Embed Size (px)
Citation preview
January 24th, 2019
Hyundai Motor Company 2018 Annual Business Results
2
Cautionary Statement with Respect to Forward-Looking Statements
In the presentation that follows and in related comments by Hyundai Motor’s management, our use of
the words “expect,” “anticipate,” “project,” “estimate,” “forecast,” “objective,” “plan,” “goal,”
“outlook,” “target,” “pursue” and similar expressions is intended to identify forward looking statements.
The financial data discussed herein are presented on a preliminary basis before the audit from our
Independent Auditor; final data will be included in HMC’s Independent auditor’s report. While these
statements represent our current judgment on what the future may hold, and we believe these
judgments are reasonable, actual results may differ materially due to numerous important factors. Such
factors include, among others, the following : changes in economic conditions, currency exchange rates
or political stability; shortages of fuel, labor strikes or work stoppages; market acceptance of the
corporation’s new products; significant changes in the competitive environment; changes in laws,
regulations and tax rates; and the ability of the corporation to achieve reductions in cost and
employment levels to realize production efficiencies and implement capital expenditures at levels and
times planned by management.
We do not intend or assume any obligation to update any forward-looking statement, which speaks only
as of the date on which it is made.
3
Table of Contents
Sales Summary
Financial Summary
2019 Business Plan
Appendix
- Consolidated Financial Statements
4
Sales Results
◇ Wholesales
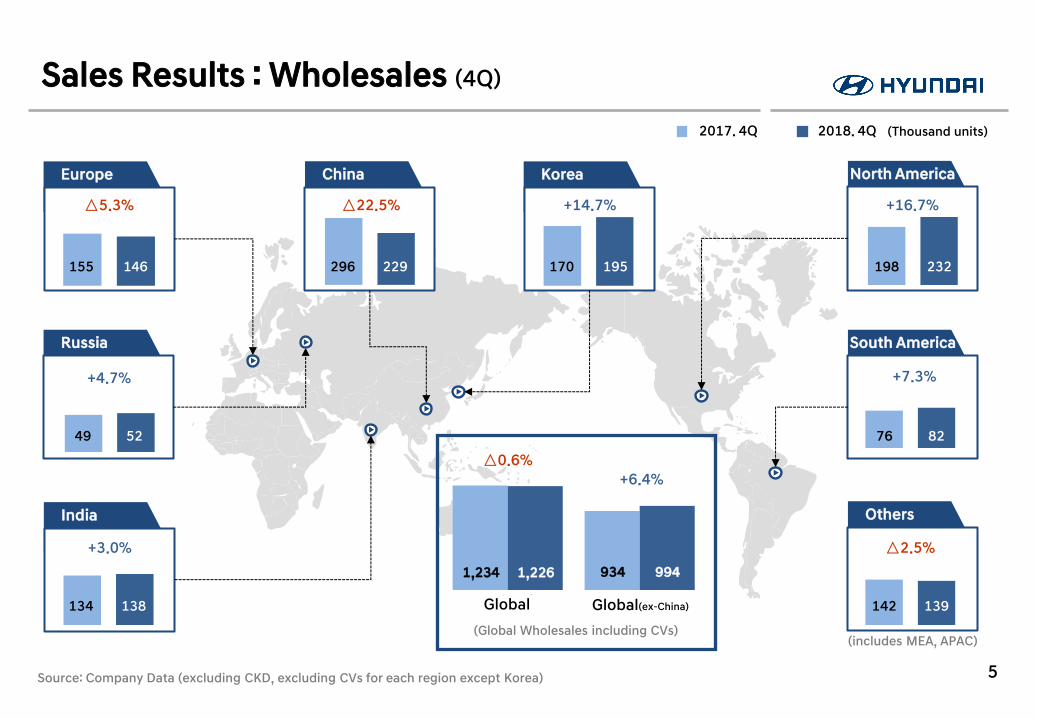
Sales Results : Wholesales (4Q)
(Thousand units) 2017. 4Q 2018. 4Q
5
Europe
△5.3%
146 155
India
Russia
Korea China North America
South America
+7.3%
82 76 52 49
+4.7%
195 170
+14.7%
232 198
+16.7%
229 296
△22.5%
138 134
+3.0%
1,226 1,234
Global
△0.6%
Global(ex-China)
994 934
+6.4%
Others
△2.5%
139 142
(includes MEA, APAC)
Source: Company Data (excluding CKD, excluding CVs for each region except Korea)
(Global Wholesales including CVs)
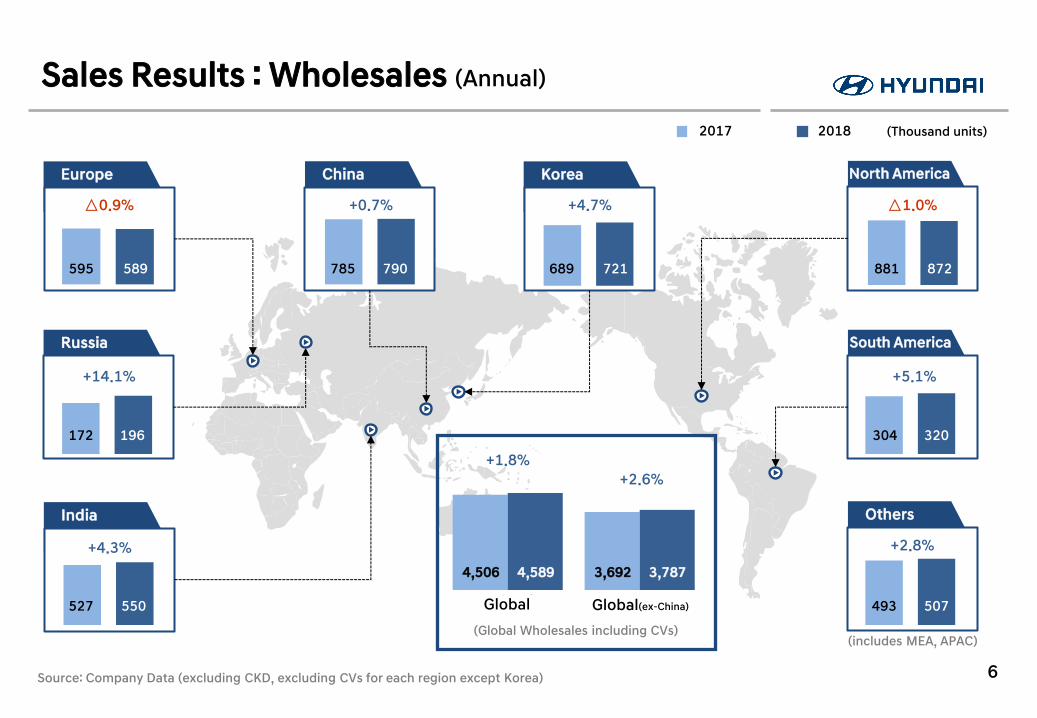
Sales Results : Wholesales (Annual)
(Thousand units) 2017 2018
6
Europe
△0.9%
589 595
India
Russia
Korea China North America
South America
+5.1%
320 304 196 172
+14.1%
721 689
+4.7%
872 881
△1.0%
790 785
+0.7%
550 527
+4.3%
4,589 4,506
Global
+1.8%
3,787 3,692
+2.6%
Others
507 493
+2.8%
Global(ex-China)
(Global Wholesales including CVs) (includes MEA, APAC)
Source: Company Data (excluding CKD, excluding CVs for each region except Korea)
7
◇ Revenue and Operating Income Analysis
◇ Non-operating Income Analysis
Financial Summary
Operating Income by Division Revenue by Division
Revenue and Operating Income Analysis (4Q)
(Billion KRW) (Billion KRW)
▷ Auto sales increased thanks to SUV sales growth (Santa Fe, Palisade)
▷ Finance division sales decreased.
▷ Operating income of Auto division improved based on better product mix and weaker KRW.
▷ Earnings decline of subsidiaries hurt overall earnings.
8
Auto Finance Others Auto Finance Others Consolidation Adjustments
Consolidated revenue and operating income under K-IFRS
'17. 4Q '18. 4Q
1,812 1,908
4,032 3,362
18,657 20,399
'17. 4Q '18. 4Q
775 501
△274 (△35.4%↓)
+1,169 (+4.8%↑)
24,501 25,670
71
463
147
110
68
37 △109
490
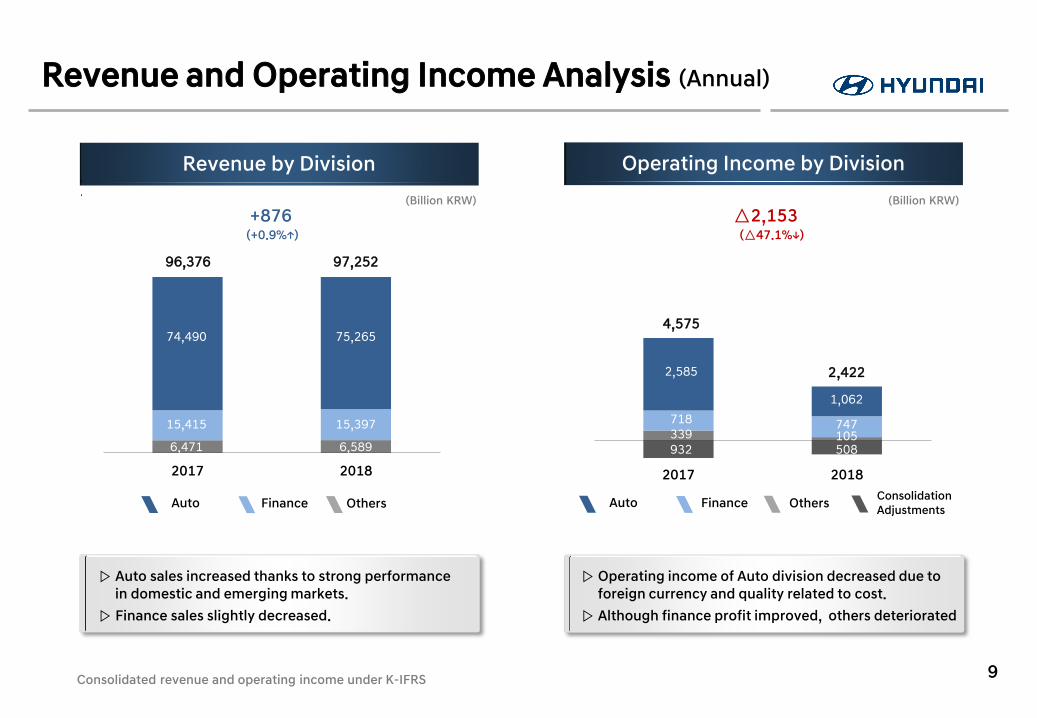
Operating Income by Division Revenue by Division
Revenue and Operating Income Analysis (Annual)
9 Consolidated revenue and operating income under K-IFRS
2017 20182017 2018
4,575
2,422
+876 (+0.9%↑)
96,376 97,252
74,490 75,265
15,415 15,397
6,471 6,589
△2,153 (△47.1%↓)
2,585
1,062
718 747 339 105
508 932
(Billion KRW) (Billion KRW)
▷ Auto sales increased thanks to strong performance in domestic and emerging markets.
▷ Finance sales slightly decreased.
▷ Operating income of Auto division decreased due to foreign currency and quality related to cost.
▷ Although finance profit improved, others deteriorated
Auto Finance Others Auto Finance Others Consolidation Adjustments
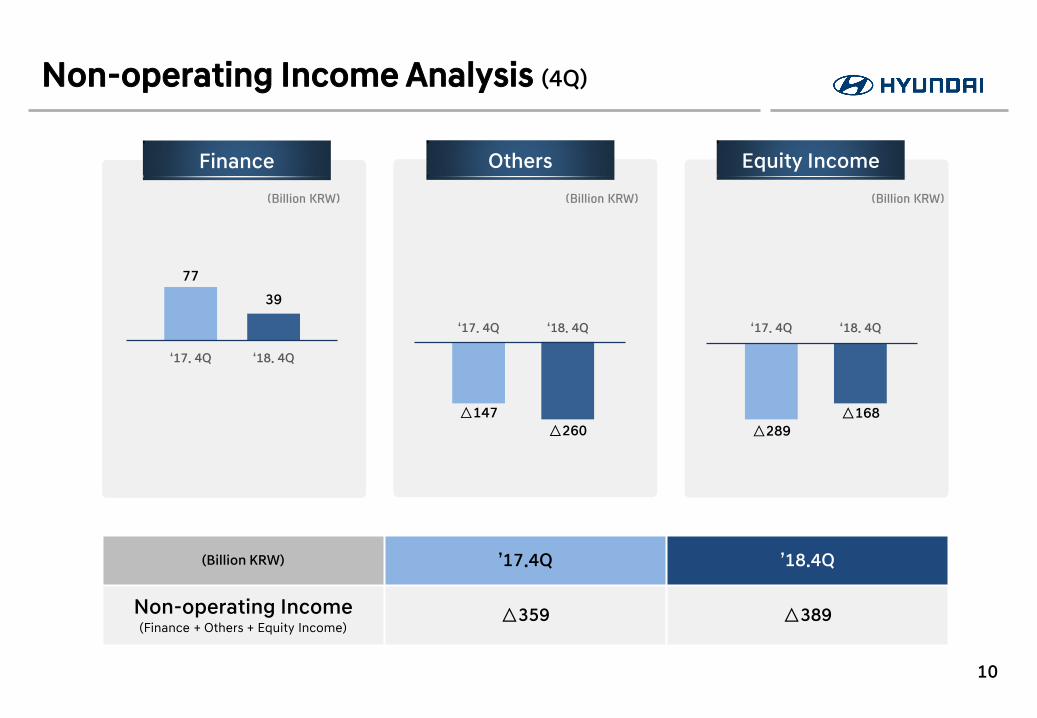
Non-operating Income Analysis (4Q)
10
‘18. 4Q ‘17. 4Q
77
39
Finance
△147
‘18. 4Q ‘17. 4Q
Others
△260 △168
‘18. 4Q ‘17. 4Q
Equity Income
△289
(Billion KRW) ’17.4Q ’18.4Q
Non-operating Income (Finance + Others + Equity Income)
△359 △389
(Billion KRW) (Billion KRW) (Billion KRW)
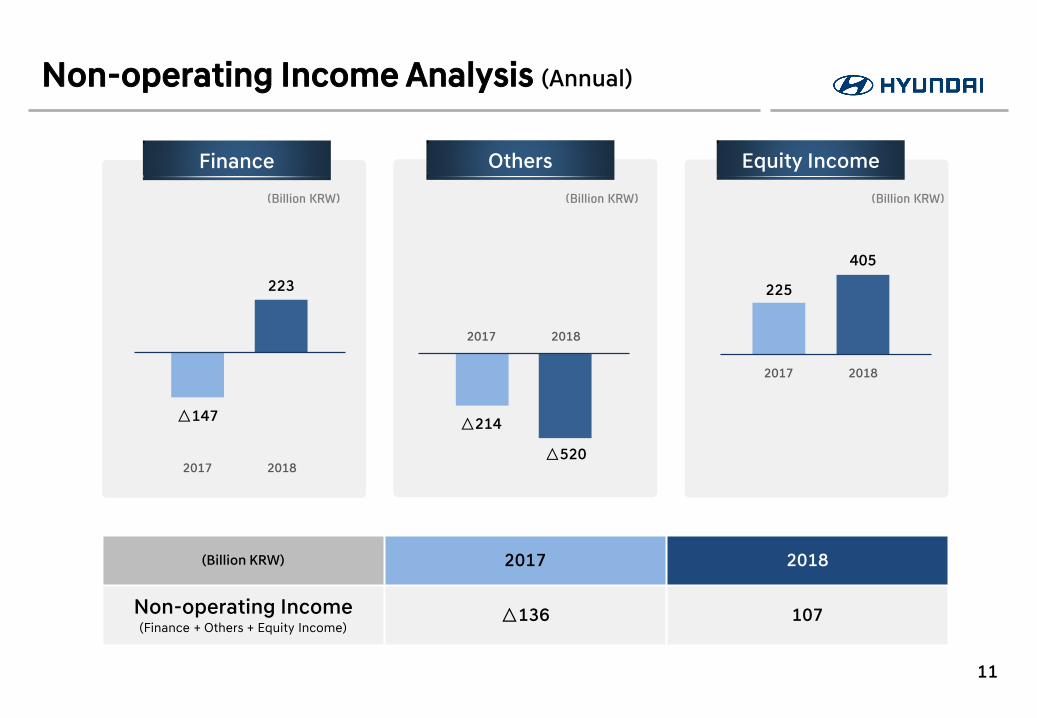
Non-operating Income Analysis (Annual)
11
(Billion KRW) 2017 2018
Non-operating Income (Finance + Others + Equity Income)
△136 107
223
△214
405
△520
225
△147
2018 2017
2018 2017
2018 2017
Finance Others Equity Income
(Billion KRW) (Billion KRW) (Billion KRW)
2019 Business Plan
12
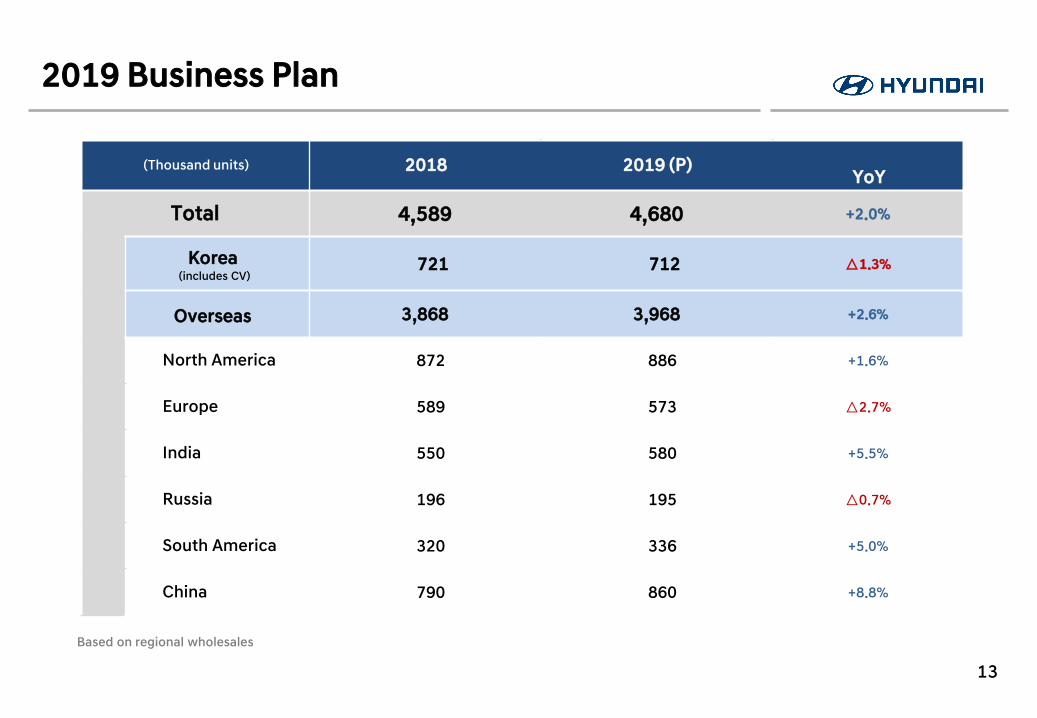
2019 Business Plan
Based on regional wholesales
13
(Thousand units) 2018 2019 (P) YoY
Total 4,589 4,680 +2.0%
0,721 0,712 △1.3%
3,868 3,968 +2.6%
North America 872 886 +1.6%
Europe 589 573 △2.7%
India 550 580 +5.5%
Russia 196 195 △0.7%
South America 320 336 +5.0%
China 790 860 +8.8%
Korea (includes CV)
Overseas
Appendix
14
◇ Sales by Plant
◇ Retail Sales
◇ Revenue by Plant
◇ Consolidated Financial Statements
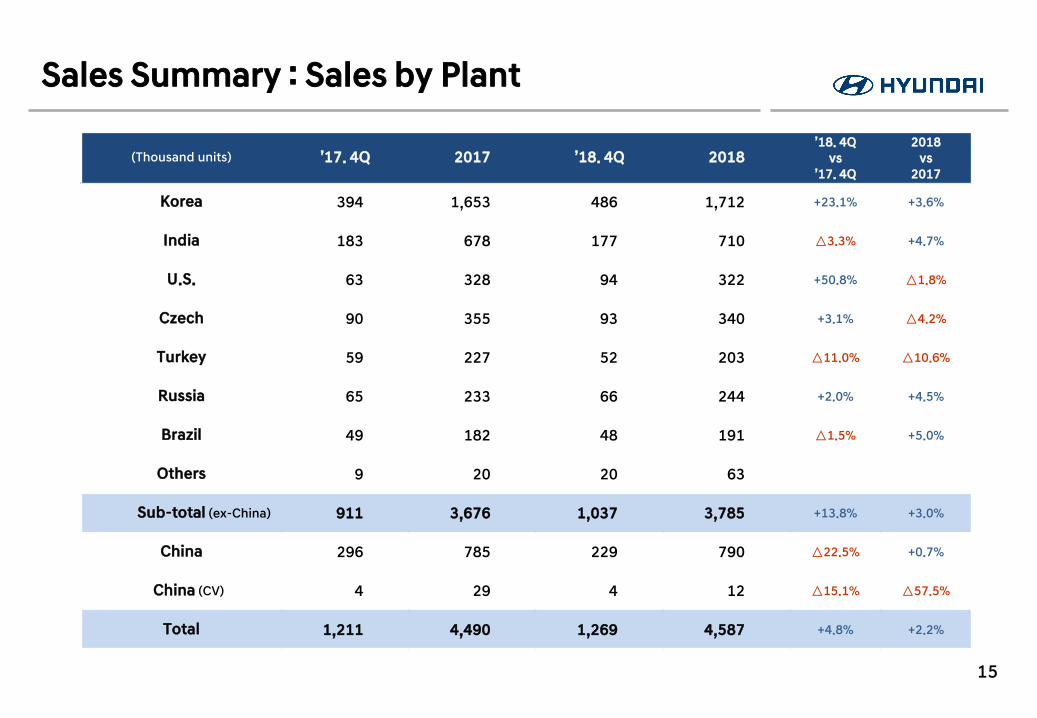
Sales Summary : Sales by Plant
15
(Thousand units) ’17. 4Q 2017 ’18. 4Q 2018 ’18. 4Q
vs ’17. 4Q
2018 vs
2017
Korea 394 1,653 486 1,712 +23.1% +3.6%
India 183 678 177 710 △3.3% +4.7%
U.S. 63 328 94 322 +50.8% △1.8%
Czech 90 355 93 340 +3.1% △4.2%
Turkey 59 227 52 203 △11.0% △10.6%
Russia 65 233 66 244 +2.0% +4.5%
Brazil 49 182 48 191 △1.5% +5.0%
Others 9 20 20 63
Sub-total (ex-China) 911 3,676 1,037 3,785 +13.8% +3.0%
China 296 785 229 790 △22.5% +0.7%
China (CV) 4 29 4 12 △15.1% △57.5%
Total 1,211 4,490 1,269 4,587 +4.8% +2.2%
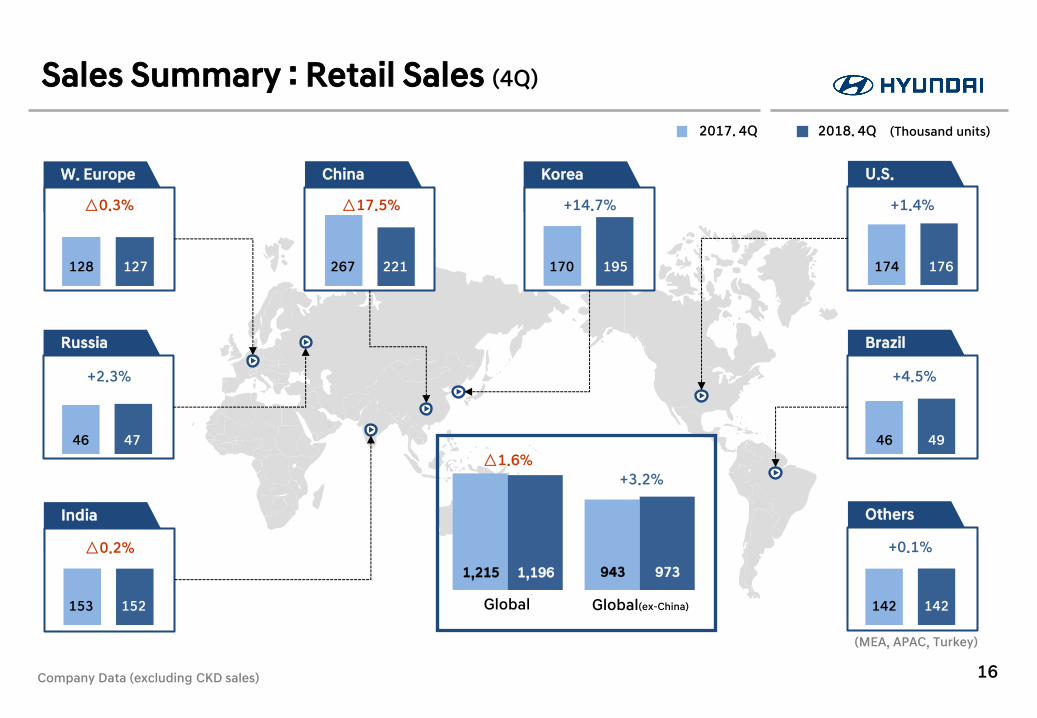
Sales Summary : Retail Sales (4Q)
(Thousand units) 2017. 4Q 2018. 4Q
Company Data (excluding CKD sales) 16
W. Europe
△0.3%
India
Russia
Korea China U.S.
Brazil
+4.5% +2.3%
+14.7% +1.4% △17.5%
△0.2%
Global
△1.6%
Global(ex-China)
+3.2%
Others
(MEA, APAC, Turkey)
+0.1%
127 128 195 170 176 174 221 267
49 46 47 46
152 153 142 142
1,196 1,215 973 943
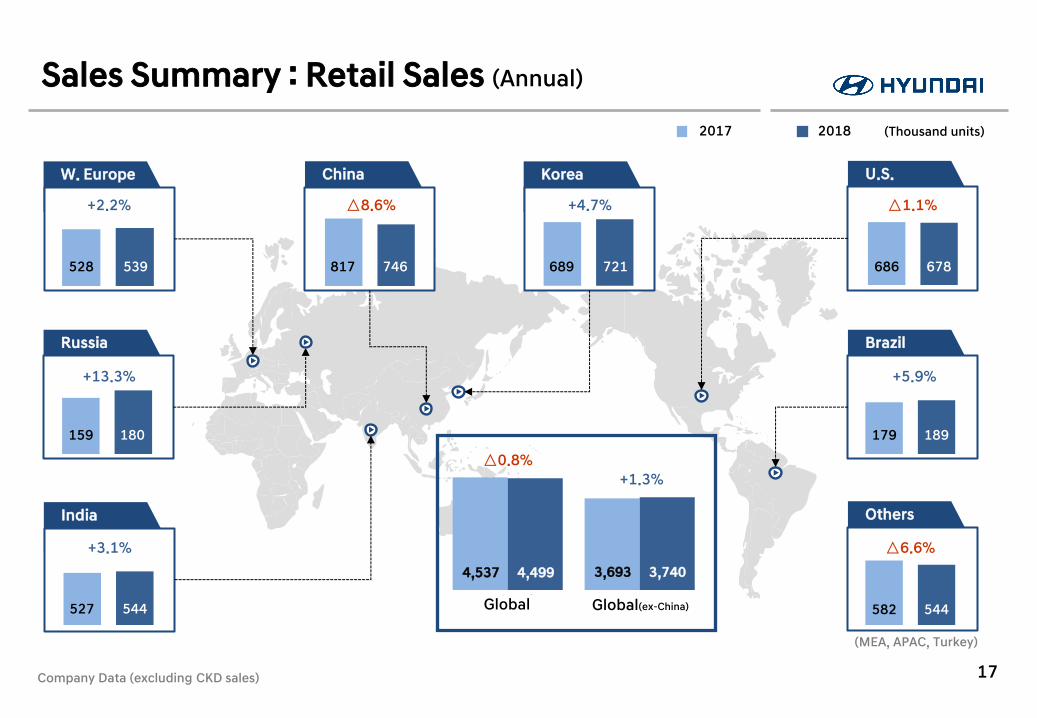
Sales Summary : Retail Sales (Annual)
(Thousand units) 2017 2018
Company Data (excluding CKD sales) 17
W. Europe
+2.2%
India
Russia
Korea China U.S.
Brazil
+5.9% +13.3%
+4.7% △1.1% △8.6%
+3.1%
Global
△0.8%
Global(ex-China)
+1.3%
Others
△6.6%
539 528 721 689 678 686 746 817
189 179 180 159
544 527 544 582
4,499 4,537 3,740 3,693
(MEA, APAC, Turkey)
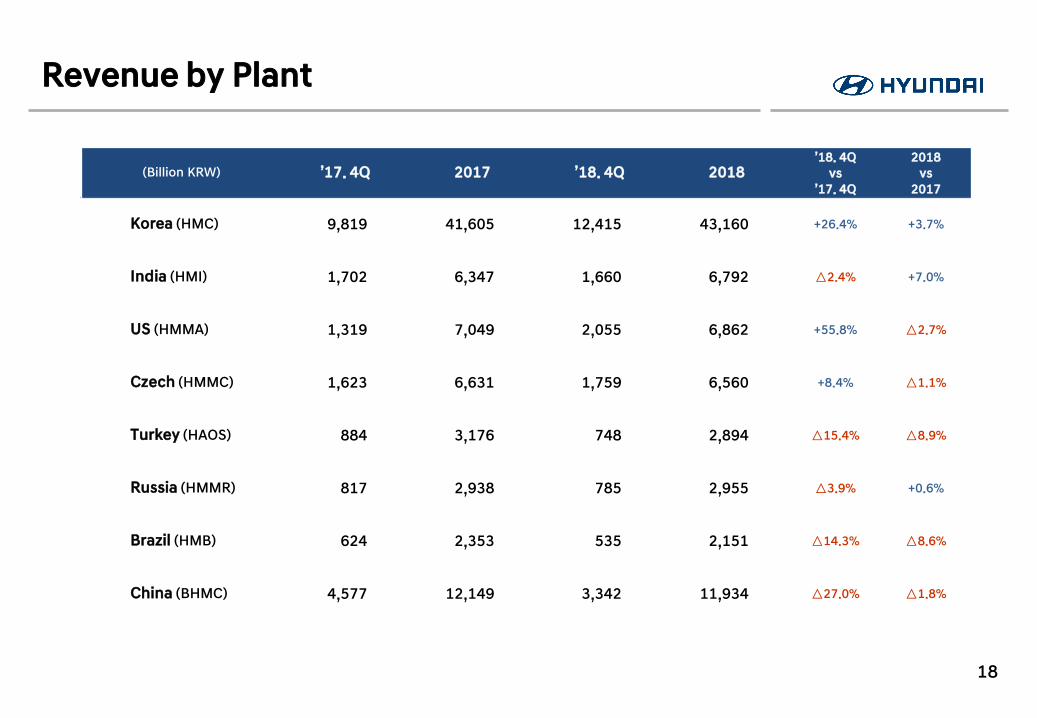
Revenue by Plant
18
(Billion KRW) ’17. 4Q 2017 ’18. 4Q 2018 ’18. 4Q
vs ’17. 4Q
2018 vs
2017
Korea (HMC) 9,819 41,605 12,415 43,160 +26.4% +3.7%
India (HMI) 1,702 6,347 1,660 6,792 △2.4% +7.0%
US (HMMA) 1,319 7,049 2,055 6,862 +55.8% △2.7%
Czech (HMMC) 1,623 6,631 1,759 6,560 +8.4% △1.1%
Turkey (HAOS) 884 3,176 748 2,894 △15.4% △8.9%
Russia (HMMR) 817 2,938 785 2,955 △3.9% +0.6%
Brazil (HMB) 624 2,353 535 2,151 △14.3% △8.6%
China (BHMC) 4,577 12,149 3,342 11,934 △27.0% △1.8%
Statement of Income
(Billion KRW) ‘17. 4Q ‘18. 1Q ‘18. 2Q ‘18. 3Q ‘18. 4Q YoY QoQ
Revenue 24,501 22,437 24,712 24,434 25,670 +4.8% +5.1%
Gross Profit 4,218 3,468 3,926 3,693 4,057 △3.9% +9.8%
Margin (%) 17.2 15.5 15.9 15.1 15.8
SG&A 3,443 2,786 2,976 3,404 3,555 +3.2% +4.4%
Portion (%) 14.1 12.4 12.0 13.9 13.8
Operating Income 775 681 951 289 501 △35.4% +73.4%
Margin (%) 3.2 3.0 3.8 1.2 2.0
Income before tax 416 926 1,129 362 113 △72.9% △68.9%
Margin (%) 1.7 4.1 4.6 1.5 0.4
Net Income 1,288 732 811 306 △203 △115.8% △166.4%
Margin (%) 5.3 3.3 3.3 1.3 △0.8
Depreciation 589 571 576 600 611
Amortization 341 344 352 364 343
EBITDA 1,705 1,596 1,879 1,254 1,455
19
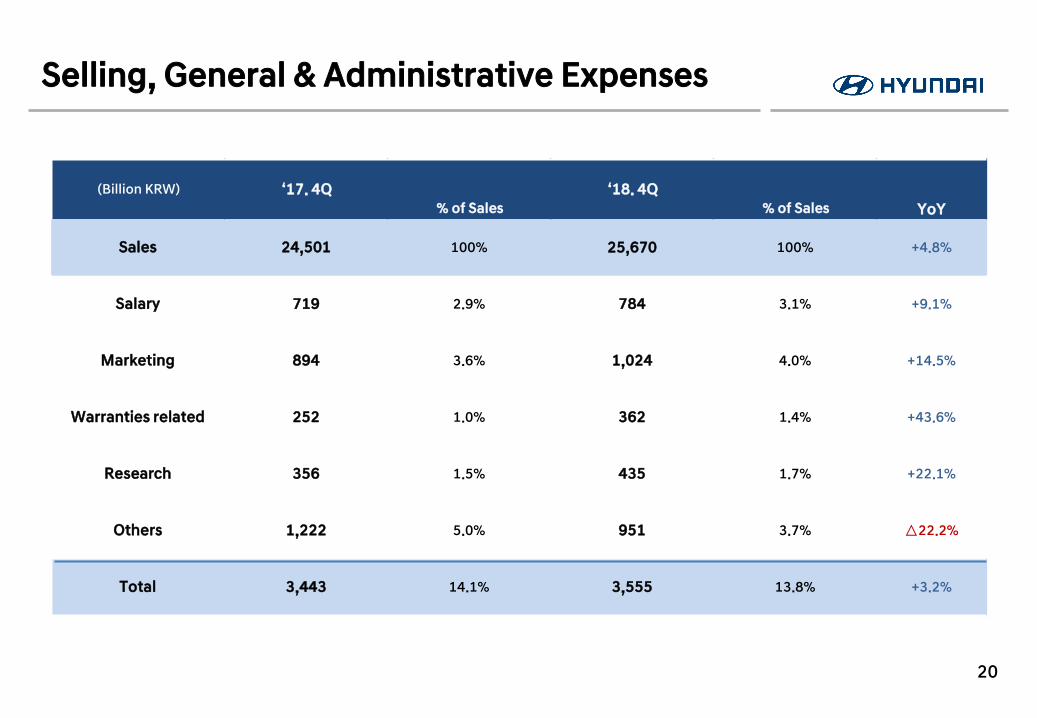
Selling, General & Administrative Expenses
(Billion KRW) ‘17. 4Q % of Sales
‘18. 4Q % of Sales YoY
Sales 24,501 100% 25,670 100% +4.8%
Salary 719 2.9% 784 3.1% +9.1%
Marketing 894 3.6% 1,024 4.0% +14.5%
Warranties related 252 1.0% 362 1.4% +43.6%
Research 356 1.5% 435 1.7% +22.1%
Others 1,222 5.0% 951 3.7% △22.2%
Total 3,443 14.1% 3,555 13.8% +3.2%
20
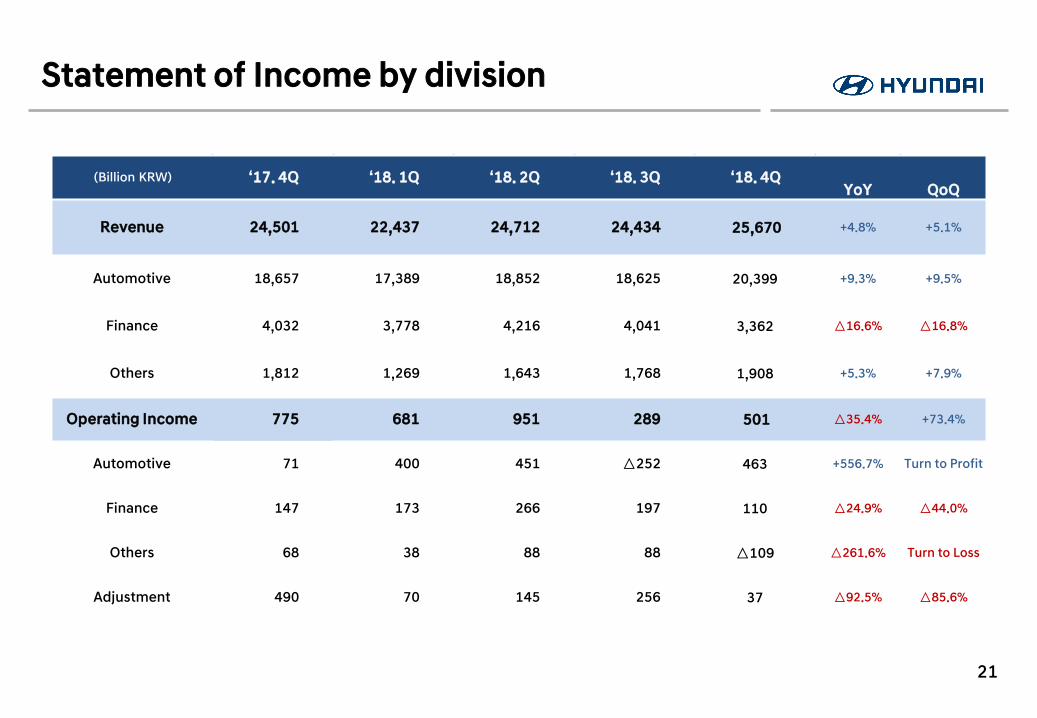
Statement of Income by division
21
(Billion KRW) ‘17. 4Q ‘18. 1Q ‘18. 2Q ‘18. 3Q ‘18. 4Q YoY QoQ
Revenue 24,501 22,437 24,712 24,434 25,670 +4.8% +5.1%
Automotive 18,657 17,389 18,852 18,625 20,399 +9.3% +9.5%
Finance 4,032 3,778 4,216 4,041 3,362 △16.6% △16.8%
Others 1,812 1,269 1,643 1,768 1,908 +5.3% +7.9%
Operating Income 775 681 951 289 501 △35.4% +73.4%
Automotive 71 400 451 △252 463 +556.7% Turn to Profit
Finance 147 173 266 197 110 △24.9% △44.0%
Others 68 38 88 88 △109 △261.6% Turn to Loss
Adjustment 490 70 145 256 37 △92.5% △85.6%
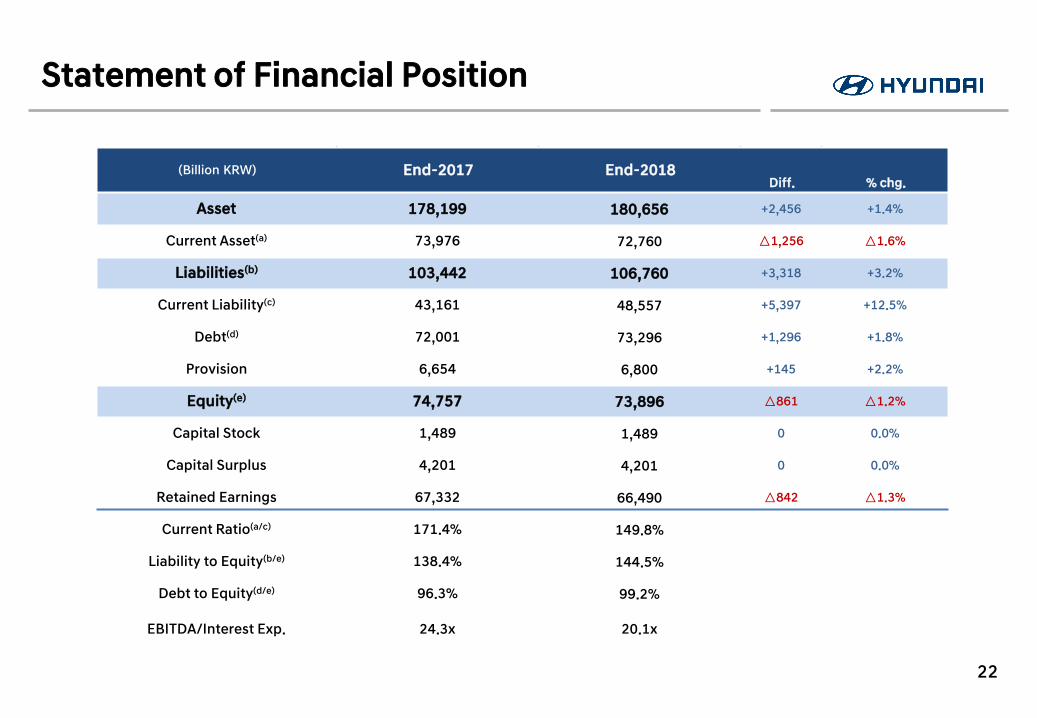
Statement of Financial Position
(Billion KRW) End-2017 End-2018 Diff. % chg.
Asset 178,199 179,772 +1,573 +0.9%
Current Asset(a) 73,976 73,206 △770 △1.0%
Liabilities(b) 103,442 104,848 +1,406 +1.4%
Current Liability(c) 43,161 47,149 +3,988 +9.2%
Debt(d) 72,001 72,005 +5 +0.0%
Provision 6,654 7,163 +509 +7.6%
Equity(e) 74,757 74,924 +167 +0.2%
Capital Stock 1,489 1,489 0 0.0%
Capital Surplus 4,201 4,201 0 0.0%
Retained Earnings 67,332 67,118 △215 △0.3%
Current Ratio(a/c) 171.4% 155.3%
Liability to Equity(b/e) 138.4% 139.9%
Debt to Equity(d/e) 96.3% 96.1%
EBITDA/Interest Exp. 24.3x 21.3x
22
(Billion KRW) End-2017 End-2018 Diff. % chg.
Asset 178,199 180,656 +2,456 +1.4%
Current Asset(a) 73,976 72,760 △1,256 △1.6%
Liabilities(b) 103,442 106,760 +3,318 +3.2%
Current Liability(c) 43,161 48,557 +5,397 +12.5%
Debt(d) 72,001 73,296 +1,296 +1.8%
Provision 6,654 6,800 +145 +2.2%
Equity(e) 74,757 73,896 △861 △1.2%
Capital Stock 1,489 1,489 0 0.0%
Capital Surplus 4,201 4,201 0 0.0%
Retained Earnings 67,332 66,490 △842 △1.3%
Current Ratio(a/c) 171.4% 149.8%
Liability to Equity(b/e) 138.4% 144.5%
Debt to Equity(d/e) 96.3% 99.2%
EBITDA/Interest Exp. 24.3x 20.1x
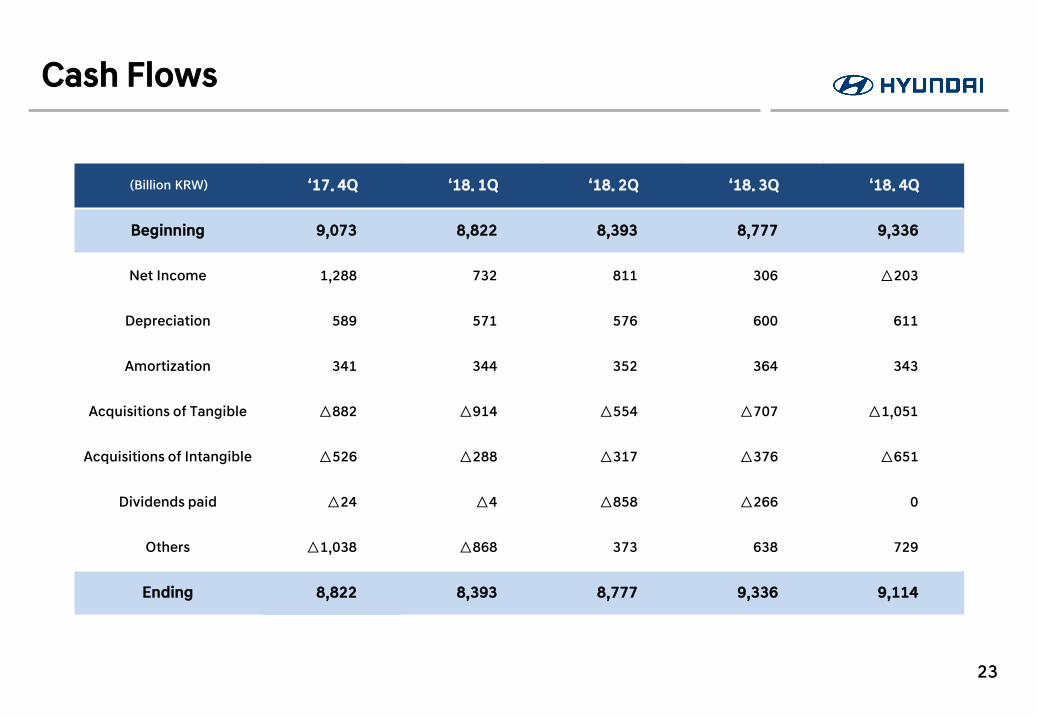
Cash Flows
(Billion KRW) ‘17. 4Q ‘18. 1Q ‘18. 2Q ‘18. 3Q ‘18. 4Q
Beginning 9,073 8,822 8,393 8,777 9,336
Net Income 1,288 732 811 306 △203
Depreciation 589 571 576 600 611
Amortization 341 344 352 364 343
Acquisitions of Tangible △882 △914 △554 △707 △1,051
Acquisitions of Intangible △526 △288 △317 △376 △651
Dividends paid △24 △4 △858 △266 0
Others △1,038 △868 373 638 729
Ending 8,822 8,393 8,777 9,336 9,114
23