Embed Size (px)
Citation preview
1
2
Important Notice
This presentation of Hyundai Heavy Industries (HHI) contains forward-looking statements relating to HHI’s
operations that are based on management’s current expectations, estimates and projections. Words such as
“anticipates”, “expects”, “intends”, “plans”, “projects”, “schedules”, “estimates” and similar expressions are
intended to identify such forward-looking statements. These statements are not guarantees of future performance
and are subject to certain risks, uncertainties, and other factors including new order flows, FX rates, steel plate
prices and so on, some of which are beyond company’s control and are difficult to predict. Therefore, actual
outcomes and actual results may differ materially from what is expressed or forecasted in such forward-looking
statements. The reader should not place undue reliance on these forward-looking statements. HHI undertakes no
obligation to update any forward-looking statements to reflect subsequent events.
3
Contents
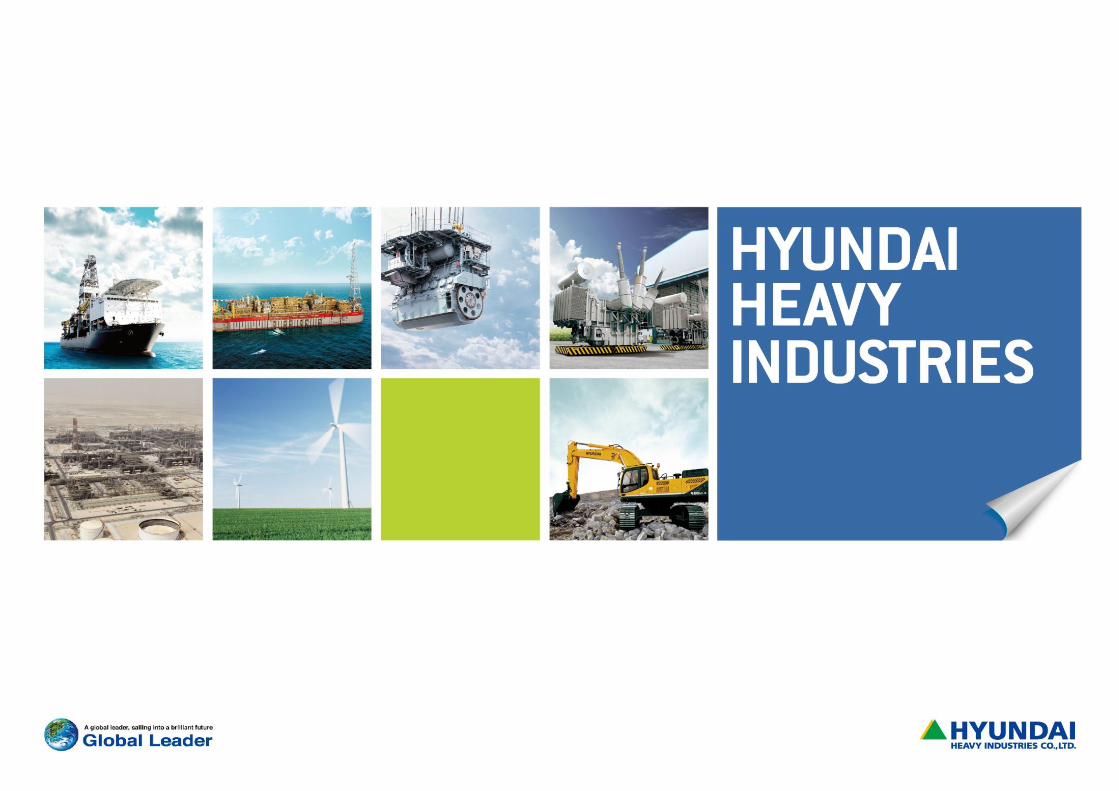
H H I at a Glance
Business Performance
Financial Performance
Appendix (Quarterly Results)
4
HHI at a Glance
5
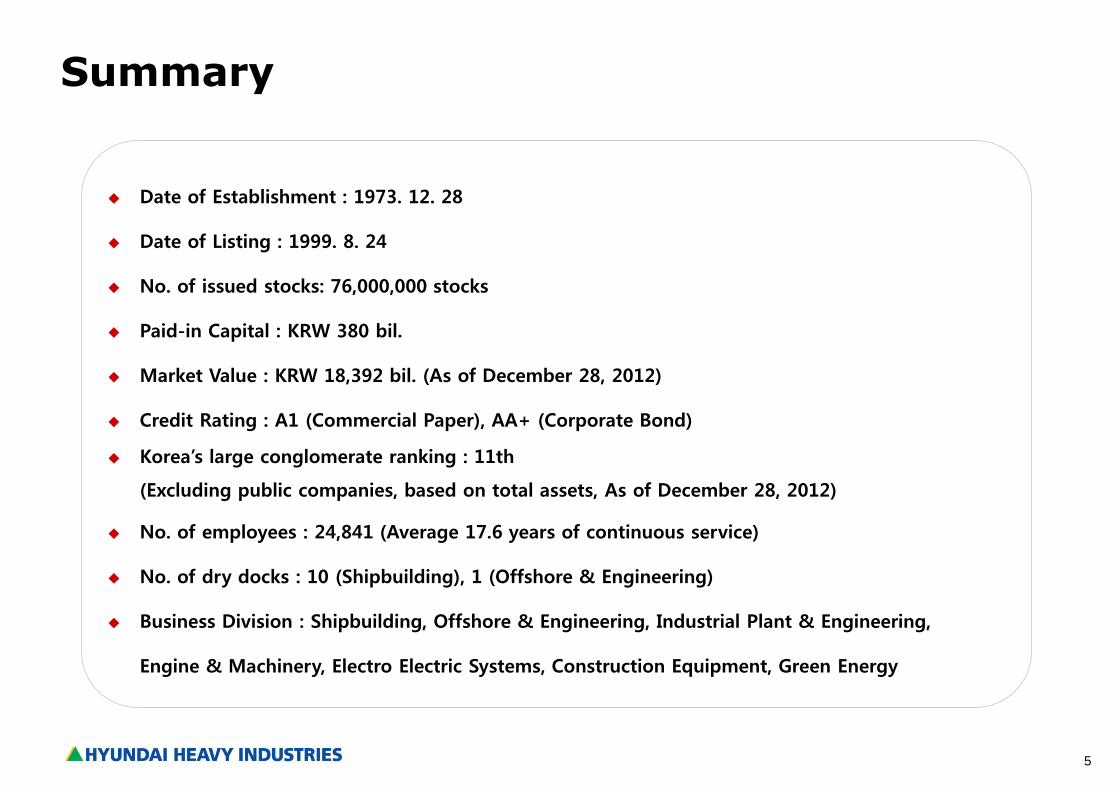
Date of Establishment : 1973. 12. 28
Date of Listing : 1999. 8. 24
No. of issued stocks: 76,000,000 stocks
Paid-in Capital : KRW 380 bil.
Market Value : KRW 18,392 bil. (As of December 28, 2012)
Credit Rating : A1 (Commercial Paper), AA+ (Corporate Bond)
Korea’s large conglomerate ranking : 11th
(Excluding public companies, based on total assets, As of December 28, 2012)
No. of employees : 24,841 (Average 17.6 years of continuous service)
No. of dry docks : 10 (Shipbuilding), 1 (Offshore & Engineering)
Business Division : Shipbuilding, Offshore & Engineering, Industrial Plant & Engineering,
Engine & Machinery, Electro Electric Systems, Construction Equipment, Green Energy
Summary
6
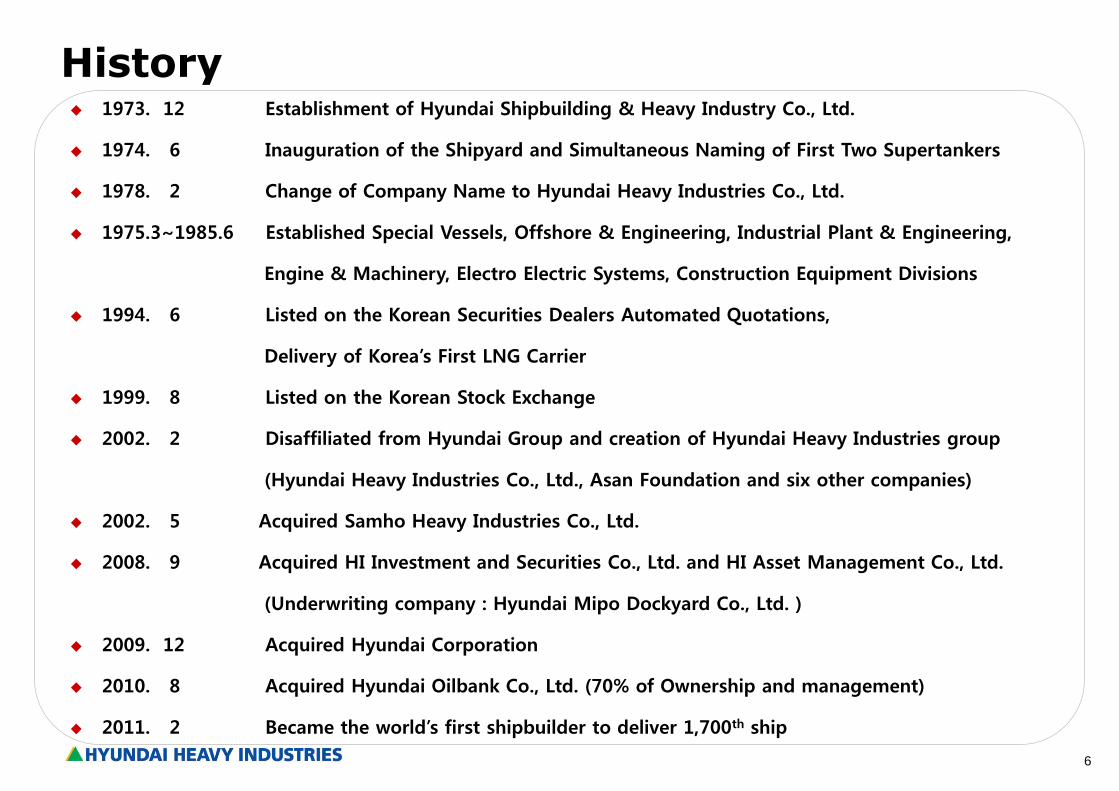
1973. 12 Establishment of Hyundai Shipbuilding & Heavy Industry Co., Ltd.
1974. 6 Inauguration of the Shipyard and Simultaneous Naming of First Two Supertankers
1978. 2 Change of Company Name to Hyundai Heavy Industries Co., Ltd.
1975.3~1985.6 Established Special Vessels, Offshore & Engineering, Industrial Plant & Engineering,
Engine & Machinery, Electro Electric Systems, Construction Equipment Divisions
1994. 6 Listed on the Korean Securities Dealers Automated Quotations,
Delivery of Korea’s First LNG Carrier
1999. 8 Listed on the Korean Stock Exchange
2002. 2 Disaffiliated from Hyundai Group and creation of Hyundai Heavy Industries group
(Hyundai Heavy Industries Co., Ltd., Asan Foundation and six other companies)
2002. 5 Acquired Samho Heavy Industries Co., Ltd.
2008. 9 Acquired HI Investment and Securities Co., Ltd. and HI Asset Management Co., Ltd.
(Underwriting company : Hyundai Mipo Dockyard Co., Ltd. )
2009. 12 Acquired Hyundai Corporation
2010. 8 Acquired Hyundai Oilbank Co., Ltd. (70% of Ownership and management)
2011. 2 Became the world’s first shipbuilder to deliver 1,700th ship
History
7
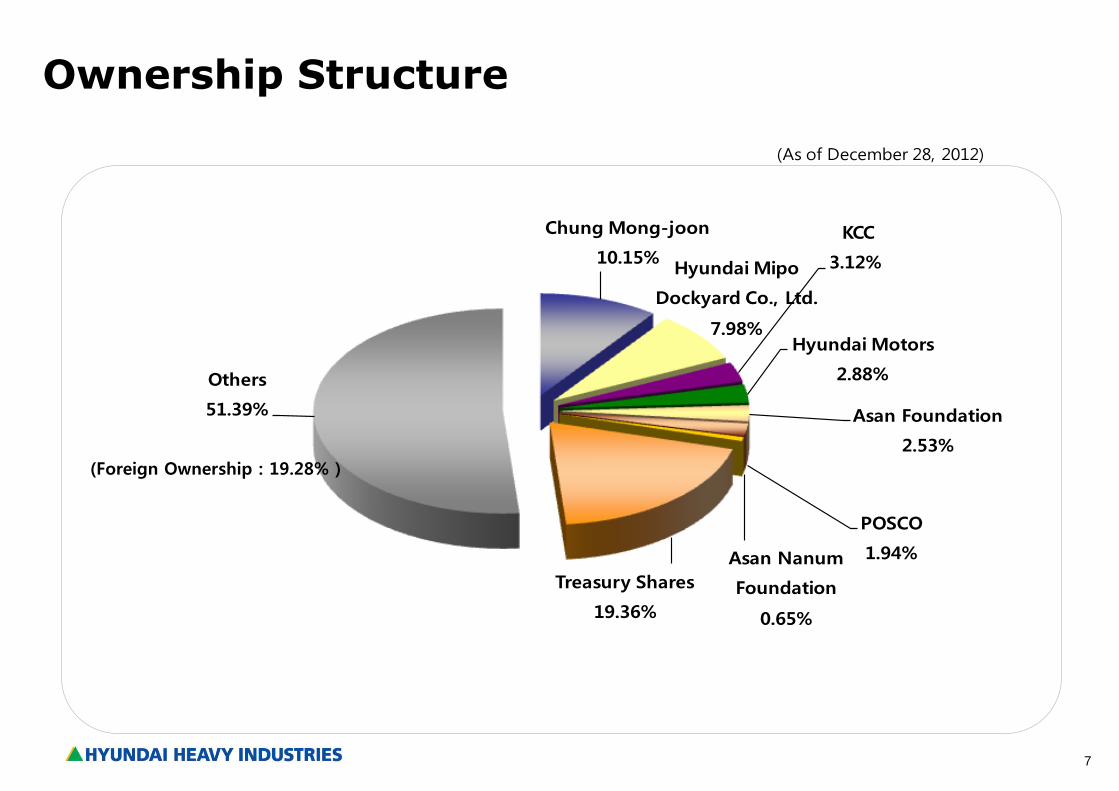
Ownership Structure
Chung Mong-joon
10.15%Hyundai Mipo
Dockyard Co., Ltd.
7.98%
KCC
3.12%
Hyundai Motors
2.88%
Asan Foundation
2.53%
POSCO
1.94%Asan Nanum
Foundation
0.65%
Treasury Shares
19.36%
Others
51.39%
(As of December 28, 2012)
(Foreign Ownership : 19.28% )
8
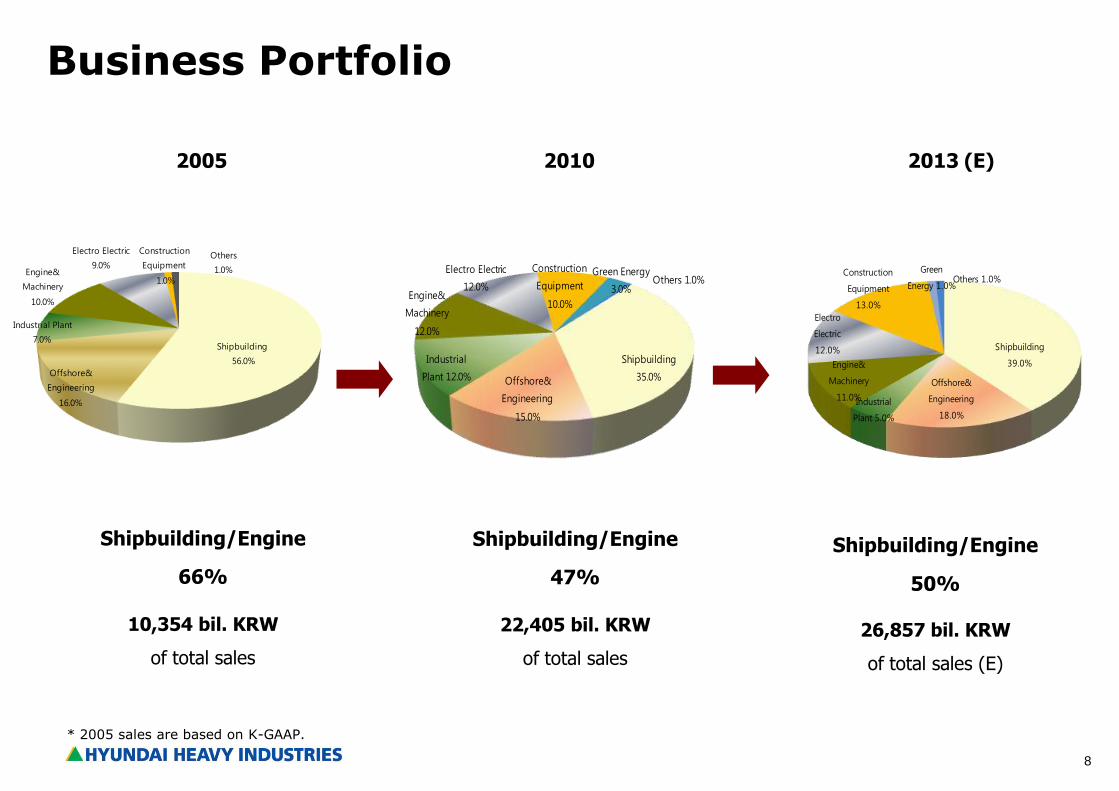
Shipbuilding
56.0%
Offshore&
Engineering
16.0%
Industrial Plant
7.0%
Engine&
Machinery
10.0%
Electro Electric
9.0%
Construction
Equipment
1.0%
Others
1.0%
Shipbuilding
39.0%
Offshore&
Engineering
18.0%
Industrial
Plant 5.0%
Engine&
Machinery
11.0%
Electro
Electric
12.0%
Construction
Equipment
13.0%
Green
Energy 1.0%Others 1.0%
Shipbuilding
35.0%Offshore&
Engineering
15.0%
Industrial
Plant 12.0%
Engine&
Machinery
12.0%
Electro Electric
12.0%
Construction
Equipment
10.0%
Green Energy
3.0%Others 1.0%
Business Portfolio
2005 2010 2013 (E)
Shipbuilding/Engine
66%
Shipbuilding/Engine
47%
Shipbuilding/Engine
50%
10,354 bil. KRW
of total sales
22,405 bil. KRW
of total sales
26,857 bil. KRW
of total sales (E)
* 2005 sales are based on K-GAAP.
9
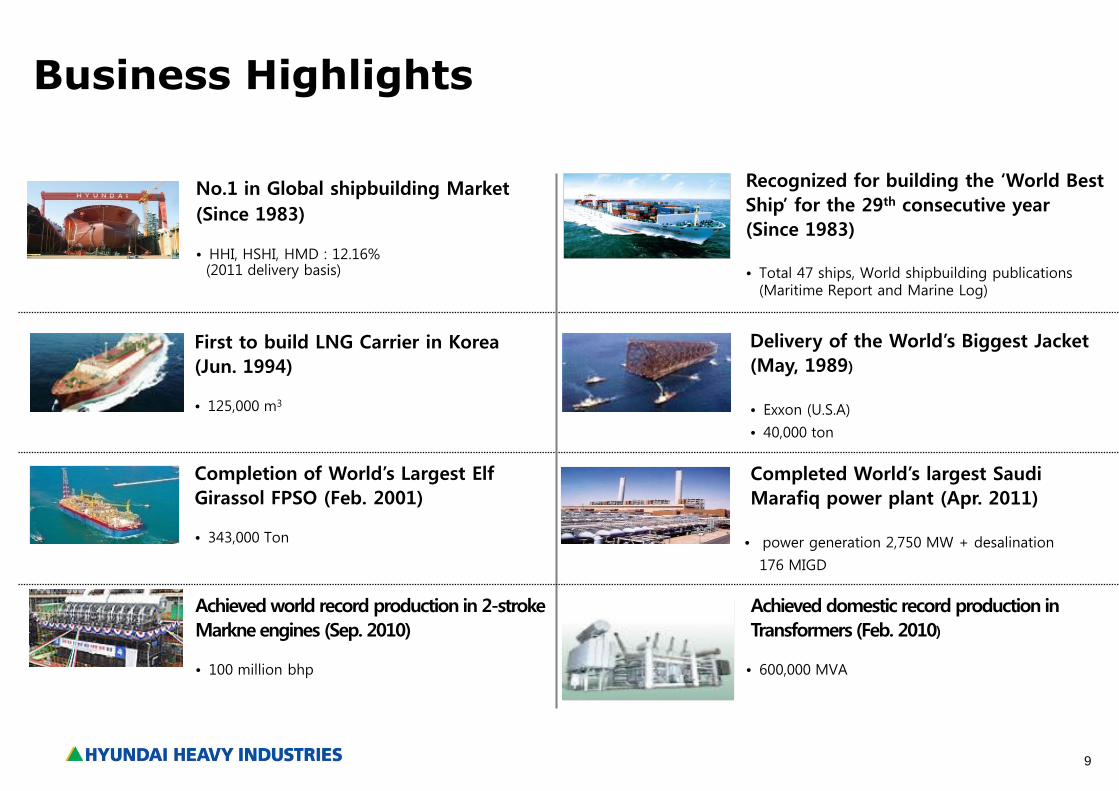
First to build LNG Carrier in Korea
(Jun. 1994) • 125,000 m3
Achieved world record production in 2-stroke
Markne engines (Sep. 2010) • 100 million bhp
Delivery of the World’s Biggest Jacket
(May, 1989)
• Exxon (U.S.A)
• 40,000 ton
No.1 in Global shipbuilding Market
(Since 1983) • HHI, HSHI, HMD : 12.16% (2011 delivery basis)
Recognized for building the ‘World Best
Ship’ for the 29th consecutive year
(Since 1983)
• Total 47 ships, World shipbuilding publications (Maritime Report and Marine Log)
Business Highlights
Completed World’s largest Saudi
Marafiq power plant (Apr. 2011)
• power generation 2,750 MW + desalination
176 MIGD
Achieved domestic record production in
Transformers (Feb. 2010)
• 600,000 MVA
Completion of World’s Largest Elf
Girassol FPSO (Feb. 2001) • 343,000 Ton
10
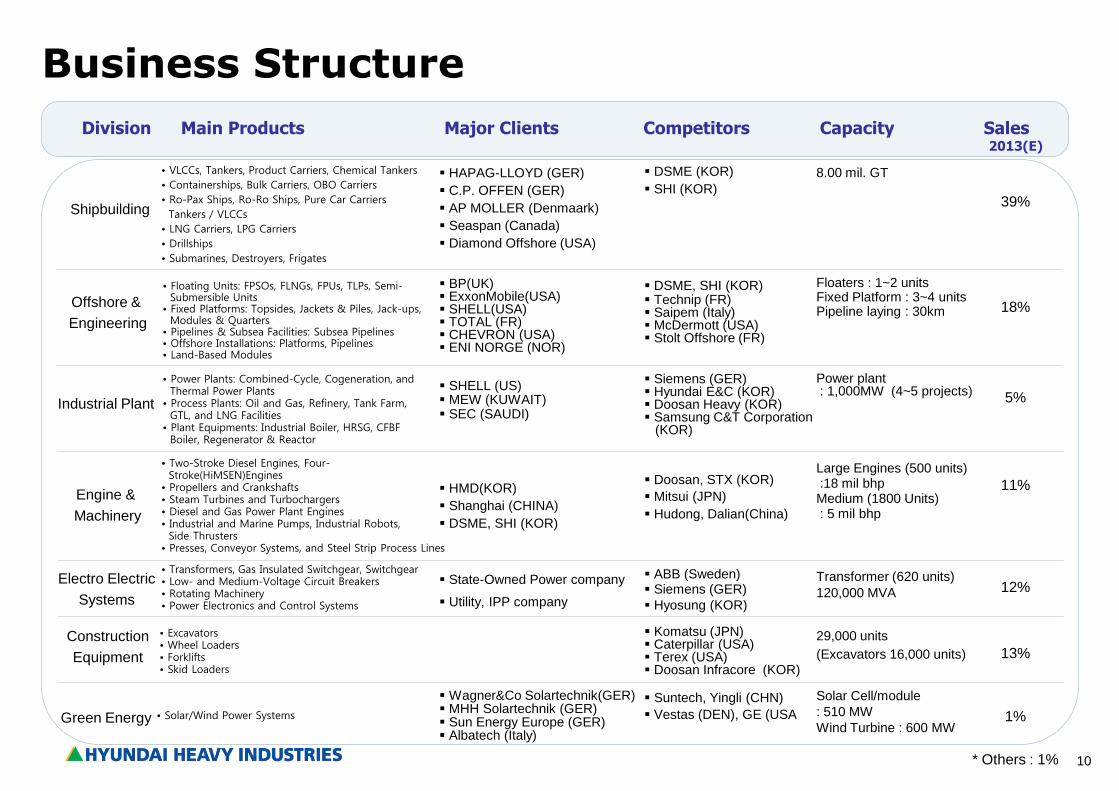
Business Structure
Shipbuilding
Industrial Plant
Engine &
Machinery
Offshore &
Engineering
Construction
Equipment
Electro Electric
Systems
DSME (KOR)
SHI (KOR)
DSME, SHI (KOR) Technip (FR) Saipem (Italy) McDermott (USA) Stolt Offshore (FR)
Siemens (GER) Hyundai E&C (KOR) Doosan Heavy (KOR) Samsung C&T Corporation (KOR)
Doosan, STX (KOR)
Mitsui (JPN)
Hudong, Dalian(China)
ABB (Sweden) Siemens (GER)
Hyosung (KOR)
Komatsu (JPN) Caterpillar (USA) Terex (USA) Doosan Infracore (KOR) Suntech, Yingli (CHN)
Vestas (DEN), GE (USA
HAPAG-LLOYD (GER)
C.P. OFFEN (GER)
AP MOLLER (Denmaark)
Seaspan (Canada)
Diamond Offshore (USA)
BP(UK) ExxonMobile(USA) SHELL(USA) TOTAL (FR) CHEVRON (USA) ENI NORGE (NOR) SHELL (US) MEW (KUWAIT) SEC (SAUDI)
HMD(KOR)
Shanghai (CHINA)
DSME, SHI (KOR)
State-Owned Power company
Utility, IPP company
Wagner&Co Solartechnik(GER) MHH Solartechnik (GER) Sun Energy Europe (GER) Albatech (Italy)
8.00 mil. GT
Floaters : 1~2 units Fixed Platform : 3~4 units Pipeline laying : 30km
Power plant : 1,000MW (4~5 projects)
Large Engines (500 units) :18 mil bhp Medium (1800 Units) : 5 mil bhp
Transformer (620 units)
120,000 MVA
29,000 units
(Excavators 16,000 units)
Solar Cell/module
: 510 MW
Wind Turbine : 600 MW
Division Main Products Major Clients Competitors Capacity Sales 2013(E)
39%
18%
5%
11%
12%
13%
1%
* Others : 1%
• Excavators • Wheel Loaders • Forklifts • Skid Loaders
• VLCCs, Tankers, Product Carriers, Chemical Tankers
• Containerships, Bulk Carriers, OBO Carriers
• Ro-Pax Ships, Ro-Ro Ships, Pure Car Carriers
Tankers / VLCCs
• LNG Carriers, LPG Carriers
• Drillships
• Submarines, Destroyers, Frigates
• Floating Units: FPSOs, FLNGs, FPUs, TLPs, Semi- Submersible Units • Fixed Platforms: Topsides, Jackets & Piles, Jack-ups, Modules & Quarters • Pipelines & Subsea Facilities: Subsea Pipelines • Offshore Installations: Platforms, Pipelines • Land-Based Modules • Power Plants: Combined-Cycle, Cogeneration, and Thermal Power Plants • Process Plants: Oil and Gas, Refinery, Tank Farm, GTL, and LNG Facilities • Plant Equipments: Industrial Boiler, HRSG, CFBF Boiler, Regenerator & Reactor
• Two-Stroke Diesel Engines, Four- Stroke(HiMSEN)Engines • Propellers and Crankshafts • Steam Turbines and Turbochargers • Diesel and Gas Power Plant Engines • Industrial and Marine Pumps, Industrial Robots, Side Thrusters • Presses, Conveyor Systems, and Steel Strip Process Lines
• Transformers, Gas Insulated Switchgear, Switchgear • Low- and Medium-Voltage Circuit Breakers • Rotating Machinery • Power Electronics and Control Systems
Green Energy • Solar/Wind Power Systems
11
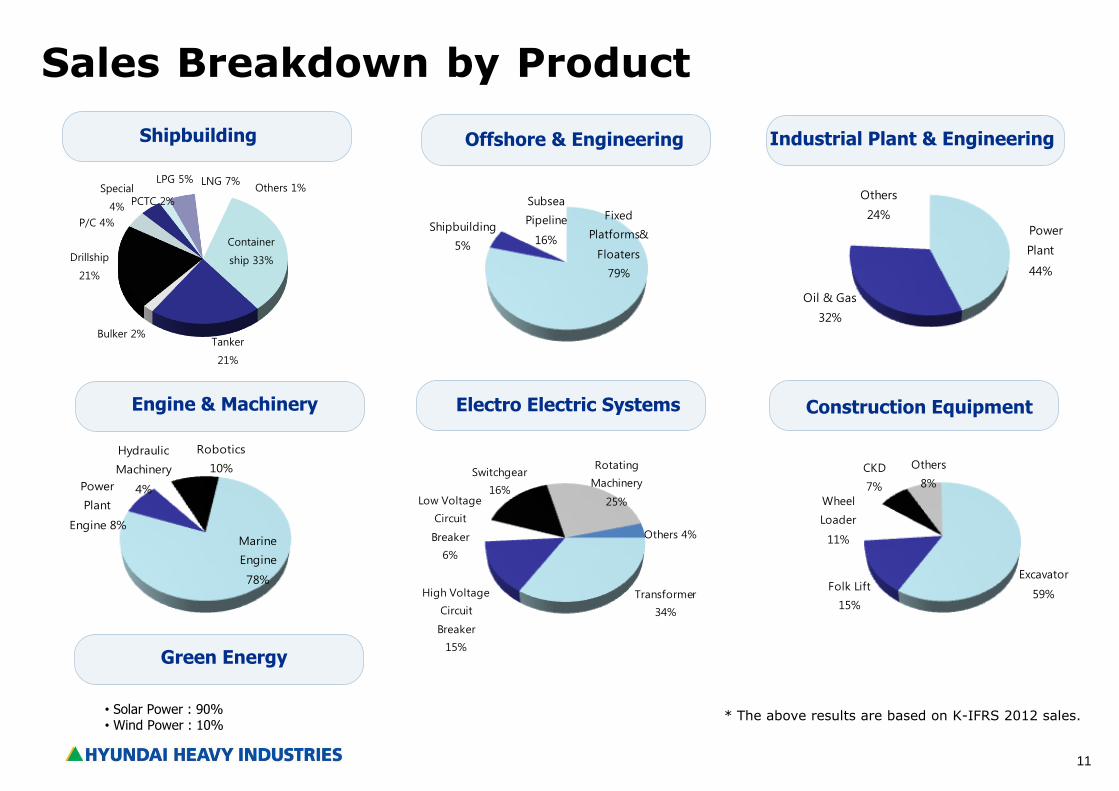
Power
Plant
44%
Oil & Gas
32%
Others
24%
Marine
Engine
78%
Power
Plant
Engine 8%
Hydraulic
Machinery
4%
Robotics
10%
Fixed
Platforms&
Floaters
79%
Shipbuilding
5%
Subsea
Pipeline
16%
Shipbuilding Offshore & Engineering
Electro Electric Systems
Industrial Plant & Engineering
Engine & Machinery
Sales Breakdown by Product
* The above results are based on K-IFRS 2012 sales.
Construction Equipment
Green Energy
• Solar Power : 90% • Wind Power : 10%
Excavator
59%Folk Lift
15%
Wheel
Loader
11%
CKD
7%
Others
8%
Transformer
34%
High Voltage
Circuit
Breaker
15%
Low Voltage
Circuit
Breaker
6%
Switchgear
16%
Rotating
Machinery
25%
Others 4%
Container
ship 33%
Tanker
21%
Bulker 2%
Drillship
21%
P/C 4%
Special
4% PCTC 2%
LPG 5% LNG 7% Others 1%
12
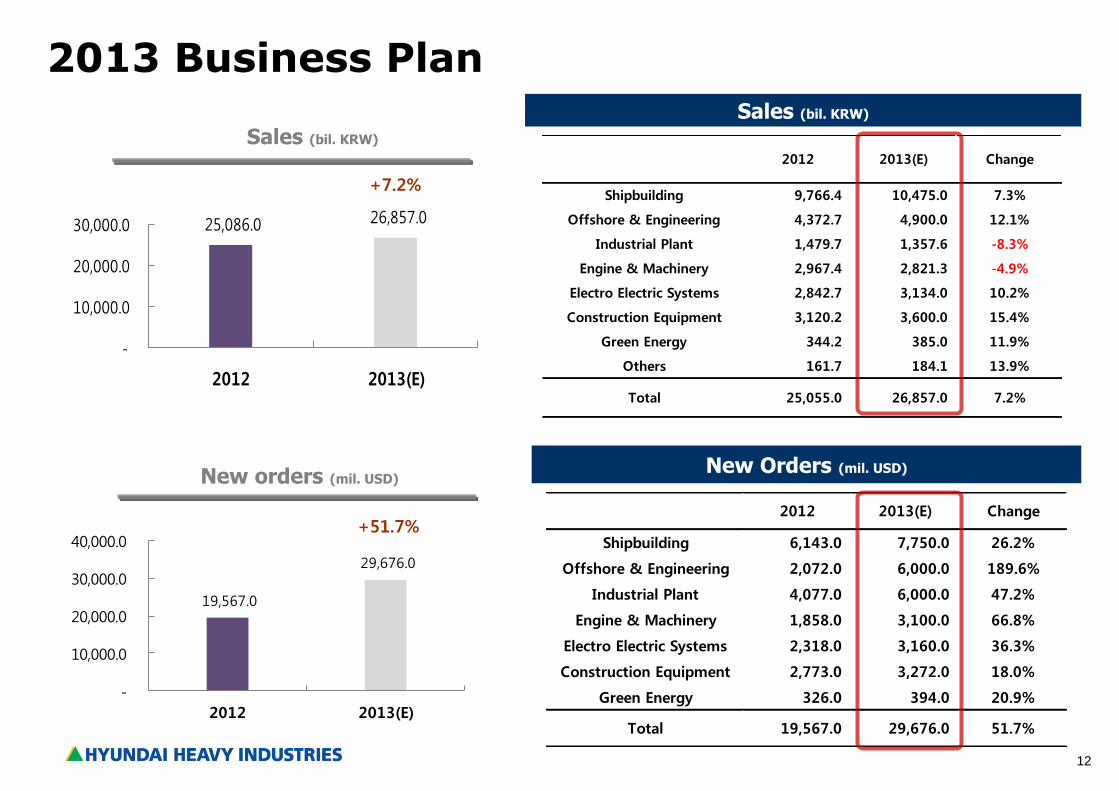
2012 2013(E) Change
Shipbuilding 9,766.4 10,475.0 7.3%
Offshore & Engineering 4,372.7 4,900.0 12.1%
Industrial Plant 1,479.7 1,357.6 -8.3%
Engine & Machinery 2,967.4 2,821.3 -4.9%
Electro Electric Systems 2,842.7 3,134.0 10.2%
Construction Equipment 3,120.2 3,600.0 15.4%
Green Energy 344.2 385.0 11.9%
Others 161.7 184.1 13.9%
Total 25,055.0 26,857.0 7.2%
19,567.0
29,676.0
-
10,000.0
20,000.0
30,000.0
40,000.0
2012 2013(E)
2013 Business Plan Sales (bil. KRW)
2012 2013(E) Change
Shipbuilding 6,143.0 7,750.0 26.2%
Offshore & Engineering 2,072.0 6,000.0 189.6%
Industrial Plant 4,077.0 6,000.0 47.2%
Engine & Machinery 1,858.0 3,100.0 66.8%
Electro Electric Systems 2,318.0 3,160.0 36.3%
Construction Equipment 2,773.0 3,272.0 18.0%
Green Energy 326.0 394.0 20.9%
Total 19,567.0 29,676.0 51.7%
New Orders (mil. USD)
New orders (mil. USD)
+51.7%
25,086.0 26,857.0
-
10,000.0
20,000.0
30,000.0
2012 2013(E)
Sales (bil. KRW)
+7.2%
13
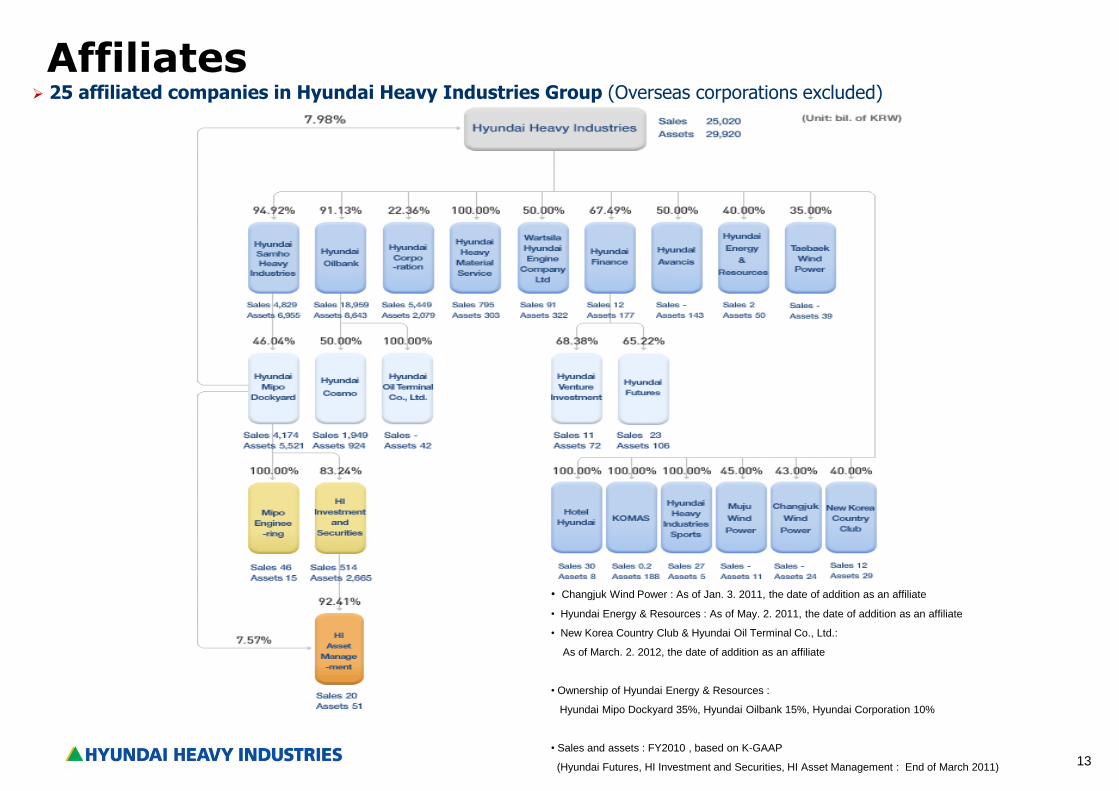
25 affiliated companies in Hyundai Heavy Industries Group (Overseas corporations excluded)
Affiliates
• Changjuk Wind Power : As of Jan. 3. 2011, the date of addition as an affiliate
• Hyundai Energy & Resources : As of May. 2. 2011, the date of addition as an affiliate
• New Korea Country Club & Hyundai Oil Terminal Co., Ltd.:
As of March. 2. 2012, the date of addition as an affiliate
• Ownership of Hyundai Energy & Resources :
Hyundai Mipo Dockyard 35%, Hyundai Oilbank 15%, Hyundai Corporation 10%
• Sales and assets : FY2010 , based on K-GAAP
(Hyundai Futures, HI Investment and Securities, HI Asset Management : End of March 2011)
14
Vladivostok
Tokyo
Beijing
Hyundai Financial Leasing Co., Ltd.
Grand China Shipping (Hong Kong) Company Limited
Chanzhou
Singapore
Mumbai Dubai
Jebel Ali
Abu Dhabi
Atlanta
(office, incorporated)
New Jersey
Houston
Istanbul
Athens
Luanda
Nigeria
Oslo
Rotterdam London
France Hyundai Ideal Electric Co.
Panama
Osaka
Moscow
NIKORMA
HHI China Investment Co., Ltd.
Tai’an
Saudi Arabia
Al Khobar
Fujairah
Alabama Shandong Yantai
Kuwait
Kuwait Offset
Spain
Hungary
Offices (23)
Production & Sales(14)
Management(5)
Construction(3)
Sales (2)
R&D(2)
Region Overseas
office Incorporated
firm (*1) Total
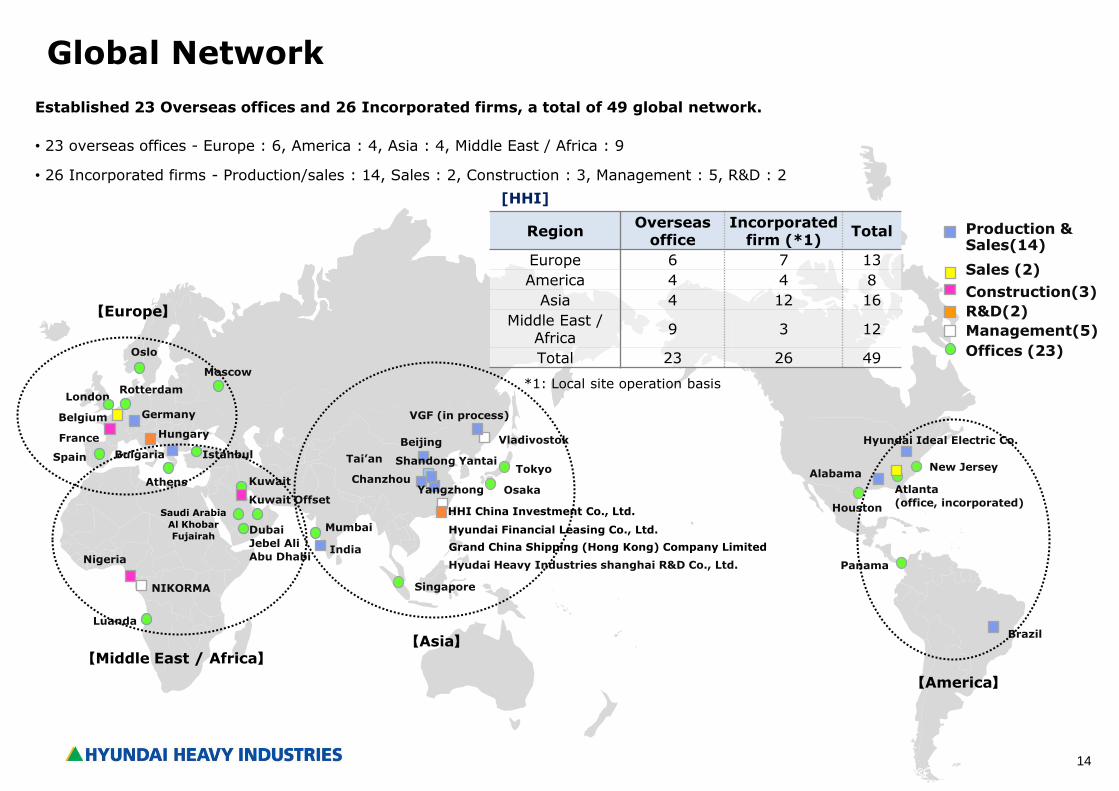
Europe 6 7 13
America 4 4 8
Asia 4 12 16
Middle East / Africa
9 3 12
Total 23 26 49
India
Bulgaria
Belgium Germany
Hyudai Heavy Industries shanghai R&D Co., Ltd.
VGF (in process)
Brazil
Established 23 Overseas offices and 26 Incorporated firms, a total of 49 global network.
• 23 overseas offices - Europe : 6, America : 4, Asia : 4, Middle East / Africa : 9
• 26 Incorporated firms - Production/sales : 14, Sales : 2, Construction : 3, Management : 5, R&D : 2
【Europe】
【Middle East / Africa】 【Asia】
【America】
[HHI]
*1: Local site operation basis
Yangzhong
Global Network
15
Business Performance
16
2,043 2,809
6,792 8,488 8,272
11,470
15,730 13,635
444 4,061
10,905
6,143 7,750 4,357 2,968
3,025
4,917
7,835
7,236
9,290
13,838
10,291
13,147
14,419
13,424
21,926
0
5,000
10,000
15,000
20,000
25,000
30,000
35,000
`01 `02 `03 `04 `05 `06 `07 `08 `09 `10 `11 `12 `13
(Target)
Shipbuilding Non-Shipbuilding
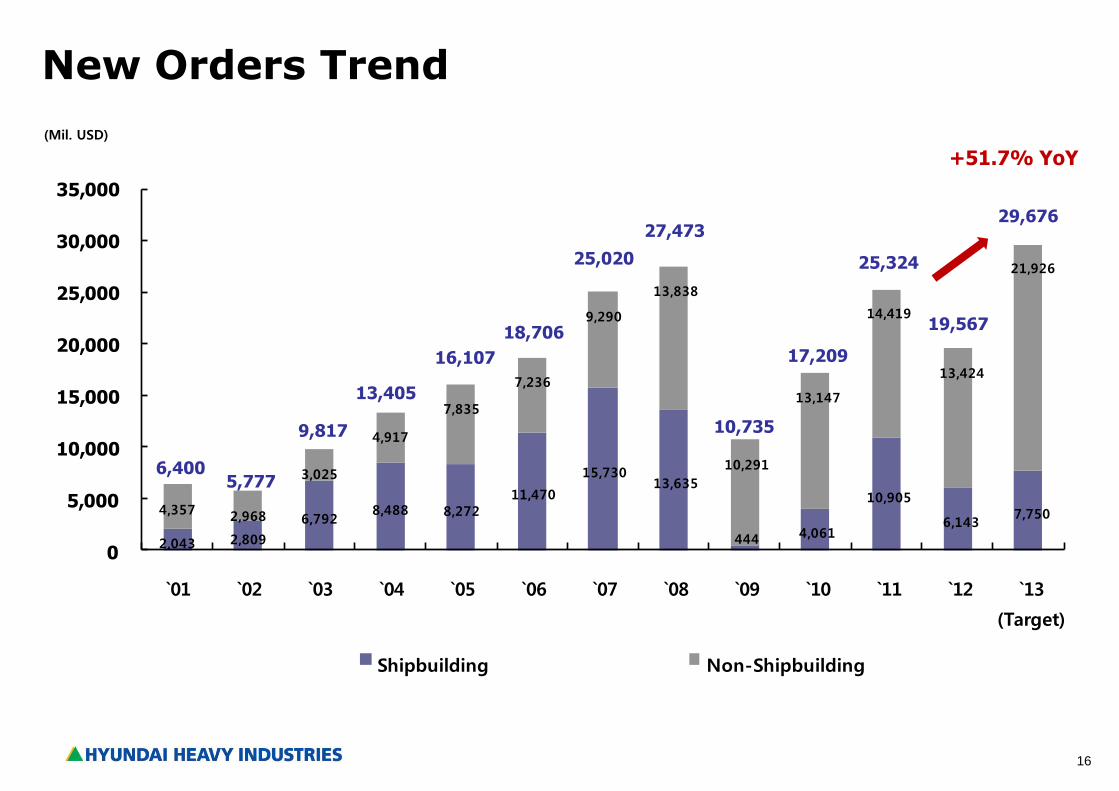
6,400 5,777
9,817
13,405
16,107
18,706
25,020
27,473
10,735
25,324
New Orders Trend
(Mil. USD)
17,209
+51.7% YoY
19,567
29,676
17
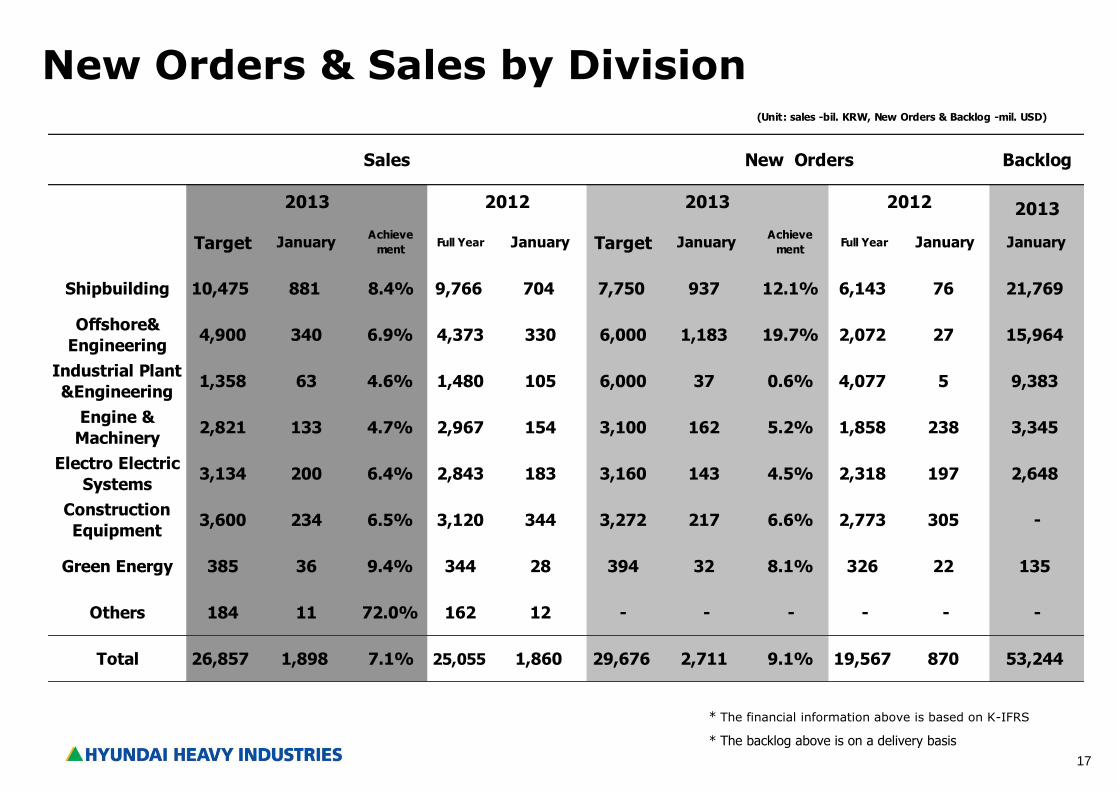
New Orders & Sales by Division
* The financial information above is based on K-IFRS
* The backlog above is on a delivery basis
Backlog
2013
Target JanuaryAchieve
mentFull Year January Target January
Achieve
mentFull Year January January
Shipbuilding 10,475 881 8.4% 9,766 704 7,750 937 12.1% 6,143 76 21,769
Offshore&
Engineering4,900 340 6.9% 4,373 330 6,000 1,183 19.7% 2,072 27 15,964
Industrial Plant
&Engineering1,358 63 4.6% 1,480 105 6,000 37 0.6% 4,077 5 9,383
Engine &
Machinery2,821 133 4.7% 2,967 154 3,100 162 5.2% 1,858 238 3,345
Electro Electric
Systems3,134 200 6.4% 2,843 183 3,160 143 4.5% 2,318 197 2,648
Construction
Equipment3,600 234 6.5% 3,120 344 3,272 217 6.6% 2,773 305 -
Green Energy 385 36 9.4% 344 28 394 32 8.1% 326 22 135
Others 184 11 72.0% 162 12 - - - - - -
Total 26,857 1,898 7.1% 25,055 1,860 29,676 2,711 9.1% 19,567 870 53,244
Sales
2013 2012
(Unit: sales -bil. KRW, New Orders & Backlog -mil. USD)
New Orders
20122013
18
Shipbuilding
Bulk Carrier Containerships Special Vessels LPG VLCC Naval Ships LNG Car Carriers Drillship
19
16.7 18.1
26.1
18.4 20.5
41.9 44.3 45.1
67.8
93.5
54.2
15.3
37.8
28.1 21.3
0
20
40
60
80
100
1998 2000 2002 2004 2006 2008 2010 2012
Global
Korea
Japan
China
0
50
100
150
200
02 03 04 05 06 07 08 09 10 11 12 13
VLCC
Bulk Carrier(Capesize)
Container(4,800TEU)
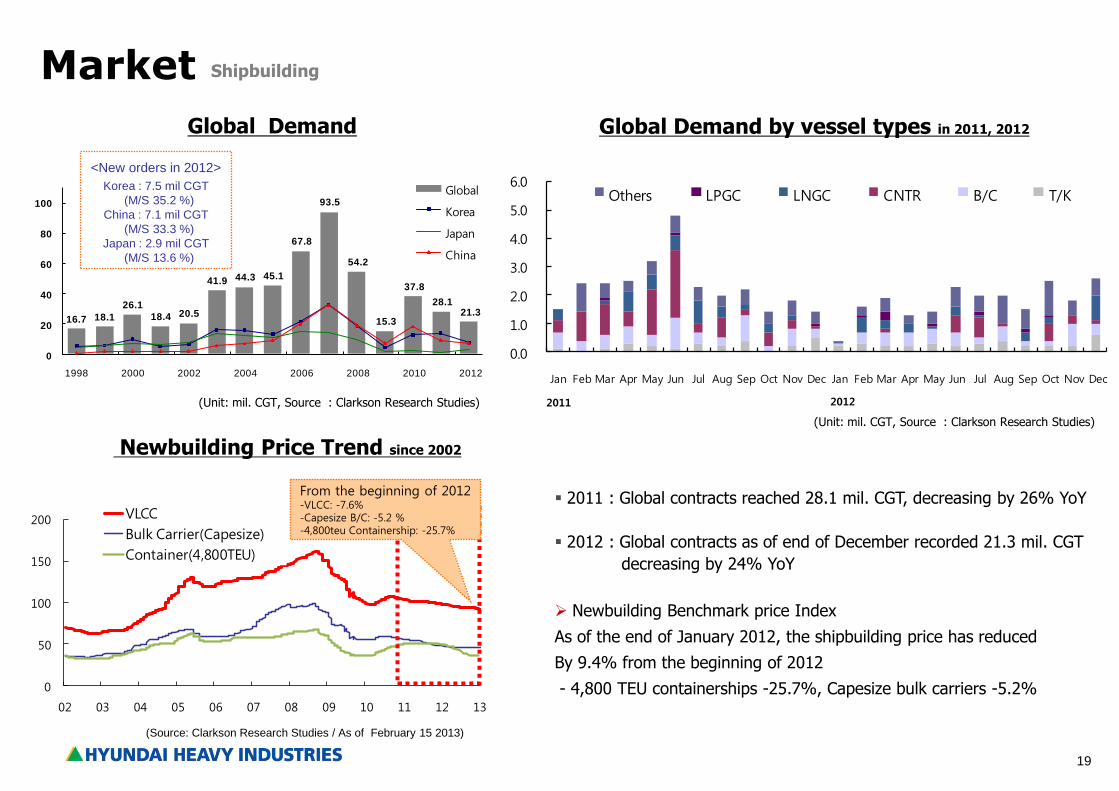
Market
(Unit: mil. CGT, Source : Clarkson Research Studies)
Newbuilding Price Trend since 2002
Global Demand by vessel types in 2011, 2012
Shipbuilding
2011 : Global contracts reached 28.1 mil. CGT, decreasing by 26% YoY
2012 : Global contracts as of end of December recorded 21.3 mil. CGT
decreasing by 24% YoY
Newbuilding Benchmark price Index
As of the end of January 2012, the shipbuilding price has reduced
By 9.4% from the beginning of 2012
- 4,800 TEU containerships -25.7%, Capesize bulk carriers -5.2%
(Source: Clarkson Research Studies / As of February 15 2013)
From the beginning of 2012 -VLCC: -7.6% -Capesize B/C: -5.2 % -4,800teu Containership: -25.7%
Global Demand
(Unit: mil. CGT, Source : Clarkson Research Studies)
<New orders in 2012>
Korea : 7.5 mil CGT
(M/S 35.2 %)
China : 7.1 mil CGT
(M/S 33.3 %)
Japan : 2.9 mil CGT
(M/S 13.6 %)
0.0
1.0
2.0
3.0
4.0
5.0
6.0
Jan Feb Mar Apr May Jun Jul Aug Sep Oct Nov Dec Jan Feb Mar Apr May Jun Jul Aug Sep Oct Nov Dec
Others LPGC LNGC CNTR B/C T/K
2011 2012
20
Shipbuilding
39.0%
Others
61.0%
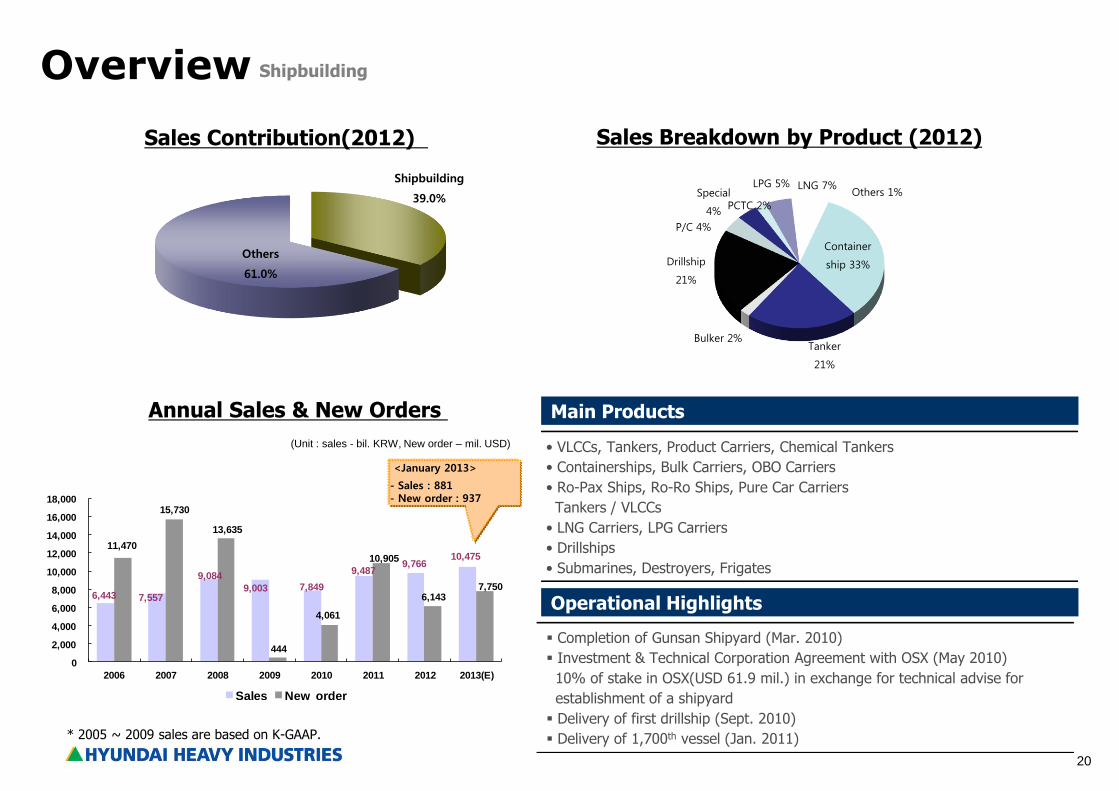
Overview
Annual Sales & New Orders
(Unit : sales - bil. KRW, New order – mil. USD)
Main Products
Sales Breakdown by Product (2012)
• VLCCs, Tankers, Product Carriers, Chemical Tankers
• Containerships, Bulk Carriers, OBO Carriers
• Ro-Pax Ships, Ro-Ro Ships, Pure Car Carriers
Tankers / VLCCs
• LNG Carriers, LPG Carriers
• Drillships
• Submarines, Destroyers, Frigates
Operational Highlights
Completion of Gunsan Shipyard (Mar. 2010)
Investment & Technical Corporation Agreement with OSX (May 2010)
10% of stake in OSX(USD 61.9 mil.) in exchange for technical advise for
establishment of a shipyard
Delivery of first drillship (Sept. 2010)
Delivery of 1,700th vessel (Jan. 2011)
Shipbuilding
<January 2013>
- Sales : 881 - New order : 937
Sales Contribution(2012)
* 2005 ~ 2009 sales are based on K-GAAP.
6,443 7,557
9,084
9,003 7,849
9,487 9,766
10,475 11,470
15,730
13,635
444
4,061
10,905
6,143 7,750
0
2,000
4,000
6,000
8,000
10,000
12,000
14,000
16,000
18,000
2006 2007 2008 2009 2010 2011 2012 2013(E)
Sales New order
Container
ship 33%
Tanker
21%
Bulker 2%
Drillship
21%
P/C 4%
Special
4% PCTC 2%
LPG 5% LNG 7% Others 1%
21
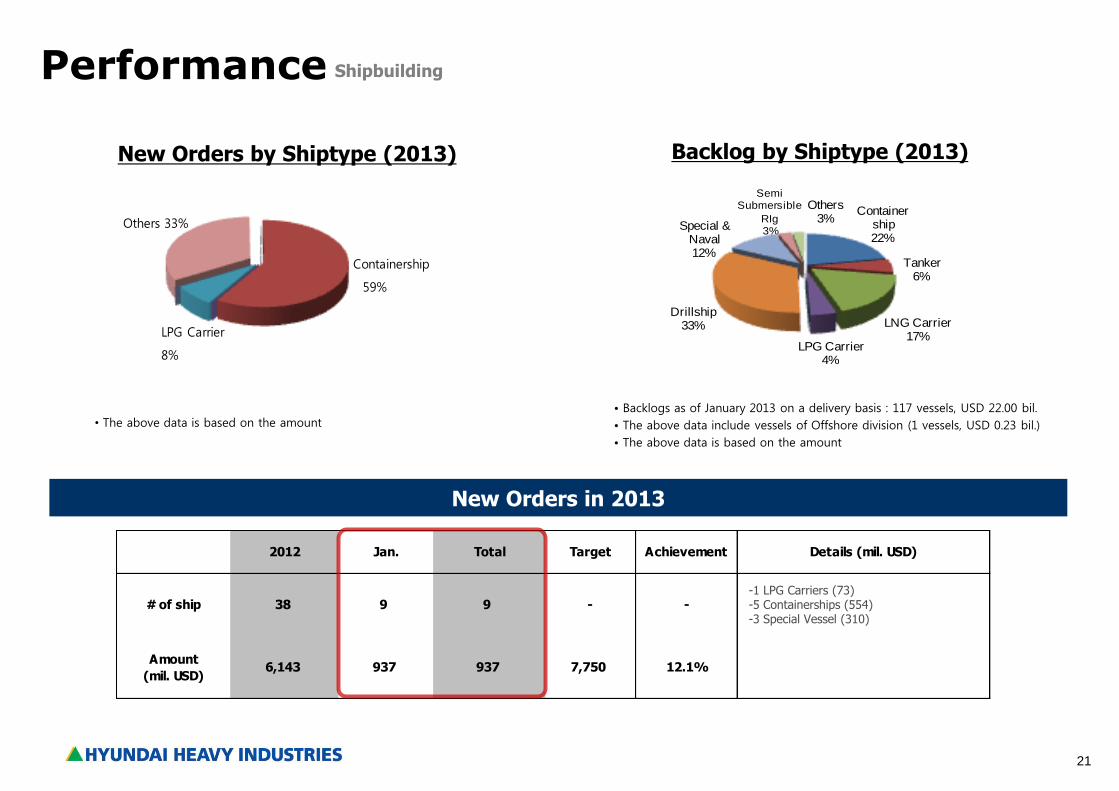
Backlog by Shiptype (2013)
Performance
New Orders in 2013
2012 Jan. Total Target Achievement Details (mil. USD)
# of ship 38 9 9 - -
Amount
(mil. USD)6,143 937 937 7,750 12.1%
New Orders by Shiptype (2013)
Shipbuilding
-1 LPG Carriers (73) -5 Containerships (554) -3 Special Vessel (310)
• Backlogs as of January 2013 on a delivery basis : 117 vessels, USD 22.00 bil.
• The above data include vessels of Offshore division (1 vessels, USD 0.23 bil.)
• The above data is based on the amount
• The above data is based on the amount
Container ship22%
Tanker6%
LNG Carrier17%
LPG Carrier4%
Drillship 33%
Special & Naval12%
Others3%
Semi Submersible
RIg3%
LPG Carrier
8%
Others 33%
Containership
59%
22
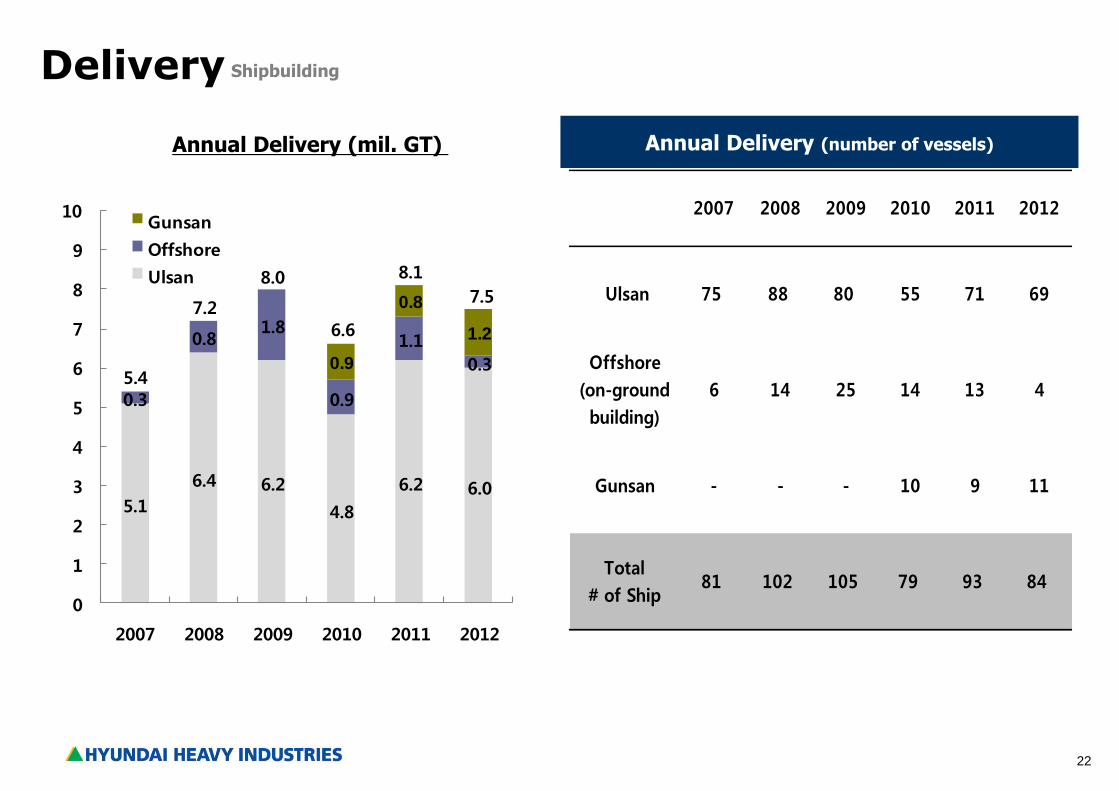
5.1
6.4 6.2
4.8
6.2 6.0
0.3
0.81.8
0.9
1.1
0.3 0.9
0.8
1.2
0
1
2
3
4
5
6
7
8
9
10
2007 2008 2009 2010 2011 2012
Gunsan
Offshore
Ulsan
5.4
7.2
8.0
6.6
7.5
8.1
Delivery
Annual Delivery (mil. GT) Annual Delivery (number of vessels)
2007 2008 2009 2010 2011 2012
Ulsan 75 88 80 55 71 69
Offshore
(on-ground
building)
6 14 25 14 13 4
Gunsan - - - 10 9 11
Total
# of Ship81 102 105 79 93 84
Shipbuilding
23
Offshore & Engineering
FPSO Semi-Submersible Unit Drilling Rig Subsea Pipeline
24
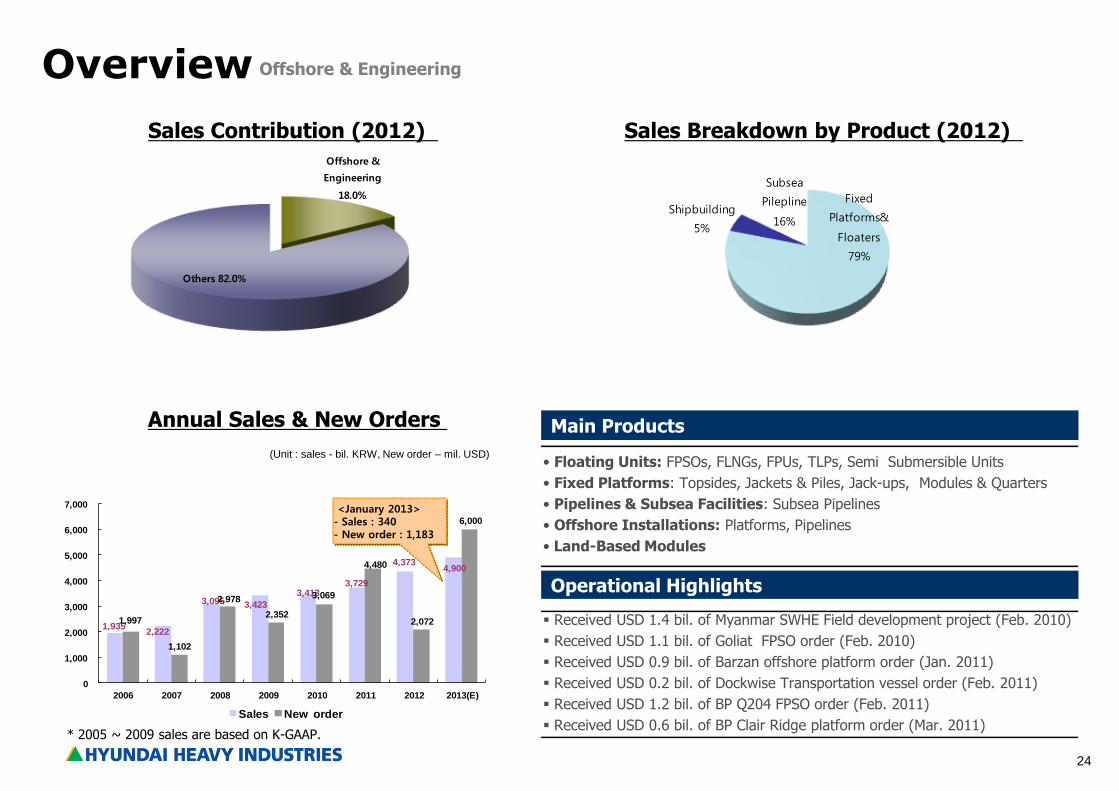
Offshore &
Engineering
18.0%
Others 82.0%
1,935 2,222
3,095 3,423
3,413 3,729
4,373 4,900
1,997
1,102
2,978
2,352
3,069
4,480
2,072
6,000
0
1,000
2,000
3,000
4,000
5,000
6,000
7,000
2006 2007 2008 2009 2010 2011 2012 2013(E)
Sales New order
Sales Contribution (2012)
Overview
(Unit : sales - bil. KRW, New order – mil. USD)
Annual Sales & New Orders
Sales Breakdown by Product (2012)
• Floating Units: FPSOs, FLNGs, FPUs, TLPs, Semi Submersible Units
• Fixed Platforms: Topsides, Jackets & Piles, Jack-ups, Modules & Quarters
• Pipelines & Subsea Facilities: Subsea Pipelines
• Offshore Installations: Platforms, Pipelines
• Land-Based Modules
Main Products
Operational Highlights
Received USD 1.4 bil. of Myanmar SWHE Field development project (Feb. 2010)
Received USD 1.1 bil. of Goliat FPSO order (Feb. 2010)
Received USD 0.9 bil. of Barzan offshore platform order (Jan. 2011)
Received USD 0.2 bil. of Dockwise Transportation vessel order (Feb. 2011)
Received USD 1.2 bil. of BP Q204 FPSO order (Feb. 2011)
Received USD 0.6 bil. of BP Clair Ridge platform order (Mar. 2011)
Offshore & Engineering
<January 2013> - Sales : 340 - New order : 1,183
* 2005 ~ 2009 sales are based on K-GAAP.
Fixed
Platforms&
Floaters
79%
Shipbuilding
5%
Subsea
Pilepline
16%
25
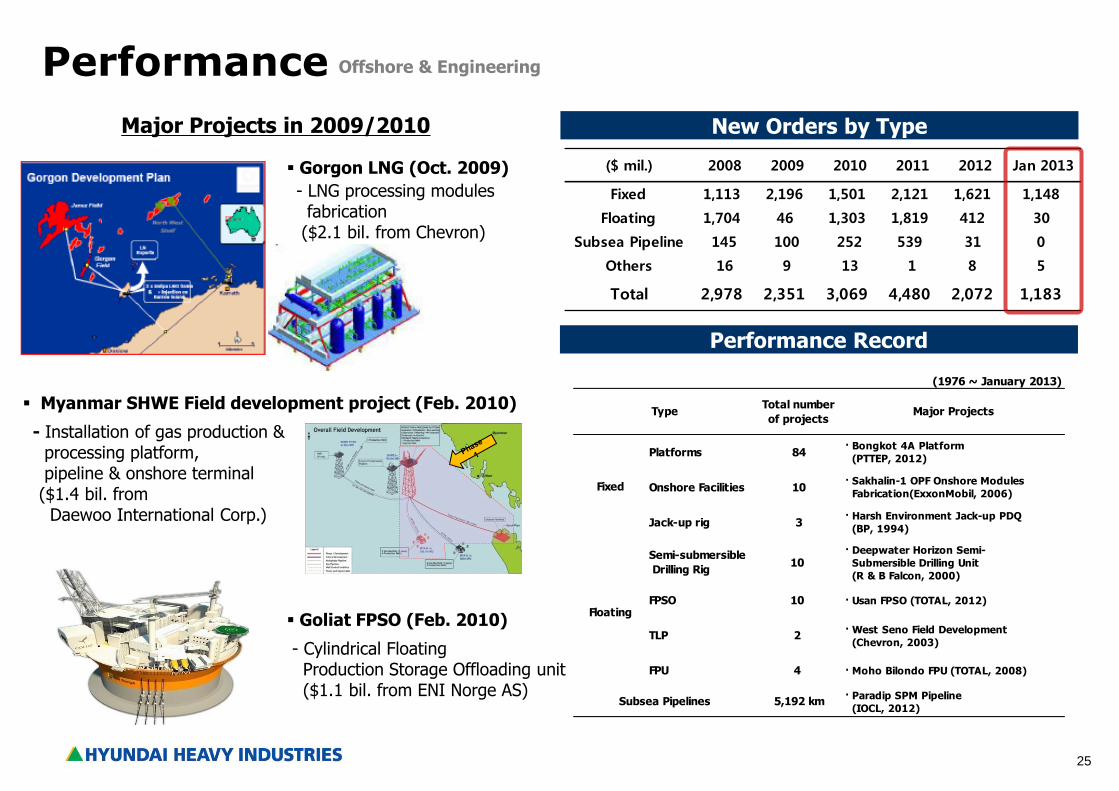
Performance
New Orders by Type
($ mil.) 2008 2009 2010 2011 2012 Jan 2013
Fixed 1,113 2,196 1,501 2,121 1,621 1,148
Floating 1,704 46 1,303 1,819 412 30
Subsea Pipeline 145 100 252 539 31 0
Others 16 9 13 1 8 5
Total 2,978 2,351 3,069 4,480 2,072 1,183
Performance Record
Major Projects in 2009/2010
Gorgon LNG (Oct. 2009)
- LNG processing modules fabrication ($2.1 bil. from Chevron)
Myanmar SHWE Field development project (Feb. 2010)
- Installation of gas production & processing platform, pipeline & onshore terminal ($1.4 bil. from Daewoo International Corp.)
Goliat FPSO (Feb. 2010)
- Cylindrical Floating Production Storage Offloading unit ($1.1 bil. from ENI Norge AS)
Offshore & Engineering
(1976 ~ January 2013)
Total number
of projectsMajor Projects
Platforms 84· Bongkot 4A Platform
(PTTEP, 2012)
Onshore Facilities 10· Sakhalin-1 OPF Onshore Modules
Fabrication(ExxonMobil, 2006)
Jack-up rig 3· Harsh Environment Jack-up PDQ
(BP, 1994)
Semi-submersible
Drilling Rig10
· Deepwater Horizon Semi-
Submersible Drilling Unit
(R & B Falcon, 2000)
FPSO 10 · Usan FPSO (TOTAL, 2012)
TLP 2· West Seno Field Development
(Chevron, 2003)
FPU 4 · Moho Bilondo FPU (TOTAL, 2008)
5,192 km· Paradip SPM Pipeline
(IOCL, 2012)
Fixed
Floating
Subsea Pipelines
Type
26
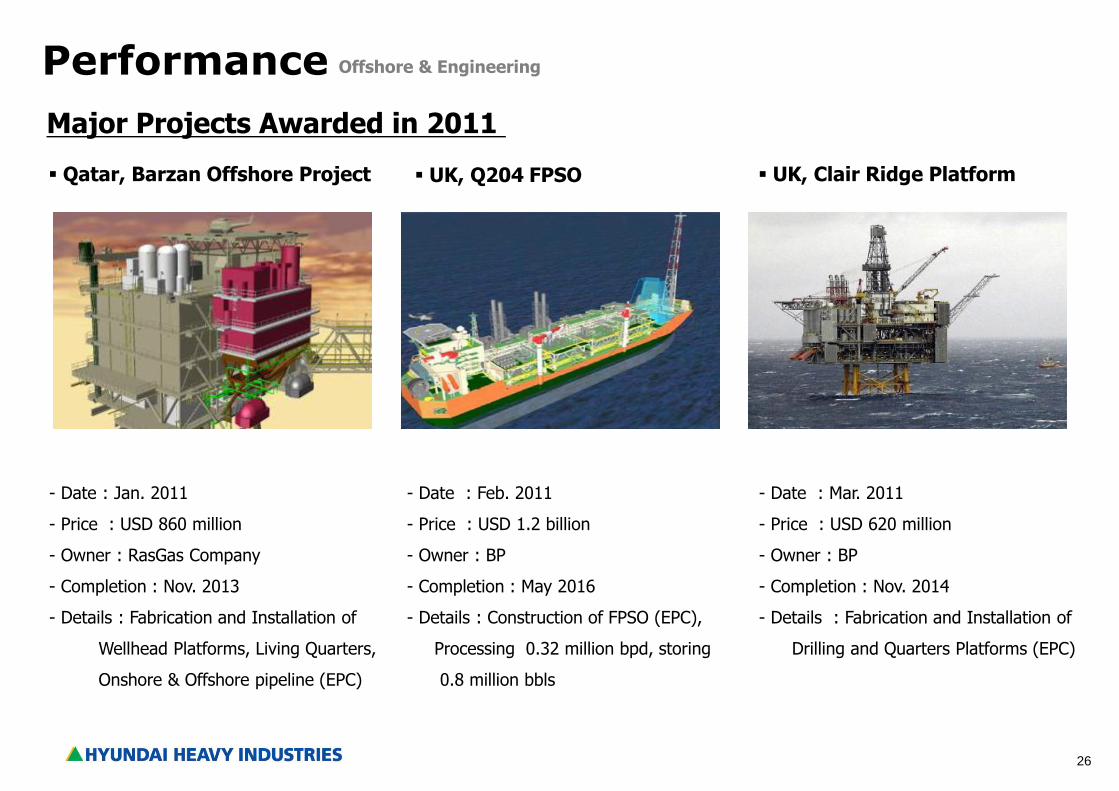
Performance
Major Projects Awarded in 2011
Qatar, Barzan Offshore Project
- Date : Jan. 2011
- Price : USD 860 million
- Owner : RasGas Company
- Completion : Nov. 2013
- Details : Fabrication and Installation of
Wellhead Platforms, Living Quarters,
Onshore & Offshore pipeline (EPC)
Offshore & Engineering
UK, Q204 FPSO UK, Clair Ridge Platform
- Date : Feb. 2011
- Price : USD 1.2 billion
- Owner : BP
- Completion : May 2016
- Details : Construction of FPSO (EPC),
Processing 0.32 million bpd, storing
0.8 million bbls
- Date : Mar. 2011
- Price : USD 620 million
- Owner : BP
- Completion : Nov. 2014
- Details : Fabrication and Installation of
Drilling and Quarters Platforms (EPC)
27
Industrial Plant & Engineering
Co-Generation Plant Process Plant Thermal Power Plant Combined Cycle Power Plant
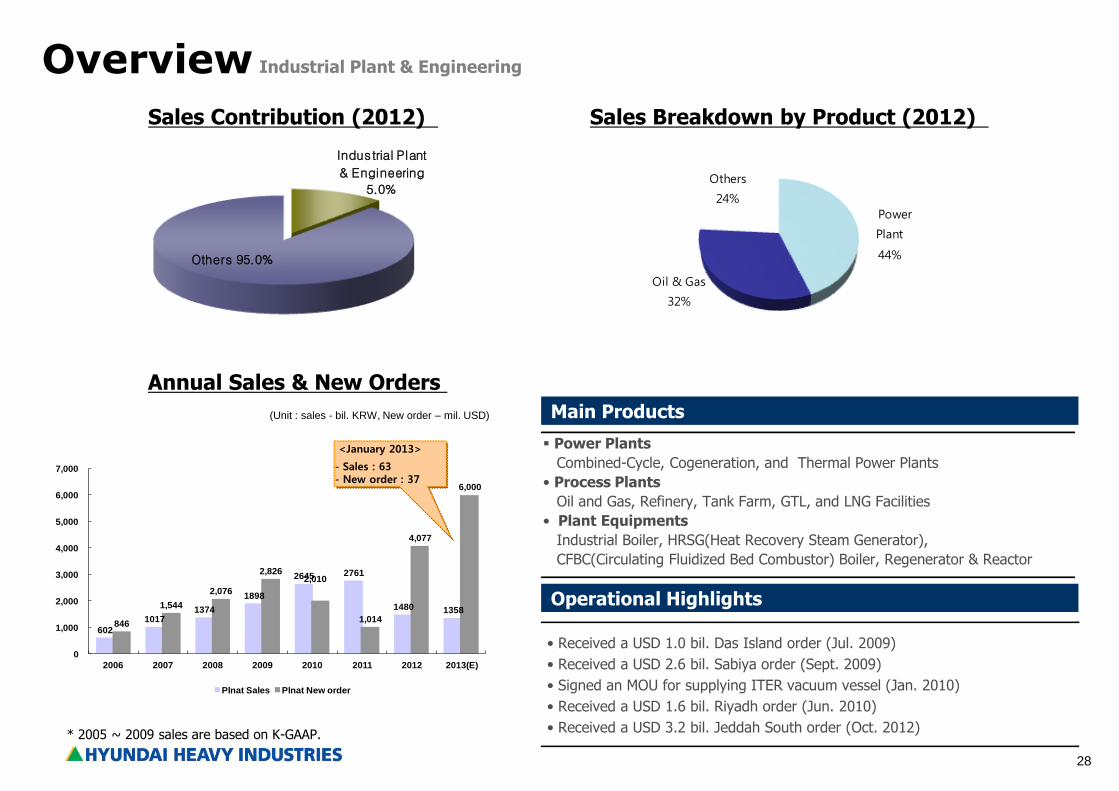
28
Industrial Plant
& Engineering
5.0%
Others 95.0%
602
10171374
1898
2645 2761
1480 1358
846
1,544
2,076
2,826 2,010
1,014
4,077
6,000
0
1,000
2,000
3,000
4,000
5,000
6,000
7,000
2006 2007 2008 2009 2010 2011 2012 2013(E)
Plnat Sales Plnat New order
Sales Contribution (2012)
Overview
(Unit : sales - bil. KRW, New order – mil. USD)
Annual Sales & New Orders
Sales Breakdown by Product (2012)
Main Products
Power Plants
Combined-Cycle, Cogeneration, and Thermal Power Plants
• Process Plants
Oil and Gas, Refinery, Tank Farm, GTL, and LNG Facilities
• Plant Equipments
Industrial Boiler, HRSG(Heat Recovery Steam Generator),
CFBC(Circulating Fluidized Bed Combustor) Boiler, Regenerator & Reactor
Operational Highlights
Industrial Plant & Engineering
<January 2013>
- Sales : 63 - New order : 37
* 2005 ~ 2009 sales are based on K-GAAP.
• Received a USD 1.0 bil. Das Island order (Jul. 2009)
• Received a USD 2.6 bil. Sabiya order (Sept. 2009)
• Signed an MOU for supplying ITER vacuum vessel (Jan. 2010)
• Received a USD 1.6 bil. Riyadh order (Jun. 2010)
• Received a USD 3.2 bil. Jeddah South order (Oct. 2012)
Power
Plant
44%
Oil & Gas
32%
Others
24%
29
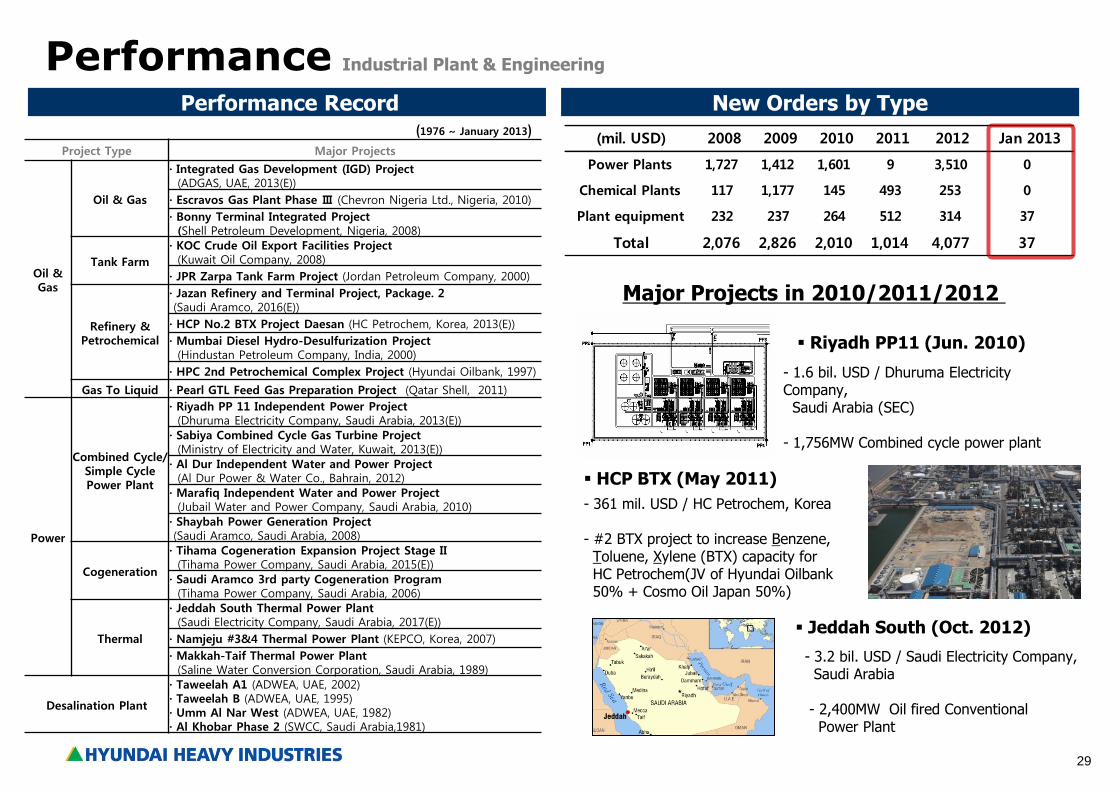
Performance Performance Record New Orders by Type
(mil. USD) 2008 2009 2010 2011 2012 Jan 2013
Power Plants 1,727 1,412 1,601 9 3,510 0
Chemical Plants 117 1,177 145 493 253 0
Plant equipment 232 237 264 512 314 37
Total 2,076 2,826 2,010 1,014 4,077 37
Industrial Plant & Engineering
Major Projects in 2010/2011/2012
(1976 ~ January 2013)
Project Type Major Projects
Oil & Gas
Oil & Gas
· Integrated Gas Development (IGD) Project (ADGAS, UAE, 2013(E))
· Escravos Gas Plant Phase Ⅲ (Chevron Nigeria Ltd., Nigeria, 2010)
· Bonny Terminal Integrated Project (Shell Petroleum Development, Nigeria, 2008)
Tank Farm
· KOC Crude Oil Export Facilities Project (Kuwait Oil Company, 2008)
· JPR Zarpa Tank Farm Project (Jordan Petroleum Company, 2000)
Refinery & Petrochemical
· Jazan Refinery and Terminal Project, Package. 2 (Saudi Aramco, 2016(E))
· HCP No.2 BTX Project Daesan (HC Petrochem, Korea, 2013(E))
· Mumbai Diesel Hydro-Desulfurization Project (Hindustan Petroleum Company, India, 2000)
· HPC 2nd Petrochemical Complex Project (Hyundai Oilbank, 1997)
Gas To Liquid · Pearl GTL Feed Gas Preparation Project (Qatar Shell, 2011)
Power
Combined Cycle/ Simple Cycle Power Plant
· Riyadh PP 11 Independent Power Project (Dhuruma Electricity Company, Saudi Arabia, 2013(E))
· Sabiya Combined Cycle Gas Turbine Project (Ministry of Electricity and Water, Kuwait, 2013(E))
· Al Dur Independent Water and Power Project (Al Dur Power & Water Co., Bahrain, 2012)
· Marafiq Independent Water and Power Project (Jubail Water and Power Company, Saudi Arabia, 2010)
· Shaybah Power Generation Project (Saudi Aramco, Saudi Arabia, 2008)
Cogeneration
· Tihama Cogeneration Expansion Project Stage II (Tihama Power Company, Saudi Arabia, 2015(E))
· Saudi Aramco 3rd party Cogeneration Program (Tihama Power Company, Saudi Arabia, 2006)
Thermal
· Jeddah South Thermal Power Plant (Saudi Electricity Company, Saudi Arabia, 2017(E))
· Namjeju #3&4 Thermal Power Plant (KEPCO, Korea, 2007)
· Makkah-Taif Thermal Power Plant (Saline Water Conversion Corporation, Saudi Arabia, 1989)
Desalination Plant
· Taweelah A1 (ADWEA, UAE, 2002) · Taweelah B (ADWEA, UAE, 1995) · Umm Al Nar West (ADWEA, UAE, 1982) · Al Khobar Phase 2 (SWCC, Saudi Arabia,1981)
Riyadh PP11 (Jun. 2010)
- 1.6 bil. USD / Dhuruma Electricity Company, Saudi Arabia (SEC) - 1,756MW Combined cycle power plant
HCP BTX (May 2011)
- 361 mil. USD / HC Petrochem, Korea - #2 BTX project to increase Benzene, Toluene, Xylene (BTX) capacity for HC Petrochem(JV of Hyundai Oilbank 50% + Cosmo Oil Japan 50%)
Jeddah South (Oct. 2012)
- 3.2 bil. USD / Saudi Electricity Company, Saudi Arabia - 2,400MW Oil fired Conventional Power Plant
30
Engine & Machinery
Marine Engine & Equip. Marine & Industrial Turbine Industrial & Marine Pump Industrial Robot & System Marine Propeller
31
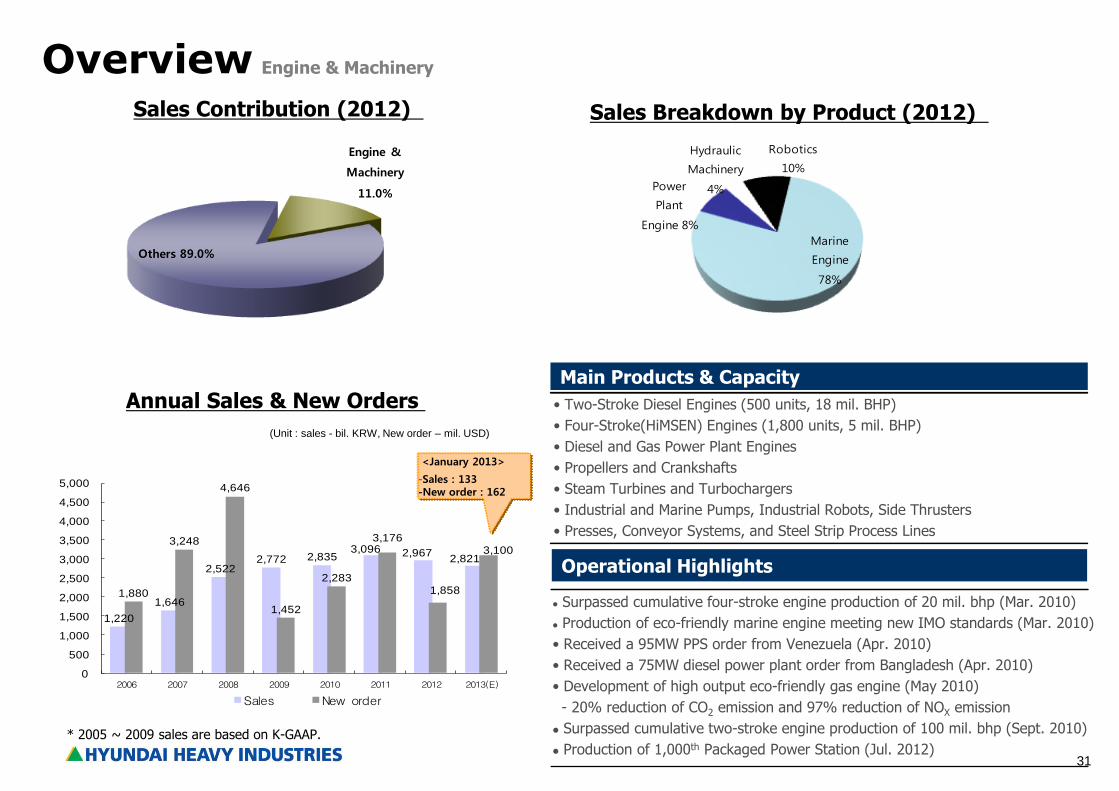
Overview
(Unit : sales - bil. KRW, New order – mil. USD)
Annual Sales & New Orders
Engine & Machinery
Sales Breakdown by Product (2012)
Main Products & Capacity
Operational Highlights
• Two-Stroke Diesel Engines (500 units, 18 mil. BHP)
• Four-Stroke(HiMSEN) Engines (1,800 units, 5 mil. BHP)
• Diesel and Gas Power Plant Engines
• Propellers and Crankshafts
• Steam Turbines and Turbochargers
• Industrial and Marine Pumps, Industrial Robots, Side Thrusters
• Presses, Conveyor Systems, and Steel Strip Process Lines
<January 2013>
-Sales : 133 -New order : 162
Sales Contribution (2012)
* 2005 ~ 2009 sales are based on K-GAAP.
Surpassed cumulative four-stroke engine production of 20 mil. bhp (Mar. 2010)
Production of eco-friendly marine engine meeting new IMO standards (Mar. 2010)
• Received a 95MW PPS order from Venezuela (Apr. 2010)
• Received a 75MW diesel power plant order from Bangladesh (Apr. 2010)
• Development of high output eco-friendly gas engine (May 2010)
- 20% reduction of CO2 emission and 97% reduction of NOX emission
Surpassed cumulative two-stroke engine production of 100 mil. bhp (Sept. 2010)
Production of 1,000th Packaged Power Station (Jul. 2012)
Engine &
Machinery
11.0%
Others 89.0%Marine
Engine
78%
Power
Plant
Engine 8%
Hydraulic
Machinery
4%
Robotics
10%
1,220
1,646
2,522 2,772 2,835
3,096 2,967 2,821
1,880
3,248
4,646
1,452
2,283
3,176
1,858
3,100
0
500
1,000
1,500
2,000
2,500
3,000
3,500
4,000
4,500
5,000
2006 2007 2008 2009 2010 2011 2012 2013(E)
Sales New order
32
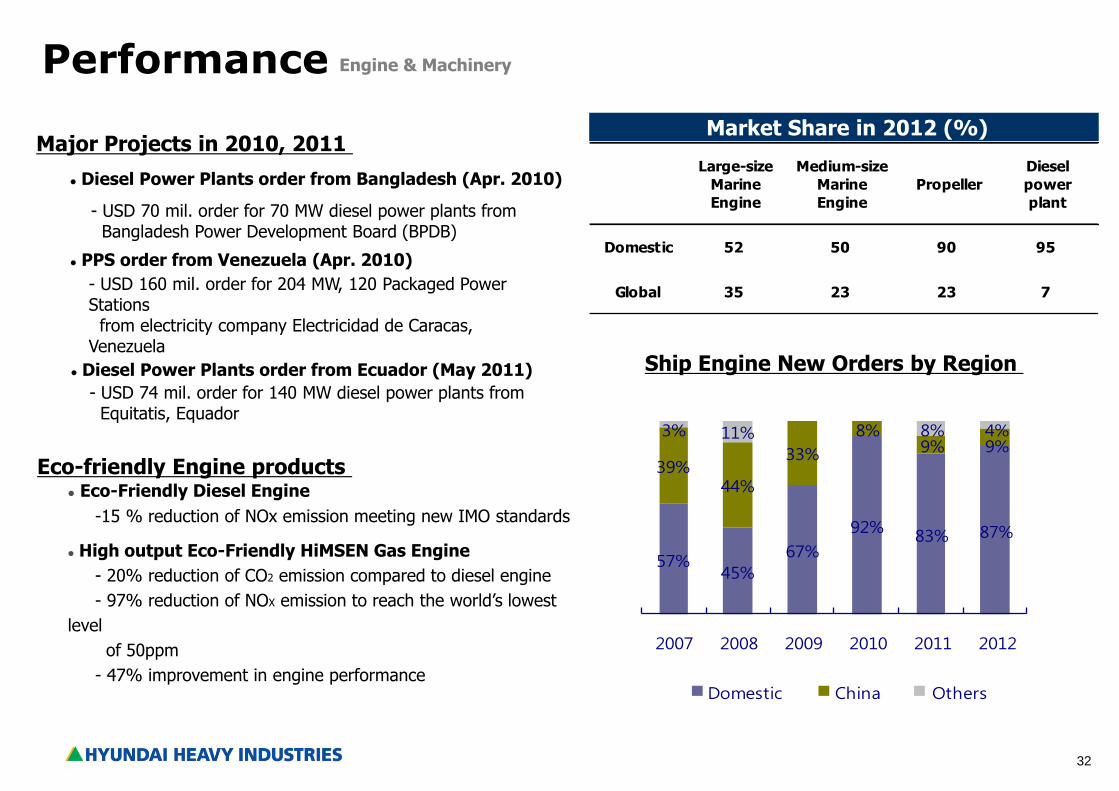
Performance
Eco-Friendly Diesel Engine
-15 % reduction of NOx emission meeting new IMO standards
High output Eco-Friendly HiMSEN Gas Engine
- 20% reduction of CO2 emission compared to diesel engine
- 97% reduction of NOX emission to reach the world’s lowest
level
of 50ppm
- 47% improvement in engine performance
Ship Engine New Orders by Region
Engine & Machinery
Market Share in 2012 (%)
Large-size
Marine
Engine
Medium-size
Marine
Engine
Propeller
Diesel
power
plant
Domestic 52 50 90 95
Global 35 23 23 7
Diesel Power Plants order from Bangladesh (Apr. 2010)
- USD 70 mil. order for 70 MW diesel power plants from Bangladesh Power Development Board (BPDB)
Eco-friendly Engine products
Major Projects in 2010, 2011
PPS order from Venezuela (Apr. 2010)
- USD 160 mil. order for 204 MW, 120 Packaged Power Stations from electricity company Electricidad de Caracas, Venezuela
Diesel Power Plants order from Ecuador (May 2011)
- USD 74 mil. order for 140 MW diesel power plants from Equitatis, Equador
57%45%
67%
92%83% 87%
39%44%
33%
8%9% 9%
3% 11% 8% 4%
2007 2008 2009 2010 2011 2012
Domestic China Others
33
Electro Electric Systems
Transformers High Voltage Circuit Breakers Switchgears Marine Electrical Equip.
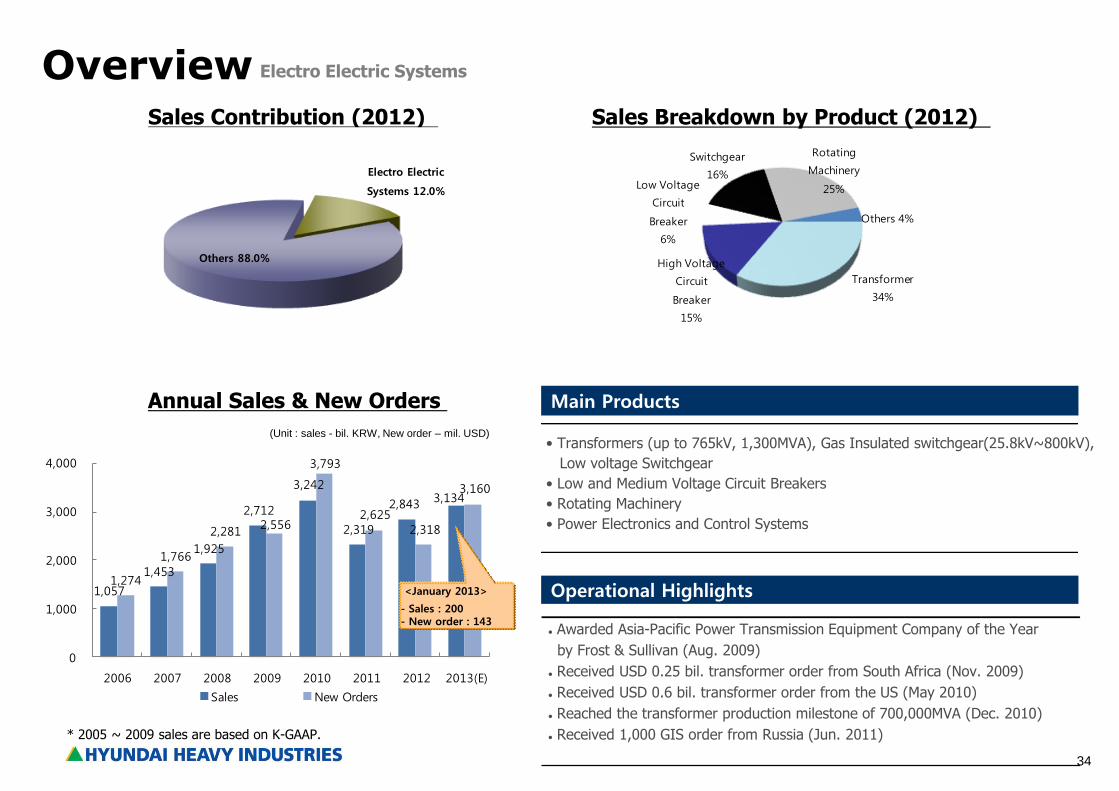
34
1,057
1,453
1,925
2,712
3,242
2,319
2,843 3,134
1,274
1,766
2,281 2,556
3,793
2,625 2,318
3,160
0
1,000
2,000
3,000
4,000
2006 2007 2008 2009 2010 2011 2012 2013(E)
Sales New Orders
Overview
(Unit : sales - bil. KRW, New order – mil. USD)
Sales Contribution (2012)
Annual Sales & New Orders
Operational Highlights
Main Products
Electro Electric Systems
Sales Breakdown by Product (2012)
• Transformers (up to 765kV, 1,300MVA), Gas Insulated switchgear(25.8kV~800kV),
Low voltage Switchgear
• Low and Medium Voltage Circuit Breakers
• Rotating Machinery
• Power Electronics and Control Systems
<January 2013>
- Sales : 200 - New order : 143
* 2005 ~ 2009 sales are based on K-GAAP.
Electro Electric
Systems 12.0%
Others 88.0%
Awarded Asia-Pacific Power Transmission Equipment Company of the Year
by Frost & Sullivan (Aug. 2009)
Received USD 0.25 bil. transformer order from South Africa (Nov. 2009)
Received USD 0.6 bil. transformer order from the US (May 2010)
Reached the transformer production milestone of 700,000MVA (Dec. 2010)
Received 1,000 GIS order from Russia (Jun. 2011)
Transformer
34%
High Voltage
Circuit
Breaker
15%
Low Voltage
Circuit
Breaker
6%
Switchgear
16%
Rotating
Machinery
25%
Others 4%
35
Performance
Sales by Region
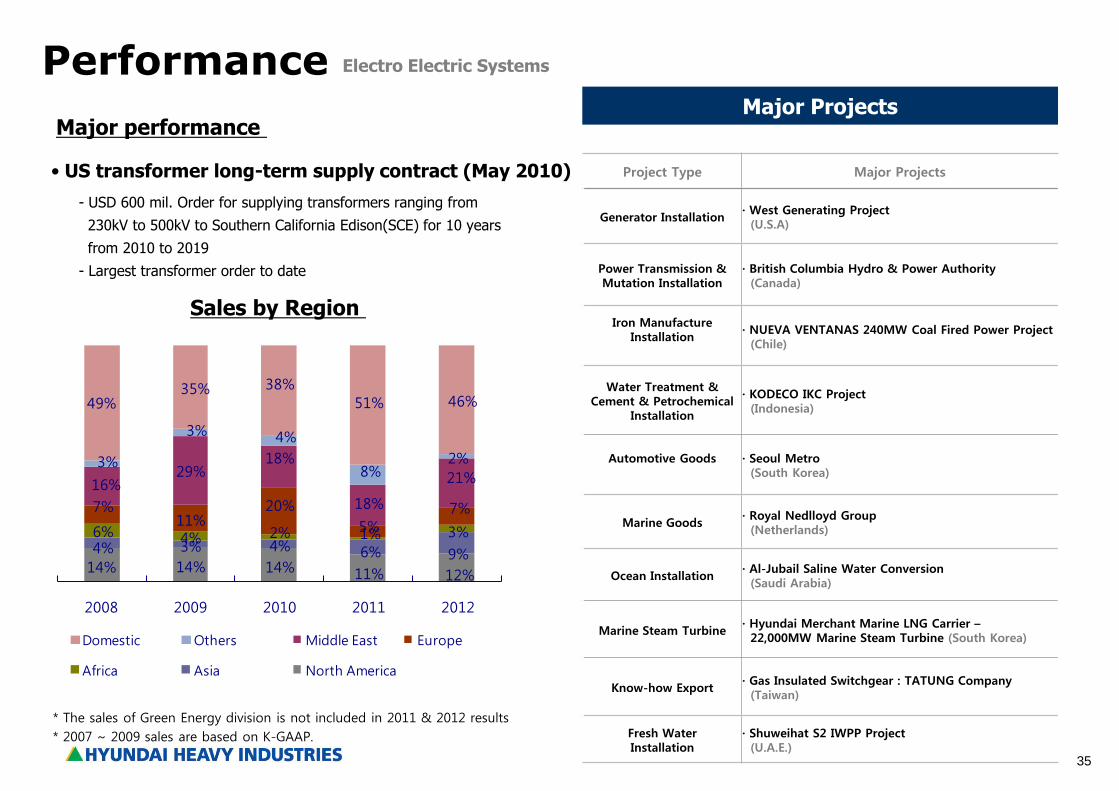
Electro Electric Systems
• US transformer long-term supply contract (May 2010)
Major performance
- USD 600 mil. Order for supplying transformers ranging from
230kV to 500kV to Southern California Edison(SCE) for 10 years
from 2010 to 2019
- Largest transformer order to date
* The sales of Green Energy division is not included in 2011 & 2012 results
* 2007 ~ 2009 sales are based on K-GAAP.
14% 14% 14% 11% 12%
4% 3% 4% 6% 9%
6% 4% 2% 1% 3%
7%11%
20%
5%7%
16%29%
18%
18%
21%3%
3% 4%
8%2%
49%35% 38%
51% 46%
2008 2009 2010 2011 2012
Domestic Others Middle East Europe
Africa Asia North America
Major Projects
Project Type Major Projects
Generator Installation · West Generating Project (U.S.A)
Power Transmission & Mutation Installation
· British Columbia Hydro & Power Authority (Canada)
Iron Manufacture Installation
· NUEVA VENTANAS 240MW Coal Fired Power Project (Chile)
Water Treatment & Cement & Petrochemical
Installation
· KODECO IKC Project (Indonesia)
Automotive Goods
· Seoul Metro (South Korea)
Marine Goods · Royal Nedlloyd Group (Netherlands)
Ocean Installation · Al-Jubail Saline Water Conversion (Saudi Arabia)
Marine Steam Turbine · Hyundai Merchant Marine LNG Carrier – 22,000MW Marine Steam Turbine (South Korea)
Know-how Export · Gas Insulated Switchgear : TATUNG Company (Taiwan)
Fresh Water Installation
· Shuweihat S2 IWPP Project (U.A.E.)
36
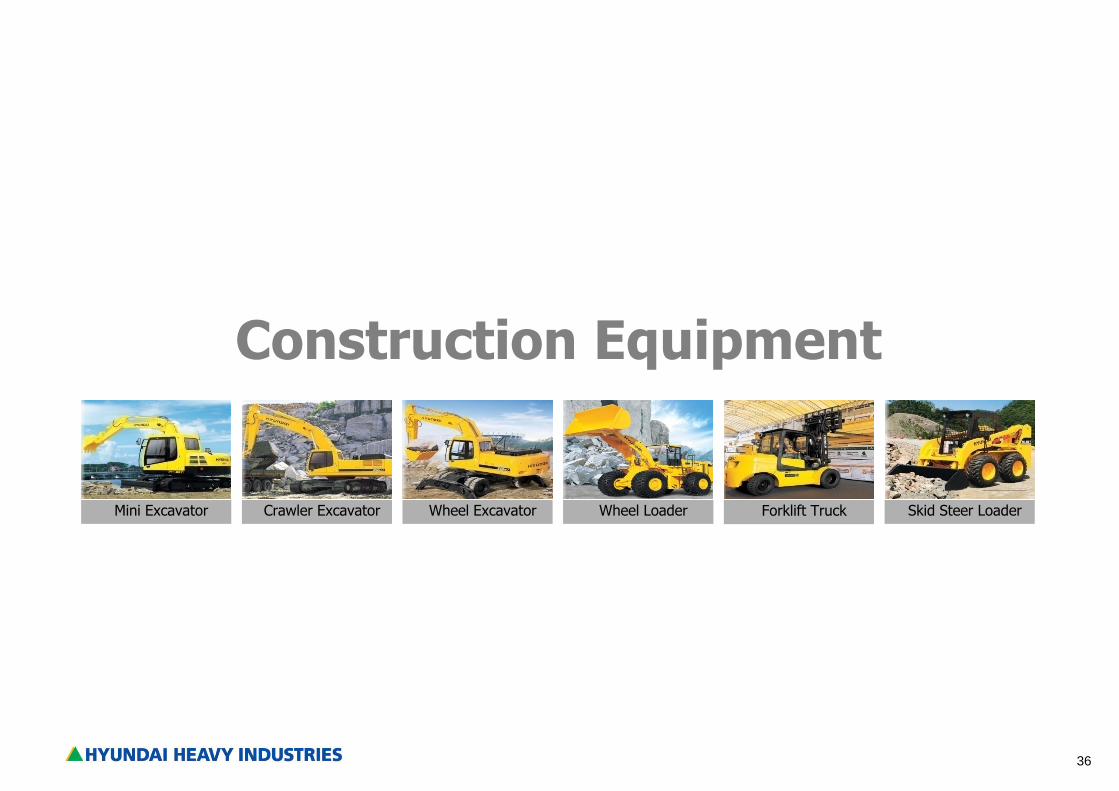
Construction Equipment
Crawler Excavator Wheel Loader Forklift Truck Skid Steer Loader Mini Excavator Wheel Excavator
37
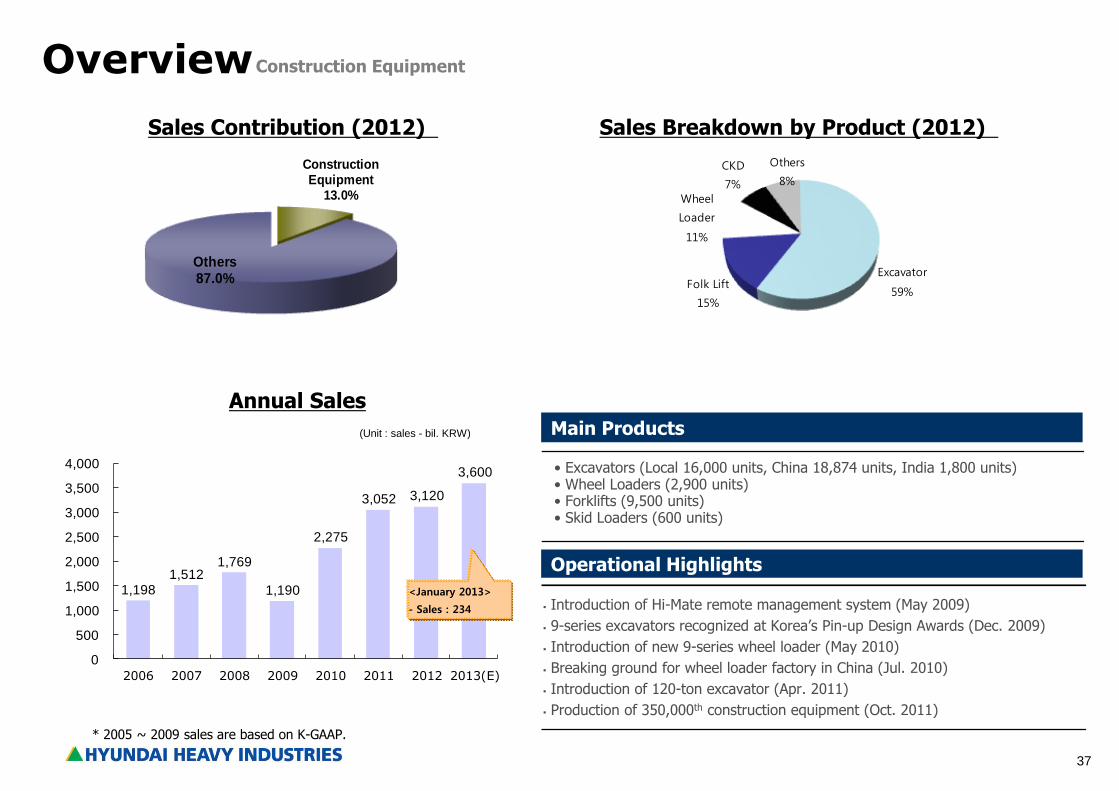
Construction Equipment
13.0%
Others 87.0%
1,198 1,512
1,769
1,190
2,275
3,052 3,120
3,600
0
500
1,000
1,500
2,000
2,500
3,000
3,500
4,000
2006 2007 2008 2009 2010 2011 2012 2013(E)
Overview
(Unit : sales - bil. KRW)
Annual Sales
Operational Highlights
Main Products
Construction Equipment
Sales Breakdown by Product (2012)
<January 2013>
- Sales : 234
• Excavators (Local 16,000 units, China 18,874 units, India 1,800 units) • Wheel Loaders (2,900 units) • Forklifts (9,500 units) • Skid Loaders (600 units)
Sales Contribution (2012)
* 2005 ~ 2009 sales are based on K-GAAP.
Introduction of Hi-Mate remote management system (May 2009)
9-series excavators recognized at Korea’s Pin-up Design Awards (Dec. 2009)
Introduction of new 9-series wheel loader (May 2010)
Breaking ground for wheel loader factory in China (Jul. 2010)
Introduction of 120-ton excavator (Apr. 2011)
Production of 350,000th construction equipment (Oct. 2011)
Excavator
59%Folk Lift
15%
Wheel
Loader
11%
CKD
7%
Others
8%
38
Construction Equipment Sales by Region
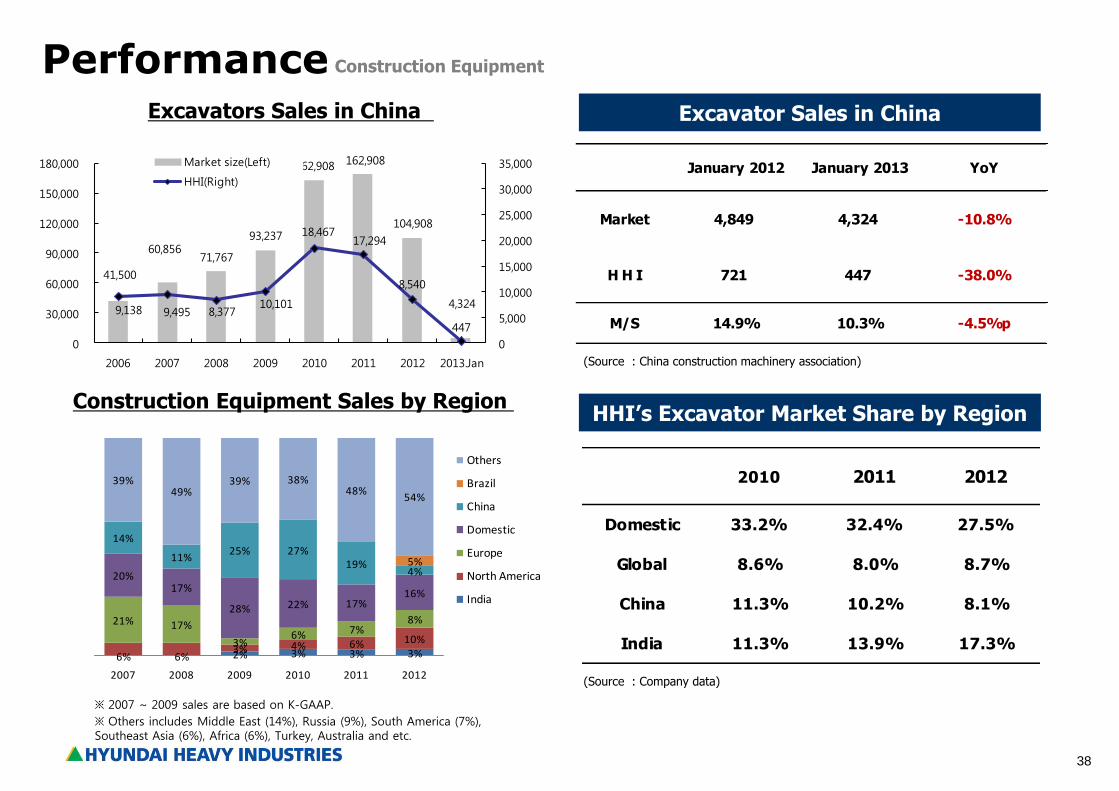
Performance Construction Equipment
Excavators Sales in China
※ Others includes Middle East (14%), Russia (9%), South America (7%), Southeast Asia (6%), Africa (6%), Turkey, Australia and etc.
January 2012 January 2013 YoY
Market 4,849 4,324 -10.8%
H H I 721 447 -38.0%
M/S 14.9% 10.3% -4.5%p
Excavator Sales in China
HHI’s Excavator Market Share by Region
※ 2007 ~ 2009 sales are based on K-GAAP.
(Source : Company data)
(Source : China construction machinery association)
41,500
60,856 71,767
93,237
162,908 162,908
104,908
4,324 9,138 9,495 8,377
10,101
18,467 17,294
8,540
447
0
5,000
10,000
15,000
20,000
25,000
30,000
35,000
0
30,000
60,000
90,000
120,000
150,000
180,000
2006 2007 2008 2009 2010 2011 2012 2013.Jan
Market size(Left)
HHI(Right)
6% 6% 2% 3% 3% 3%3% 4% 6% 10%
21% 17%
3%6% 7%
8%
20%17%
28% 22% 17%16%
14%
11%25% 27%
19%4%5%
39%49%
39% 38%48%
54%
2007 2008 2009 2010 2011 2012
Others
Brazil
China
Domestic
Europe
North America
India
2010 2011 2012
Domestic 33.2% 32.4% 27.5%
Global 8.6% 8.0% 8.7%
China 11.3% 10.2% 8.1%
India 11.3% 13.9% 17.3%
39
Green Energy
Solar Power Wind Power
40
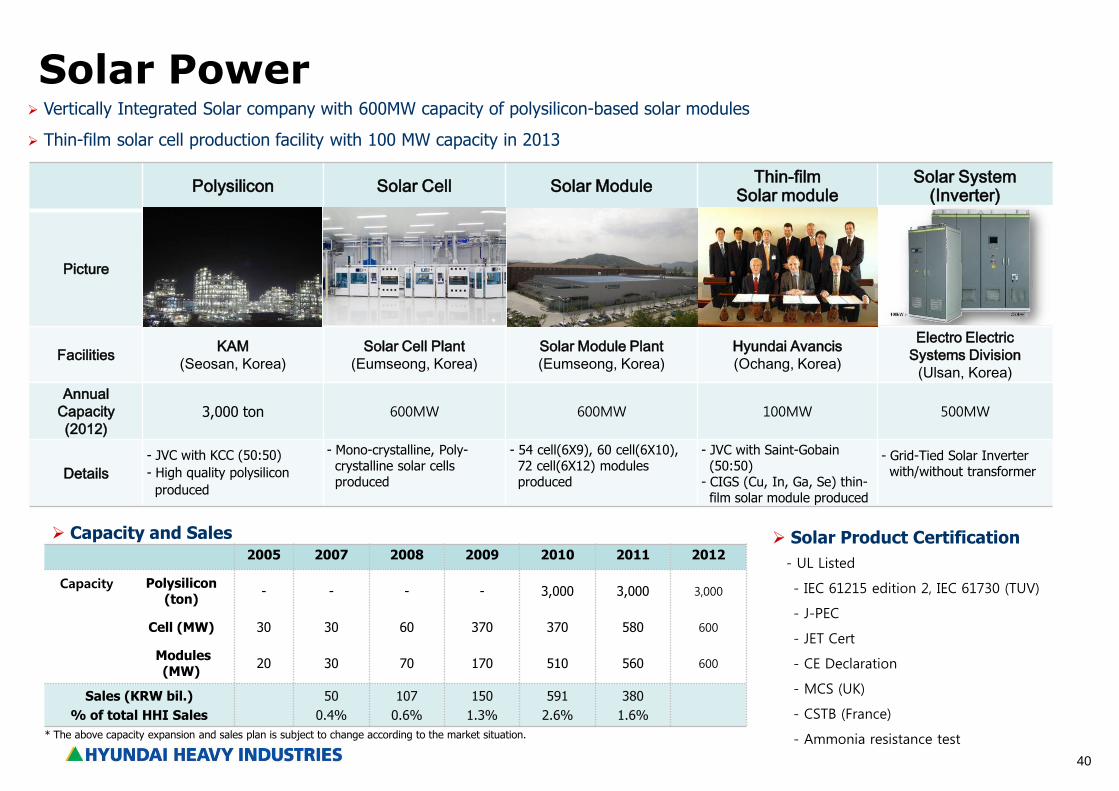
Polysilicon Solar Cell Solar Module Thin-film
Solar module Solar System
(Inverter)
Picture
Facilities KAM
(Seosan, Korea)
Solar Cell Plant
(Eumseong, Korea)
Solar Module Plant
(Eumseong, Korea)
Hyundai Avancis
(Ochang, Korea)
Electro Electric
Systems Division
(Ulsan, Korea)
Annual
Capacity
(2012) 3,000 ton 600MW 600MW 100MW 500MW
Details
- JVC with KCC (50:50)
- High quality polysilicon
produced
- Mono-crystalline, Poly- crystalline solar cells produced
- 54 cell(6X9), 60 cell(6X10), 72 cell(6X12) modules produced
- JVC with Saint-Gobain (50:50) - CIGS (Cu, In, Ga, Se) thin- film solar module produced
- Grid-Tied Solar Inverter with/without transformer
Solar Power
Vertically Integrated Solar company with 600MW capacity of polysilicon-based solar modules
Thin-film solar cell production facility with 100 MW capacity in 2013
Capacity and Sales
2005 2007 2008 2009 2010 2011 2012
Capacity
Polysilicon (ton)
- - - - 3,000 3,000 3,000
Cell (MW) 30 30 60 370 370 580 600
Modules (MW)
20 30 70 170 510 560 600
Sales (KRW bil.)
% of total HHI Sales
50
0.4%
107
0.6%
150
1.3%
591
2.6%
380
1.6%
Solar Product Certification
- UL Listed
- IEC 61215 edition 2, IEC 61730 (TUV)
- J-PEC
- JET Cert
- CE Declaration
- MCS (UK)
- CSTB (France)
- Ammonia resistance test * The above capacity expansion and sales plan is subject to change according to the market situation.
41
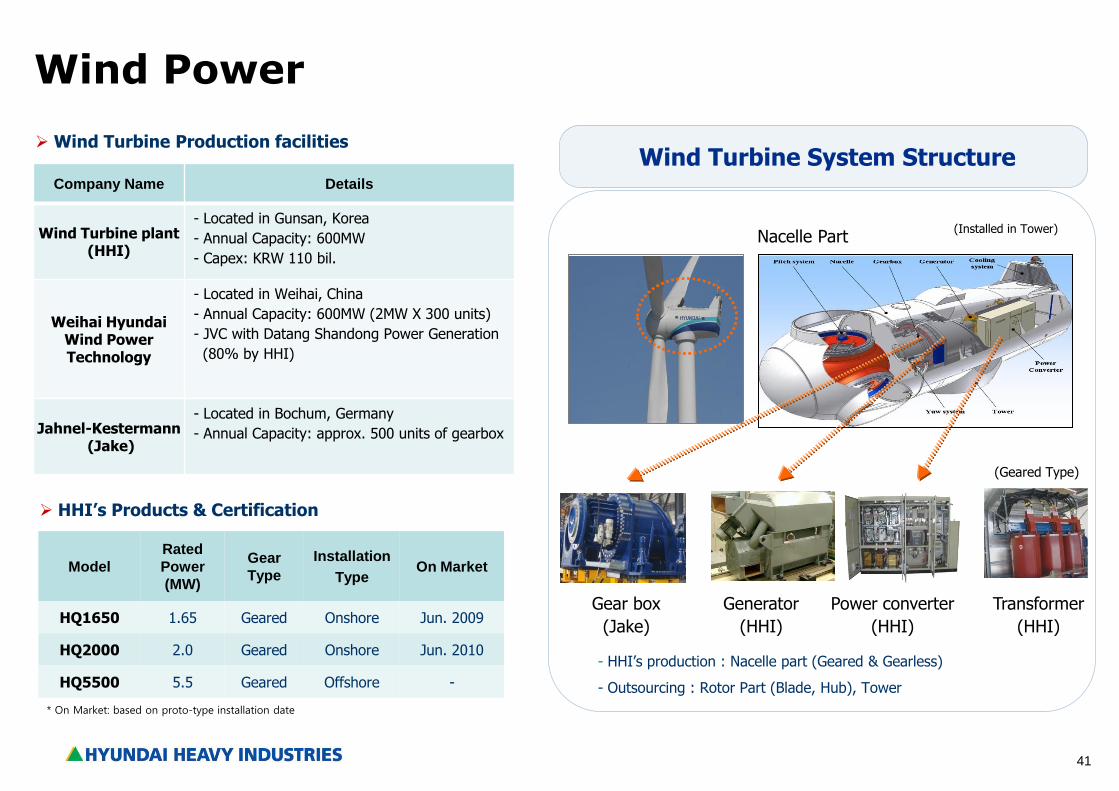
Wind Power
- HHI’s production : Nacelle part (Geared & Gearless)
- Outsourcing : Rotor Part (Blade, Hub), Tower
Generator
(HHI)
Gear box
(Jake)
Power converter
(HHI)
Transformer
(HHI)
(Installed in Tower)
Wind Turbine Production facilities
HHI’s Products & Certification
(Geared Type)
Model
Rated
Power
(MW)
Gear
Type
Installation
Type On Market
HQ1650 1.65 Geared Onshore Jun. 2009
HQ2000 2.0 Geared Onshore Jun. 2010
HQ5500 5.5 Geared Offshore -
Nacelle Part
Wind Turbine System Structure Company Name Details
Wind Turbine plant (HHI)
- Located in Gunsan, Korea
- Annual Capacity: 600MW
- Capex: KRW 110 bil.
Weihai Hyundai Wind Power Technology
- Located in Weihai, China
- Annual Capacity: 600MW (2MW X 300 units)
- JVC with Datang Shandong Power Generation
(80% by HHI)
Jahnel-Kestermann (Jake)
- Located in Bochum, Germany
- Annual Capacity: approx. 500 units of gearbox
* On Market: based on proto-type installation date
42
Subsidiaries
43
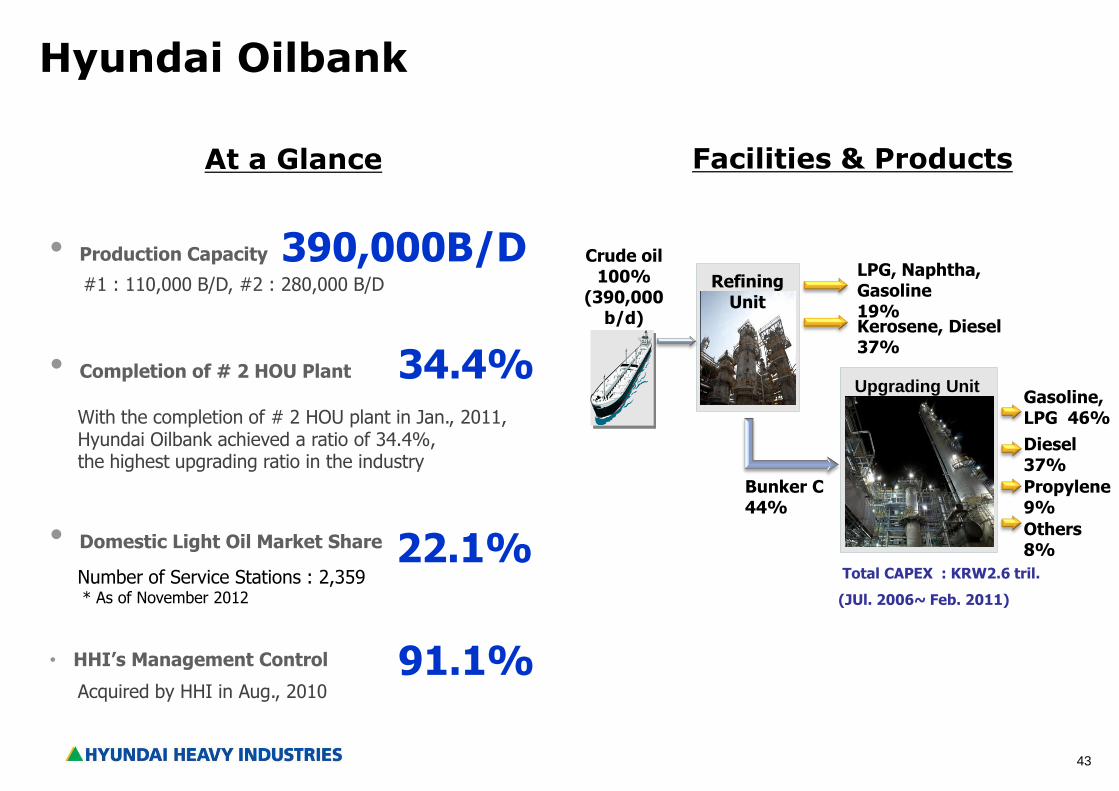
Hyundai Oilbank
Refining Unit
Upgrading Unit
Crude oil 100%
(390,000 b/d)
LPG, Naphtha, Gasoline 19% Kerosene, Diesel 37%
Bunker C 44%
Gasoline, LPG 46%
Diesel 37%
Propylene 9%
Others 8%
Total CAPEX : KRW2.6 tril.
(JUl. 2006~ Feb. 2011)
• Completion of # 2 HOU Plant 34.4% With the completion of # 2 HOU plant in Jan., 2011, Hyundai Oilbank achieved a ratio of 34.4%, the highest upgrading ratio in the industry
At a Glance
• Domestic Light Oil Market Share 22.1% Number of Service Stations : 2,359 * As of November 2012
• Production Capacity 390,000B/D #1 : 110,000 B/D, #2 : 280,000 B/D
Facilities & Products
• HHI’s Management Control 91.1% Acquired by HHI in Aug., 2010
44
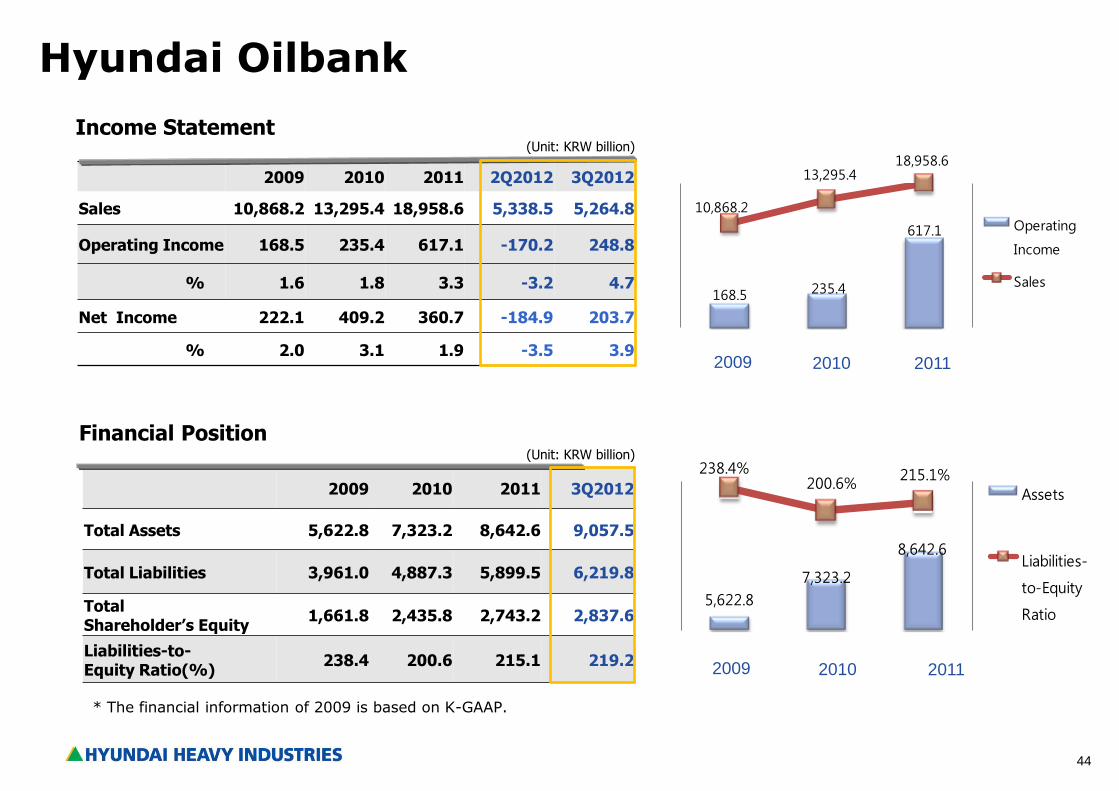
2009 2010 2011 2Q2012 3Q2012
Sales 10,868.2 13,295.4 18,958.6 5,338.5 5,264.8
Operating Income 168.5 235.4 617.1 -170.2 248.8
% 1.6 1.8 3.3 -3.2 4.7
Net Income 222.1 409.2 360.7 -184.9 203.7
% 2.0 3.1 1.9 -3.5 3.9
(Unit: KRW billion)
Income Statement
2009 2010 2011 3Q2012
Total Assets 5,622.8 7,323.2 8,642.6 9,057.5
Total Liabilities 3,961.0 4,887.3 5,899.5 6,219.8
Total Shareholder’s Equity
1,661.8 2,435.8 2,743.2 2,837.6
Liabilities-to- Equity Ratio(%)
238.4 200.6 215.1 219.2
(Unit: KRW billion)
Financial Position
Hyundai Oilbank
* The financial information of 2009 is based on K-GAAP.
2011 2009 2010
2011 2009 2010
5,622.8
7,323.2
8,642.6
238.4%200.6%
215.1%
Assets
Liabilities-
to-Equity
Ratio
168.5 235.4
617.1
10,868.2
13,295.418,958.6
Operating
Income
Sales
45
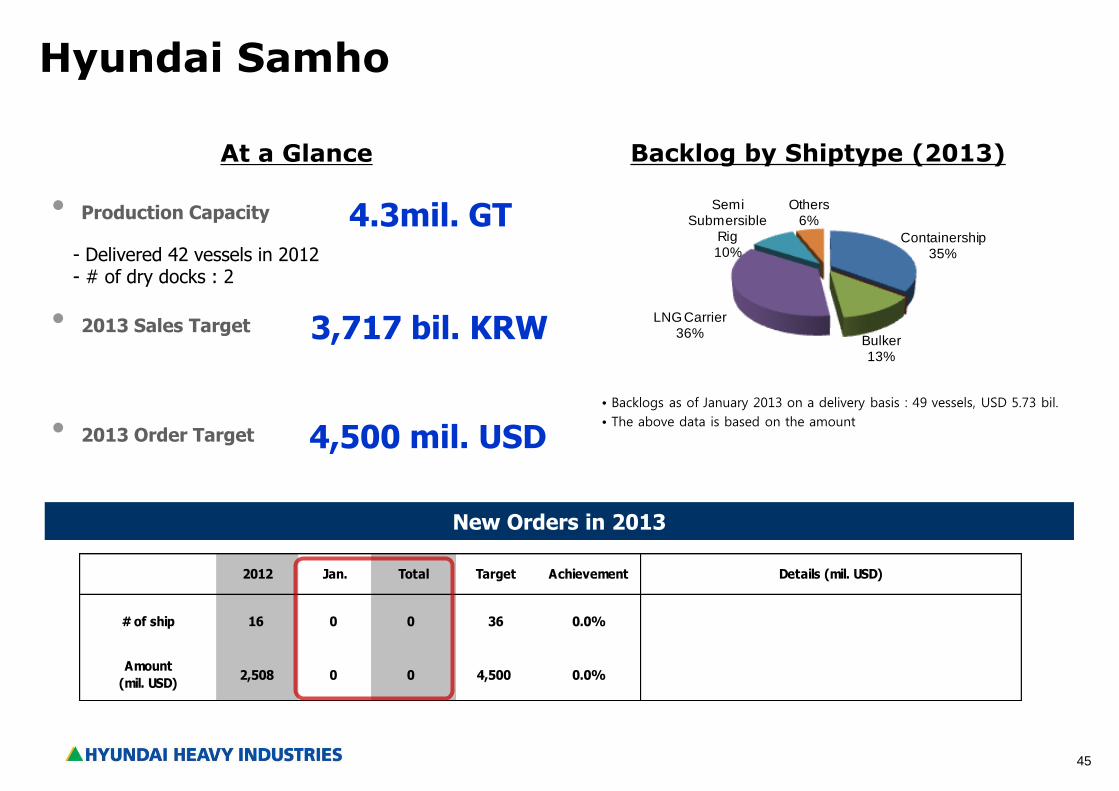
Containership35%
Bulker13%
LNG Carrier36%
Semi Submersible
Rig10%
Others6%
New Orders in 2013
2012 Jan. Total Target Achievement Details (mil. USD)
# of ship 16 0 0 36 0.0%
Amount
(mil. USD)2,508 0 0 4,500 0.0%
At a Glance
Hyundai Samho
• Production Capacity 4.3mil. GT - Delivered 42 vessels in 2012 - # of dry docks : 2
• 2013 Order Target
• 2013 Sales Target
Backlog by Shiptype (2013)
4,500 mil. USD
3,717 bil. KRW
• Backlogs as of January 2013 on a delivery basis : 49 vessels, USD 5.73 bil.
• The above data is based on the amount
-6 LNG Carriers (1,252) -1 Semi Submersible Rig (568) -4 VLCCs (354) -2 Containerships (120) -3 PCTCs (214)
46
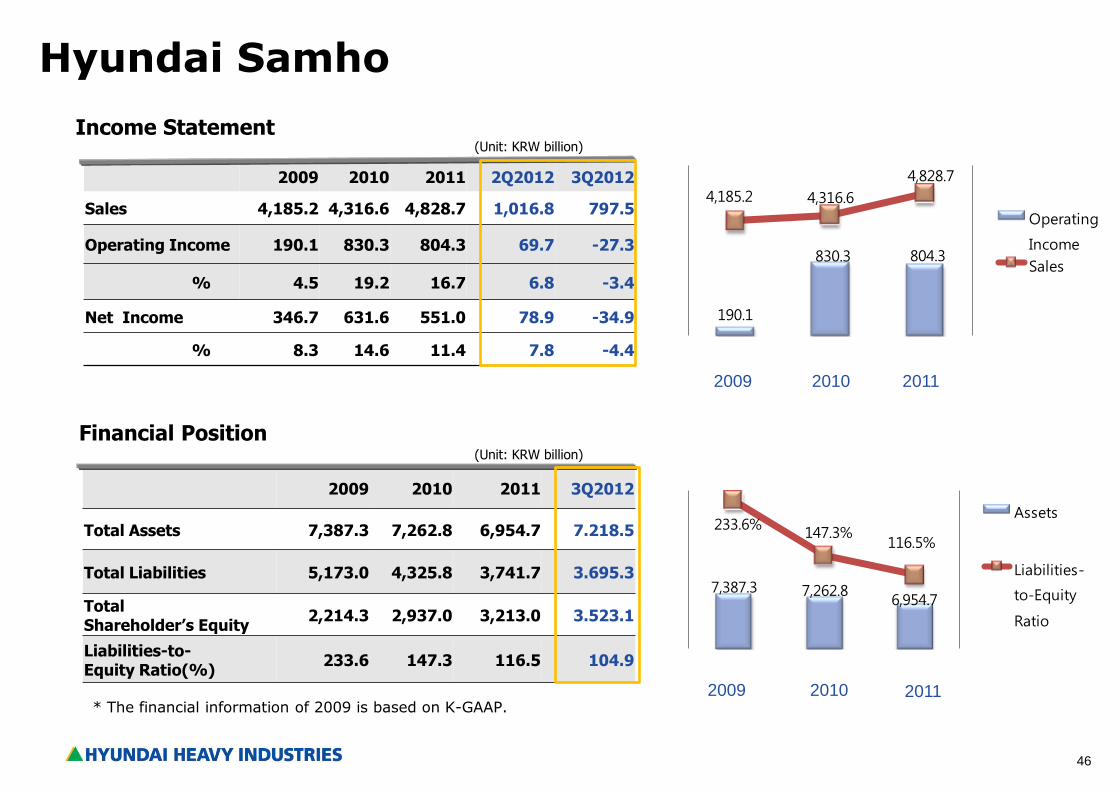
2009 2010 2011 2Q2012 3Q2012
Sales 4,185.2 4,316.6 4,828.7 1,016.8 797.5
Operating Income 190.1 830.3 804.3 69.7 -27.3
% 4.5 19.2 16.7 6.8 -3.4
Net Income 346.7 631.6 551.0 78.9 -34.9
% 8.3 14.6 11.4 7.8 -4.4
(Unit: KRW billion)
Income Statement
2009 2010 2011 3Q2012
Total Assets 7,387.3 7,262.8 6,954.7 7.218.5
Total Liabilities 5,173.0 4,325.8 3,741.7 3.695.3
Total Shareholder’s Equity
2,214.3 2,937.0 3,213.0 3.523.1
Liabilities-to- Equity Ratio(%)
233.6 147.3 116.5 104.9
(Unit: KRW billion)
Financial Position
2009 2010 2011
2011 2009 2010
Hyundai Samho
* The financial information of 2009 is based on K-GAAP.
190.1
830.3 804.3
4,185.2 4,316.6
4,828.7
Operating
Income
Sales
7,387.3 7,262.8 6,954.7
233.6%147.3%
116.5%
Assets
Liabilities-
to-Equity
Ratio
47
Financial Performance
48
455275
-1
879
1,751
2,206
2,223
3,564
2,612
5.6%
3.4%
0.0%
0.9%
7.0%
11.3% 11.1%10.5%
15.9%
10.4%
-2%
0%
2%
4%
6%
8%
10%
12%
14%
16%
18%
-500
0
500
1,000
1,500
2,000
2,500
3,000
3,500
4,000
`02 `03 `04 `05 `06 `07 `08 `09 `10 `11
8,134 8,153 9,084
10,354
12,555
15,533
19,957 21,142
22,408
25,020
0
5,000
10,000
15,000
20,000
25,000
30,000
`02 `03 `04 `05 `06 `07 `08 `09 `10 `11
Sales (KRW bil.) Operating profit (KRW bil.)
(Data from 2010 are based on K-IFRS)
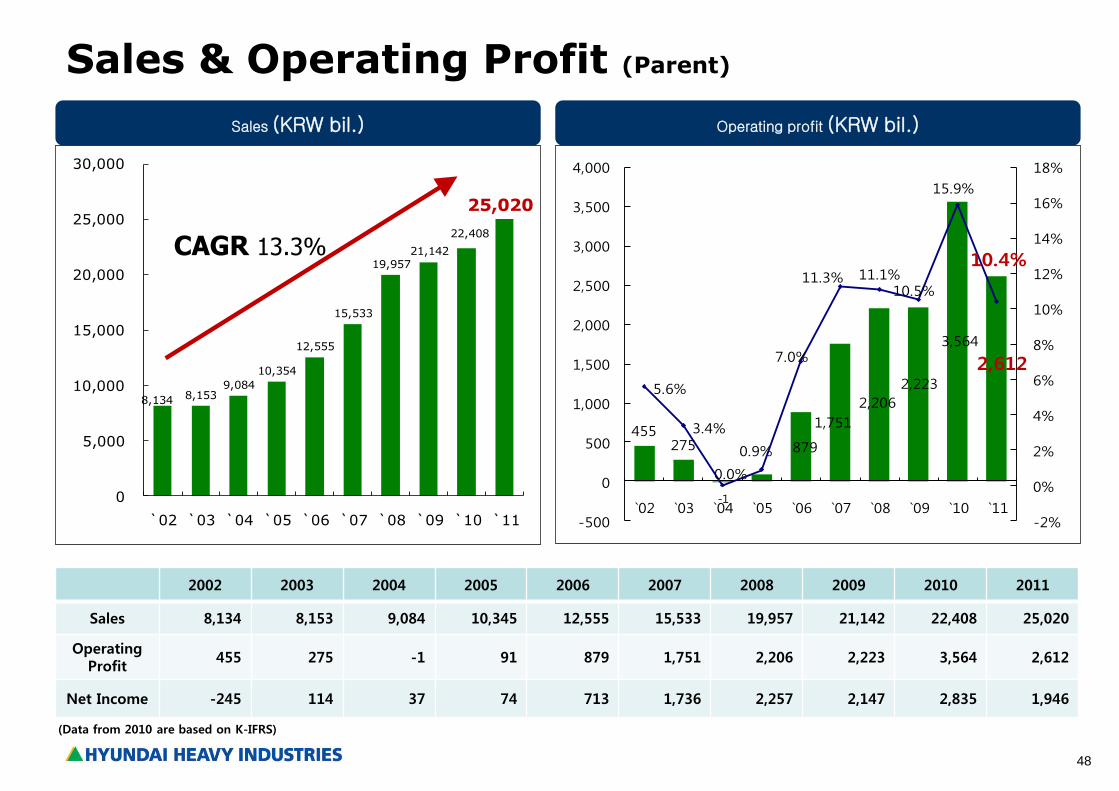
Sales & Operating Profit (Parent)
2002 2003 2004 2005 2006 2007 2008 2009 2010 2011
Sales 8,134 8,153 9,084 10,345 12,555 15,533 19,957 21,142 22,408 25,020
Operating Profit
455 275 -1 91 879 1,751 2,206 2,223 3,564 2,612
Net Income -245 114 37 74 713 1,736 2,257 2,147 2,835 1,946
CAGR 13.3%
49
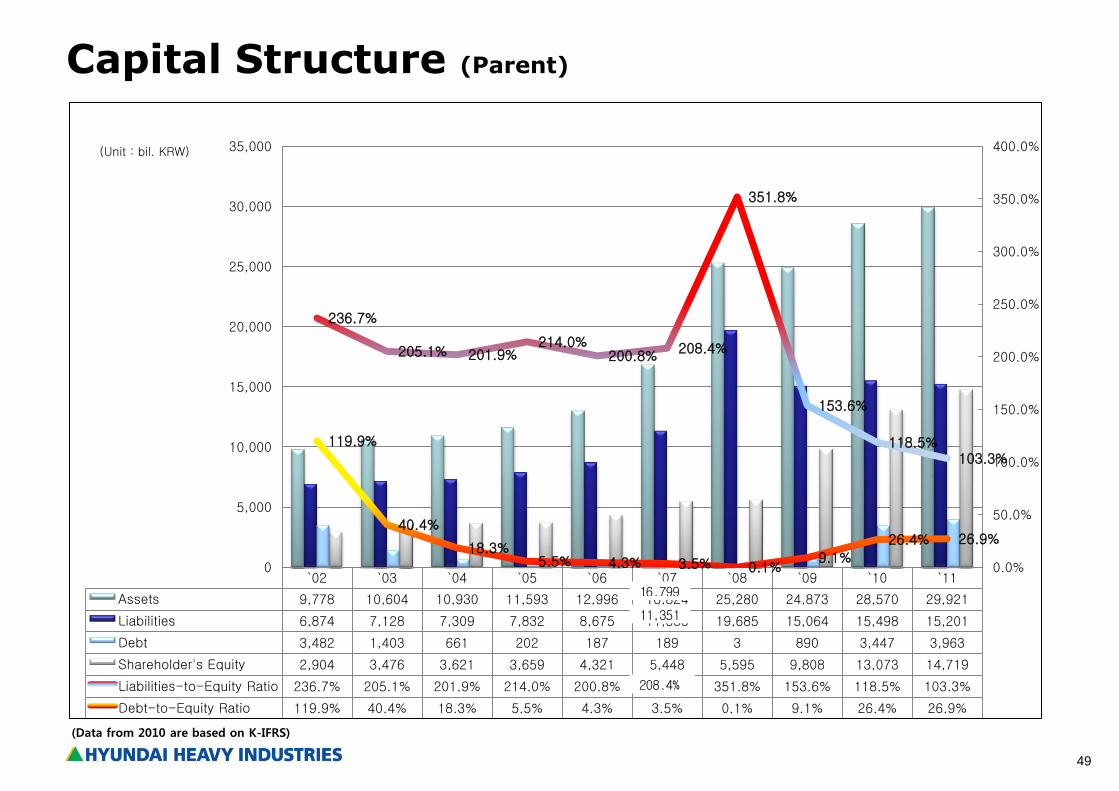
Capital Structure (Parent)
(Unit : bil. KRW)
(Data from 2010 are based on K-IFRS)
`02 `03 `04 `05 `06 `07 `08 `09 `10 `11
Assets 9,778 10,604 10,930 11,593 12,996 16,824 25,280 24,873 28,570 29,921
Liabilities 6,874 7,128 7,309 7,832 8,675 11,333 19,685 15,064 15,498 15,201
Debt 3,482 1,403 661 202 187 189 3 890 3,447 3,963
Shareholder's Equity 2,904 3,476 3,621 3,659 4,321 5,448 5,595 9,808 13,073 14,719
Liabilities-to-Equity Ratio 236.7% 205.1% 201.9% 214.0% 200.8% 208.0% 351.8% 153.6% 118.5% 103.3%
Debt-to-Equity Ratio 119.9% 40.4% 18.3% 5.5% 4.3% 3.5% 0.1% 9.1% 26.4% 26.9%
236.7%
205.1% 201.9% 214.0%
200.8% 208.4%
351.8%
153.6%
118.5% 103.3%
119.9%
40.4%
18.3% 5.5% 4.3% 3.5% 0.1%
9.1%
26.4% 26.9%
0.0%
50.0%
100.0%
150.0%
200.0%
250.0%
300.0%
350.0%
400.0%
0
5,000
10,000
15,000
20,000
25,000
30,000
35,000
16,799
11,351
208.4%
50
Appendix
(Quarterly Results)
Important Notice
The financial information regarding “3Q, , 2Q 2012 and 3Q 2011 Consolidated Earnings Release” is consolidated
financial earnings results based on K-IFRS.
51
Statements of Comprehensive Income (K-IFRS consolidated)
(unit : bil. KRW)
2Q 2012 3Q 2011
QoQ YoY
13,199.0 -3.7% 0.8% 13,700.4 13,094.1
Cost of sales 11,970.2 -6.0% 3.9% 12,739.4 11,526.1
1,228.8 27.9% -21.6% 961.0 1,568.0
593.9 65.7% -35.1% 358.5 915.4
4.5% 1.9%p -2.5%p 2.6% 7.0%
(437.4) - - 154.0 1,128.3
908.0 - - (255.8) (1,280.4)
Equity method income (55.3) 15.0% - (48.1) 25.8
1,009.2 383.8% 27.9% 208.6 789.1
729.4 443.9% 29.6% 134.1 562.6
5.5% 4.5%p 1.2%p 1.0% 4.3%
Net income before income taxes
Operating income margin
Finance income
Net income margin
3Q 2012
Net income
Operating income
Other non-operating income
Sales
Gross profit
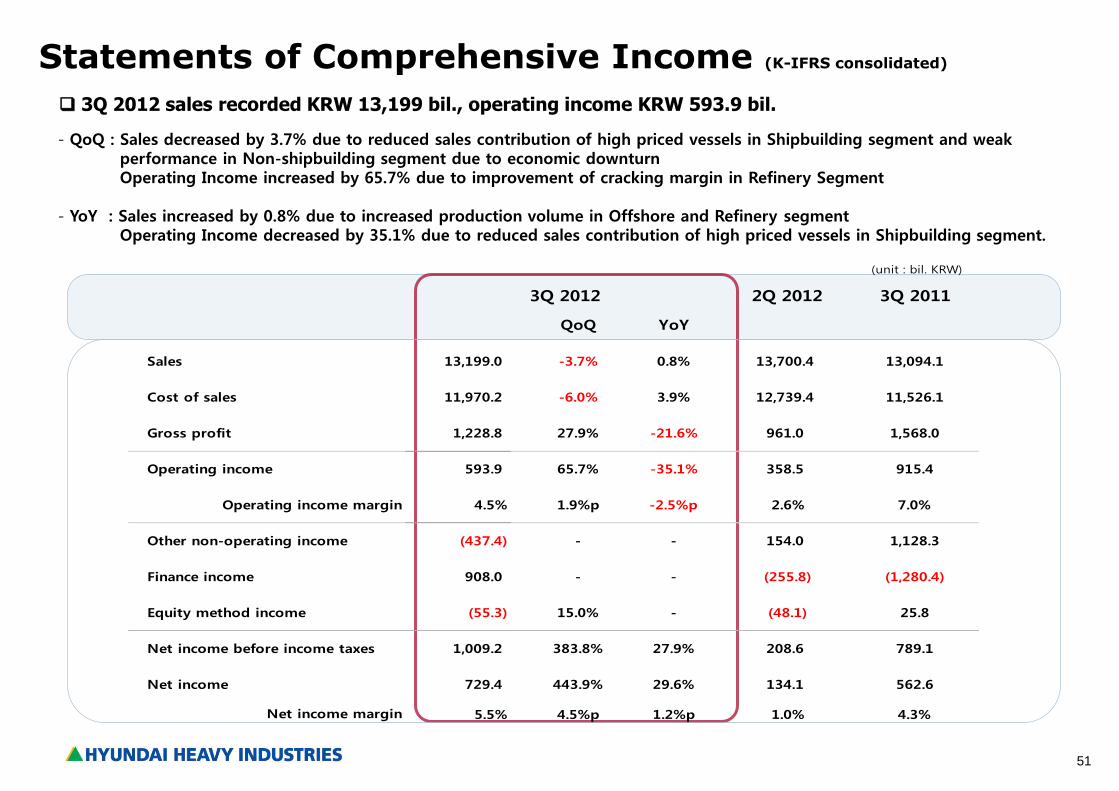
3Q 2012 sales recorded KRW 13,199 bil., operating income KRW 593.9 bil.
- QoQ : Sales decreased by 3.7% due to reduced sales contribution of high priced vessels in Shipbuilding segment and weak performance in Non-shipbuilding segment due to economic downturn Operating Income increased by 65.7% due to improvement of cracking margin in Refinery Segment - YoY : Sales increased by 0.8% due to increased production volume in Offshore and Refinery segment Operating Income decreased by 35.1% due to reduced sales contribution of high priced vessels in Shipbuilding segment.
52
Sales & Operating Income by divisions (K-IFRS Consolidated)
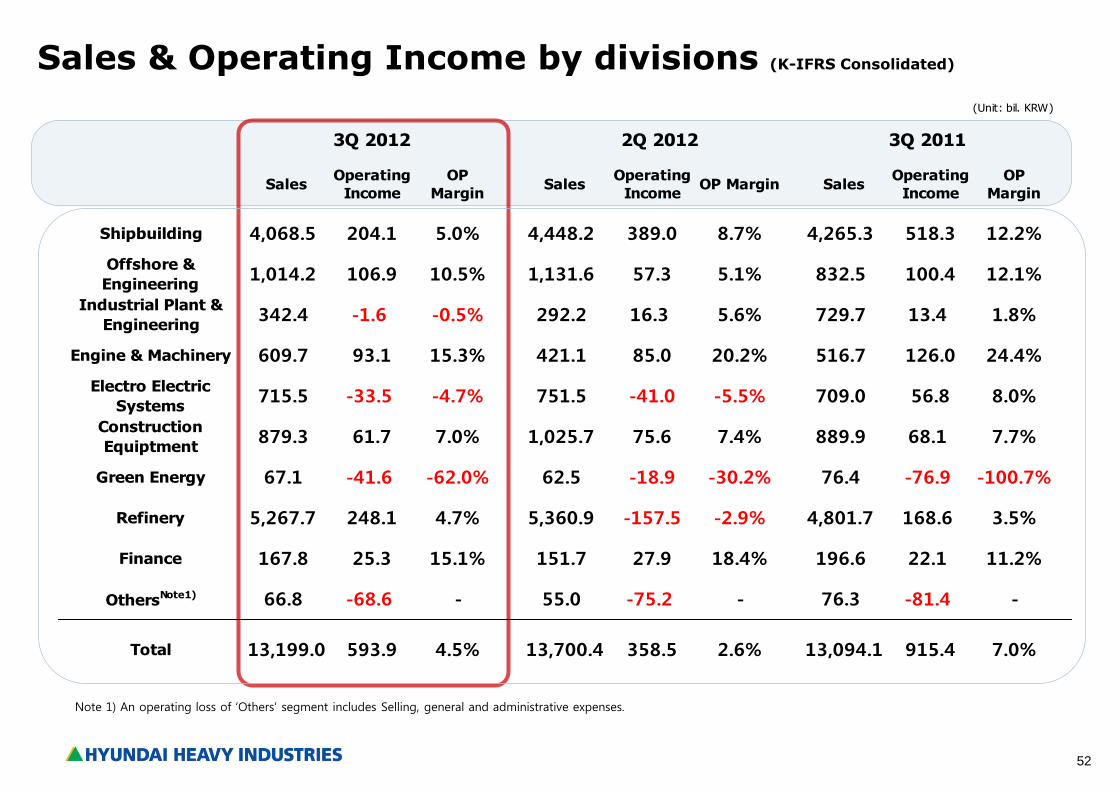
Note 1) An operating loss of ‘Others’ segment includes Selling, general and administrative expenses.
SalesOperating
Income
OP
MarginSales
Operating
IncomeOP Margin Sales
Operating
Income
OP
Margin
Shipbuilding 4,068.5 204.1 5.0% 4,448.2 389.0 8.7% 4,265.3 518.3 12.2%
Offshore &
Engineering1,014.2 106.9 10.5% 1,131.6 57.3 5.1% 832.5 100.4 12.1%
Industrial Plant &
Engineering342.4 -1.6 -0.5% 292.2 16.3 5.6% 729.7 13.4 1.8%
Engine & Machinery 609.7 93.1 15.3% 421.1 85.0 20.2% 516.7 126.0 24.4%
Electro Electric
Systems715.5 -33.5 -4.7% 751.5 -41.0 -5.5% 709.0 56.8 8.0%
Construction
Equiptment879.3 61.7 7.0% 1,025.7 75.6 7.4% 889.9 68.1 7.7%
Green Energy 67.1 -41.6 -62.0% 62.5 -18.9 -30.2% 76.4 -76.9 -100.7%
Refinery 5,267.7 248.1 4.7% 5,360.9 -157.5 -2.9% 4,801.7 168.6 3.5%
Finance 167.8 25.3 15.1% 151.7 27.9 18.4% 196.6 22.1 11.2%
OthersNote1) 66.8 -68.6 - 55.0 -75.2 - 76.3 -81.4 -
Total 13,199.0 593.9 4.5% 13,700.4 358.5 2.6% 13,094.1 915.4 7.0%
2Q 2012
(Unit: bil. KRW)
3Q 2012 3Q 2011
53
Statements of Financial Position (K-IFRS consolidated)
(unit: bil. KRW)
As of Sep.30 2012 As of Dec.31 2011
Total Assets 50,625.6 49,000.8 1,624.8 3.3%
26,186.7 23,076.4 3,110.3 13.5%
1,502.1 1,610.0 (107.9) -6.7%
24,438.9 25,924.4 (1,485.5) -5.7%
31,529.8 30,824.3 705.5 2.3%
23,883.7 25,490.8 (1,607.1) -6.3%
7,646.1 5,333.5 2,312.6 43.4%
19,095.8 18,176.5 919.3 5.1%
165.1% 169.6% -4.5%p -
76.8% 60.8% 16.0%p -
Total borrowings 14,656.7 11,057.0 3,599.7 32.6%
Libilities-to-Equity Ratio
Change
Debt-to-Equity Ratio
Current Assets
Non-current Assets
Total Liabilities
Current Liabilities
Non-current Liabilities
Shareholders' Equity
*Cash & Cash Equivalents
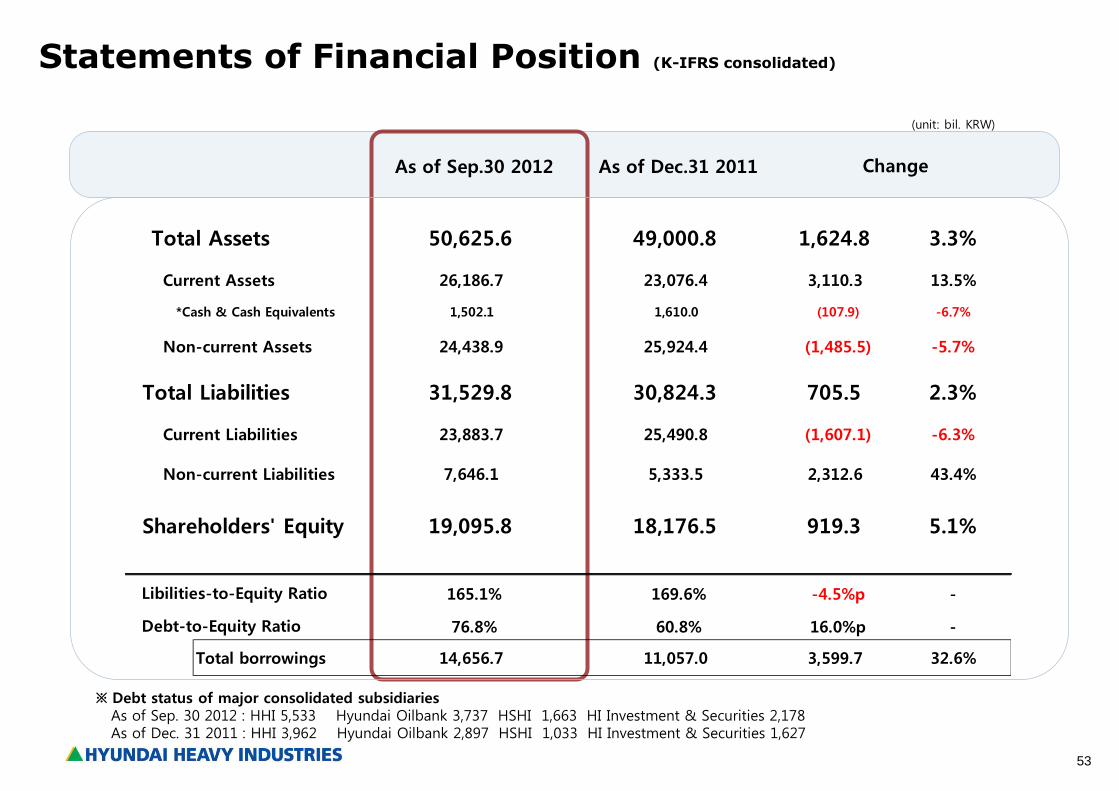
※ Debt status of major consolidated subsidiaries As of Sep. 30 2012 : HHI 5,533 Hyundai Oilbank 3,737 HSHI 1,663 HI Investment & Securities 2,178 As of Dec. 31 2011 : HHI 3,962 Hyundai Oilbank 2,897 HSHI 1,033 HI Investment & Securities 1,627
54
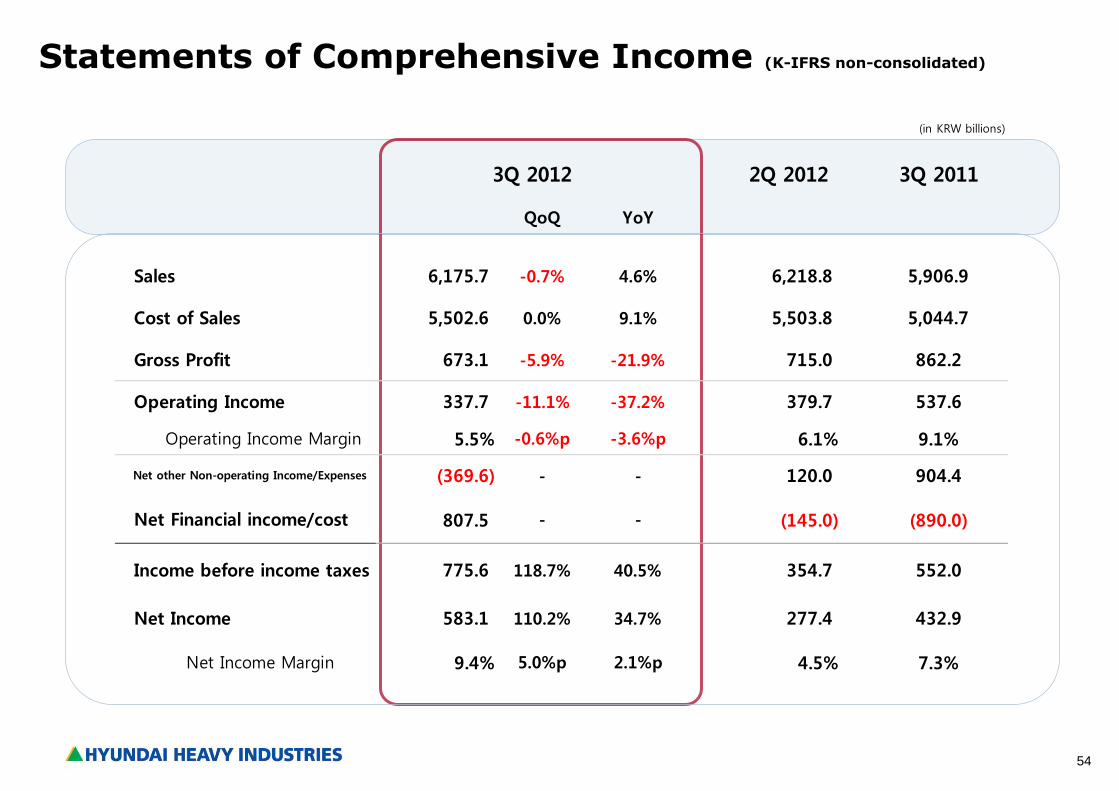
Statements of Comprehensive Income (K-IFRS non-consolidated)
(in KRW billions)
2Q 2012 3Q 2011
QoQ YoY
6,175.7 -0.7% 4.6% 6,218.8 5,906.9
5,502.6 0.0% 9.1% 5,503.8 5,044.7
673.1 -5.9% -21.9% 715.0 862.2
337.7 -11.1% -37.2% 379.7 537.6
5.5% -0.6%p -3.6%p 6.1% 9.1%
(369.6) - - 120.0 904.4
807.5 - - (145.0) (890.0)
775.6 118.7% 40.5% 354.7 552.0
583.1 110.2% 34.7% 277.4 432.9
9.4% 5.0%p 2.1%p 4.5% 7.3% Net Income Margin
3Q 2012
Net Income
Operating Income
Net other Non-operating Income/Expenses
Sales
Gross Profit
Income before income taxes
Cost of Sales
Operating Income Margin
Net Financial income/cost
55
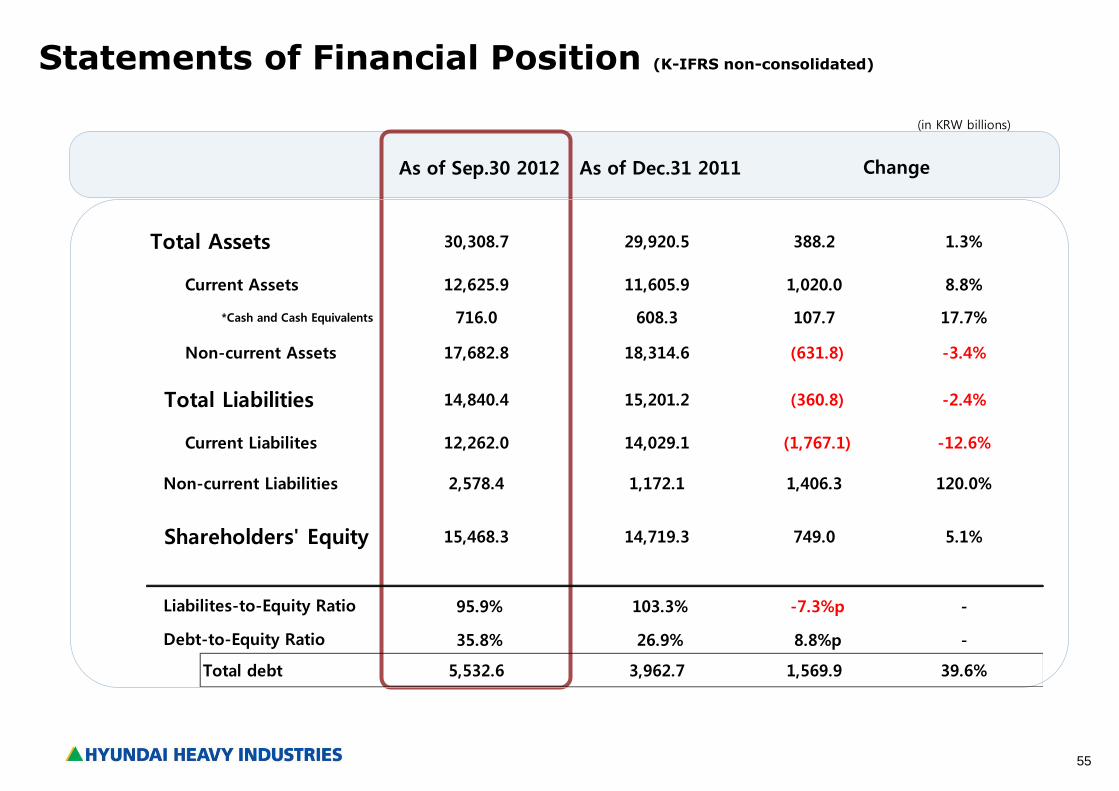
Statements of Financial Position (K-IFRS non-consolidated)
(in KRW billions)
As of Sep.30 2012 As of Dec.31 2011
Total Assets 30,308.7 29,920.5 388.2 1.3%
12,625.9 11,605.9 1,020.0 8.8%
*Cash and Cash Equivalents 716.0 608.3 107.7 17.7%
17,682.8 18,314.6 (631.8) -3.4%
14,840.4 15,201.2 (360.8) -2.4%
12,262.0 14,029.1 (1,767.1) -12.6%
2,578.4 1,172.1 1,406.3 120.0%
15,468.3 14,719.3 749.0 5.1%
95.9% 103.3% -7.3%p -
35.8% 26.9% 8.8%p -
Total debt 5,532.6 3,962.7 1,569.9 39.6%
Liabilites-to-Equity Ratio
Change
Debt-to-Equity Ratio
Current Assets
Non-current Assets
Total Liabilities
Current Liabilites
Non-current Liabilities
Shareholders' Equity
56
Q & A
57
Thank You Http://www.hhiir.com
*For More Information
IR Team
E-mail: [email protected]
Tel: +82-2-746-4728, 4546, 7858
Fax: +82-746-4662
Website: www.hhi.co.kr (Company) /www.hhiir.com (IR)