Embed Size (px)
Citation preview
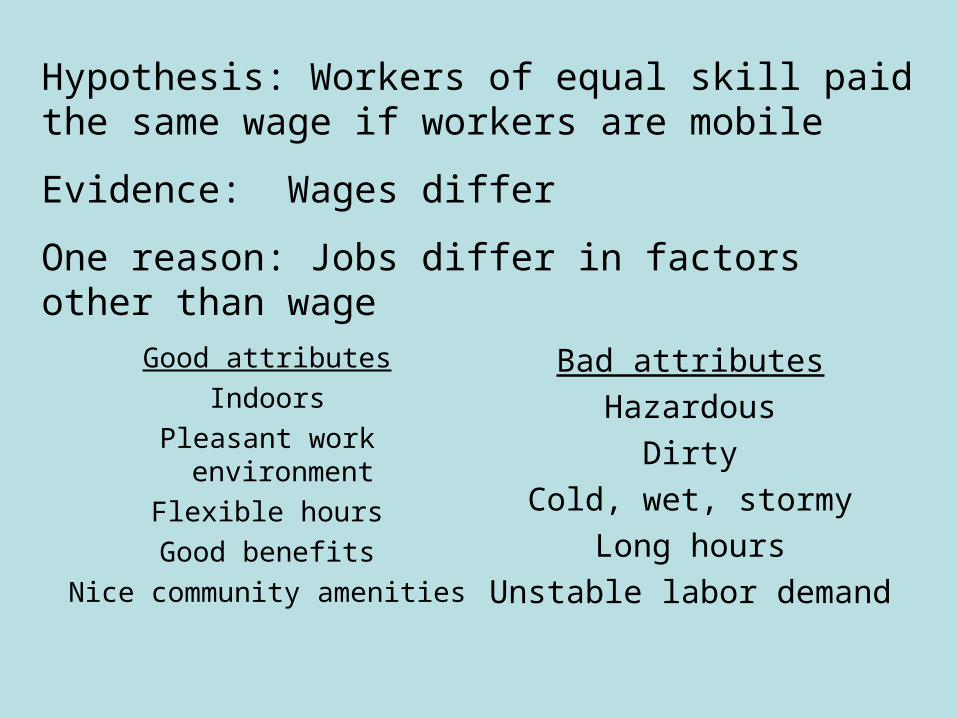
Hypothesis: Workers of equal skill paid the same wage if workers are mobile
Evidence: Wages differ
One reason: Jobs differ in factors other than wage
Good attributes
Indoors
Pleasant work environment
Flexible hours
Good benefits
Nice community amenities
Bad attributes
Hazardous
Dirty
Cold, wet, stormy
Long hours
Unstable labor demand
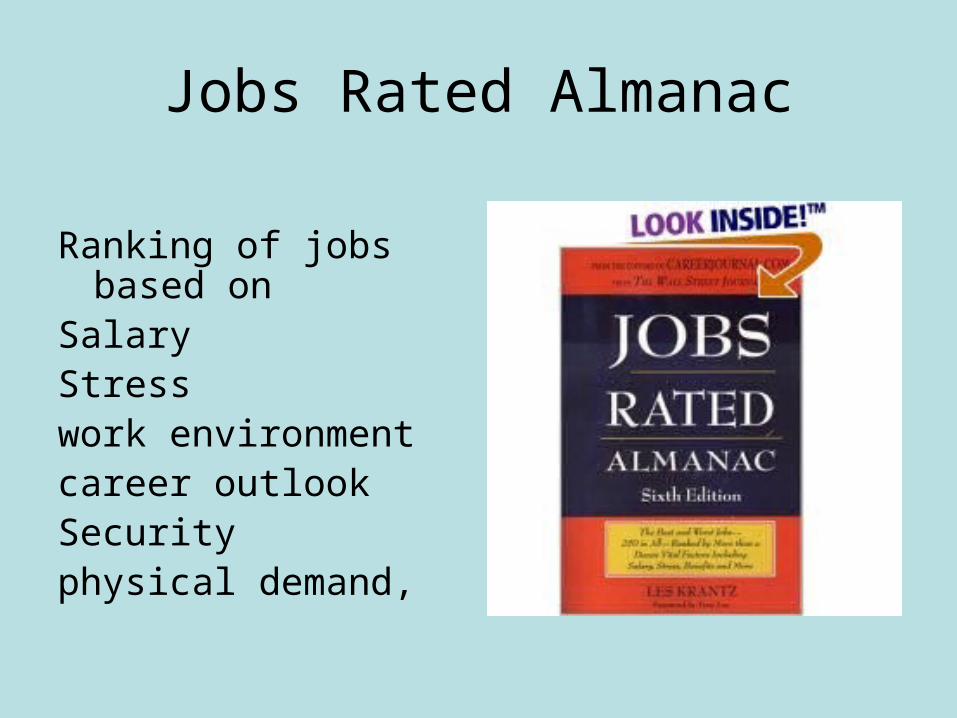
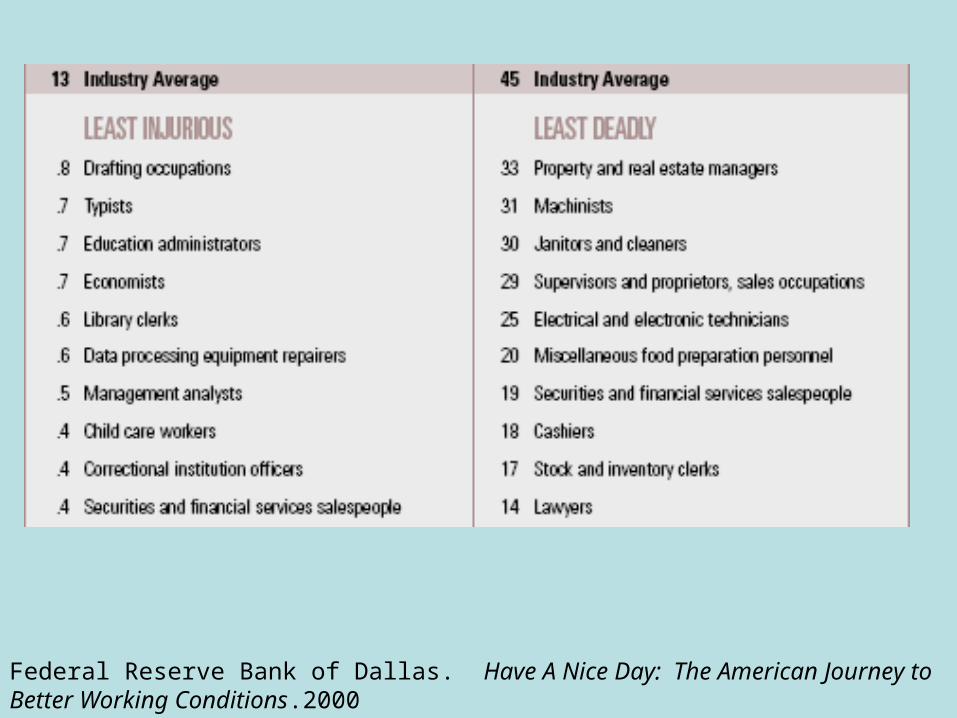
Jobs Rated Almanac
Ranking of jobs based onSalaryStresswork environmentcareer outlookSecurityphysical demand,
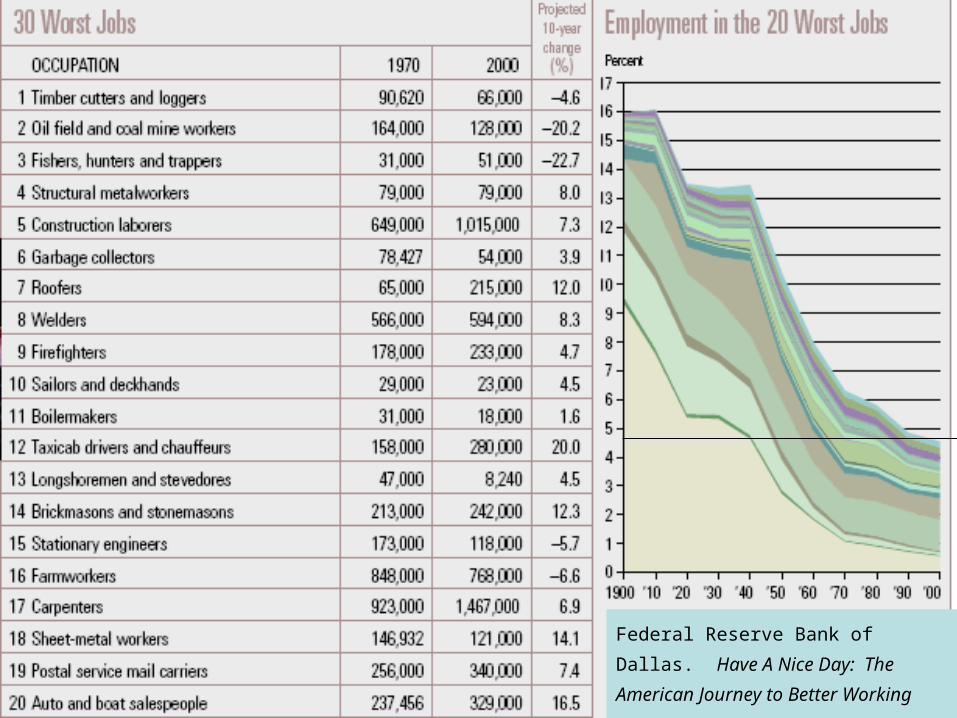
Federal Reserve Bank of Dallas. Have
A Nice Day: The American Journey to
Better Working Conditions.2000
Compensating Differential: Wage increase required to get worker to accept a bad job attribute or the wage decrease a worker is willing to accept to get a good job attribute
Example of compensating differentials
Two sector model
Two jobs: Garbage collector; Floor sweeper
Equal skill requirement
Garbage collection considered to have more bad job amenities
Example of compensating differentials
What if taste for bad amenity differ?
The case of flower picking and pollen
Quality of life ratings
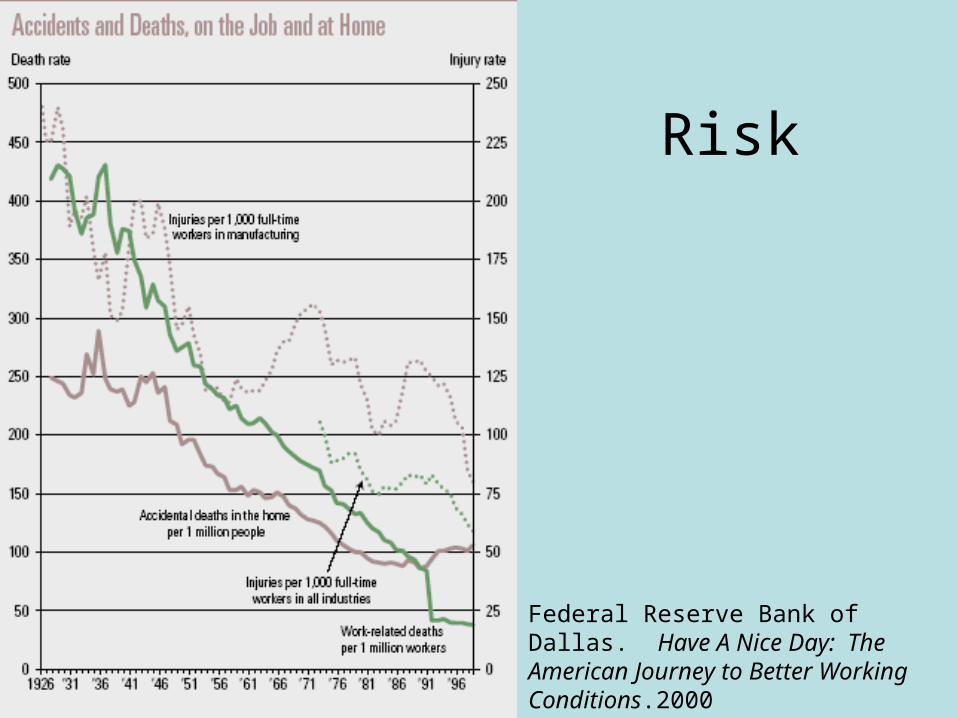
Risk
Federal Reserve Bank of Dallas. Have A Nice Day: The American Journey to Better Working Conditions.2000
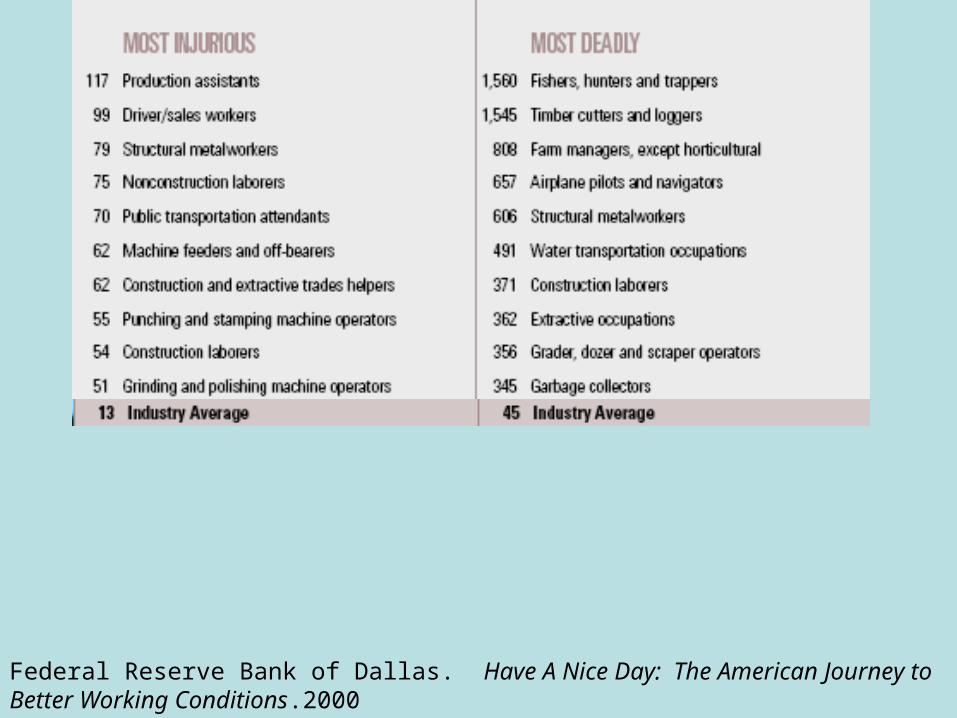
Federal Reserve Bank of Dallas. Have A Nice Day: The American Journey to Better Working Conditions.2000
Federal Reserve Bank of Dallas. Have A Nice Day: The American Journey to Better Working Conditions.2000
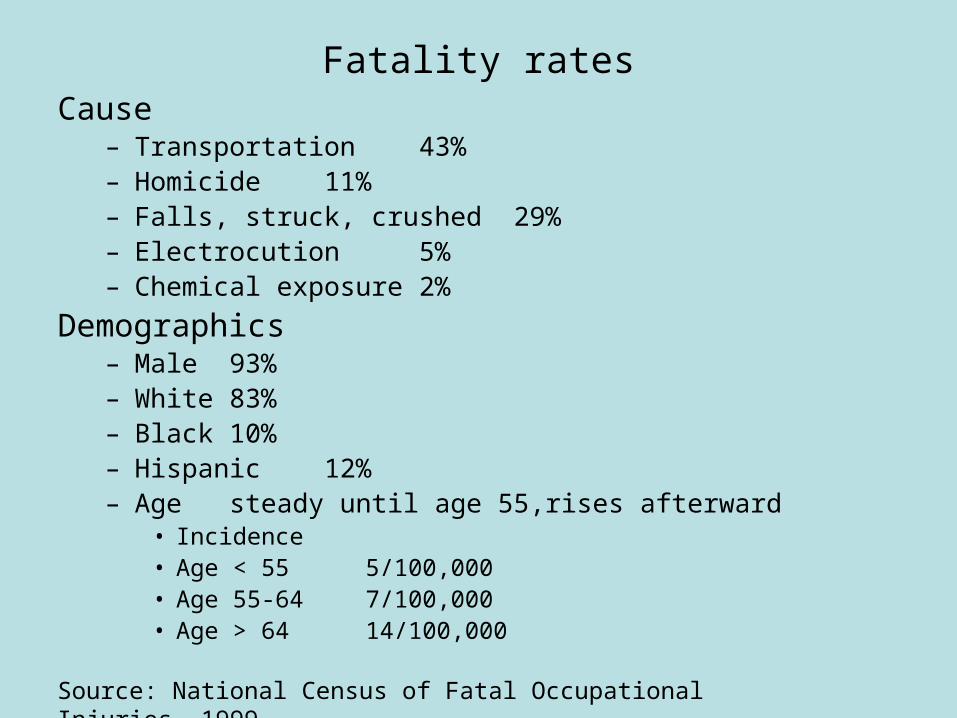
Fatality ratesCause
– Transportation 43%– Homicide 11%– Falls, struck, crushed 29%– Electrocution 5%– Chemical exposure 2%
Demographics– Male 93%– White 83%– Black 10%– Hispanic 12%– Age steady until age 55,rises afterward
• Incidence• Age < 55 5/100,000• Age 55-64 7/100,000• Age > 64 14/100,000
Source: National Census of Fatal Occupational Injuries, 1999
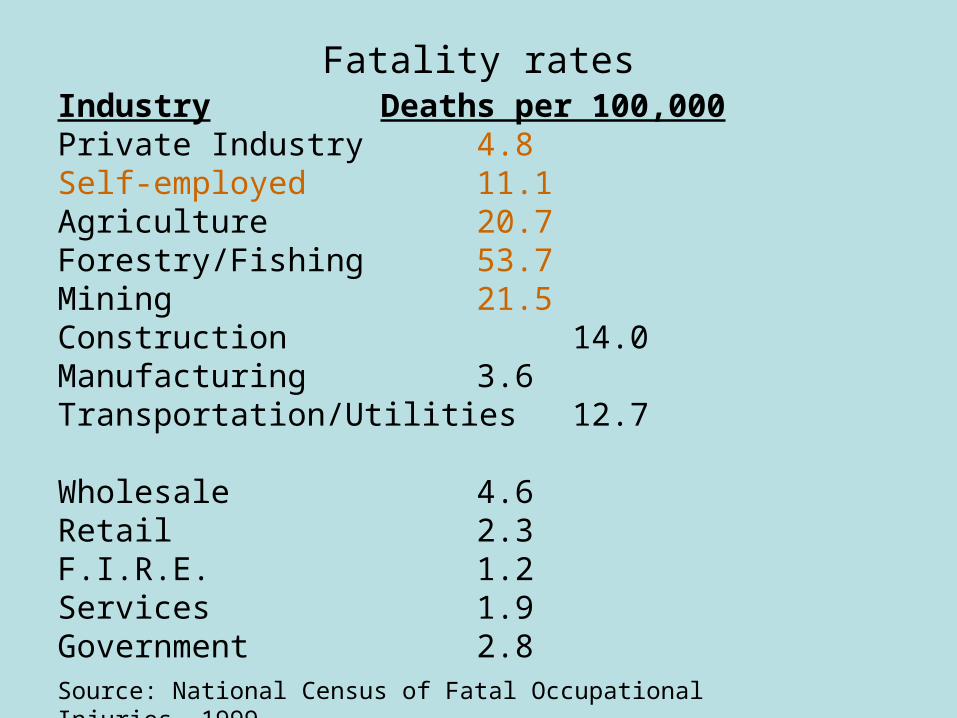
Fatality ratesIndustry Deaths per 100,000Private Industry 4.8Self-employed 11.1Agriculture 20.7Forestry/Fishing 53.7Mining 21.5Construction 14.0Manufacturing 3.6Transportation/Utilities 12.7
Wholesale 4.6Retail 2.3F.I.R.E. 1.2Services 1.9Government 2.8Source: National Census of Fatal Occupational Injuries, 1999
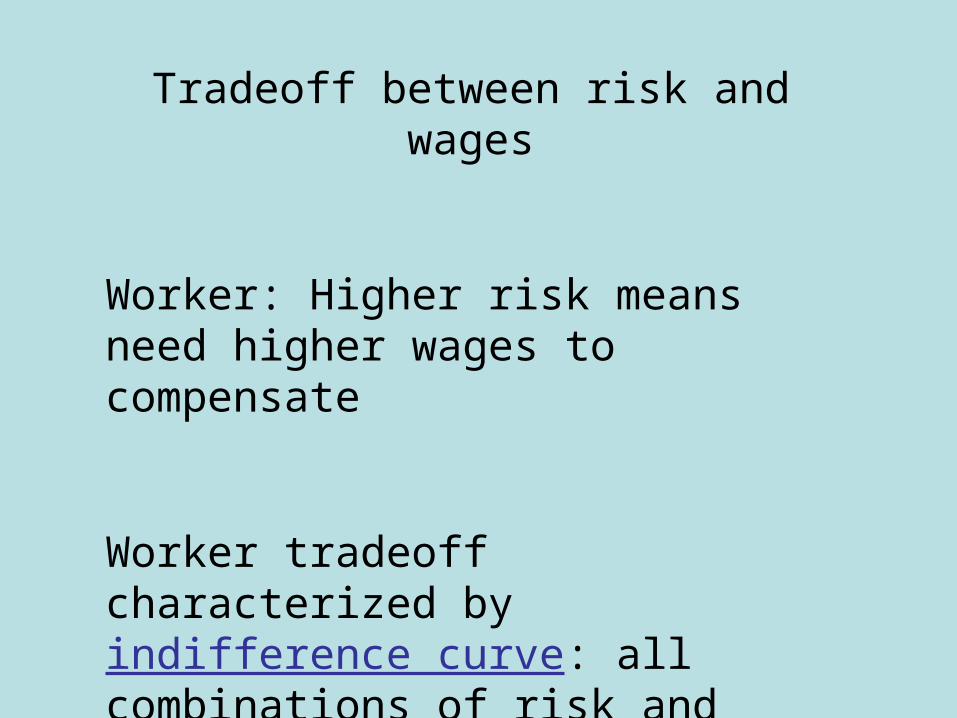
Tradeoff between risk and wages
Worker: Higher risk means need higher wages to compensate
Worker tradeoff characterized by indifference curve: all combinations of risk and wages that yield the same level of utility
Tradeoff between risk and wages
Risk aversion, risk neutral and risk loving
Tradeoff between risk and wages
Firm: Reducing risk is costly—firm needs to be able to lower wage to make back some of the higher costs
Firm tradeoff characterized by isoprofit line: all combinations of risk and wages that yield the same level of profit
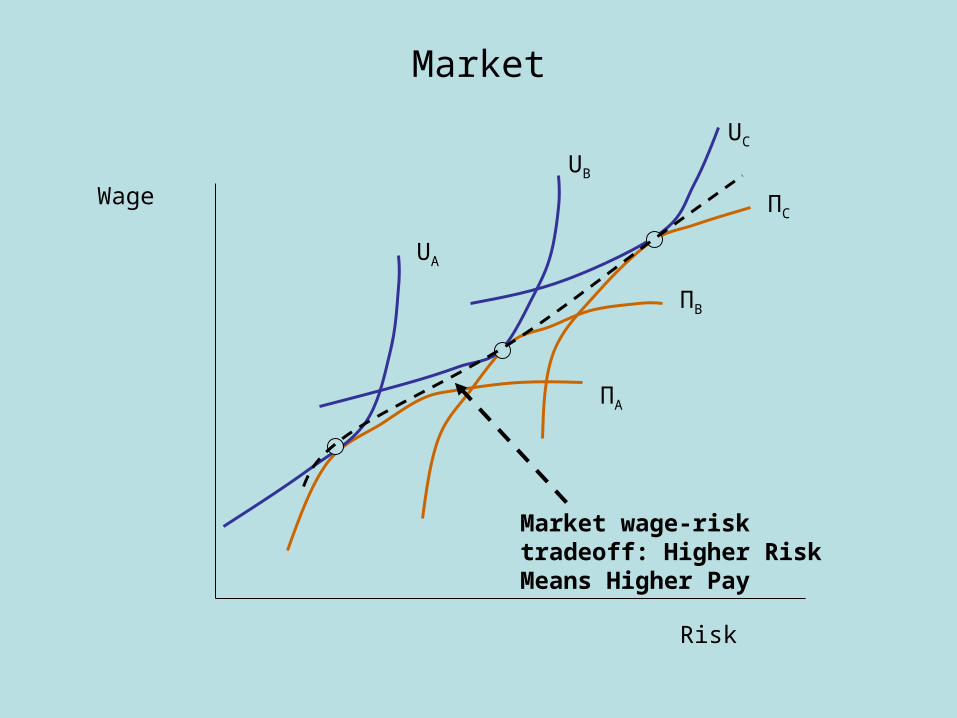
Market
Risk
Wage
UA
UB
UC
ΠC
ΠB
ΠA
Market wage-risk tradeoff: Higher Risk Means Higher Pay
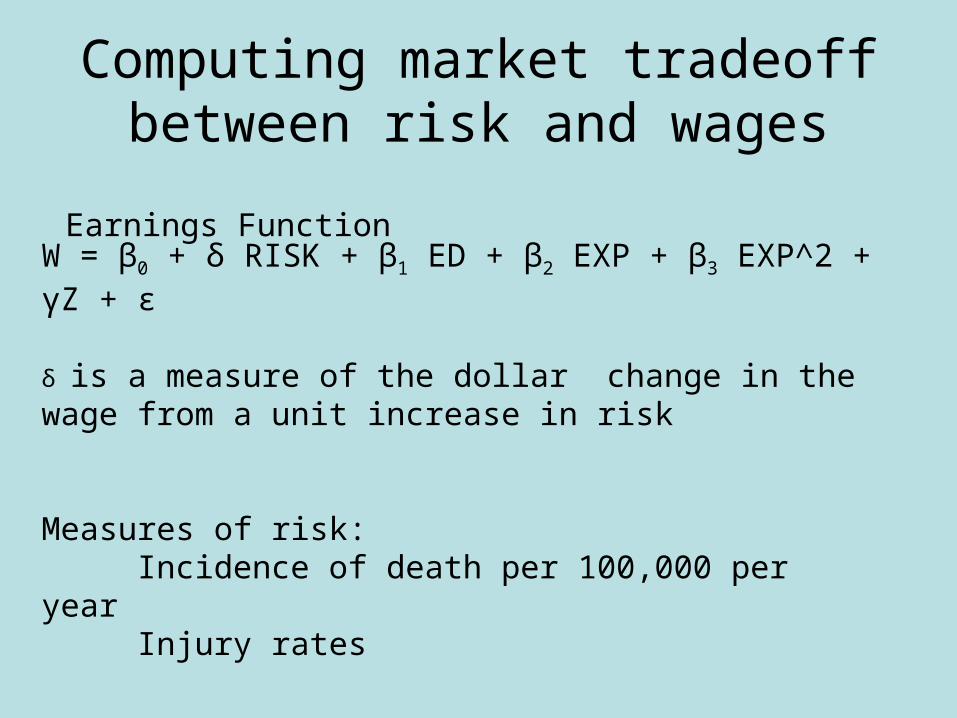
Computing market tradeoff between risk and wages
W = β0 + δ RISK + β1 ED + β2 EXP + β3 EXP^2 + γZ + ε
δ is a measure of the dollar change in the wage from a unit increase in risk
Measures of risk:Incidence of death per 100,000 per yearInjury rates
Earnings Function
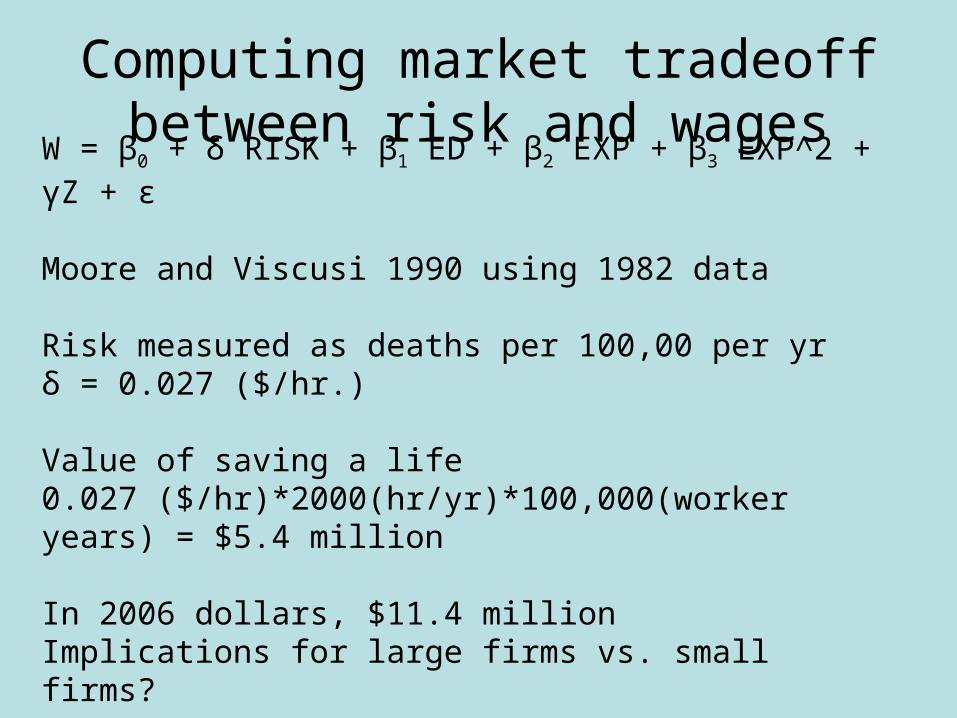
Computing market tradeoff between risk and wages
W = β0 + δ RISK + β1 ED + β2 EXP + β3 EXP^2 + γZ + ε
Moore and Viscusi 1990 using 1982 data
Risk measured as deaths per 100,00 per yrδ = 0.027 ($/hr.)
Value of saving a life0.027 ($/hr)*2000(hr/yr)*100,000(worker years) = $5.4 million
In 2006 dollars, $11.4 millionImplications for large firms vs. small firms?
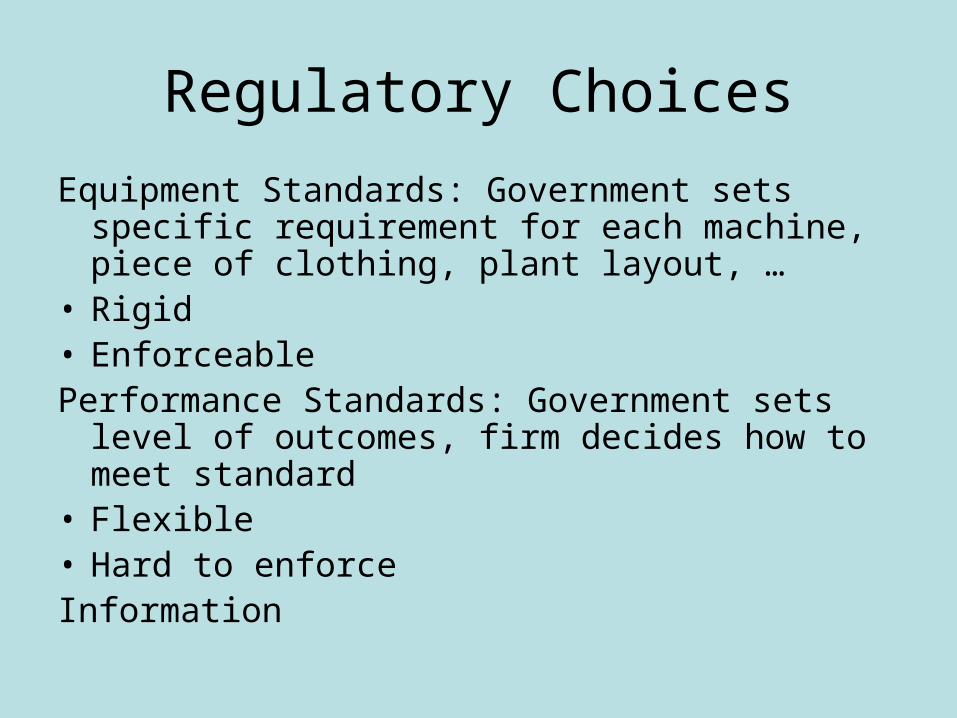
Regulatory Choices
Equipment Standards: Government sets specific requirement for each machine, piece of clothing, plant layout, …
• Rigid• EnforceablePerformance Standards: Government sets level of
outcomes, firm decides how to meet standard• Flexible• Hard to enforceInformation
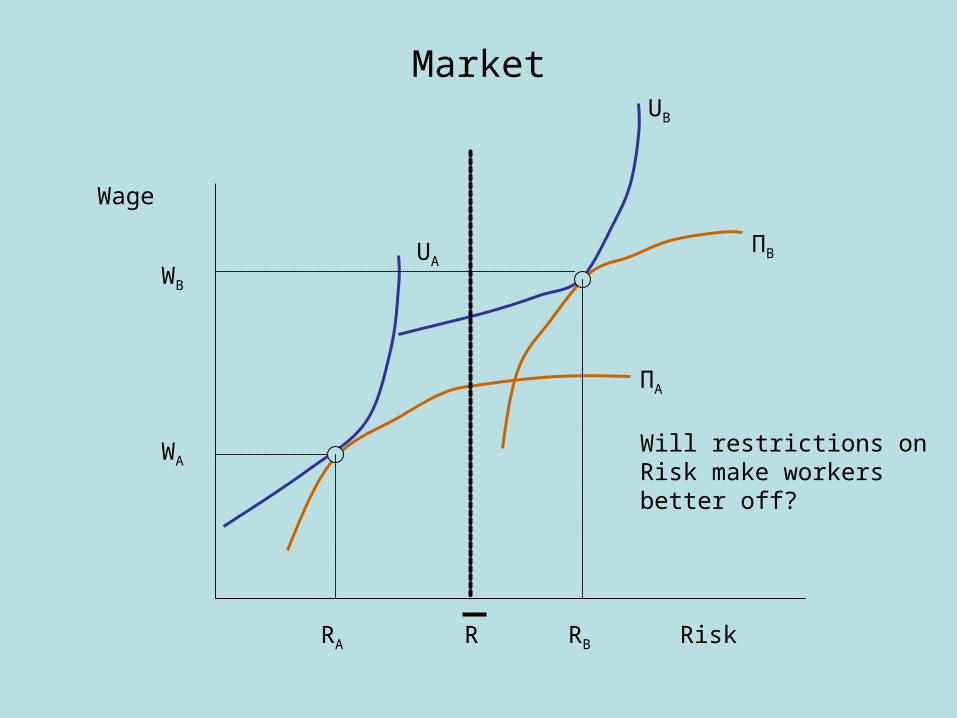
Market
Risk
Wage
UA
UB
ΠB
ΠA
R
Will restrictions on Risk make workers better off?
RA RB
WB
WA
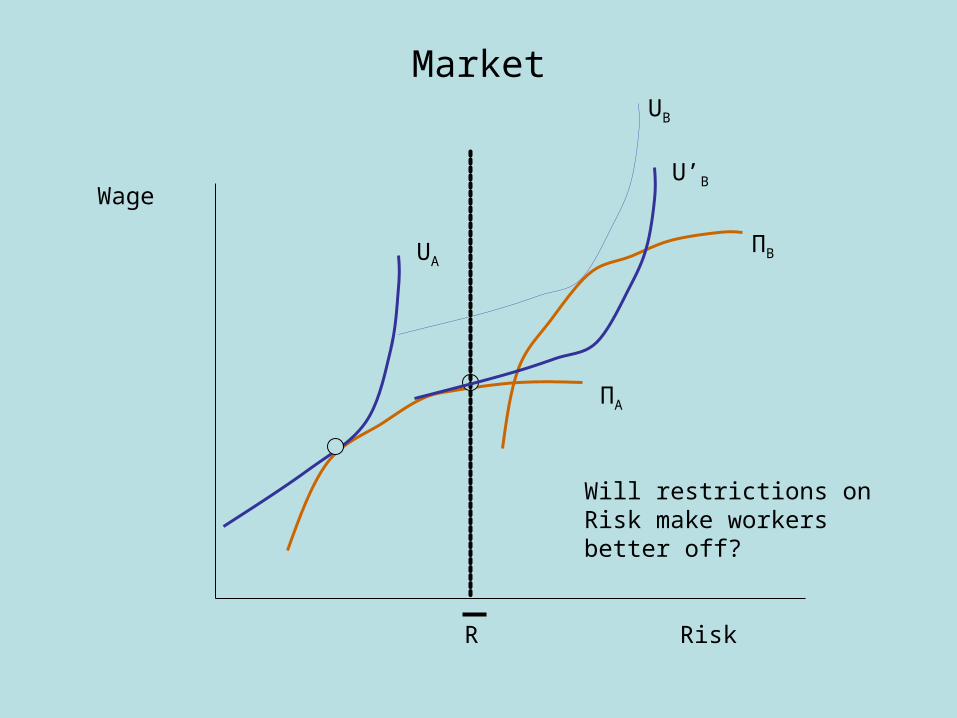
Market
Risk
Wage
UA
UB
ΠB
ΠA
R
Will restrictions on Risk make workers better off?
U’B
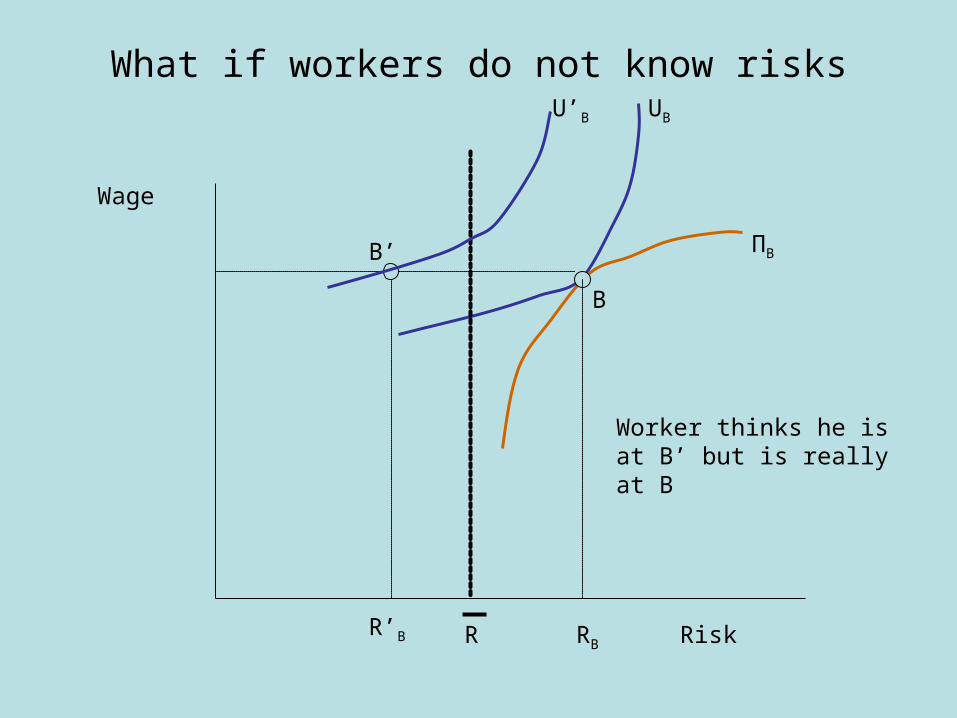
What if workers do not know risks
Risk
Wage
UB
ΠB
R
Worker thinks he is at B’ but is really at B
RBR’B
U’B
B’
B
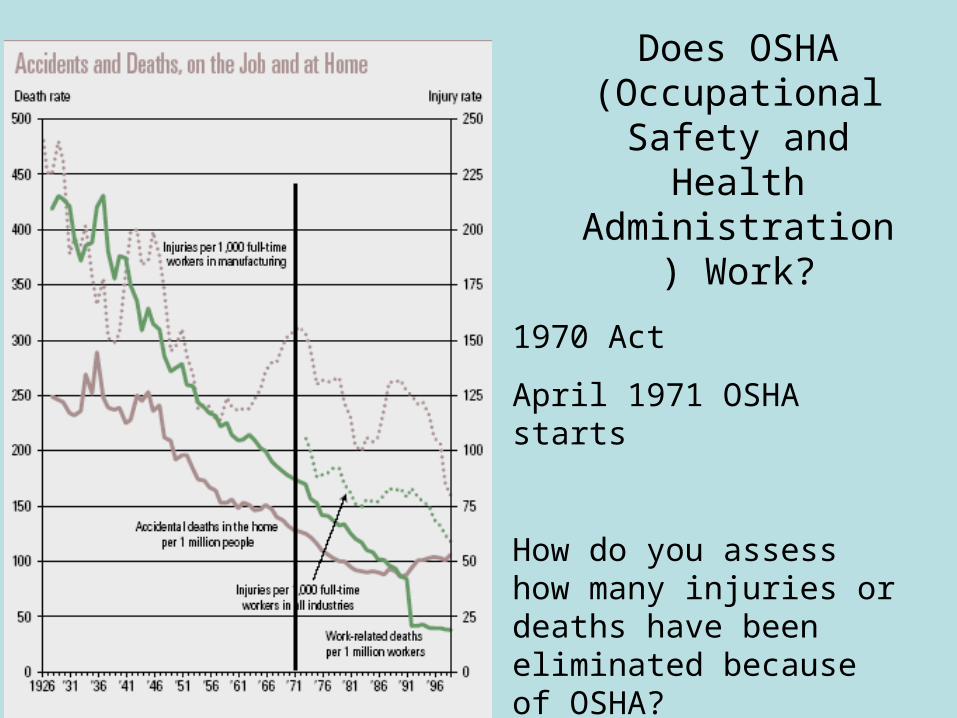
Does OSHA (Occupational
Safety and Health Administration)
Work?
1970 Act
April 1971 OSHA starts
How do you assess how many injuries or deaths have been eliminated because of OSHA?
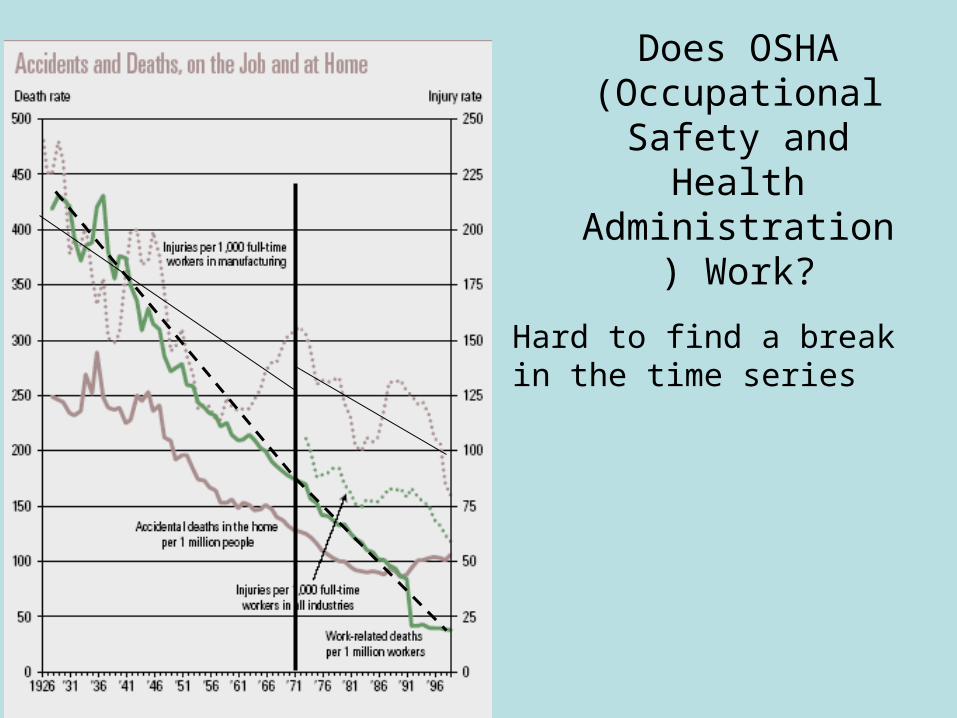
Does OSHA (Occupational
Safety and Health Administration)
Work?
Hard to find a break in the time series
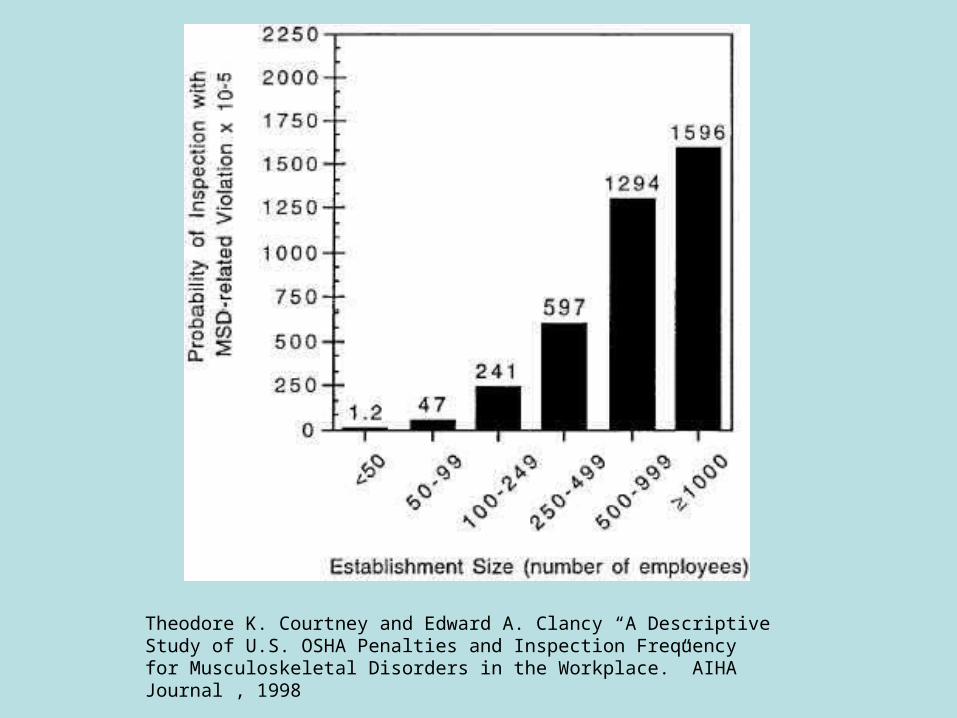
Theodore K. Courtney and Edward A. Clancy “A Descriptive Study of U.S. OSHA Penalties and Inspection Frequency for Musculoskeletal Disorders in the Workplace.” AIHA Journal , 1998
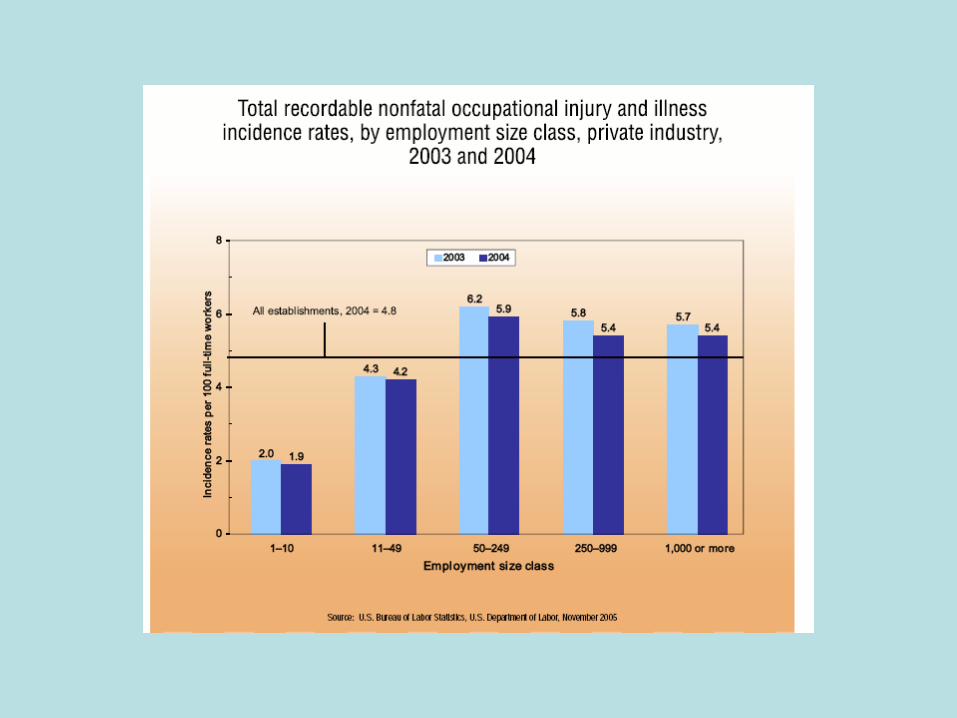
Does OSHA (Occupational Safety and Health Administration) Work?
Inspect 1/200 firms per year
Bias toward investigating large firms
Grandfather old firms
Small fines, first violation typically a warning
Injury rates smallest in smallest and largest firms
Worker’s Compensation
Insurance that pays in the event of a work related injury
How does that affect the risk wage tradeoff?