Embed Size (px)
Citation preview
Hypoglycemia unawareness in Type 1 diabetes suppresses brain responses to 1
hypoglycemia 2
3
Janice Jin Hwang1, Lisa Parikh1, Cheryl Lacadie2, Dongju Seo3, Wai Lam1, Muhammad Hamza1, 4
Christian Schmidt1, Feng Dai4, Anne-Sophie Sejling5, Renata Belfort-DeAguiar1, R. Todd 5
Constable2, Rajita Sinha3, Robert Sherwin1 6
7
1 Section of Endocrinology, Yale School of Medicine, New Haven, CT 8
2 Department of Radiology & Biomedical Imaging, Yale School of Medicine, New Haven, CT 9
3 Department of Psychiatry, Yale School of Medicine, New Haven, CT 10
4 Yale Center for Analytical Sciences, Yale School of Public Health, New Haven, CT 11
5 Department of Cardiology, Nephrology and Endocrinology, Nordsjællands Hospital, Hillerød, 12
Denmark 13
14
Conflict of Interest Statement: The authors have declared that no conflicts of interest exist. 15 Drs. Hwang and Sherwin reports receipt of research support from Regeneron for work unrelated 16 to this project. Dr. Belfort DeAguiar reports receipt of research support from Glaxo Smith Kline 17 for work unrelated to this project. 18 19
Corresponding author: 20
Robert S. Sherwin 21
The Anlyan Center, TAC 147S 22
PO Box 208020 23
New Haven, CT 06520 24
203-737-5558 (fax) 25
27

ABSTRACT: 28
Background: Amongst non-diabetic individuals, mild glucose decrements alter brain activity in 29
regions linked to reward, motivation and executive control. Whether these effects differ in T1DM 30
patients with and without hypoglycemia awareness remains unclear. 31
Methods: 42 individuals (13 healthy control subjects (HC), 16 T1DM individuals with 32
hypoglycemia awareness (T1DM-Aware) and 13 T1DM individuals with hypoglycemia 33
unawareness (T1DM-Unaware)) underwent BOLD fMRI brain imaging during a 2-step 34
hyperinsulinemic euglycemic (90 mg/dl)-hypoglycemic (60 mg/dl) clamp for assessment of 35
neural responses to mild hypoglycemia. 36
Results: Mild hypoglycemia in HC altered activity in the caudate, insula, prefrontal cortex, and 37
angular gyrus, whereas T1DM-Aware subjects showed no caudate and insula changes, but 38
showed altered activation patterns in the prefrontal cortex and angular gyrus. Most strikingly, in 39
direct contrast to HC and T1DM-Aware subjects, T1DM-Unaware subjects failed to show any 40
hypoglycemia-induced changes in brain activity. These findings were also associated with 41
blunted hormonal counterregulatory responses and hypoglycemia symptoms scores during mild 42
hypoglycemia. 43
Conclusion: In T1DM, and in particular T1DM-Unaware patients, there is a progressive blunting 44
of brain responses in cortico-striatal and fronto-parietal neurocircuits in response to mild-45
moderate hypoglycemia. These findings have implications for understanding why individuals 46
with impaired hypoglycemia awareness fail to respond appropriately to falling blood glucose 47
levels. 48
Funding: This study was supported in part by grants from the NIH R01DK020495 and P30 49
DK045735 (Sherwin), K23DK109284 (Hwang), K08AA023545 (Seo), the Yale Center for 50
Clinical Investigation supported by the Clinical Translational Science Award (UL1 RR024139). 51
52
53
INTRODUCTION 54
55
Patients with type 1 diabetes mellitus (T1DM) have long been constrained by the 56
adverse effects of insulin-induced hypoglycemia. The Diabetes Control and Complications Trial 57
(DCCT) established the benefits of restoring mean blood glucose to “near normal” levels in 58
patients with T1DM, and while this has produced clear benefits in terms of the microvascular 59
and macrovascular complications of T1DM, for many individuals, the widespread use of 60
intensified insulin therapy has resulted in a much higher rate of severe hypoglycemia (1). 61
Frequent episodes of hypoglycemia can lead to hypoglycemia unawareness, which prevents 62
patients from taking corrective action by eating. Thus, for many T1DM patients the immediate 63
fear of hypoglycemia exceeds the fear of long-term complications (2, 3). 64
In non-diabetic subjects, hypoglycemia is rare because, in response to falling blood 65
glucose levels, an integrated physiologic response is triggered which suppresses endogenous 66
insulin secretion, increases release of counterregulatory hormones, and provokes awareness of 67
hypoglycemia, which act together to rapidly restore euglycemia by stimulating glucose 68
production and food consumption. We have previously reported using the glucose clamp 69
technique together with functional magnetic resonance (fMRI) imaging, visual food cues, and 70
behavioral measures that brain regions involved in stimulating motivation to eat are exquisitely 71
sensitive to small reductions in glucose. In healthy humans, mild reductions in plasma glucose 72
(~68mg/dl) that were not sufficient to increase counterregulatory hormones were sufficient to 73
activate hypothalamic blood flow (4) as well as modulate brain motivation/reward and executive 74
control responses to food cues, which in turn resulted in a greater ‘wanting’ for high-calorie 75
foods (5). 76
In T1DM, this critical hypoglycemia defense system may be interrupted at every level. 77
Loss of endogenous insulin and reliance on peripheral exogenous hormone delivery make rapid 78

insulin reductions impossible. Beta cell destruction is also linked to loss of glucagon responses 79
to hypoglycemia, a defect that develops in nearly all T1DM patients (6, 7). As a result, T1DM 80
patients are particularly vulnerable to impairments in epinephrine release, which commonly 81
follows iatrogenic insulin-induced hypoglycemia (8-10). 82
Frequent episodes of hypoglycemia in T1DM individuals commonly lead to 83
hypoglycemia-associated autonomic failure (HAAF), whereby significantly lower blood glucose 84
levels are required to elicit a counterregulatory hormonal response as well as symptomatic 85
awareness of hypoglycemia (2, 3, 9). Whether loss of hypoglycemia awareness is also 86
accompanied by a failure to activate the drive to eat, which is clinically the most effective way to 87
reverse hypoglycemia, remains unknown. A study using fMRI reported that functional 88
connectivity in brain regions that have been implicated in the control of feeding behavior 89
including the basal ganglia, insula, and prefrontal cortex are altered in individuals with T1DM 90
(11). However, this study did not examine the specific effects of HAAF and hypoglycemia 91
unawareness on brain activity. Another study in a small number of individuals with T1DM who 92
were both aware or unaware of hypoglycemia using 18-F-Fluoro-2-deoxyglucose (FDG) PET 93
scanning suggested that acute hypoglycemia may increase ventral striatum FDG uptake and 94
that a small diminution of this response may have occurred in unaware patients (12). However, 95
FDG uptake may not accurately reflect glucose uptake during hypoglycemia, since acute 96
hypoglycemia (and likely antecedent hypoglycemia) alters the lumped constant used to 97
calculate glucose uptake (13). 98
It is noteworthy that prior studies using fMRI or PET scanning to assess the impact of 99
hypoglycemia on the brain amongst T1DM individuals have utilized very low glycemic targets 100
(typically 50 mg/dl or less). However, from a clinical perspective, by the time a T1DM patient’s 101
blood glucose falls into the low 50 mg/dl range they may already be at significantly higher risk 102
for hypoglycemia associated morbidity and mortality due to the failure to appropriately activate 103

multiple layers of protection against hypoglycemia. Therefore, in this study, we specifically 104
sought to determine how T1DM individuals both with or without hypoglycemia unawareness 105
respond to milder degrees of hypoglycemia in an effort to more effectively distinguish the CNS 106
defects at an earlier time point leading to unawareness in the course of developing moderate-107
severe hypoglycemia. To do this, we used fMRI brain scanning in conjunction with a two-step 108
hyperinsulinemic euglycemic-hypoglycemic clamp technique to investigate how regional brain 109
activity, particularly the neurocircuits driving eating behavior, are altered amongst T1DM 110
individuals with hypoglycemia unawareness (T1DM-Unaware) as compared to those patients 111
with preserved awareness (T1DM-Aware) as well as healthy non-diabetic control subjects (HC) 112
during acute mild-moderate hypoglycemia (target ~60 mg/dl). 113
114
RESULTS 115
Participant characteristics 116
Thirteen healthy, non-diabetic individuals, 16 T1DM-Aware individuals as assessed by the 117
Clarke score (14), and 13 T1DM-Unaware individuals participated in this study. Demographic 118
and clinical characteristics are presented in Table 1. Compared to HC individuals, both T1DM-119
aware individuals and T1DM-Unaware individuals were similar in age, gender, and education. 120
The T1DM-Unaware individuals were slightly older (P=0.01), had longer duration of disease 121
(P<0.001), and had slightly higher BMI (P=0.003) than the T1DM-Aware group. T1DM-Unaware 122
individuals also had significantly higher self-reported rates of severe hypoglycemic episodes in 123
the preceeding year (P=0.03). Both T1DM-Aware and T1DM-unaware groups were 124
indistinguishable in terms of HbA1C% and there were no differences across all three groups for 125
gender and education as well as measures of disordered eating and cognitive function (Table 126
1). 127
128

Two-step hyperinsulinemic euglycemic-hypoglycemic clamp 129
As seen in Figure 1B, both groups of individuals with T1DM had modestly higher blood 130
glucose levels at the beginning of the study compared to healthy control subjects. However, 131
using repeated measures linear regression analysis and adjusting for age, BMI, and gender, 132
there were no overall differences in plasma glucose levels during the course of the study 133
between T1DM-Aware and T1DM-Unaware subjects (LS mean 5.3 (-4.1, 14.7), P=0.27). 134
Furthermore, beginning at time 25 minutes, there was no significant statistical difference in pair-135
wise comparisons of plasma glucose levels between T1DM-Unaware compared to T1DM-Aware 136
(P=0.11) as well as healthy control participants (P=0.14). Notably, during the times of fMRI 137
BOLD data acquisition (euglycemia at times 45-60 minutes and hypoglycemia at times 90-105 138
minutes), plasma glucose levels were virtually identical across all three groups and were at 139
target (mean plasma glucose at euglycemia 93.0±1.9 mg/dl and hypoglycemia 58.9±1.1 mg/dl) 140
(Figure 1B). There were also no differences in plasma insulin levels between the groups (P = 141
0.76) over time. In addition, there were no significant differences across groups in mean glucose 142
infusion rates (GIR) during euglycemia (GIR mg/kg/min, HC 9.5±1.1 vs. T1DM-Aware 8.2±1.4 143
vs. T1DM-Unaware 7.0±0.9, P = 0.35) as well as during hypoglycemia (HC 7.2±0.8 vs. T1DM-144
Aware 6.6±0.7 vs. T1DM-Unaware 4.9±0.8, P = 0.12). 145
146
Hormonal and symptomatic responses to hypoglycemia 147
Mean plasma epinephrine, norepinephrine, glucagon, and cortisol levels at euglycemia 148
and hypoglycemia are shown in Figure 2. Baseline epinephrine levels were different across 149
groups (ANOVA P=0.04). This difference was primarily driven by the difference between T1DM-150
Unaware compared to healthy control participants (P=0.024). T1DM-Unaware and T1DM-Aware 151
patients were not significantly different (P=0.07). Notably, plasma epinephrine levels rose 152
significantly in response to hypoglycemia in all three groups. Healthy controls and T1DM-Aware 153
subjects had a nearly 3-fold increase in epinephrine levels, whereas T1DM-Unaware individuals 154
had a much more modest response, i.e. only a 60-70% increase above euglycemic levels. In 155
contrast, only the healthy controls had a significant increase in plasma glucagon and cortisol 156
during the hypoglycemic phase of the study. No significant changes in plasma norepinephrine 157
were detected in the three groups during this relatively mild hypoglycemic stimulus. 158
While in the scanner and prior to the fMRI BOLD acquisitions (at time 30 min and time 159
75 min), participants were asked to rate their symptoms of hypoglycemia using the Edinburgh 160
hypoglycemia score (15). Both T1DM-Aware and control subjects exhibited a statistically 161
significant increase in symptom response during hypoglycemia, whereas there was no 162
significant change in symptoms in the T1DM-Unaware group (Figure 3). Interestingly, 163
hypoglycemia symptoms were different across groups during hypoglycemia (HC, 23.9 ± 7.0; 164
T1DM-Aware, 35.9 ± 14.2; T1DM-Unaware, 28.4 ± 12.4 (ANOVA P=0.03), with the highest 165
scores amongst T1DM-Aware individuals, which was due to differences between healthy control 166
and T1DM-Aware individuals (P=0.009). Furthermore, during hypoglycemia, the symptoms of 167
hypoglycemia correlated significantly and positively with plasma epinephrine levels for the 168
T1DM-Aware individuals (ρ = 0.58, P= 0.02), but not for T1DM-Unaware (P=0.54). Of note was 169
that one participant who was T1DM-Unaware based on Clarke score had a very pronounced 170
increase in plasma epinephrine levels during mild hypoglycemia (euglycemia 47 pg/ml, peak 171
hypoglycemia 329 pg/ml); however, this participant had minimal changes in hypoglycemia 172
symptom scores during acute hypoglycemia (Edinburgh score euglycemia 33, hypoglycemia 39) 173
despite achieving target glucose levels during both the euglycemic and hypoglycemia portions 174
of the clamp. As a result, all fMRI-based analyses were run with and without this participant. 175
Given that there were no significant changes in the results, this participant was included in all 176
subsequent analysis. 177
178
Neural responses to mild hypoglycemia 179

Overall relationship between groups and glycemia (Group X condition effects): Across all 180
three groups, there was a significant group difference in brain response to hypoglycemia and 181
euglycemia in the right striatum (dorsal/ventral), particularly in the caudate (Figure 4) even after 182
adjusting for age and BMI and using the current standard threshold for significance of P<0.001 183
(whole brain, Family-wise error corrected) (16). To give a sense of directionality of change, a 184
region of interest was defined from the significant cluster in the right caudate and mean GLM β-185
weights were extracted for each subject. In response to hypoglycemia, healthy control subjects 186
had relatively decreased activity in the caudate, whereas T1DM-Aware and T1DM-Unaware 187
individuals had minimal changes (Figure 4B). Across all three groups, we did not find any 188
significant (at P<0.001) interactions between Group X Glycemia X Task or Group X Task. Thus, 189
all analysis using all 3 groups were collapsed across tasks (visual food and non-food cues). 190
Furthermore, although all three groups had similar plasma glucose levels by 20 minutes prior to 191
the time of BOLD acquisitions, the T1DM-Aware group had higher plasma glucose levels at the 192
start of the clamps. To assess whether these differences in starting glucose levels affected brain 193
activity during euglycemia BOLD acquisitions (~45 minutes later), we assessed across groups 194
and between group interactions at euglycemia alone and found no significant differences. 195
We then examined each group’s brain activity response to hypoglycemia separately 196
(Figure 5 and Supplemental Table 1). The healthy control, T1DM-Aware and T1DM-Unaware 197
subjects had strikingly different patterns of brain responses to mild hypoglycemia, even after 198
adjusting for age and BMI. In particular, in response to hypoglycemia, healthy control subjects 199
had relatively decreased activity in the ventral striatum/caudate, insula, orbitofrontal cortex 200
(OFC), ventromedial prefrontal cortex (vmPFC), ventrolateral prefrontal cortex (vlPFC), 201
dorsolateral prefrontal cortex (dlPFC), and left angular gyrus. In contrast, while the T1DM-202
Aware individuals also had relatively decreased activity in the vmPFC and OFC, they did not 203
have any significant differences in activity in the caudate, insula, or dlPFC. Interestingly, the 204
T1DM-Aware individuals had relatively increased activity in the inferior parietal lobe, particularly 205

the right angular gyrus as well as the right ventrolateral prefrontal cortex (vlPFC). In contrast, 206
T1DM-Unaware individuals showed no significant changes in brain activity in any of the regions 207
that were different amongst the other two groups. 208
Given that changes in plasma epinephrine levels are believed to be a particularly 209
sensitive marker for defective counterregulation amongst T1DM individuals, we assessed the 210
relationship between changes in plasma epinephrine levels and changes in brain responses in 211
the regions identified in Figure 5. A smaller change in plasma epinephrine levels was associated 212
with a smaller degree of deactivation in the striatum/caudate (ρ = -0.43, P = 0.005), vmPFC (ρ = 213
-0.46, P = 0.003), right insula (ρ = - 0.37, P = 0.02), vlPFC (ρ = - 0.34, P = 0.03), and angular 214
gyrus (ρ = -0.41, P = 0.007) consistent with the association of the blunted epinephrine response 215
with the blunted brain responses. There were no associations between brain activity in any of 216
the above regions and epinephrine levels at euglycemia or hypoglycemia alone. Amongst the 217
T1DM subjects, the Edinburgh hypoglycemia symptom score correlated inversely with activity 218
only in the vmPFC during hypoglycemia (ρ = -0.410, P=0.03). 219
220
Effect of hypoglycemia unawareness on brain responses to high calorie food cues 221
To address the question of whether hypoglycemia unawareness modulates the brain’s 222
response to hypoglycemia while viewing high calorie food stimuli, we performed an analysis 223
focused on only the T1DM-Aware and T1DM-Unaware groups. While viewing high calorie food 224
cues (~75% of the high calorie cues were also high carbohydrate), there was a significant 225
Group X Glycemia interaction (P<0.001), even after covarying for age, BMI, and duration of 226
diabetes. This interaction was not present under non-food visual stimuli conditions. Notably, 227
T1DM-Aware individuals had a significant decrease in brain activity during high calorie food in 228
the medial orbitofrontal cortex (Brodmann area 11), while T1DM-Unaware individuals showed 229
no statistically significant change in brain activity in this region (Figure 6). There were no 230
significant correlations between brain activity in this region and counterregulatory hormones. 231

DISCUSSION 232
In this study, we show that hypoglycemia unawareness in T1DM patients is associated 233
with a diminished brain response to mild hypoglycemia (plasma glucose ~60 mg/dl). Moreover, 234
the pattern of loss of brain responses appears to involve cortico-striatal and fronto-parietal 235
neurocircuits that are known to play important roles in regulating motivation and goal-directed 236
behavior as well as attention, and thus are likely to have implications for understanding why 237
individuals with hypoglycemia unawareness fail to respond appropriately to falling blood glucose 238
levels. 239
The basal ganglia, and in particular the caudate, has been consistently shown in studies 240
across species and imaging modalities to play an important role in the ability to respond 241
appropriately to environmental changes and to regulate goal directed behavioral inputs (17-21). 242
The caudate has direct physical and functional connections with executive control regions in the 243
frontal cortex including the medial, ventral, and dorsolateral prefrontal cortex (22, 23). Amongst 244
healthy, non-diabetic individuals, mild hypoglycemia was sufficient to elicit changes in the 245
caudate, cortical regions such as the vmPFC and vlPFC, and the insula, which is consistent with 246
previous studies that have shown that the caudate, PFC, and insula are responsive to changes 247
in circulating glucose levels (5, 12, 24, 25). In contrast, T1DM-Aware individuals had altered 248
patterns of cortico-striatal activity with no significant changes in the caudate or insula during 249
hypoglycemia. We also observed differences across groups in the patterns of 250
activation/deactivation in the dorsolateral prefrontal cortex (dlPFC) and angular gyrus. The 251
angular gyrus, located in the inferior parietal lobe, has direct projections to the dlPFC (26) and 252
together they are part of a larger, well-studied, fronto-parietal circuit (27-29). The angular gyrus, 253
in particular, has been shown to play a role in regulating how one’s attention shifts towards 254
higher salient stimuli (30-33). Interestingly, amongst healthy control subjects, mild hypoglycemia 255
induced changes in activity in the left dlPFC and left angular gyrus, which is consistent with a 256
previous study in healthy control subjects during hypoglycemia (plasma glucose 50 mg/dl) while 257

performing cognitive tasks (34). In contrast, T1DM-Aware individuals had no brain responses in 258
the left dlPFC or left angular gyrus, but instead showed markedly increased activity in the right 259
angular gyrus. Taken together with our findings that T1DM-Aware individuals had higher ratings 260
for symptoms at hypoglycemia, these observations suggest that increased activity in inferior 261
parietal lobe/angular gyrus may be a compensatory adaptation to the disruption in cortico-262
striatal and fronto-parietal neurocircuits that are involved in sensing mild hypoglycemia. The 263
markedly increased angular gyrus activity seen in the T1DM-Aware group during mild 264
hypoglycemia may reflect differences in attention to or sensing of the stimulus (35). Thus, the 265
T1DM-Aware individuals may have heightened awareness to hypoglycemia sensory inputs 266
compared to healthy control subjects, which would be consistent with their higher reported 267
ratings of hypoglycemia symptoms both at euglycemia and at hypoglycemia. 268
Most strikingly, compared to T1DM-Aware and healthy control subjects, the T1DM-269
Unaware participants showed virtually no changes in brain activity in response to mild 270
hypoglycemia. Very little is known about the impact of hypoglycemia unawareness on regional 271
brain responses; however, these findings would be consistent with the blunted symptom scores 272
as well as the blunted counterregulatory hormone responses to hypoglycemia observed in the 273
T1DM-Unaware group. The underlying mechanism mediating the lack of change amongst the 274
T1DM-Unaware individuals remains uncertain; however, it is likely due to brain adaptations to 275
frequent episodes of severe hypoglycemia in the preceeding year of the study. Recurrent 276
hypoglycemia alters brain glucose transport kinetics as well as promotes increased utilization of 277
alternate fuels such as monocarboxylic acids (lactate, ketones and acetate) in humans when the 278
availability of glucose diminishes (36, 37). Furthermore, T1DM individuals with hypoglycemia 279
unawareness may have alterations in cerebral blood flow during hypoglycemia (38, 39), which 280
may also affect BOLD signal. Interestingly, a recent study has reported that individuals with 281
T1DM and hypoglycemia unawareness have increased cerebral blood flow during acute 282
hypoglycemia compared to T1DM-Aware and healthy controls (39). The current findings would 283

be consistent with these observations that the brain adapts to ensure sufficient substrate 284
(glucose) delivery to the brain. In keeping with these human studies, data in rodents have also 285
demonstrated that prior exposure to hypoglycemia induces up-regulation of blood-brain barrier 286
glucose transport, leading to more efficient glucose utilization during hypoglycemia (40, 41). 287
Thus, the lack of change in brain activity amongst T1DM-Unaware individuals in response to 288
mild hypoglycemia may be the culmination of a variety of adaptive changes in cerebral blood 289
flow, glucose transport, cerebral glucose metabolism, or some combination of each of these 290
factors. 291
It is important to note that induction of hypoglycemia results in a series of dynamic 292
changes in brain activation and deactivation, and thus time intervals when the scans are 293
acquired over the course of hypoglycemia may directly impact the directionality and regional 294
changes observed (24). This, as well as other factors such as hypoglycemia target, timing of 295
image acquisition, imaging modality, may all contribute to the heterogeneity of brain responses 296
to hypoglycemia previously reported in the literature. For example, we did not observe 297
hypoglycemia-induced changes in the hypothalamus, which has been reported by some groups 298
(25), but not others (42) to be altered during hypoglycemia in T1DM individuals. Thus, our 299
findings must be interpreted cautiously given that we are only observing a snapshot of the 300
dynamic brain changes produced over the course of falling blood glucose levels, a critical time 301
for prevention of hypoglycemia-induced brain injury. 302
Importantly, it remains uncertain whether lower glycemic thresholds will be able to elicit 303
changes in brain activation responses amongst T1DM-Unaware individuals and whether the 304
brain responses will be in a similar pattern to that observed amongst T1DM-Aware individuals. 305
Studies of glucose transport kinetics in hypoglycemia unaware T1DM individuals have found 306
that glucose transport is preserved even at glucose levels as low as 50 mg/dl (43). However, it 307
remains uncertain whether lower glucose thresholds are the only difference between T1DM-308
Aware and Unaware individuals. Thus, this current study highlights the need for further studies 309
designed to assess the contribution of additional factors such as age of onset of diabetes, 310
duration of diabetes, severity of diabetes during childhood/adolescence when the brain is still 311
developing in determining the propensity for developing hypoglycemia unawareness. 312
Furthermore, whether these changes are reversible and whether strict avoidance of 313
hypoglycemia can restore brain responses remains to be assessed. Of note, prior studies using 314
strict avoidance of hypoglycemia have also resulted in worsening of glycemic control (44-46), 315
which could also have an impact on glucose transport capacity into the brain. 316
Because one of the earliest and best defenses against falling blood glucose levels is to 317
eat, we also examined the brain responses to high calorie/high carbohydrate food cues. 318
Amongst non-diabetic individuals, high calorie food cues have been shown to elicit robust 319
changes in brain activity in reward, motivation, and executive control regions during both 320
euglycemia (47) and mild hypoglycemia (5). Consistent with these findings reported in non-321
diabetic individuals, the current data demonstrate that T1DM Hypoglycemia-Aware individuals 322
also had a pronounced change in the medial orbitofrontal cortex (OFC) when viewing high 323
calorie food cues that was not present when looking at pictures of non-food objects. Notably, the 324
medial OFC plays an important role in reward-guided decision-making (48, 49). Furthermore, 325
because it has dense direct connections with the hypothalamus (50, 51), it has been shown to 326
play a particularly important role in regulating feeding behavior (52-54). Thus, it is particularly 327
noteworthy that in contrast to T1DM-Aware individuals, high calorie food cues had no effect on 328
medial OFC brain activity during mild hypoglycemia in T1DM-Unaware individuals, suggesting a 329
diminished drive to eat, which may be a critical early defect in the defense against 330
hypoglycemia. Interestingly, we found no relationship between changes in brain activity to high 331
calorie foods and the counterregulatory hormone response. Whether the lack of brain response 332
is due to intrinsic central nervous system differences or secondary to the blunted rise in 333
circulating counterregulatory hormone levels remains unclear and further studies will be needed 334
to address this question and prove causality. However, given that in non-diabetic subjects 335

changes in brain activity induce and occur prior to changes in counterregulatory hormones (4), it 336
is likely that changes in brain activity are not primarily driven by the counterregulatory response, 337
but rather play the key role in protecting the brain by initiating appropriate defenses against 338
falling glucose levels. Prior studies have also noted a dissociation between cournterregulatory 339
hormone responses and awareness of hypoglycemia (45). 340
It is noteworthy that there are some considerations and limitations to the current study. 341
While we defined our groups using widely accepted and validated questionnaires for 342
hypoglycemia unawareness, the Clarke and Gold scores, these are subjective reports and we 343
did not collect data on glycemic variability and objective rates of hypoglycemia in the months 344
preceeding our studies. In addition, our T1DM-Unaware participants were approximately 10 345
years older and had diabetes for a longer duration than the T1DM Aware group. Although we 346
co-varied for age, BMI, and duration of diabetes, our findings amongst the T1DM-Unaware 347
individuals should still be interpreted cautiously with recognition that it may be very difficult 348
experimentally to separate the effects of age and longer duration of T1DM from the effects of 349
hypoglycemia unawareness itself. Of note in this regard, increasing age has been associated 350
with increases in baseline epinephrine levels (55) and our T1DM-Unaware cohort was slightly 351
older and had higher baseline epinephrine levels; however, we did not observe any 352
relationships between epinephrine levels at euglycemia or hypoglycemia and brain responses. 353
Furthermore, prior studies have examined the effects of age on counterregulatory responses to 354
hypoglycemia (amongst non-diabetic individuals). In these studies, where the mean age of the 355
older groups was markedly older than our cohort (age 60-70’s), they found modest (55) or no 356
(56) differences in counterregulatory responses to hypoglycemia. 357
It is also noteworthy that increased age and duration of diabetes may be associated with 358
cerebrovascular dysfunction. Increased presence of cerebral small vessel disease such as 359
white matter hyperintensities and lacunes have been reported amongst individuals with T1DM 360
(mean age 50 years) (57, 58); however, other studies amongst older T1DM patients (mean age 361

~60 years and with known microvascular complications) (59) have reported no significant 362
differences in white matter lesions or microinfarcts compared to control subjects. While we 363
cannot exclude the possibility that occult cerebrovascular disease may also contribute to the 364
differences observed in the T1DM-Unaware individuals, this appears less likely given our 365
participants had well-controlled diabetes, had no history of cerebrovascular disease or 366
cardiovascular disease, and were significantly younger (mean age 30 and 40 years for T1DM-367
Aware and Unaware, respectively) than the groups reported in the literature. 368
Finally, even though our study includes larger numbers of T1DM-Aware and T1DM-369
Unaware participants than prior fMRI-based studies investigating hypoglycemia unawareness, 370
our sample sizes remain a limitation. To minimize the risk of false positives, we used a p-value 371
threshold of P<0.001 (16). Currently, best practice guidelines for conducting fMRI based studies 372
typically recommend at least 20 subjects per group to minimize false positives (60); however, 373
these recommendations may not be directly applicable to studies amongst relatively rare 374
disease groups such as individuals with T1DM and hypoglycemia unawareness or in study 375
designs using highly controlled physiologic manipulations such as in a two step euglycemic-376
hypoglycemic clamp where individuals are compared to themselves at two well-defined, but 377
different states. 378
In conclusion, the current study highlights the differential CNS responses to mild 379
hypoglycemia amongst individuals with T1DM and preserved or diminished hypoglycemia 380
awareness. Our findings suggest that although T1DM-Aware individuals no longer exhibit 381
hypoglycemia-induced changes in reward and motivation brain regions (striatum), they have 382
developed compensatory increases in activity in regions associated with attention (i.e. angular 383
gyrus), which may be a protective adaptive mechanism to help maintain an appropriate 384
response to falling glucose levels. However, T1DM patients with hypoglycemia unawareness fail 385
to respond acutely to mild hypoglycemia in cortico-striatal and fronto-parietal brain regions. 386
Taken together with the blunted counterregulatory hormone and subjective hypoglycemia 387
symptom responses seen amongst these individuals, these CNS changes most likely play an 388
important role in causing the inability of T1DM patients with hypoglycemia unawareness to 389
detect and respond appropriately to falling plasma glucose levels. These findings underscore 390
the importance of future interventional studies to determine whether reduction of hypoglycemia 391
frequency can restore these changes in regional brain responses. 392
393
394
METHODS 395
Participants 396
Participants were recruited from the greater New Haven area as well as the Yale 397
Diabetes Center. Inclusion criteria for all subjects included: ages 18-60 years, BMI < 30 kg/m2, 398
ability to read English. Inclusion criteria for individuals with T1DM included HbA1C < 9% and 399
duration of diabetes > 5 years. Exclusion criteria included inability to enter the MRI, smoking, 400
illicit drug or recent steroid use; known psychiatric or neurological disorders, active infection, 401
malignancy, abnormal thyroid function, cerebrovascular disease, cardiovascular disease, 402
hepatobiliary disease, weight change in the last 3 months, pregnancy or breastfeeding. 403
Sixty-seven potential subjects were screened at the Yale New Haven Hospital research 404
unit from November 2013 through July 2016 with a screening history, electrocardiogram, 405
physical examination, and laboratory testing at the Yale New Haven Hospital Research Unit 406
(HRU). Of the 67 subjects screened, 42 participants completed the study and were included in 407
the final analysis (see CONSORT diagram showing the flow of participants in the study, 408
Supplement Figure 1). They were divided into the following three groups: 13 healthy controls 409
(HC) (6 males/7 females, age 33±11 years, BMI 24.1±2.9 kg/m2, HbA1c 5.0±0.3%), 16 410
participants with type 1 diabetes and hypoglycemia awareness (T1DM-Aware) (5 males/11 411
females, age 30±8 years, BMI 23.2±3.4 kg/m2, HbA1c 7.0±0.8), and 13 participants with type 1 412
diabetes and hypoglycemia unawareness (T1DM-Unaware) (6 males/7 females, age 40±12 413

years, BMI 26.8±2.9 kg/m2, HbA1c 6.9±0.6). The Clarke score (14) was used to differentiate 414
participants with hypoglycemia awareness versus unawareness. If the Clarke score was not 415
classifiable (i.e. when individuals reported a score of 3 R) then the Gold (61) method was used 416
to determine whether they had impaired hypoglycemia awareness. 417
Study protocol 418
All participants with T1DM were asked to wear a continuous glucose monitor (CGM) 419
(Dexcom G4) one week prior to their scheduled MRI visit in order to monitor for antecedent 420
hypoglycemia. If participants had any episodes of hypoglycemia (glucose < 70 mg/dl or a 421
symptomatic episode requiring assistance) in the 5 days prior to MRI scanning, then the scans 422
were postponed to a later date. On the day of the MRI, participants arrived to the HRU at 9AM. 423
All participants were instructed to eat breakfast as usual prior to arrival and those with diabetes 424
were further instructed to bolus insulin as usual for breakfast. At 10AM, all participants were 425
provided with a standardized snack consisting of 41 grams of carbohydrate (turkey sandwich, 426
apple, diet ginger ale) in order to neutralize feeling of hunger as previously described (5). 427
Participants with diabetes were instructed to inject a bolus of insulin as per their home insulin to 428
carbohydrate ratio. Intravenous catheters were placed in antecubital veins bilaterally: one for 429
blood sampling and the other for insulin and glucose infusion. Participants were informed that 430
their glucose levels would be reduced below normal using an insulin and glucose infusion, 431
which could lead to symptoms of hypoglycemia. Participants were blinded to the timing of 432
changes in glucose levels. Scanning began in the MRI center at 12PM simultaneously with 433
initiation of an insulin infusion at 2 milliunits/kg/hr. Euglycemia (~90 mg/dl) that was maintained 434
for the first phase of the study, after which glucose was decreased into the mild hypoglycemia 435
range (~60 mg/dl) (Figure 1A). Blood oxygen level dependent (BOLD) images were acquired 436
during euglycemia (between time 45-60 minutes) and hypoglycemia (between time 90-105 437
minutes) sessions. Participants completed a visual food task while BOLD images were 438
collected, as described below. Throughout the MRI scan, blood was sampled for glucose every 439

5 minutes. Counter-regulatory hormones (epinephrine, norepinephrine, glucagon and cortisol) 440
were sampled at times 0, 30, 45, 60, 75, 90, and 105. 441
442
Biochemical Analysis: Plasma glucose was measured enzymatically using glucose oxidase 443
(YSI, Yellow Springs, OH). Plasma free insulin, leptin, ghrelin, and glucagon were measured by 444
double antibody radioimmunoassay (Millipore). Double-antibody radioimmunoassay was used to 445
measure plasma cortisol (MP Biomedicals, Solon, OH). Plasma epinephrine and norepinephrine 446
were measured by high-performance liquid chromatography (ESA). 447
448
Visual Food Cue Task: The visual food cue task we used has been previously validated for 449
fMRI (5, 47). During each euglycemia and hypoglycemia session, we presented a total of 42 450
images (three runs of 14 pictures (7 high-calorie food images (HCF), 7 non food images (NF)) 451
each). HCF pictures included items such as hamburgers, pizza, ice cream, and chocolate as 452
previously described (5). 75% of the HCF foods were also high carbohydrate foods. NF pictures 453
consisted of objects such as buildings, books, and doors. Using an event-related design, 454
images were shown for 6 seconds. Each picture was displayed only once and the order of 455
pictures was counterbalanced and randomized within condition across participants. At the end 456
of each trial, a fixation cross appeared with a jittered inter-trial interval (mean, 6 seconds: range 457
3-9 seconds), during which participants relaxed until the onset of the next trial, as previously 458
described (5). This process was repeated for each of the three runs that were presented at both 459
euglycemia and hypoglycemia. 460
461
Hypoglycemia symptom assessments: Participants were asked to verbally rate their 462
sensation of hypoglycemic symptoms (unable to concentrate, blurry vision, anxiety, confusion, 463
difficulty speaking, double vision, drowsiness, tiredness, hunger, weakness, sweating, 464
trembling, warmness, heart racing) on a 7-point Likert scale (1 indicating “not at all” and 7 465

indicating “a lot”) based upon the Edinburgh hypoglycemia symptom score (15) at three 466
separate time points during the study: baseline (prior to entering the scanner) and then once 467
they had reached target glucose levels for euglycemia (at time 30 min) and hypoglycemia (at 468
time 90 min). 469
470
Statistical Analysis: One-way analysis of variance (ANOVA) was used to determine whether 471
there were statistical differences among the three groups for all demographic variables followed 472
by Fisher’s least significant difference (LSD) test for pairwise comparisons if the overall test was 473
statistically significant. Analyses of repeatedly measured variables such as plasma glucose was 474
performed using the mixed-effects regression model method, taking into account both between-475
subject and within-subject correlations of repeated measures using a combination of pre-476
specified compound symmetry covariance matrix and an autoregressive covariance matrix. Age, 477
gender, and BMI were adjusted as covariates (i.e., as fixed effects). Subsequently, pair-wise 478
comparisons at each time point were performed. Least square mean difference and its 95% 479
confidence interval were reported as a measure of effect size. To assess changes in 480
counterregulatory hormones, plasma hormone levels at euglycemia (times 45 and 60 min) and 481
hormone levels at hypoglycemia (times 90 and 105 min) were averaged together and compared 482
using paired T-tests. All analyses were performed using SAS, version 9.4 (Cary, NC) and 483
SPSS, version 22 (Armonk, NY). A two-tailed p-value of less than 0.05 was considered to be 484
statistically significant. Unless otherwise stated, data are presented as mean +/- standard error 485
of mean (SEM). 486
487
Study Approval: The protocol was approved by the Yale University School of Medicine Human 488
Investigation Committee (New Haven, CT). All subjects provided informed, written consent 489
before participation. 490
491

fMRI analysis: The digital data (Digital Imaging and Communication in Medicine (DICOM)) was 492
converted to NIFTI using dcm2nii (62) and then the first 3 images were discarded from each 493
functional run to enable the signal to achieve steady-state equilibrium between radio-frequency 494
pulsing and relaxation leaving 271 images per slice per run for analysis. The data were motion 495
corrected using SPM8 (www.fil.ion.ucl.ac.uk/spm/software/spm8), and they were discarded if 496
linear motion was greater than 1·5 mm or rotation was greater than 2 degrees. Images were 497
iteratively smoothed until the smoothness for any image had a full width half maximum of 498
approximately 6mm (63). For individual subject data analysis, General Linear Model (GLM) was 499
used to determine the regions with changes in signal in response to the visual task (HCF or NF 500
image) in each session. To consider potential variability in baseline fMRI signal, drift correction 501
was included in the GLM with drift regressors used to remove the mean time course, linear, 502
quadratic, and cubic trends for each run. To adjust for anatomical differences in each 503
individual, the Yale Bio-Image Suite software package (http://www.bioimagesuite.org/) was used 504
to calculate two linear and one non-linear registration. These three registrations were 505
concatenated and applied as one registration to bring the data into a common reference brain 506
space. The Colin27 Brain in the Montreal Neurological Institute (MNI) space was used as the 507
reference brain. For group level data analysis, linear effects modeling using AFNI 3dLME 508
(http://afni.nimh.nih.gov) was implemented with a 3 (group: HC, T1DM-Aware, T1DM-Unaware) 509
X 2 (session: Euglycemia, Hypoglycemia) X 2 (Task: HCF and NF) design, while co-varying for 510
age, duration of diabetes, and BMI using the LME modeling program 3dLME from AFNI 511
(http://afni.nimh.nih.gov/sscc/gangc/lme.html). In this design, task and session were treated as 512
the within-subjects fixed-effect factors and group as the between-subjects factor and subject as 513
the random-effect factor. To correct for multiple comparisons, we used family-wise errors (FWE) 514
correction determined by Monte Carlo simulation using the AFNI 3dClustSim version (16.3.05, 515
October 2016) program. Results are shown at p<0.05 whole brain FWE corrected with an initial 516
p threshold of p<0.001, as described previously (16). 517

ACKNOWLEDGEMENTS 518 519 Author contributions: 520 Drs. Hwang and Sherwin had full access to all of the data in the study and take responsibility for 521 the integrity of the data and the accuracy of the data analysis. 522 Study concept and design: Hwang, Seo, Constable, Sinha, Sherwin 523 Acquisition of data: Hwang, Parikh, Seo, Schmidt, Hamza, Lam, Belfort DeAguiar 524 Analysis and interpretation of data: all authors 525 Writing of manuscript: all authors 526 Statistical analysis: Lacadie, Hwang, Dai, Lam, Hamza 527 528 529 Funding and Support: This study was supported in part by grants from the NIH R01DK020495 530 and P30 DK045735 (Sherwin), K23DK109284 (Hwang), K08AA023545 (Seo), the Yale Center 531 for Clinical Investigation supported by the Clinical Translational Science Award (UL1 532 RR024139). 533 534 Role of the sponsors: The funding agencies had no role in the design and conduct of the 535 study; collection, management, analysis, and interpretation of the data; or the preparation, 536 review, or approval of the manuscript. 537 538 We gratefully acknowledge the help of the Yale Core lab staff: Mikhail Smolgovsky, Irene 539 Chernyak, Ralph Jacob, Doreen Nemeth, Maria Batsu, Codruta Todeasa as well as the Yale 540 HRU nurses and staff: Joanne Caprio-Adams, Gina Solomon, Anne O’Connor, Catherine 541 Parmelee, Mary Scanlon, Lynda Knaggs, Carmen Galarza, Elizabeth O’Neal, Joyce Russell, 542 Gayle Pietrogallo, Cynthia Smith. 543 544
545
546
547
1. Group DP. Incidence and trends of childhood Type 1 diabetes worldwide 1990-1999. 548 Diabet Med. 2006;23(8):857-66. 549
2. Cryer PE. Banting Lecture. Hypoglycemia: the limiting factor in the management of 550 IDDM. Diabetes. 1994;43(11):1378-89. 551
3. Sherwin RS. Bringing light to the dark side of insulin: a journey across the blood-brain 552 barrier. Diabetes. 2008;57(9):2259-68. 553
4. Page KA, et al. Small decrements in systemic glucose provoke increases in 554 hypothalamic blood flow prior to the release of counterregulatory hormones. Diabetes. 555 2009;58(2):448-52. 556
5. Page KA, et al. Circulating glucose levels modulate neural control of desire for high-557 calorie foods in humans. J Clin Invest. 2011;121(10):4161-9. 558
6. Gerich JE, et al. Lack of glucagon response to hypoglycemia in diabetes: evidence for 559 an intrinsic pancreatic alpha cell defect. Science. 1973;182(4108):171-3. 560
7. Bolli G, et al. Abnormal glucose counterregulation in insulin-dependent diabetes mellitus. 561 Interaction of anti-insulin antibodies and impaired glucagon and epinephrine secretion. 562 Diabetes. 1983;32(2):134-41. 563
8. Hirsch BR, and Shamoon H. Defective epinephrine and growth hormone responses in 564 type I diabetes are stimulus specific. Diabetes. 1987;36(1):20-6. 565
9. Cryer PE, et al. Hypoglycemia. Diabetes Care. 1994;17(7):734-55. 566 10. White NH, et al. Identification of type I diabetic patients at increased risk for 567
hypoglycemia during intensive therapy. N Engl J Med. 1983;308(9):485-91. 568 11. Bolo NR, et al. Functional Connectivity of Insula, Basal Ganglia, and Prefrontal 569
Executive Control Networks during Hypoglycemia in Type 1 Diabetes. J Neurosci. 570 2015;35(31):11012-23. 571
12. Dunn JT, et al. Attenuation of amydgala and frontal cortical responses to low blood 572 glucose concentration in asymptomatic hypoglycemia in type 1 diabetes: a new player in 573 hypoglycemia unawareness? Diabetes. 2007;56(11):2766-73. 574
13. Suda S, et al. The lumped constant of the deoxyglucose method in hypoglycemia: 575 effects of moderate hypoglycemia on local cerebral glucose utilization in the rat. J Cereb 576 Blood Flow Metab. 1990;10(4):499-509. 577
14. Clarke WL, et al. Reduced awareness of hypoglycemia in adults with IDDM. A 578 prospective study of hypoglycemic frequency and associated symptoms. Diabetes Care. 579 1995;18(4):517-22. 580
15. Deary IJ, et al. Partitioning the symptoms of hypoglycaemia using multi-sample 581 confirmatory factor analysis. Diabetologia. 1993;36(8):771-7. 582
16. Cox RW, et al. FMRI Clustering in AFNI: False-Positive Rates Redux. Brain Connect. 583 2017;7(3):152-71. 584
17. Grahn JA, et al. The role of the basal ganglia in learning and memory: 585 neuropsychological studies. Behav Brain Res. 2009;199(1):53-60. 586
18. Grahn JA, et al. The cognitive functions of the caudate nucleus. Prog Neurobiol. 587 2008;86(3):141-55. 588
19. Yin HH, et al. Blockade of NMDA receptors in the dorsomedial striatum prevents action-589 outcome learning in instrumental conditioning. Eur J Neurosci. 2005;22(2):505-12. 590
20. Yin HH, et al. Lesions of dorsolateral striatum preserve outcome expectancy but disrupt 591 habit formation in instrumental learning. Eur J Neurosci. 2004;19(1):181-9. 592
21. Tricomi EM, et al. Modulation of caudate activity by action contingency. Neuron. 593 2004;41(2):281-92. 594
22. Lehericy S, et al. Diffusion tensor fiber tracking shows distinct corticostriatal circuits in 595 humans. Ann Neurol. 2004;55(4):522-9. 596
23. Alexander GE, et al. Parallel organization of functionally segregated circuits linking basal 597 ganglia and cortex. Annu Rev Neurosci. 1986;9(357-81. 598

24. Teh MM, et al. Evolution and resolution of human brain perfusion responses to the 599 stress of induced hypoglycemia. Neuroimage. 2010;53(2):584-92. 600
25. Musen G, et al. Regional brain activation during hypoglycemia in type 1 diabetes. J Clin 601 Endocrinol Metab. 2008;93(4):1450-7. 602
26. Sakurai Y. [Brodmann Areas 39 and 40: Human Parietal Association Area and Higher 603 Cortical Function]. Brain Nerve. 2017;69(4):461-9. 604
27. Ptak R, and Schnider A. The attention network of the human brain: relating structural 605 damage associated with spatial neglect to functional imaging correlates of spatial 606 attention. Neuropsychologia. 2011;49(11):3063-70. 607
28. Ptak R. The frontoparietal attention network of the human brain: action, saliency, and a 608 priority map of the environment. Neuroscientist. 2012;18(5):502-15. 609
29. Jung RE, and Haier RJ. The Parieto-Frontal Integration Theory (P-FIT) of intelligence: 610 converging neuroimaging evidence. Behav Brain Sci. 2007;30(2):135-54; discussion 54-611 87. 612
30. Corbetta M, and Shulman GL. Human cortical mechanisms of visual attention during 613 orienting and search. Philos Trans R Soc Lond B Biol Sci. 1998;353(1373):1353-62. 614
31. Corbetta M. Frontoparietal cortical networks for directing attention and the eye to visual 615 locations: identical, independent, or overlapping neural systems? Proc Natl Acad Sci U S 616 A. 1998;95(3):831-8. 617
32. Gottlieb J. From thought to action: the parietal cortex as a bridge between perception, 618 action, and cognition. Neuron. 2007;53(1):9-16. 619
33. Singh-Curry V, and Husain M. The functional role of the inferior parietal lobe in the 620 dorsal and ventral stream dichotomy. Neuropsychologia. 2009;47(6):1434-48. 621
34. Rosenthal JM, et al. The effect of acute hypoglycemia on brain function and activation: a 622 functional magnetic resonance imaging study. Diabetes. 2001;50(7):1618-26. 623
35. Jeong SK, and Xu Y. The impact of top-down spatial attention on laterality and 624 hemispheric asymmetry in the human parietal cortex. J Vis. 2016;16(10):2. 625
36. Grill V, et al. Cerebral blood flow and substrate utilization in insulin-treated diabetic 626 subjects. Am J Physiol. 1990;258(5 Pt 1):E813-20. 627
37. Gulanski BI, et al. Increased brain transport and metabolism of acetate in hypoglycemia 628 unawareness. J Clin Endocrinol Metab. 2013;98(9):3811-20. 629
38. Mangia S, et al. Hypoglycemia-induced increases in thalamic cerebral blood flow are 630 blunted in subjects with type 1 diabetes and hypoglycemia unawareness. J Cereb Blood 631 Flow Metab. 2012;32(11):2084-90. 632
39. Wiegers EC, et al. Cerebral blood flow response to hypoglycemia is altered in patients 633 with type 1 diabetes and impaired awareness of hypoglycemia. J Cereb Blood Flow 634 Metab. 2017;37(6):1994-2001. 635
40. Simpson IA, et al. Blood-brain barrier glucose transporter: effects of hypo- and 636 hyperglycemia revisited. J Neurochem. 1999;72(1):238-47. 637
41. Kumagai AK, et al. Upregulation of blood-brain barrier GLUT1 glucose transporter 638 protein and mRNA in experimental chronic hypoglycemia. Diabetes. 1995;44(12):1399-639 404. 640
42. Bolo NR, et al. Brain activation during working memory is altered in patients with type 1 641 diabetes during hypoglycemia. Diabetes. 2011;60(12):3256-64. 642
43. van de Ven KC, et al. Steady-state brain glucose concentrations during hypoglycemia in 643 healthy humans and patients with type 1 diabetes. Diabetes. 2012;61(8):1974-7. 644
44. Dagogo-Jack S, et al. Durable reversal of hypoglycemia unawareness in type 1 645 diabetes. Diabetes Care. 1999;22(5):866-7. 646
45. Dagogo-Jack S, et al. Reversal of hypoglycemia unawareness, but not defective glucose 647 counterregulation, in IDDM. Diabetes. 1994;43(12):1426-34. 648

46. Fanelli C, et al. Long-term recovery from unawareness, deficient counterregulation and 649 lack of cognitive dysfunction during hypoglycaemia, following institution of rational, 650 intensive insulin therapy in IDDM. Diabetologia. 1994;37(12):1265-76. 651
47. Belfort-DeAguiar R, et al. Food image-induced brain activation is not diminished by 652 insulin infusion. Int J Obes (Lond). 2016;40(11):1679-86. 653
48. Rushworth MF, et al. Frontal cortex and reward-guided learning and decision-making. 654 Neuron. 2011;70(6):1054-69. 655
49. Schoenbaum G, et al. A new perspective on the role of the orbitofrontal cortex in 656 adaptive behaviour. Nat Rev Neurosci. 2009;10(12):885-92. 657
50. Hirose S, et al. Lateral-Medial Dissociation in Orbitofrontal Cortex-Hypothalamus 658 Connectivity. Front Hum Neurosci. 2016;10(244. 659
51. Barbas H. Flow of information for emotions through temporal and orbitofrontal pathways. 660 J Anat. 2007;211(2):237-49. 661
52. Rolls ET, and Baylis LL. Gustatory, olfactory, and visual convergence within the primate 662 orbitofrontal cortex. J Neurosci. 1994;14(9):5437-52. 663
53. Rolls ET, et al. Representations of the texture of food in the primate orbitofrontal cortex: 664 neurons responding to viscosity, grittiness, and capsaicin. J Neurophysiol. 665 2003;90(6):3711-24. 666
54. O'Doherty J, et al. Sensory-specific satiety-related olfactory activation of the human 667 orbitofrontal cortex. Neuroreport. 2000;11(4):893-7. 668
55. Ortiz-Alonso FJ, et al. Hypoglycemia counterregulation in elderly humans: relationship to 669 glucose levels. Am J Physiol. 1994;267(4 Pt 1):E497-506. 670
56. Meneilly GS, et al. Counterregulatory responses to insulin-induced glucose reduction in 671 the elderly. J Clin Endocrinol Metab. 1985;61(1):178-82. 672
57. Nunley KA, et al. White matter hyperintensities in middle-aged adults with childhood-673 onset type 1 diabetes. Neurology. 2015;84(20):2062-9. 674
58. Biessels GJ, and Reijmer YD. Brain changes underlying cognitive dysfunction in 675 diabetes: what can we learn from MRI? Diabetes. 2014;63(7):2244-52. 676
59. Brands AM, et al. Cognitive performance, psychological well-being, and brain magnetic 677 resonance imaging in older patients with type 1 diabetes. Diabetes. 2006;55(6):1800-6. 678
60. Simmons JP, et al. False-positive psychology: undisclosed flexibility in data collection 679 and analysis allows presenting anything as significant. Psychol Sci. 2011;22(11):1359-680 66. 681
61. Gold AE, et al. Frequency of severe hypoglycemia in patients with type I diabetes with 682 impaired awareness of hypoglycemia. Diabetes Care. 1994;17(7):697-703. 683
62. Li X, et al. The first step for neuroimaging data analysis: DICOM to NIfTI conversion. J 684 Neurosci Methods. 2016;264(47-56. 685
63. Friedman L, et al. Reducing interscanner variability of activation in a multicenter fMRI 686 study: controlling for signal-to-fluctuation-noise-ratio (SFNR) differences. Neuroimage. 687 2006;33(2):471-81. 688
689

Table 1. Participant Characteristics
Groups P-value
HC T1DM Aware T1DM Unaware ANOVA HC vs Aware
Aware vs Unaware
Demographics
N (M/F) 13 (6/7) 16 (5/11) 13 (6/7) 0.633 -- --
Age (y) 33±11 30±8 40±12 0.033 0.366 0.01
Education (y) 17±3 18±3 16±3 0.507 -- --
BMI (kg/m2) 24.1±2.9 23.2±3.4 26.8±2.9 0.010 0.475 0.003
HbA1c (%) 5.02±0.29 6.99±0.77 6.88±0.61 <.001 <.001 0.61
Duration Diabetes (y) -- 11.8±8.9 25.3±7.8 -- -- <0.001 C-peptide (ng/ml) 1.49±1.01 0.25±0.35 0.12±0.08 <.001 <.001 0.56 Severe hypoglycemic episodes past yr (n) -- 0.06±0.06 0.9±0.4 -- -- 0.031 Hypoglycemia Awareness Scores
Clarke* (# R) -- 0.8 ± 0.9 5 ± 1 -- -- <.001
Gold -- 2.4 ± 0.8 4.5 ± 1.2 -- -- <.001
Behavioral Assessment
Eating Behavior Inventory 69±6 74±10 71±10 0.287 -- --
Eating Disorder Examination Questionnaire 1.01±1.1 0.92±0.79 1.32±0.99 0.548 -- --
Montreal Cognitive Assessment 28±2 27.69±1.58 26.2±2.3 0.088 -- -- * Clarke score, ≤ 2R = Hypoglycemia aware; ≥4 R = Hypoglycemia unaware Data presented as mean±SEM

Figure 1. Study design. A) Schematic representation of two-step hyperinsulinemic euglycemic-hypoglycemia clamp during fMRI BOLD scanning in response to visual cues; B) Plasma glucose levels of Healthy Control (n = 13), T1DM Aware (n = 16), and T1DM Unaware (n = 13) during the study. Data presented as Mean±SEM Statistical comparisons were performed using mixed model linear regression adjusting for age, gender and BMI.

Figure 2. Hormonal responses to mild hypoglycemia in Healthy Control (n = 13), T1DM Aware (n = 16), and T1DM Unaware (n = 13) during the study. A) Epinephrine; B) Norepinephrine; C) Glucagon; D) Cortisol. Open bars denote euglycemia, black bars denote hypoglycemia. Euglycemia values were averaged from time 45-60 minutes of clamp. Hypoglycemia values were averaged from time 90-105 min of clamp. Data presented as Mean±SEM, paired samples T-test, * P < 0.05.
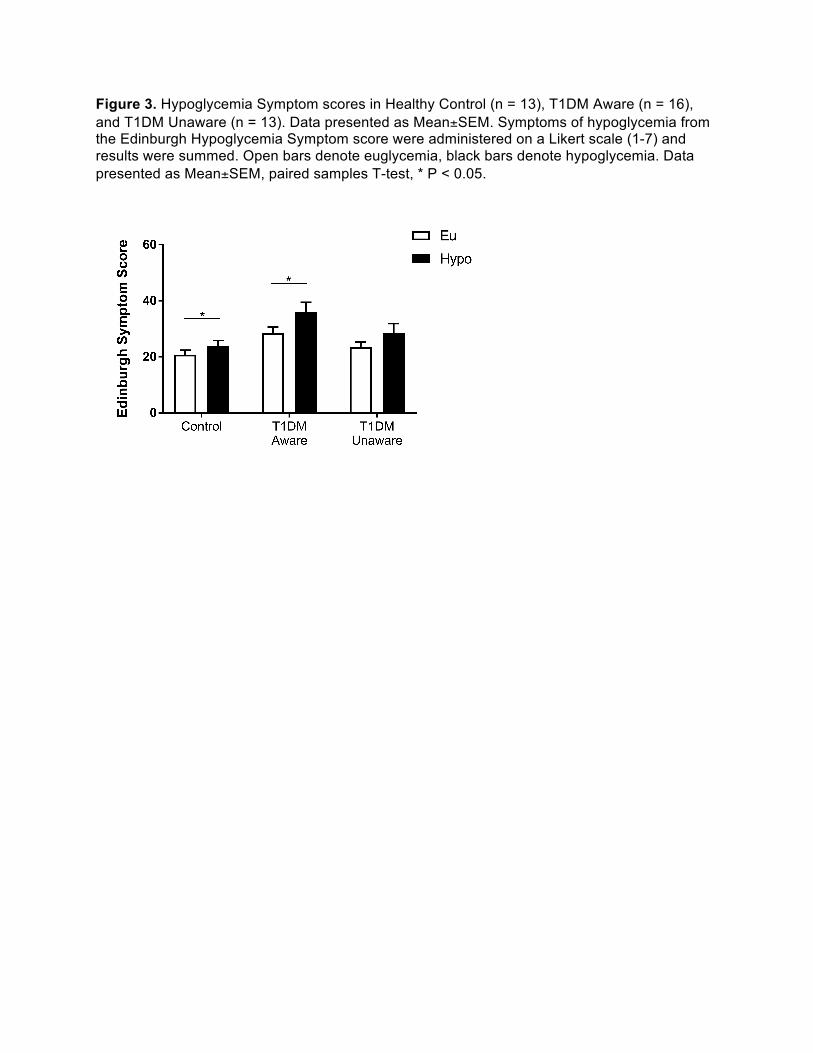
Figure 3. Hypoglycemia Symptom scores in Healthy Control (n = 13), T1DM Aware (n = 16), and T1DM Unaware (n = 13). Data presented as Mean±SEM. Symptoms of hypoglycemia from the Edinburgh Hypoglycemia Symptom score were administered on a Likert scale (1-7) and results were summed. Open bars denote euglycemia, black bars denote hypoglycemia. Data presented as Mean±SEM, paired samples T-test, * P < 0.05.

Figure 4. Group X Glycemia effects. A) Axial slices showing the differences in brain responses to mild hypoglycemia compared to euglycemia across all three groups (covaried for age and BMI, threshold of P < 0.001, 2-tailed, FWE whole brain corrected); B) Region of interest identified from significant cluster in right striatum (caudate). General linear model β-weights extracted from each participant, presented as mean (95% CI). (Healthy Control (n = 13), T1DM Aware (n = 16), T1DM Unaware (n = 13)).

Figure 5. Differences in regional brain responses between mild hypoglycemia and euglycemia conditions. Axial slices of healthy control (n = 13), T1DM-Aware (n = 16) and T1DM-Unaware (n = 13) subjects showing differences in brain responses to mild hypoglycemia (Hypo-Eu) (covaried by age and BMI , threshold of P < 0.001, 2-tailed, FWE whole brain corrected). Regions identified as A=ventromedial prefrontal cortex (vmPFC); B = Orbitofrontal cortex (OFC); C = right ventral striatum/caudate; D = right insula; E = ventrolateral prefrontal cortex (vlPFC); F = dorsolateral prefrontal cortex (dlPFC); G = angular gyrus.

Figure 6. Brain responses to high calorie food cues. Axial brain slices (z = -17) of change in brain response to mild hypoglycemia (Hypo – Eu) while viewing high calorie food cues and non-food cues in A) T1DM-Aware (n = 16) and B) T1DM-Unaware (n = 13) participants (covaried by age, duration of DM, and BMI, threshold of P < 0.001, 2-tailed, FWE whole brain corrected). Data presented as mean (95% CI)

Supplemental Figure 1. Diagram showing the flow of participants through the study
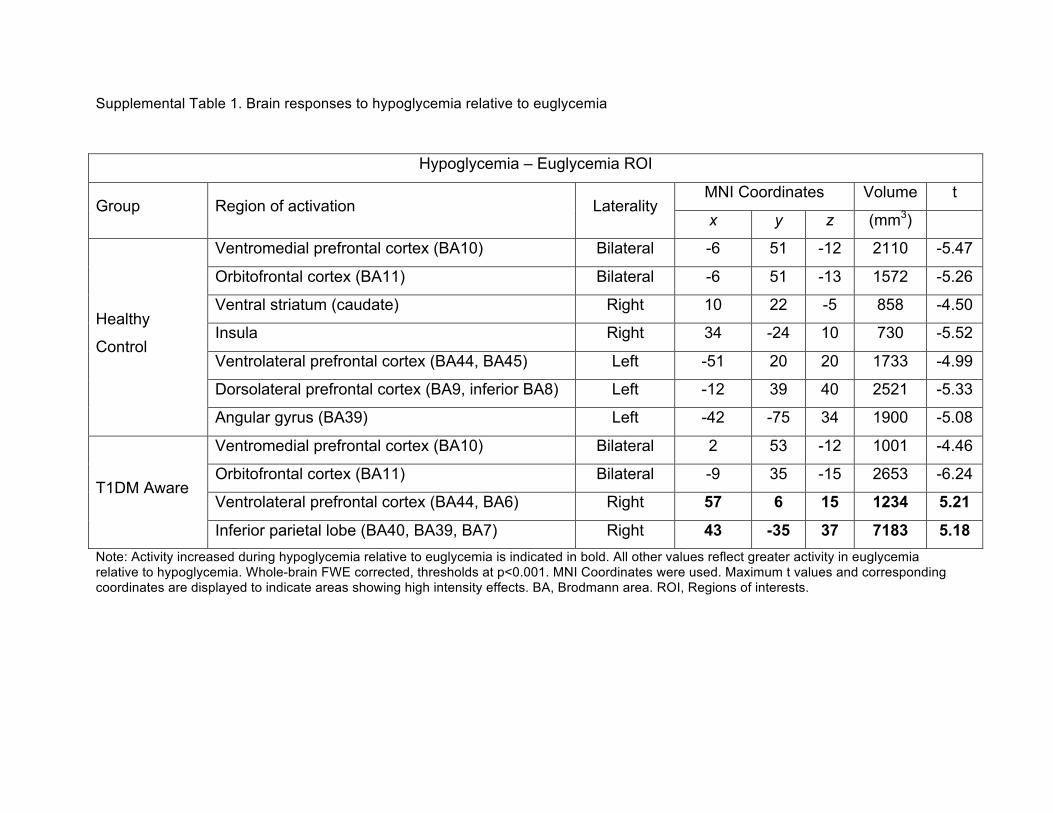
Supplemental Table 1. Brain responses to hypoglycemia relative to euglycemia
Note: Activity increased during hypoglycemia relative to euglycemia is indicated in bold. All other values reflect greater activity in euglycemia relative to hypoglycemia. Whole-brain FWE corrected, thresholds at p<0.001. MNI Coordinates were used. Maximum t values and corresponding coordinates are displayed to indicate areas showing high intensity effects. BA, Brodmann area. ROI, Regions of interests.
Hypoglycemia – Euglycemia ROI
Group Region of activation Laterality MNI Coordinates Volume t
x y z (mm3)
Healthy
Control
Ventromedial prefrontal cortex (BA10) Bilateral -6 51 -12 2110 -5.47
Orbitofrontal cortex (BA11) Bilateral -6 51 -13 1572 -5.26
Ventral striatum (caudate) Right 10 22 -5 858 -4.50
Insula Right 34 -24 10 730 -5.52
Ventrolateral prefrontal cortex (BA44, BA45) Left -51 20 20 1733 -4.99
Dorsolateral prefrontal cortex (BA9, inferior BA8) Left -12 39 40 2521 -5.33
Angular gyrus (BA39) Left -42 -75 34 1900 -5.08
T1DM Aware
Ventromedial prefrontal cortex (BA10) Bilateral 2 53 -12 1001 -4.46
Orbitofrontal cortex (BA11) Bilateral -9 35 -15 2653 -6.24
Ventrolateral prefrontal cortex (BA44, BA6) Right 57 6 15 1234 5.21
Inferior parietal lobe (BA40, BA39, BA7) Right 43 -35 37 7183 5.18

![Hypoglycemia and Diabetes · hypoglycemia, including severe hypoglycemia, occur in people with type 2 diabetes.[25] There is no doubt that hypoglycemia can be fatal.[26] In addition](https://img.pdfslide.us/doc/110x75/5f0518c07e708231d4113f09/hypoglycemia-and-hypoglycemia-including-severe-hypoglycemia-occur-in-people-with.jpg)