Embed Size (px)
Citation preview
Published on February 1, 2018
Hypo Investor Update2017Debt Investor Presentation

Secure Way for Better Living

Hypo Group Overview
Founded in 1860 The oldest private credit
institution in Finland Retail banking, no corporate lending Supervised by the FIN-FSA Specialized in mortgage financing Residential property always as
collateral Mutual company governed by the
member customers All returns are kept within Hypo
Strong loan book (NPLs 0.14%) Established and regular issuer in
Finland Total assets EUR 2.8 billion S&P issuer rating ‘BBB/A-2’ (st.) S&P covered bond rating ‘AAA’ (st.)
3
The Mortgage Society of Finland
1860
Deposittaking Bank
2002
Office Building
1912
Pension FundA + M Departments
100% 54.6%

4
Anchor Rating for Finnish Commercial Banks a-1. Hypo business position
• Small-sized bank, concentrated niche market position• Prudent approach in risk management, restricted operations providing stability
-2
2. Hypo capital and earnings• Very strong capitalization• Strong asset quality and exceptional loan loss track record.• Mutual business model: retained earnings fully used for capital build-up
+2
3. Hypo risk position• Moderate risk position due to concentration in risks• Partly mitigated by conservative underwriting standards, prudent risk
management and outstanding loan-loss track record
-1
4. Hypo liquidity and funding• Well matched funding profile• High loan-to-deposit ratio
-1
Hypo Credit Rating BBB (st.)
S&P Issuer Credit Rating of Hypo: ’BBB/A-2’ (st.)

Hypo – Leading the Debate on Finnish Mortgage Market

Financial Results

Group Balance Sheet EUR 2.8 billion
7
ECB
Deposits
Equity
1 2201 500
1 9592 305
2 792
2013 2014 2015 2016 2017
Hypo Group Balance Sheet Total 2013-2017EUR million
79 %
17 %
1 % 2 %1 %
Assets
Customerloans
Liquidity
Interbankreceivables
Housing andland property
Other
55 %
7 %
24 %
5 %3 %2 %4 %
Liabilities and Equity
Deposits
Senior unsecured
Covered bonds
CDs
Subordinated
Credit institutions
Other
Equity
2 213
420
285 61
Revenue Generating Assets(m€), On and Off Balance Sheet
Loan portfolio
Residential LandUnder Management
Liquidityinvestments (ex.cash)
Housing and Landproperty

Solid Capital Basel III Standard Approach
Mutual company: all profits retained and added to the core capital
Common Equity Tier 1 12.7% S&P’s Risk Adjusted Capital 17.6% on
30.6.2017 Markedly higher than Finnish peers
applying internal methods EUR 18.2 million of excess capital after
8.0% Regulatory TC requirement 2.5% Capital Conservation Buffer
EUR 5.6 million of hidden reserves in housing property (not marked-to-market) and EUR 6.4 million of surplus in Pension Fund Inclusion into CET1 would raise the ratio to
13.8% Basel III standardized approach risk weights
Lending with residential collateral: 35% risk weight
Housing and land investments: 100% risk weight
8
106
12,7
1,5
3,5
5,5
7,5
9,5
11,5
13,5
15,5
17,5
0
20
40
60
80
100
120
2013 2014 2015 2016 2017
CET
1 C
apita
l in
EUR
, mill
ion
%Capital Ratios 2013-2017
Surplus of own funds, m€
Capital conservation buffer, m€
Regulatory Total Capital Requirement, m€CET1, %

S&P Risk Adjusted Capital ’Very Strong’
9
26,8 26,1
23,1
19,6 19,3 18,7 18,6 18,3 18,2 17,7 17,6 17,6 17,115,5 14,7 14,6 14,5 14,0 13,8 13,4 12,8 12,6 12,6 12,5
11,2 11,1 10,5 10,2 9,9
0
5
10
15
20
25
30
S&P's Nordic RAC Ratios 30.6.2017
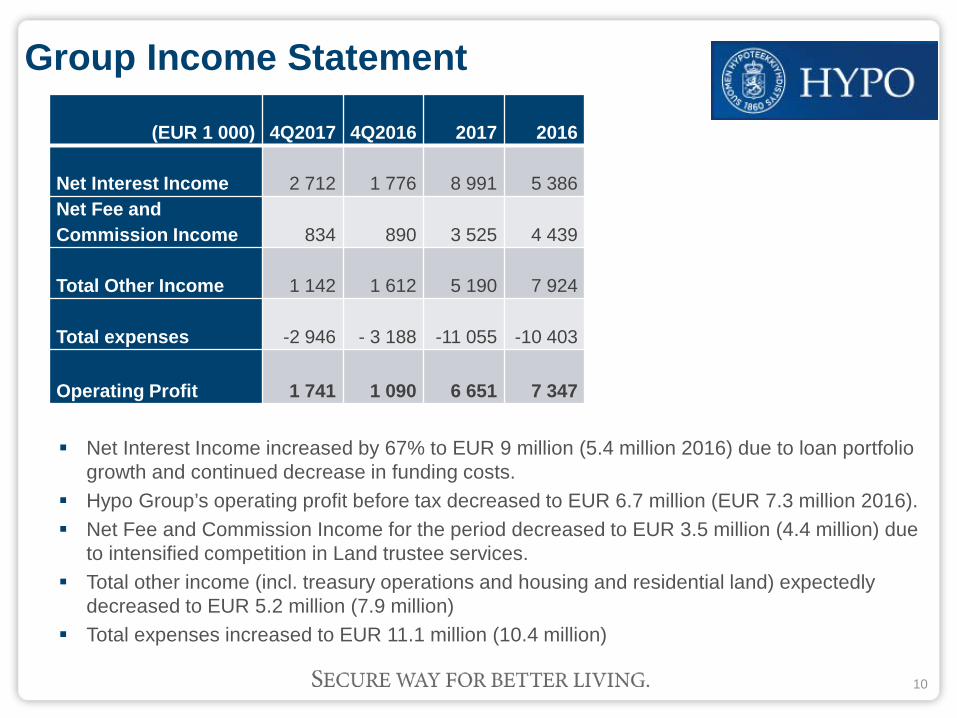
Group Income Statement
Net Interest Income increased by 67% to EUR 9 million (5.4 million 2016) due to loan portfolio growth and continued decrease in funding costs.
Hypo Group’s operating profit before tax decreased to EUR 6.7 million (EUR 7.3 million 2016). Net Fee and Commission Income for the period decreased to EUR 3.5 million (4.4 million) due
to intensified competition in Land trustee services. Total other income (incl. treasury operations and housing and residential land) expectedly
decreased to EUR 5.2 million (7.9 million) Total expenses increased to EUR 11.1 million (10.4 million)
10
(EUR 1 000) 4Q2017 4Q2016 2017 2016
Net Interest Income 2 712 1 776 8 991 5 386Net Fee and Commission Income 834 890 3 525 4 439
Total Other Income 1 142 1 612 5 190 7 924
Total expenses -2 946 - 3 188 -11 055 -10 403
Operating Profit 1 741 1 090 6 651 7 347
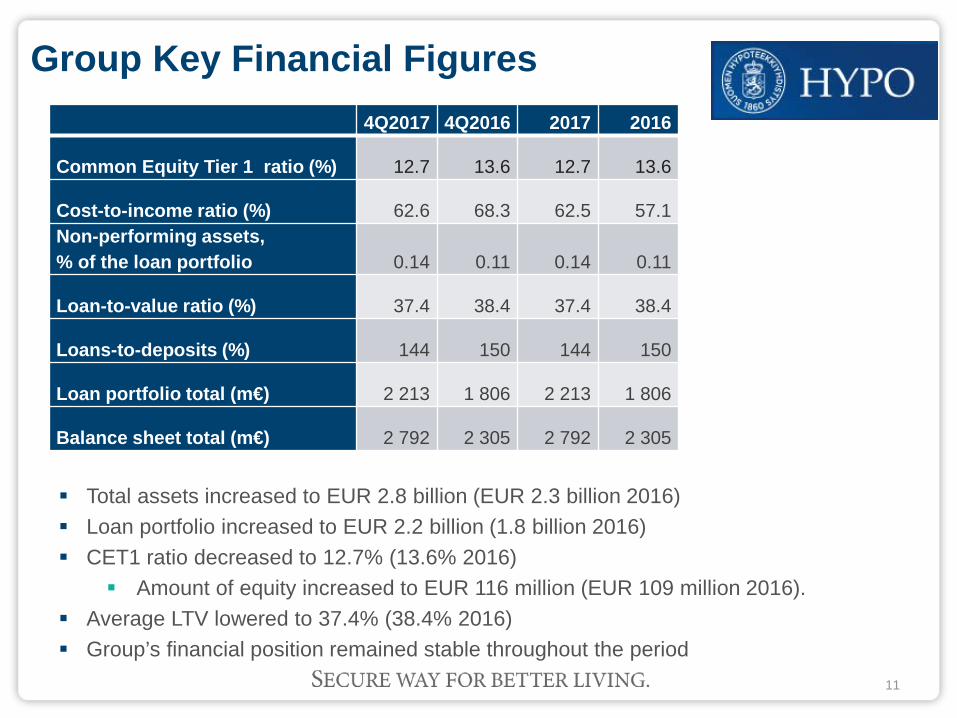
Group Key Financial Figures
Total assets increased to EUR 2.8 billion (EUR 2.3 billion 2016) Loan portfolio increased to EUR 2.2 billion (1.8 billion 2016) CET1 ratio decreased to 12.7% (13.6% 2016)
Amount of equity increased to EUR 116 million (EUR 109 million 2016). Average LTV lowered to 37.4% (38.4% 2016) Group’s financial position remained stable throughout the period
11
4Q2017 4Q2016 2017 2016
Common Equity Tier 1 ratio (%) 12.7 13.6 12.7 13.6
Cost-to-income ratio (%) 62.6 68.3 62.5 57.1Non-performing assets, % of the loan portfolio 0.14 0.11 0.14 0.11
Loan-to-value ratio (%) 37.4 38.4 37.4 38.4
Loans-to-deposits (%) 144 150 144 150
Loan portfolio total (m€) 2 213 1 806 2 213 1 806
Balance sheet total (m€) 2 792 2 305 2 792 2 305

Net Interest Income IncreasesDespite Low Interest Rate Environment
2017 net interest income increased to EUR 9 million (5.4 million) due to diversification of funding sources
Operating profit decreased to EUR 6.7 million (7.3 million)
Cost-to-income ratio 63% (57%)
12
1,0 %
2,0 %
3,0 %
4,0 %
5,0 %
6,0 %
7,0 %
0,01,02,03,04,05,06,07,08,0
2013 2014 2015 2016 2017
Profitability
Operating profit m€ (LHS) Return on equity, % (RHS)
5 2906 428
4 5745 386
8 991
01 0002 0003 0004 0005 0006 0007 0008 0009 000
10 000
Net Interest Income 2013-2017
36
48 51 48 50
50%
60%
70%
80%
90%
100%20
25
30
35
40
45
50
55
60
2013 2014 2015 2016 2017
Cost-to-Income Ratio (%) and Average Number of Permanent
Employees
Average number of employeesCost-to-income ratio, %

Hypo’s Loan Book
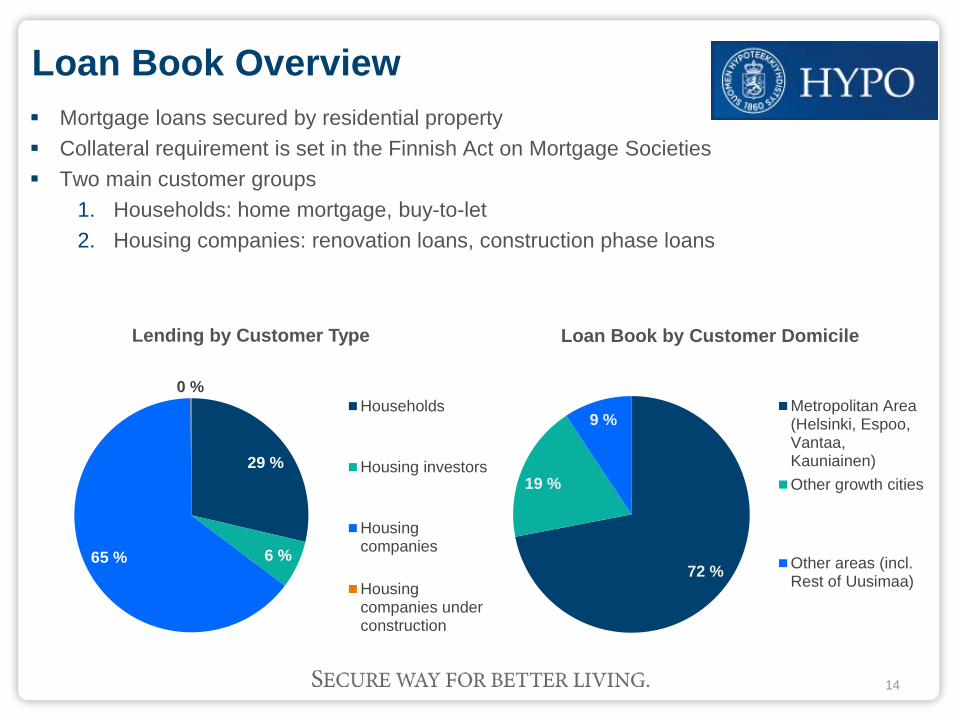
Loan Book Overview
14
Mortgage loans secured by residential property Collateral requirement is set in the Finnish Act on Mortgage Societies Two main customer groups
1. Households: home mortgage, buy-to-let2. Housing companies: renovation loans, construction phase loans
29 %
6 %65 %
0 %
Lending by Customer Type
Households
Housing investors
Housingcompanies
Housingcompanies underconstruction
72 %
19 %
9 %
Loan Book by Customer Domicile
Metropolitan Area(Helsinki, Espoo,Vantaa,Kauniainen)Other growth cities
Other areas (incl.Rest of Uusimaa)
836 978 1 078 1 204 1 309 1 421 1 649 1 806 2035 2213
275
250
500
750
1 000
1 250
1 500
1 750
2 000
2 250
2 500
H.1/2013 H.2/2013 H.1/2014 H.2/2014 H.1/2015 H.2/2015 H.1/2016 H.2/2016 H.1/2017 H.2/2017
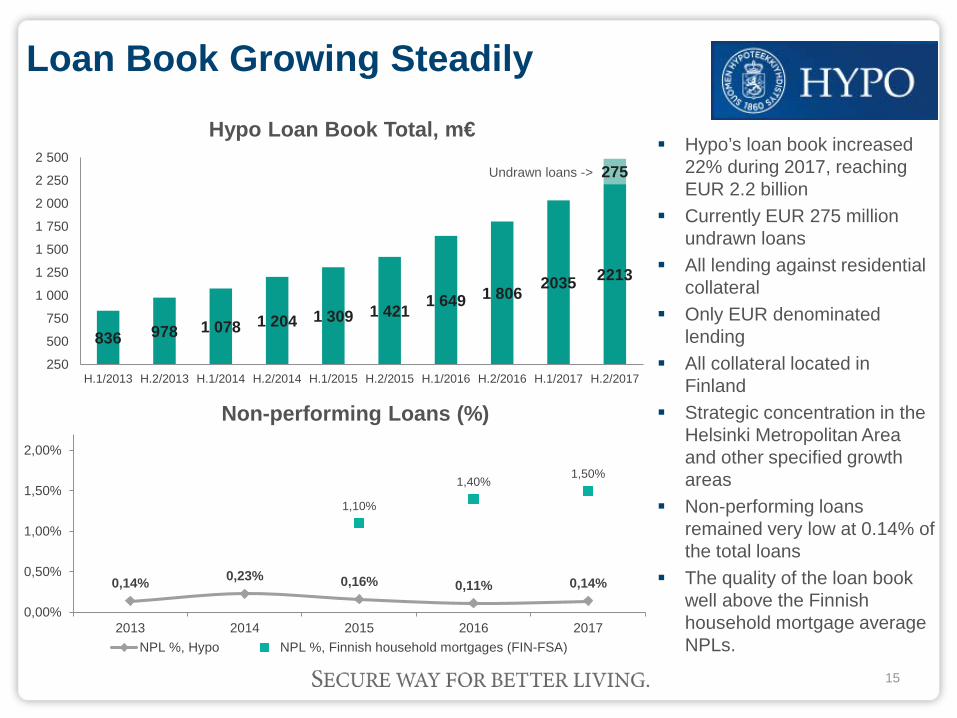
Hypo Loan Book Total, m€
Loan Book Growing Steadily
Hypo’s loan book increased22% during 2017, reachingEUR 2.2 billion
Currently EUR 275 million undrawn loans
All lending against residentialcollateral
Only EUR denominatedlending
All collateral located in Finland
Strategic concentration in the Helsinki Metropolitan Area and other specified growthareas
Non-performing loans remained very low at 0.14% of the total loans
The quality of the loan book well above the Finnish household mortgage average NPLs.
15
Undrawn loans ->
0,14% 0,23% 0,16% 0,11% 0,14%
1,10%
1,40% 1,50%
0,00%
0,50%
1,00%
1,50%
2,00%
2013 2014 2015 2016 2017
Non-performing Loans (%)
NPL %, Hypo NPL %, Finnish household mortgages (FIN-FSA)
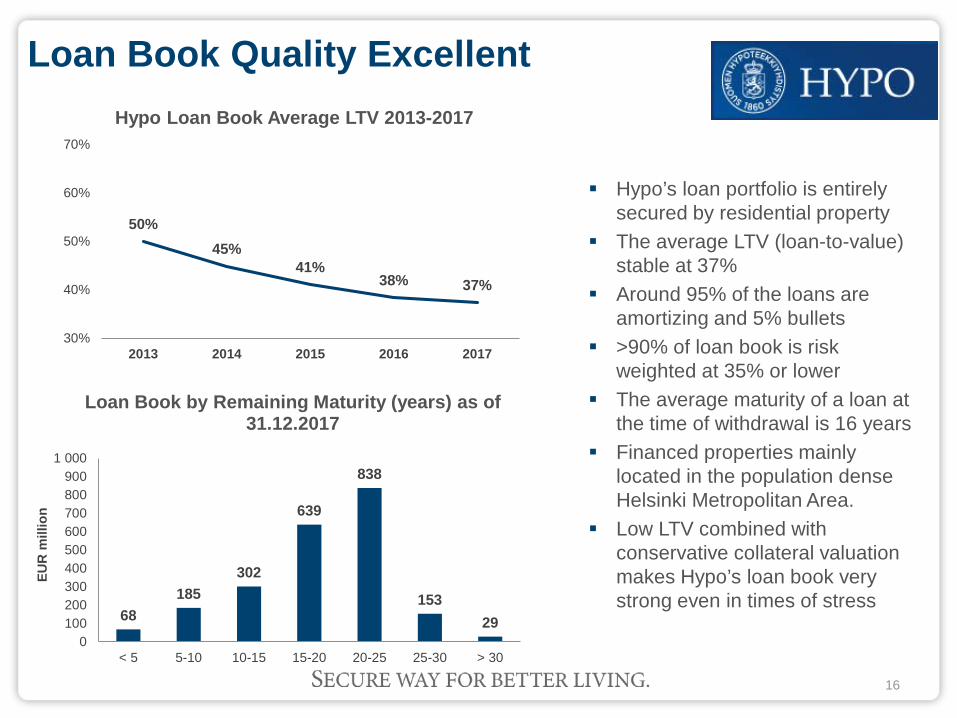
Loan Book Quality Excellent
Hypo’s loan portfolio is entirely secured by residential property
The average LTV (loan-to-value) stable at 37%
Around 95% of the loans are amortizing and 5% bullets
>90% of loan book is risk weighted at 35% or lower
The average maturity of a loan at the time of withdrawal is 16 years
Financed properties mainlylocated in the population denseHelsinki Metropolitan Area.
Low LTV combined with conservative collateral valuationmakes Hypo’s loan book verystrong even in times of stress
16
50%45%
41%38% 37%
30%
40%
50%
60%
70%
2013 2014 2015 2016 2017
Hypo Loan Book Average LTV 2013-2017
68185
302
639
838
15329
0100200300400500600700800900
1 000
< 5 5-10 10-15 15-20 20-25 25-30 > 30
EUR
mill
ion
Loan Book by Remaining Maturity (years) as of 31.12.2017

Funding and Liquidity
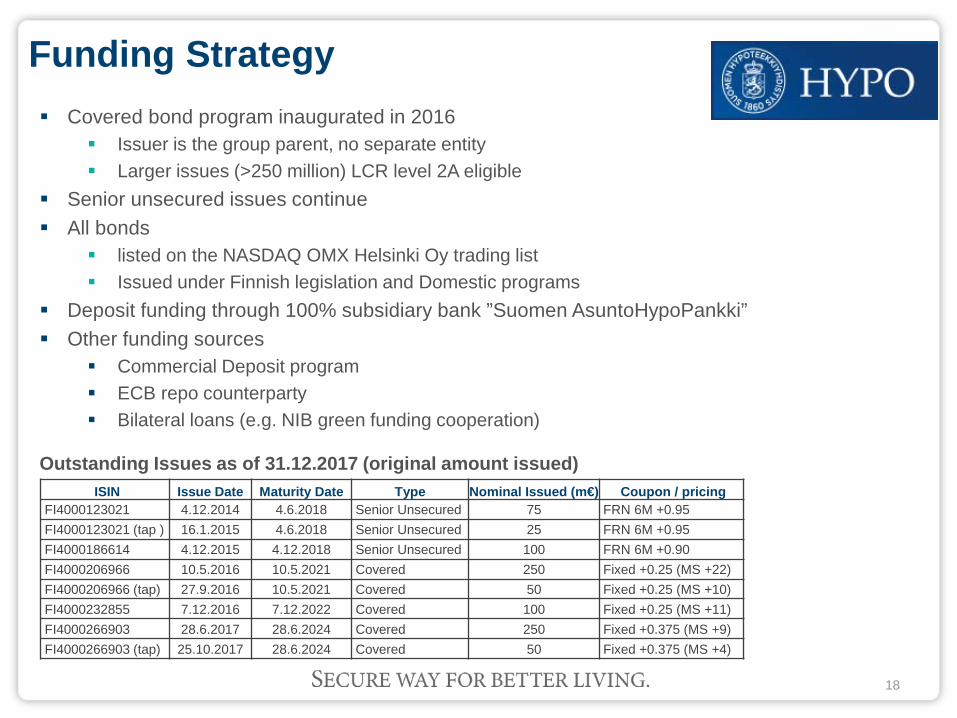
Funding Strategy Covered bond program inaugurated in 2016
Issuer is the group parent, no separate entity Larger issues (>250 million) LCR level 2A eligible
Senior unsecured issues continue All bonds
listed on the NASDAQ OMX Helsinki Oy trading list Issued under Finnish legislation and Domestic programs
Deposit funding through 100% subsidiary bank ”Suomen AsuntoHypoPankki” Other funding sources
Commercial Deposit program ECB repo counterparty Bilateral loans (e.g. NIB green funding cooperation)
18
Outstanding Issues as of 31.12.2017 (original amount issued)ISIN Issue Date Maturity Date Type Nominal Issued (m€) Coupon / pricing
FI4000123021 4.12.2014 4.6.2018 Senior Unsecured 75 FRN 6M +0.95FI4000123021 (tap ) 16.1.2015 4.6.2018 Senior Unsecured 25 FRN 6M +0.95FI4000186614 4.12.2015 4.12.2018 Senior Unsecured 100 FRN 6M +0.90FI4000206966 10.5.2016 10.5.2021 Covered 250 Fixed +0.25 (MS +22)FI4000206966 (tap) 27.9.2016 10.5.2021 Covered 50 Fixed +0.25 (MS +10)FI4000232855 7.12.2016 7.12.2022 Covered 100 Fixed +0.25 (MS +11)FI4000266903 28.6.2017 28.6.2024 Covered 250 Fixed +0.375 (MS +9)FI4000266903 (tap) 25.10.2017 28.6.2024 Covered 50 Fixed +0.375 (MS +4)

Diversified Funding Profile
19
Domestic Program for the Issuance of Senior Unsecured and Covered Bonds Deposit funding through the AsuntoHypoPankki subsidiary
~50% of total funding Domestic CD program for short term funding Possibility to participate in the ECB market operations
Deposits
Covered BondsSenior unsecured
CDsSubordinated
Other (incl. equity)
2013 2014 2015 2016 20170 %
10 %
20 %
30 %
40 %
50 %
60 %
70 %
80 %
90 %
100 %
Funding Structure 2013-2017
100 104
20
60
300
100
300
0
50
100
150
200
250
300
350
Wholesale Funding Maturity Profile

Solid LiquidityLiquidity portfolio EUR 506 million as of 31.12.2017
Equaling 18.1% of total assets Conservative investment policy
91.5% of debt securities invested in at least ‘AA-’ rated instruments 100% of debt securities are ECB repo eligible
Only EUR denominated exposure Hypo’s domestic MTN and CD programs support the liquidity LCR 148% (144% ye2016) Liquidity covers maturing wholesale funding for the following 40 months
20
56 %40 %
3 % 1 %
Liquidity Portfolio Composition
Notes and bonds eligiblefor refinancing withcentral banksCash
Receivables fromfinancial institutions
Other

Outlook for 2018

Future Outlook
“Finnish economy develops positively in 2018, which has positive repercussions on housing market and loan demand. The urbanization in Finland continues and supports the housing and mortgage markets in the biggest growth centers yet, at the same time, the decline of regions experiencing net population outflows continues. Uncertainties in the European and world economies may weaken the outlook. Following the increase in loan portfolio and net interest income, Hypo’s core business’ share of the profit for the financial period keeps growing. The operating profit for 2018 is expected to reach at least the 2017 level. Hypo concentrates on its core business operations, whereupon risk level of lending is expected to become more moderate and capital adequacy to remain almost unchanged.”

www.hypo.fi/en/investor-relations
CEO Mr Ari Pauna
Tel. +358 50 353 [email protected]
Chief Treasury and Funding Officer Mr Petteri Bollmann
Tel. +358 50 550 [email protected]
DISCLAIMERTo the extent the Information relating to The Mortgage Society of Finland (“Hypo”) or its group members (“Hypo Group”) is prepared by Hypo or another member of Hypo Group, the following limitations apply:
All official financial information of Hypo Group, including without limitation profit and loss statement, balance sheet, and annexes is available at web address www.hypo.fi/. This document is not official financial information of Hypo Group.
Opinions and statements of or concerning Hypo Group are made in good faith at the time of giving such statement and may be subject to change without notice. Investing in a financial instrument issued by Hypo may contain risks, such as (without limitation) operational and financial condition of Hypo Group and general market conditions. Changes in them may have an adverse effect on the price or value of the instrument. The investor is exposed to the risk of loosing all or part of the investment in a financial instrument issued by Hypo. Opinions or statements regarding future performance are based on assumptions that may not be realised. Past performance of Hypo Group is not a sign or a promise of future performance.
Director - Treasury, Funding and RatingMs Maiju Harava
Tel. +358 50 410 [email protected]
Chief Economist, Research Director Mr Juhana Brotherus
Tel. +358 50 384 [email protected]