Embed Size (px)
Citation preview

Hyperspectral Imaging in MWIR and On-line
Timo Hyvärinen, Hannu Holma, Mathieu Marmion and Rainer Bars
SPECIM, Spectral Imaging Ltd, Finland
www.specim.fi
Pekka Teppola and Csaba Finta
VTT Technical Research Centre of Finland
www.vtt.fi

Outline
Thermal hyperspectral imaging
MWIR (3 to 5 um) push-broom hyperspectral camera
MWIR hyperspectral imaging applications
On-line hyperspectral image processing tools

Why hyperspectral imaging in
MWIR 3-5 um?
Information which is not available in VNIR and SWIR.
Stronger spectral signatures (absorption bands).
’See through’ black pigments.
Ability to measure emitted spectral signatures.
Lower cost frame cameras than in LWIR (8 to 12 um).
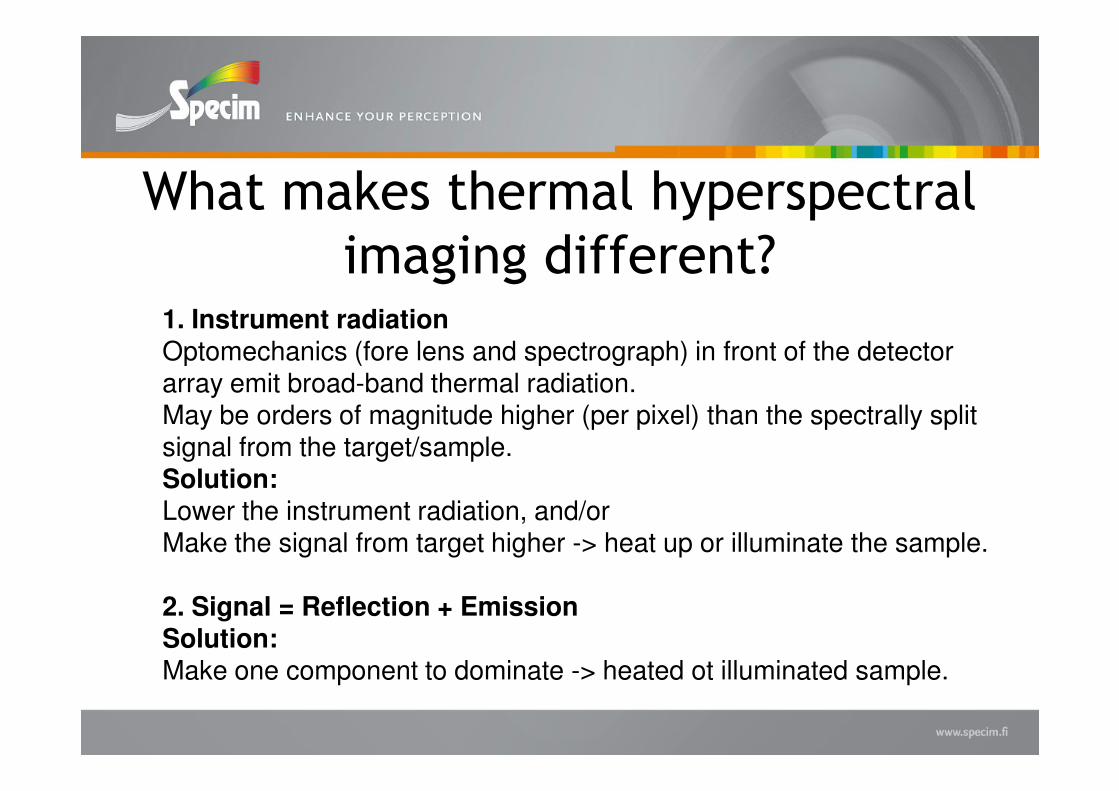
What makes thermal hyperspectral
imaging different?1. Instrument radiationOptomechanics (fore lens and spectrograph) in front of the detector array emit broad-band thermal radiation.array emit broad-band thermal radiation.May be orders of magnitude higher (per pixel) than the spectrally split signal from the target/sample.Solution:Lower the instrument radiation, and/orMake the signal from target higher -> heat up or illuminate the sample.
2. Signal = Reflection + EmissionSolution:Make one component to dominate -> heated ot illuminated sample.

MWIR Push-broom hyperspectral
cameraUncooled spectrographCryogenically cooled InSb or MCT FPA

SPECIM Thermal Hyperspectral ImagersMWIR LWIR uncooled LWIR cooled
Detector InSb, MCT, 80K Microbolometer, uncooled MCT, 55K
Spectral range 3-5.5 um 8-12 (13) um 7.6-12.5 um
# Spectral bands 120 22 (30) 100
Spectral sampling 17 nm 200 nm (mean) 48 nmSpectral sampling 17 nm 200 nm (mean) 48 nm
Spectral resolution 30 nm 400 nm 100 nm
Spatial pixels 320/640 384 384
Smile, keystone <0.2 pix <0.2 pix <0.2 pix
Image rate, max 350 Hz 60 Hz 100 Hz
Instrument temp. Ambient Ambient Stabilized
NESR@centre of range 70 mW/m2 sr um 160 mW/m2 sr um 20 mW/m2 sr um
Power consumption <50 W <4 W <200 W
Relative cost 1 0.5 4
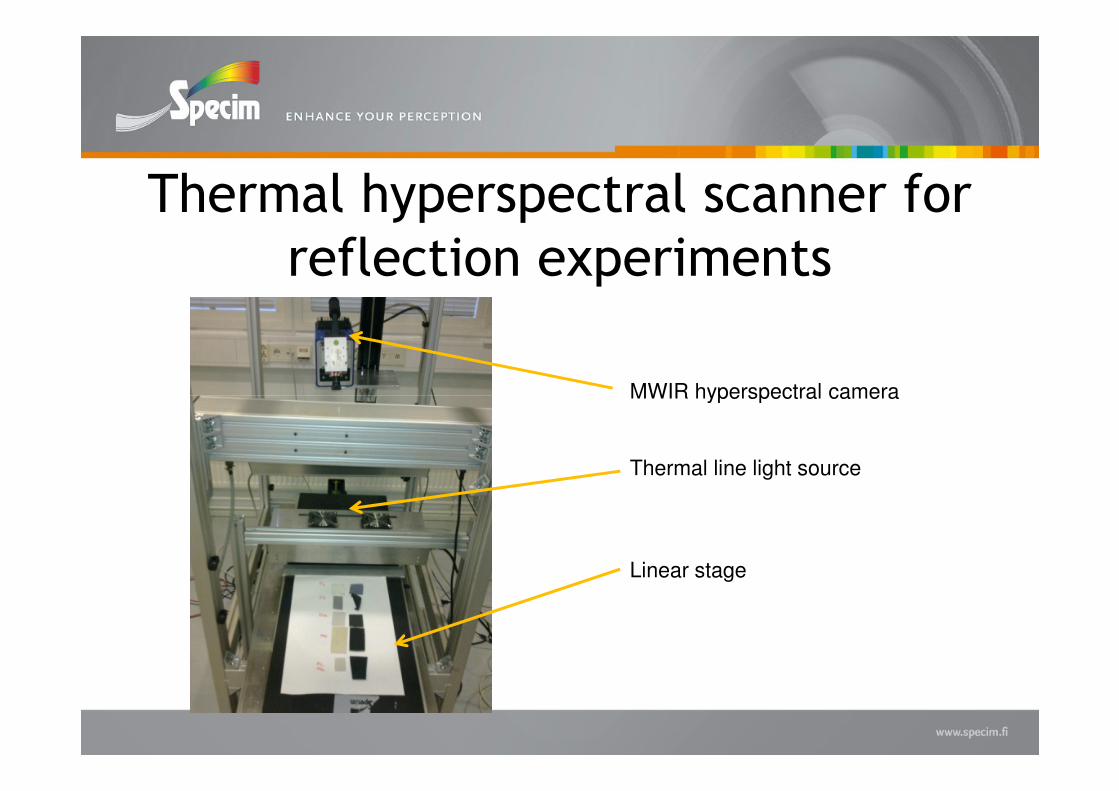
Thermal hyperspectral scanner for
reflection experiments
MWIR hyperspectral cameraMWIR hyperspectral camera
Thermal line light source
Linear stage

Industrial applications of thermal
hyperspectral imaging
Mineral mapping of geological samples, like drill cores.Fusion of SWIR and LWIR – Could MWIR replace LWIR?Fusion of SWIR and LWIR – Could MWIR replace LWIR?
Sorting of dark materials in recycling processes.
Surface inspection for minute impurities, like oil residual and oxidation on steel surface and uniformity of thin coating layers.
Temperature measurement and mapping independently of emissivity variation.

Identification of dark materials
HIPS HIPS
SWIR MWIR
HIPS HIPS
Transparent
Dark
Transparent
Dark
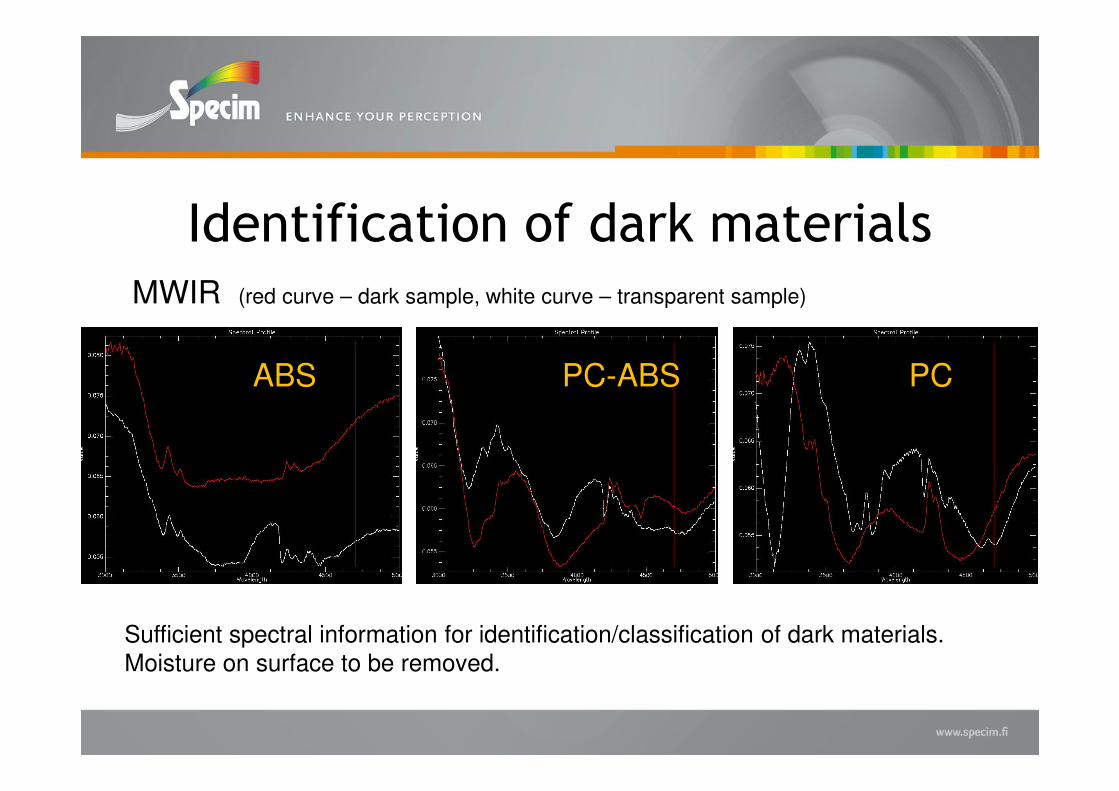
Identification of dark materials
ABS PC-ABS PC
MWIR (red curve – dark sample, white curve – transparent sample)
Sufficient spectral information for identification/classification of dark materials.
Moisture on surface to be removed.

Mineral mapping
TIR = Thermal LWIR Infrared

Mineral
mapping
Red: QuartzRed: QuartzWhite: Feldspar?

Trial project by Anglo Gold Ashanti:Average data collection rate of 1200 m of core/day
SWIR + VNIR/RGBLWIR option
Mineral mapping in the exploration
and mining field
Average data collection rate of 1200 m of core/day
Full core tray mode in SWIR, 2 mm resolution
Total of 17000 m of core was imaged in two weeks
SisuROCK Hyperspectral Core Imaging Station
Anglo Gold Ashanti, South Africa
Real-time software for hyperspectral
chemical imaging
1. CHEMOM – Chemometrics modelling tool
2. PREDICTOR – Multi-point real-time spectral acquisition 2. PREDICTOR – Multi-point real-time spectral acquisition
and analysis tool
3. IMAGER – Real-time hyperspectral image capture and
analysis tool
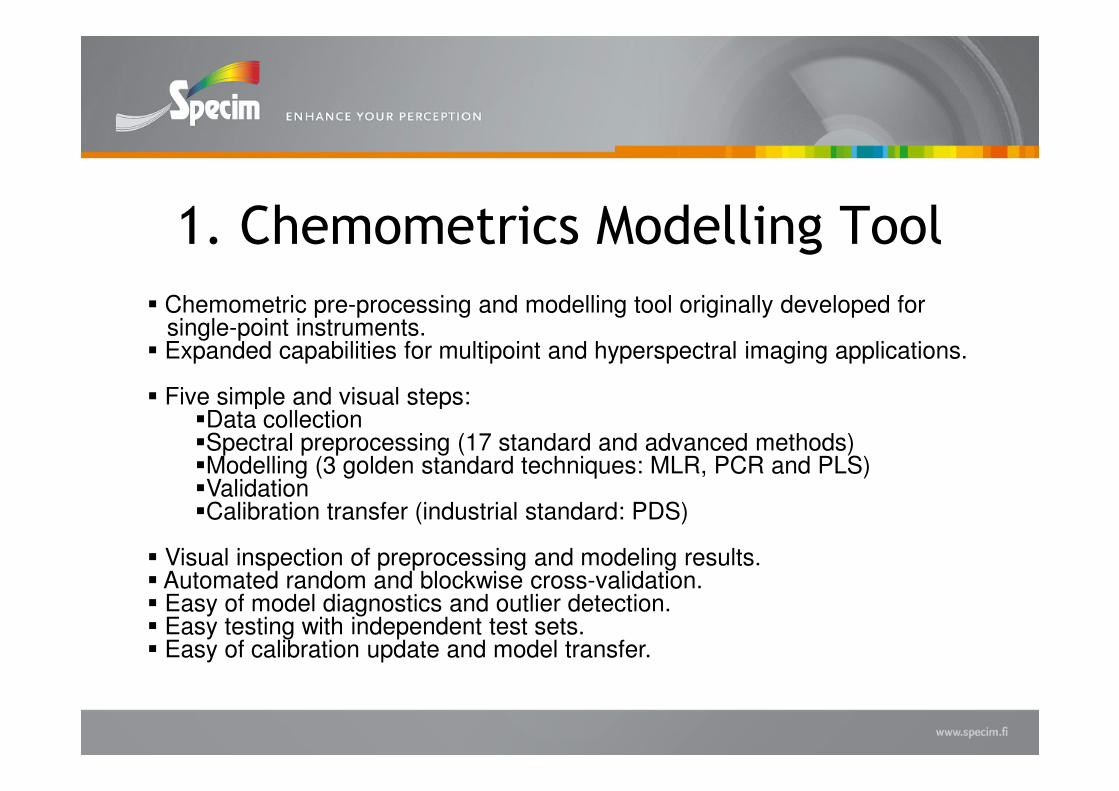
1. Chemometrics Modelling Tool
� Chemometric pre-processing and modelling tool originally developed forsingle-point instruments.
� Expanded capabilities for multipoint and hyperspectral imaging applications.
� Five simple and visual steps:� Five simple and visual steps:�Data collection�Spectral preprocessing (17 standard and advanced methods)�Modelling (3 golden standard techniques: MLR, PCR and PLS)�Validation�Calibration transfer (industrial standard: PDS)
� Visual inspection of preprocessing and modeling results.� Automated random and blockwise cross-validation.� Easy of model diagnostics and outlier detection.� Easy testing with independent test sets.� Easy of calibration update and model transfer.

2. Multi-point Real-time Spectral
Acquisition and Analysis Tool
� Camera control (integration, time, frame rate)� Shutter control� Simultaneous measurement on 20 fiber optical channels� Simultaneous measurement on 20 fiber optical channels� Entry for up to 20 different calibration files� Multiple prediction on any channel available� Prediction results displayed as actual values, average and RSD� Captured spectra (raw data) stored in binary format� Prediction results stored in ASCII file� OPC and ModBus (Ethernet) support for the prediction results� Drift (dark current) compensation� Several measurement modes (interval, burst, restart)

Multiple point spectrometer


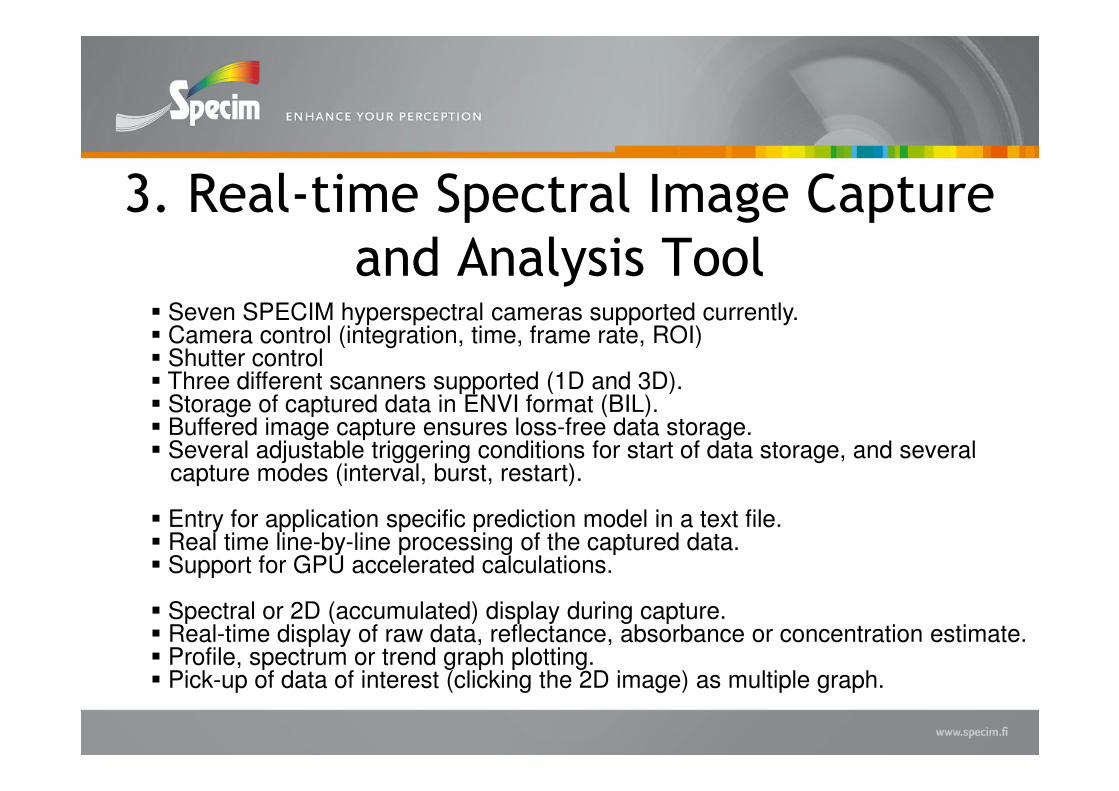
3. Real-time Spectral Image Capture
and Analysis Tool� Seven SPECIM hyperspectral cameras supported currently.� Camera control (integration, time, frame rate, ROI)� Shutter control� Three different scanners supported (1D and 3D).� Storage of captured data in ENVI format (BIL).� Storage of captured data in ENVI format (BIL).� Buffered image capture ensures loss-free data storage.� Several adjustable triggering conditions for start of data storage, and several
capture modes (interval, burst, restart).
� Entry for application specific prediction model in a text file.� Real time line-by-line processing of the captured data.� Support for GPU accelerated calculations.
� Spectral or 2D (accumulated) display during capture.� Real-time display of raw data, reflectance, absorbance or concentration estimate.� Profile, spectrum or trend graph plotting.� Pick-up of data of interest (clicking the 2D image) as multiple graph.

IMAGER demonstration
SWIR spectral camera• 320 spatial pixels• 320 spatial pixels• 240 spectral bands•100 images/s
81920 spectra/s !
GPU accelerated real-time prediction

SummaryMWIR hyperspectral imaging will make possible aplications where VNIR and SWIR do not provide the information.
Excelent SNR with high spectral Excelent SNR with high spectral resolution and image rate achievable in reflection mode.Performance limited in emission applications.
More affordable technology than high performance LWIR HSI.Less distinctive spectral signatures than in LWIR (minerals)?