Embed Size (px)
Citation preview

Hyperspectral Data Applications:
Convection & Turbulence
• Overview: Application Research for MURI
• Atmospheric Boundary Layer Turbulence
• Convective Initiation Studies
John R. MecikalskiKristopher M. Bedka
University of Wisconsin-Madison
3rd Annual Workshop on Hyperspectal Meteorological Science of UW-MURI and Beyond28-29 May 2003, Madison, Wisconsin
John R. Mecikalski: MURI Application Research

• Questions:– How can high-temporal resolution soundings of water vapor
and temperature (derived from hyperspectral measurements) be used to assess boundary layer turbulent/moisture patterns?
– What is the value of hyperspectral satellite data for evaluating cloud growth, cloud microphysics, and the variability of water vapor for studying convective cloud formation?
• Data:– AERI (and Raman LIDAR) atmospheric profiles– GIFTS data cubes
Hyperspectral Data Applications:
Convection & Turbulence
3rd Annual Workshop on Hyperspectal Meteorological Science of UW-MURI and Beyond28-29 May 2003, Madison, Wisconsin
John R. Mecikalski: MURI Application Research
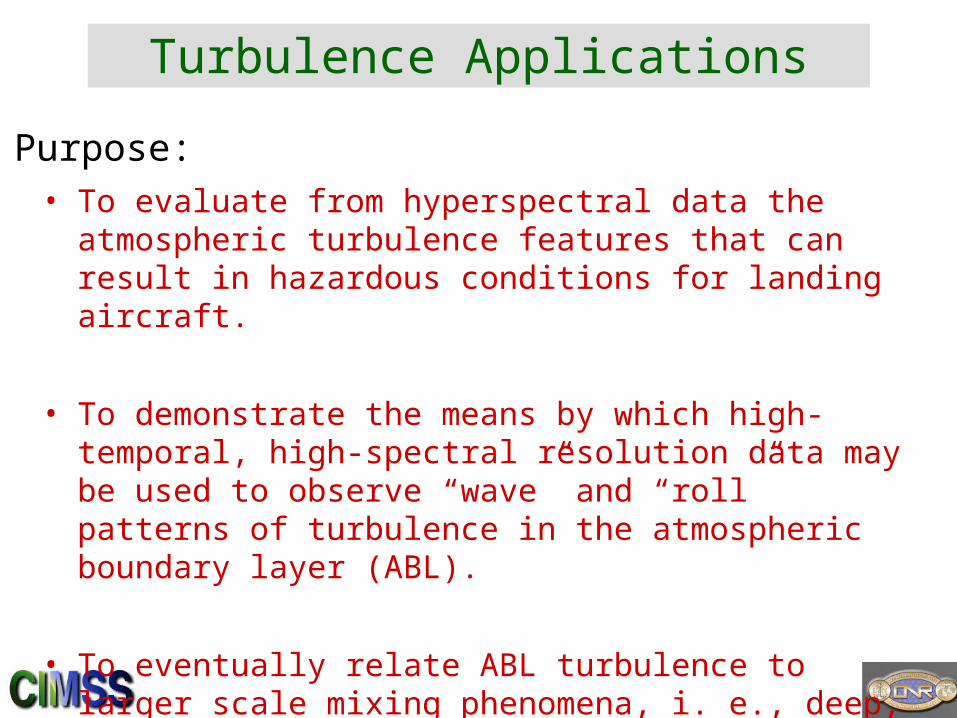
Turbulence Applications
• To evaluate from hyperspectral data the atmospheric turbulence features that can result in hazardous conditions for landing aircraft.
• To demonstrate the means by which high-temporal, high-spectral resolution data may be used to observe “wave” and “roll” patterns of turbulence in the atmospheric boundary layer (ABL).
• To eventually relate ABL turbulence to larger scale mixing phenomena, i. e., deep, moist convection (e.g., thunderstorms).
Purpose:
GOES-11
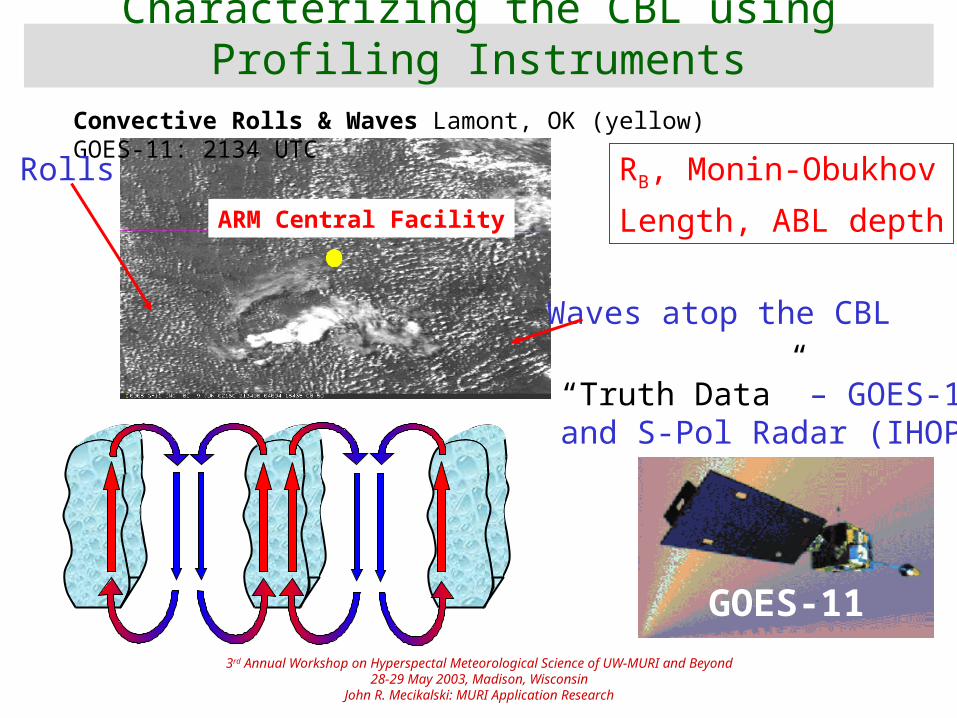
Convective Rolls & Waves Lamont, OK (yellow) GOES-11: 2134 UTC
Characterizing the CBL using Profiling Instruments
Waves atop the CBL
Rolls
“Truth Data” – GOES-11and S-Pol Radar (IHOP)
ARM Central Facility
RB, Monin-Obukhov
Length, ABL depth
3rd Annual Workshop on Hyperspectal Meteorological Science of UW-MURI and Beyond28-29 May 2003, Madison, Wisconsin
John R. Mecikalski: MURI Application Research

8 minute AERI profiles from 16-22 UTC on June 9th, 11th
Clouds

1 minute Raman LIDAR profiles from 16-22 UTC on June 9th, 11th
Used: Moisture at 0.31 km Daytime information
0.312 km
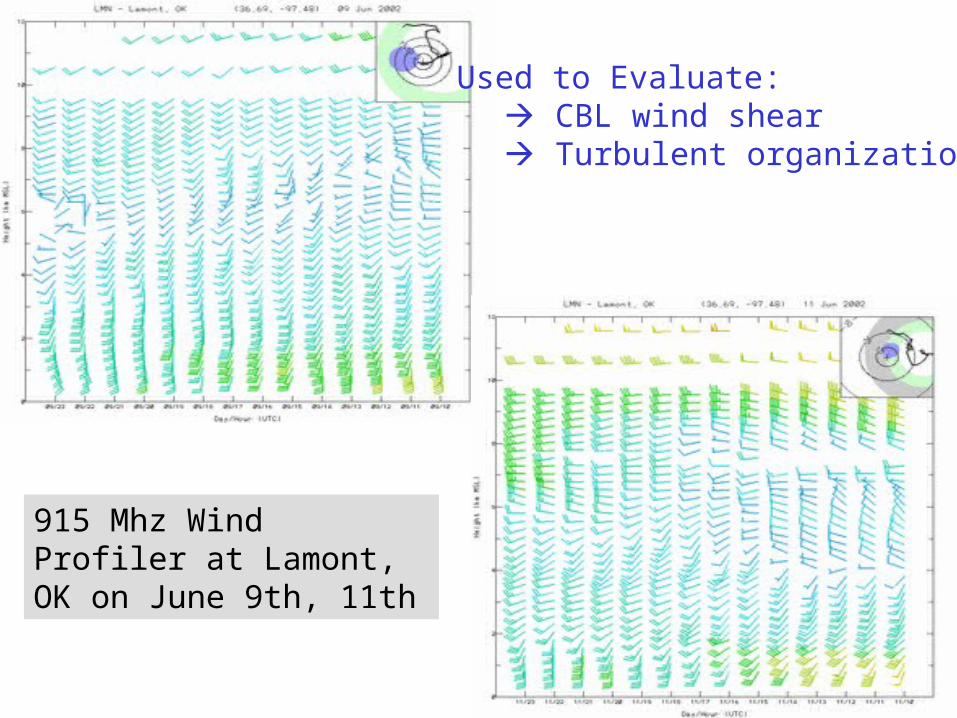
915 Mhz Wind Profiler at Lamont, OK on June 9th, 11th
Used to Evaluate: CBL wind shear Turbulent organization

15 min running mean of qv raw signal at 312 meters; from Raman LIDAR
Scales of high-e “plumes”making convective clouds:
10 km length scales Moisture fluxes ABL overturning
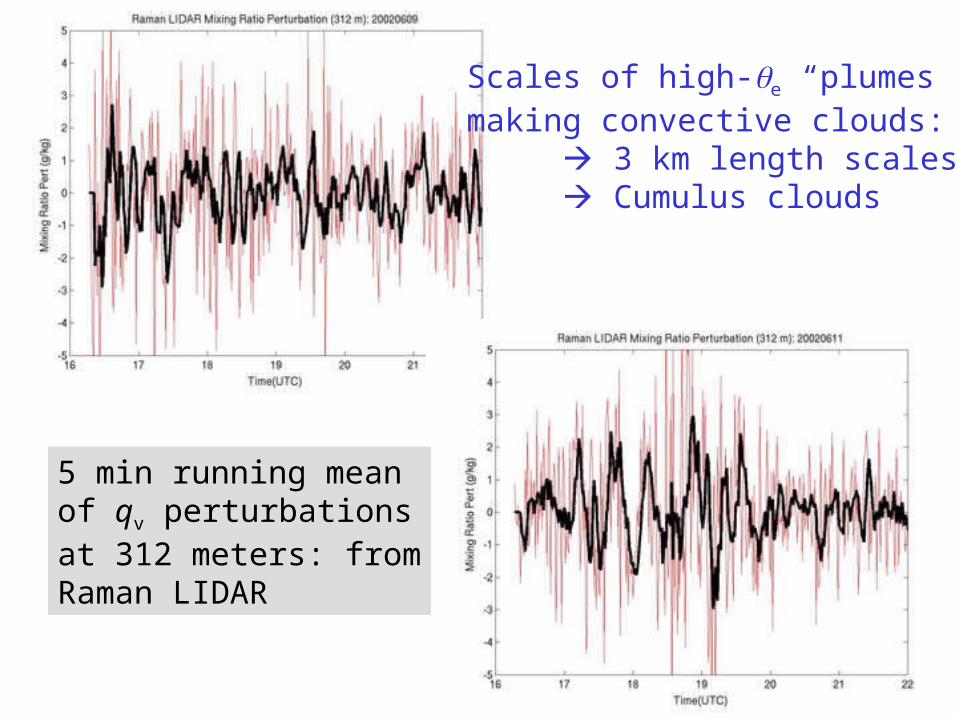
5 min running mean of qv perturbations at 312 meters: from Raman LIDAR
Scales of high-e “plumes”making convective clouds:
3 km length scales Cumulus clouds

This frequency closely corresponds to the periodicity derived from the Raman LIDAR WV perturbation power spectrum Quantitative analysis of the GOES-11 imagery via a 2-D Fourier transform
A satellite analysis reveals that convective cloud wave structures passed over Lamont with a frequency of 6 to 9 minutes from 1915-2200 UTC. CBL roll patterns were observed at 16-21 minute frequencies.
Rolls
WavesRolls
Waves?
AC
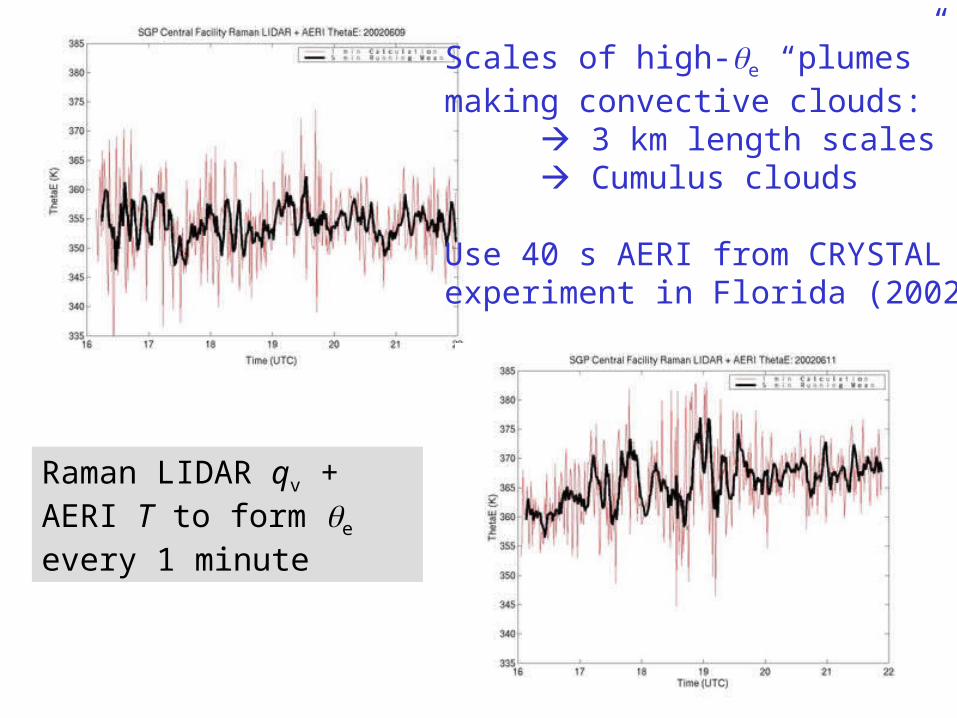
Raman LIDAR qv + AERI T to form e every 1 minute
Scales of high-e “plumes”making convective clouds:
3 km length scales Cumulus clouds
Use 40 s AERI from CRYSTALexperiment in Florida (2002)
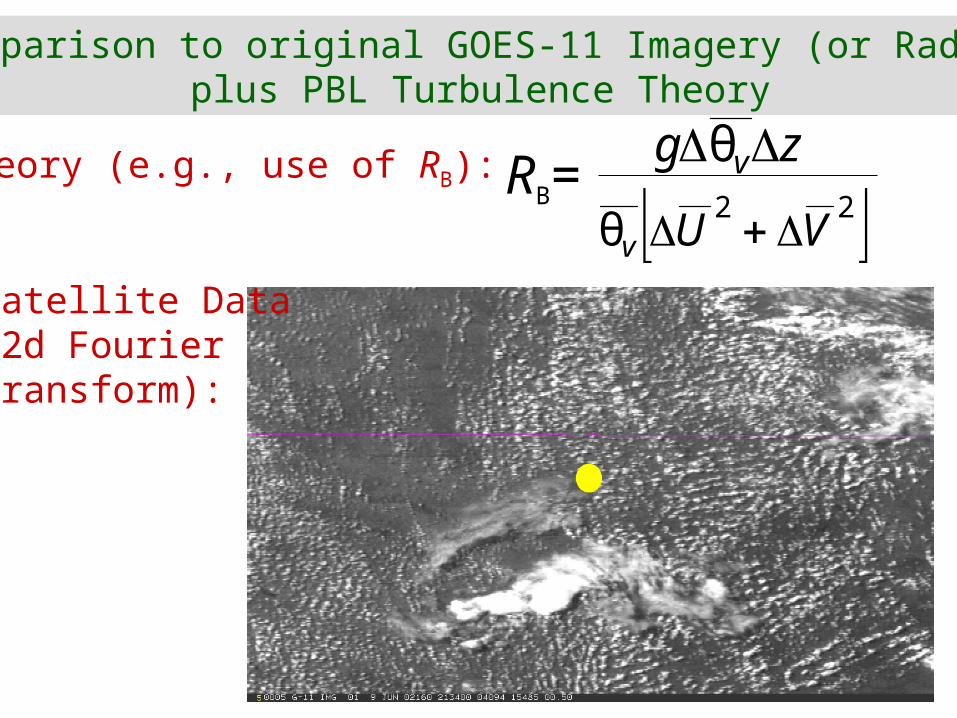
Comparison to original GOES-11 Imagery (or Radar)plus PBL Turbulence Theory
zg vθ
22θ VUv
RB=Theory (e.g., use of RB):
Satellite Data(2d FourierTransform):
Convective Initiation Research
Purpose:• To assess the sensitivity brought by hyperspectral data for
studying atmospheric convection.
• GIFTS should do a better job identifying low-level water vapor/temperature gradients as precursors to cloud development.
• To assess the ability of GIFTS in evaluating cloud microphysics, temperature and water vapor patterns in terms of assessing CI ?
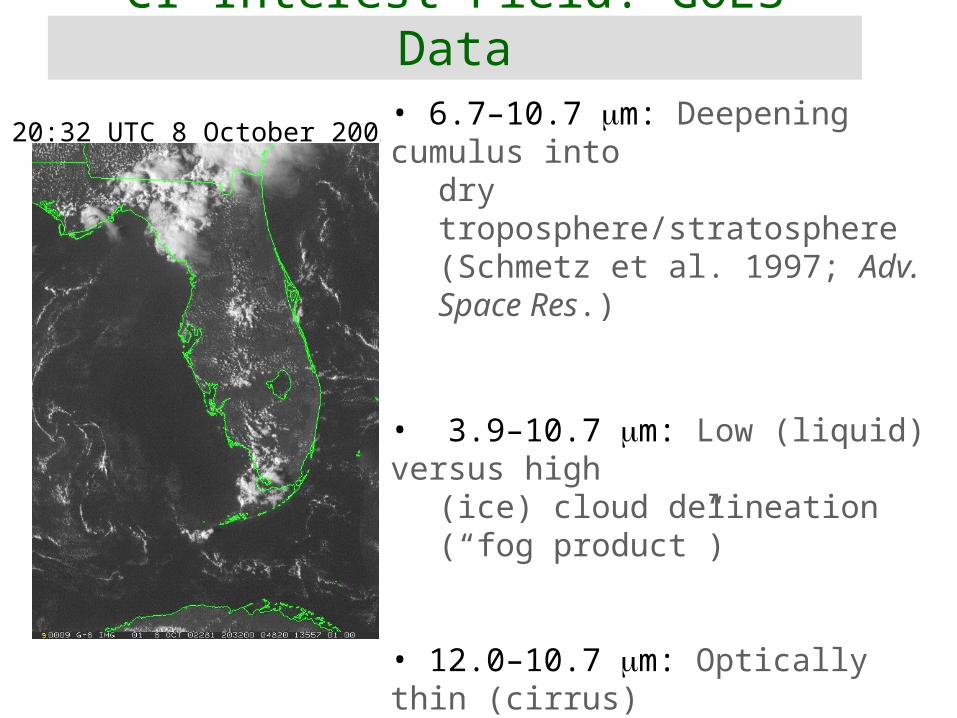
CI Interest Field: GOES Data
20:32 UTC 8 October 2002• 6.7–10.7 m: Deepening cumulus into
dry troposphere/stratosphere(Schmetz et al. 1997; Adv. Space Res.)
• 3.9–10.7 m: Low (liquid) versus high(ice) cloud delineation (“fog product”)
• 12.0–10.7 m: Optically thin (cirrus)versus optically thick (cumulus) clouds
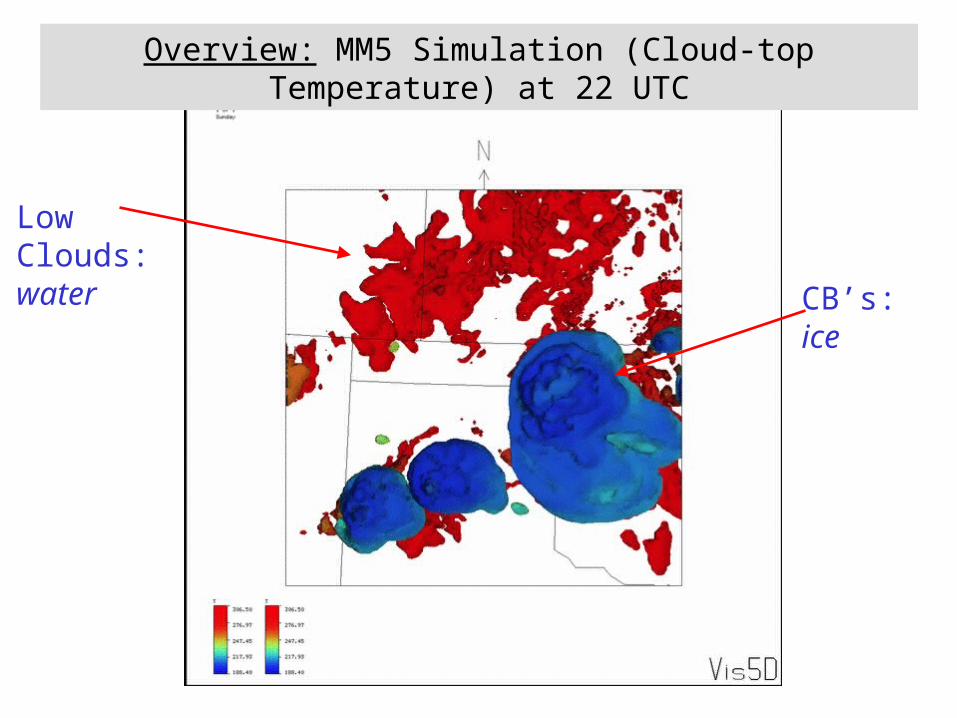
Overview: MM5 Simulation (Cloud-top Temperature) at 22 UTC
CB’s:ice
LowClouds:water
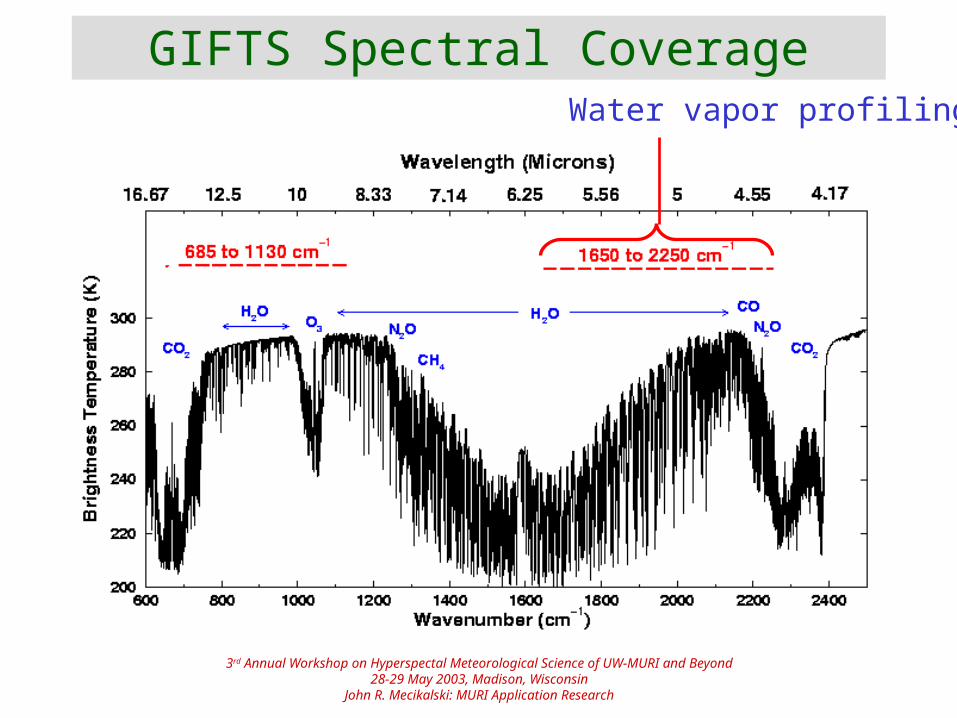
GIFTS Spectral CoverageWater vapor profiling
3rd Annual Workshop on Hyperspectal Meteorological Science of UW-MURI and Beyond28-29 May 2003, Madison, Wisconsin
John R. Mecikalski: MURI Application Research
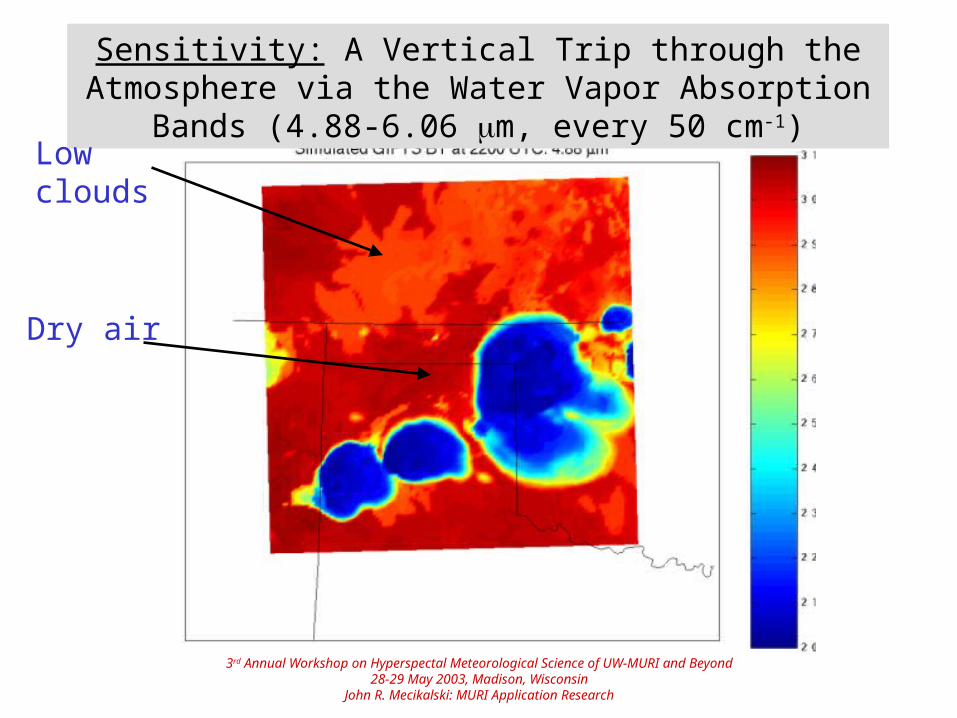
Sensitivity: A Vertical Trip through the Atmosphere via the Water Vapor Absorption Bands (4.88-6.06 m, every 50 cm-1)
Lowclouds
Dry air
3rd Annual Workshop on Hyperspectal Meteorological Science of UW-MURI and Beyond28-29 May 2003, Madison, Wisconsin
John R. Mecikalski: MURI Application Research
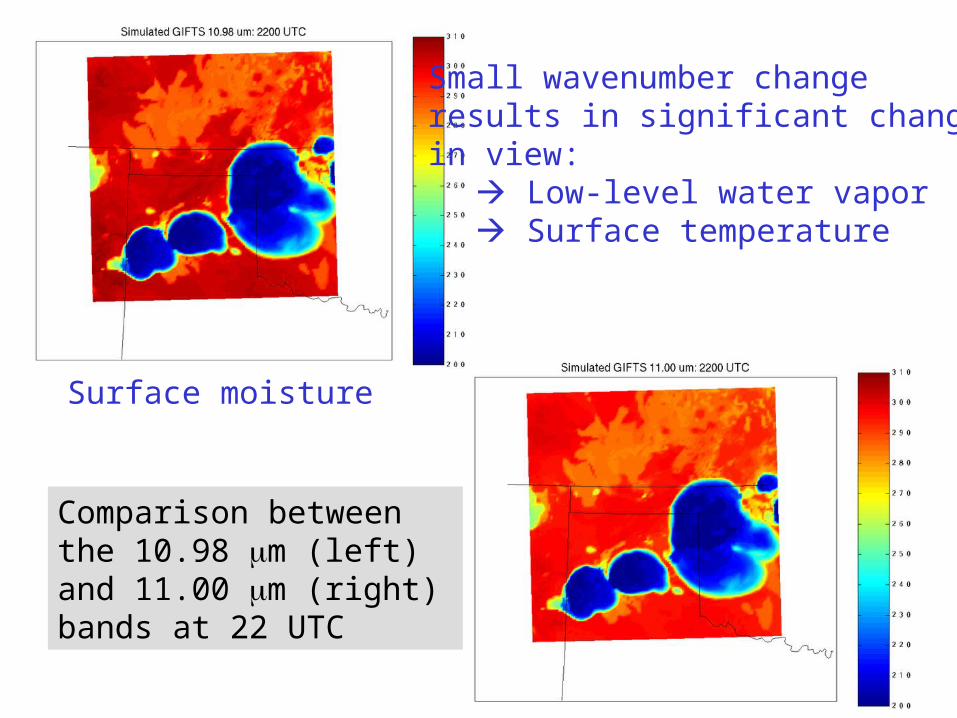
Comparison between the 10.98 m (left) and 11.00 m (right) bands at 22 UTC
Small wavenumber changeresults in significant changesin view:
Low-level water vapor Surface temperature
Surface moisture

Illustration of the High Sensitivity to Selected wavenumbers in the ~8.5-10.98 m difference (1 cm-1 increments)
3rd Annual Workshop on Hyperspectal Meteorological Science of UW-MURI and Beyond28-29 May 2003, Madison, Wisconsin
John R. Mecikalski: MURI Application Research
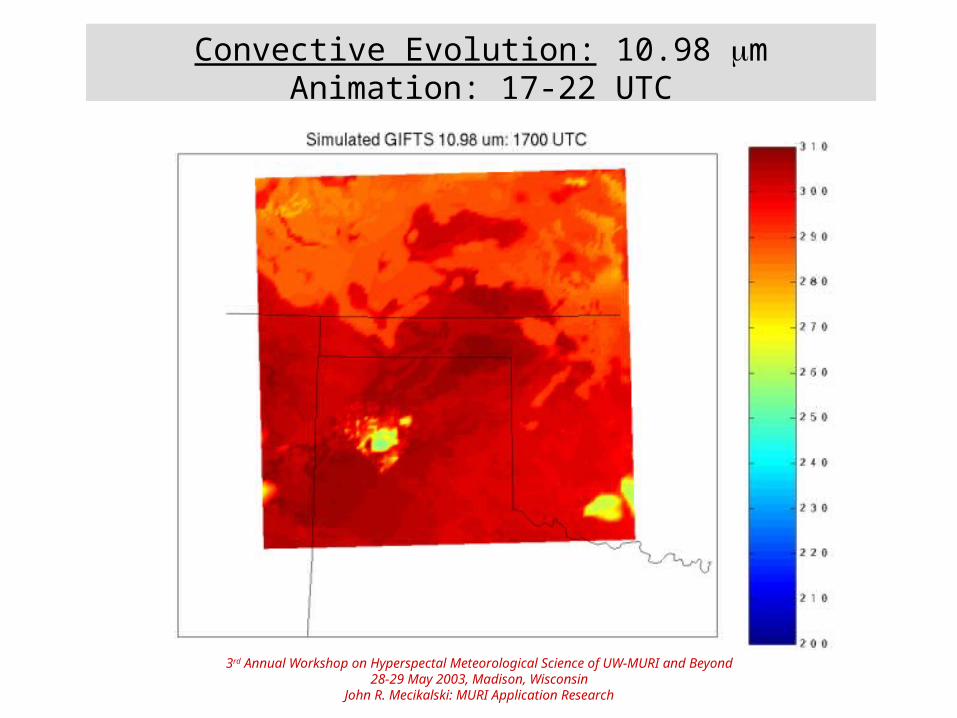
Convective Evolution: 10.98 m Animation: 17-22 UTC
3rd Annual Workshop on Hyperspectal Meteorological Science of UW-MURI and Beyond28-29 May 2003, Madison, Wisconsin
John R. Mecikalski: MURI Application Research
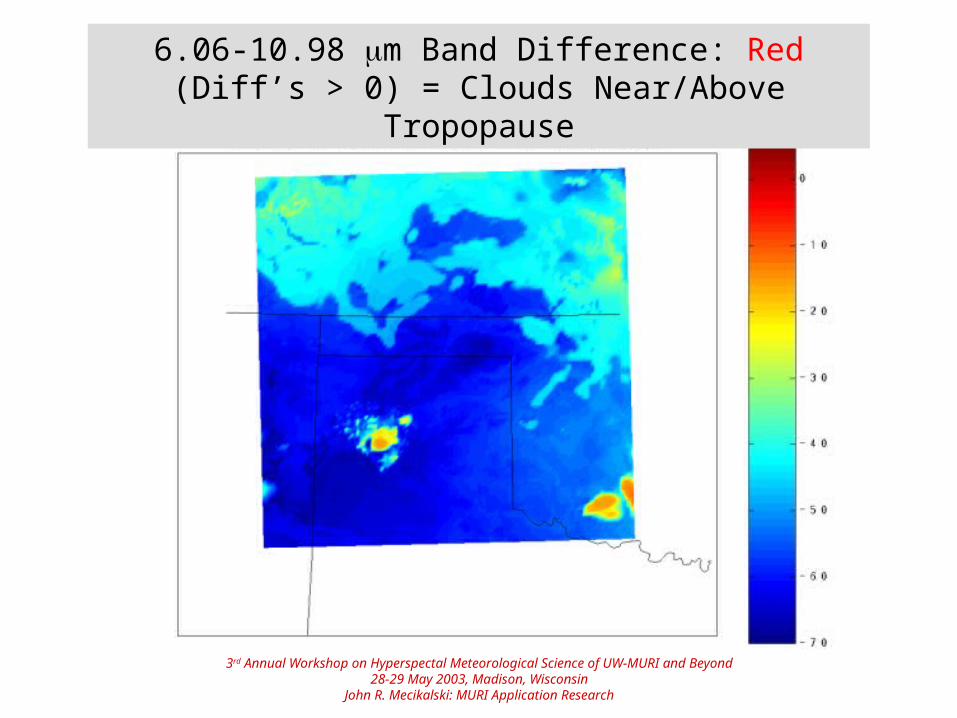
6.06-10.98 m Band Difference: Red (Diff’s > 0) = Clouds Near/Above Tropopause
3rd Annual Workshop on Hyperspectal Meteorological Science of UW-MURI and Beyond28-29 May 2003, Madison, Wisconsin
John R. Mecikalski: MURI Application Research

8.508-10.98 m Band Difference: Red (’s > 0) = Ice
3rd Annual Workshop on Hyperspectal Meteorological Science of UW-MURI and Beyond28-29 May 2003, Madison, Wisconsin
John R. Mecikalski: MURI Application Research
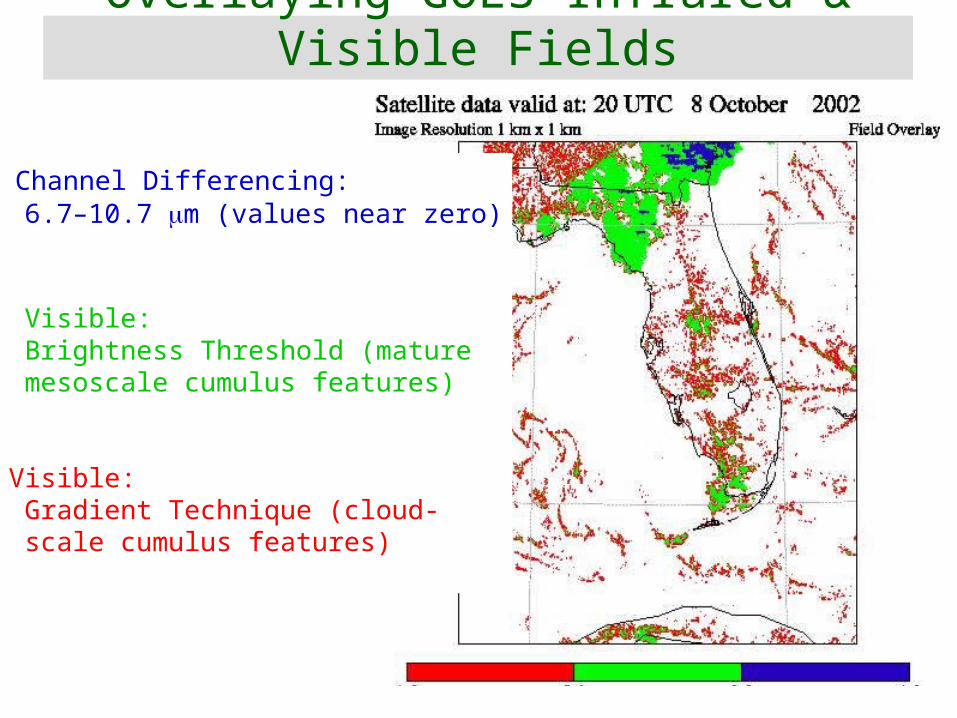
Overlaying GOES Infrared & Visible Fields
• Channel Differencing:6.7–10.7 m (values near zero)
• Visible:Brightness Threshold (maturemesoscale cumulus features)
• Visible:Gradient Technique (cloud-scale cumulus features)
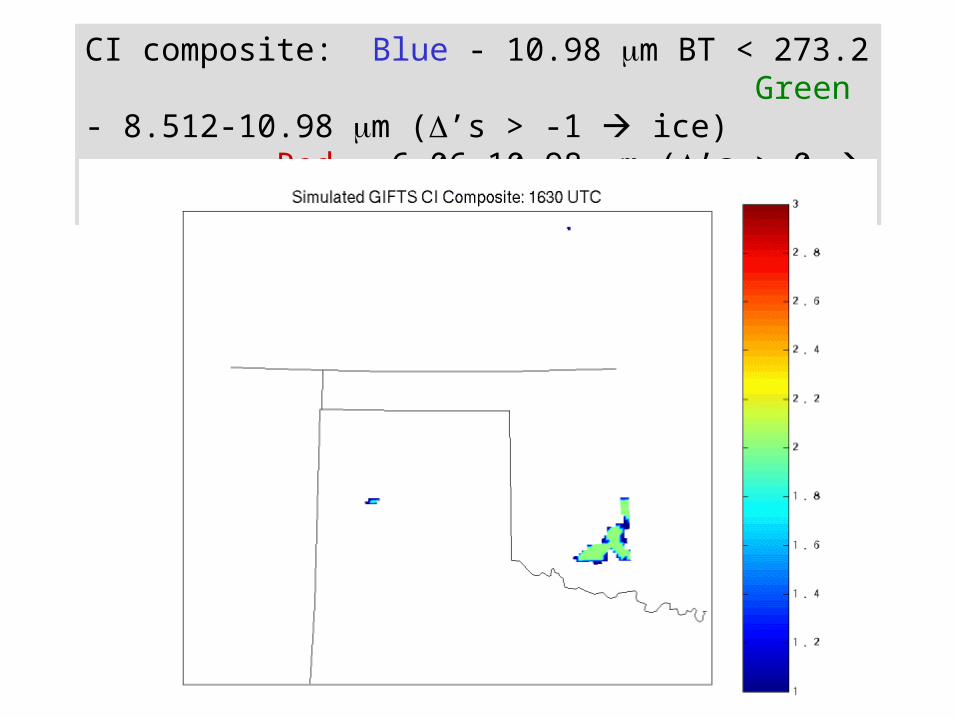
CI composite: Blue - 10.98 m BT < 273.2 Green - 8.512-10.98 m (’s > -1 ice)Red - 6.06-10.98 m (’s > 0 high clouds)
3rd Annual Workshop on Hyperspectal Meteorological Science of UW-MURI and Beyond28-29 May 2003, Madison, Wisconsin
John R. Mecikalski: MURI Application Research
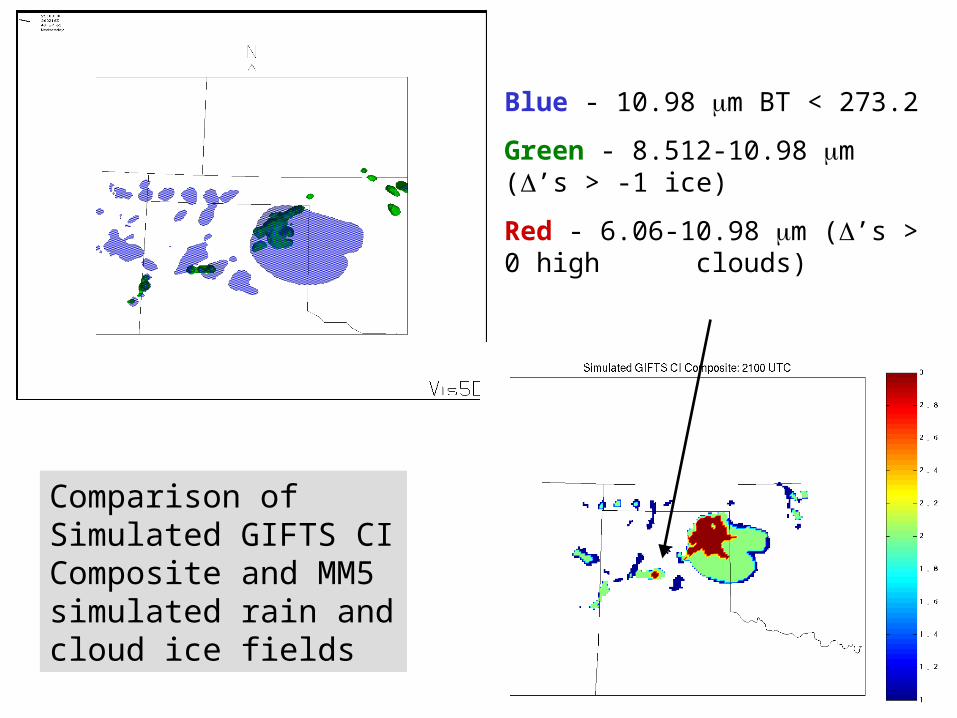
Comparison of Simulated GIFTS CI Composite and MM5 simulated rain and cloud ice fields
Blue - 10.98 m BT < 273.2
Green - 8.512-10.98 m (’s > -1 ice)
Red - 6.06-10.98 m (’s > 0 high clouds)

• GIFTS/hyperspectral data offer us an improved ability to assess cloud properties (e.g., growth & phase).
• GIFTS should do a better job identifying low-level water vapor/temperature gradients as precursors to cloud development.
• Seek other new methods of using GIFTS to assess CI other than evaluating cloud microphysics, temperature and water vapor patterns.
Overview
3rd Annual Workshop on Hyperspectal Meteorological Science of UW-MURI and Beyond28-29 May 2003, Madison, Wisconsin
John R. Mecikalski: MURI Application Research

• First look at S-HIS and NAST-I for performing theseanalyses.
• Use of other validation data sets (other than IHOP); THORpex (with AIRS, NAST-I, etc.).
Overview
3rd Annual Workshop on Hyperspectal Meteorological Science of UW-MURI and Beyond28-29 May 2003, Madison, Wisconsin
John R. Mecikalski: MURI Application Research