Embed Size (px)
Citation preview
© 2017. Arvind Pandey, Smrti Rawat & Neelam Rawat. This is a research/review paper, distributed under the terms of the Creative Commons Attribution-Noncommercial 3.0 Unported License http://creativecommons.org/licenses/by-nc/3.0/), permitting all non commercial use, distribution, and reproduction in any medium, provided the original work is properly cited.
Hyper-Spectral Data and Techniques for Land-use Land-Cover Analysis using Two Time Data for Lonar Town, Buldhana District of Maharashtra State
By Arvind Pandey, Smrti Rawat & Neelam Rawat Kumaun University
Abstract- Hyper-spectral optical data has been the key for accurate mapping in various field of scientific research to get results in different dimension. Based on this the present study involves two different images classify by different technique to improve the spectral resolution classification for the LULC areas using their unique spectral reflectance. The Optimum bands for the urban, vegetation, agriculture and water features are found using the spectral library is created for different invariant LULC features. The performance evaluation of the Hyperion image is carried out in terms of spatial, spectral and feature based and the results shows Spectral Angle Mapper with n-D visualizer produces a better classification output compared to the Spectral Angle Mapper and Support Vector Machine method for a heterogeneous LULC area. Accuracy assessment also revealed choosing reference pixels for classification using MNF scatterplots and then refining them use n-D visualizer increases classification accuracy.
Keywords: remote sensing, hyper-spectral, image classification, spectral angle mapper, support vector machine.
GJSFR-H Classification: FOR Code: 120599
HyperSpectralDataandTechniquesforLanduseLandCoverAnalysisusingTwoTimeDataforLonarTownBuldhanaDistrictofMaharashtraState
Strictly as per the compliance and regulations of :
Global Journal of Science Frontier Research: HEnvironment & Earth Science Volume 17 Issue 2 Version 1.0 Year 2017 Type : Double Blind Peer Reviewed International Research JournalPublisher: Global Journals Inc. (USA)Online ISSN: 2249-4626 & Print ISSN: 0975-5896
Hyper-Spectral Data and Techniques for Land-use Land-Cover Analysis using Two Time Data
for Lonar Town, Buldhana District of Maharashtra State
Arvind Pandey α, Smrti Rawat
σ & Neelam Rawat
ρ
Abstract-
Hyper-spectral optical data has been the key for accurate mapping in various field of scientific research to get results in different dimension. Based on this the present study involves two different images classify by different technique to improve the spectral resolution classification for the LULC areas using their unique spectral reflectance. The Optimum bands for the urban, vegetation, agriculture and water features are found using the spectral library is created for different invariant LULC features.
The performance evaluation of the Hyperion image is carried out in terms of spatial, spectral and feature based and the results shows Spectral Angle Mapper with n-D visualizer produces a better classification output compared to the Spectral Angle Mapper and Support Vector Machine method for a heterogeneous LULC area. Accuracy assessment also revealed choosing reference pixels for classification using MNF scatterplots and then refining them use n-D visualizer increases classification accuracy.
I.
Introduction
ver the past two decades, Hyperspectral remote sensing from airborne and satellite systems has been used as a data source for numerous
applications. Hyperspectral imaging is quickly moving into the main stream of remote sensing and is being applied to remote sensing research studies. Hyperspectral remote sensing are characterized by imaging and spectroscopic property, which differentiates the terrestrial features into unique spectral signature. K. Shahid Khurshid, et al.,
2006 carried out work for Advances in preprocessing of hyperspectral remote sensing data have enabled more accurate atmospheric correction and have led to the development of new information extraction techniques in the areas of agriculture, forestry, geosciences, and environmental monitoring. This property is valuable in evidently classifying land use / cover features especially vegetation and water bodies. Hyperspectral remote Sensing has great potential for analysing complex
LU/LC scenes. However, operational applications within environments are still limited, despite several studies that have explored the capabilities of using Hyper-spectral data is to increase the accuracy in preparing land-use land-cover maps in various aspects.
Recent developments in hyperspectral remote sensing or imaging spectrometry have provided additional bands within the visible, near infrared (NIR) and shortwave infrared (SWIR) region of the electromagnetic spectrum. Most hyperspectral sensors acquire radiance information in less than 10 nm bandwidths from the visible to the SWIR (400-2500 nm). Hyper spectral remote sensing by virtue of its contiguity and narrow bandwidth is increasingly used to characterize, model, classify, and map agricultural crops and natural vegetation. Schmidt and Skidmore, 2002 attempted hyperspectral studies at the herbaceous and grassland level and showed that 27 saltmarsh vegetations could be discriminated. Hyper spectral applications for vegetation studies (Schlerf, 2011) introduced the red edge phenomenon and red edge inflection point (REIP), which is correlated to the chlorophyll content in the canopy. Hyperspectral remote sensing in vegetation studies include species composition, vegetation or crop type biophysical properties, biochemical properties disease and stress studies, nutrients, moisture, light use efficiency and net primary productivity (Thenkabail, 2012). Hyperion hyperspectral imagery over a given region, when combined with either SVMs or ANNs to classifiers, can potentially enable a wider approach in land use/cover mapping (Petropoulos et al., 2012). An attempt has been made for preparing land-use, land-cover map for Buldhana district of Maharashtra, using various Hyper-spectral mapping techniques and map abundances of certain geographic classes.
a) Study Area is a town and a municipal council in
Buldhana district of the division of Buldhana of the region of Vidarbha in the Indian state of Maharashtra. It is a Taluka of the district of Buldhana and is located
near Mehkar. It is an important place in Buldhana district
O
1
Globa
lJo
urna
lof
Scienc
eFr
ontie
rResea
rch
V
olum
eXVII
X Issue
e
rsion
IV
IIYea
r20
17
© 2017 Global Journals Inc. (US)
21
( H)
Lonar
Author α σ: Kumaun University, Nainital, Uttarakhnad, India. e-mail: [email protected] ρ: Uttarakhnad Space Application Centre, Dehradun Uttarakhnad, India.
Keywords: remote sensing, hyper-spectral, image classification, spectral angle mapper, support vector machine.
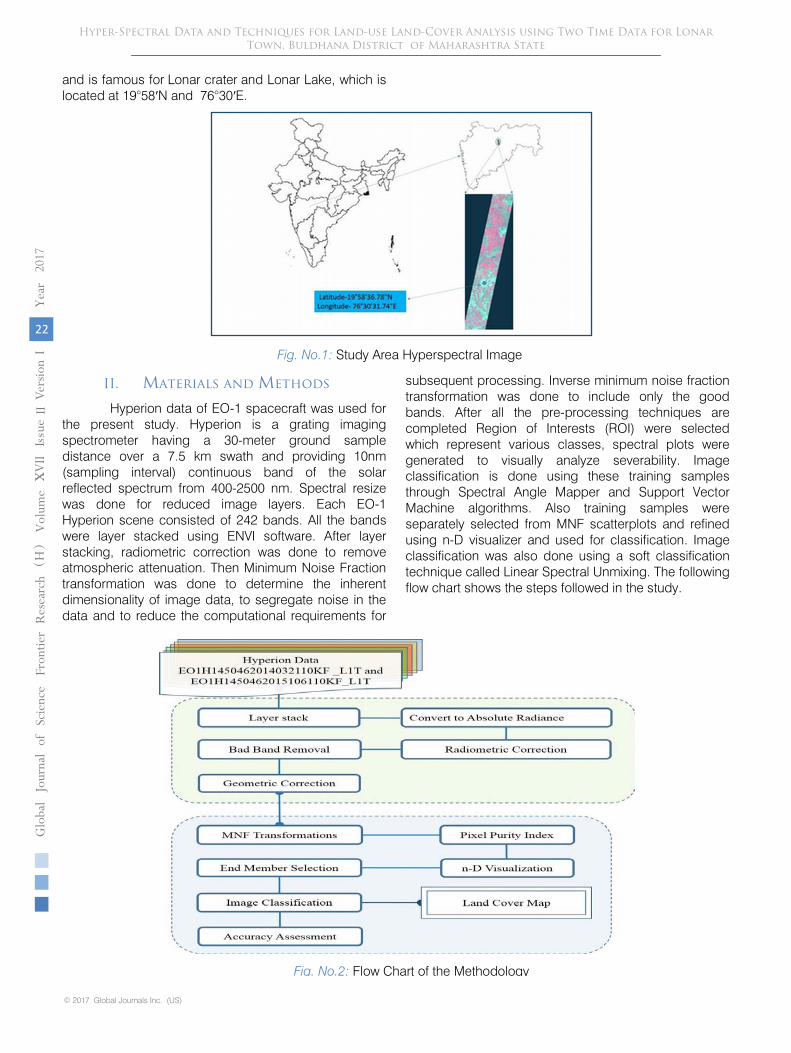
and is famous for Lonar crater and Lonar Lake, which is located at 19°58′N and 76°30′E.
II.
Materials and Methods
Hyperion data of EO-1 spacecraft was used for the present study. Hyperion is a grating imaging spectrometer having a 30-meter ground sample distance over a 7.5 km swath and providing 10nm (sampling interval) continuous band of the solar reflected spectrum from 400-2500 nm.
Spectral resize
was done for reduced image layers. Each EO-1 Hyperion scene consisted of 242 bands. All the bands were layer stacked using ENVI software. After layer
stacking, radiometric correction was done to remove atmospheric attenuation. Then Minimum Noise Fraction transformation was done to determine the inherent dimensionality of image data, to segregate noise in the data and to reduce the computational requirements for
subsequent processing. Inverse minimum noise fraction transformation was done to include only the good bands. After all the pre-processing techniques are completed Region of Interests (ROI) were selected which represent various classes, spectral plots were generated to visually analyze severability. Image classification is done using these training samples through Spectral Angle Mapper and Support Vector Machine algorithms. Also training samples were separately selected from MNF scatterplots and refined using n-D visualizer and used for classification. Image classification was also done using a soft classification technique called Linear Spectral Unmixing. The following flow chart shows the steps followed in the study.
Fig. No.1: Study Area Hyperspectral Image
© 2017 Global Journals Inc. (US)
22
Globa
lJo
urna
lof
Scienc
eFr
ontie
rResea
rch
V
olum
eYea
r20
17XVII
X Issue
e
rsion
IV
II( H
)Hyper-Spectral Data and Techniques for Land-use Land-Cover Analysis using Two Time Data for Lonar
Town, Buldhana District of Maharashtra State
Fig. No.2: Flow Chart of the Methodology
a) Data Mining This study involves two different images classify
by different technique to improve the spectral resolution classification for the LULC areas using their unique spectral reflectance. The Optimum bands for the urban, vegetation, agriculture and water features are found using the spectral library is created for different invariant LULC features. The performance evaluation of the Hyperion image is carried out in terms of spatial, spectral and feature based and the results are explained further.
b)
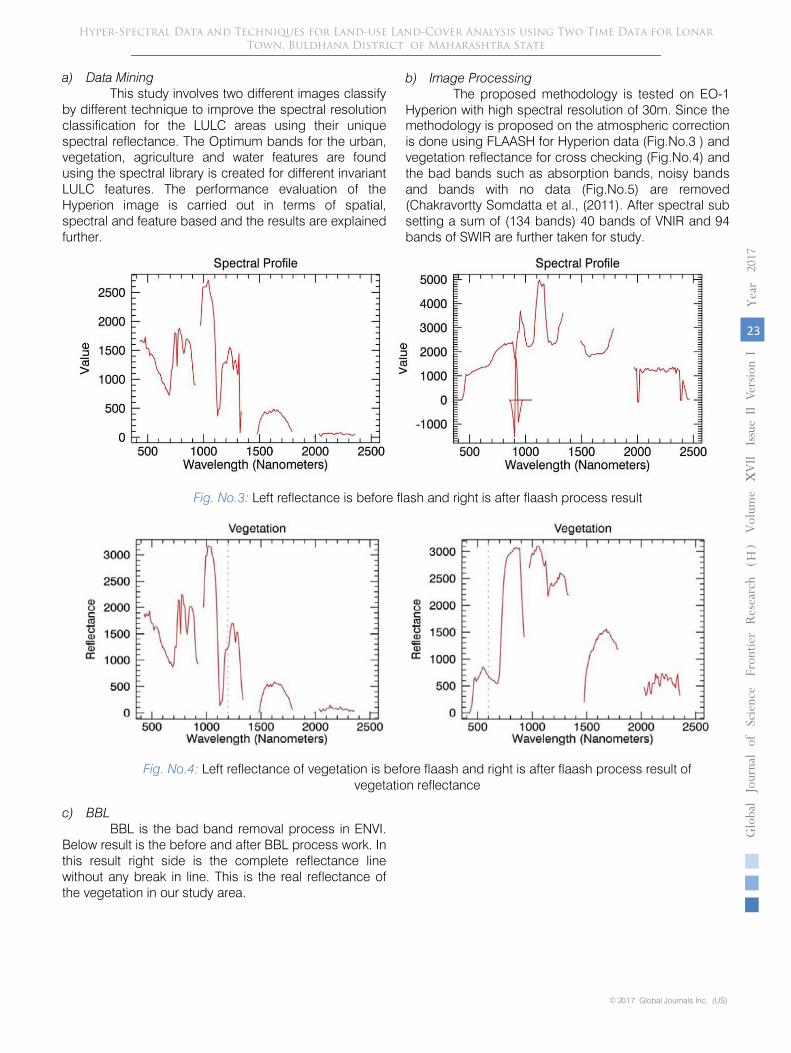
Image Processing
The proposed methodology is tested on EO-1 Hyperion with high spectral resolution of 30m. Since the methodology is proposed on the atmospheric correction is done using FLAASH for Hyperion data (Fig.No.3 ) and vegetation reflectance for cross checking (Fig.No.4) and the bad bands such as absorption bands, noisy bands and bands with no data (Fig.No.5) are removed (Chakravortty Somdatta et al., (2011). After spectral sub setting a sum of (134 bands) 40 bands of VNIR and 94 bands of SWIR are further taken for study.
c)
BBL
BBL is the bad band removal process in ENVI. Below result is the before and after BBL process work. In this result right side is the complete reflectance line without any break in line. This is the real reflectance of the vegetation in our study area.
Fig. No.4: Left reflectance of vegetation is before flaash and right is after flaash process result of
vegetation reflectance
1
Globa
lJo
urna
lof
Scienc
eFr
ontie
rResea
rch
V
olum
eXVII
X Issue
e
rsion
IV
IIYea
r20
17
© 2017 Global Journals Inc. (US)
23
( H)
Hyper-Spectral Data and Techniques for Land-use Land-Cover Analysis using Two Time Data for LonarTown, Buldhana District of Maharashtra State
Fig. No.3: Left reflectance is before flash and right is after flaash process result
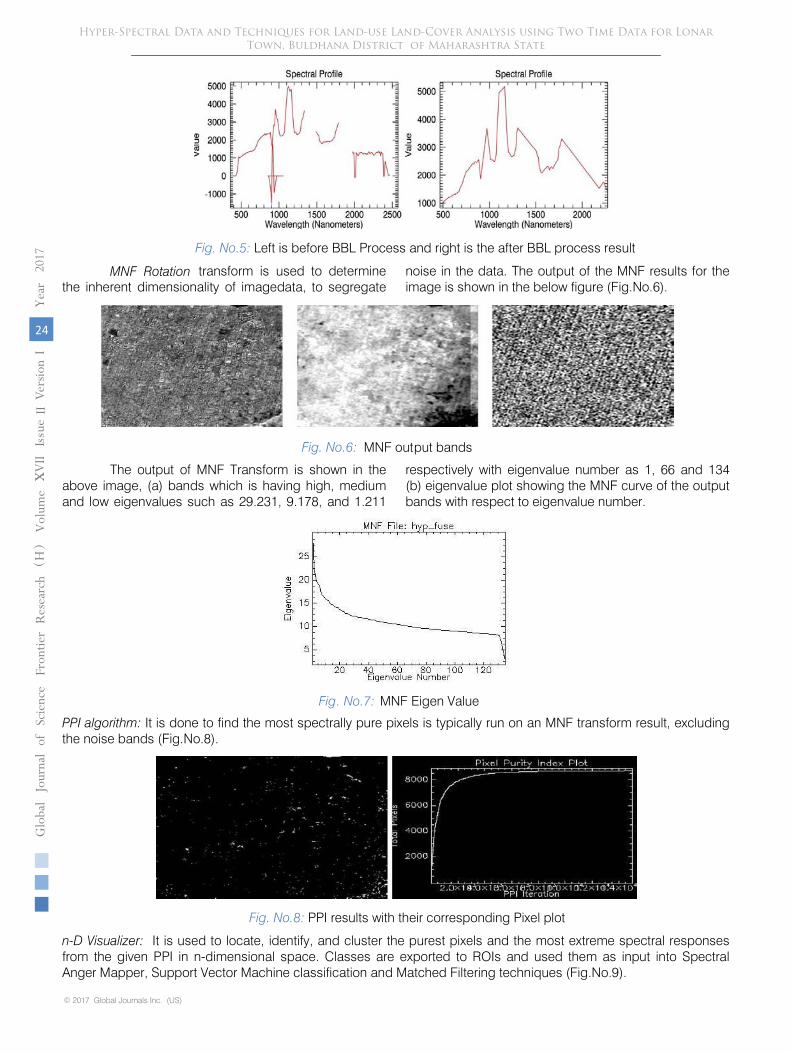
MNF output bands
Fig. No.7:
MNF Eigen Value
Fig. No.8: PPI results with their corresponding Pixel plot
transform is used to determine the inherent dimensionality of imagedata, to segregate
noise in the data. The output of the MNF results for the image is shown in the below figure (Fig.No.6).
The output of MNF Transform is shown in the above image, (a) bands which is having high, medium and low eigenvalues such as 29.231, 9.178, and 1.211
respectively with eigenvalue number as 1, 66 and 134 (b) eigenvalue plot showing the MNF curve of the output bands with respect to eigenvalue number.
PPI algorithm: It is done to find the most spectrally pure pixels is typically run on an MNF transform result, excluding the noise bands (Fig.No.8).
n-D Visualizer: It is used to locate, identify, and cluster the purest pixels and the most extreme spectral responses from the given PPI in n-dimensional space. Classes are exported to ROIs and used them as input into Spectral Anger Mapper, Support Vector Machine classification and Matched Filtering techniques (Fig.No.9).
Fig. No.5: Left is before BBL Process and right is the after BBL process result
© 2017 Global Journals Inc. (US)
24
Globa
lJo
urna
lof
Scienc
eFr
ontie
rResea
rch
V
olum
eYea
r20
17XVII
X Issue
e
rsion
IV
II( H
)Hyper-Spectral Data and Techniques for Land-use Land-Cover Analysis using Two Time Data for Lonar
Town, Buldhana District of Maharashtra State
Fig. No.6:
MNF Rotation
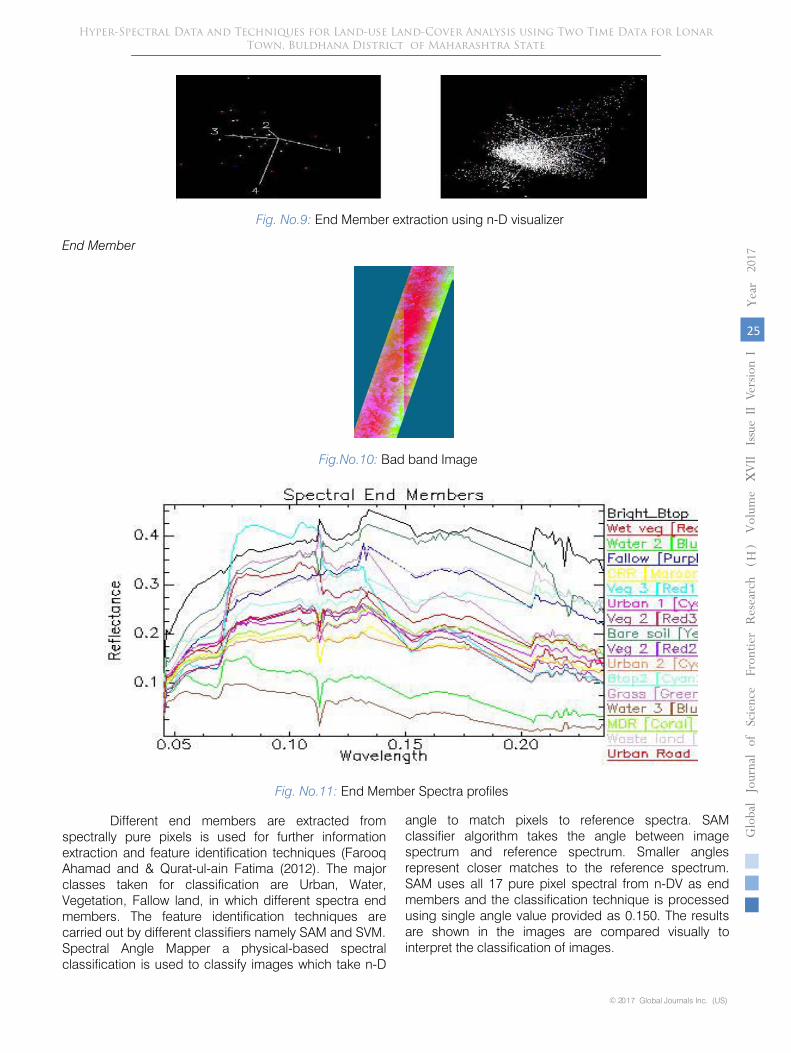
Fig. No.9: End Member extraction using n-D visualizer
End Member
Different end members are extracted from spectrally pure pixels is used for further information extraction and feature identification techniques (Farooq Ahamad and & Qurat-ul-ain Fatima (2012). The major classes taken for classification are Urban, Water, Vegetation, Fallow land, in which different spectra end members. The feature identification techniques are carried out by different classifiers namely SAM and SVM.
Spectral Angle Mapper a physical-based spectral classification is used to classify images which take n-D
1
Globa
lJo
urna
lof
Scienc
eFr
ontie
rResea
rch
V
olum
eXVII
X Issue
e
rsion
IV
IIYea
r20
17
© 2017 Global Journals Inc. (US)
25
( H)
Hyper-Spectral Data and Techniques for Land-use Land-Cover Analysis using Two Time Data for LonarTown, Buldhana District of Maharashtra State
angle to match pixels to reference spectra. SAM classifier algorithm takes the angle between image spectrum and reference spectrum. Smaller angles represent closer matches to the reference spectrum. SAM uses all 17 pure pixel spectral from n-DV as end members and the classification technique is processed using single angle value provided as 0.150. The results are shown in the images are compared visually to interpret the classification of images.
Fig.No.10: Bad band Image
Fig. No.11: End Member Spectra profiles
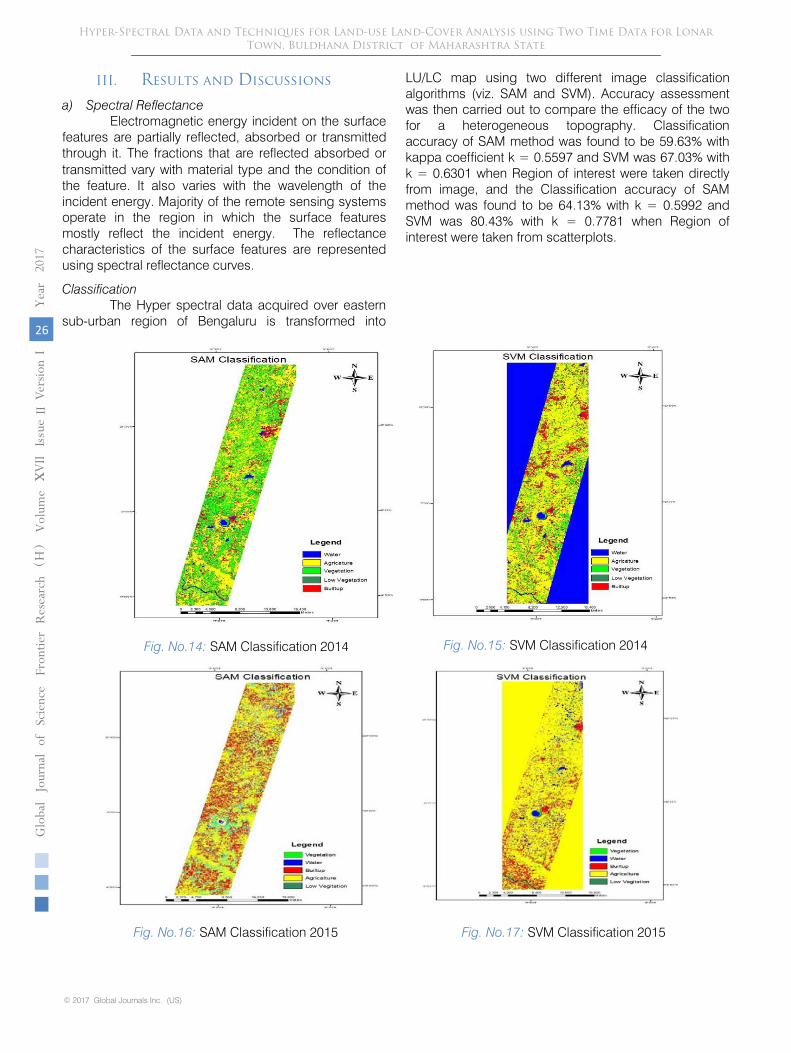
Fig. No.15:
SVM Classification 2014
Fig. No.14:
SAM Classification 2014
Fig. No.16:
SAM Classification 2015
Fig. No.17:
SVM Classification 2015
© 2017 Global Journals Inc. (US)
26
Globa
lJo
urna
lof
Scienc
eFr
ontie
rResea
rch
V
olum
eYea
r20
17XVII
X Issue
e
rsion
IV
II( H
)Hyper-Spectral Data and Techniques for Land-use Land-Cover Analysis using Two Time Data for Lonar
Town, Buldhana District of Maharashtra State
ClassificationThe Hyper spectral data acquired over eastern
sub-urban region of Bengaluru is transformed into
LU/LC map using two different image classification algorithms (viz. SAM and SVM). Accuracy assessment was then carried out to compare the efficacy of the two for a heterogeneous topography. Classification accuracy of SAM method was found to be 59.63% with kappa coefficient k = 0.5597 and SVM was 67.03% with k = 0.6301 when Region of interest were taken directly from image, and the Classification accuracy of SAM method was found to be 64.13% with k = 0.5992 and SVM was 80.43% with k = 0.7781 when Region of interest were taken from scatterplots.
transmitted vary with material type and the condition of the feature. It also varies with the wavelength of the incident energy. Majority of the remote sensing systems operate in the region in which the surface features mostly reflect the incident energy. The reflectance characteristics of the surface features are represented using spectral reflectance curves.
III. Results and Discussions
a) Spectral ReflectanceElectromagnetic energy incident on the surface
features are partially reflected, absorbed or transmitted through it. The fractions that are reflected absorbed or
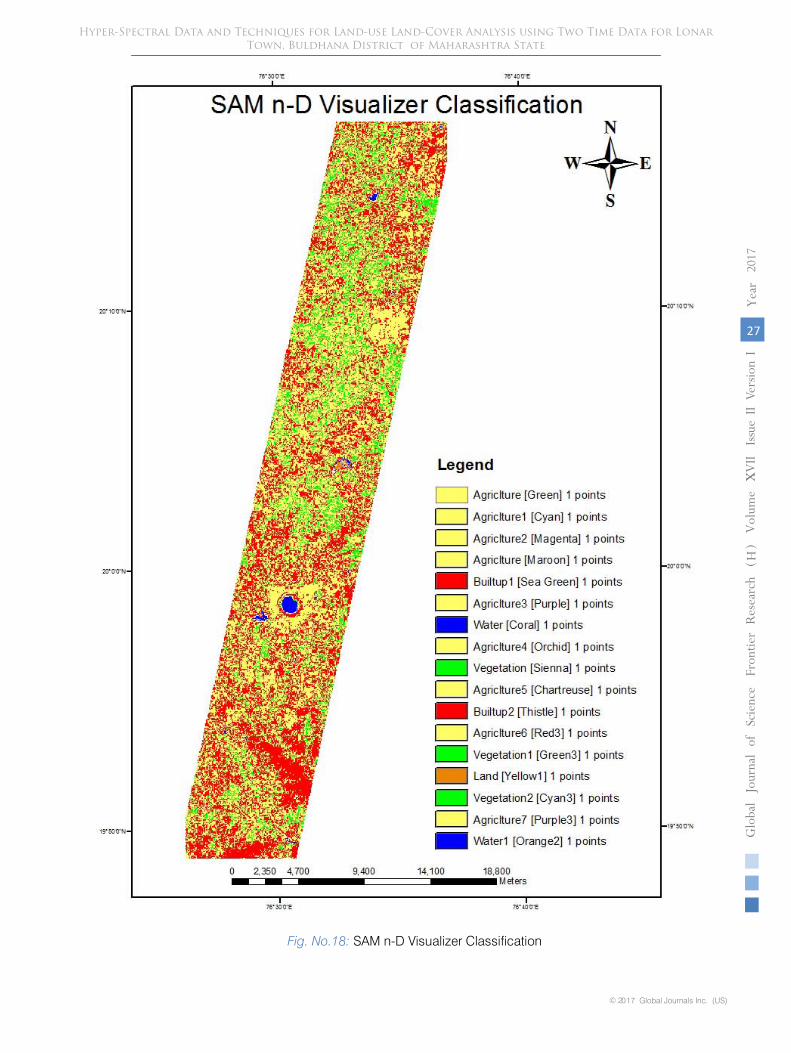
Fig. No.18: SAM n-D Visualizer Classification
1
Globa
lJo
urna
lof
Scienc
eFr
ontie
rResea
rch
V
olum
eXVII
X Issue
e
rsion
IV
IIYea
r20
17
© 2017 Global Journals Inc. (US)
27
( H)
Hyper-Spectral Data and Techniques for Land-use Land-Cover Analysis using Two Time Data for LonarTown, Buldhana District of Maharashtra State
SVM Classification of year 2015 was not very clear as in this classification. Agriculture area is not showing good results but water and built-up area is quite good classified. In this study overall accuracy= (1326/2025) = 65.4815% and Kappa Coefficient = 0.6249 which is the good classification with this Hyperion data result.
IV. Conclusion
Results of satellite image classification of using various algorithms shows Spectral Angle Mapper with n-D visualizer produces a better classification output compared to the Spectral Angle Mapper and Support Vector Machine method for a heterogeneous LULC area. Accuracy assessment also revealed choosing reference pixels for classification using MNF scatterplots and then refining them use n-D visualizer increases classification accuracy. In SAM Classification many pixels remained unclassified which is because of the fact that the reflectance of features in an n-dimensional plot exhibits large deviations from the reflectance of reference end member. On the other hand SVM left no unclassified pixel which is because of its generalizing behaviour. This observation helps us to conclude SAM is essentially a mapping algorithm and SVM a classification algorithm.
References Références Referencias
1. Chakravortty, S., & Chakrabarthi, S. (2011). Pre-processing of Hyperspectral Data: A case Study of Henry and Lothian Islands in Sunderban Region, West Bengal, India. International Journal of Geomatics and GeoSciences, 2(2), 490-551.
2. Farooq, A., & Qurat-ul-ain, F. (2012). Pixel Purity Index Algorithm and n-Dimensional Visualization for ETM+ Image Analysis: A Case of District Vehari, Global Journal of Human Social Science Arts & Humanities, 12(15), Version 1.0.
3. K. Shahid Khurshid, Staenz, K. Sun, L., Neville, R., White,H. P., Bannari, A., Champagne, C.M., & Hitchcock, R. (2006). "Preprocessing of EO-1 Hyperion data". Canadian Journal for Remote Sensing, 32 (2), 84-97.
4. Petropoulos, G. P., Aravantis, K. and Sigrimis, N., (2012). Hyperion hyperspectral imagery analysis combined with machine learning. Expert Systems with Applications, 39, 3800-3809.
5. Vijayan, D., Shankar, G. R., & Shankar, T. R. (2014). Hyperspectral Data for Land use/Land cover classification. The International Archives of Photogrammetry, Remote Sensing and Spatial Information Sciences, 40(8), 991.
6. Schmidt, K. S. and Skidmore, A. K. (2002). Spectral discrimination of vegetation types in a coastal wetland. Remote sensing of Environment, 85, 92-108.
7. Thenkabail, P.S. Lyon, J.G., & Huete, A. (2011). Hyperspectral Remote Sensing of Vegetation. CRC Press,781.
© 2017 Global Journals Inc. (US)
28
Globa
lJo
urna
lof
Scienc
eFr
ontie
rResea
rch
V
olum
eYea
r20
17XVII
X Issue
e
rsion
IV
II( H
)Hyper-Spectral Data and Techniques for Land-use Land-Cover Analysis using Two Time Data for Lonar
Town, Buldhana District of Maharashtra State


![[46] Recent Advances in Techniques for Hyper Spectral Image Processing](https://img.pdfslide.us/doc/110x75/577d29551a28ab4e1ea68060/46-recent-advances-in-techniques-for-hyper-spectral-image-processing.jpg)