Embed Size (px)
Citation preview

Hyper-Efficient Devices: Assessing the Fuel Displacement
Potential in Vermont of Plug-In Vehicles and Heat Pump
Technology
A report prepared for Green Mountain Power
May, 2013
Steven Letendre, PhD 58 Sundog Lane
Middletown Springs, VT 05757

1
Table of Contents Table of Contents...................................................................................................................................... 1
List of Tables ............................................................................................................................................ 1
List of Figures........................................................................................................................................... 1
List of Images ........................................................................................................................................... 2
Executive Summary.................................................................................................................................. 3
I. Introduction....................................................................................................................................... 5
II. Hyper-Efficient Devices: Applications in Vermont ......................................................................... 6
A. Plug-In Hybrid Vehicles in Vermont ......................................................................................... 7
i. Plug-in car performance in hilly terrain and cold climates .......................................................... 8
ii. Plug-in car sales and future projections....................................................................................... 9
iii. Meeting the energy needs for vehicle charging in Vermont .................................................... 10
B. Heat-Pumps and Electric Furnaces: Applicability in Vermont................................................ 12
i. Heat pump technology................................................................................................................ 12
ii. Electric Furnace with Thermal Storage ..................................................................................... 15
iii. Heat pumps and electric furnaces in Vermont ......................................................................... 16
iv. Electric demand from heat pumps and electric furnaces .......................................................... 17
III. Fuel Displacement and Carbon Reduction Potential for Hyper Efficient Devices ..................... 21
A. The Benefits of Displacing Gasoline with Electricity for Transportation. .................................... 21
B. The Benefits of Displacing Fuel Oil and Propane for Space Heating and Water Heating Using Heat Pump Technology ...................................................................................................................... 24
IV. Conclusions.................................................................................................................................. 26
Acknowledgements................................................................................................................................. 27
Works Cited ............................................................................................................................................ 27
List of Tables Table 1: Vermont GHG Emissions by Category 2008……………………………………………6 Table 2: Select Characteristics of Plug-In Cars Available in Vermont…………….……………..7 Table 3: Projected Demand (MW) for Vehicle Charging……………………………………….11 Table 4: Sample Data Table from Amana Heat Pump Unit……………………………………..14 Table 5: Assumptions for Annual Electricity Use Using Heat Pumps and Electric Furnaces…..18 Table 6: Projected Annual Energy Cos Savings: Oil & Propane…..……………………………19 Table 7: Total Consumption for Space and Water Heating by Fuel Type 2010 Vermont………20 Table 8: Increased Electricity Use in Vermont from Heat Pumps Deployed for Space and Water
Hearing Given Various Fuel Displacement Scenarios…………………………………20 Table 9: Fuel Displacement and Savings Potential for Plug-in Vehicles in Vermont…………...23 Table 10: Projected Net GHG Emissions Savings from Plug-in Vehicle Adoption in Vermont…24 Table 11: Fuel Oil Savings from Heat Pump Deployment for Space Heating and Hot Water Given
Various Fuel Displacement Scenarios (gallons annually)…………….………………..24
List of Figures Figure 1: Space/Water Heating Fuel Use in Vermont 2010……………………………………….5 Figure 2: Projected Number of Advanced Electric Vehicles in Vermont 2010 – 2030………..…9 Figure 3: Annual Electric Use Estimates by Device Type………………………………………..19 Figure 4: Projected Need for Electric Energy from Plug-In Cars………………………………...22 Figure 5: Annual Energy Bill Savings Using Heat Pump Technology in Vermont……………...25

2
Figure 6: Carbon Reduction Potential Using Heat Pump Technology in Vermont………………26
List of Images Image 1: Steffes Corporation Electric Furnace with Thermal Storage Room Unit………………16

3
Executive Summary The Vermont Agency of Natural Resource’s “Greenhouse Gas Emissions Inventory Update: 1990 – 2008” reports that transportation and fuel use in buildings account for 78% of total greenhouse gas emissions annually. Furthermore, the Agency estimates that emissions in these sectors have increased since 1990 by 22% and 8% respectively. Greenhouse gas (GHG) emissions from the electric power sector were reported to be just 4% of the total annual emissions. Consumption of gasoline for transportation and fuel oil and propane use for space and water heating cost Vermonters over $2 billion dollars annually. These dollars leave the State as Vermont imports all of its liquid fuels, which represents over 7% of Vermont’s $26.4 billion economy. New hyper-efficient devices that displace gasoline for transportation and fuel oil and propane for space and water heating offer a new opportunity for Vermonters to save money and at the same time lower GHG emissions. Green Mountain Power commissioned a study to estimate the fuel displacement potential in Vermont assuming various consumer adoption rates for these technologies. Consumers in Vermont now have several plug-in vehicles to choose from that displace gasoline purchased at the pump with electricity from the grid. It is well documented that electricity is significantly less expensive as a fuel for transportation relative to gasoline or diesel fuel. Although Vermont’s hilly terrain and cold climate impact the all electric range of plug-in cars, there are no inherent barriers to widespread adoption of these vehicles other than the higher initial cost of plug-in cars relative to comparable gasoline vehicles. There are currently just over 300 plug-in vehicles registered in the State; sales of plug-in cars are growing as more vehicle options are available for consumers to choose from. Recent advances in heat pump technology make them a viable option in Vermont to displace fuel oil and propane currently used for space and water heating with electricity. The heat pump cycle allows one unit of electricity (kWh) to deliver 2 or more units of equivalent heat energy. New heat pump designs allow heat pumps for space heating to operate efficiently on some of the coldest days experienced in our climate. The Hyper Heat line of inverter-based heat pumps manufactured by Mitsubishi can deliver its full heating capacity even with single digit outside temperatures. These types of units can be retrofitted to existing homes, the so-called hybrid house, which displaces fuel oil and propane used for space heating. In addition, several manufacturers offer heat pump water heating units that can be a cost effective option relative to fuel-based water heating units. This study analyzed the increased demand for electricity and fuel displacement potential from various adoption rates of plug-in vehicles and heat pumps for space and water heating. The increased demand for electricity and the fuel displacement potential were used to project annual GHG reductions and fuel cost savings that could accrue to Vermonters if the technology adoption scenarios explored in the study came to fruition. Based on a plug-in vehicle adoption model developed by researchers at the University of Vermont’s Transportation Research Center, in the year 2020 there could be over 30,000 plug-in vehicles in Vermont leading to a 2% increase in electricity consumption annually. This would translate into a reduction in gasoline consumption of over 13 million gallons, thus saving Vermonters $29 million dollars in fuel costs and reducing GHG emissions by over 125,000 metric tons annually. These savings would increase in the future as the fleet of plug-in cars in Vermont expands beyond 2020.

4
Assuming that heat pumps displace 20% of the fuel oil and propane currently used for space and water heating in the residential sector, increased consumption of electricity was projected to be 280,000 MWh, which represents a 4.6% increase in electricity consumption. Based on these estimates, Vermonters would displace over 14 million gallons of fuel oil and 7.7 million gallons of propane currently used for space and water heating. This would translate into net energy cost savings of $40 million and a reduction of 175,000 metric tons of GHG emissions annually assuming Vermont’s contracted power supply mix. Greenhouse gas emissions would be lower if the New England average emissions rates were used in place of Vermont’s contracted supply mix. In sum transitioning to electricity to power cars and to displace fuel use in buildings for space and water heating could save Vermonters millions of dollars and make a significant contribution toward reducing the State’s greenhouse gas emissions. Transitioning to electricity for transportation and space and water heating creates a new avenue for renewable forms of power production including wind and solar to serve these loads. The intermittent nature of these renewable forms of power production and the inherent flexibility of these new loads creates potential synergies that should be explored more fully. Additional research is needed to gain operational data on the performance of plug-in cars and heat pumps in Vermont. Demonstrations projects could help to determine strategies to leverage the emerging smart grid infrastructure to minimize the power system impacts associated with expanding the use of electricity for vehicle charging and space and water heating. This report does not address cost-effectiveness. The premium for plug-in electric vehicles relative to conventional vehicles has narrowed in the past year; however the higher cost may not yet be justified simply by reduced fuel costs. Societal cost-effectiveness tests that encompass the carbon reduction, human health benefits, and regional economic multiplier benefits may suggest a role for incentives to encourage adoption of plug-in cars in Vermont. The cost of retrofitting an existing home with a heat pump will vary depending on the particular characteristics of the installation. The cost-effectiveness of these investments is difficult to assess without cost data for several demonstration projects. Again, societal cost-effectiveness tests that capture the GHG reduction, health benefits and regional economic multiplier benefits are needed to determine if incentives to accelerate heat pump adoption rates for space and water heating are justified.

5
I. Introduction
Vermont is a rural state with a population of approximately 627,000 residents spread over an area of 9,250 square miles. Each year Vermonter’s drive over 7 billion miles, resulting in one of the highest per capita miles traveled in the US. All fuels for transportation are imported into Vermont. The US Department of Energy’s Energy Information Administration (EIA) estimates total gasoline consumption in Vermont of 326 million gallons in 2010 and 74 million gallons of diesel fuel in the same year. Assuming an average price of $3.50/gallon for gasoline and $4.00 per gallon for diesel fuel, the total bill for transportation fuels in Vermont totals $1.4 billion dollars annually. Based on the U.S. Census Bureau 2011 Community Survey data on residential heating fuels, approximately 63% of Vermont households use either fuel oil or propane as the primary fuel for space heating and domestic hot water (U.S. Census Bureau, 2011 Community Survey). Only 15% of Vermont households heat with natural gas as compared to 49% of households nationally according to the US Census Bureau data. This is due to the limited natural gas transmission and distribution infrastructure in the State. The EIA estimates total fuel oil and propane use in Vermont to be 125 million gallons and 98.5 million gallons in 2010 respectively for space heating and domestic hot water. The Vermont Department of Public Service estimates that Vermonters spend $600 million to import fuels for use in homes and businesses (VT Department of Public Service, 2011). Figure 1 illustrates the total heating fuel use by sector in Vermont based on EIA estimates for 2010.
Figure 1
Space/Water Heating Fuel Use in Vermont 2010
-
20,000,000
40,000,000
60,000,000
80,000,000
100,000,000
120,000,000
140,000,000
Oil Propane
Ga
llo
ns Industrial
Commercial
Residential
Source: US DOE, EIA. The Vermont Agency of Natural Resources estimates Vermont’s greenhouse gas (GHG) emissions to be 8.37 million metric tons of CO2 equivalent (MMTCO2e) in 2008 (VT Agency of Natural Resources, 2010). Table 1 below lists the various sources of GHG emissions in Vermont. Transportation represents 47% of Vermont’s total GHG emissions, while fossil fuel use in buildings represents 31% of

6
total GHG emission in 2008. Vermont’s transportation-related GHG emissions have increased by 22% since 1990, while GHG emissions from fuel use in buildings grew by only 8% in the same time period. Table 1 Vermont GHG Emissions by Category 2008 (Million Metric Tons of CO2 Equivalent)
Sector GHG Emissions (MMTCO2e)
Electricity Supply & Demand (consumption-based)
0.34
Residential / Commercial / Industrial (RCI) Fuel Use
2.63
Transportation 3.93
Fossil Fuel Industry 0.015
Industrial Processes 0.30
Waste Management 0.27
Agriculture 0.88
TOTAL 8.37
Source: VT Agency of Natural Resources Emission from electricity consumed in Vermont represents just 4% of total GHG emissions. The Vermont electric power supply mix is very low in carbon emissions, given our reliance on hydro and nuclear generating facilities. A comprehensive effort to address Vermont’s carbon footprint must address both transportation and fuel used for space and water heating in residential, commercial, and industrial buildings. Furthermore, in 2011 the Vermont Department of Public Service’s Comprehensive Energy Plan called for the goal to achieve 90% of the State’s energy needs using renewable forms of energy by 2050. There are many strategies and technologies that can be deployed in Vermont to reduce GHG emissions and make progress toward the 2050 goal. First and foremost energy efficiency will play a key role in reducing the overall use of energy. Vermont is a national leader in meeting aggressive electric efficiency gains through the efficiency utility known as Efficiency Vermont. In recent years electricity consumption has been reduced by more than 2% annually (VT Department of Public Service, 2011). This white paper investigates the use of hyper-efficient devices in Vermont to displace fuel use for vehicles and in buildings for space and water heating. Specifically, this paper estimates the fuel displacement potential of plug-in electric vehicles, ground source heat pumps, air source heat pumps, and electric furnaces with thermal storage. These devices are referred to as hyper-efficient because they can deliver the same end-use services with dramatic reductions in energy costs and GHG emissions. Furthermore, using electricity for transportation and building thermal needs creates an avenue for renewable sources of energy not previously available, including wind, farm methane, hydro and solar, to meet these end-uses.
II. Hyper-Efficient Devices: Applications in Vermont In October of 2009 the U.S. Department of Energy awarded Vermont utilities $69 million in funding to deploy smart grid technology across the state. This represents one of the most significant energy infrastructure investments to occur in Vermont in the past decade, which was called the eEnergy

7
Vermont initiative. With matching funds from Vermont utility companies, the $138 million project is a comprehensive state-wide smart grid initiative. A variety of smart grid technologies will be deployed across Vermont, with a particular emphasis on smart meters with a goal to expand from the current 28,000 smart meters today to over 300,000. This project is unique nationally as it entails state-wide cooperation between a number of utility companies under different corporate structures including investor owned, municipal, and cooperatives. The eEnergy Vermont proposal that was awarded funding by the Department of Energy for a 50% funding match references the project’s role in lowering Vermont’s carbon footprint. As stated earlier, Vermont utilities have secured in-state generation resources and various power supply contracts that result in a very low carbon emissions supply mix. Smart grid technologies may be used to achieve significant carbon reduction opportunities through “smart” fuel switching. This involves the use of smart controls and time of use pricing, providing homeowners and businesses the opportunity to displace fuel oil, propane, and gasoline with electricity using a variety of hyper-efficient devices—including plug-in cars, ground source and advanced air source heat pumps, and electric furnaces with thermal storage—in a manner that minimizes the power system impacts from the introduction of these emerging, new electrical loads. As the smart grid systems are being deployed in Vermont, this white paper offers timely analysis of the potential of hyper-efficient technology adoption in Vermont.
A. Plug-In Hybrid Vehicles in Vermont
The second attempt in two decades by major automobile manufacturers to introduce plug-in electric vehicles to the car-buying public began in 2010. Four different plug-in vehicles are currently offered here in Vermont. General Motors is selling their much anticipated Volt, a plug-in hybrid electric vehicle. Nissan is offering its all electric Leaf and Mitsubishi is offering its all electric plug-in called the MiEV. In addition, Toyota recently began offering a plug-in version of its category leading Prius hybrid electric vehicle in Vermont. Table 2 below lists several characteristics of these four plug-in vehicles currently being sold in Vermont. Table 2 Select Characteristics of Plug-in Cars Available in Vermont
GM Volt Nissan Leaf Mitsubishi MiEV Plug-In Prius
Hybrid/All-Electric Hybrid All Electric All Electric Hybrid
All Electric Range 35 miles 100 miles 62 miles 11 miles
Battery Pack Size 16 kWh 24 kWh 16 kWh 4.4 kWh
Charge Time 120 v 10 hrs. n/a 22.5 hrs. 3 hrs.
Charge Time 240 v 4 hrs. 7 hrs. 7 hrs. 1.5 hrs.
Interior Volume 90.3 cubic feet 112.8 cubic feet 84.7 cubic feet 93.7 cubic feet
2013 MSRP $39,145 $28,800 $29.975 $32,000
Most every other major automobile manufacturer has announced plans to sell plug-in cars in the coming months and years. Ford Motor Company began limited distribution in 2012 of its all electric Focus and the C-Max Energi. In addition to the major automobile manufacturers new entrants have entered, or plan to enter, the U.S. automobile market offering plug-in vehicles serving niche markets. These include Tesla with their Model S and Fisker Automotive’s plug-in hybrid Karma, both of which cater to high-end car enthusiasts. Other new entrants with plans to enter the U.S. market offering plug-in vehicles include Coda Automotive and China’s BYD. Plug-in cars may be considered hyper-efficient devices as they deliver per mile cost of driving that is a fraction of that for a typical gas-

8
powered vehicle. A plug-in car that gets 3 miles per kWh has fuel costs of $0.04/mile. In contrast, a vehicle that gets 32 miles per gallon at a fuel cost of $3.50 per gallon incurs fuel costs of $0.11/mile.
i. Plug-in car performance in hilly terrain and cold climates
Given the hilly terrain and cold climate it is anticipated that the advertized all electric driving ranges for plug-in cars will not be realized in Vermont. A study by the author evaluating the performance of two plug-in vehicle conversions using a Hymotion after market conversion kit on the 2007 Toyota Prius, found average fuel economies of approximately 70 mpg when the vehicles were operating in charge depleting mode. The same study found a 12% reduction in fuel economy between summer and winter driving. The manufacturer of the plug-in conversion kits claimed 100 mpg was achievable. While 100 mpg was realized on a few trips recorded as part of the research, it was not the norm (Letendre and Mackey, 2008). The cold weather reduces the all electric range for plug-in cars due to a number of factors. Both plug-in cars and conventional vehicles are less efficient during the winter due to higher drag snow tires, denser air and the fact that fluids have lower viscosity all of which serve to reduce fuel economy. A significant energy demand for plug-in cars is associated with heating the cabin and defrosting windows. All electric vehicles don’t have an internal combustion engine (ICE), and thus the abundant waste heat of combustion is not available for heating the cabin or defrosting windows. The demand for electricity for window defrosting and warming the cabin in cold climates draws electricity from the battery and thus reduces the number of all-electric miles that can be driven. A plug-in hybrid electric vehicle has the advantage of an ICE that can be used to draw heat for the cabin and window defrosting. However, the need for heat in cold weather will cause the ICE to run more often and thus reduce overall fuel economy. The most significant issue with regard to plug-in cars and cold weather relates to impacts associated with the battery chemistry. A quote from Bryan Johannsen’s article on TheElectricCar.com titled “How do Electric Cars Operate in Cold Weather Climates,” states:
All batteries deliver their power via a chemical reaction inside the battery that
releases electrons. When the temperature drops the chemical reactions happen
more slowly and the battery cannot produce the same current that it can at room
temperature. A change of ten degrees can sap 50% of a battery's output. In some
situations the chemical reactions will happen so slowly and give so little power
that the battery will appear to be dead when in fact if it is warmed up it will go
right back to normal output.
(Source: http://www.thecarelectric.com/content/electric-cars-in-cold-climates.php)
The impact on battery chemistry from the cold not only reduces driving range, but can also impact the rate of charging.
Early adopters of the Volt, Leaf and the limited distribution of electric Mini Cooper have reported significant range reductions during cold weather months. The automobile manufacturers have recognized this issue and are developing a variety of strategies to address cold weather performance. Most currently available plug-in cars offer the option to preheat the cabin while plugged-in to reduce auxiliary energy demands while driving. In addition, some battery pack systems use active heating and
9
cooling strategies to keep the pack at the optimal operating temperature. In 2012 Nissan integrated a cold weather package for the Leaf as standard, which includes battery heater, heated steering wheel, and heated seats (front and rear). Additional research is needed in Vermont to better understand the cold weather impacts on the efficiency and charging of currently available plug-in vehicles, along with the most cost-effective strategies to mitigate these issues.
ii. Plug-in car sales and future projections
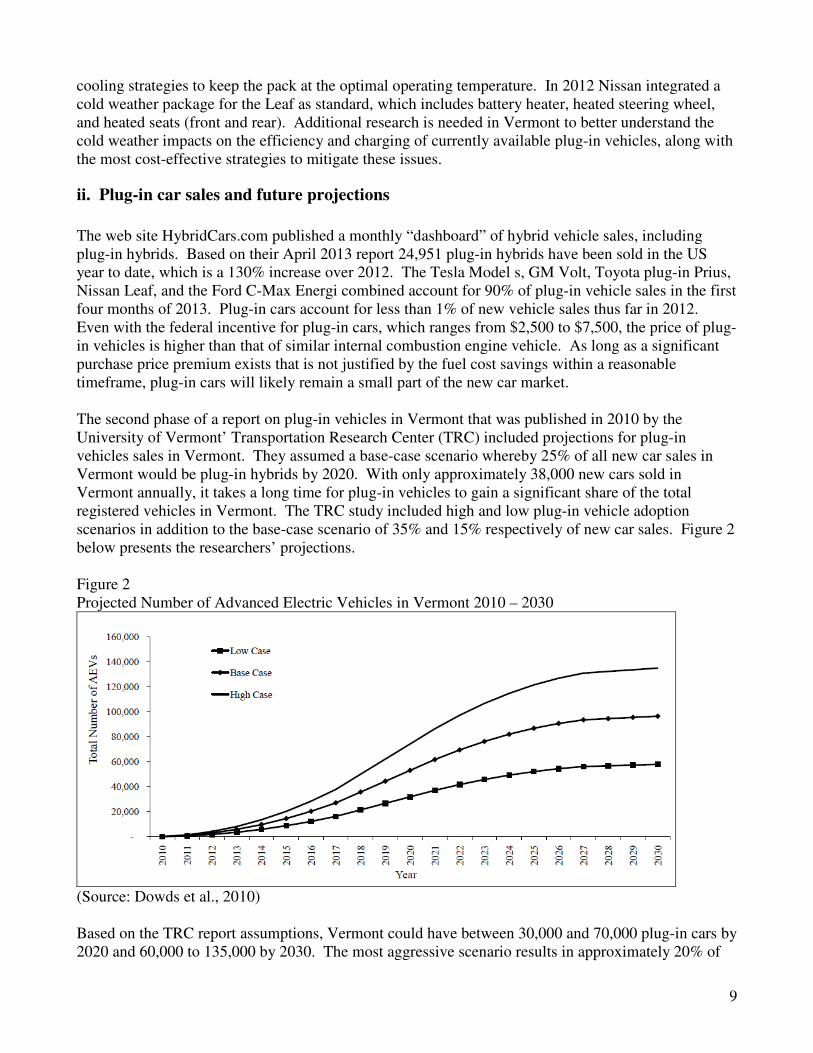
The web site HybridCars.com published a monthly “dashboard” of hybrid vehicle sales, including plug-in hybrids. Based on their April 2013 report 24,951 plug-in hybrids have been sold in the US year to date, which is a 130% increase over 2012. The Tesla Model s, GM Volt, Toyota plug-in Prius, Nissan Leaf, and the Ford C-Max Energi combined account for 90% of plug-in vehicle sales in the first four months of 2013. Plug-in cars account for less than 1% of new vehicle sales thus far in 2012. Even with the federal incentive for plug-in cars, which ranges from $2,500 to $7,500, the price of plug-in vehicles is higher than that of similar internal combustion engine vehicle. As long as a significant purchase price premium exists that is not justified by the fuel cost savings within a reasonable timeframe, plug-in cars will likely remain a small part of the new car market. The second phase of a report on plug-in vehicles in Vermont that was published in 2010 by the University of Vermont’ Transportation Research Center (TRC) included projections for plug-in vehicles sales in Vermont. They assumed a base-case scenario whereby 25% of all new car sales in Vermont would be plug-in hybrids by 2020. With only approximately 38,000 new cars sold in Vermont annually, it takes a long time for plug-in vehicles to gain a significant share of the total registered vehicles in Vermont. The TRC study included high and low plug-in vehicle adoption scenarios in addition to the base-case scenario of 35% and 15% respectively of new car sales. Figure 2 below presents the researchers’ projections. Figure 2 Projected Number of Advanced Electric Vehicles in Vermont 2010 – 2030
(Source: Dowds et al., 2010) Based on the TRC report assumptions, Vermont could have between 30,000 and 70,000 plug-in cars by 2020 and 60,000 to 135,000 by 2030. The most aggressive scenario results in approximately 20% of

10
all vehicles in Vermont being plug-in cars by 2030. The actual market penetration of plug-in cars will depend on a number of key variables. This includes the cost premium for plug-in cars over conventional vehicles. This is primarily driven by battery costs. New technologies and innovations with battery chemistries could serve to dramatically reduce the cost and increase the driving range achieved from a single charge. Another factor that would impact the rate of plug-in vehicle adoption is the price of gasoline. Higher gas prices reduce the length of time that fuel cost savings offset the higher initial purchase price of a plug-in vehicle. Consumer research is needed to determine the best mechanisms to encourage the adoption of plug-in cars in Vermont if deemed to be consistent with advancing societal benefits and the public good.
iii. Meeting the energy needs for vehicle charging in Vermont
The TRC Phase I report on plug-in vehicles in Vermont found that the energy needs of a large fleet of plug-in cars in Vermont could be met without the need to acquire additional transmission and generation facilities, provided that most charging is confined to the late evening and early morning hours—so-called valley filling (Letendre et. al, 2008). The findings in Vermont are consistent with a number of national studies, which also found that the energy needs for a large fleet of plug-in cars can be met without the need to build additional transmission and generation facilities (Hadley and Tsvetkova, 2008 and Kintner-Meyer et al., 2007). The phase II TRC report took the vehicle market penetration forecast and estimated the energy requirements to meet the new projected load for vehicle charging. The projected range of 60,000 to 135,000 plug-in cars in Vermont in 2030 would require between 150 – 520 GWh annually to charge the vehicles, which represents approximately 2.5 to 8.6 percent of total electrical energy use in Vermont in 2005 (Dowds et al., 2010). Thus, even the most aggressive scenario for vehicle adoption would increase energy use in Vermont by less than 10% in 2030. While the energy needs of a large fleet of plug-in cars in Vermont are rather modest relative to electricity consumption in homes and businesses, the instantaneous demand from vehicle charging could increase peak demand for power in Vermont if not managed accordingly. The instantaneous demand for vehicle charging is a function of the rate of vehicle charging and the timing of vehicle charging for the fleet of plug-in vehicles in Vermont. Slower charging rates and staggered charging of vehicles minimizes the instantaneous demand for power. The industry has established 3 charging levels. Level 1 Charging is the technical term for using an ordinary household outlet to charge a vehicle, typically at 120 volts, delivering on average about 4.5 miles of range per hour of charging. Level 2 Charging requires a commercial vehicle charger that supplies 240 volts, similar to what an electric dryer or oven uses. Level 2 allows for a wide range of charging rates with demand impacts up to 19.2 kilowatts, delivering a potential of 7 miles of range per hour of charging. Level 3 charging is the fastest method of vehicle charging and the most expensive units to purchase. Level 3 fast charging stations use direct current (DC) power, which can provide up to 40 miles of range for every 10 minutes of charging. These stations cost up to $100,000 and require more instantaneous power than a typical house, so these will be deployed in central locations for consumers to access along major travel corridors by paying a fee for rapid charging. Fast charging makes it far more practical to drive beyond a plug-in vehicle’s single-charge range in one day. The Phase II TRC report estimated the demand for vehicle charging assuming slow charging at a rate of 1.9 kW (120 v/20 amp.) and fast charging at a rate of 7.7 kW (240 v/40 amp). Table 3 presents the

11
instantaneous demand for power if all vehicles were charging at the same time (an extremely unlikely, worst-case scenario), based on the plug-in vehicle adoption scenarios discussed above. Table 3 Projected Demand (MW) for Vehicle Charging
Source: Dowds et al., 2010, Table 5-3 As Table 3 suggests, even though plug-in cars represent a modest share of the total fleet of vehicles in Vermont, the instantaneous demand for power if charging all at once would be significant. Thus both the rate of charging and the timing of vehicle charging are important issues for power companies to manage. Even at very low plug-in vehicle adoption rates, small neighborhood clusters of plug-in vehicle owners with Level 2 chargers could potentially overload distribution circuits and associated equipment. One of the potential benefits of smart grid technology may be the ability to stagger vehicle charging in an area that may have distribution constraints. While shifting vehicle charging to off peak periods is important on those days when the system is close to its annual peak, many days of the year charging during peak demand hours would not be problematic. There are two basic ways to move vehicle charging to off-peak hours. The first approach would be direct control of vehicle charging by the utility company. Utility companies have been running direct load control programs for decades, which include the cycling on and off of loads such as air conditioners or water heaters in response to system conditions. Directly controlling the timing of vehicle charging would be an extension of these types of programs and would require utilities to offer incentives for customers to relinquish control over the timing of vehicle charging. Power companies would need to manage vehicle charging so that vehicles begin the commute day with a full battery. A second approach to shift vehicle charging to off-peak hours is to offer favorable rates for off-peak charging to plug-in vehicle owners. As part of the federally funded EV Project (the largest deployment of electric vehicles and charge infrastructure in history), the Idaho National Laboratory has been collecting data on vehicle charging for hundreds of electric vehicles deployed in different regions in the US. They analyzed the charging behaviors of plug-in vehicle owners from two regions, one with favorable off-peak charging rates and the other without an off-peak rate. They found that favorable off-peak rates lead to a reliable delay in vehicle charging to 12:00 am, when the favorable off-peak rates went into effect. This is contrast to the vehicle charging beginning at 4:00 pm, with demand from vehicle charging peaking at 8:00 pm in the region without an off-peak rate (Francfort, 2012).

12
B. Heat-Pumps and Electric Furnaces: Applicability in Vermont
In the 1960’s and 1970’s throughout New England many homes were outfitted with baseboard electric heaters. These systems convert electricity into thermal energy using resister elements that heat up and radiate and convect heat into living spaces. The high cost of using electric heat and the economics of central heating systems using a fuel source such as oil, natural gas, or propane greatly reduced the number of homes using electricity for space heating starting in the decade of the 1990’s. According the EIA only 5% of Vermont households use electricity as the primary means for home heating; this compares to 30% of homes nationwide. To this day, there is still a strong resistance to using electricity for heat energy among many energy analysts. The noted energy physicist Amory Lovins noted in the late 1970’s that, “…using electricity for heat is like cutting butter with a chain saw.” As stated above, most Vermont homes and businesses now use fuel oil or propane as the primary energy source for home heating and domestic hot water. Here we evaluate the use of new hyper-efficient electric technologies for home heating and domestic hot water in Vermont. The technologies evaluated include ground-source heat pumps and advanced air-source heat pumps for both space heating and domestic hot water. Central electric furnaces with thermal storage capacity are also considered given the opportunity to use off-peak energy with these systems for home heating and their potential use as a dump load to balance intermittent renewable generation that might not be needed on the grid.
i. Heat pump technology
A heat pump is an electro-mechanical device that reverses the natural flow of heat energy. Heat energy naturally moves from hot to cold. A heat pump can move heat from a relatively cold space and releases it into a warmer one. This is the basic principle that is in operation in a refrigerator/freezer and air conditioning units. However, the term heat pump refers to appliances used for home heating, and increasingly for domestic water heaters. Heat pumps use a refrigerant in a sealed system to absorb heat to vaporize the refrigerant in a device called the evaporator, and then a compressor converts the vapor to a higher pressure which can release heat when the refrigerant condenses back to a liquid in the condenser. The refrigerant flows through insulated pipes between the evaporator and the condenser, allowing for efficient thermal energy transfer over relatively long distances. The heat pump is reversible allowing the direction of the refrigerant flow to change thus the system can operate as a source of heat for a home in the winter and as a source of cooling during the summer months. From the online information site Wikipedia:
• In heating mode, the outdoor coil is an evaporator, while the indoor coil is a condenser. The refrigerant flowing from the evaporator (outdoor coil) carries the thermal energy from outside air (or ground) indoors, after the fluid's temperature and pressure has been augmented by compressing it. The indoor coil then transfers thermal energy (including energy from the compression) to the indoor air, which is then moved around the inside of the building by an air handler. The refrigerant is then allowed to expand and absorb heat from the outdoor environment through the outside evaporator, and the cycle repeats. This is a standard refrigeration cycle, except that the "cold" side of the refrigerator (the evaporator coil) is positioned so it is outdoors where the environment is colder.

13
• In cooling mode the cycle is similar, but the outdoor coil is now the condenser and the indoor coil (which reaches a lower temperature) is the evaporator. This is the familiar mode in which air conditioners operate. (source: http://en.wikipedia.org/wiki/Heat_pump#Heat_transport)
A heat pump needs a source of heat; the outside air or the heat of the earth several feet below the surface (ground-source) are the two common sources of heat to initiate the evaporative stage of the heat pump cycle. The heat is absorbed as the refrigerant is transformed from a liquid to a gaseous state. The compressor increases the pressure further raising the heat of the refrigerant; this heat is then transferred to the interior space of the building. The refrigerant then condenses and reaches an expansion valve in liquid state to begin the cycle once again. This is reversed during cooling, when the interior space becomes the source of heat to initiate the evaporative stage. Heat pumps for home heating and cooling can be used with a number of heat distribution systems, including forced hot air or hydronic systems. For forced hot air, the heat generated by the heat pump is transferred to the air of the central air distribution system. A hydronic system transfers the heat generated by the heat pump to water for distribution to in-floor or baseboard radiant heating systems. Geothermal heat pump systems can be configured in a variety of ways. This includes open loop systems using a well and closed loop systems that use the earth or a nearby pond as a heat source. In addition, a number of manufacturers now sell air to water heat pumps for domestic hot water production. Another air source heat pump is a ductless unit and is often referred to as a split system, with the compressor unit outside and the heat distribution unit inside. The two units are connected through the house by copper piping. The outdoor unit houses a coil that acts as a heat exchanger and compressor. The indoor unit houses a coil and a fan to distribute the heat (or cold during summer months) into the living spaces. Some of these split systems have multiple interior units connected to the single outside unit. Heat pumps can be retrofitted to existing homes, which is important in Vermont as the market for new construction will likely remain rather limited in the coming decade. In addition, heat pumps for home space heating require a back up heating system for the coldest days, which rely on traditional fuels. Thus, most existing homes have a readily available fuel-based central heating system. A home that uses both a heat pump and a conventional fuel can be thought of as a hybrid house, similar to the way in which a hybrid electric car switches between electricity and gasoline to propel the vehicle. Air source heat pumps are given two efficiency ratings. The heat pump efficiency rating for home heating is called the Coefficient of Performance (COP), which is the ratio of heat output to the amount of energy input to operate the heat pump. Thus a COP of 3 indicated that the system is providing 3 units of heat energy for every unit of energy consumed, thus the label of hyper-efficient device at 300% conversion efficiency. This is the key efficiency advantage of a heat pump relative to traditional electric resistance heaters, which have a COP of 1. The COP varies with the differential between the heat source temperature (outdoor or ground) and the interior temperature requirements. Thus, the colder it gets outside the less efficient an air source heat pump becomes at delivering heat to interior spaces and the heat output declines. Table 4 below was taken from the specification sheet for the Amana heat pump model ASZC180361A with 35,000 Btu heating and cooling capacity. This table shows the COP as a function of outdoor ambient temperature.

14
An additional measure of efficiency for air source heat pumps is the HSPF (heating seasonal performance factor), which is calculated based on a heat pump's estimated seasonal heating output in BTUs divided by the amount of energy that it consumes in watt-hours. The HSPF can be converted to a seasonally-averaged COP by converting both the Btu heat output and the electrical input to a common energy unit. New heat pumps manufactured after 2005 are required to have an HSPF of at least 7.7. The most efficient heat pumps have an HSPF of 10. Energy Star rated air source heat pumps must have an HSPF of at least 8.2 and a SEER (seasonal energy efficiency ratio) of 14.5. The HSPF can be converted to an annual average COP by multiplying it by the 0.293 to have the numerator and the denominator into common units of Joules (1,055 Joules/Btu / 3,600 Joules/watt-hour). Thus a heat pump with an HSPF of 8.2 would have an average annual COP of 2.4. Table 4 Sample Data Table from Amana Heat Pump Unit
Air source heat pumps are also given efficiency ratings for when the unit is providing space cooling during the summer months. The industry rating for air conditioning units is SEER, which is the cooling output in Btu during a typical cooling season divided by the total electric energy input in watt-hours during the same period; the higher the unit's SEER rating the more energy efficient it is. The Amana heat pump unit discussed above has a SEER of 18. As of January 2006, all residential air conditioners sold in the United States must have a SEER of at least 13. ENERGY STAR qualified Central Air Conditioners must have a SEER of at least 14. Geothermal heat pump systems reach high COP of 3 to 6 on the coldest of winter nights compared to 1.75 to 2.5 for air source heat pumps. This is due to the fact that the heat source for the ground geothermal heat pump is the ground, which is a constant temperature year round several feet below the ground, which in Vermont about 50° F. As of January 2012 the Energy Star standard for Tier 3 closed loop, water to air geothermal heat pump systems is a COP of 3.6. While ground-source heat pumps may operate more efficiently than air source heat pumps, they tend to be more complex and higher cost, which often includes drilling one or more wells. Furthermore, ground source heat pumps require more energy relative to an air source unit for pumping fluid through the geothermal loop, which is not figured into the COP. Heat pump water heaters use an efficiency rating known as the efficiency factor (EF), which is synonymous with COP. Energy Star qualified heat pump water heaters have EFs ranging from 2.0 – 2.5. Recent innovations have increased the efficiency of advanced air source heat pump technology. It is anticipated that heat pumps will continue to improve their performance over time. The following was found at EnergySavers.gov:

15
Unlike standard compressors that can only operate at full capacity, two-speed and variable speed compressors allow heat pumps to operate close to the heating or cooling capacity that is needed at any particular moment. This saves large amounts of electrical energy and reduces compressor wear. Two-speed heat pumps also work well with zone control systems. Zone control systems, which are often found in larger homes, allow the heat pump to keep different rooms at different temperatures. Some models of heat pumps are equipped with variable-speed or dual-speed motors on their indoor fans (blowers), outdoor fans, or both. The variable-speed controls for these fans attempt to keep the air moving at a comfortable velocity, minimizing cool drafts and maximizing electrical savings. It also minimizes the noise from the blower running at full speed. High-efficiency heat pumps can be equipped with a desuperheater, which recovers waste heat from the heat pump's cooling mode to pre heat domestic hot water. A desuperheater-equipped heat pump can heat water 2 to 3 times more efficiently than an ordinary electric water heater. Another advance in heat pump technology is the scroll compressor, which consists of two spiral-shaped scrolls. One remains stationary, while the other orbits above it, compressing the refrigerant by forcing it into increasingly smaller eccentric spiral areas. Compared to the typical piston compressors, scroll compressors have a longer operating life and are quieter. According to some reports, heat pumps with scroll compressors provide 10°–15°F warmer air when in the heating mode, compared to existing heat pumps with piston compressors. Although heat pumps could use electric resistance heaters as a backup for cold weather, heat pumps should be partnered in a hybrid home with traditional fossil fueled space heating appliances for use only on the very coldest days to supplement the heat pump. Since there are few heat pump manufacturers that incorporate both types of heat supply in one box, these configurations are often two smaller, side-by-side, standard systems sharing the same ductwork. The combustion fuel half of the system could be propane, natural gas, oil, or even coal and wood. (Source: http://www.energysavers.gov/your_home/space_heating_cooling/index.cfm/mytopic=12700)
ii. Electric Furnace with Thermal Storage
An electric furnace is similar to other central heating systems, but uses electricity to produce heat instead of using oil or propane as a fuel. Newer electric furnaces include a thermal storage system consisting of ceramic bricks encased in an insulated container that can store thermal energy. This creates two key advantages. The first is that these systems can use off peak electricity to “charge” the thermal storage system. Off-peak electricity can be less expensive with time of use rates from an electric utility due to the excess capacity that utility companies may have during the evening and early morning hours. There is also a benefit of having a thermal storage system to take advantage of renewable generation that might otherwise go unused on the grid during certain conditions. Some

16
studies have also investigated the use of an electric furnace in helping to provide reliability services to the grid, such as frequency regulation. The leading manufacturer of electric furnaces with thermal storage is Steffes Corporation. They manufacture a line of residential electric furnaces with thermal storage, including room units and central heating units for forced hot air or hydronic distribution systems. Image 1 below is of the Steffes room unit. Image 1 Steffes Corporation Electric Furnace with Thermal Storage Room Unit
An electric furnace with thermal storage can be retrofitted to an existing home as a source of heat for a single room or to work in parallel with an existing central heating system using oil, propane, or natural gas. These units are 100% efficient, as each kWh of electricity is transferred into thermal energy through the heating element. Again, this is in contrast to a heat pump with an efficiency of 200% or more.
iii. Heat pumps and electric furnaces in Vermont
Vermont has a long and challenging heating season, with approximately 7,200 heating degree days. Heating degree days (HDD) is a climatic statistic that engineers and economists use that reflects the severity and length of the heating season. To calculate HDD, take the average of a day's high and low temperatures and subtract from 65. For example, if the day's average temperature is 50o F, its HDD is 15. If every day in a 30-day month had an average temperature of 50o F, the month's HDD value would be 450 (15 x 30). Vermont ranks number 6th in the nation in terms of number of heating degree days. A similar measure to HDD is calculated for cooling. Vermont has an average of 334 cooling degree days, which places Vermont as 47 in a national ranking of state cooling degree days. In sum, Vermont

17
households have a much greater demand for heating relative to cooling as compared to other regions of the country. The amount of fuel used for home heating is a function of both HDD and the thermal efficiency of the building. A well-insulated building with minimal air infiltration will require less energy to heat over the heating season then a comparable sized structure with less insulation and many air leaks. Prior to the installation of any new supplemental heating system to an existing home, an effort should be made to first weatherize the home based on best practices. A home energy audit by a certified Building Performance Institute contractor can help identify issues and recommend solutions to reduce the heat loss from a home. In Vermont this service can cost between $300 and $400 dollars. Investments in home weatherization often have very favorable payback periods, meaning the energy savings can quickly pay for the investment to make a home more energy efficient. There are no obvious barriers to using advanced heat pumps and thermal furnaces for space heating and domestic hot water in Vermont. Given the fact that Vermont has the 6th highest heating degree days (HDD) in the nation, air source heat pumps will not achieve performance efficiencies comparable to their use in other regions with fewer HDD. New heat pump designs using multi-speed and variable compressors and variable speed fans can help improve heat pump efficiencies in challenging climates like Vermont’s. Home retrofits using ductless heat pump systems face several challenges. They do not operate cost-effectively in homes that are highly segmented as the heat does not distribute evenly. Homes with single zone central fossil heating systems are challenging to displace due to the fact that a space heater does not have an effective zone the same size as the heating system zone, which results in cold rooms or non-operation of the heat pump. Furthermore, multiple control systems can be cumbersome and confusing, resulting in non-optimized use of the heat pump system. Electric rates in Vermont are relatively high compared to other regions of the country. Electricity for home heating in Vermont displaces fuel oil or propane, which are more expensive per unit of heat energy than natural gas—the primary heating fuel in most regions of the US. Thus the higher electric rates may be more than offset due to the more expensive fuels displaced in Vermont using heat pumps and electric furnaces with thermal storage relative to other regions in the US.
iv. Electric demand from heat pumps and electric furnaces
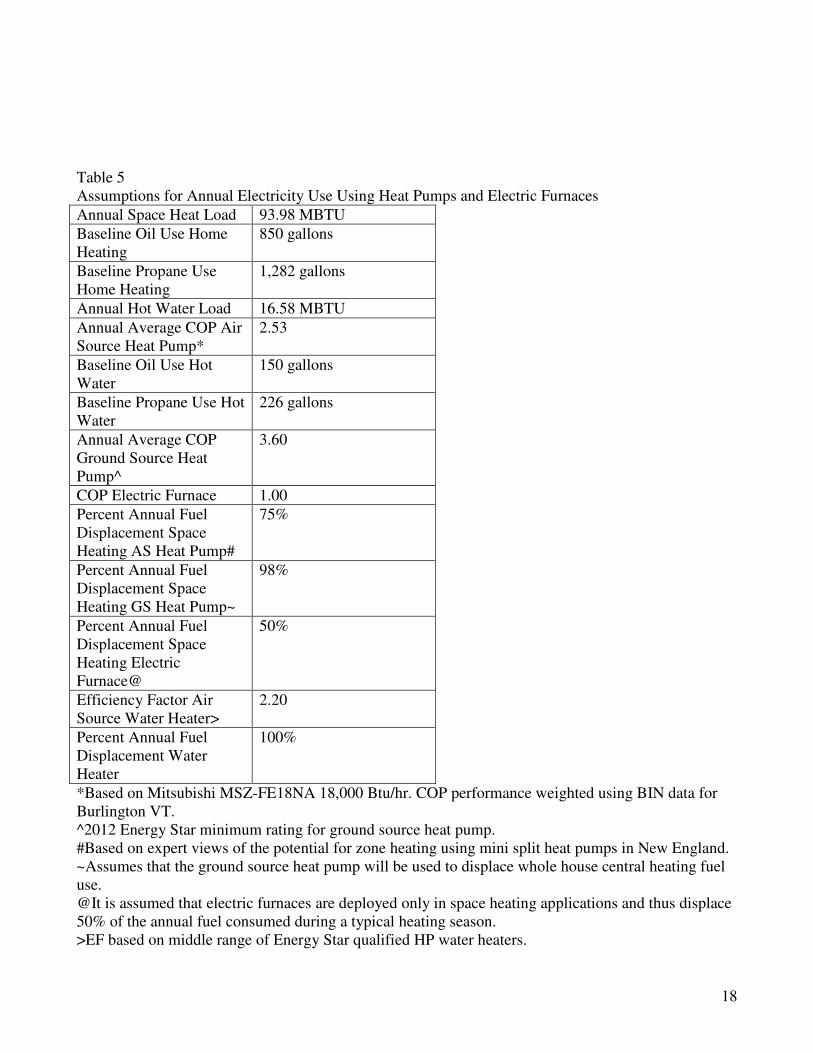
Here we focus on the residential sector to estimate the annual electricity consumption for four technologies: ground source and air source heat pumps for space heating, electric furnace for space heating, and air source heat pump for domestic hot water. The basic assumptions for these estimates are presented in Table 5.
18
Table 5 Assumptions for Annual Electricity Use Using Heat Pumps and Electric Furnaces
Annual Space Heat Load 93.98 MBTU
Baseline Oil Use Home Heating
850 gallons
Baseline Propane Use Home Heating
1,282 gallons
Annual Hot Water Load 16.58 MBTU
Annual Average COP Air Source Heat Pump*
2.53
Baseline Oil Use Hot Water
150 gallons
Baseline Propane Use Hot Water
226 gallons
Annual Average COP Ground Source Heat Pump^
3.60
COP Electric Furnace 1.00
Percent Annual Fuel Displacement Space Heating AS Heat Pump#
75%
Percent Annual Fuel Displacement Space Heating GS Heat Pump~
98%
Percent Annual Fuel Displacement Space Heating Electric Furnace@
50%
Efficiency Factor Air Source Water Heater>
2.20
Percent Annual Fuel Displacement Water Heater
100%
*Based on Mitsubishi MSZ-FE18NA 18,000 Btu/hr. COP performance weighted using BIN data for Burlington VT. ^2012 Energy Star minimum rating for ground source heat pump. #Based on expert views of the potential for zone heating using mini split heat pumps in New England. ~Assumes that the ground source heat pump will be used to displace whole house central heating fuel use. @It is assumed that electric furnaces are deployed only in space heating applications and thus displace 50% of the annual fuel consumed during a typical heating season. >EF based on middle range of Energy Star qualified HP water heaters.

19
The general equation to calculate annual energy use for space and hot water heating is as follows:
)/1(** COPorEFntlDiplacemePercentFueHeatLoadMBTUetricictyUsAnnualElec =
Using the above assumptions and equation, annual electricity use was estimated for each of the four technologies. The decision to install one of these systems is a function of the installed cost versus the annual energy savings. The annual energy savings is based on the amount and cost of the fuel oil or propane displaced with the new system. Table 6 below provides estimates of the annual energy savings for each technology.
Figure 3
Annual Electricity Use Estimates by Device Type
-
2,000.00
4,000.00
6,000.00
8,000.00
10,000.00
12,000.00
14,000.00
16,000.00
Air Source HP
Space Heat
Ground Source
HP Space Heat
Electric
Furnace
Air Source HP
Hot Water
kW
h
Table 6 Projected Annual Energy Cost Savings: Fuel Oil & Propane*
Oil Propane
Air Source HP Space Heating $1,350 $1,682
Ground Source HP Space Heating
$2,228 $2,661
Electric Furnace ($317) ($96)
Air Source HP Hot Water $276 $353
*Assumes current market prices (8/12) of fuel oil at $3.99 and propane at $2.99 and GMP Rate 1 ($0.14615/kWh). All technologies reduce annual energy costs except for the electric furnace. A favorable off-peak rate would be required to generate net annual energy savings from the use of an electric furnace with thermal storage. The payback period—the number of years it takes to pay for the initial investment through annual energy savings—is a function of both the annual energy savings and the installed cost of the system. Although a ground source heat pump offers greater annual energy savings potential, the cost of digging a well or trenches to lay the ground heat exchanger tubing can be quite high. Calculating the payback for the air source heat pump for water heating is a bit more complicated, in that the decision to do so would occur when the homeowners is in need of replacing their existing water heater. So the payback would involve looking at the cost differential between standard water

20
heaters using propane, oil, or electricity and the high-efficient heat pump unit. The annual fuel savings potential would depend on the fuel used by the reference water heater being considered by the homeowner. Here we calculate the total potential energy use for various heat pump penetration scenarios for the residential sector. The particular heat pump system depends to a large extent on the characteristics of the home being retrofitted. The existing heating system and heat delivery system (forced hot air or hydronic) influences the type of heat pump system that would maximize a customer’s investment. To investigate the state-wide energy use given various fuel displacement scenarios, we use an annual average COP of 3.0 across all retrofits. Any particular retrofit project would have a different average annual COP. A ground source system would have a COP well above the average (we assume a COP of 3.6 in the above analysis), while air source heat pump installations would have perhaps a lower annual average COP (we assume a COP 2.53 in the above analysis). The annual increase in electricity use using heat pump water heaters to replace oil and propane water heaters is also estimated using different fuel displacement scenarios, using a COP of 2.2. The analysis uses total Vermont-wide consumption estimates of fuel oil and propane use for 2010 developed by the US Department of Energy’s Energy Information Administration. Total consumption was divided into use for space heating and water heating using data from a 2007 study by GDS Associates for the Vermont Department of Public Service (see Table 7). The percentage of total consumption by end-uses for space and water heating consumption are based on a phone survey of local Vermont fuel and service providers, which found for fuel oil that 86 percent of purchases are for space heating and 14 percent for water heating. For propane the survey found that 47 percent of purchases are for space heating, 13 percent for water heating, and 40 percent for other end uses (GDS Associates, 2007). Table 8 contains the annual electricity use from displacing fuel oil and propane for space and water heating using an array of heat pump technology described above. Table 7 Total Consumption for Space and Water Heating by Fuel Type 2010 Vermont (Trillion Btu)
Fuel Space Heating Water Heating
Fuel Oil 8.60 1.40
Propane 2.77 0.77
Source: US DOE EIA Table 8 Increased Electricity Use in Vermont from Heat Pump Deployment for Space and Water Heating Given Various Fuel Displacement Scenarios (MWh)
Fuel Displacement
Scenario
Space Heating
Water Heating
Oil Propane Oil Propane
10% 83,993 27,083 18,645 10,215
20% 167,985 54,165 37,291 20,430
30% 251,978 81,248 55,936 30,645
40% 335,970 108,331 74,581 40,860
50% 419,963 135,414 93,226 51,075
Note: These estimates do not consider the increased annual electricity use if homeowners decide to use the cooling function of the heat pumps during the summer months.

21
Based on the values in Table 8, 50 percent fuel displacement across the board would represent a 12 percent increase in annual electricity consumption in Vermont, assuming approximately 6,000 GWh of electricity use annually. On a demand basis, a heat pump for space heating can draw over 3 kW in instantaneous power, thus a thousand homes could potentially increase the peak demand for power by 3 MW if all heat pumps were operating at the same instant. A heat pump hot water heater could have a higher power input of 4.5 kW. It is unlikely that these systems would create any local distribution constraints. A room unit electric furnace like the Steffes discussed above could require a power draw of up to 10 kW. A clustering of homes with these units could create local distribution constraints, similar to those discussed above for electric vehicles. However, this high power connection could be useful to allow for the use of renewable energy generation that would otherwise by curtailed and provides a sufficient power input range to allow these units to participate in emerging markets for end-use ancillary services.
III. Fuel Displacement and Carbon Reduction Potential for Hyper
Efficient Devices
Plug-in cars and heat pumps displace petroleum-based fuels currently being used for transportation, space heating, and water heating with electricity. As discussed above the most aggressive scenarios of plug-in vehicle adoption in Vermont in 2030 of 135,000 vehicles, which could increase electricity consumption by approximately 520,000 MWh annually according to the analysis by researchers at the University of Vermont’s Transportation Research Center. Additionally, assuming that 50 percent of the fuel oil and propane used for space heating and water heating is displaced with heat pump technology, annual increased electricity consumptions is estimated to be 700,000 MWh. Combined plug-in cars and heat pump technology under the most aggressive market adoption scenarios would increase electricity use in Vermont by approximately 1,350 GWh or 20 percent of Vermont’s annual electricity consumption in 2030. This shift from petroleum-based fuels for transportation, space heating, and water heating to electricity could significantly reduce energy costs for Vermonters and at the same time dramatically reduced greenhouse gas emissions.
A. The Benefits of Displacing Gasoline with Electricity for Transportation.
Consumers are largely dependent on gasoline as the only fuel choice for transportation. Vermonters typically drive greater distances each year relative to their counterparts in different regions. Per capita vehicle miles traveled in Vermont in 2009 was 12,297, which is 27.9 percent above the national average (VT Department of Public Service, 2011). The rural character of Vermont makes car ownership a necessity for most households. As discussed above, for the first time in several decades, car buyers are being offered the choice to purchase an all electric or hybrid electric vehicles that plug-in to the grid using electricity to displace gasoline for transportation. The market penetration study of plug-in electric vehicles developed by researchers at the University of Vermont’s Transportation Research Center was used to assess the fuel displacement potential of plug-in vehicles. They found that in 2020 there could be between 32,000 to 75,000 plug-in vehicles in operation in Vermont. Looking further into the future the study projects that in 2030 there could be between 58,000 and 135,000 plug-in vehicles in Vermont. In 2010 there were approximately 550,000

22
registered vehicles in the state of Vermont. As of April 2013 there were 311 passenger plug-in cars registered in the state of Vermont. This suggests that consumer adoption of these vehicles is much slower than the UVM study estimated due in part to the slower than expected plug-in vehicle options available to consumers. The low penetration scenario of the 2010 study projected plug-in vehicle registrations in Vermont would be 1,737 at the end of 2012. The increase consumption of electricity for vehicle charging will be determined by the penetration rate of vehicles discussed above and the vehicle designs that emerge, particularly the size of the on-board energy storage system. The UVM study assumed that the average on-board battery storage capacity will increase over time as the technology improves and costs decline. Their base case analysis predicted the average on-board energy storage system of the fleet of plug-in cars would increase from 21.1 kWh in 2010 to 52.8 kWh in 2030. As a result, overtime more of the 15,000 miles of assumed annual travel per vehicle is met with electricity. Figure 4 provides the base case estimates of increase demand for electricity from 2010 – 2030 from the UVM study based on their market penetration projections.
Figure 4
Projected Need for Electric Energy from Plug-In Cars
-
50,000
100,000
150,000
200,000
250,000
300,000
350,000
2010 2011 2012 2013 2014 2015 2016 2017 2018 2019 2020 2021 2022 2023 2024 2025 2026 2027 2028 2029 2030
Year
MW
h
Annual fuel savings are calculated by estimating how much gasoline would have been consumed by a conventional vehicle to meet the miles of travel provided with electricity. This calculation is very sensitive to the fuel economy assumption of the conventional vehicle. For simplicity, we assume 30 mpg as a reasonable base scenario; fuel savings would be higher if the reference vehicle had lower fuel economy and lower if the reference vehicle had a higher mpg rating. Table 9 contains the annual gasoline displaced and the net fuel cost savings to consumers from displacing gasoline with electricity for transportation for select years in the forecast timeframe. Favorable off-peak rates to encourage plug-in vehicle owners to charge during non peak hours would increase the net fuel cost savings presented in Table 9.

23
Table 9 Fuel Displacement and Savings Potential for Plug-in Vehicles in Vermont
Year Fuel Displacement (gallons) Fuel Cost Savings*
2015 2,904,264 $6,306,213
2020 13,652,168 $28,992,411
2025 25,914,971 $56,144,669
2030 34,007,194 $73,841,984
*Nominal savings assume $3.50 per gallon of gasoline and GMP Rate 1 $0.14615/kWh. Plug-in vehicles offer Vermonters the opportunity to save millions of gallons of gasoline annually thus reducing fuel costs for transportation by potentially tens of millions of dollars. Displacing gasoline with electricity keeps a portion of the fuel costs paid by Vermonters in state, due to electric utility ownership of instate generation and transmission and distribution assets. In addition, increased sales of electricity will serve to increase the utilization of the utilities’ asset base, putting down ward pressure on rates. Economic theory suggests that dollars that stay in Vermont create a multiplier effect and stimulate additional economic activity within the State. Thus, displacing gasoline with electricity for transportation could contribute to a stronger regional economy. Governor Shumlin has been an outspoken advocate for taking steps to reduce Vermont’s GHG emissions. Vermont has established aggressive goals of reducing emissions from 1990 baseline levels as follows: 25 percent by 2012; 50 percent by 2028; and, if practicable using reasonable efforts, 75 percent by 2050 (10 V.S.A. § 578). Transportation represents the single largest source of greenhouse gas (GHG) emissions in the State. According to the Vermont Agency of Natural Resources, transportation represents 46 percent of the total annual GHG emissions in Vermont. A transition to plug-in cars represents an opportunity to make significant progress toward reducing transportation-related GHG emissions in Vermont. To better understand this potential, estimate of the net GHG reductions were calculated from displacing gasoline with electricity in Vermont’s light vehicle fleet. The net GHG reductions from displacing gasoline with electricity for transportation were calculated using two GHG emissions rates (pounds/MWh) for electricity. The first is based on Vermont’s contracted power supply mix. Vermont electric utility companies have secured a power supply mix with very low carbon content. Most of the contracted supply of power in is from nuclear power plants in New England and hydroelectricity from both in-state and out of state sources. The Vermont grid should become even less carbon intensive in the future as the state with the statutory goal of 75% renewable electricity by 2032. The Agency of Natural Resources reported GHG emissions from electricity supply and demand to be 340,000 metric tons in 2008. Assuming consumption of approximately 6,000,000 MWh translates into an emission rate of approximately 125 pounds per MWh. Given that Vermont is part of the New England integrated power grid, some might argue that the appropriate emission factor for calculating net GHG savings should be based on the regional grid. The New England Independent System Operator (NE ISO), the regional grid operator, reported regional average carbon dioxide emissions of 829 pounds per MWh in 2010 (citation). Table 10 presents projected GHG emissions reductions for select years from displacing gasoline with electricity for select years under the baseline plug-in vehicle adoption scenario discussed above.

24
Table 10 Projected Net GHG Emissions Savings from Plug-in Vehicle Adoption in Vermont
Year
Net GHG Savings VT
Emissions Factor (MTCO2)
Net GHG Savings New England
Emissions Factor (MTCO2)
2015 27,276 1,505
2020 125,401 6,919
2025 243,389 13,429
2030 319,389 17,622
Based on the projections presented in Table 10, net GHG emissions reductions in 2030 from plug-in hybrid vehicles could represent approximately 10 percent of 2008 transportation related GHG emissions using the Vermont power supply mix carbon emissions factor.
B. The Benefits of Displacing Fuel Oil and Propane for Space Heating and Water
Heating Using Heat Pump Technology
As described above, recent technological advances in heat pump technology have dramatically improved their performance making them a viable option for Vermont households. The heat pump cycle allows one kWh of electricity to deliver two or more kWh of equivalent heat energy for space heating and water heating. For space heating heat pumps can be used in tandem with an already existing fuel-based heating system. In particular, ductless mini split heat pumps can be a good choice for retrofit add-ons to houses with "non-ducted" heating systems, such as hydronic (hot water heat), radiant panels, and space heaters (wood, kerosene, propane). In addition, they can also be a good choice for room additions where extending or installing distribution ductwork is not feasible. Heat pump water heaters are an efficient alternative to traditional water heaters using fuel oil or propane. To date, however there has been no comprehensive assessment of the fuel displacement potential, fuel cost savings, and carbon reduction benefits from widespread adoption of heat pump technology by Vermont households. Estimated increases in demand for electricity associated with the deployment of heat pumps were presented above given a range of fuel displacement scenarios. Table 11 presents the annual fuel savings based on these scenarios. Again, the analysis presented here is confined to the residential sector. Table 11 Fuel Oil Savings from Heat Pump Deployment for Space Heating and Hot Water Given Various Fuel Displacement Scenarios (gallons annually)
Fuel Displacement
Scenario
Space Heating
Hot Water
Oil Propane Oil Propane
10% 6,222,865 3,027,293 1,013,025 837,336
20% 12,445,731 6,054,585 2,026,049 1,674,672
30% 18,668,596 9,081,878 3,039,074 2,512,009
40% 24,891,462 12,109,170 4,052,098 3,349,345
50% 31,114,327 15,136,463 5,065,123 4,186,681

25
Heat pump technology offers the potential to displace millions of gallons of fuel oil and propane currently being used to provide space heating and water heating to Vermont households. Based on this fuel displacement potential in Table 11, annual energy bill savings were calculated assuming fuel oil at $3.99 per gallon and propane at $2.99 per gallon (rates in August of 2012). Green Mountain Power’s Rate 1 of $0.14615/kWh was used to estimate the increase cost of the electricity used to displace fuel oil and propane for space heating and water heating. Figure 5 presents the results of this analysis.
Figure 5
Annual Energy Bill Savings Using Heat Pump
Technology in Vermont
$0
$20,000,000
$40,000,000
$60,000,000
$80,000,000
$100,000,000
$120,000,000
10% 20% 30% 40% 50%
Fuel Displacement Scenario
Using electricity for space heating and water heating using heat pump technology is less expensive than using fuel oil and propane as fuels for these end-uses. Even at a modest market penetration of 10 percent fuel displacement, Vermonters could save close to $20 million annually in reduced fuel costs for space heating and water heating. These are net annual fuel costs savings and do not reflect the cost-effectiveness of an initial investment in a heat pump system. Fuel oil and propane are imported into the State and thus represent a net outflow of cash from the Vermont economy. As discussed in the prior section, keeping more energy dollars in the State creates an economic multiplier effect contributing to a stronger regional economy Displacing fuel oil and propane with electricity for space heating and water heating also offers an avenue to reduce Vermont’s overall greenhouse gas (GHG) emissions. As discussed above, the vast majority of Vermont’s GHG emissions are linked to transportation and fuel use for space heating and water heating. Thus, shifting from fuel oil and propane to electricity for space heating and water heating could be a key strategy to meet Vermont’s GHG emissions reduction goals. Figure 6 presents net carbon dioxide emissions savings from displacing fuel oil and propane with electricity for space heating and water heating. As described in the previous section, two emissions factors were used in these projections, one based on Vermont’s contracted power supply mix and the other based on the average emissions from all resources within the New England grid. Emissions factors for fuel oil and propane were obtained from the US Department of Energy’s Energy Information Administration (http://www.eia.gov/oiaf/1605/coefficients.html#tbl1).

26
Figure 6
Carbon Reduction Potential Using Heat Pump Technology in Vermont
- 50,000 100,000 150,000 200,000 250,000 300,000 350,000 400,000 450,000 500,000
10%
20%
30%
40%
50%
Fu
el
Dis
pla
cm
en
t S
cen
ari
o
MTCO2
New England
Vermont
Significant net carbon reduction benefits result from displacing fuel oil and propane for space heating and water heating using both the Vermont and the New England emission rate factors. With modest fuel displacement of 10 percent, carbon dioxide emissions reductions are equivalent to taking 15,200 and 7,320 cars off the road for the Vermont and New England emission factors respectively assuming 5 metric tons of CO2 per year per vehicle.
IV. Conclusions Hyper efficient devices including plug-in electric vehicles and heat pumps may offer households the opportunity to reduce energy costs, cut greenhouse gas emissions and decrease the outflow of money from the Vermont economy associated with importing fuels. The analyses presented above suggest that plug in cars can work in Vermont, although their performance may not be as good as it is in other regions with less hilly terrain and warmer weather. In addition, advances in heat pump technology make them viable option for Vermont households for space heating and water heating. These hyper efficient devices allow Vermonters to displace fuels imported into the state with electricity purchased from their local utility companies. While many factors could impact the rate of adoption of these technologies in Vermont, the analyses presented above suggests that even at relatively modest rates of penetration, Vermonters could save millions of dollars in fuel costs and at the same time decrease GHG emissions in Vermont by tens of thousands of metric tons. The increase in consumption of electricity is relatively modest in comparison to Vermont’s overall consumption of electrical energy. Based on the projections presented above, 10 percent displacement of fuel oil and propane for space heating and water heating would increase the demand for electricity by approximately three percent. Based on a consumer adoption rate in 2020 of 25 percent of new vehicle sales being plug-in vehicles, the increased demand for electricity would be approximately two percent.

27
These new loads offer utility companies a degree of flexibility given that they inherently include storage. Smart grid systems could be configured to allow the adoption of plug-in vehicles and heat pumps to be integrated with minimal impacts on peak loads. Attractive off peak rates could serve to shift loads for vehicle charging, space heating, and water heating to off peak periods filling night time valleys and increasing overall asset utilization rates for electric power utilities. The analyses presented above do not make any claims regarding cost-effectiveness. Future research should consider the initial capital investments relative to the annual energy bill savings to assess cost effectiveness. In addition, there is limited performance data on plug-in vehicles and heat pump systems in Vermont. Data should be systematically collected to validate the performance assumptions used in the analysis above. In addition, Vermont’s smart grid initiative should include pilot demonstration projects that develop strategies to integrate plug-in cars and heat pumps in a way that limits the power system impacts associated with vehicle charging and increasing the use of electricity for space and water heating.
Acknowledgements I would like to thank Bruce Bentley, David Dunn, and Kenneth Roberts of Green Mountain Power for their review of earlier drafts and data provided that was used in the fuel displacement analyses presented above. I would also like to thank a number of anonymous reviewers for comments and suggestions on an earlier draft. Any errors remaining in this document are the sole responsibility of the author.
Works Cited Dowds, J., P. Hines, C. Farmer, R. Watts, and S. Letendre, (2010) Plug-in Hybrid Electric Vehicle
Research Project: Phase II Report, UVM TRC Report # 10001. Francfort, J., (2012) EV Project Data Collection and Reporting @ EVS-26, a presentation at the 2012
Electric Vehicle Symposium in Los Angeles. GDS Associates, (2007) FINAL REPORT Vermont Energy Efficiency Potential Study for Oil, Propane,
Kerosene and Wood Fuels, Prepared for the Vermont Department of Public Service. Hadley S. and A. Tsvetkova, (2008) Potential impacts of plug-in hybrid electric vehicles on regional
power generation, Oak Ridge National Laboratory: ORNL/TM-2007/1502008. Kintner-Meyer, M, K. Schneider, and Robert Pratt, (2007) Impacts assessment of plug-in hybrid
vehicles on electric utilities and regional U.S. power grids part 1: Technical analysis: Pacific Northwest National Laboratory, PNNL.
Letendre, S., R. Watts, & M. Cross, (2008) Plug-In Hybrid Vehicles and the Vermont Grid: A Scoping
Analysis, UCM TRC Report # 08-006. Letendre, S. and D. Mackey, (2008) Plug-In Hybrid Test Program: Central Vermont Public Service &
Green Mountain College: Report #1. United States Census Bureau, 2011 American Community Survey, http://www.census.gov/acs/www/. United States Department of Energy, Energy Information Administration, State Profiles and Energy
Estimates, Vermont, http://www.eia.gov/beta/state/?sid=vt#tabs-2. Vermont Department of Public Service, (2011) Comprehensive Energy Plan 2011 Vermont’s Energy
Future: Volume I. Vermont Department of Public Service, (2011) Comprehensive Energy Plan 2011 Facts Analysis &
Recommendations: Volume II. Vermont Agency of Natural Resources, (2010) Vermont Greenhouse Gas Emissions Inventory Update
1990 - 2008