Embed Size (px)
Citation preview
HYPE: Predicting Blood Pressure fromPhotoplethysmograms in a Hypertensive
Population
Ariane M. Sasso1? , Suparno Datta1? , Michael Jeitler2,3 , Nico
Steckhan2,3 , Christian S. Kessler2,3 , Andreas Michalsen2,3 , BertArnrich1, and Erwin Bottinger1
1 Digital Health Center, Hasso Plattner Institute, University of Potsdam2 Institute for Social Medicine, Epidemiology and Health Economics, Charite –
Universitatsmedizin Berlin, Corporate Member of Freie Universitat Berlin,Humboldt-Universitat zu Berlin, and Berlin Institute of Health
3 Department of Internal and Integrative Medicine, Immanuel Hospital Berlin{Potsdam,Berlin} Germany
{ariane.morassi-sasso,suparno.datta}@hpi.de
Abstract. The state of the art for monitoring hypertension relies onmeasuring blood pressure (BP) using uncomfortable cuff-based devices.Hence, for increased adherence in monitoring, a better way of measur-ing BP is needed. That could be achieved through comfortable wearablesthat contain photoplethysmography (PPG) sensors. There have been sev-eral studies showing the possibility of statistically estimating systolic anddiastolic BP (SBP/DBP) from PPG signals. However, they are eitherbased on measurements of healthy subjects or on patients on intensivecare units (ICUs). Thus, there is a lack of studies with patients out ofthe normal range of BP and with daily life monitoring out of the ICUs.To address this, we created a dataset (HYPE) composed of data fromhypertensive subjects that executed a stress test and had 24-hours mon-itoring. We then trained and compared machine learning (ML) modelsto predict BP. We evaluated handcrafted feature extraction approachesvs image representation ones and compared different ML algorithms forboth. Moreover, in order to evaluate the models in a different scenario,we used an openly available set from a stress test with healthy subjects(EVAL). The best results for our HYPE dataset were in the stress testand had a mean absolute error (MAE) in mmHg of 8.79 (±3.17) for SBPand 6.37 (±2.62) for DBP; for our EVAL dataset it was 14.74 (±4.06)and 7.12 (±2.32) respectively. Although having tested a range of signalprocessing and ML techniques, we were not able to reproduce the smallerror ranges claimed in the literature. The mixed results suggest a needfor more comparative studies with subjects out of the intensive care andacross all ranges of blood pressure. Until then, the clinical relevance ofPPG-based predictions in daily life should remain an open question.
Keywords: machine learning · blood pressure · photoplethysmogram.
? The two authors contributed equally to this paper.
. CC-BY-NC-ND 4.0 International licenseIt is made available under a is the author/funder, who has granted medRxiv a license to display the preprint in perpetuity. (which was not certified by peer review)
The copyright holder for this preprint this version posted August 13, 2020. .https://doi.org/10.1101/2020.05.27.20107243doi: medRxiv preprint

2 AM. Sasso and S. Datta et al.
1 Introduction
According to the Global Disease Burden (GBD) study, high blood pressure (BP)(i. e. hypertension) is the risk factor that leads to more deaths worldwide [16].The standard way of monitoring this condition is through the measurementof BP using an uncomfortable cuff-based device [24]. Fortunately, comfortableand common wearables can already detect changes in the flow of blood througha photoplethysmography (PPG) sensor [1]. The PPG signal (photoplethysmo-gram) obtained from it is already used with success to estimate heart rate [19]and, has the potential to go beyond that into accurate BP prediction [5,2].
Most of the work in this area focus on building predictive models for patientsin intensive care units (ICUs) [12,23,20]. However, data collected from regular lifecontain motion artifacts that are not observed in intensive care. Additionally,models that work on healthy populations [17,18] should also be validated onhypertensive populations for guarantying their applicability in BP monitoring.Hence, in our work we focused on assembling a dataset containing data fromsubjects with hypertension (HYPE) during a stress test and 24-hours monitoring.
We then evaluated machine learning (ML) models for predicting BP fromPPG in the HYPE dataset and also in a dataset from healthy subjects duringa stress test (EVAL). From the PPG signals, we extracted features from thetime domain plus their image representations. Errors as low as the ones in theliterature—for patients in the ICU or healthy subjects—could not be reproduced,even after processing the PPG signals with diverse time windows and filters.
This work is detailed as follows: section 2 shows previous work in the fieldand section 3 describes the datasets and methods we used to predict BP fromthe PPG signal. In section 4 we convey our findings and results, followed by adiscussion in section 5 and section 6 describing the implications of this work.
2 Related Work
Existing work focuses on predictive models using MIMIC [7], a dataset thatcontains physiological signals including PPG and ambulatory BP (ABP) frompatients in ICUs. Kurylayak et al. [12] and Wong et al. [23] have both appliedartificial neural networks (ANN) to predicted BP in this dataset and reportedsuccess. However, they used unknown or small sample sizes as can be seen inTable 1. Moreover, Kurylayak et al. only extracted time domain features from thePPG signal while Wong et al. also extracted frequency domain ones. Conversely,Slapnicar et al. [20] tried a spectro-temporal ResNet with all features in a largersample size but could not report the same success as his predecessors.
Others have tried to collect data from healthy subjects in daily life suchas Lustrek et al. [17]. They have used the device empatica E4† and evaluateda range of machine learning (ML) techniques, achieving the best results withan ensemble of regression trees and the leave-one-subject-out (LOSO) valida-tion strategy. However, they had to use ground truth BP from each subject to
† https://e4.empatica.com/e4-wristband
. CC-BY-NC-ND 4.0 International licenseIt is made available under a is the author/funder, who has granted medRxiv a license to display the preprint in perpetuity. (which was not certified by peer review)
The copyright holder for this preprint this version posted August 13, 2020. .https://doi.org/10.1101/2020.05.27.20107243doi: medRxiv preprint
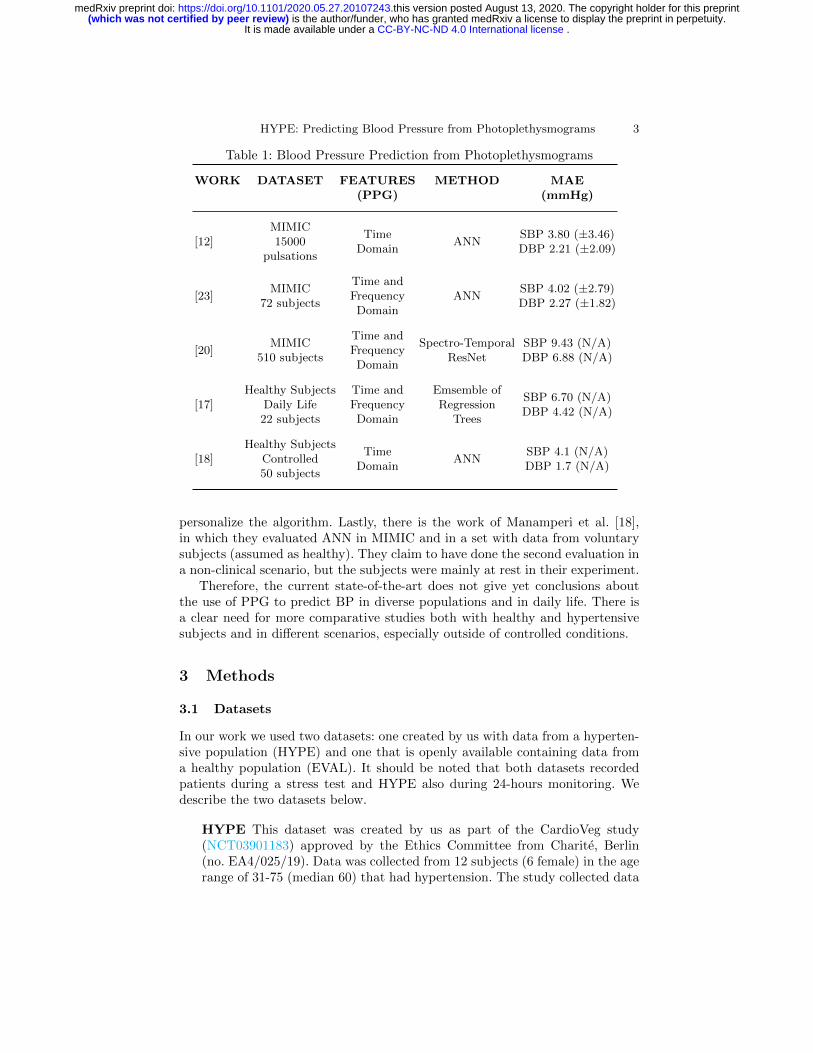
HYPE: Predicting Blood Pressure from Photoplethysmograms 3
Table 1: Blood Pressure Prediction from Photoplethysmograms
WORK DATASET FEATURES(PPG)
METHOD MAE(mmHg)
[12]MIMIC15000
pulsations
TimeDomain
ANNSBP 3.80 (±3.46)DBP 2.21 (±2.09)
[23]MIMIC
72 subjects
Time andFrequencyDomain
ANNSBP 4.02 (±2.79)DBP 2.27 (±1.82)
[20]MIMIC
510 subjects
Time andFrequencyDomain
Spectro-TemporalResNet
SBP 9.43 (N/A)DBP 6.88 (N/A)
[17]Healthy Subjects
Daily Life22 subjects
Time andFrequencyDomain
Emsemble ofRegression
Trees
SBP 6.70 (N/A)DBP 4.42 (N/A)
[18]Healthy Subjects
Controlled50 subjects
TimeDomain
ANNSBP 4.1 (N/A)DBP 1.7 (N/A)
personalize the algorithm. Lastly, there is the work of Manamperi et al. [18],in which they evaluated ANN in MIMIC and in a set with data from voluntarysubjects (assumed as healthy). They claim to have done the second evaluation ina non-clinical scenario, but the subjects were mainly at rest in their experiment.
Therefore, the current state-of-the-art does not give yet conclusions aboutthe use of PPG to predict BP in diverse populations and in daily life. There isa clear need for more comparative studies both with healthy and hypertensivesubjects and in different scenarios, especially outside of controlled conditions.
3 Methods
3.1 Datasets
In our work we used two datasets: one created by us with data from a hyperten-sive population (HYPE) and one that is openly available containing data froma healthy population (EVAL). It should be noted that both datasets recordedpatients during a stress test and HYPE also during 24-hours monitoring. Wedescribe the two datasets below.
HYPE This dataset was created by us as part of the CardioVeg study(NCT03901183) approved by the Ethics Committee from Charite, Berlin(no. EA4/025/19). Data was collected from 12 subjects (6 female) in the agerange of 31-75 (median 60) that had hypertension. The study collected data
. CC-BY-NC-ND 4.0 International licenseIt is made available under a is the author/funder, who has granted medRxiv a license to display the preprint in perpetuity. (which was not certified by peer review)
The copyright holder for this preprint this version posted August 13, 2020. .https://doi.org/10.1101/2020.05.27.20107243doi: medRxiv preprint

4 AM. Sasso and S. Datta et al.
from a stress test (1) and from 24-hours monitoring (2) using the empaticaE4 wristband as the PPG source and the Spacelabs (SL 90217) BP monitor.(1) Stress Test. The subjects followed a protocol in which they watcheda relaxing video for 5 minutes then had their BP taken by a physician fivetimes with an interval of 1 minute per measurement [24]. Then, the patientsbiked in an ergonomic bike from 5 to 10 minutes and relaxed again. Duringthe second relaxation phase their BP was measured again 5 times with a1 minute interval. This dataset contains a total of 95 BP recordings. Onesubject could not bike due to extreme high BP and another one had a failurein the wearable device. Therefore, this experiment had 10 subjects (5 female).(2) 24 Hours. In this phase, the same subjects from the stress test weremonitored for 24-hours during regular day activities. The Spacelabs moni-toring device was configured to measure BP every 30 minutes during the dayand every hour during the night. This dataset contains a total of 464 BPrecordings and all 12 subjects were measured.
EVAL This dataset was generated by Esmaili et al. [3]. The original papertried to estimate BP based on pulse transit time (PTT) and pulse arrivaltime (PAT). Both variables are derived from the differences between thePPG and ECG signals. This data was collected from 26 healthy subjects inthe age range of 21–50 years. The subjects were required to run for 3 minutesat the speed of 8 km/h to induce perturbations in their BP values. Directlyafter the exercise the subjects were made to sit upright and BP values weremeasured along with PPG and ECG. A force-sensing resistor (FSR) wasused under the BP monitor cuff to measure the instantaneous cuff pressure.With the FSR it was possible to pin point the exact time when the SBP andDBP were measured. A total of 152 BP values were recorded in this dataset.
3.2 Handcrafted Feature Extraction Methods
Our first approach entailed extracting handcrafted features from the PPG signal.Time windows of 15, 30 and 45 seconds around the BP measurement were usedfor our experiments. To eliminate motion artefacts induced by wrist movementssections in which the Euclidean norm of x-, y- and z-acceleration lied outside ofan interval of 25% of the standard deviation around the sample mean, for thecurrent window, were removed from consideration. The motion removal was onlydone for the HYPE dataset as the EVAL dataset did not contain any motionsignals corresponding to the PPG recording. We also experimented with signalnormalization and filters such as Chebyshev II and Butterworth, since they werereported as the best filters for PPG signals [15]. For the processed signal, thePPG cycles were then identified with a standard peak detection function.
All detected cycles in the same window were combined into a custom PPGsignal template (details in section B), following a procedure described by Li andClifford [13]. Individual cycles were then compared with the template using twosignal quality indices (SQI): (1) direct linear correlation and (2) direct linearcorrelation between the cycle, re-sampled to match the template length, and the
. CC-BY-NC-ND 4.0 International licenseIt is made available under a is the author/funder, who has granted medRxiv a license to display the preprint in perpetuity. (which was not certified by peer review)
The copyright holder for this preprint this version posted August 13, 2020. .https://doi.org/10.1101/2020.05.27.20107243doi: medRxiv preprint
HYPE: Predicting Blood Pressure from Photoplethysmograms 5
template itself. Only if both correlations lied above 0.8, the cycle was furtherprocessed to extract features. This resulted in some BP intervals not having anyfeatures extracted since no cycles matching the template were identified.
After the clean PPG cycles have been identified, time domain features wereextracted and the detailed list can be found in the Appendix (Table 4). Thefirst step was to identify the first peak in the cycle, which corresponded to thesystolic peak. Then for various percentages of the peak amplitude, we extractedthe time between systolic peak and end of the cycle (DWn), start of the cycleand end of the cycle (SWn +DWn), and the ratio between the time in the cyclebefore and after the systolic peak (DWn/SWn). For every window, the meanand variance of each feature were computed and used as input for the models.
3.3 Image Representation Methods
An alternative approach to the manual feature extraction has recently gainedmuch popularity involving convolutional neural networks (CNNs). The approachis to represent the waves as images and then use a transfer learning method basedon pretrained CNNs to learn embedding from the images and use them to predictBP. The two different image-form representations of PPG signals that we testedwere spectograms and scalograms, described below.
Scalograms. A scalogram is usually plotted as a graph of time and fre-quency and it represents the absolute value of the Continuous Wavelet Trans-form (CWT) coefficients of a signal. The scalogram-CNN based approachwas first discussed in Liang et al. [14]. However, it was only evaluated forhypertension stratification, not BP prediction. Before passing the signal tothe CWT, we detrended it, i.e. subtracted the mean value from the inputsignal. CWT is a convolution of the input data sequence with a set of func-tions generated by the base wavelet. We used the complex Morlet waveletfunction as the base wavelet, which is given by:
Ψ(t) =1√πB
exp−t2
B exp2πCt (1)
The value of bandwidth frequency (B) and center frequency (C) was chosento be 3 and 60 in the above equation, following the work of Liang et al. [14].Compared to a spectrogram, a scalogram is usually better at identifying thelow-frequency or fast-changing frequency component of the signal.
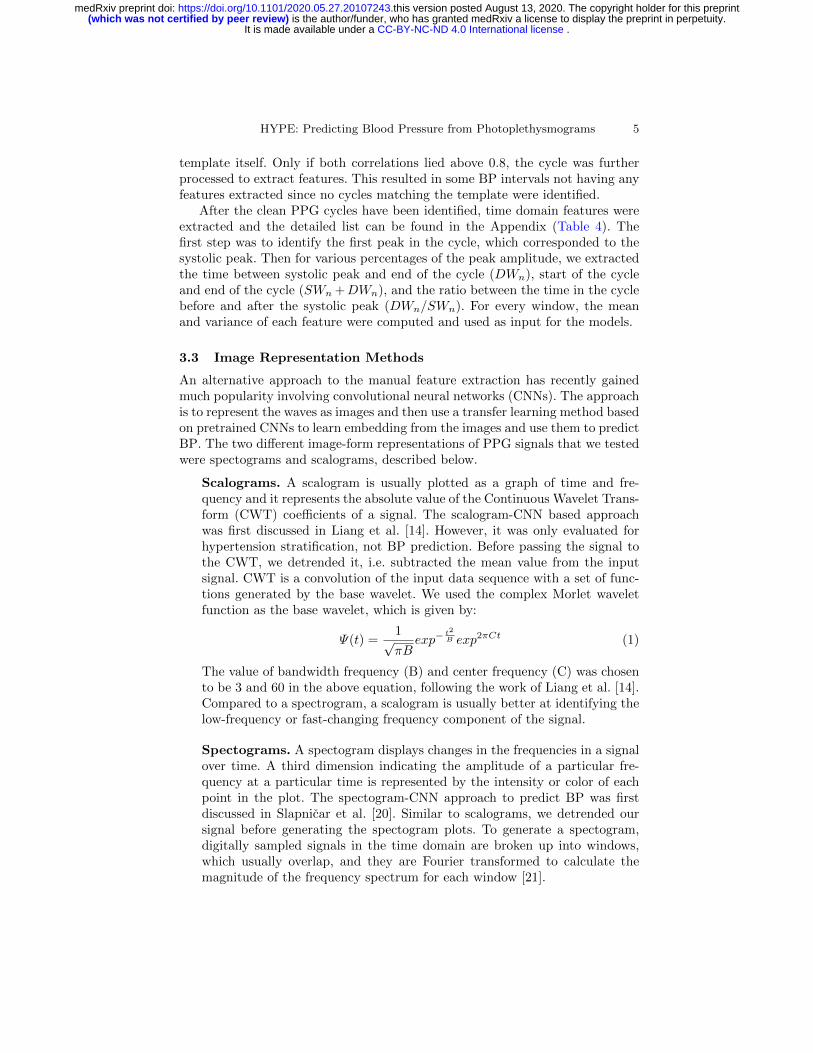
Spectograms. A spectogram displays changes in the frequencies in a signalover time. A third dimension indicating the amplitude of a particular fre-quency at a particular time is represented by the intensity or color of eachpoint in the plot. The spectogram-CNN approach to predict BP was firstdiscussed in Slapnicar et al. [20]. Similar to scalograms, we detrended oursignal before generating the spectogram plots. To generate a spectogram,digitally sampled signals in the time domain are broken up into windows,which usually overlap, and they are Fourier transformed to calculate themagnitude of the frequency spectrum for each window [21].
. CC-BY-NC-ND 4.0 International licenseIt is made available under a is the author/funder, who has granted medRxiv a license to display the preprint in perpetuity. (which was not certified by peer review)
The copyright holder for this preprint this version posted August 13, 2020. .https://doi.org/10.1101/2020.05.27.20107243doi: medRxiv preprint
6 AM. Sasso and S. Datta et al.
2 4 6 8 10 12 14Time (sec)
100
101
Freq
uenc
ies (
Hz)
Spectrogram of Signal
160
140
120
100
80
60
40
(a) Spectogram
0 2 4 6 8 10 12 14Time (sec)
1.0
2.0
4.0
8.0
16.0
32.0
64.0
Freq
uenc
ies (
Hz)
Wavelet Transform of signal
10 5
10 4
10 3
10 2
10 1
(b) Scalogram
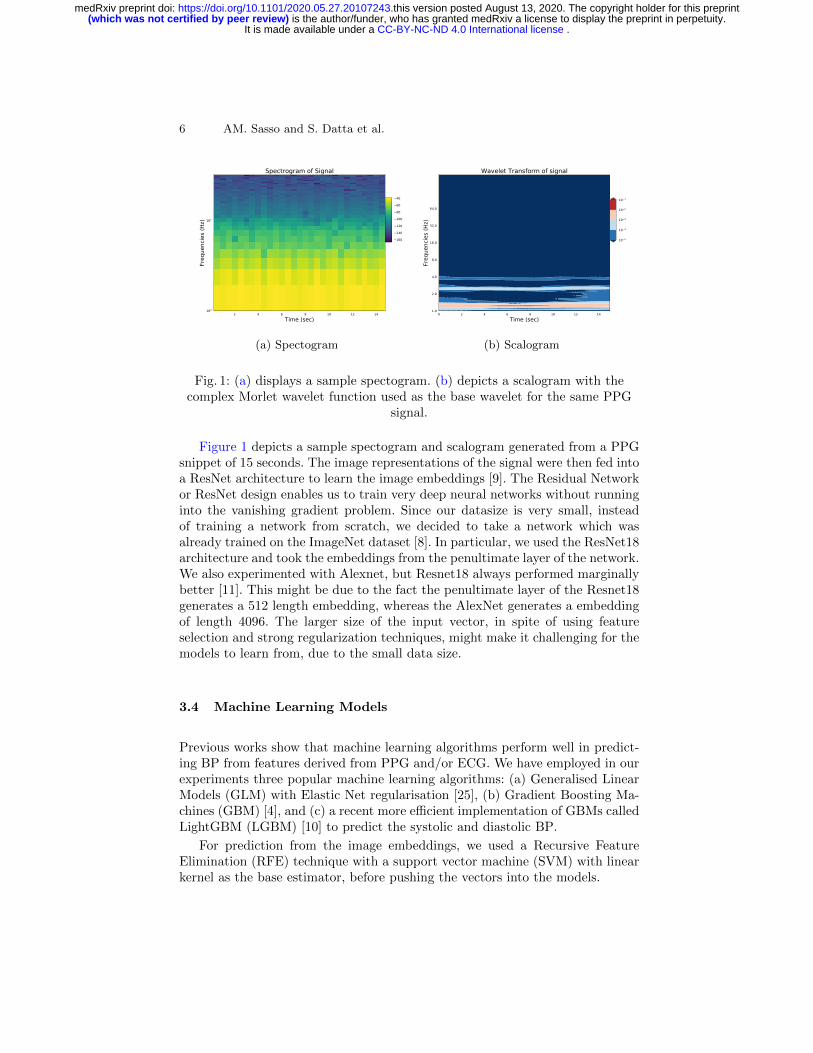
Fig. 1: (a) displays a sample spectogram. (b) depicts a scalogram with thecomplex Morlet wavelet function used as the base wavelet for the same PPG
signal.
Figure 1 depicts a sample spectogram and scalogram generated from a PPGsnippet of 15 seconds. The image representations of the signal were then fed intoa ResNet architecture to learn the image embeddings [9]. The Residual Networkor ResNet design enables us to train very deep neural networks without runninginto the vanishing gradient problem. Since our datasize is very small, insteadof training a network from scratch, we decided to take a network which wasalready trained on the ImageNet dataset [8]. In particular, we used the ResNet18architecture and took the embeddings from the penultimate layer of the network.We also experimented with Alexnet, but Resnet18 always performed marginallybetter [11]. This might be due to the fact the penultimate layer of the Resnet18generates a 512 length embedding, whereas the AlexNet generates a embeddingof length 4096. The larger size of the input vector, in spite of using featureselection and strong regularization techniques, might make it challenging for themodels to learn from, due to the small data size.
3.4 Machine Learning Models
Previous works show that machine learning algorithms perform well in predict-ing BP from features derived from PPG and/or ECG. We have employed in ourexperiments three popular machine learning algorithms: (a) Generalised LinearModels (GLM) with Elastic Net regularisation [25], (b) Gradient Boosting Ma-chines (GBM) [4], and (c) a recent more efficient implementation of GBMs calledLightGBM (LGBM) [10] to predict the systolic and diastolic BP.
For prediction from the image embeddings, we used a Recursive FeatureElimination (RFE) technique with a support vector machine (SVM) with linearkernel as the base estimator, before pushing the vectors into the models.
. CC-BY-NC-ND 4.0 International licenseIt is made available under a is the author/funder, who has granted medRxiv a license to display the preprint in perpetuity. (which was not certified by peer review)
The copyright holder for this preprint this version posted August 13, 2020. .https://doi.org/10.1101/2020.05.27.20107243doi: medRxiv preprint

HYPE: Predicting Blood Pressure from Photoplethysmograms 7
3.5 Experimental Settings
In order to train models that are well generalizable, we used a leave-2-subjects-out cross validation for all our models, i.e. at every iteration we use data from 2subjects as the test set, trained our models on the remaining data and repeatedthis procedure till all subjects have been at some point used as the test set. Allhyper parameters were optimized empirically. We evaluated the models basedon the mean absolute error (MAE). The MAE was calculated at each iterationand we calculated the mean and standard deviation of these values.
4 Results
In this section we report our experimental results. In Table 2 we show the com-parison of the MAEs for predicting systolic blood pressure (SBP) between thedifferent models in different datasets. Table 3 shows the results for diastolicblood pressure (DBP) prediction. The cells in these table contain the mean andstandard deviation (in parenthesis) of the MAE of all cross validation folds.Noticeably, in the HYPE dataset feature extraction based methods consistentlyoutperformed the image based methods. In EVAL the spectogram-representationbased results outperformed the other two approaches. In both datasets, the bestresults for the spectogram based approach are usually marginally better thanthe best results of the scalogram based approach. For the image based methodsthe more advanced machine learning methods such as LGBM and GBM clearlyoutperformed the GLM model. This is most probably due to the comparativelylarge dimension of the input image embeddings. For the feature extraction basedmethods this difference is not so prominent, and in some cases the GLM turnsout to be the best performing model. In general, based on the MAE values, pre-dicting SBP appears to be more difficult than predicting DBP which is consistentwith previous literature (see Table 1).
5 Discussion
5.1 Clinical Relevance
Cuff-less and continuous methods of measuring BP are particularly attractive asBP is one of the most important predictors of long term cardiovascular health [6].Prediction models for BP based on PPG signals can be a very important stride inthat direction. But for reliable continuous monitoring of BP, these models needto perform well during regular day-to-day activities and also for different patientpopulations. Apart from MIMIC there does exist a few other works that try tocollect PPG and corresponding BP signals following a strict protocol (similar toHYPE: stress-test). To the best of our knowledge, our 24-hours dataset is thefirst attempt to collect this data from an uncontrolled environment where thesubjects were free to do anything. Our evaluations do underline that it is indeedmore challenging to accurately predict BP in such an uncontrolled environment.
. CC-BY-NC-ND 4.0 International licenseIt is made available under a is the author/funder, who has granted medRxiv a license to display the preprint in perpetuity. (which was not certified by peer review)
The copyright holder for this preprint this version posted August 13, 2020. .https://doi.org/10.1101/2020.05.27.20107243doi: medRxiv preprint

8 AM. Sasso and S. Datta et al.
Table 2: MAE of the different models for SBP prediction in different datasets
DatasetFeature Selection Spectograms-Resnet18 Scalograms-Resnet18
GLM GBM LGBM GLM GBM LGBM GLM GBM LGBM
EVALStress Test
16.71(±4.32)
16.19(±4.35)
16.00(±4.63)
17.59(±3.72)
15.24(±4.01)
14.74(±4.06)
16.71(±4.16)
15.68(±4.34)
15.46(±4.49)
HYPEStress Test
10.26(±1.18)
8.79(±3.17)
9.57(±1.65)
15.58(±1.21)
12.44(±2.72)
12.15(±2.72)
17.98(±2.11)
12.91(±2.57)
12.83(±2.63)
HYPE24-hours
14.44(±2.96)
14.83(±3.81)
14.74(±4.07)
18.71(±4.072)
16.92(±5.22)
17.07(±5.22)
18.97(±5.15)
17.03(±5.26)
17.30(±5.21)
Table 3: MAE of the different models for DBP prediction in different datasets
DatasetFeature Selection Spectograms-Resnet18 Scalograms-Resnet18
GLM GBM LGBM GLM GBM LGBM GLM GBM LGBM
EVALStress Test
7.87(±2.07)
7.86(±2.27)
7.57(±2.38)
13.18(±13.01)
7.12(±2.32)
7.15(±2.42)
8.67(±3.08)
7.62(±2.35)
7.53(±2.48)
HYPEStress Test
7.50(±0.68)
6.37(±2.62)
7.22(±2.69)
11.98(±1.90)
9.55(±2.74)
9.52(±2.02)
12.18(±1.98)
9.51(±1.91)
9.35(±1.93)
HYPE24-hours
11.52(±3.05)
11.48(±3.57)
11.56(±2.03)
13.93(±3.20)
12.84(±4.00)
12.79(±4.10)
15.71(±3.83)
12.94(±4.00)
13.14(±4.03)
5.2 Technical Relevance
In this work we impartially evaluated different models and approaches for BPprediction from PPG. Most of the methods have only been previously validatedon MIMIC. Also, due to the large volume of existing work, very often the modelswere not compared against all available approaches. To the best of our knowl-edge, this is also the first work to compare the scalogram, spectogram and featureextraction approaches. We employ strong cross validation methods to make sureour results are robust. Our models and code are available openly to make surethis results can be reproduced and also applied to similar datasets when needed.
5.3 Limitations and Future Work
The major limitation of our work is related to the small size of the datasetswe used. For that reason, it was not possible to train a deep Long Short TermMemory (LSTM) network, which in a few recent papers have demonstrated verypromising results [22]. In future work, we would like to extend our dataset withmore diverse patient populations and also with a longer observation period perpatient. This will allow us to apply more data-demanding learning algorithmsand, at the same time, to investigate how models trained in one populationperform in a different one.
6 Conclusion
In conclusion, we presented a comprehensive comparison of different machinelearning approaches to predict BP from PPG in two different datasets. We
. CC-BY-NC-ND 4.0 International licenseIt is made available under a is the author/funder, who has granted medRxiv a license to display the preprint in perpetuity. (which was not certified by peer review)
The copyright holder for this preprint this version posted August 13, 2020. .https://doi.org/10.1101/2020.05.27.20107243doi: medRxiv preprint

HYPE: Predicting Blood Pressure from Photoplethysmograms 9
demonstrate that despite the plethora of work in this area, there exists a dearthof models that perform well in uncontrolled environments when the subjectsindulge in various day-to-day activities. We show for small to medium sizeddatasets that feature extraction based methods can produce better results thanthe recent image based approaches. We hope our paper will induce more workthat will look into the generalizability of these models.
7 Acknowledgements
We would like to thank Manisha Manaswini, Felix Musmann, Juan Carlos NinoRodriguez, and Carolin Muller for their help during data collection and, alsoHarry Freitas da Cruz and Attila Wohlbrandt for giving many valuable insights.
References
1. Challoner, A.V., Ramsay, C.A.: A photoelectric plethysmograph for the measure-ment of cutaneous blood flow. Physics in Medicine and Biology 19(3), 317–328(1974). https://doi.org/10.1088/0031-9155/19/3/003
2. Elgendi, M., Fletcher, R., Liang, Y., Howard, N., Lovell, N.H., Abbott, D., Lim,K., Ward, R.: The use of photoplethysmography for assessing hypertension. npjDigital Medicine 2(1), 60 (dec 2019). https://doi.org/10.1038/s41746-019-0136-7
3. Esmaili, A., Kachuee, M., Shabany, M.: Nonlinear cuffless blood pressure estima-tion of healthy subjects using pulse transit time and arrival time. IEEE Transac-tions on Instrumentation and Measurement 66(12), 3299–3308 (2017)
4. Friedman, J.H.: Greedy function approximation: a gradient boosting machine. An-nals of statistics pp. 1189–1232 (2001)
5. Ghamari, M.: A review on wearable photoplethysmography sensors and their po-tential future applications in health care. International Journal of Biosensors &Bioelectronics 4(4), 195–202 (2018)
6. Gholamhosseini, H., Meintjes, A., Baig, M.M., Linden, M.: Smartphone-based con-tinuous blood pressure measurement using pulse transit time. In: pHealth. pp.84–89 (2016)
7. Goldberger, A.L., Amaral, L.A., Glass, L., Hausdorff, J.M., Ivanov, P.C., Mark,R.G., Mietus, J.E., Moody, G.B., Peng, C.K., Stanley, H.E.: Physiobank, phys-iotoolkit, and physionet: components of a new research resource for complex phys-iologic signals. circulation 101(23), e215–e220 (2000)
8. He, K., Zhang, X., Ren, S., Sun, J.: Delving deep into rectifiers: Surpassing human-level performance on imagenet classification. In: Proceedings of the IEEE interna-tional conference on computer vision. pp. 1026–1034 (2015)
9. He, K., Zhang, X., Ren, S., Sun, J.: Deep residual learning for image recognition. In:Proceedings of the IEEE conference on computer vision and pattern recognition.pp. 770–778 (2016)
10. Ke, G., Meng, Q., Finley, T., Wang, T., Chen, W., Ma, W., Ye, Q., Liu, T.Y.:Lightgbm: A highly efficient gradient boosting decision tree. In: Advances in neuralinformation processing systems. pp. 3146–3154 (2017)
11. Krizhevsky, A., Sutskever, I., Hinton, G.E.: Imagenet classification with deep con-volutional neural networks. In: Advances in neural information processing systems.pp. 1097–1105 (2012)
. CC-BY-NC-ND 4.0 International licenseIt is made available under a is the author/funder, who has granted medRxiv a license to display the preprint in perpetuity. (which was not certified by peer review)
The copyright holder for this preprint this version posted August 13, 2020. .https://doi.org/10.1101/2020.05.27.20107243doi: medRxiv preprint

10 AM. Sasso and S. Datta et al.
12. Kurylyak, Y., Lamonaca, F., Grimaldi, D.: A Neural Network-based method forcontinuous blood pressure estimation from a PPG signal. In: Conference Record- IEEE Instrumentation and Measurement Technology Conference. pp. 280–283.IEEE (may 2013). https://doi.org/10.1109/I2MTC.2013.6555424
13. Li, Q., Clifford, G.D.: Dynamic time warping and machine learning for signalquality assessment of pulsatile signals. Physiological measurement 33(9), 1491(2012)
14. Liang, Y., Chen, Z., Ward, R., Elgendi, M.: Photoplethysmography and deep learn-ing: enhancing hypertension risk stratification. Biosensors 8(4), 101 (2018)
15. Liang, Y., Elgendi, M., Chen, Z., Ward, R.: Analysis: An optimal fil-ter for short photoplethysmogram signals. Scientific Data 5, 1–12 (2018).https://doi.org/10.1038/sdata.2018.76
16. Lim, S.S., Vos, T., Flaxman et al., A.D.: A comparative risk assessment of burdenof disease and injury attributable to 67 risk factors and risk factor clusters in 21regions, 1990-2010: A systematic analysis for the Global Burden of Disease Study2010. The Lancet 380(9859), 2224–2260 (2012). https://doi.org/10.1016/S0140-6736(12)61766-8
17. Lustrek, M.J.S.I., Gasper Slapnicar (Jozef Stefan Institute), Slapnicar, G., Lustrek,M.J.S.I.: Blood Pressure Estimation with a Wristband Optical Sensor. UbiComppp. 758–761 (2018). https://doi.org/10.1145/3267305.3267708
18. Manamperi, B., Chitraranjan, C.: A Robust Neural Network-Based Method toEstimate Arterial Blood Pressure Using Photoplethysmography. In: 2019 IEEE19th International Conference on Bioinformatics and Bioengineering (BIBE). pp.681–685. IEEE (oct 2019). https://doi.org/10.1109/BIBE.2019.00128
19. Shcherbina, A., Mattsson, C., Waggott, D., Salisbury, H., Christle, J., Hastie, T.,Wheeler, M., Ashley, E.: Accuracy in Wrist-Worn, Sensor-Based Measurements ofHeart Rate and Energy Expenditure in a Diverse Cohort. Journal of PersonalizedMedicine 7(2), 3 (may 2017). https://doi.org/10.3390/jpm7020003
20. Slapnicar, G., Mlakar, N., Lustrek, M.: Blood pressure estimation from photo-plethysmogram using a spectro-temporal deep neural network. Sensors (Switzer-land) 19(15) (2019). https://doi.org/10.3390/s19153420
21. Smith, J.O.: Mathematics of the discrete Fourier transform (DFT): with audioapplications. Julius Smith (2007)
22. Su, P., Ding, X.R., Zhang, Y.T., Liu, J., Miao, F., Zhao, N.: Long-term bloodpressure prediction with deep recurrent neural networks. In: 2018 IEEE EMBSInternational Conference on Biomedical & Health Informatics (BHI). pp. 323–328.IEEE (2018)
23. Wang, L., Zhou, W., Xing, Y., Zhou, X.: A Novel Neural Network Model for BloodPressure Estimation Using Photoplethesmography without Electrocardiogram.Journal of Healthcare Engineering (2018). https://doi.org/10.1155/2018/7804243
24. Whelton, P.K., Carey, R.M., Aronow et al., W.S.: 2017ACC/AHA/AAPA/ABC/ACPM/AGS/APhA/ASH/ASPC/NMA/PCNAGuideline for the Prevention, Detection, Evaluation, and Management ofHigh Blood Pressure in Adults:. Hypertension 71(6), e13–e115 (jun 2018).https://doi.org/10.1161/HYP.0000000000000065
25. Zou, H., Hastie, T.: Regularization and variable selection via the elastic net. Jour-nal of the royal statistical society: series B (statistical methodology) 67(2), 301–320(2005)
. CC-BY-NC-ND 4.0 International licenseIt is made available under a is the author/funder, who has granted medRxiv a license to display the preprint in perpetuity. (which was not certified by peer review)
The copyright holder for this preprint this version posted August 13, 2020. .https://doi.org/10.1101/2020.05.27.20107243doi: medRxiv preprint
HYPE: Predicting Blood Pressure from Photoplethysmograms 11
APPENDIX
A Data and Code Availability
The code for the experiments is available at: https://github.com/arianesasso/aime-2020. Information on the HYPE dataset is also provided there. The EVALdataset can be found at: https://www.kaggle.com/mkachuee/noninvasivebp.
B Feature extraction
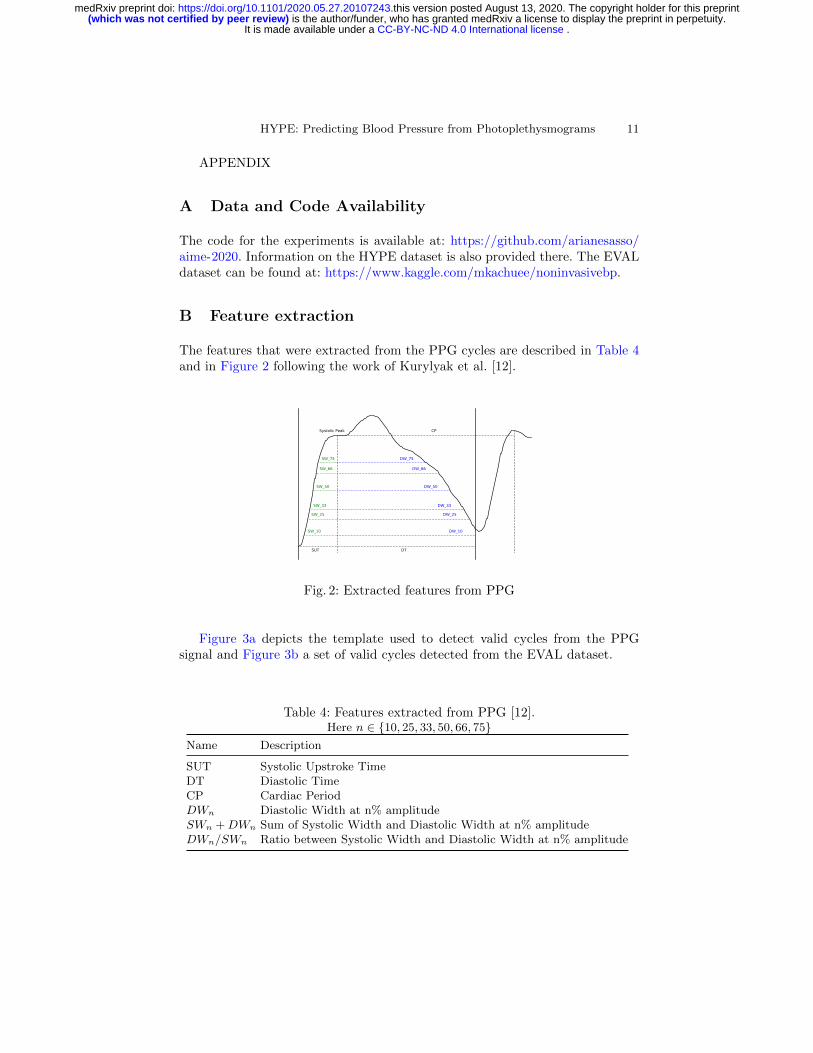
The features that were extracted from the PPG cycles are described in Table 4and in Figure 2 following the work of Kurylyak et al. [12].
Systolic Peak
DW_10SW_10
DW_25SW_25
DW_33SW_33
DW_50SW_50
DW_66SW_66
DW_75SW_75
SUT DT
CP
Fig. 2: Extracted features from PPG
Figure 3a depicts the template used to detect valid cycles from the PPGsignal and Figure 3b a set of valid cycles detected from the EVAL dataset.
Table 4: Features extracted from PPG [12].Here n ∈ {10, 25, 33, 50, 66, 75}
Name Description
SUT Systolic Upstroke TimeDT Diastolic TimeCP Cardiac PeriodDWn Diastolic Width at n% amplitudeSWn + DWn Sum of Systolic Width and Diastolic Width at n% amplitudeDWn/SWn Ratio between Systolic Width and Diastolic Width at n% amplitude
. CC-BY-NC-ND 4.0 International licenseIt is made available under a is the author/funder, who has granted medRxiv a license to display the preprint in perpetuity. (which was not certified by peer review)
The copyright holder for this preprint this version posted August 13, 2020. .https://doi.org/10.1101/2020.05.27.20107243doi: medRxiv preprint

12 AM. Sasso and S. Datta et al.
(a) PPG template cycle (b) Cycles detected from the EVAL datausing the template
Fig. 3: PPG cyclesC Experiments
Here we briefly discuss how the different parameters of our experiments suchas window size, motion filter etc. effect the results. In Figure 4 we can see theeffect of adding motion filter in the stres test and 24-hours datasets. Though noprominent difference in MAE was seen during the controlled stress test, for the 24hours dataset, using a motion filter clearly achieved better MAEs. In Figure 5 wecan see the effect of different window sizes (length of the PPG signal consideredas an input) on the results. In the stress test data the 15 sec and 30 sec windowsizes performed considerably better than the 45 sec window size. In the 24-hoursdata the 30 sec and 45 sec windows performed better. Overall we chose the 30sec window size for all our experiments. The last variable that we experimentedwith was the position of the window itself. Since the BP measurement happensover a duration of time there are different ways a window can be positioned.We particularly tested two: (1) Bfill, where the window starts exactly from theBP measurement start and goes t sec (t being the window size) before and (2)Bffill, where the window goes t/2 sec before and t/2 sec after the start of theBP measurement. In Figure 6 we can see the results. Here there was no clearwinner between the two approaches.
. CC-BY-NC-ND 4.0 International licenseIt is made available under a is the author/funder, who has granted medRxiv a license to display the preprint in perpetuity. (which was not certified by peer review)
The copyright holder for this preprint this version posted August 13, 2020. .https://doi.org/10.1101/2020.05.27.20107243doi: medRxiv preprint

HYPE: Predicting Blood Pressure from Photoplethysmograms 13
(a) Box Plot of the GBM-MAE with andwithout motion-filter for the HYPE:
stresstest experiment
(b) Box Plot of the GBM-MAE with andwithout motion-filter for theHYPE:24hours experiment
Fig. 4: Box-plots depicting the effect of motion filters
(a) Box Plot of the GBM-MAE fordifferent window sizes for the HYPE:
stresstest experiment
(b) Box Plot of the GBM-MAE fordifferent window sizes for theHYPE:24hours experiment
Fig. 5: Box-plots depicting the effect of window sizes
(a) Box Plot of the GBM-MAE fordifferent window types for the HYPE:
stresstest experiment
(b) Box Plot of the GBM-MAE fordifferent window types for the
HYPE:24hours experiment
Fig. 6: Box-plots depicting the effect of window types
. CC-BY-NC-ND 4.0 International licenseIt is made available under a is the author/funder, who has granted medRxiv a license to display the preprint in perpetuity. (which was not certified by peer review)
The copyright holder for this preprint this version posted August 13, 2020. .https://doi.org/10.1101/2020.05.27.20107243doi: medRxiv preprint