Embed Size (px)
Citation preview

Atmos Chem Phys 11 3479ndash3494 2011wwwatmos-chem-physnet1134792011doi105194acp-11-3479-2011copy Author(s) 2011 CC Attribution 30 License
AtmosphericChemistry
and Physics
Hygroscopic properties of aerosol particles at high relative humidityand their diurnal variations in the North China Plain
P F Liu1 C S Zhao1 T Gobel2 E Hallbauer2 A Nowak2 L Ran1 W Y Xu1 Z Z Deng1 N Ma1K Mildenberger 2 S Henning2 F Stratmann2 and A Wiedensohler2
1Department of Atmospheric and Oceanic Sciences School of Physics Peking University Beijing 100871 China2Institute for Tropospheric Research Permoserstr 15 04318 Leipzig Germany
Received 5 January 2011 ndash Published in Atmos Chem Phys Discuss 26 January 2011Revised 12 April 2011 ndash Accepted 12 April 2011 ndash Published 14 April 2011
Abstract The hygroscopic properties of submicron aerosolparticles were determined at a suburban site (Wuqing) in theNorth China Plain among a cluster of cities during the period17 July to 12 August 2009 A High Humidity Tandem Dif-ferential Mobility Analyser (HH-TDMA) instrument was ap-plied to measure the hygroscopic growth factor (GF) at 9095 and 985 relative humidity (RH) for particles with drydiameters between 50 and 250 nm The probability distribu-tion of GF (GF-PDF) averaged over the period shows a dis-tinct bimodal pattern namely a dominant more-hygroscopic(MH) group and a smaller nearly-hydrophobic (NH) groupThe MH group particles were highly hygroscopic and theirGF was relatively constant during the period with averagevalues of 154plusmn 002 181plusmn 004 and 245plusmn 007 at 9095 and 985 RH (D0 = 100 nm) respectively The NHgroup particles grew very slightly when exposed to high RHwith GF values of 108plusmn 002 113plusmn 006 and 124plusmn 013respectively at 90 95 and 985 RH (D0 = 100 nm)The hygroscopic growth behaviours at different RHs werewell represented by a single-parameter Kohler model Thusthe calculation of GF as a function of RH and dry diametercould be facilitated by an empirical parameterization ofκ asfunction of dry diameter A strong diurnal pattern in numberfraction of different hygroscopic groups was observed Theaverage number fraction of NH particles during the day wasabout 8 while during the nighttime fractions up to 20were reached Correspondingly the state of mixing in termsof water uptake varied significantly during a day Simula-tions using a particle-resolved aerosol box model (PartMC-MOSAIC) suggest that the diurnal variations of aerosol hy-groscopicity and mixing state were mainly caused by the evo-lution of the atmospheric mixing layer The shallow noctur-nal boundary layer during the night facilitated the accumu-
Correspondence toC S Zhao(zcspkueducn)
lation of freshly emitted carbonaceous particles (mainly hy-drophobic) near the surface while in the morning turbulenceentrained the more aged and more hygroscopic particles fromaloft and diluted the NH particles near the surface resultingin a decrease in the fraction of NH particles
1 Introduction
The North China Plain is a polluted area with great indus-trial activity and dense population A group of megacities(so-called city cluster) including Beijing and Tianjin is lo-cated in this region Along with the rapid economic growthand increase in traffic during the last decades the consump-tion of fossil fuels like coal gasoline diesel and natural gashas increased dramatically in China The combustion of fos-sil fuels emits large amounts of particulate and gaseous pol-lutants into the atmosphere leading to substantial environ-mental problems Industrial and traffic related primary emis-sions as well as the formation of secondary aerosols com-bined with the transport of dust from the desert region re-sult frequently in heavy aerosol loads in this area dependingon the meteorological conditions (Wehner et al 2004 2008Liu et al 2009) Air quality is significantly influenced byaerosol particles and high loads of aerosol pollution severelydegrade visibility especially at high RH in summer (Zhanget al 2010) related health risks are increased as well (Leitteet al 2011) Moreover aerosol particles influence the earthrsquosradiative budget directly by scattering and absorbing solar ra-diation (Charlson et al 1992) and indirectly by serving asnuclei for cloud formation (Twomey 1974 Albrecht 1989)Aerosols may also affect the hydrological cycle (Menon etal 2002) A study shows that the magnitude of precipi-tation in the North China Plain has decreased significantlyduring the last 40 years and that the reduction of precipita-tion is strongly correlated to the high concentration of aerosolparticles (Zhao et al 2006b)
Published by Copernicus Publications on behalf of the European Geosciences Union
3480 P F Liu et al Hygroscopic properties of aerosol particles at high relative humidity
In order to reduce the uncertainties in model projectionsof climate change induced by aerosol indirect effects inten-sive aircraft measurement studies on warm cloud microphys-ical properties were conducted in the areas of high aerosolloading such as the North China Plain (Zhao et al 2006aDeng et al 2009) The aerosol hygroscopic properties arevery crucial for the understanding of the aerosol effects onclimate via their effects on clouds since the hygroscopicgrowth measured at subsaturation is closely related to theability of aerosol particles to activate and form cloud droplets(Swietlicki et al 2008 Rissler et al 2010)
Moreover hygroscopic particles grow significantly in sizeat high RH due to water uptake and hence influence theaerosol optical properties such as extinction visibility andaerosol optical depth (AOD) (Cheng et al 2008) Inade-quate characterization of aerosol hygroscopic properties willinduce large uncertainties in the estimation of aerosol directeffect on the climate
Hygroscopic properties of aerosol particles can be deter-mined by their physical and chemical characteristics (Top-ping et al 2005a b) The Kohler equation is often usedto describe both the hygroscopic growth and the activationof aerosol particles to cloud droplets based on the aerosolrsquosphysicochemical properties (Kohler 1936) However thesedetailed properties are not always available for ambientaerosols Size-dependent mixing states of various chemicalcompositions also increase the complexity Recently severalsingle-parameter schemes have been proposed to simplify theKohler equation Hygroscopicity parameters such asκ andρ ion have been defined as proxies of chemical compositionto represent aerosol hygroscopic growth as well as the abil-ity of aerosol particles to become cloud condensation nuclei(CCN) (Petters and Kreidenweis 2007 Wex et al 2007)Moreover Rissler et al (2010) recently overviewed severalmodels which describe the aerosol hygroscopicity and theCCN activation It is worth noting that the hygroscopicityparameter (κ or ρ ion) for the Kohler model is not always aconstant with respect to RH especially for the range of RHabove 90 This parameter is linearly proportional to thenumber of soluble entities per dry volume Laboratory stud-ies using LACIS (Leipzig Aerosol Cloud Interaction Sim-ulator) observed an increased hygroscopicity parameter by afactor of 4ndash6 for secondary organic aerosol (SOA) in the RH-range from below 90 to 996 (Wex et al 2009 Petters etal 2009) indicating a significant increase in the number ofsoluble entities per dry volume as the RH increases at highRH The RH-dependency ofκ could be crucial for the pre-diction of CCN number concentration For ambient aerosolsvalidations of the applicability of single-parameter simplifi-cation at RH above 90 through field measurements usinghumidified tandem differential mobility analyser (H-TDMA)technique are necessary and are rarely reported in the currentliterature
Ambient aerosols are external and internal mixtures of par-ticles with different chemical compounds such as soot sul-
phate nitrate organic carbon and mineral dust The state ofmixing of these components is crucial for understanding therole of aerosol particles in the atmosphere In recent yearsmuch attention has been paid to the mixing state of soot inaerosols (Jacobson 2001 Moffet and Prather 2009 Riemeret al 2009 2010 Zhang et al 2008 Oshima et al 2009)which influences the optical properties and climate effects ofaerosols The hygroscopicity of aerosol particles can be con-sidered as an agent of chemical composition A HumidifiedTandem Differential Mobility Analyser (H-TDMA) is one ofthe few instruments capable of providing information regard-ing the mixing state in terms of hygroscopicity of the atmo-spheric aerosols (Swietlicki et al 2008) Different modes ofhygroscopic growth of ambient aerosols are often observedin the H-TDMA measurements indicating an external mix-ture in terms of hygroscopicity (Swietlicki et al 2008)
A large number of ship- and ground-based measure-ments for the size-resolved hygroscopic properties of ambi-ent aerosols have been conducted worldwide using the H-TDMA technique of which the results were summarized in areview paper by Swietlicki et al (2008) In the North ChinaPlain area Massling et al (2009) and Meier et al (2009) re-cently reported the hygroscopic properties measured in Bei-jing city using various instruments including the H-TDMAHowever due to technical limitations most of these con-ventional H-TDMA field studies were conducted at the RHranges below 90 Detailed hygroscopic properties of at-mospheric aerosols at RHs above 90 are still very scarceConsidering that the hygroscopic growth factors at high RHare highly sensitive to aerosol chemical composition and aremore closely related to cloud droplet activation behavioursthere is a strong need to measure the detailed hygroscopicproperties for ambient aerosols at RH above 90
In this paper we focus on measurement of the aerosolhygroscopic properties in a polluted megacity area at RHvalues above 90 The High Humidity Tandem Differen-tial Mobility Analyser (HH-TDMA) developed by Henniget al (2005) was applied in the field study to determine thehygroscopic properties of ambient aerosols at 90 95 and985 RH The hygroscopic growth factors and number frac-tions of different hygroscopic groups are analysed The cal-culated hygroscopicity parametersκ are presented and thesize-dependentκ values are parameterized to facilitate theapplication of our result in models The diurnal variations ofaerosol mixing state revealed by detailed hygroscopic prop-erties are also discussed and these diurnal patterns are in-terpreted by modelling simulations using a state-of-the-artparticle-resolved aerosol box model PartMC-MOSAIC de-veloped by Riemer et al (2009)
Atmos Chem Phys 11 3479ndash3494 2011 wwwatmos-chem-physnet1134792011
P F Liu et al Hygroscopic properties of aerosol particles at high relative humidity 3481
2 Data and methods
21 Description of the measurement campaign
This investigation is part of the project HaChi (Haze inChina) which was conducted by the collaboration of PekingUniversity (PKU) China and Leibniz Institute for Tropo-spheric Research (IFT) Germany During an intensive fieldcampaign in JulyndashAugust 2009 the aerosol number-size dis-tribution hygroscopicity size resolved and bulk CCN activa-tion properties (Deng et al 2011) chemical composition andoptical properties (Ma et al 2011) were measured at groundlevel The period of the HH-TDMA measurements analysedin this study is between 17 July 2009 and 12 August 2009namely HaChi summer campaign The HH-TDMA systemwas located in an air-conditioned mobile laboratory with wellcontrolled room temperature Air was sampled through a lowflow PM10 inlet The aerosol flow was dehumidified to a rel-ative humidity below 30 by an automatic aerosol dryer unit(Tuch et al 2009) on the roof of the laboratory before it en-tered the measurement systems
The measurement site was situated next to the WuqingMeteorological Station (3923prime N 1170prime E 74 m asl)The site is located in the west of the town surrounded byan area with mixed agricultural residential and industrialland use Figure 1 shows the location of the measurementsite nearby major cities and the distribution of 4-yr average(2005ndash2008) AOD derived from the Moderate ResolutionImaging Spectroradiometer (MODIS) at 550 nm wavelengthThe contour map of AOD shown in Fig 1 demonstrates theregion of high AOD from the edge of the North China Plain(north and west of Beijing) expanding to the south and eastwith AOD exceeding 06 indicating the heavy pollution inthe North China Plain Around cities such as Beijing (withabout 16 million inhabitants) Tianjin (10 million inhabi-tants) and Baoding (1 million inhabitants) AOD values ex-ceed 08 which reflect the major anthropogenic aerosol emis-sions in these areas Wuqing is a suburban district of Tianjin(with about 08 million inhabitants) located among a clus-ter of large cities The urban areas of Beijing and Tianjin are80 km to the northwest and 30 km to the southeast of Wuqingrespectively Tangshan (4 million inhabitants) and Baodingare two other cities in the North China Plain 130 km to thenortheast and 160 km to the northwest of Wuqing respec-tively The average AOD at Wuqing is about 07 which isclose to the regional average value of the large polluted areain the North China Plain Therefore it is an optimal sitefor field studies which represents an average pollution levelfor aerosol measurements in the megacity region The siteis thus representative of the regional polluted aerosol in theNorth China Plain The site is in the GMT +0800 time zoneAll times in the paper are reported as GMT +0800
02
04
04
04
0404
04
04
04
06
06
06 06 0606
06
06
0808
08
08
08
08
08
08
08
11
11
Beijing
Wuqing (Site)
Tianjin
Baoding
Bohai Sea
Tangshan
115deg E 116deg E 117deg E 118deg E
39deg N
40deg N
41deg N
Fig 1 Map shows the site location (red star) major cities in thevicinity (red and blue circles) and contour lines of the 4-yr av-erage MODIS AOD (Aerosol Optical Depth) distribution (2005ndash2008 01
times01 resolution)
22 Instrumentation and data
221 HH-TDMA
The main instrument used in this study was a High HumidityTandem Differential Mobility Analyser (HH-TDMA) TheHH-TDMA was designed to measure size-resolved hygro-scopic properties for laboratory and ambient aerosol at RHsbetween 90 and 985 (Hennig et al 2005) The gen-eral principle is similar to that of the hygroscopicity tan-dem mobility analyser system (H-TDMA Rader and Mc-Murry 1986) However in the conventional H-TDMA-system the temperature fluctuations may cause instabilitiesof RH in the second DMA The direct humidification hasits technical limit as well because the water vapour trans-port through semi-permeable membranes is limited (Henniget al 2005) Due to these limitations a stable humidificationof the aerosol and sheath air is difficult to maintain for RHsabove 90 To measure the aerosol hygroscopicity at highRHs the set-up of the HH-TDMA-system was re-designedto minimize the temperature fluctuation in the humidificationprocess and in the size distribution measurement
Similar to the H-TDMA-system the HH-TDMA consistsof two DMAs connected in series with a humidity condition-ing section between them The first DMA extracts a narrowsize increment from the ambient polydisperse aerosol and isoperated at RHlt 5 This nearly monodisperse aerosol isexposed to a well-defined higher RH in the humidity condi-tioning section and the increase of the particle size due to the
wwwatmos-chem-physnet1134792011 Atmos Chem Phys 11 3479ndash3494 2011
3482 P F Liu et al Hygroscopic properties of aerosol particles at high relative humidity
water uptake is determined by the second DMA Differentfrom the conventional H-TDMA two separate temperaturecontrolled water baths are employed to control the tempera-ture of humidity conditioning section and temperature of thesecond DMA respectively A constant temperature decreaseof approximately 2 K is maintained between the second wa-ter bath (for the second DMA operated at 20C) and the firstwater bath (for the humidity conditioning section operated at22C) The humidity conditioning section can humidify thesheath air and the aerosol flow to RH values lower than 90(about 77sim 83 in this study) by regulated mixing of dryair (lt5 RH) and humid air (sim95 RH) The final RH upto 985 is produced by decreasing the temperature of thesecond DMA relative to the humidity conditioning sectionA dew point mirror (DPM) is located in the excess air line ofthe second DMA to measure the RH inside Temperature andRH stability tests conducted by Hennig et al (2005) showedthat the absolute temperatures in HH-TDMA-system can bemaintained withinplusmn01 K the stability withinplusmn002 K andthe RH in the second DMA reaches an absolute accuracy ofplusmn12 for 98 More detailed information regarding theHH-TDMA-system is provided by Hennig et al (2005)
During the HaChi summer campaign the RH values of thesecond DMA were set to be 90 95 and 985 The drydiameters selected by the first DMA were set to be 50 nm100 nm 200 nm and 250 nm For calibration the growth fac-tors of ammonium sulphate particles with 200 nm dry sizeat low RH (approximately 225 in this study) and at 9095 and 985 RH were measured every day The hygro-scopic behaviour of the ammonium sulphate particles is welldepicted by the Kohler theory with a parameterized vanrsquotHoff factor as a function of molality (the molality is de-fined as the amount of constituent divided by the mass ofthe solvent water unit mol kgminus1) The parameterizationscheme for 01lt molalitylt 55 mol kgminus1 was taken fromLow (1969) while that for 10minus5 lt molalitylt 01 mol kgminus1
was taken from Young and Warren (1992) Since 200 nmammonium sulphate particles are unable to take up water atRH lower than the deliquescence point (about 80) in theHH-TDMA the low RH scans were applied to calibrate anypossible offset in sizing by the second DMA cf the firstas well as to determine the TDMA kernel function whichdescribes the instrument response used in the inversion algo-rithm (see Gysel et al 2009) Ammonium sulphate scans atRH values greater than 85 are applied to correct the RHdifference between the second DMA and the DPM at highRH range between 90 and 100 The flows in the HH-TDMA system were checked by a Primary Standard AirflowCalibrator (Gilian Gilibrator) daily during the measurementperiod
In the data quality control routine the temperature and RHvalues recorded by the DPM (placed in the second DMA)and two capacitive RHtemperature sensors (placed in thehumidity conditioning section) were used to check the tem-perature and RH stabilities of the system For a valid mea-
surement scan of the humidified aerosol number size spec-trum the mean temperature at the DPM should be within therange between 1990C and 2010C with a standard devi-ation smaller than 005C The standard deviation of DPMRH should be smaller than 025 The threshold values forthe maximum standard deviations of RH and temperature inthe humidity conditioning section are 05 and 005C re-spectively Any scans with larger deviations in RH or tem-perature than the threshold values have been screened fromthe data set Over the whole period of HaChi summer cam-paign 114 of the measurement data were excluded usingthe criteria described above
222 Data analysis and inversion algorithm
The goals of the H-TDMA measurement and data analysisapproach are to obtain the probability distribution functionof the growth factor (GF-PDF) hence the mean GF and thenumber fraction (nf) for different growth factor ranges In theHH-TDMA-system the dry particles with specific mobilitydiameter are selected by the first DMA and the number sizedistribution of the humidified aerosol particles is determinedusing the second DMA and CPC The measured growth fac-tor distributions can be calculated by dividing the size of thehumidified particle by the size of the dry particle Howeverdue to the finite widths of the size increments of selectedparticles with two DMAs the measured distribution function(MDF) is a skewed and smoothed integral transform of theactual growth factor probability distribution function (GF-PDF c(GF)) (Gysel et al 2009) Therefore a data inver-sion procedure is needed to retrieve the GF-PDF from themeasured data Here the TDMAinv algorithm (Gysel et al2009) was applied to invert each scan of the HH-TDMA-measured number size distribution of humidified aerosol par-ticles into the actual GF-PDF The TDMAinv algorithm hasbeen successfully applied to ambient H-TDMA data in pre-vious studies (Gysel et al 2007 Sjogren et al 2008) In thisalgorithm the GF-PDF is assumed to be a piecewise linearfunction in fixed growth factor intervals and it is normalizedto unity (
intc(GF)dGF= 1)
To facilitate the comparison of the measurements at differ-ent RHs a hygroscopic parameterκ is calculated using thedefinitions of Petters and Kreidenweis (2007)
κ(GF)=(GF3minus1) middot
[1
Sexp(
4σsaMw
RTρwD0GF)minus1
](1)
whereS represents the saturation ratio (S is the same as theRH at subsaturation regime egS = 09 while RH = 90)ρw is the density of waterMw is the molecular weight ofwaterσ sa is the surface tension of the solutionair interfaceR is the universal gas constantT is the temperatureD0 isthe diameter of dry particle andD is the diameter of the hu-midified particle GF =DD0 In this study the temperatureused in theκ calculation is 20C and the surface tensionof the solutionair interfaceσ sa is assumed to be the same
Atmos Chem Phys 11 3479ndash3494 2011 wwwatmos-chem-physnet1134792011
P F Liu et al Hygroscopic properties of aerosol particles at high relative humidity 3483
as the surface tension of the pure waterair interface (about00728 N mminus1 at 20C)
Moreover the concept ofκ-PDF (Probability Distribu-tion Function ofκ c(κ)) is introduced in this study whichrepresents the normalized distribution ofκ The κ-PDFis converted from the GF-PDF for each scan The en-semble mean growth factor is defined as a volume equiva-lent mean value of the GF-PDF over the whole GF rangeGFmean= (
intGF3
middotc(GF)dGF)13 The volume equivalentmean growth factor represents the equivalent growth factor ifthe absorbed water was equally distributed among all parti-cles The mean hygroscopicity parameters (κmean) are calcu-lated from GFmeanusing Eq (1) which are basically equiva-lent to the mean value (1st-moment) of theκ-PDF
Due to a degree of regularity in the complex mixing stateof ambient aerosols different groupings in terms of modes ofhygroscopic growth of particles were frequently and repeat-edly observed in our field campaigns Accordingly we clas-sify the particles into a nearly-hydrophobic (NH) group aless-hygroscopic (LH) group and a more-hygroscopic (MH)group Conventionally the soluble particle volume fractionεAS (using ammonium sulphate as the reference compound)is used to define the boundaries for different groups of hy-groscopic growth (Swietlicki et al 2008 Svenningsson etal 1994 Swietlicki et al 1999 Rissler et al 2006) Inthis study we use the parameterκ as an equivalent alterna-tive to establish boundaries for each grouping of hygroscopicgrowth The following values ofκ have been determinedto be suitable for most of our data to separate the hygro-scopic groups (GF values are for 100 nm dry size particlesat RH = 90 these values varies at other size or RH)
Nearlyminushydrophobic particles(NH)
κ lt= 010(GFlt= 121)
Lessminushygroscopic particles(LH)
κ = 010minus020(GF= 121minus137)
Moreminushygroscopic particles(MH)
κ gt 020(GFgt 137)
For each measured spectrum the HH-TDMA data is pre-sented as the hygroscopic growth factor (GFNHLHMH)
and number fraction (nfNHLHMH) for each group TheGFNHLHMH values are calculated as the volume equiv-alent mean of the GF-PDF within the GF boundaries ofeach group The corresponding hygroscopicity parametersκNHLHMH are determined by the GFNHLHMH using Eq (1)
The state of mixing of aerosol particles can be derivedfrom the GF-PDF orκ-PDF of the measurement scans EachGF-PDF orκ-PDF represents a hygroscopicity distributionof particles with the same dry size Since particles with dif-ferent hygroscopicity generally represent distinct chemical
compositions (or mixing ratio of chemical compounds) thebimodal distribution of a GF-PDF or aκ-PDF generally indi-cates an external mixture The size-resolved CCN activationratio at given supersaturations can be also derived from thesize-resolvedκ-PDF Recently an article by Su et al (2010)gave a detailed description of the hygroscopicity distribu-tion concept similar to theκ-PDF used here for modellingaerosol mixing state with regard to hygroscopic growth andCCN activation Sjogren et al (2008) suggested using thestandard deviationσ of the inverted GF-PDF (σGF) as a mea-sure for the spread of growth factors In this study we cal-culated the standard deviationσ of κ-PDF (σ κ) to estimatethe spread ofκ thus represent the state of mixing in terms ofhygroscopic growth Any scan with largeσ of κ-PDF value(eggt008) indicates that aerosol particles are highly ex-ternally mixed while smallσ of κ-PDF value (eglt008)indicates a state of low degree of external mixing or quasi-internal mixing In this paper the standard deviations of GF-PDF andκ-PDF for NH and MH modes are also presented
223 Correction of HH-TDMA data to set RHs
The HH-TDMA instrument was set at 90 95 and 985RHs Over the whole summer campaign the deviationsof actual RH (measured by the DPM and calibrated usingthe ammonium sulphate particles) from the set value weresmaller than 15 for 90 RH while for 95 and 985RH the deviations were normally withinplusmn05 from set val-ues For each measurement the GFmean and GFNHLHMHwere corrected usingκ-Kohler model ie the corrected GFvalues were recalculated at their nominal values using theκFor GF-PDF the RH correction is more complicated Sincetheκ-Kohler model cannot be solved analytically for GF us-ing RH andκ theγ -model (Eq 4 in Gysel et al 2009) waschosen to calculate the RH correction for GF-PDF Theγ -model overcomes the computational difficulty of theκ-modelin correcting GF-PDF and comparison shows that the correc-tion using theγ -model yields nearly the same results as thecorrection using theκ-Kohler model in this study
23 Regional meteorological model and aerosol boxmodel
231 The WRF model
In this study the Weather Research and Forecast Model(WRF Skamarock et al 2005) version 22 was used togenerate the gridded meteorological fields The simulationuses two nested domains with one-way nesting at resolutionsof 18 km and 6 km with 101times 101 (1800 kmtimes 1800 km)and 250times250 (1500 kmtimes 1500 km) grid cells respectivelyThere are 27 vertical levels using the eta coordinate inthe simulations The initial and boundary conditions weretaken from the Global Forecast System (GFS NCEP FNL10times 10) data at a 6-h resolution The Yonsei University
wwwatmos-chem-physnet1134792011 Atmos Chem Phys 11 3479ndash3494 2011
3484 P F Liu et al Hygroscopic properties of aerosol particles at high relative humidity
(YSU) boundary layer scheme (Hong et al 2006) and the5-class microphysics scheme (WSM5) were used in themodel The simulated meteorological fields were availablefrom 0000 on 11 July to 0000 on 15 August 2009 (UTC)for HaChi summer campaign To better adapt the bound-ary conditions provided by NCEP data the whole campaignwas separated into several continuous 3-day short periods forWRF simulations Each WRF run was initialized 12-h beforethe corresponding period and the first 12-h data were usedfor modelling spin-up followed by the 3-day simulation pe-riod The meteorological fields were output and stored everyhour for analysis In this paper the simulated boundary layer(PBL) height was applied to initialize the PartMC-MOSAICmodel (see Sect 232) This high resolution meteorologi-cal field is also applied in other studies under HaChi projectsuch as back trajectory calculation (eg Gobel et al 2011)
232 The PartMC-MOSAIC model
The PartMC-MOSAIC recently developed by Riemer etal (2009) is a stochastic particle-resolved aerosol box modelwhich explicitly resolves the composition of individual parti-cles in a given population of different types of aerosol parti-cles The PartMC model uses a Monte-Carlo approach forsimulating the coagulation process stochastically Particleemissions as well as the dilution with air representative of thelower free tropospheric above the nocturnal boundary layerare also modelled in a stochastic manner The PartMC wascoupled with a new state-of-the-art aerosol chemistry mod-ule MOSAIC (Model for Simulating Aerosol Interactionsand Chemistry Zaveri et al 2008) which simulates the gasand particle phase chemistries particle phase thermodynam-ics and dynamic gas-particle mass transfer in a determinis-tic manner The coupled system predicts number mass andfull composition distributions It treats all globally impor-tant aerosol species including sulphate nitrate chloride car-bonate ammonium sodium calcium other inorganic massprimary organic aerosol (POA) secondary organic aerosol(SOA) and black carbon (BC) The hygroscopicity parame-ter κ for each aerosol particle is assumed to be the averageof the κ values of the constituent species weighted by theirvolume fractions The assignment of individualκ values istaken from Riemer et al (2010) assumingκ = 065 for allsalts formed from the NH+4 -SO2minus
4 -NO3minus systemκ = 01 forSOAκ = 0001 for POA andκ = 0 for BC
The simulated scenario represents a Lagrangian air parcelover a large megacity region The simulation period is startedat 1800 h 6 August and ended at 1800 h 9 August 2009The model was initialized 12-h before the simulation periodfor model adjustment The mixing layer height was initial-ized based on the PBL height simulated by the WRF modeland the temperature and water vapour mixing ratio were setbased on the measurements The initial gas phase concentra-tions and emission rates are the same as the idealized urbanplume scenario described by Riemer et al (2009) which as-
sumed varied gas phase emissions throughout 0600 to 1800according to a typical diurnal cycle found in a polluted urbanarea
The initial aerosol distribution which is representative ofa regional average particle distribution is tri-modal with anAitken mode and two accumulation modes The modal pa-rameters of this distribution were adjusted to make the simu-lated aerosol concentration and distribution generally consis-tent with the observations using a TDMPS (Tandem Differ-ential Mobility Particle Sizer) combined with an APS (Aero-dynamic Particle Sizer) The initial aerosol was assumed toconsist of (NH4)2SO4 POA and BC with mass fractions ofabout 60 35 and 5 respectively The composition ofeach particle was assumed to be identical ie the initial par-ticles were assumed to be internally mixed Theκ value ofthe initial aerosol is about 036 The mass concentration ofthe initial aerosol was about 40 microg mminus3 which is higher thanthat assumed in Riemer et al (2009) representing the strongregional aerosol pollution in the North China Plain
In Riemer et al (2009) and Riemer et al (2010) a constantparticle emission was assumed during the day between 0600to 1800 h LT and all emissions were switched off during thenight Three types of carbonaceous aerosols were consideredin the emission (1) meat cooking (100 POA) (2) dieselvehicle emissions (30 POA 70 BC) and (3) gasolinevehicle emissions (80 POA 20 BC) This assumptionregarding emissions represents an urban plume scenario asdescribed in Riemer et al (2009) Here by contrast we as-sume a particle emission with the same aerosol types sizedistribution and composition as described by Riemer How-ever particle emission was not switched off during the night(1900ndash070 h LT) but changed to 12 strength of that during0700ndash1900 h LT instead The emission rate during 0700ndash1900 LT was assumed to be the same as that used in Riemeret al (2009) The assumption concerning particle emissionin our study is basically consistent with the diurnal pattern ofblack carbon (BC) concentration during HaChi summer cam-paign observed by the MAAP (Ma et al 2011) which gen-erally shows a higher value during the nighttime and lowervalue during daytime This diurnal variation can be inter-preted as a result of the diurnal variation of emission ratecombined with the diurnal evolution of mixing height Acontinued though lower emission of soot particles at nightcoupled with the shallow nocturnal mixing layer results in ahigher concentration of BC during the night
The PartMC-MOSAIC model is applied in this study tosimulate the diurnal variations of aerosol hygroscopicity andmixing state for a 3-day scenario (from 6 to 9 August 2009)Comparison between the simulated results and the measure-ments of the HH-TDMA are presented in Sect 4 The pro-cesses of coagulation gas and particle phase chemistries andevolution of mixing layer are considered in the model thustheir effects on aerosol hygroscopicity and mixing state canbe estimated
Atmos Chem Phys 11 3479ndash3494 2011 wwwatmos-chem-physnet1134792011
P F Liu et al Hygroscopic properties of aerosol particles at high relative humidity 3485
0
2
4
6
(a1) D
0=50nm 90
95985
0
2
4
6 (b1) D0=100nm
0
2
4
6
Pro
babi
lity
Dis
trib
utio
n F
unct
ion
of G
row
th F
acto
r (G
Fminus
PD
F)
(c1) D0=200nm
08 12 16 2 24 28 320
2
4
6
Growth Factor (DpD
0)
(d1) D0=250nm
0
2
4
6
8
NH LH MH
(a2) D
0=50nm 90
95985
0
2
4
6
8 (b2) D0=100nm
0
2
4
6
8
Pro
babi
lity
Dis
trib
utio
n F
unct
ion
of κ
(κminus
PD
F)
(c2) D0=200nm
0 01 02 03 04 05 060
2
4
6
8
Hygroscopicity Parameter κ
(d2) D0=250nm
Fig 2 Averaged probability distribution functions of(a1ndashd1)growth factor (GF-PDF)(a2ndashd2) hygroscopicity parameterκ (κ-PDF) dashed lines represent the boundaries of the three definedhygroscopic groups data were averaged over the whole period ofHaChi summer campaign
3 Experiment results
31 Distributions of GF and κ
Figure 2 shows the average GF-PDF and the correspond-ing averageκ-PDF for particles with 50 nm 100 nm 200 nmand 250 nm dry diameters The set values of RH are 9095 and 985 and the effect of instrumental RH fluctua-tion on GF-PDF has been corrected (see Sect 223) Pan-els (a1)-(d1) show that the average growth distributions of50 nm 100 nm 200 nm and 250 nm particles are uniformlybimodal A dominate more-hygroscopic mode and a smallerbut distinct nearly-hydrophobic mode can be observed foreach averaged GF-PDF The peaks of MH modes in GF-PDF shift significantly from about 14ndash16 to 21ndash28 (de-pend on different dry diameters) as the RH increases from90 to 985 whereas the peaks of NH modes only shiftvery slightly from about 11 to a value of about 12 thespread of both modes becomes wider as the RH increasesFor the average GF-PDFs with same RH the peak of MHmode shifts to larger values when the dry diameter increasesfrom 50 nm to 250 nm indicating that the hygroscopic parti-cles with larger dry diameters generally have greater growthfactors compared to the smaller hygroscopic particles Pan-els (a2ndashd2) show that the measurements at 90 95 and985 RH generally achieve similar average distributions ofhygroscopicity parameterκ indicating that the hygroscopicgrowths of monodisperse particles measured at different RHsyield consistent results via theκ-Kohler model Similar tothe GF-PDF two distinct modes can be seen for eachκ-PDFThe classification of the three different hygroscopic groups
described in Sect 222 is shown to be appropriate (seeFig2 a2ndashd2) since this classification adequately captures theNH mode and the MH mode for most scans at all RHs andfor all dry diameters The transition regions between the twodistinct modes are defined as the LH group which is overallless important in this study though the LH group has a largerfractional contribution to the PDF at smaller sizes The av-erageκ-PDF represents the probability of the occurrence ofparticles with different hygroscopicity It means that not onlythe mixing state but also the temporal variability of hygro-scopicity contributes to the spread ofκ-PDF
It is noted that theκ value for the peaks of the NH modein theκ-PDFs decreases slightly as the RH increases How-ever considering the inversion resolution (0075 in GF for90 RH and 0125 for 985 RH) and the instrumental un-certainty limits it is not easy to resolve the detailed hygro-scopicity distributions for the nearly-hydrophobic particlesespecially at 90 RH The slight shifts of NH mode inκ-PDFs do not necessarily indicate that the hygroscopicity ofthe NH group particles has a RH-dependent behaviour Asthe RH increases from 90 to 985 the peak of NH in GF-PDF remains at GF = 11 but the spread becomes wider at thesame time We also calculated the number fractions of par-ticles with GFlt 12 and the results show that these valuesdecrease significantly as the RH increase as presented in Ta-ble 1 Taking particles with 100 nm dry size as an examplethe number fractions of GFlt 12 at 90 95 and 985are 016plusmn 010 014plusmn 009 and 009plusmn 008 respectivelyBy contrast the number fraction of particles withκ lt 01(NH group) at three RHs are 016plusmn 010 018plusmn 011 and015plusmn 011 This result indicates that some particles in theNH group are internally mixed with small amounts of solu-ble materials (eg sulphate nitrate etc) or SOA with somesparingly soluble materials thus an observable growth be-haviour appears at very high RH (gt95) This slight changein hygroscopic growth behaviour cannot be resolved withouttaking advantage of the high RH hygroscopic measurement
The statistics of the HH-TDMA measurements are sum-marized in Table 1 The particles are classified into the dif-ferent hygroscopic groups as described in Sect 222 Themean GF meanκ mean nf spread of GF andκ for the NHand MH groups for the whole HaChi summer campaign arepresented These parameters calculated as ensemble meanfor all groups are presented as well The diameters of MHparticles grow significantly at RH ranges from 90 to 985Taking particles with 100 nm dry size as an example themean GF for the MH group at 90 95 and 985 RH are154 181 and 245 respectively whereas the mean GF forNH group particles increases slightly from 108 at 90 RHto 124 at 985 RH No significant variations of meanκ ornf were observed at different RHs Both mean GF and meanκ for all groups and for MH groups increase as a function ofparticle dry diameter For NH group particles the meanκ
decreases from about 005 for 50 nm particles to about 002for 250 nm particles
wwwatmos-chem-physnet1134792011 Atmos Chem Phys 11 3479ndash3494 2011
3486 P F Liu et al Hygroscopic properties of aerosol particles at high relative humidity
Table 1 Summary of the HH-TDMA measurements of hygroscopic growth at 90 95 and 985 RH during HaChi summer campaign(mean valueplusmn1 standard deviation)
Dry diameter (nm) 50 100 200 250
RH () 90 95 985 90 95 985 90 95 985 90 95 985
Number of scans 226 218 205 758 320 416 244 221 218 168 156 151inversion resolution1GF 0075 0075 010 0075 0075 0125 0075 0075 0125 0075 0075 0125Number fraction of GFlt 12 group 022plusmn 014 013plusmn 011 007plusmn 0008 016plusmn 010 014plusmn 009 009plusmn 008 016plusmn 009 014plusmn 009 010plusmn 008 015plusmn 010 013plusmn 009 009plusmn 009
Nearly-hydrophobic group NH
Number fraction 018plusmn 012 020plusmn 013 017plusmn 013 016plusmn 010 018plusmn 011 015plusmn 011 016plusmn 009 016plusmn 010 012plusmn 010 015plusmn 010 014plusmn 010 011plusmn 010Mean GFplusmn std (when present) 110plusmn 003 116plusmn 004 125plusmn 008 108plusmn 002 113plusmn 006 124plusmn 013 107plusmn 002 110plusmn 005 117plusmn 014 106plusmn 002 109plusmn 004 115plusmn 015Mean spreadσ of GF 004plusmn 001 007plusmn 002 011plusmn 003 005plusmn 001 007plusmn 002 014plusmn 006 004plusmn 001 006plusmn 003 012plusmn 007 004plusmn 001 005plusmn 002 010plusmn 006Meanκ plusmn std 0054plusmn 0014 0051plusmn 0013 0049plusmn 0017 0034plusmn 0011 0032plusmn 0016 0031plusmn 0019 0028plusmn 0010 0021plusmn 0012 0016plusmn 0016 0025plusmn 0007 0018plusmn 0010 0013plusmn 0017Mean spreadσ of κ 0023plusmn 0005 0024plusmn 0006 0023plusmn 0007 0023plusmn 0006 0022plusmn 0008 0021plusmn 0009 0018plusmn 0005 0015plusmn 0007 0013plusmn 0009 0016plusmn 0005 0012plusmn 0007 0010plusmn 0007
More-hygroscopic group MH
Number fraction 068plusmn 018 066plusmn 018 069plusmn 017 078plusmn 012 075plusmn 013 079plusmn 014 081plusmn 011 082plusmn 012 085plusmn 013 084plusmn 012 084plusmn 012 087plusmn 011Mean GFplusmn std 146plusmn 005 168plusmn 006 213plusmn 009 154plusmn 002 181plusmn 004 245plusmn 007 161plusmn 004 194plusmn 005 274plusmn 009 163plusmn 004 198plusmn 005 281plusmn 009Mean spreadσ of GF 0051plusmn 0013 0065plusmn 0016 0117plusmn 0026 0055plusmn 0011 0069plusmn 0012 0125plusmn 0023 0061plusmn 0010 0082plusmn 0013 0142plusmn 0019 0060plusmn 0011 0081plusmn 0013 0140plusmn 0018Meanκ plusmn std 031plusmn 004 030plusmn 004 031plusmn 004 033plusmn 002 032plusmn 002 033plusmn 003 038plusmn 003 037plusmn 003 038plusmn 004 039plusmn 003 039plusmn 003 039plusmn 004Mean spreadσ of κ 0045plusmn 0012 0041plusmn 0011 0048plusmn 0011 0045plusmn 0009 0042plusmn 0008 0047plusmn 0009 0054plusmn 0009 0053plusmn 0009 0057plusmn 0009 0054plusmn 0010 0054plusmn 0009 0058plusmn 0009
Ensemble mean of all groups
Mean GFplusmn std 139plusmn 007 157plusmn 010 197plusmn 015 148plusmn 005 170plusmn 008 231plusmn 012 154plusmn 006 184plusmn 009 261plusmn 014 157plusmn 006 189plusmn 008 270plusmn 013Mean spreadσ of GF 014plusmn 004 020plusmn 006 032plusmn 011 017plusmn 005 025plusmn 008 042plusmn 017 020plusmn 005 029plusmn 008 047plusmn 020 020plusmn 006 029plusmn 010 045plusmn 022Meanκ plusmn std 025plusmn 006 024plusmn 006 025plusmn 006 028plusmn 004 026plusmn 004 028plusmn 004 032plusmn 004 031plusmn 005 033plusmn 005 034plusmn 005 033plusmn 005 035plusmn 005Mean spreadσ of κ 010plusmn 003 010plusmn 003 010plusmn 003 011plusmn 003 011plusmn 003 011plusmn 004 013plusmn 003 013plusmn 003 012plusmn 004 013plusmn 004 013plusmn 004 012plusmn 005
32 Time series meteorology and diurnal variation
The meteorological parameters eg wind direction (WD)wind speed (WS) temperature(T ) and relative humidity(RH) were continuously measured at Wuqing meteorologi-cal station by instruments which were beside the containerswith the aerosol instruments The time series of meteorolog-ical parameters are presented in Fig 3 panel (a and b) TheambientT and RH both show pronounced diurnal variationwith high temperature and low RH during the day and theopposite during the night For particles with 100 nm dry di-ameter the time series of hygroscopicity parameters for allgroups (κmean) MH group (κMH) and NH group (κNH) areshown in panels (cndashe) and the number fraction of MH group(nfMH) and NH group (nfNH) are illustrated in panels (fndashg) respectively Panels (cndashg) demonstrate that the hygro-scopicity parameters and number fractions measured at 9095 and 985 RH generally yield consistent results indi-cating that the RH-dependence of aerosol hygroscopicityκ
is not important in the RH range between 90ndash985 in thisstudy Figure 4 depicts the results of autocorrelation anal-ysis for meteorological parameters (panel a) and forκmeanκMH and nfNH of 100 nm dry diameter particles measured atthree RHs (panel b) The correlation coefficient of ambientT and ambient RH show sinusoidal variations with high val-ues of 05ndash06 when1t = 24 48 and 72 h demonstratingthe pronounced diurnal variations of these variables Theseresults are consistent with those depicted in Fig 3a b Sim-ilarly autocorrelation analysis shows that the diurnal varia-tion of nfNH is very pronounced and that ofκmean is rela-tively weaker but it is still significant The diurnal variationfor theκMH was found to be less obvious (see Fig 4b) Sim-ilar analyses were also done for nfMH andκNH (not shown inthe figure) and both show significant diurnal variations The
0
5
10W
S (
ms
)
(a)
simulated period
N E S W N
40
60
80
RH
(
)
(b)
20
30
40
T (
degC)
01
02
03
04
κ mea
n
(c) D
0=100nm 90 95 985
02
03
04
05
κ MH
(d) D
0=100nm 90 95 985
0004008012016
κ NH
(e) D
0=100nm 90 95 985
020406080
100
nfM
H (
)
(f) D0=100nm
90 95 985
Jul 19 Jul 24 Jul 29 Aug 03 Aug 08 Aug 130
20
40
60
nfN
H (
)
Date
(g) D
0=100nm 90 95 985
Fig 3 Time series of meteorological parameters and hygroscopicproperties of 100 nm particles in the HaChi summer campaign(a)wind speed and wind direction(b) temperature(T ) and relativehumidity (RH) (c) meanκ (averaged over both modes 100 nmdry diameter)(d) κ of more-hygroscopic group particles(e)κ of nearly-hydrophobic mode particles(f) number fraction ofmore-hygroscopic group particles(g) number fraction of nearly-hydrophobic group The dashed lines represent the average value ofeach parameter
Atmos Chem Phys 11 3479ndash3494 2011 wwwatmos-chem-physnet1134792011
P F Liu et al Hygroscopic properties of aerosol particles at high relative humidity 3487
(a)
-08-06-04-02
002040608
1T RH WS r
crit α=001
Δt (h)
Cor
rela
tion
Coe
ffici
ent
r
(b)
0 6 12 18 24 30 36 42 48 54 60 66 72-04
-02
0
02
04
06
08
1nf
NH D
0=100nm
κmean
D0=100nm
κMH
D0=100nm
Fig 4 Autocorrelation analysis of meteorological parameters andhygroscopic properties of 100 nm particles(a) temperature(T )relative humidity (RH) and wind speed (WS)(b) number fractionof nearly-hydrophobic group (nfNH) meanκ (κmean) andκ of morehygroscopic group (κMH) The dashed lines show the significancelevel of 001
01
02
03
04
05
κ mea
n
(a)
night day night
02
03
04
05 (b)
κ MH
50nm 100nm 200nm 250nm
0
20
40
60 (c)
nfN
H (
)
1h running avg 90 RH 95 RH 985 RH
0 2 4 6 8 10 12 14 16 18 20 22 240
005
01
015
02(d)
Hour of day
σ of
κ-P
DF
Fig 5 Diurnal variations of aerosol hygroscopic properties(a) meanκ of all groups(b) κ of more-hygroscopic group(c) thenumber fraction of nearly-hydrophobic group(d) the spread ofκ-PDF
time series and autocorrelation analysis indicate that the frac-tion of NH particles eg freshly emitted soot varies greatlyduring a day while the hygroscopicity of MH group parti-
cles is relatively stable during the measurement period Thevariation of hygroscopicity of all groups is largely due to thediurnal variation of number fraction of NH group particles
The average diurnal variations ofκmean κMH and nfNHof 50 nm 100 nm 200 nm and 250 nm dry diameters duringHaChi summer campaign are presented in Fig 5andashc Theseparameters generally show different characteristics betweendaytime and nighttime measurements An apparent featureof the diurnal pattern is that the nfNH of all dry diameterschanges significantly with time of a day (see Fig 5c) Theaverage nfNH between 1800 to 0900 (nighttime) is about20 while between 0900 to 1800 (day-time) it is about 8A significant decrease and rapid increase of nfNH were oftenobserved at 0800 to 1000 and at around 1800 respectivelyFigure 5a shows that the averageκmean for 100 nm 200 nmand 250 nm particles increases slightly during the day whilethe averageκmean for 50 nm increases significantly repre-senting that the hygroscopicity of aerosol particles with 50to 250 nm dry diameters is enhanced during the day due tothe decrease of the fraction of NH particles The differencesof κMH for particles with different dry diameters are smallerduring the day than during the night (see Fig 5b) indicatingthat during the day the chemical composition is more evenlydistributed across dry diameter Figure 5d indicates that thespread ofκ-PDF which basically represents the dispersion ofchemical composition (in terms of the hygroscopic growth)among particles with the same dry diameters decreases dur-ing the day
The diurnal patterns of the parameters mentioned abovereflect the variation of aerosol mixing states The high num-ber fraction of NH particles during the night indicates thatthe freshly emitted hydrophobic particles (eg fresh soot orprimary organic aerosol see Petters et al 2006 and Zhang etal 2008) have accumulated in the surface layer apparentlyexternally mixed with the hygroscopic particles During theday the fraction of NH mode nfNH is smaller (see Fig 5c)indicating that aged aerosol was dominant in the atmospherenear the surface Figure 5a b and d show clearly that differ-ences in hygroscopicityκ among particles are less apparentduring the day indicating that the extent of external mixingis lower in the daytime compared to that at night Similarresults regarding the diurnal variations of aerosol hygroscop-icity and mixing state were reported several previous stud-ies (eg Moffet and Prather 2009 Lance 2007 Rose et al2011) These measurements were also made in megacity ar-eas (Mexico City Mexico for Moffet and Prather 2009 andLance 2007 Guangzhou China for Rose et al 2011)
33 Hygroscopic growth at high humidity
Figure 6a1ndashd1 show the hygroscopic growths of aerosol par-ticles with 50 nm 100 nm 200 nm and 250 nm dry diame-ters respectively The squares and crosses represent the aver-age growth factors of MH group and NH group measured by
wwwatmos-chem-physnet1134792011 Atmos Chem Phys 11 3479ndash3494 2011
3488 P F Liu et al Hygroscopic properties of aerosol particles at high relative humidity
the HH-TDMA respectively (corrected to the nominal RHs)and the error bars denote the standard deviations red andblue colours represent measurements during the day (0900ndash1800 LT) and during the night (1800ndash0900 LT) respec-tively The fitted curves areκ-Kohler curves using the av-eragedκ measured at all RHs The reference curves (greensolid curves) are calculated Kohler curves for ammoniumsulphate particles using the scheme from Low (1969) andYoung and Warren (1992) It can be seen that the growthcurves can be well described with the single-parameter (κ)Kohler model given in Eq (1) Over time remarkably con-sistent hygroscopic growths were observed for hygroscopicgroup particles with all dry diameters Compared to the hy-groscopic growth factors of pure ammonium sulphate parti-cles those of MH group particles with 50 nm and 100 nmdry diameters reveal relatively lower values (see Fig 6a1and b1) indicating that these particles are quasi-internalmixtures of both inorganic compounds (eg sulphate ni-trate and sodium chloride with strong hygroscopicity) withorganic compounds (normally slightly hygroscopic or hy-drophobic) or an insoluble core (eg soot or dust) with in-organic coating By comparison MH group particles with200 nm and 250 nm dry diameters demonstrate larger hygro-scopic growth factors (see Fig 6c1 and d1) For large particlesize growth factors are as high as 16 at 90 and about 28 at985 RH (for 250 nm particles nighttime measurements)These pronounced growths in diameter imply dramatic en-hancement in aerosol scattering with a correspondingly largechange in other aerosol optical properties at high RHs Thehygroscopic growths of 200 nm and 250 nm MH group parti-cles are only slightly lower than those of the pure ammoniumsulphate particles indicating that these particles contain largefractions of inorganic compounds The error bars of GFMHmeasured by the HH-TDMA are generally small indicatingthat the temporal variations of GFMH at the same RH (dueto the variations of hygroscopicity) are less significant thanthe variations of GFMH due to the change of RH The HH-TDMA measurements show that the hygroscopicity factorκ
of MH group particles during the day is about 9 lower thanthat during the night
The hygroscopic growths for the NH group particles athigh RH are much weaker compared to those for the MHgroup particles The GFNH values are generally lower than12ndash13 during the night at RHlt 985 During the day theaverage GFNH values are slightly higher and the standard de-viations (which show the temporal variations) are larger thanthose during the night
Figure 6a2ndashd2 shows the average number fractions ofthree hygroscopic groups during daytime and nighttime re-spectively No significant variations of nf values were ob-served at three different RHs for either daytime or nighttimemeasurements The nfNH values measured at nighttime weresignificant higher than that during daytime while the nfMHwere higher during the day The number fractions of thetransition group nfLH were larger at smaller sizes (sim14
10
15
20
25
30
35
GF
(a1) D0=50nm
HHTDMA MH daytimeHHTDMA NH daytimeHHTDMA MH nighttimeHHTDMA NH nighttimeAmmonium sulfate
90 92 94 96 98 1000
20406080
nf (
) (a2) D
0=50nm
(b1) D0=100nm
MH daytime fittedNH daytime fittedMH nighttime fittedNH nighttime fitted
90 92 94 96 98 100
(b2) D0=100nm
10
15
20
25
30
35
GF
(c1) D0=200nm
90 92 94 96 98 1000
20406080
nf (
) (c2) D
0=200nm
RH ()
(d1) D0=250nm
90 92 94 96 98 100
(d2) D0=250nm
Fig 6 (a1ndashd1)the hygroscopic growth of aerosol particles withdifferent dry diameters of 50 nm 100 nm 200 nm and 250 nm re-spectively The growth factors (GF) of nearly-hydrophobic (NH)group and more-hygroscopic (MH) group are the mean values of themeasured GFs corrected to their set RHs (90 95 and 985)the error bars representplusmn1 s d the blue and red lines are fittedκ-Kohler curves using the meanκ measured by the HH-TDMAthe green lines are the hygroscopic growth of ammonium sulphateparticles calculated following Low (1969) and Young and Warren(1992) (a2-d2) the mean number fractions of nearly-hydrophobic(NH) group less-hygroscopic (LH) group and more-hygroscopic(MH) group particles (from dark colour to light colour) with 50 nm100 nm 200 nm and 250 nm dry diameters
at 50nm andsim6 at 100nm) but negligible for larger sizes(lt3 at 200 nm and 25 nm)
34 Parameterization of HH-TDMA data
To further facilitate the use of HH-TDMA dataκ can beparameterized as a function of dry diameterD0 using theequation (Rissler et al 2006)
κ(D0) = B log(D0)+CD0+D (2)
where B C and D are fitted parameters In Rissler etal (2006) an equation similar to Eq (2) as presented herewas used to parameterize the size-dependent variation ofAwhereA is identical toκ in principle if the Kelvin term isneglected Similarly the nf is also parameterized as a func-tion of D0 using the same equation as Eq (2) by replacingκ(D0) with nf(D0) Examples for the parameterizations arepresented in Fig 7 The value ofκ for the MH group particlesmeasured during the night increases significantly with parti-cle dry diameter suggesting an increasing fraction of solublecomponents However theκMH is significantly less than theκ of pure ammonium sulphate particles (green lines) During
Atmos Chem Phys 11 3479ndash3494 2011 wwwatmos-chem-physnet1134792011
P F Liu et al Hygroscopic properties of aerosol particles at high relative humidity 3489
0
01
02
03
04
05
hygr
osco
pici
ty p
aram
eter
κ
MH daytimeMH nighttimeNH daytimeNH nighttimeAmmonium Sulfate 90 RHAmmonium Sulfate 95 RHAmmonium Sulfate 985 RH
50 100 150 200 2500
10
20
30
40
Dry diameter D0 (nm)
nf N
H g
roup
(
)
90 RH 95 RH 985 RH
Fig 7 Parameterization ofκ and nf The upper panel showsthe parameterizations ofκ as functions of dry diameter for more-hygroscopic group and nearly-hydrophobic group particles duringthe day and during the night respectively the lower panel shows theparameterizations of the number fractions of nearly-hydrophobicgroup particles
the day theκMH increases slightly for diameters greater than100 nm indicating that the variation of soluble fraction withdiameter is less pronounced than that during the night For50 nm MH particles daytime measurements show strongerhygroscopicity which suggest that the Aitken mode particlesmay have different sources during the day from that duringthe night In contrast to the MH group described above theκ of NH group particles decreases slightly as a function a drydiameter for both day and night measurements
In this studyκ and nf for MH group NH group and en-semble mean for all groups during the day during the nightand during the whole period have been fitted empirically asdescribed above The values of the parameters in Eq (2)are summarized in Table 2 The parameterized GFs can bederived by solving Eq (1) usingκ values calculated fromEq (2) combined with parameters in Table 2 A lookup ta-ble was made for GF values as a function of dry diameterand RH The result is illustrated in Fig 8 panels (andashc) whichshow the parameterized mean GF of all groups for day-timenight-time and whole period measurements respectively GFvalues which are represented by the colour of the contourlines can be read directly from the figure Similar lookuptables or contour figures can also be made for each hygro-scopic group separately using the data in Table 2 To val-idate our parameterization for GF Fig 8d presents a com-parison between the parameterized GF and the measured GFThe comparison result shows that in most cases our param-eterizations adequately capture the variations of GF and nf
Table 2 Summary of fitting parameters for the parameterization ofκ and nf see Eq (2) and Sect 34 for description
B C D
Summer daytime scans
κ more-hygroscopic group minus0150 0000703 0553κ nearly-hydrophobic group minus00391 minus412times10minus6 0121κ all groups minus0172 0000807 0553nf more-hygroscopic group minus00930 0000664 0963nf nearly-hydrophobic group 00886 minus0000337 minus00596
Summer nighttime scans
κ more-hygroscopic group 00837 0000228 0144κ nearly-hydrophobic group minus00926 0000158 0200κ all groups 0136 800times 10minus5
minus00101nf more-hygroscopic group 0644 minus000129 minus0408nf nearly-hydrophobic group minus0166 0000313 0491
summer average
κ more-hygroscopic group 00285 0000320 0243κ nearly-hydrophobic group minus00812 0000126 0183κ all groups 00533 0000279 0141nf more-hygroscopic group 0431 minus0000682 minus00196nf nearly-hydrophobic group minus00770 309times 10minus5 0314
as functions of dry diameter and RH (90ndash985) For theGF of NH group during the night at 985 RH the parame-terized GF deviates slightly from the measured values Sincethe parameterizations are based on the measured size range50ndash250 nm we do not recommend extrapolating Eq (2) toparticles larger than 250 nm or smaller than 50 nm It isworth to note that Meier et al (2009) and Eichler et al (2008)observed a decreasing trend in GF for particles larger than300 nm based on the measurements conducted in Beijing(North China Plain) and Xinken (Pearl River Delta in South-Eastern China) respectively The decrease in hygroscopicityfor large particles is because of higher contents of mineraldust
4 Diurnal variations of aerosol hygroscopicity andmixing state a case study
41 Description of meteorological situation
To better understand the chemical and meteorological pro-cesses dominating the diurnal variation of aerosol hygroscop-icity and mixing state a state-of-the-art stochastic particle-resolved aerosol box model PartMC-MOSAIC was appliedto simulate the aerosol hygroscopicity and mixing state (seeSect 232 for the description of the model) A 3-day periodfrom 6 August 1800 LT to 9 August 2009 1800 LT was se-lected for the simulations Influenced by the slow-moving ty-phoon ldquoMorakotrdquo near Taiwan about 2000 km south from the
wwwatmos-chem-physnet1134792011 Atmos Chem Phys 11 3479ndash3494 2011
3490 P F Liu et al Hygroscopic properties of aerosol particles at high relative humidity
88 90 92 94 96 9850
100
150
200
250
(a) daytime
D0 (
nm)
88 90 92 94 96 98
(b) nighttime
RH ()
parameterized mean GF all groups
14 15 16 17 18 19 2 21 22 23 24 25 26 27 28 29 3
88 90 92 94 96 98
(c) whole period
1 15 2 25 31
15
2
25
3
parameterized GF
mea
sure
d G
F
(d)
all groups daytimeall groups nighttimeall groups whole periodMH daytimeMH nighttimeMH whole periodNH daytimeNH nighttimeNH whole period
Fig 8 Contours show the parameterized mean growth factors ofall groups during(a) daytime (b) nighttime (c) whole period ofHaChi summer campaign(d) Comparison between measured andparameterized growth factors the error bars represent the one stan-dard deviation of the measurements during the summer campaignperiod the dashed line shows the 11 line
site the synoptic situation of Wuqing during this period wasrelatively constant withlt3 m sminus1 east wind dominating thisarea most of the time (see Fig 3a where the selected periodis marked) The weather was cloud-free without precipita-tion Under this meteorological situation the pollution in thesurface layer was dominated by the local or regional emis-sions Thus the meteorological situation was well suited forthe investigation of the diurnal variations of aerosol proper-ties via PartMC-MOSAIC
42 Description of the simulated cases
There are several plausible mechanisms to explain the diurnalbehaviour of aerosol mixing state all of which are likely con-sistent with the measurements described in Sect 32 (Petterset al 2006 Riemer et al 2009 Moffet and Prather 2009Lance 2007 Rissler et al 2006) (1) condensation of sec-ondary organic and inorganic species onto the hydrophobicparticles (2) photochemical oxidation on the surface or inthe interior of hydrophobic particles (3) coagulation of hy-drophobic particles with more hygroscopic background par-ticles (4) the downward mixing by entrainment of moreaged hygroscopic particles from aloft due to the break-upof the nocturnal inversion layer
The PartMC-MOSAIC model consists of two parts thePartMC model (Riemer et al 2009) deals with the coagu-
Table 3 Schemes used in different cases of the PartMC-MOZAICsimulation
case No coagulation gas particle mixing layerphase chemistries height
c1 off off variedc2 on off variedc3 on on variedc4 on on fixed (1000 m)
lation process particle emissions and dilution in a stochas-tic manner while the aerosol chemistry module MOSAIC(Zaveri et al 2008) simulates the gas and particle phasechemistries particle phase thermodynamics and dynamicgas-particle mass transfer deterministically The effects ofthese mechanisms on aerosol hygroscopicity and mixingstate can be isolated by designing different model simulationcases We initially assumed 2times104 particles in the air parcelfor the stochastic simulations Table 3 shows the experimen-tal design for the mechanism settings used in this study Forcase 1 coagulation was switched off in PartMC model andthe MOSAIC chemistry module was disabled in the simula-tion Different emission rates of anthropogenic carbonaceousaerosols were set for daytime and nighttime (see Sect 232)A variable mixing height (see Fig 9a) was adapted from thesimulation of WRF model (see Sects 231 and 232) Thusin this case with condensation photochemical oxidation andcoagulation processes disabled increases of mixing heightand entrainment of air from aloft with a lower concentrationof internally mixed aerosols during the morning resulted inthe dilution of surface aerosol concentrations and the changeof the overall aerosol mixing state For case 2 the coagu-lation process was switched on and other settings were keptthe same as case 1 For case 3 the PartMC model was cou-pled with the gas-particle chemistry module MOSAIC andothers were the same as case 2 so that all mechanisms men-tioned above were considered in the case-3 simulation Forcase 4 to disable the entrainment of aerosol from aloft in themorning the mixing height was fixed to 1000 m (see Fig 9a)base on case 3 The evolution of aerosol properties in the airparcel were therefore driven by the aging processes eg co-agulation condensation of secondary organic and inorganicspecies and photochemical oxidation
43 Simulated and measured aerosol properties
The comparison of modelled and measured aerosol proper-ties is shown in the lower two panels of Fig 9 The modelledexternal mixed BC and POA (withκ lt 01) are considered tobe a proxy for NH particles and are compared to the mod-elled total number concentration to yield a modelled nf Thevolume-weighted averageκ for all modelled components iscompared to the measuredκmean Both the simulation (case 3
Atmos Chem Phys 11 3479ndash3494 2011 wwwatmos-chem-physnet1134792011
P F Liu et al Hygroscopic properties of aerosol particles at high relative humidity 3491
in which all mechanisms were included) and measurementsshow that the concentrations of both total aerosol and blackcarbon are lower during the day than during the night due tothe dilution in the morning when the mixing height increases
Figure 9b and c show that the diurnal variations of nfNHandκmeanfor 100 nm particles measured by the HH-TDMAare very pronounced during our simulation period The nfNHof 100 nm particles is generally low in the afternoon (about0 to 10) indicating that most of the aerosol particles arehygroscopic while the nfNH increases rapidly after 1800 LTwhen the PBL collapses and the HH-TDMA measurementsshow clear bi-modal distributions of GF-PDF andκ-PDFwhich indicate that the aerosol particles are externally mixed(see Fig 9b) The meanκ of all groups shows the inversediurnal pattern Theκmean for 100 nm dry diameter parti-cles is about 02 during the night and increases rapidly inthe morning to about 03 The diurnal variations of nfNH andκmeanof 50 nm 200 nm and 250 nm particles are similar tothose of 100 nm particles described above The diurnal pat-terns of nfNH andκmeanof particles with 100 nm dry diametercan be well depicted by the PartMC-MOSAIC simulations ofcase 1 2 and 3 in which the process of aerosols entrainmentfrom aloft in the morning is included In contrast simula-tion of case 4 has failed to capture these diurnal variationsIn case 4 aging processes such as coagulation condensa-tion and photochemical aging are included but we assumed afixed mixing height to prevent the dilution and entrainment ofbackground aerosols in the morning when the actual mixingheight is increasing These results indicate that the entrain-ment of background aged particles in the morning is deci-sive in explaining the diurnal cycle of aerosol hygroscopicityand mixing state In the morning (sim0700 LT) the increasingmixing height brings a downward entrainment of more agedand hygroscopic particles from aloft leading to the decreaseof nfNH and increase ofκmean while in the evening (after1800 LT) the shallow nocturnal stable layer combined withthe local emission of black carbon aerosols (eg soot emittedfrom diesel truck engines during the night) explain the rapidincrease of hydrophobic particle fraction and the decrease ofthe mean hygroscopicity A similar boundary layer mech-anism was suggested by Rissler et al (2006) to explain thediurnal pattern of number concentration size distribution andhygroscopic properties for biomass burning aerosols in Ama-zonia In this study we use a particle-resolved aerosol modelto estimate the effects of downward mixing of more agedaerosol in the morning hour and confirm that this mechanismis a plausible explanation for the diurnal pattern of aerosolhygroscopicity and mixing state It is important to note thatin the simulations we assume the aerosols above the mix-ing layer to be an internal mixture of sulphate OC and BCThe reasons are that these lofted aerosol particles have un-dergone longer aging processes compared to those in the sur-face layer near emission sources and that the aging of loftedaerosol particles may be accelerated by cloud processes Al-though we consider that this assumption is reasonable more
0
500
1000
1500
2000
2500
mix
ing
heig
ht (
m)
(a)c1minusc3 c4
0
20
40
60
80
nf h
ydro
phob
ic m
ode
()
(b)100nm 90 measured 95 measured 985 measured
1800 Aug 7 0600 1200 1800 Aug 8 0600 1200 1800 Aug 9 0600 1200 180001
02
03
04
05
mea
n κ
Time
(c)c1 c2 c3 c4
Fig 9 Comparisons between the PartMC-MOSAIC simulationsand the HH-TDMA measurements(a) Mixing layer height set fordifferent cases(b) number fraction of nearly-hydrophobic parti-cles(c) mean hygroscopicity parameterκ of all groups See Table 3for the settings in the model for the four cases(c1-c4)
three-dimension measurements of aerosol mixing state (egPratt and Prather 2010) could be valuable for our scientificunderstanding
Comparisons among the results of case 1 2 and 3 indi-cate as expected that the aging processes such as coagula-tion condensation of organicinorganic species and photo-chemical aging also contribute to the variations of the aerosolhygroscopicity and mixing state Case 2 (with coagulation)demonstrates slightly lower hygroscopicity for 100 nm par-ticles compared with case 1 This could be interpreted asthe transformation via coagulation of the smaller particles(sim50 nm) which contain large number fraction of fresh sootinto larger (sim100 nm) less-hygroscopic particles resulting inthe decrease of mean hygroscopicity measured for 100 nmparticles Comparison between case 3 and case 2 shows thatthe condensation and photochemical aging processes couldsignificantly increase the mean hygroscopicity for 100 nmparticles The chemical aging effects are more pronouncedin the afternoon (1200ndash1800 LT) due to the formation ofsecondary species However the chemical aging and coag-ulation aging are insufficient in explaining the pronounceddiurnal variations of mean hygroscopicity and mixing stateobserved in this study (see Fig 9b c)
5 Conclusions
For the first time in this geographical and pollution source re-gion of the North China Plain we employed the HH-TDMAto investigate the atmospheric aerosol and provide a detaileddescription of its hygroscopic properties and mixing state athigh RH between 90 and 985 The measurements were
wwwatmos-chem-physnet1134792011 Atmos Chem Phys 11 3479ndash3494 2011
3492 P F Liu et al Hygroscopic properties of aerosol particles at high relative humidity
conducted from 17 July 2009 to 12 August 2009 These in-situ field measurements of atmospheric aerosol are uniquewith respect to their high RH range and especially of im-portance to better understand the widespread anthropogenichaze over the North China Plain
The average GFs of particles with 50ndash250 nm dry diam-eters measured at 90 95 and 985 RHs are 139ndash157157ndash189 and 197ndash270 respectively The average GF mea-sured at the same RH generally increased as a function of drydiameter The corresponding average hygroscopicity param-eterκ was also determined ranging from 025 to 034 for 50to 250 nm particles The average GF-PDF reveals a bi-modaldistribution with two distinct peaks and an intermediate tran-sition region To facilitate the comparison and interpretationof HH-TDMA data measured at different RHs and for differ-ent particle size the inverted GF-PDFs were classified intonearly-hydrophobic (κ lt 01 first peak) less-hygroscopic(κ = 01 to 02 transition) and more-hygroscopic (κ gt 02second peak) groups Based on this classification of hygro-scopic groups using the criteria ofκ the hygroscopic prop-erties measured at different RHs yielded consistent resultsin terms of κ indicating that theκ-theory is adequate indescribing the hygroscopic growth of atmospheric aerosolat a RH range between 90ndash985 Detailed analysis re-garding RH-dependency ofκ will be presented by Milden-berger et al (2011) Particles of the more-hygroscopic groupare generally dominant for the measured size range of 50 to250 nm and the average fraction of the more-hygroscopicgroup is slightly higher for larger particles ranging from68 to 85 for 50 to 250 nm particles The hygroscopicgrowth of the more-hygroscopic group was relatively sta-ble during the period with averageκ values of 030 to 039for 50 to 250 nm particles Although the more-hygroscopicatmospheric aerosols reveal lower hygroscopicity than pureammonium sulphate (withκ =sim 05 to 06) these particlesexperienced large hygroscopic growth at high RH (gt90)their size being increased by 21sim 28 fold at 985 RH ascompared to dry particles These hygroscopic growth be-haviours also reveal an immense potential of light scatteringenhancement at high humidity and the potential for beinghighly effective cloud condensation nuclei For NH groupthe averageκ value of 50 nm particles was about 005 whilethat for 250 nm particles was around 002
The variation of the mean hygroscopicity of all groups ismostly due to the pronounced diurnal pattern for the num-ber fractions of different groups The average number frac-tion of nearly-hydrophobic particles during day-time (0900ndash1800 LT) is about 8 while during the night the fractionreaches about 20 An inverse diurnal pattern of the numberfraction of more-hygroscopic particles was correspondinglyobserved This variation in number fraction also indicatesa change in aerosol mixing state Based on the spread ofκ-PDF most of the scans measured during the night demon-strated distinctly external mixing states while during the daythe degree of external mixing was less A case study for a
three day period with stable meteorological conditions wasconducted to investigate the diurnal pattern of hygroscopic-ity and mixing state using a particle-resolved aerosol modelPartMC-MOSAIC In the case study the high fraction ofnearly-hydrophobic particles during the night was well ex-plained by the shallow nocturnal layer combined with freshsoot emissions from traffic while the rapid decrease in thenumber fraction of nearly-hydrophobic particles and the cor-responding increase in the meanκ in the morning hours aremostly due to the entrainment of aged and hygroscopic par-ticles from the residual layer aloft as the stable layer breaksdown The condensation photochemical aging and coagula-tion processes are also included in the simulations and theycould contribute to the variation of aerosol hygroscopicityand mixing state as expected However these aging pro-cesses alone were evaluated to be insufficient in magnitudeor rate to interpret the observed diurnal pattern of hygroscop-icity and mixing state in terms of hygroscopic growth
AcknowledgementsThe authors thank M Gysel for the use of theTDMA inversion algorithm (TDMAinv) The authors acknowledgeN Riemer M West and R A Zaveri for their provision and guid-ance of the PartMC-MOSAIC model The invaluable commentsfrom D S Covert D Lamb J P Chan and R Shaw are alsogratefully acknowledged This work is supported by the NationalNatural Science Foundation of China (NSFC) under Grant No40875001 the German Science Foundation under grant DFG WI144914-1 and the 973 Program (2011CB403402)
Edited by V-M Kerminen
References
Albrecht B A Aerosols cloud microphysics and fractionalcloudiness Science 245 1227ndash1230 1989
Charlson R J Schwartz S E Hales J M Cess R DCoakley Jr J A Hansen J E and Hofmann D J Cli-mate forcing by anthropogenic aerosols Science 255 423ndash430doi101126science2555043423 1992
Cheng Y F Wiedensohler A Eichler H Heintzenberg JTesche M Ansmann A Wendisch M Su H Althausen DHerrmann H Gnauk T Bruggemann E Hu M and ZhangY H Relative humidity dependence of aerosol optical proper-ties and direct radiative forcing in the surface boundary layer atXinken in Pearl River Delta of China An observation based nu-merical study Atmos Environ 42 6373ndash6397 2008
Deng Z Z Zhao C S Zhang Q Huang M Y and Ma X CStatistical analysis of microphysical properties and the param-eterization of effective radius of warm clouds in Beijing areaAtmos Res 93 888ndash896 2009
Deng Z Z Zhao C S Ma N Liu P F Ran L Xu WY Chen J Liang Z Liang S Huang M Y Ma X CZhang Q Quan J N Yan P Henning S Mildenberger KSommerhage E Schafer M Stratmann F and WiedensohlerA Size-resolved and bulk activation properties of aerosols inthe North China plain the importance of aerosol size distribu-tion in the prediction of CCN number concentration Atmos
Atmos Chem Phys 11 3479ndash3494 2011 wwwatmos-chem-physnet1134792011
P F Liu et al Hygroscopic properties of aerosol particles at high relative humidity 3493
Chem Phys Discuss 11 1333ndash1366doi105194acpd-11-1333-2011 2011
Eichler H Cheng Y F Birmili W Nowak A WiedensohlerA Bruggemann E Gnauk T Herrmann H Althausen DAnsmann A Engelmann R Tesche M Wendisch M ZhangY H Hu M Liu S and Zeng L M Hygroscopic propertiesand extinction of aerosol particles at ambient relative humidity insouth-eastern China Atmos Environ 42 6321ndash6334 2008
Gobel T Hallbauer E Nowak A Henning S Mildenberger KNekat B Ran L Liu P F Deng Z Z Ma N Zhao C SCovert D S Wiedensohler A Hygroscopic properties of theatmospheric aerosol at high relative humidities from 90 to 99determined over the North China Plain during two seasons andits dependency on air mass Origin Atmos Chem Phys Discussin preparation 2011
Gysel M Crosier J Topping D O Whitehead J D Bower KN Cubison M J Williams P I Flynn M J McFiggans GB and Coe H Closure study between chemical compositionand hygroscopic growth of aerosol particles during TORCH2Atmos Chem Phys 7 6131ndash6144doi105194acp-7-6131-2007 2007
Gysel M McFiggans G B and Coe H Inversion of tandemdifferential mobility analyzer (TDMA) measurements J AerosolSci 40 134ndash151doi101016jjaerosci200807013 2009
Hennig T Massling A Brechtel F J and WiedensohlerA A tandem DMA for highly temperature-stabilized hy-groscopic particle growth measurements between 90 and98 relative humidity J Aerosol Sci 36 1210ndash1223doi101016jjaerosci200501005 2005
Hong S-Y Noh Y and Dudhia J A new vertical diffusion pack-age with an explicit treatment of entrainment processes MonWeather Rev 134 2318ndash2341doi101175MWR31991 2006
Jacobson M Z Strong radiative heating due to the mixing stateof black carbon in atmospheric aerosols Nature 409 695ndash6972001
Kohler H The nucleus in and the growth of hygro-scopic droplet Trans Faraday Soc 32 1152ndash1161doi101039TF9363201152 1936
Lance S Quantifying compositional impacts of ambient aerosolon cloud droplet formation PhD thesis School of Earth and At-mospheric Sciences Georgia Institute of Technology Atlanta166 pp 2007
Leitte A M Schlink U Herbarth O Wiedensohler A Pan X-C Hu M Richter M Wehner B Tuch T Wu Z YangM Liu L Breitner S Cyrys J Peters A Wichmann H Eand Franck U Size-segregated particle number concentrationsand respiratory emergency room visits in Beijing China Envi-ron Health Perspect 119 508ndash513doi101289ehp10022032011
Liu P F Zhao C S Zhang Q Deng Z Z Huang M Y Ma XC and Tie X X Aircraft study of aerosol vertical distributionsover Beijing and their optical properties Tellus B 61 756ndash767doi101111j1600-0889200900440x 2009
Low R D H A generalized equation for the solution effect indroplet growth J Atmos Sci 26 608ndash611 1969
Ma N Zhao C S Nowak A Muller T Pfeifer S Cheng YF Deng Z Z Liu P F Xu W Y Ran L Yan P Gobel THallbauer E Mildenberger K Henning S Yu J Cheng LL Zhou X J Stratmann F and Wiedensohler A Aerosol op-
tical properties in the North China Plain during HaChi campaignan in-situ optical closure study Atmos Chem Phys Discuss11 9567ndash9605doi105194acpd-11-9567-2011 2011
Massling A Stock M Wehner B Wu Z J Hu MBruggemann E Gnauk T Herrmann H and WiedensohlerA Size segregated water uptake of the urban submicrometeraerosol in Beijing Atmos Environ 43 1578ndash1589 2009
Menon S Hansen J Nazarenko L and Luo Y Climate effectsof black carbon aerosols in China and India Science 297 2250ndash2253doi101126science1075159 2002
Meier J Wehner B Massling A Birmili W Nowak A GnaukT Bruggemann E Herrmann H Min H and WiedensohlerA Hygroscopic growth of urban aerosol particles in Beijing(China) during wintertime A comparison of three experimentalmethods Atmos Chem Phys 9 6865ndash6880doi105194acp-9-6865-2009 2009
Mildenberger K Henning S Nowak A Sommerhage ESchafer M Hallbauer E Gobel T Nekat B van PinxterenD Deng Z Z Liu P F Ma N Zhao C S Herrmann HWiedensohler A and Stratmann F A hygroscopicity closurestudy for atmospheric aerosol particles in the North China PlainAtmos Chem Phys Discuss in preparation 2011
Moffet R C and Prather K A In-situ measurements of the mix-ing state and optical properties of soot with implications for ra-diative forcing estimates P Natl Acad Sci USA 106 11872ndash11877doi101073pnas0900040106 2009
Oshima N Koike M Zhang Y Kondo Y Moteki NTakegawa N and Miyazaki Y Aging of black carbon in out-flow from anthropogenic sources using a mixing state resolvedmodel Model development and evaluation J Geophys Res114 D06210doi1010292008jd010680 2009
Petters M D and Kreidenweis S M A single parameter repre-sentation of hygroscopic growth and cloud condensation nucleusactivity Atmos Chem Phys 7 1961ndash1971doi105194acp-7-1961-2007 2007
Petters M D Prenni A J Kreidenweis S M DeMottP J Matsunaga A Lim Y B and Ziemann P JChemical aging and the hydrophobic-to-hydrophilic conversionof carbonaceous aerosol Geophys Res Lett 33 L24806doi1010292006GL027249 2006
Petters M D Wex H Carrico C M Hallbauer E MasslingA McMeeking G R Poulain L Wu Z Kreidenweis SM and Stratmann F Towards closing the gap between hygro-scopic growth and activation for secondary organic aerosol Part2 theoretical approaches Atmos Chem Phys 9 3999ndash4009doi105194acp-9-3999-2009 2009
Pratt K A and Prather K A Aircraft measurements of verticalprofiles of aerosol mixing states J Geophys Res 115 D11305doi1010292009jd013150 2010
Rader D J and McMurry P H Application of the tandem differ-ential mobility analyser to studies of droplet growth or evapora-tion J Aerosol Sci 17 771ndash787 1986
Riemer N West M Zaveri R A and Easter R C Sim-ulating the evolution of soot mixing state with a particle-resolved aerosol model J Geophys Res 114 D09202doi1010292008jd011073 2009
Riemer N West M Zaveri R and Easter R Estimating blackcarbon aging time-scales with a particle-resolved aerosol modelJ Aerosol Sci 41 143ndash158 2010
wwwatmos-chem-physnet1134792011 Atmos Chem Phys 11 3479ndash3494 2011
3494 P F Liu et al Hygroscopic properties of aerosol particles at high relative humidity
Rissler J Vestin A Swietlicki E Fisch G Zhou J ArtaxoP and Andreae M O Size distribution and hygroscopic prop-erties of aerosol particles from dry-season biomass burning inAmazonia Atmos Chem Phys 6 471ndash491doi105194acp-6-471-2006 2006
Rissler J Svenningsson B Fors E O Bilde M and Swi-etlicki E An evaluation and comparison of cloud condensationnucleus activity models Predicting particle critical saturationfrom growth at subsaturation J Geophys Res 115 D22208doi1010292010jd014391 2010
Rose D Gunthe S S Su H Garland R M Yang HBerghof M Cheng Y F Wehner B Achtert P Nowak AWiedensohler A Takegawa N Kondo Y Hu M ZhangY Andreae M O and Poschl U Cloud condensation nu-clei in polluted air and biomass burning smoke near the mega-city Guangzhou China ndash Part 2 Size-resolved aerosol chem-ical composition diurnal cycles and externally mixed weaklyCCN-active soot particles Atmos Chem Phys 11 2817ndash2836doi105194acp-11-2817-2011 2011
Sjogren S Gysel M Weingartner E Alfarra M R DuplissyJ Cozic J Crosier J Coe H and Baltensperger U Hy-groscopicity of the submicrometer aerosol at the high-alpine siteJungfraujoch 3580 m asL Switzerland Atmos Chem Phys8 5715ndash5729doi105194acp-8-5715-2008 2008
Skamarock W C Klemp J B Dudhia J Gill D O BarkerD M Wang W and Powers J G A Description of theAdvanced Research WRF Version 2 Tech Rep NCARTN-468+STR NCAR 2005
Su H Rose D Cheng Y F Gunthe S S Massling A StockM Wiedensohler A Andreae M O and Poschl U Hy-groscopicity distribution concept for measurement data analysisand modeling of aerosol particle mixing state with regard to hy-groscopic growth and CCN activation Atmos Chem Phys 107489ndash7503doi105194acp-10-7489-2010 2010
Svenningsson B Hansson H-C Wiedensohler A Noone KOgren J Hallberg A and Colvile R Hygroscopic growthof aerosol particles and its influence on nucleation scavengingin cloud Experimental results from Kleiner Feldberg J AtmosChem 19 129ndash152 1994
Swietlicki E Zhou J Berg O H Martinsson B G FrankG Cederfelt S-I Dusek U Berner A Birmili W Wieden-sohler A Yuskiewicz B and Bower K N A closure study ofsub-micrometer aerosol particle hygroscopic behaviour AtmosRes 50 205ndash240 1999
Swietlicki E Hansson H-C Hameri K Svenningsson BMassling A McFiggans G McMurry P H Petaja TTunved P Gysel M Topping D Weingartner E Bal-tensperger U Rissler J Wiedensohler A and Kulmala MHygroscopic properties of submicrometer atmospheric aerosolparticles measured with H-TDMA instruments in various envi-ronments a review Tellus B 60 432ndash469 2008
Topping D O McFiggans G B and Coe H A curvedmulti-component aerosol hygroscopicity model framework Part1-Inorganic compounds Atmos Chem Phys 5 1205-1222doi105194acp-5-1205-2005 2005a
Topping D O McFiggans G B and Coe H A curved multi-component aerosol hygroscopicity model framework Part 2-Including organic compounds Atmos Chem Phys 5 1223-1242doi105194acp-5-1223-2005 2005b
Tuch T M Haudek A Muller T Nowak A Wex Hand Wiedensohler A Design and performance of an auto-matic regenerating adsorption aerosol dryer for continuous op-eration at monitoring sites Atmos Meas Tech 2 417ndash422doi105194amt-2-417-2009 2009
Twomey S Pollution and the planetary albedo Atmos Environ8 1251-1256 1974
Wehner B Wiedensohler A Tuch T M Wu Z J Hu MSlanina J and Kiang C S Variability of the aerosol numbersize distribution in Beijing China New particle formation duststorms and high continental background Geophys Res Lett31 L22108doi1010292004gl021596 2004
Wehner B Birmili W Ditas F Wu Z Hu M Liu X MaoJ Sugimoto N and Wiedensohler A Relationships betweensubmicrometer particulate air pollution and air mass history inBeijing China 2004-2006 Atmos Chem Phys 8 6155ndash6168doi105194acp-8-6155-2008 2008
Wex H Hennig T Salma I Ocskay R Kiselev A Henning SMassling A Wiedensohler A and Stratmann F Hygroscopicgrowth and measured and modeled critical super-saturations ofan atmospheric HULIS sample Geophys Res Lett 34 L02818doi1010292006gl028260 2007
Wex H Petters M D Carrico C M Hallbauer E MasslingA McMeeking G R Poulain L Wu Z Kreidenweis S Mand Stratmann F Towards closing the gap between hygroscopicgrowth and activation for secondary organic aerosol Part 1 evi-dence from measurements Atmos Chem Phys 9 3987ndash3997doi105194acp-9-3987-2009 2009
Young K C and Warren A J A reexamination of the derivationof the equilibrium supersaturation curve for soluble particles JAtmos Sci 49 1138ndash1143 1992
Zaveri R A Easter R C Fast J D and Peters L K Modelfor simulating aerosol interactions and chemistry (MOSAIC) JGeophys Res 113 D13204doi1010292007jd008782 2008
Zhang R Khalizov A F Pagels J Zhang D Xue H and Mc-Murry P H Variability in morphology hygroscopicity and op-tical properties of soot aerosols during atmospheric processingP Natl Acad Sci USA 105 10291ndash10296 2008
Zhang Q H Zhang J P and Xue H W The challenge ofimproving visibility in Beijing Atmos Chem Phys 10 7821ndash7827doi105194acp-10-7821-2010 2010
Zhao C Tie X Brasseur G Noone K J Nakajima T ZhangQ Zhang R Huang M Duan Y Li G and Ishizaka YAircraft measurements of cloud droplet spectral dispersion andimplications for indirect aerosol radiative forcing Geophys ResLett 33 L16809doi1010292006gl026653 2006a
Zhao C Tie X and Lin Y A possible positive feed-back of reduction of precipitation and increase in aerosolsover Eastern Central China Geophys Res Lett 33 L11814doi1010292006gl025959 2006b
Atmos Chem Phys 11 3479ndash3494 2011 wwwatmos-chem-physnet1134792011
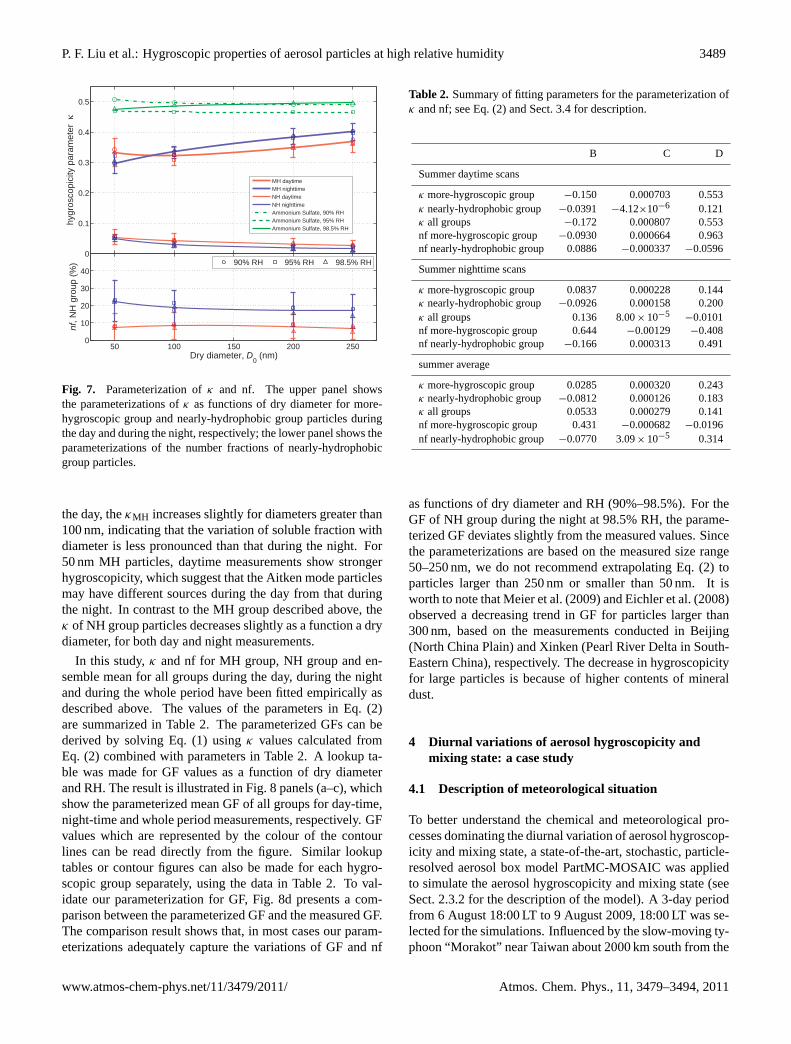
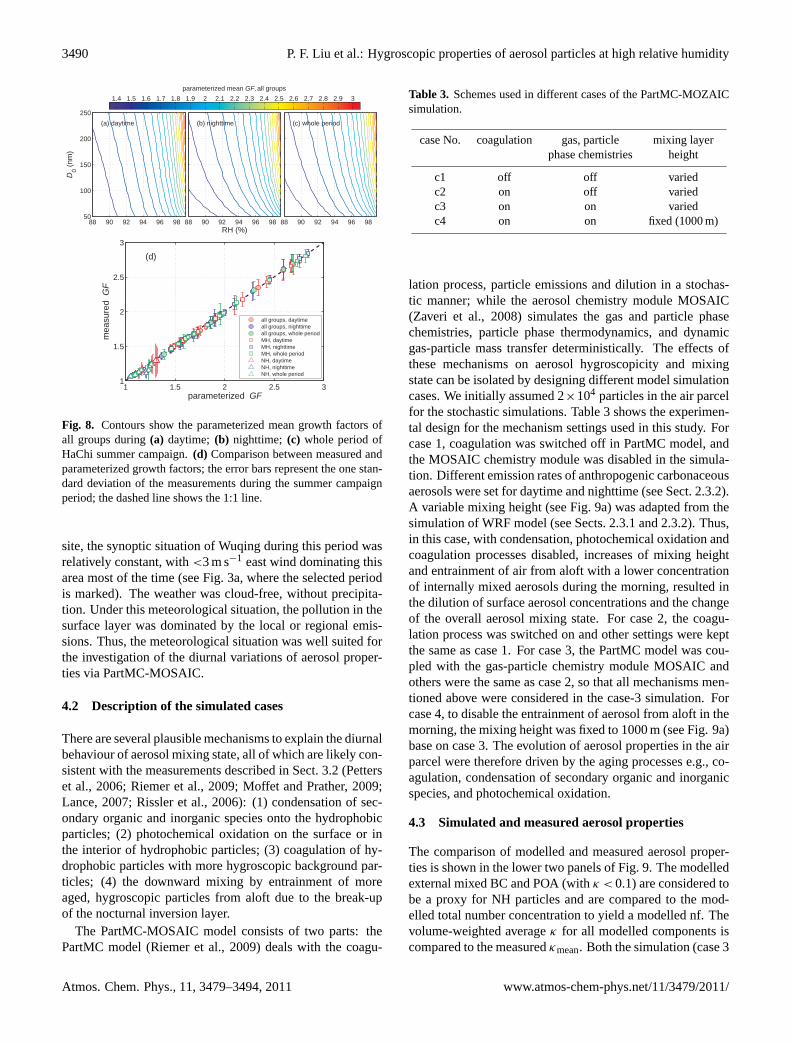
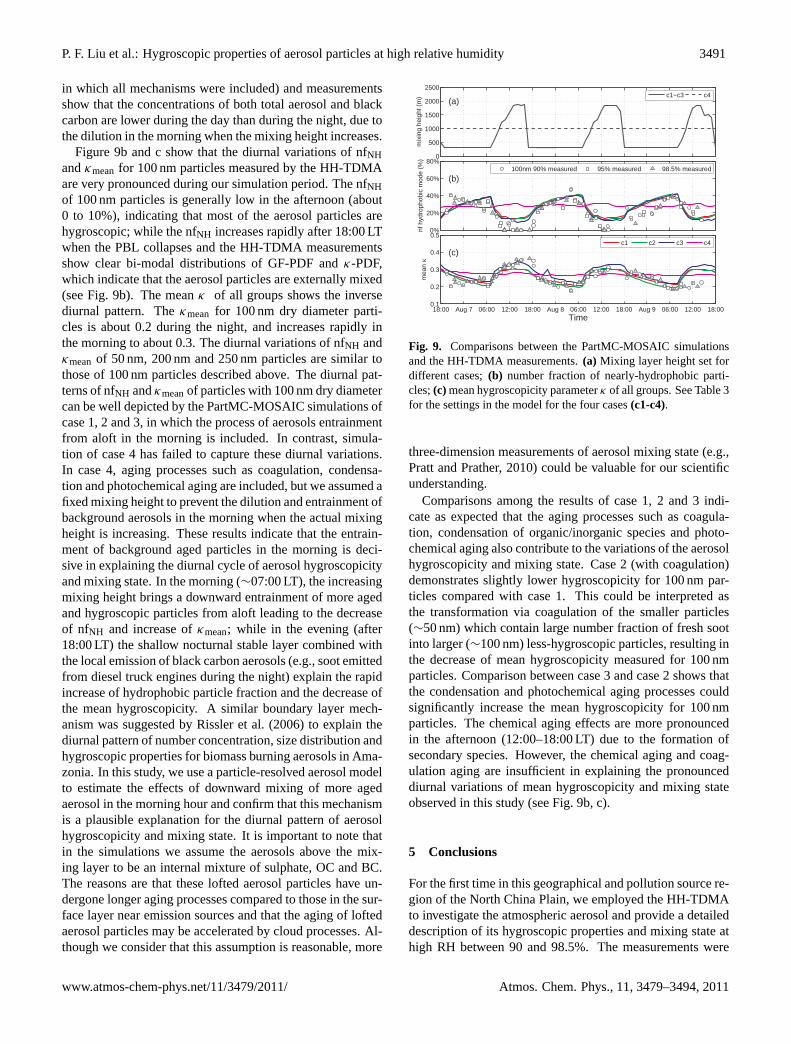


![Effect of changes in relative humidity on aerosol ... · [Podgorny, 2003; Wen et al. , 2007; Marshak et al., 2008], (3) hygroscopic growth of particles that results from the elevated](https://img.pdfslide.us/doc/110x75/5f0c678c7e708231d4353be4/effect-of-changes-in-relative-humidity-on-aerosol-podgorny-2003-wen-et-al.jpg)