Embed Size (px)
Citation preview

Published: November 11, 2011
r 2011 American Chemical Society 642 dx.doi.org/10.1021/ef201415s | Energy Fuels 2012, 26, 642–657
ARTICLE
pubs.acs.org/EF
Hydrothermal Treatment (HTT) of Microalgae: Evaluation of theProcess As Conversion Method in an Algae Biorefinery ConceptLaura Garcia Alba,*,† Cristian Torri,‡ Chiara Samorì,‡ Jaapjan van der Spek,† Daniele Fabbri,‡
Sascha R. A. Kersten,† and Derk W. F. (Wim) Brilman*,†
†Thermo-Chemical Conversion of Biomass Group, Faculty of Science and Technology, University of Twente, P.O. Box 217,7500AE Enschede, The Netherlands‡Centro Interdipartimentale di Ricerca per le Scienze Ambientali, Universit�a di Bologna,Via Sant’Alberto 163, 48123 Ravenna, Italy
ABSTRACT: The hydrothermal treatment (HTT) technology is evaluated for its potential as a process to convert algae and algaldebris into a liquid fuel, within a sustainable algae biorefinery concept in which, next to fuels (gaseous and liquid), high valueproducts are coproduced, nutrients and water are recycled, and the use of fossil energy is minimized. In this work, the freshwatermicroalgaeDesmodesmus sp.was used as feedstock. HTTwas investigated over a very wide range of temperatures (175�450 �C) andreaction times (up to 60 min), using a batch reactor system. The different product phases were quantified and analyzed. Themaximum oil yield (49 wt %) was obtained at 375 �C and 5 min reaction time, recovering 75% of the algal calorific value into the oiland an energy densification from 22 to 36 MJ/kg. At increasing temperature, both the oil yield and the nitrogen content in the oilincreased, necessitating further investigation on the molecular composition of the oil. This was performed in the adjacentcollaborative paper with special attention to the nitrogen-containing compounds and to gain insight in the liquefaction mechanism.A pioneering visual inspection of the cells after HTT showed that a large step increase in the HTT oil yield, when going from 225 to250 �C at 5 min reaction time, coincided with a major cell wall rupture under these conditions. Additionally, it was found that the oilcomposition, by extractive recovery after HTT below 250 �C, did change with temperature, even though the algal cells were visuallystill unbroken. Finally, the possibilities of recycling growth nutrients became evident by analyzing the aqueous fractions obtainedafter HTT. From the results obtained, we concluded that HTT is most suited as post-treatment technology in an algae biorefinerysystem, after the wet extraction of high value products, such as protein-rich food/feed ingredients and lipids.
1. INTRODUCTION
The link between the development of new growing economiesand the depletion of fossil fuels has forced society to develop newand sustainable ways for meeting their energy demands. Biomassis the only current renewable carbon source that can be directlyused for chemicals and liquid fuels.1 Therefore, biomass is con-sidered as an optional long-term sustainable and CO2-neutralenergy source. Currently, microalgae have been identified as apotential bioenergy source exhibiting alleged advantages for fuelproduction:• higher growth rates than terrestrial biomass sources;• the ability to fix CO2 to organic substances using solarenergy while growing in a wide variety of climates and lands;
• no direct competition for agricultural land;• capable of storing solar energy into energy-rich compoundssuch as lipids.
Various conversion and extraction routes have been fol-lowed for the production of liquid fuels from microalgae. Lipidextraction—combined with transesterification—to produce bio-diesel is one of the most common methods.2�4 To our knowl-edge, algal lipid extraction for fuel production has not yet beenproven at large scale. This extraction approach would be mostuseful if the process could be optimized to use wet algal biomassand low-toxicity solvents.
Other thermo-chemical processes such as combustion, pyroly-sis, and dry conventional gasification have been also reported.5�7
In these processes, the use of dry biomass is required, which leads
to a significant increase in energy costs as a result of the needfor a drying step before the conversion step.8 Therefore, a wetbiomass-handling process, such as hydrothermal liquefaction(HTL) is attractive for the production of liquid fuels from wetmicroalgae, as it circumvents the need for complete water removaland associated high energy cost for thermal drying. Algae con-centrations of about 5�20% seem to be suitable for hydrothermaltreatment, which can be achieved using less than 5% of the energycosts required for complete drying (by means of thermal drying).9
In this research, we look at the feasibility of an algae biorefineryconcept (ABC) comprising four main stages: microalgae growthand harvesting, fuel production, residue processing, and nutrientsrecovery and recycling. We consider the HTL process as a pro-mising candidate to be included in our algae biorefinery concept.
Hydrothermal liquefaction has been widely described as aprocess involving the reaction of biomass in water at subcriticaltemperatures (below 374 �C) and high pressure (above watervapor pressure) for a certain reaction time with or without theuse of a catalyst.10 Because of the fact that, in this research, experi-ments at above 374 �C have been also performed, the term“hydrothermal treatment (HTT)” will be used rather than“hydrothermal liquefaction” as this generally refers to thermalprocessing at subcritical temperatures.
Received: September 17, 2011Revised: November 8, 2011
643 dx.doi.org/10.1021/ef201415s |Energy Fuels 2012, 26, 642–657
Energy & Fuels ARTICLE
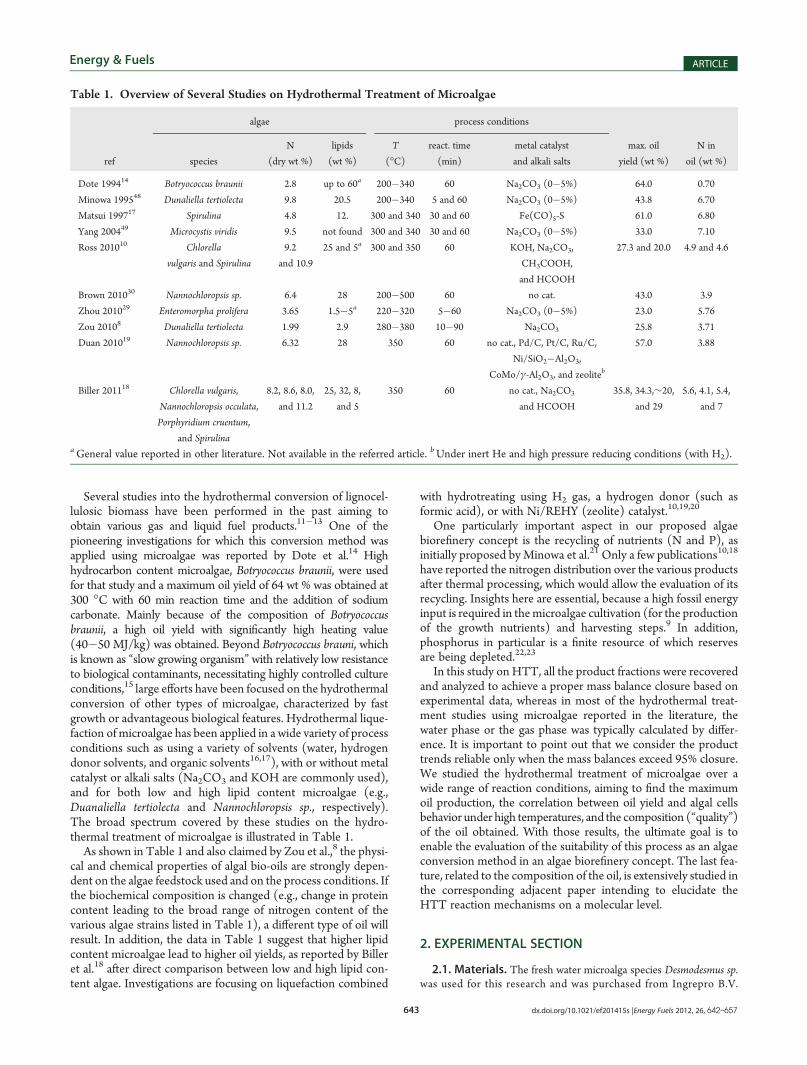
Several studies into the hydrothermal conversion of lignocel-lulosic biomass have been performed in the past aiming toobtain various gas and liquid fuel products.11�13 One of thepioneering investigations for which this conversion method wasapplied using microalgae was reported by Dote et al.14 Highhydrocarbon content microalgae, Botryococcus braunii, were usedfor that study and a maximum oil yield of 64 wt % was obtained at300 �C with 60 min reaction time and the addition of sodiumcarbonate. Mainly because of the composition of Botryococcusbraunii, a high oil yield with significantly high heating value(40�50 MJ/kg) was obtained. Beyond Botryococcus brauni, whichis known as “slow growing organism” with relatively low resistanceto biological contaminants, necessitating highly controlled cultureconditions,15 large efforts have been focused on the hydrothermalconversion of other types of microalgae, characterized by fastgrowth or advantageous biological features. Hydrothermal lique-faction of microalgae has been applied in a wide variety of processconditions such as using a variety of solvents (water, hydrogendonor solvents, and organic solvents16,17), with or without metalcatalyst or alkali salts (Na2CO3 and KOH are commonly used),and for both low and high lipid content microalgae (e.g.,Duanaliella tertiolecta and Nannochloropsis sp., respectively).The broad spectrum covered by these studies on the hydro-thermal treatment of microalgae is illustrated in Table 1.
As shown in Table 1 and also claimed by Zou et al.,8 the physi-cal and chemical properties of algal bio-oils are strongly depen-dent on the algae feedstock used and on the process conditions. Ifthe biochemical composition is changed (e.g., change in proteincontent leading to the broad range of nitrogen content of thevarious algae strains listed in Table 1), a different type of oil willresult. In addition, the data in Table 1 suggest that higher lipidcontent microalgae lead to higher oil yields, as reported by Billeret al.18 after direct comparison between low and high lipid con-tent algae. Investigations are focusing on liquefaction combined
with hydrotreating using H2 gas, a hydrogen donor (such asformic acid), or with Ni/REHY (zeolite) catalyst.10,19,20
One particularly important aspect in our proposed algaebiorefinery concept is the recycling of nutrients (N and P), asinitially proposed byMinowa et al.21 Only a few publications10,18
have reported the nitrogen distribution over the various productsafter thermal processing, which would allow the evaluation of itsrecycling. Insights here are essential, because a high fossil energyinput is required in themicroalgae cultivation (for the productionof the growth nutrients) and harvesting steps.9 In addition,phosphorus in particular is a finite resource of which reservesare being depleted.22,23
In this study on HTT, all the product fractions were recoveredand analyzed to achieve a proper mass balance closure based onexperimental data, whereas in most of the hydrothermal treat-ment studies using microalgae reported in the literature, thewater phase or the gas phase was typically calculated by differ-ence. It is important to point out that we consider the producttrends reliable only when the mass balances exceed 95% closure.We studied the hydrothermal treatment of microalgae over awide range of reaction conditions, aiming to find the maximumoil production, the correlation between oil yield and algal cellsbehavior under high temperatures, and the composition (“quality”)of the oil obtained. With those results, the ultimate goal is toenable the evaluation of the suitability of this process as an algaeconversion method in an algae biorefinery concept. The last fea-ture, related to the composition of the oil, is extensively studied inthe corresponding adjacent paper intending to elucidate theHTT reaction mechanisms on a molecular level.
2. EXPERIMENTAL SECTION
2.1. Materials. The fresh water microalga species Desmodesmus sp.was used for this research and was purchased from Ingrepro B.V.
Table 1. Overview of Several Studies on Hydrothermal Treatment of Microalgae
algae process conditions
ref species
N
(dry wt %)
lipids
(wt %)
T
(�C)react. time
(min)
metal catalyst
and alkali salts
max. oil
yield (wt %)
N in
oil (wt %)
Dote 199414 Botryococcus braunii 2.8 up to 60a 200�340 60 Na2CO3 (0�5%) 64.0 0.70
Minowa 199548 Dunaliella tertiolecta 9.8 20.5 200�340 5 and 60 Na2CO3 (0�5%) 43.8 6.70
Matsui 199717 Spirulina 4.8 12. 300 and 340 30 and 60 Fe(CO)5-S 61.0 6.80
Yang 200449 Microcystis viridis 9.5 not found 300 and 340 30 and 60 Na2CO3 (0�5%) 33.0 7.10
Ross 201010 Chlorella
vulgaris and Spirulina
9.2
and 10.9
25 and 5a 300 and 350 60 KOH, Na2CO3,
CH3COOH,
and HCOOH
27.3 and 20.0 4.9 and 4.6
Brown 201030 Nannochloropsis sp. 6.4 28 200�500 60 no cat. 43.0 3.9
Zhou 201029 Enteromorpha prolifera 3.65 1.5�5a 220�320 5�60 Na2CO3 (0�5%) 23.0 5.76
Zou 20108 Dunaliella tertiolecta 1.99 2.9 280�380 10�90 Na2CO3 25.8 3.71
Duan 201019 Nannochloropsis sp. 6.32 28 350 60 no cat., Pd/C, Pt/C, Ru/C,
Ni/SiO2�Al2O3,
CoMo/γ-Al2O3, and zeoliteb
57.0 3.88
Biller 201118 Chlorella vulgaris,
Nannochloropsis occulata,
Porphyridium cruentum,
and Spirulina
8.2, 8.6, 8.0,
and 11.2
25, 32, 8,
and 5
350 60 no cat., Na2CO3
and HCOOH
35.8, 34.3,∼20,
and 29
5.6, 4.1, 5.4,
and 7
aGeneral value reported in other literature. Not available in the referred article. bUnder inert He and high pressure reducing conditions (with H2).
644 dx.doi.org/10.1021/ef201415s |Energy Fuels 2012, 26, 642–657
Energy & Fuels ARTICLE
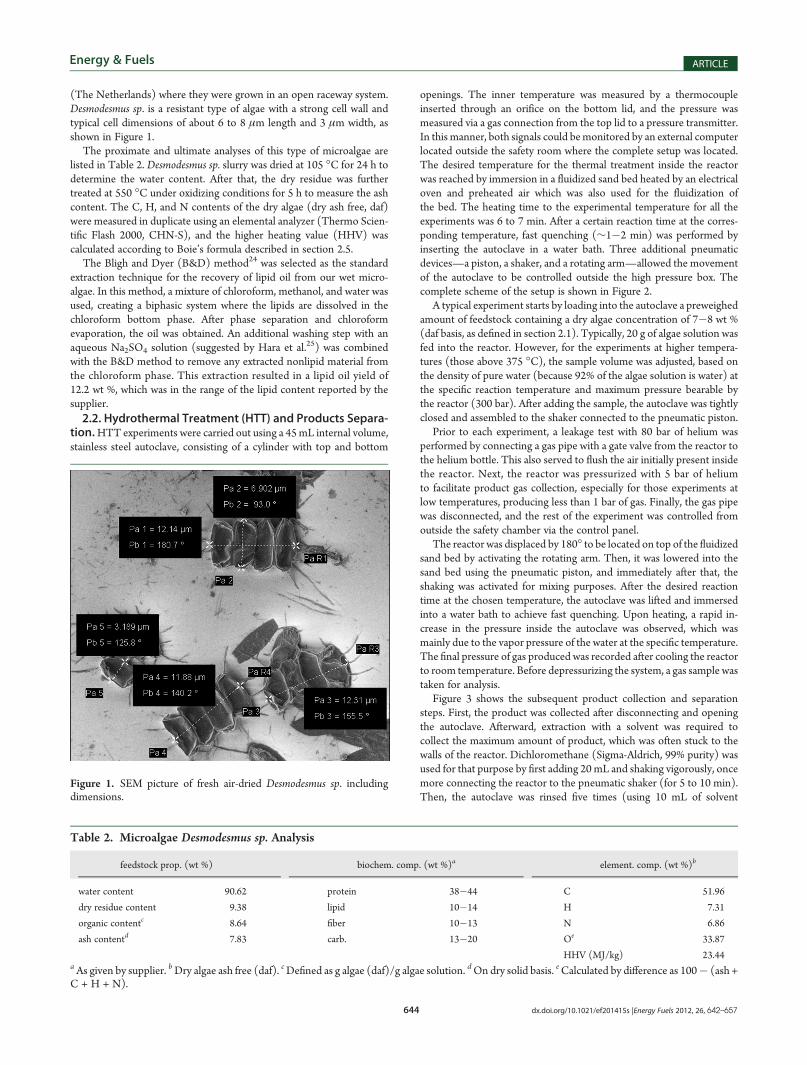
(The Netherlands) where they were grown in an open raceway system.Desmodesmus sp. is a resistant type of algae with a strong cell wall andtypical cell dimensions of about 6 to 8 μm length and 3 μm width, asshown in Figure 1.
The proximate and ultimate analyses of this type of microalgae arelisted in Table 2. Desmodesmus sp. slurry was dried at 105 �C for 24 h todetermine the water content. After that, the dry residue was furthertreated at 550 �C under oxidizing conditions for 5 h to measure the ashcontent. The C, H, and N contents of the dry algae (dry ash free, daf)were measured in duplicate using an elemental analyzer (Thermo Scien-tific Flash 2000, CHN-S), and the higher heating value (HHV) wascalculated according to Boie’s formula described in section 2.5.
The Bligh and Dyer (B&D) method24 was selected as the standardextraction technique for the recovery of lipid oil from our wet micro-algae. In this method, a mixture of chloroform, methanol, and water wasused, creating a biphasic system where the lipids are dissolved in thechloroform bottom phase. After phase separation and chloroformevaporation, the oil was obtained. An additional washing step with anaqueous Na2SO4 solution (suggested by Hara et al.25) was combinedwith the B&D method to remove any extracted nonlipid material fromthe chloroform phase. This extraction resulted in a lipid oil yield of12.2 wt %, which was in the range of the lipid content reported by thesupplier.2.2. Hydrothermal Treatment (HTT) and Products Separa-
tion.HTT experiments were carried out using a 45mL internal volume,stainless steel autoclave, consisting of a cylinder with top and bottom
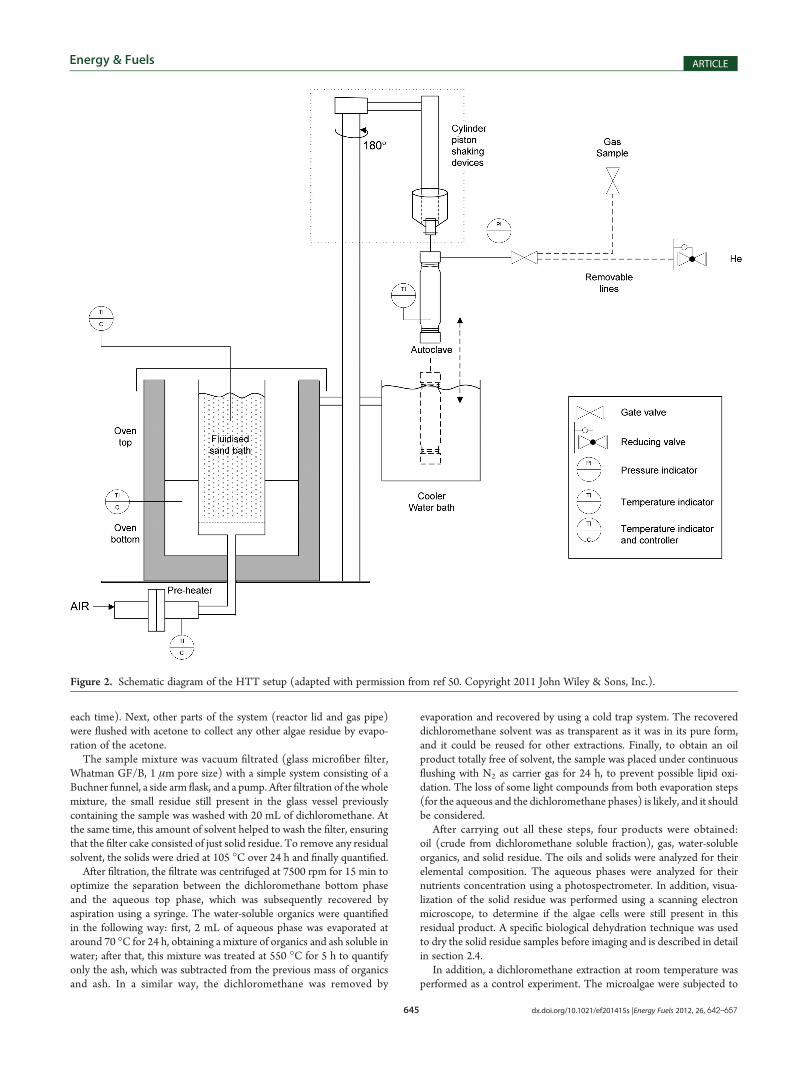
openings. The inner temperature was measured by a thermocoupleinserted through an orifice on the bottom lid, and the pressure wasmeasured via a gas connection from the top lid to a pressure transmitter.In this manner, both signals could bemonitored by an external computerlocated outside the safety room where the complete setup was located.The desired temperature for the thermal treatment inside the reactorwas reached by immersion in a fluidized sand bed heated by an electricaloven and preheated air which was also used for the fluidization ofthe bed. The heating time to the experimental temperature for all theexperiments was 6 to 7 min. After a certain reaction time at the corres-ponding temperature, fast quenching (∼1�2 min) was performed byinserting the autoclave in a water bath. Three additional pneumaticdevices—a piston, a shaker, and a rotating arm—allowed the movementof the autoclave to be controlled outside the high pressure box. Thecomplete scheme of the setup is shown in Figure 2.
A typical experiment starts by loading into the autoclave a preweighedamount of feedstock containing a dry algae concentration of 7�8 wt %(daf basis, as defined in section 2.1). Typically, 20 g of algae solution wasfed into the reactor. However, for the experiments at higher tempera-tures (those above 375 �C), the sample volume was adjusted, based onthe density of pure water (because 92% of the algae solution is water) atthe specific reaction temperature and maximum pressure bearable bythe reactor (300 bar). After adding the sample, the autoclave was tightlyclosed and assembled to the shaker connected to the pneumatic piston.
Prior to each experiment, a leakage test with 80 bar of helium wasperformed by connecting a gas pipe with a gate valve from the reactor tothe helium bottle. This also served to flush the air initially present insidethe reactor. Next, the reactor was pressurized with 5 bar of heliumto facilitate product gas collection, especially for those experiments atlow temperatures, producing less than 1 bar of gas. Finally, the gas pipewas disconnected, and the rest of the experiment was controlled fromoutside the safety chamber via the control panel.
The reactor was displaced by 180� to be located on top of the fluidizedsand bed by activating the rotating arm. Then, it was lowered into thesand bed using the pneumatic piston, and immediately after that, theshaking was activated for mixing purposes. After the desired reactiontime at the chosen temperature, the autoclave was lifted and immersedinto a water bath to achieve fast quenching. Upon heating, a rapid in-crease in the pressure inside the autoclave was observed, which wasmainly due to the vapor pressure of the water at the specific temperature.The final pressure of gas produced was recorded after cooling the reactorto room temperature. Before depressurizing the system, a gas sample wastaken for analysis.
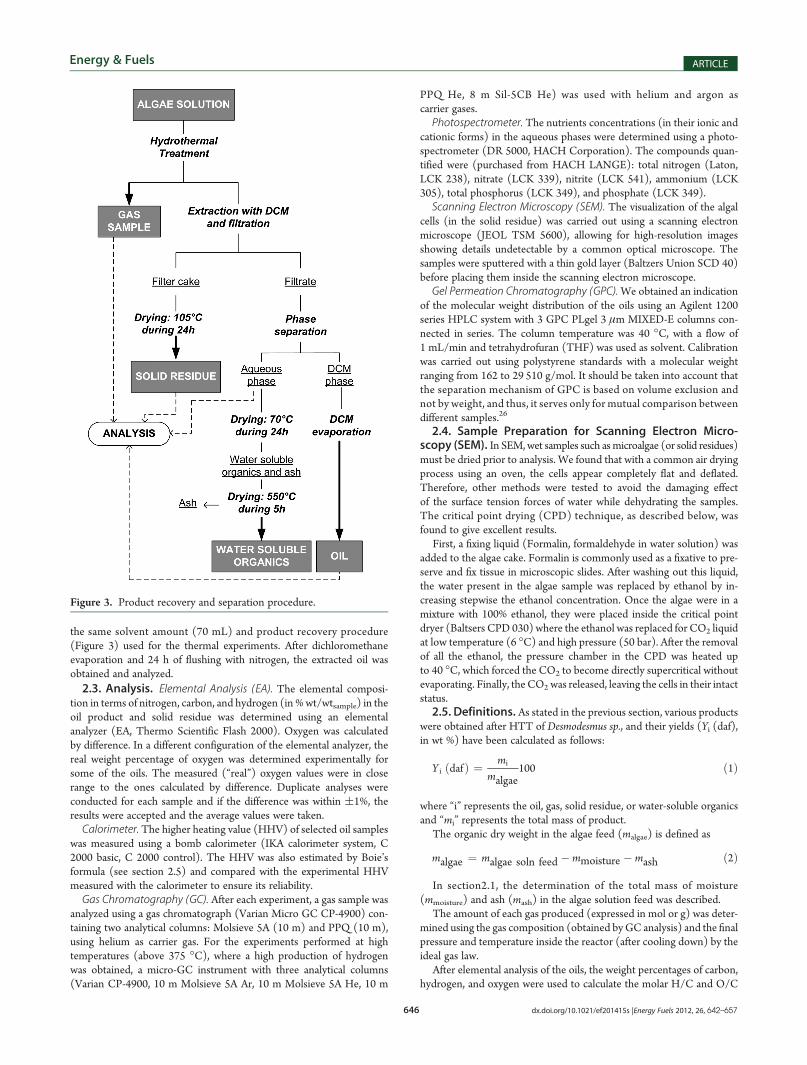
Figure 3 shows the subsequent product collection and separationsteps. First, the product was collected after disconnecting and openingthe autoclave. Afterward, extraction with a solvent was required tocollect the maximum amount of product, which was often stuck to thewalls of the reactor. Dichloromethane (Sigma-Aldrich, 99% purity) wasused for that purpose by first adding 20 mL and shaking vigorously, oncemore connecting the reactor to the pneumatic shaker (for 5 to 10 min).Then, the autoclave was rinsed five times (using 10 mL of solvent
Figure 1. SEM picture of fresh air-dried Desmodesmus sp. includingdimensions.
Table 2. Microalgae Desmodesmus sp. Analysis
feedstock prop. (wt %) biochem. comp. (wt %)a element. comp. (wt %)b
water content 90.62 protein 38�44 C 51.96
dry residue content 9.38 lipid 10�14 H 7.31
organic contentc 8.64 fiber 10�13 N 6.86
ash contentd 7.83 carb. 13�20 Oe 33.87
HHV (MJ/kg) 23.44aAs given by supplier. bDry algae ash free (daf). cDefined as g algae (daf)/g algae solution. dOn dry solid basis. eCalculated by difference as 100� (ash +C + H + N).
645 dx.doi.org/10.1021/ef201415s |Energy Fuels 2012, 26, 642–657
Energy & Fuels ARTICLE
each time). Next, other parts of the system (reactor lid and gas pipe)were flushed with acetone to collect any other algae residue by evapo-ration of the acetone.
The sample mixture was vacuum filtrated (glass microfiber filter,Whatman GF/B, 1 μm pore size) with a simple system consisting of aBuchner funnel, a side arm flask, and a pump. After filtration of the wholemixture, the small residue still present in the glass vessel previouslycontaining the sample was washed with 20 mL of dichloromethane. Atthe same time, this amount of solvent helped to wash the filter, ensuringthat the filter cake consisted of just solid residue. To remove any residualsolvent, the solids were dried at 105 �C over 24 h and finally quantified.
After filtration, the filtrate was centrifuged at 7500 rpm for 15 min tooptimize the separation between the dichloromethane bottom phaseand the aqueous top phase, which was subsequently recovered byaspiration using a syringe. The water-soluble organics were quantifiedin the following way: first, 2 mL of aqueous phase was evaporated ataround 70 �C for 24 h, obtaining a mixture of organics and ash soluble inwater; after that, this mixture was treated at 550 �C for 5 h to quantifyonly the ash, which was subtracted from the previous mass of organicsand ash. In a similar way, the dichloromethane was removed by
evaporation and recovered by using a cold trap system. The recovereddichloromethane solvent was as transparent as it was in its pure form,and it could be reused for other extractions. Finally, to obtain an oilproduct totally free of solvent, the sample was placed under continuousflushing with N2 as carrier gas for 24 h, to prevent possible lipid oxi-dation. The loss of some light compounds from both evaporation steps(for the aqueous and the dichloromethane phases) is likely, and it shouldbe considered.
After carrying out all these steps, four products were obtained:oil (crude from dichloromethane soluble fraction), gas, water-solubleorganics, and solid residue. The oils and solids were analyzed for theirelemental composition. The aqueous phases were analyzed for theirnutrients concentration using a photospectrometer. In addition, visua-lization of the solid residue was performed using a scanning electronmicroscope, to determine if the algae cells were still present in thisresidual product. A specific biological dehydration technique was usedto dry the solid residue samples before imaging and is described in detailin section 2.4.
In addition, a dichloromethane extraction at room temperature wasperformed as a control experiment. The microalgae were subjected to
Figure 2. Schematic diagram of the HTT setup (adapted with permission from ref 50. Copyright 2011 John Wiley & Sons, Inc.).
646 dx.doi.org/10.1021/ef201415s |Energy Fuels 2012, 26, 642–657
Energy & Fuels ARTICLE
the same solvent amount (70 mL) and product recovery procedure(Figure 3) used for the thermal experiments. After dichloromethaneevaporation and 24 h of flushing with nitrogen, the extracted oil wasobtained and analyzed.2.3. Analysis. Elemental Analysis (EA). The elemental composi-
tion in terms of nitrogen, carbon, and hydrogen (in %wt/wtsample) in theoil product and solid residue was determined using an elementalanalyzer (EA, Thermo Scientific Flash 2000). Oxygen was calculatedby difference. In a different configuration of the elemental analyzer, thereal weight percentage of oxygen was determined experimentally forsome of the oils. The measured (“real”) oxygen values were in closerange to the ones calculated by difference. Duplicate analyses wereconducted for each sample and if the difference was within (1%, theresults were accepted and the average values were taken.Calorimeter. The higher heating value (HHV) of selected oil samples
was measured using a bomb calorimeter (IKA calorimeter system, C2000 basic, C 2000 control). The HHV was also estimated by Boie’sformula (see section 2.5) and compared with the experimental HHVmeasured with the calorimeter to ensure its reliability.Gas Chromatography (GC). After each experiment, a gas sample was
analyzed using a gas chromatograph (Varian Micro GC CP-4900) con-taining two analytical columns: Molsieve 5A (10 m) and PPQ (10 m),using helium as carrier gas. For the experiments performed at hightemperatures (above 375 �C), where a high production of hydrogenwas obtained, a micro-GC instrument with three analytical columns(Varian CP-4900, 10 m Molsieve 5A Ar, 10 m Molsieve 5A He, 10 m
PPQ He, 8 m Sil-5CB He) was used with helium and argon ascarrier gases.
Photospectrometer. The nutrients concentrations (in their ionic andcationic forms) in the aqueous phases were determined using a photo-spectrometer (DR 5000, HACH Corporation). The compounds quan-tified were (purchased from HACH LANGE): total nitrogen (Laton,LCK 238), nitrate (LCK 339), nitrite (LCK 541), ammonium (LCK305), total phosphorus (LCK 349), and phosphate (LCK 349).
Scanning Electron Microscopy (SEM). The visualization of the algalcells (in the solid residue) was carried out using a scanning electronmicroscope (JEOL TSM 5600), allowing for high-resolution imagesshowing details undetectable by a common optical microscope. Thesamples were sputtered with a thin gold layer (Baltzers Union SCD 40)before placing them inside the scanning electron microscope.
Gel Permeation Chromatography (GPC).We obtained an indicationof the molecular weight distribution of the oils using an Agilent 1200series HPLC system with 3 GPC PLgel 3 μm MIXED-E columns con-nected in series. The column temperature was 40 �C, with a flow of1 mL/min and tetrahydrofuran (THF) was used as solvent. Calibrationwas carried out using polystyrene standards with a molecular weightranging from 162 to 29 510 g/mol. It should be taken into account thatthe separation mechanism of GPC is based on volume exclusion andnot by weight, and thus, it serves only for mutual comparison betweendifferent samples.26
2.4. Sample Preparation for Scanning Electron Micro-scopy (SEM). In SEM,wet samples such asmicroalgae (or solid residues)must be dried prior to analysis. We found that with a common air dryingprocess using an oven, the cells appear completely flat and deflated.Therefore, other methods were tested to avoid the damaging effectof the surface tension forces of water while dehydrating the samples.The critical point drying (CPD) technique, as described below, wasfound to give excellent results.
First, a fixing liquid (Formalin, formaldehyde in water solution) wasadded to the algae cake. Formalin is commonly used as a fixative to pre-serve and fix tissue in microscopic slides. After washing out this liquid,the water present in the algae sample was replaced by ethanol by in-creasing stepwise the ethanol concentration. Once the algae were in amixture with 100% ethanol, they were placed inside the critical pointdryer (Baltsers CPD 030) where the ethanol was replaced for CO2 liquidat low temperature (6 �C) and high pressure (50 bar). After the removalof all the ethanol, the pressure chamber in the CPD was heated upto 40 �C, which forced the CO2 to become directly supercritical withoutevaporating. Finally, the CO2was released, leaving the cells in their intactstatus.2.5. Definitions. As stated in the previous section, various products
were obtained after HTT of Desmodesmus sp., and their yields (Yi (daf),in wt %) have been calculated as follows:
Y i ðdafÞ ¼ mi
malgae100 ð1Þ
where “i” represents the oil, gas, solid residue, or water-soluble organicsand “mi” represents the total mass of product.
The organic dry weight in the algae feed (malgae) is defined as
malgae ¼ malgae soln feed �mmoisture �mash ð2Þ
In section2.1, the determination of the total mass of moisture(mmoisture) and ash (mash) in the algae solution feed was described.
The amount of each gas produced (expressed in mol or g) was deter-mined using the gas composition (obtained byGC analysis) and the finalpressure and temperature inside the reactor (after cooling down) by theideal gas law.
After elemental analysis of the oils, the weight percentages of carbon,hydrogen, and oxygen were used to calculate the molar H/C and O/C
Figure 3. Product recovery and separation procedure.

647 dx.doi.org/10.1021/ef201415s |Energy Fuels 2012, 26, 642–657
Energy & Fuels ARTICLE
ratios and the higher heating value (HHV) using Boie’s formula (eq 5).
molar H=C ¼ H wt % 3MWC
C wt % 3MWHð3Þ
molar O=C ¼ O wt % 3MWC
C wt % 3MWOð4Þ
HHVBoie ¼ 0:3516 3C þ 1:16225 3H� 0:1109Oþ 0:0628 3N ð5Þ
Tocalculate the energy recovery (in%) of the algae conversionprocess, thetotal energy content of the algae feedstock should be compared to the energycontent of the oil product. Therefore, this value was calculated as follows:
energy recovery ð%Þ ¼ HHVoil 3moilHHValgae feedðdaf Þ 3malgae feedðdaf Þ
100
ð6Þ
It should be taken into account that the external work applied to thereaction system (such as energy for heating) is not included in thisenergy recovery value.
Finally, the nitrogen distribution between the product streams wasdetermined as the ratio of their nitrogenmass to the initial nitrogenmassof the algal feed:
YN, i ¼ mN, i
mN in algae feed100 ð7Þ
The remaining fraction allowed the estimation of the nitrogencontent in the gaseous stream and in losses. The nitrogen in the waterfraction of the feed (growthmedium) was not included in this definition,but it did not contribute to more than around 5% of the total nitrogen inthe whole algae slurry.
3. RESULTS
We investigated the influence of experimental temperature(175�450 �C) and reaction time (5�60 min) on the productsdistribution (yields), giving a closer look to the quality of the
Figure 4. Effect of reaction temperature on the product yield distribution after HTT of Desmodesmus sp. for (a) 5 min reaction time and (b) 60 minreaction time.
648 dx.doi.org/10.1021/ef201415s |Energy Fuels 2012, 26, 642–657
Energy & Fuels ARTICLE
oil—in terms of elemental and molecular composition—and thebehavior of the cells. A wide range of these two reaction param-eters was applied in order to understand the process and identifythe most suitable reaction conditions (toward maximum oil yieldand improved quality). Additional HTT experiments (200 and300 �C for 5 and 60 min) using a slurry with higher dry algaeconcentrations (up to 17.4 wt %) were performed. The increasein algal concentration did not show significant effects on the pro-duct distribution and their properties. This fact was also reportedin other studies (e.g., by Jena et al.27 with algae concentrationsranging between 10 and 50 wt %), and hence, this parameter wasnot further investigated.3.1. Effect of Temperature and Reaction Time. 3.1.1. Pro-
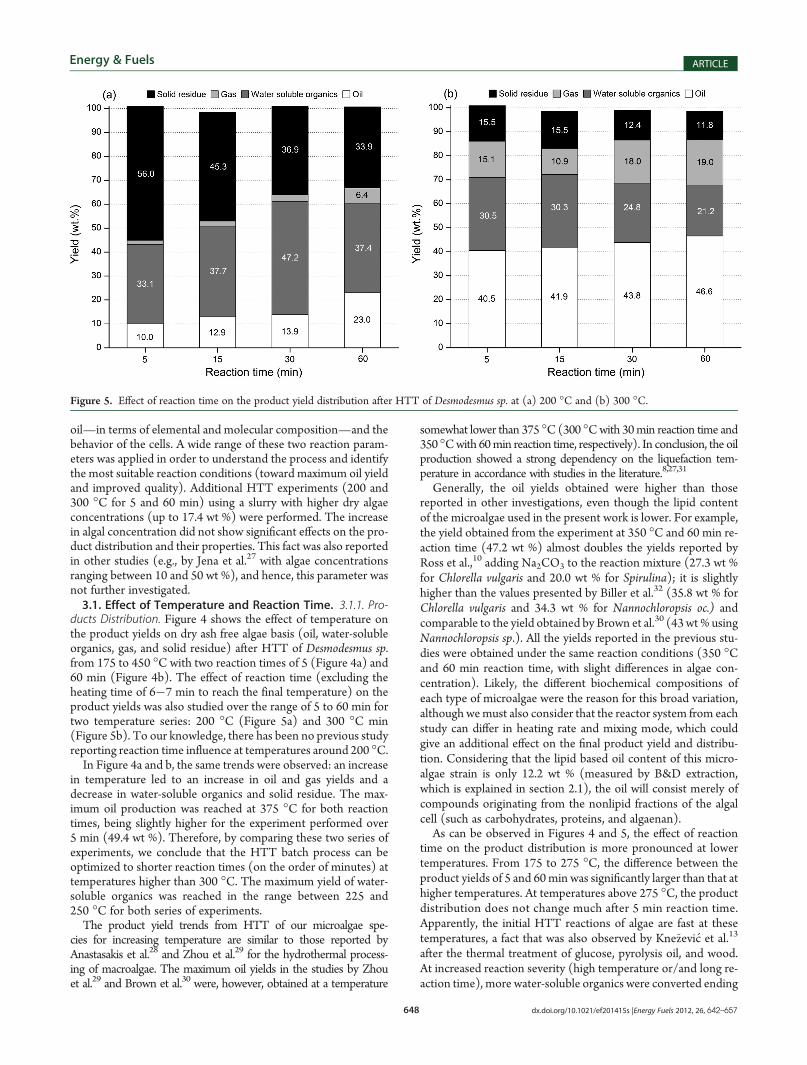
ducts Distribution. Figure 4 shows the effect of temperature onthe product yields on dry ash free algae basis (oil, water-solubleorganics, gas, and solid residue) after HTT of Desmodesmus sp.from 175 to 450 �C with two reaction times of 5 (Figure 4a) and60 min (Figure 4b). The effect of reaction time (excluding theheating time of 6�7 min to reach the final temperature) on theproduct yields was also studied over the range of 5 to 60 min fortwo temperature series: 200 �C (Figure 5a) and 300 �C min(Figure 5b). To our knowledge, there has been no previous studyreporting reaction time influence at temperatures around 200 �C.In Figure 4a and b, the same trends were observed: an increase
in temperature led to an increase in oil and gas yields and adecrease in water-soluble organics and solid residue. The max-imum oil production was reached at 375 �C for both reactiontimes, being slightly higher for the experiment performed over5 min (49.4 wt %). Therefore, by comparing these two series ofexperiments, we conclude that the HTT batch process can beoptimized to shorter reaction times (on the order of minutes) attemperatures higher than 300 �C. The maximum yield of water-soluble organics was reached in the range between 225 and250 �C for both series of experiments.The product yield trends from HTT of our microalgae spe-
cies for increasing temperature are similar to those reported byAnastasakis et al.28 and Zhou et al.29 for the hydrothermal process-ing of macroalgae. The maximum oil yields in the studies by Zhouet al.29 and Brown et al.30 were, however, obtained at a temperature
somewhat lower than 375 �C (300 �Cwith 30min reaction time and350 �Cwith 60min reaction time, respectively). In conclusion, the oilproduction showed a strong dependency on the liquefaction tem-perature in accordance with studies in the literature.8,27,31
Generally, the oil yields obtained were higher than thosereported in other investigations, even though the lipid contentof the microalgae used in the present work is lower. For example,the yield obtained from the experiment at 350 �C and 60 min re-action time (47.2 wt %) almost doubles the yields reported byRoss et al.,10 adding Na2CO3 to the reaction mixture (27.3 wt %for Chlorella vulgaris and 20.0 wt % for Spirulina); it is slightlyhigher than the values presented by Biller et al.32 (35.8 wt % forChlorella vulgaris and 34.3 wt % for Nannochloropsis oc.) andcomparable to the yield obtained by Brown et al.30 (43wt% usingNannochloropsis sp.). All the yields reported in the previous stu-dies were obtained under the same reaction conditions (350 �Cand 60 min reaction time, with slight differences in algae con-centration). Likely, the different biochemical compositions ofeach type of microalgae were the reason for this broad variation,although wemust also consider that the reactor system from eachstudy can differ in heating rate and mixing mode, which couldgive an additional effect on the final product yield and distribu-tion. Considering that the lipid based oil content of this micro-algae strain is only 12.2 wt % (measured by B&D extraction,which is explained in section 2.1), the oil will consist merely ofcompounds originating from the nonlipid fractions of the algalcell (such as carbohydrates, proteins, and algaenan).As can be observed in Figures 4 and 5, the effect of reaction
time on the product distribution is more pronounced at lowertemperatures. From 175 to 275 �C, the difference between theproduct yields of 5 and 60min was significantly larger than that athigher temperatures. At temperatures above 275 �C, the productdistribution does not change much after 5 min reaction time.Apparently, the initial HTT reactions of algae are fast at thesetemperatures, a fact that was also observed by Kne�zevi�c et al.13
after the thermal treatment of glucose, pyrolysis oil, and wood.At increased reaction severity (high temperature or/and long re-action time), more water-soluble organics were converted ending
Figure 5. Effect of reaction time on the product yield distribution after HTT of Desmodesmus sp. at (a) 200 �C and (b) 300 �C.
649 dx.doi.org/10.1021/ef201415s |Energy Fuels 2012, 26, 642–657
Energy & Fuels ARTICLE
into the oil or gas. Above 375 �C, the oil yield even starteddecreasing, mainly as a result of the further decomposition ofunstable oil molecules toward gaseous products and, possibly, tosome extent, polymerization of intermediates to high molecularweight compounds remaining in the solid residue. On the basis ofour data, polymerization cannot be confirmed; however, earlierstudies proved that the polymerization of sugars (compoundsalso present in algae) commonly occurs during subcritical hydro-thermal processing.13
In several publications,8,29,33,34 biomass liquefaction is de-scribed as follows:1. Hydrolysis of biomass macromolecules (lipids, proteins,
and carbohydrates in the case of algal biomass) into smallerfragments;
2. Conversion of these fragments by, for example, dehydra-tion into other, smaller compounds;
3. Rearrangement via condensation, cyclization, and poly-merization producing new components.
It should be noticed that some of the above-mentioned lique-faction mechanisms from literature were reported for experi-ments in which woody biomass was used as feedstock. Thedifferent biochemical composition of the microalgal biomass,compared to that of terrestrial biomass in other studies, may playa role here.The yield of each product depends on the reaction conditions,
influencing the competition between depolymerization, crack-ing, and repolymerization reactions (resulting in larger moleculesand aggregates). As suggested by Yuan et al.,34 after investigatingthe process of straw liquefaction, hydrolysis dominates duringlow temperature liquefaction (below 220 �C) and after that,the competition between hydrolysis and repolymerization startswhen the temperature ranges between 220 and 300 �C. Finally,repolymerization becomes predominant with a further increasein temperature, increasing the oil and gas production.Similar trends could be hypothesized from our results by
observing Figure 4. From 175 �C to around 225�250 �C andshort reaction time, hydrolysis into smaller fragments (soluble inwater) dominated, as indicated by the increase in water-solubleorganics and the low oil yields obtained. In the range 250�375 �C, oil production increased and reached a maximum, whilethe organic content in water decreased. This might indicate the
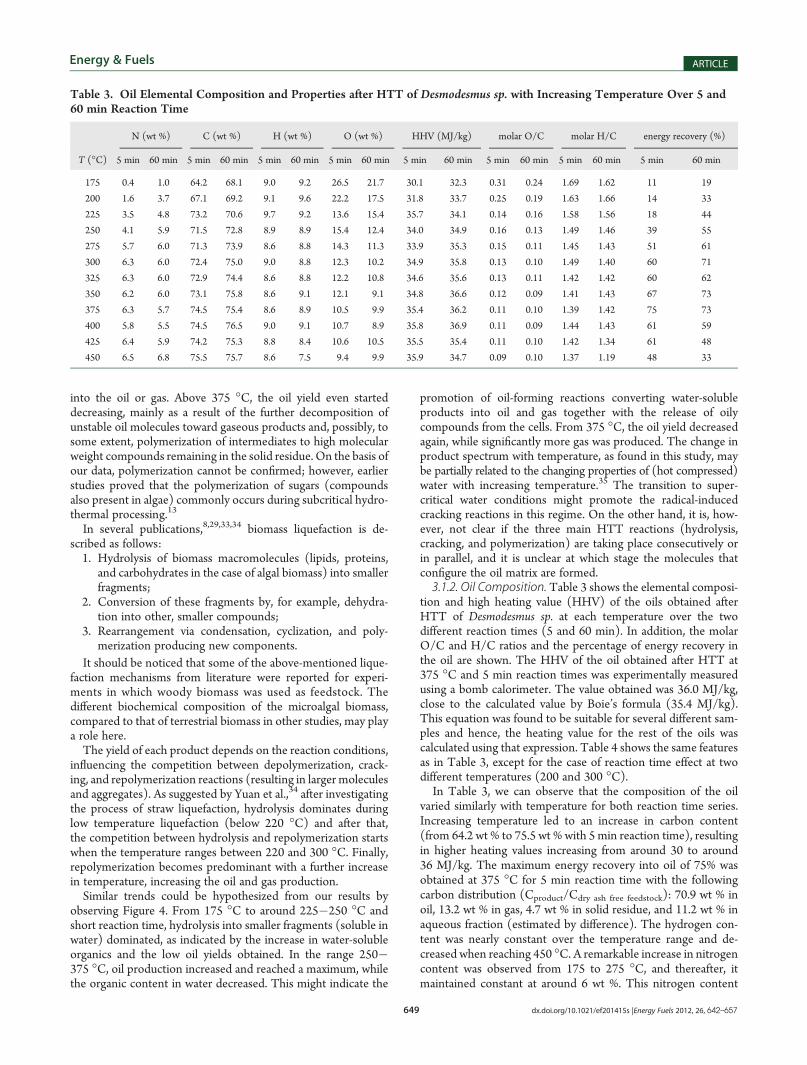
promotion of oil-forming reactions converting water-solubleproducts into oil and gas together with the release of oilycompounds from the cells. From 375 �C, the oil yield decreasedagain, while significantly more gas was produced. The change inproduct spectrum with temperature, as found in this study, maybe partially related to the changing properties of (hot compressed)water with increasing temperature.35 The transition to super-critical water conditions might promote the radical-inducedcracking reactions in this regime. On the other hand, it is, how-ever, not clear if the three main HTT reactions (hydrolysis,cracking, and polymerization) are taking place consecutively orin parallel, and it is unclear at which stage the molecules thatconfigure the oil matrix are formed.3.1.2. Oil Composition. Table 3 shows the elemental composi-
tion and high heating value (HHV) of the oils obtained afterHTT of Desmodesmus sp. at each temperature over the twodifferent reaction times (5 and 60 min). In addition, the molarO/C and H/C ratios and the percentage of energy recovery inthe oil are shown. The HHV of the oil obtained after HTT at375 �C and 5 min reaction times was experimentally measuredusing a bomb calorimeter. The value obtained was 36.0 MJ/kg,close to the calculated value by Boie’s formula (35.4 MJ/kg).This equation was found to be suitable for several different sam-ples and hence, the heating value for the rest of the oils wascalculated using that expression. Table 4 shows the same featuresas in Table 3, except for the case of reaction time effect at twodifferent temperatures (200 and 300 �C).In Table 3, we can observe that the composition of the oil
varied similarly with temperature for both reaction time series.Increasing temperature led to an increase in carbon content(from 64.2 wt % to 75.5 wt % with 5 min reaction time), resultingin higher heating values increasing from around 30 to around36 MJ/kg. The maximum energy recovery into oil of 75% wasobtained at 375 �C for 5 min reaction time with the followingcarbon distribution (Cproduct/Cdry ash free feedstock): 70.9 wt % inoil, 13.2 wt % in gas, 4.7 wt % in solid residue, and 11.2 wt % inaqueous fraction (estimated by difference). The hydrogen con-tent was nearly constant over the temperature range and de-creased when reaching 450 �C. A remarkable increase in nitrogencontent was observed from 175 to 275 �C, and thereafter, itmaintained constant at around 6 wt %. This nitrogen content
Table 3. Oil Elemental Composition and Properties after HTT of Desmodesmus sp. with Increasing Temperature Over 5 and60 min Reaction Time
N (wt %) C (wt %) H (wt %) O (wt %) HHV (MJ/kg) molar O/C molar H/C energy recovery (%)
T (�C) 5 min 60 min 5 min 60 min 5 min 60 min 5 min 60 min 5 min 60 min 5 min 60 min 5 min 60 min 5 min 60 min
175 0.4 1.0 64.2 68.1 9.0 9.2 26.5 21.7 30.1 32.3 0.31 0.24 1.69 1.62 11 19
200 1.6 3.7 67.1 69.2 9.1 9.6 22.2 17.5 31.8 33.7 0.25 0.19 1.63 1.66 14 33
225 3.5 4.8 73.2 70.6 9.7 9.2 13.6 15.4 35.7 34.1 0.14 0.16 1.58 1.56 18 44
250 4.1 5.9 71.5 72.8 8.9 8.9 15.4 12.4 34.0 34.9 0.16 0.13 1.49 1.46 39 55
275 5.7 6.0 71.3 73.9 8.6 8.8 14.3 11.3 33.9 35.3 0.15 0.11 1.45 1.43 51 61
300 6.3 6.0 72.4 75.0 9.0 8.8 12.3 10.2 34.9 35.8 0.13 0.10 1.49 1.40 60 71
325 6.3 6.0 72.9 74.4 8.6 8.8 12.2 10.8 34.6 35.6 0.13 0.11 1.42 1.42 60 62
350 6.2 6.0 73.1 75.8 8.6 9.1 12.1 9.1 34.8 36.6 0.12 0.09 1.41 1.43 67 73
375 6.3 5.7 74.5 75.4 8.6 8.9 10.5 9.9 35.4 36.2 0.11 0.10 1.39 1.42 75 73
400 5.8 5.5 74.5 76.5 9.0 9.1 10.7 8.9 35.8 36.9 0.11 0.09 1.44 1.43 61 59
425 6.4 5.9 74.2 75.3 8.8 8.4 10.6 10.5 35.5 35.4 0.11 0.10 1.42 1.34 61 48
450 6.5 6.8 75.5 75.7 8.6 7.5 9.4 9.9 35.9 34.7 0.09 0.10 1.37 1.19 48 33
650 dx.doi.org/10.1021/ef201415s |Energy Fuels 2012, 26, 642–657
Energy & Fuels ARTICLE
variation was more pronounced than that reported in otherstudies.27,30 Finally, the oxygen content decreased significantlywith increasing temperature (more pronounced with the 60 minreaction time), showing that deoxygenation occurs. The carbonand hydrogen content of the oil obtained was significantly higherthan that of the original dry algal biomass, and with the continu-ous drop of oxygen level in the oil by increasing temperature,HTT resulted in a significant energy densification from 22MJ/kgfor the algal biomass to around 36 MJ/kg for the oil obtained.The molar O/C and H/C ratios of the algal oils were close tothose of biodiesel (FAME and FAEE) and heavy crude oil. Further-more, a reduction in the H/C ratio with increasing temperaturewas also observed, likely as a result of increasing content ofaromatic compounds in the oil.In Table 4, as observed with the product distribution results,
increasing the reaction time had more effect on the oil composi-tion and its heating value at 200 �C than it did with the 300 �Cseries. Noticeable is the nitrogen content of the 200 �C oil, whichshowed a remarkable rise from 1.6 to 3.7 wt %, particularlyfrom 30 to 60 min, while at 300 �C it was already at a high levelafter 5 min. Oil deoxygenation was also achieved by increasingreaction time.The high nitrogen content of the oil produced (mainly as a
result of the large protein content of the aquatic organism used)is an important drawback in view of fuel applications, as undesir-able NOx emissions will occur during combustion. For cofeedingof HTT algal oil to existing crude oil-based refineries for the pro-duction of transportation fuels, the high nitrogen content mayalso be prohibitive. Similarly, some deoxygenation might be nec-essary, although work by deMiguelMercader et al.36 showed that
full deoxygenation is not required for successful coprocessing ofhydrodeoxygenated pyrolysis oil along with a heavy oil petro-leum fraction in a lab scale simulated FCC unit. Pyrolysis oilfrom terrestrial biomass has the advantage over algal oil obtainedby HTT, in that it contains a very low fraction of nitrogen (e.g.,<0.1 wt % using pine wood37). However, the energy densityof the HTT algal oil can be twice as high as that of pyrolysis oil(14�24 MJ/kg using pine wood38) and more close to that ofpetroleum crude oil (42 MJ/kg).In view of the oil upgrading methods, especially for denitro-
genation, a preliminary identification of the chemical natureof the oil and the nitrogen containing compounds in the oil isrequired. An additional complexity was found, as, by contrastingvarious studies, the influence of the type of microalgae feedstockon the composition of the oil became evident. Oils producedafter thermal processing of different microalgae species at 350 �Cand 60 min reaction time in absence of a catalyst were compared(see Table 5), and a considerable variation in the nitrogencontent could be observed. Spirulina, having the highest proteincontent18 (65 daf %), showed also the highest nitrogen contentin the oil.3.1.3. Aqueous Phase, Solid Residue, and Gas Analyses. As
previously mentioned, a constant decrease of the water-solubleorganics was noticed with increasing temperature. This wasclearly visible when observing the color of the aqueous phasesrecovered from the various temperature treatments. At highertemperatures, transparency increased and, gradually, the solutionbecame lighter in color, suggesting the conversion of the dis-solved organics into gaseous and oil products. Identification, ona molecular level, of these organic compounds soluble in waterwould provide more information about the reaction mechanismsoccurring. Zhou et al.29 (processing macroalgae) found aceticacid as the most abundant compound in the aqueous phase,followed by glycerol, suggesting its formation from the hydro-lysis of lipids during HTT. They also detected several organicnitrogen-containing compounds. Other studies10,27 reported thepresence of acetates and formates (likely from carbohydratehydrolysis). The amounts of these organic constituents variedper study, pointing out once again the influence of the type ofalgal biomass used. Photospectrometry analysis of the aqueousphases was performed to evaluate the potential of nutrientsrecycling for further cultivation of algae. The thermal treatmentof microalgae led to the formation of NH4
+ (dissolved in theaqueous phase), which was not present as nitrogen nutrient inthe initial growth medium (containing mainly NO3
� and PO43�)
prior to HTT. Ammonium was most likely formed by thermaldecomposition of proteins initially yielding amino acids, whichwere further hydrolyzed (deamination), producing ammonia,
Table 4. Oil Elemental Composition and Properties afterHTT ofDesmodesmus sp.with Increasing Reaction Time (RT)at 200 �C and 300 �C
RT
(min)
N
(wt %)
C
(wt %)
H
(wt %)
O
(wt %)
HHV
(MJ/kg)
molar
O/C
molar
H/C
energy
recovery
Temp. 200 �C
5 1.6 67.1 9.1 22.2 31.8 0.25 1.63 13.6
15 2.1 66.6 8.6 22.8 31.0 0.26 1.55 17.0
30 2.0 68.1 9.5 20.5 32.8 0.23 1.67 19.5
60 3.7 69.2 9.6 17.5 33.7 0.19 1.66 33.1
Temp. 300 �C5 6.3 72.4 9.0 12.3 34.9 0.13 1.49 60.3
15 6.0 72.9 9.0 12.0 35.2 0.12 1.48 62.8
30 5.9 73.5 8.9 11.7 35.2 0.12 1.45 65.8
60 6.0 75.0 8.8 10.2 35.8 0.10 1.40 71.2
Table 5. Elemental Composition of Oils Obtained after HTT at the Same Reaction Conditions (350�C and 60min reaction time)using Different Microalgae Feedstock
ref algae N (wt %) C (wt %) H (wt %) O (wt %) S (wt %) HHV (MJ/kg)
present work Desmodesmus sp. 6.0 75.8 9.1 9.1 n.d.a 36.6b
Brown 201030 Nannochloropsis sp. 3.9 76.0 10.3 9.0 0.9 39.0
Biller 201018 Porphyridium cruentum 5.4 72.8 8.5 13.3 0.3 35.7
Spirulina 7.0 73.3 9.2 10.4 0.0 36.8
Duan 201019 Nannochloropsis sp. 4.2 75.3 10.2 9.2 0.8 38.5
Biller 201132 Nannochloropsis oculata 4.1 68.1 8.8 18.9 0.0 34.5
Chlorella vulgaris 5.9 70.7 8.6 14.8 0.0 35.1aNot determined. bCalculated with Boie’s formula.

651 dx.doi.org/10.1021/ef201415s |Energy Fuels 2012, 26, 642–657
Energy & Fuels ARTICLE
and after accepting a proton from water, it produced NH4+
and OH�. The formation of ammonium was previously reportedin other investigations.21,22 The NH4
+ concentration increasedwith increasing temperature while NO3
� decreased, but to alesser extent. The total nitrogen was always significantly higherthan the sum of NH4
+ and NO3� (NO2
� was below the detec-tion limit), indicating the presence and formation of organicnitrogen containing compounds being the major constituents inthe aqueous fraction, together with NH4
+. After HTT, all thephosphorus in the aqueous phase was present in the form ofPO4
3�, as evidenced by the total phosphorus and PO43�
determination being nearly equal. However, an important de-cline in the phosphorus recovery via the aqueous phase withincreasing HTT temperature was noticed. Depending on thepossibilities to recover phosphorus from the other product frac-tions (solid residue and oil phase), an appropriate HTT operat-ing temperature must be selected in order to minimize losses ofphosphorus. In conclusion, the basic inorganic N and P nutrientsnecessary forDesmodesmus sp. growth were found in the aqueousproduct phase. In addition, organic carbon and nitrogen com-pounds were also found, which could be beneficial (as carbonsource for heterotrophic growth) but could also adversely inhibitgrowth. Also, some toxicmetals (e.g., Ni andCr) from the reactorwall could be dissolved in the aqueous phase, leading to the sameinhibitory effect. Preliminary results from growth studies with thealgae species used in this work, using recycled HTT aqueousphase, are very promising and will be published in the future.From the elemental analysis results, we could observe a steady
decrease of carbon (5 min, 48.9�19.3 wt %; 60 min, 49.9�19.4wt%), nitrogen (5min, 6.3�1.3wt%; 60min, 7.1�1.8wt%),and hydrogen (5 min, 7.0�1.8 wt %; 60 min, 6.8�1.2 wt %)contents in the solid residue with increasing temperature. Thefraction estimated by difference (100 � C � H � N), whichcould be oxygen but also could be other products such as ashes,increased (5 min, 37.7�77.6 wt %; 60 min, 36.3�77.6 wt %). Atlow temperatures (175 and 200 �C), the elemental compositionand HHV of the solid residues were close to that of the initialalgae feedstock (in Table 2).The main compound in the gas phase was CO2 (99.7�
66.9 mol % with 5 min and 98.5�58.1 mol % with 60 minreaction time), the amount of which remained nearly constantfrom 175 to 350 �C and from there it started decreasing whilesmall hydrocarbons (CH4 and C2�C3) andH2 began to increasesignificantly. Very small amounts of CO and H2 were formed,suggesting that deoxygenation occurs mainly via decarboxylationrather than by decarbonylation. Besides the gaseous carbon,earlier studies also identified nitrogen containing compoundsin the gas fraction. Duan et al.19 reported the presence of N2
(excluding its origin from residual air) suggesting its formationfrom ammonia decomposition. Components such as NO2, N2O,HCN, and NH3 were found after FTIR analysis of the gas pro-duct in the work by Ross et al.,10 although a catalyst was used inthose experiments. The GC equipment used in this work wasable to measure N2, but we could not distinguish if its origin wasfrom traces of air or from the algal biomass itself. Therefore, thefraction of nitrogen ending in the gas was estimated from anelemental balance with the nitrogen content of the oil, aqueousphase, and solid phase products (the calculation method canbe found in section 2.5). However, the total nitrogen test (seesection 2.3) employed for the aqueous phase may give an under-estimated value of nitrogen content. It is known that this oxi-dative method may not be able to completely digest all organic N
compounds (e.g., pyridine) and would thus yield lower valuesfor the nitrogen content of the aqueous phase.Figure 6 shows the nitrogen distribution over the product
phases with increasing HTT reaction temperature. As observedin other investigations10,18 reporting a nitrogen balance, a signi-ficant fraction of nitrogen ended up in the gas phase and this frac-tion seemed to increase with temperature.For the experiments changing reaction time (Figure 5), ana-
lyses of the other product fractions (gas, solid residue, and aque-ous phase) were also performed. In general, when the reactiontime for HTT at 200 �C was increased, the properties of the oiland the other product fractions varied in similar manner as whenthe temperature was raised at a constant reaction time.3.1.4. Algae Cell Observations after Hydrothermal Treat-
ment. As can be seen in Figure 4, the most remarkable increasein oil yield and decrease in solid residue occurred in the temper-ature range from 225 to 250 �C for the 5 min reaction time series(49.1�22.3 wt % and 12.1�26.7 wt %, respectively). It was anti-cipated that this could be related to a change in the morphologyof the algal cells, considering that intracellular compounds maybe more accessible if the cell wall is broken, which may haveincreased the overall oil yield. At the same time, if the cell wallmaterial itself is thermally degraded into oil, the total yield wouldincrease even more. However, such an abrupt change was notobserved for the 60 min reaction time series. Therefore, SEManalysis was performed (Figure 7) to visually inspect the cells inthe solid residue after HTT with increasing temperature in orderto investigate the possible link between yields and cell structure.These micrographs clearly showed that no major cell wall
breakage took place below 250 �C and 5min reaction time, as thecell wall remained visually intact, confirming the strong resis-tance of the Desmodesmus sp. physical structure to temperature.After HTT at 175 �C, the cells appeared unbroken and theirappearance was similar to that of the fresh microalgae. Cell wallbreakage was not achieved after HTT at 200 �C, although thepresence of some type of residue/precipitate was visible on theouter surface of the cells. This solid material could be debrisfrom a minor decomposition of the cell walls regarding theslight decrease in solid yield from 175 to 200 �C or intracellular
Figure 6. Effect of reaction temperature on the nitrogen distributionbetween the products obtained after HTT of Desmodesmus sp. with60 min reaction time.

652 dx.doi.org/10.1021/ef201415s |Energy Fuels 2012, 26, 642–657
Energy & Fuels ARTICLE
compounds released from the cells. HTT at 225 �C led to astrong cell clustering effect where the cells appeared deformedand closely packed with some solid residue detected on them.Finally, while the cell wall was still visually unbroken after HTTat 225 �C, the following increase in temperature to 250 �C led toa major breakage of the cells. Above 250 �C, no individual cellswere recognizable and only a compact mass of cells debris was
visible. In conclusion, the significant difference between the pro-duct yields from 225 to 250 �C coincided with the breakageof the cells occurring in that temperature range with 5 min reac-tion time.A possible explanation for the cell clustering and adhesion
observed after HTT at 225 �C could be the result of precipitationor coagulation of released proteins by their thermal denaturation
Figure 7. Effect of reaction temperature on the algal cells after HTT of Desmodesmus sp. for 5 min reaction time.

653 dx.doi.org/10.1021/ef201415s |Energy Fuels 2012, 26, 642–657
Energy & Fuels ARTICLE
during the whole heating process. Zepka et al.39 studied theinfluence of drying conditions on the biochemical composition ofalgal biomass and reported that such a protein degradation pro-cess could be expected. Denaturation can be promoted by vari-ous agents such as heat, pH, salts, and surface effects. Denatura-tion in microalgae can also lead to the formation of viscous gelsby applying heat.40 These gels could promote the adhesion of thecells. Another possibility for the observed clustering could be theoccurrence of Maillard reaction producing brown nitrogenouspolymers or melanoidins. Peterson et al.41 reported system plug-ging problems caused by this product during hydrothermal pro-cessing at 250 �C of glucose, as a model carbohydrate, andglycine, as model protein of biomass. Finally, aggregation of thecells could have happened because their polar cell wall is sur-rounded by water that behaves similarly to an organic nonpolarsolvent as a result of the lowering in dielectric constant at thosereaction conditions.Nevertheless, the high stability of the cell wall over tempera-
ture is the most noteworthy feature of Desmodesmus sp. Thisthermal resistance could be related to the presence of certainbiomacromolecules, termed algaenans, in the cell wall of manyalgae from the Chlorophyta division (green algae) such asDesmodesmus sp. The building blocks of algaenans consist oflinear C22 to C34 even numbered carbon chains with functionalgroups cross-linking the monomers with ether and ester bonds.42
Salmon et al.43 reported a very low algaenan (isolated fromBotryococcus braunii) conversion (3�9%) by means of heatingfrom 200 to 300 �C and 9 h reaction time. These insoluble, non-hydrolyzable biopolymers seem to have a particular resistance totemperature.A related question arose when noticing the unbreakable be-
havior of the cells wall below 250 �C: Do the intracellular consti-tuents remain intact during HTT at those operating conditions?To answer that question, first the oil yield and elemental com-position of the oils obtained after HTT at 175, 200, and 225 �Cwere compared to those of the oils obtained from two differentsolvent extractions: the common Bligh and Dyer (B&D) extrac-tion method (described in section 2.1) without the washing stepwith aqueous Na2SO4 solution and a dichloromethane (DCM)extraction using the same amount of solvent as was used forthe recovery of the products after HTT (in total 70 mL) andapplying the same product recovery procedure (Figure 3). Bothroom temperature extractions were applied to the same amountof algae solution (∼20 g) with a dry algae concentration of7�8 wt %, as was used in the HTT experiments. The results areshown in Table 6.The first aspect to highlight is that it was possible to obtain an
oily product extracted with the use of only DCM as solvent. Thisindicates that the oil obtained after HTT might be a mixture of
compounds obtained from the hydrothermal processing andother compounds extracted by the DCM used afterward forproduct recovery purposes from the reactor. The same phenom-enon was observed by Brown et al.30 On the other hand, slightdifferences between yields of solvent extracted oils and HTT oilsat low temperatures became apparent, as well as in elementalcomposition, particularly for the nitrogen and carbon content.Therefore, GPC analysis of the extracted and HTT oils wasperformed in order to compare their molecular weight distribu-tion. The results are represented in Figure 8, where the diagramswere cut at low molecular weight (∼100 g/mol) to remove thepeak corresponding to the degradation products of the GPC-eluent THF. The differential distribution dtotal mass/dlog molar mass(W(log M)) is plotted versus the molar mass (M).As can be seen in Figure 8, the molecular weight distribution of
the HTT oils was significantly different from that of the extractedoils (B&D and DCM). The HTT oils had a wider molecularweight distribution where more heavy compounds were pro-duced (tailing observed from 2000 to more than 10 000 g/mol),most probably related to the presence of hydrophobic poly-peptides or proteins, as well as some lighter components (from100 to 300 g/mol), which had minor presence in the extractedoils. The peak observed at around 400 to 500 g/mol was mostlikely related to the presence of lipids. These results lead to theconclusion that, at relatively low temperatures, the cellular com-pounds already undergo thermal degradation, even though theouter algal cell wall remains visually unbroken.In addition, the DCM extracted oil and the oil from HTT
at 200 �C and 5 min reaction time were analyzed in terms offatty acid composition (detailed information of these analyses isreported elsewhere44). It was found that while only boundedfatty acids (representing the esterification products from mono-,di-, and triglycerides, and phospholipids, saccharolipids, etc.)were present in the DCM extracted oil, the 200 �C HTT oil alsocontained free fatty acids (FFA). This indicates that, already atthose less severe HTT conditions, hydrolysis into FFA occurred.This reduces the possibility of obtaining an oil rich in lipids withintact molecular structure (e.g., triglycerides) at relatively lowHTT temperatures. Moreover, the presence of FFA in the oilcould be detrimental if transesterification of this oil using an
Table 6. Yield and Elemental Analysis of Oils Obtained afterB&D Extraction, Dichloromethane (DCM) Extraction, andHTT at 175, 200, and 225 �C with 5 min RT
expt
oil yield
(wt %)
N
(wt %)
C
(wt %)
H
(wt %)
O
(wt %)
B&D 16.5 1.4 74.0 9.8 14.7
DCM 7.1 0.8 75.5 10.5 13.3
175 �C, 5 min 8.6 0.4 64.2 9.0 26.5
200 �C, 5 min 10.0 1.6 67.1 9.1 22.2
225 �C, 5 min 12.5 3.5 73.2 9.7 13.6
Figure 8. Molecular weight distribution by GPC analysis of oilsobtained after B&D extraction, dichloromethane (DCM) extraction,and HTT at 175, 200, and 225 �C with 5 min reaction time.
654 dx.doi.org/10.1021/ef201415s |Energy Fuels 2012, 26, 642–657
Energy & Fuels ARTICLE
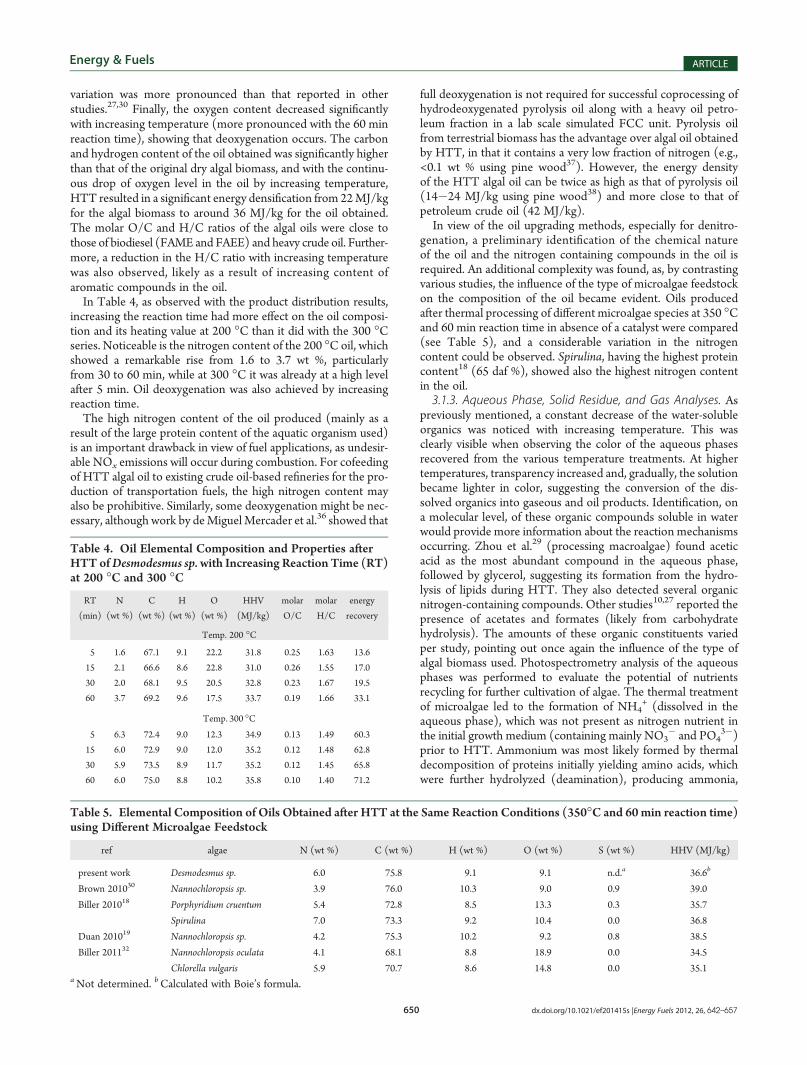
homogeneous basic catalyst (most commonly used) is per-formed, as undesirable soaps would be produced by the neutrali-zation of the FFA, decreasing the biodiesel yield.45 In contrast,FFA would not cause difficulties if hydrotreating of the oilfor upgrading purposes is preferred. More generally, as in somestudies a method termed thermolysis (or also autoclaving) isapplied as mild heat pretreatment (around 70 to 120 �C) for cellbreakage prior to extraction,46,47 it is now clear that such athermal treatment could already (undesirably) modify the mo-lecular structure of the intracellular compounds.As shown in Figure 5, a rise in oil production was obtained by
increasing reaction time at 200 �C. Again, the observed relativelylarge increase in oil yield (specially from 30 to 60 min reactiontime) was compared with visual inspection of the solid residueafter HTT at different reaction times and 200 �C (Figure 9) bySEM analysis.With the temperature series experiments, we could observe
that one of the main characteristics of alga of Desmodesmussp. is that they possess a very strong cell wall. In this new series ofexperiments, this feature was confirmed, because after 200 �CHTT during 5 and 15 min, all the cells were still visually un-broken and no major cell differences could be detected betweenboth. However, from the 30 min reaction time onward, the cellsstarted compacting and clustering, although still keeping the cellwall unruptured. Therefore, we could prove again that, at rela-tively low temperatures (200 �C), longer reaction times resultedin a thermal degradation of the cellular compounds withoutbreaking the cell wall because the oil yield increased as well asthe N and C content. HTT experiments at 200 �C over evenlonger reaction time will be performed in following research to
determine if the breakage of the cells takes place at a certain pointin time at such low temperature.Moreover, now we observed that the previous reported cell
breakages from 225 to 250 �C and 5 min reaction time (observedin Figure 7) were not the only phenomenon causing the suddenincrease in oil yield, since HTT at 200 �C, 60 min reaction timeand visually unbroken cells led to an oil yield (23 wt %)comparable to the one obtained with HTT at 250 �C, 5 minreaction time and major breakage of cells (26 wt %).3.2. Comparison of HTT Algal Oils Produced under Differ-
ent Reaction Conditions. To give an idea on the differencebetween “milder” and “harsher” HTT, in terms of molecularcomposition of the product, chemical features of two differentoils obtained at 250 and 375 �C (both over 5 min reaction time)are shown here. Two oils were analyzed in terms of their molec-ular weight distribution (by GPC), fatty acid composition,and yield of (categories of) chemical compounds (by stepwisePy-SPME-GC-MS combined with TGA). Complete informationabout the newly developed analytical techniques applied, as wellas the results of an extensive study on the chemical nature of theoils, is published by Torri et al. in the adjacent paper.44
The following oil features were identified and quantified byGC-FID analysis (after applying esterification): total amountof fatty acids (TFA) and its yield from algae (TFA yield); theamount of free fatty acids (FFA) and the total FFA yield calcu-lated from the total yield of oil. The amount of bounded fattyacids (BFA) and yield is then calculated by difference (BFA =TFA� FFA). These results are shown in Table 7. The same fattyacids analyses were also performed on the oils obtained after HTTat 200 and 300 �C and 5 min reaction time (results not shown),
Figure 9. Effect of reaction time on the algal cells after HTT of Desmodesmus sp. at 200 �C.
655 dx.doi.org/10.1021/ef201415s |Energy Fuels 2012, 26, 642–657
Energy & Fuels ARTICLE
and we observed that the highest TFA content was for the oilobtained at 250 �C HTT. Therefore, two different situationshave been selected for comparison: 250 �C HTT where a loweroil yield is obtained but with higher quality (in terms of FAcomposition) and the oil from 375 �C HTT with the highest oilyield but low fatty acid content.In the oil from HTT at 250 �C, 45% of TFA were in the form
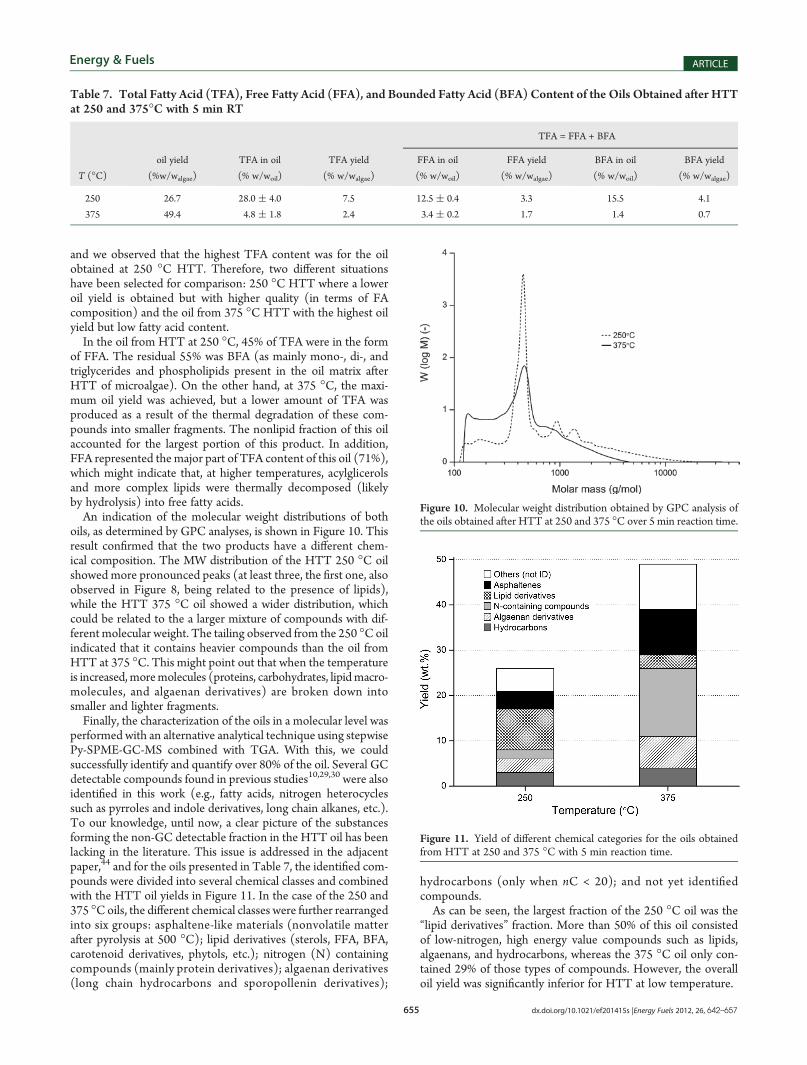
of FFA. The residual 55% was BFA (as mainly mono-, di-, andtriglycerides and phospholipids present in the oil matrix afterHTT of microalgae). On the other hand, at 375 �C, the maxi-mum oil yield was achieved, but a lower amount of TFA wasproduced as a result of the thermal degradation of these com-pounds into smaller fragments. The nonlipid fraction of this oilaccounted for the largest portion of this product. In addition,FFA represented themajor part of TFA content of this oil (71%),which might indicate that, at higher temperatures, acylglicerolsand more complex lipids were thermally decomposed (likelyby hydrolysis) into free fatty acids.An indication of the molecular weight distributions of both
oils, as determined by GPC analyses, is shown in Figure 10. Thisresult confirmed that the two products have a different chem-ical composition. The MW distribution of the HTT 250 �C oilshowed more pronounced peaks (at least three, the first one, alsoobserved in Figure 8, being related to the presence of lipids),while the HTT 375 �C oil showed a wider distribution, whichcould be related to the a larger mixture of compounds with dif-ferentmolecular weight. The tailing observed from the 250 �Coilindicated that it contains heavier compounds than the oil fromHTT at 375 �C. This might point out that when the temperatureis increased, moremolecules (proteins, carbohydrates, lipidmacro-molecules, and algaenan derivatives) are broken down intosmaller and lighter fragments.Finally, the characterization of the oils in a molecular level was
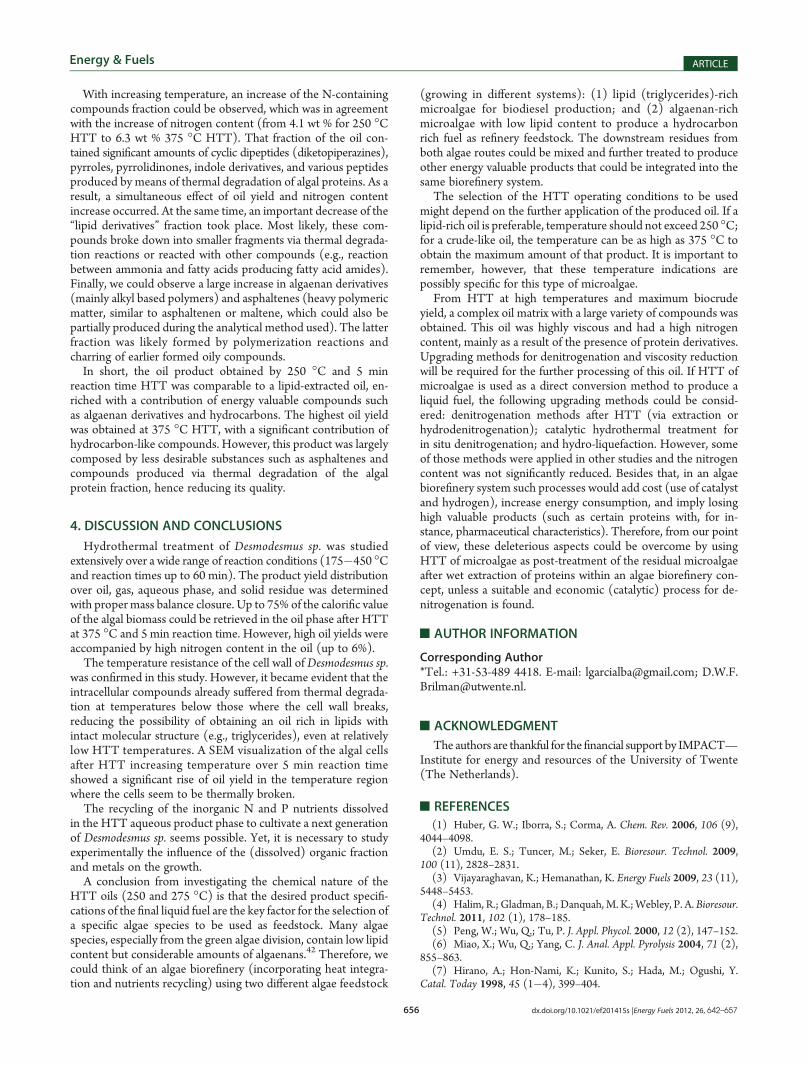
performed with an alternative analytical technique using stepwisePy-SPME-GC-MS combined with TGA. With this, we couldsuccessfully identify and quantify over 80% of the oil. Several GCdetectable compounds found in previous studies10,29,30 were alsoidentified in this work (e.g., fatty acids, nitrogen heterocyclessuch as pyrroles and indole derivatives, long chain alkanes, etc.).To our knowledge, until now, a clear picture of the substancesforming the non-GC detectable fraction in the HTT oil has beenlacking in the literature. This issue is addressed in the adjacentpaper,44 and for the oils presented in Table 7, the identified com-pounds were divided into several chemical classes and combinedwith the HTT oil yields in Figure 11. In the case of the 250 and375 �Coils, the different chemical classes were further rearrangedinto six groups: asphaltene-like materials (nonvolatile matterafter pyrolysis at 500 �C); lipid derivatives (sterols, FFA, BFA,carotenoid derivatives, phytols, etc.); nitrogen (N) containingcompounds (mainly protein derivatives); algaenan derivatives(long chain hydrocarbons and sporopollenin derivatives);
hydrocarbons (only when nC < 20); and not yet identifiedcompounds.As can be seen, the largest fraction of the 250 �C oil was the
“lipid derivatives” fraction. More than 50% of this oil consistedof low-nitrogen, high energy value compounds such as lipids,algaenans, and hydrocarbons, whereas the 375 �C oil only con-tained 29% of those types of compounds. However, the overalloil yield was significantly inferior for HTT at low temperature.
Table 7. Total Fatty Acid (TFA), Free Fatty Acid (FFA), and Bounded Fatty Acid (BFA) Content of the Oils Obtained after HTTat 250 and 375�C with 5 min RT
TFA = FFA + BFA
T (�C)oil yield
(%w/walgae)
TFA in oil
(% w/woil)
TFA yield
(% w/walgae)
FFA in oil
(% w/woil)
FFA yield
(% w/walgae)
BFA in oil
(% w/woil)
BFA yield
(% w/walgae)
250 26.7 28.0 ( 4.0 7.5 12.5 ( 0.4 3.3 15.5 4.1
375 49.4 4.8 ( 1.8 2.4 3.4 ( 0.2 1.7 1.4 0.7
Figure 10. Molecular weight distribution obtained by GPC analysis ofthe oils obtained after HTT at 250 and 375 �C over 5 min reaction time.
Figure 11. Yield of different chemical categories for the oils obtainedfrom HTT at 250 and 375 �C with 5 min reaction time.
656 dx.doi.org/10.1021/ef201415s |Energy Fuels 2012, 26, 642–657
Energy & Fuels ARTICLE
With increasing temperature, an increase of the N-containingcompounds fraction could be observed, which was in agreementwith the increase of nitrogen content (from 4.1 wt % for 250 �CHTT to 6.3 wt % 375 �C HTT). That fraction of the oil con-tained significant amounts of cyclic dipeptides (diketopiperazines),pyrroles, pyrrolidinones, indole derivatives, and various peptidesproduced by means of thermal degradation of algal proteins. As aresult, a simultaneous effect of oil yield and nitrogen contentincrease occurred. At the same time, an important decrease of the“lipid derivatives” fraction took place. Most likely, these com-pounds broke down into smaller fragments via thermal degrada-tion reactions or reacted with other compounds (e.g., reactionbetween ammonia and fatty acids producing fatty acid amides).Finally, we could observe a large increase in algaenan derivatives(mainly alkyl based polymers) and asphaltenes (heavy polymericmatter, similar to asphaltenen or maltene, which could also bepartially produced during the analytical method used). The latterfraction was likely formed by polymerization reactions andcharring of earlier formed oily compounds.In short, the oil product obtained by 250 �C and 5 min
reaction time HTT was comparable to a lipid-extracted oil, en-riched with a contribution of energy valuable compounds suchas algaenan derivatives and hydrocarbons. The highest oil yieldwas obtained at 375 �C HTT, with a significant contribution ofhydrocarbon-like compounds. However, this product was largelycomposed by less desirable substances such as asphaltenes andcompounds produced via thermal degradation of the algalprotein fraction, hence reducing its quality.
4. DISCUSSION AND CONCLUSIONS
Hydrothermal treatment of Desmodesmus sp. was studiedextensively over a wide range of reaction conditions (175�450 �Cand reaction times up to 60 min). The product yield distributionover oil, gas, aqueous phase, and solid residue was determinedwith propermass balance closure. Up to 75% of the calorific valueof the algal biomass could be retrieved in the oil phase after HTTat 375 �C and 5 min reaction time. However, high oil yields wereaccompanied by high nitrogen content in the oil (up to 6%).
The temperature resistance of the cell wall ofDesmodesmus sp.was confirmed in this study. However, it became evident that theintracellular compounds already suffered from thermal degrada-tion at temperatures below those where the cell wall breaks,reducing the possibility of obtaining an oil rich in lipids withintact molecular structure (e.g., triglycerides), even at relativelylow HTT temperatures. A SEM visualization of the algal cellsafter HTT increasing temperature over 5 min reaction timeshowed a significant rise of oil yield in the temperature regionwhere the cells seem to be thermally broken.
The recycling of the inorganic N and P nutrients dissolvedin the HTT aqueous product phase to cultivate a next generationof Desmodesmus sp. seems possible. Yet, it is necessary to studyexperimentally the influence of the (dissolved) organic fractionand metals on the growth.
A conclusion from investigating the chemical nature of theHTT oils (250 and 275 �C) is that the desired product specifi-cations of the final liquid fuel are the key factor for the selection ofa specific algae species to be used as feedstock. Many algaespecies, especially from the green algae division, contain low lipidcontent but considerable amounts of algaenans.42 Therefore, wecould think of an algae biorefinery (incorporating heat integra-tion and nutrients recycling) using two different algae feedstock
(growing in different systems): (1) lipid (triglycerides)-richmicroalgae for biodiesel production; and (2) algaenan-richmicroalgae with low lipid content to produce a hydrocarbonrich fuel as refinery feedstock. The downstream residues fromboth algae routes could be mixed and further treated to produceother energy valuable products that could be integrated into thesame biorefinery system.
The selection of the HTT operating conditions to be usedmight depend on the further application of the produced oil. If alipid-rich oil is preferable, temperature should not exceed 250 �C;for a crude-like oil, the temperature can be as high as 375 �C toobtain the maximum amount of that product. It is important toremember, however, that these temperature indications arepossibly specific for this type of microalgae.
From HTT at high temperatures and maximum biocrudeyield, a complex oil matrix with a large variety of compounds wasobtained. This oil was highly viscous and had a high nitrogencontent, mainly as a result of the presence of protein derivatives.Upgrading methods for denitrogenation and viscosity reductionwill be required for the further processing of this oil. If HTT ofmicroalgae is used as a direct conversion method to produce aliquid fuel, the following upgrading methods could be consid-ered: denitrogenation methods after HTT (via extraction orhydrodenitrogenation); catalytic hydrothermal treatment forin situ denitrogenation; and hydro-liquefaction. However, someof those methods were applied in other studies and the nitrogencontent was not significantly reduced. Besides that, in an algaebiorefinery system such processes would add cost (use of catalystand hydrogen), increase energy consumption, and imply losinghigh valuable products (such as certain proteins with, for in-stance, pharmaceutical characteristics). Therefore, from our pointof view, these deleterious aspects could be overcome by usingHTT of microalgae as post-treatment of the residual microalgaeafter wet extraction of proteins within an algae biorefinery con-cept, unless a suitable and economic (catalytic) process for de-nitrogenation is found.
’AUTHOR INFORMATION
Corresponding Author*Tel.: +31-53-489 4418. E-mail: [email protected]; [email protected].
’ACKNOWLEDGMENT
The authors are thankful for thefinancial support by IMPACT—Institute for energy and resources of the University of Twente(The Netherlands).
’REFERENCES
(1) Huber, G. W.; Iborra, S.; Corma, A. Chem. Rev. 2006, 106 (9),4044–4098.
(2) Umdu, E. S.; Tuncer, M.; Seker, E. Bioresour. Technol. 2009,100 (11), 2828–2831.
(3) Vijayaraghavan, K.; Hemanathan, K. Energy Fuels 2009, 23 (11),5448–5453.
(4) Halim, R.; Gladman, B.; Danquah,M. K.;Webley, P. A. Bioresour.Technol. 2011, 102 (1), 178–185.
(5) Peng, W.; Wu, Q.; Tu, P. J. Appl. Phycol. 2000, 12 (2), 147–152.(6) Miao, X.; Wu, Q.; Yang, C. J. Anal. Appl. Pyrolysis 2004, 71 (2),
855–863.(7) Hirano, A.; Hon-Nami, K.; Kunito, S.; Hada, M.; Ogushi, Y.
Catal. Today 1998, 45 (1�4), 399–404.
657 dx.doi.org/10.1021/ef201415s |Energy Fuels 2012, 26, 642–657
Energy & Fuels ARTICLE
(8) Zou, S.; Wu, Y.; Yang, M.; Li, C.; Tong, J. Energy Fuels 2009,23 (7), 3753–3758.(9) Xu, L.; Brilman, D. W. F.; Withag, J. A. M.; Brem, G.; Kersten, S.
Bioresour. Technol. 2011, 102 (8), 5113–5122.(10) Ross, A. B.; Biller, P.; Kubacki, M. L.; Li, H.; Lea-Langton, A.;
Jones, J. M. Fuel 2010, 89, 2234–2243.(11) Elliott, D. C.; Sealock, L. J.; Butner, R. S. Product Analysis from
Direct Liquefaction of Several High-Moisture Biomass Feedstocks.Pyrolysis Oil from Biomass; American Chemical Society: Washington,DC, 1988; pp 179�188.(12) Peterson, A. A.; Vogel, F.; Lachance, R. P.; Fr€oling, M.; Antal,
M. J., Jr; Tester, J. W. Energy Environ. Sci. 2008, 1 (1), 32–65.(13) Kne�zevi�c, D.; van Swaaij, W.; Kersten, S. Ind. Eng. Chem. Res.
2009, 49 (1), 104–112.(14) Dote, Y.; Sawayama, S.; Inoue, S.; Minowa, T.; Yokoyama, S.-y.
Fuel 1994, 73 (12), 1855–1857.(15) Metzger, P.; Largeau, C. Appl. Microbiol. Biotechnol. 2005,
66 (5), 486–496.(16) Huang, H.; Yuan, X.; Zeng, G.; Wang, J.; Li, H.; Zhou, C.; Pei,
X.; You, Q.; Chen, L. Fuel Process. Technol. 2011, 92 (1), 147–153.(17) Matsui, T.; Nishihara, A.; Ueda, C.; Ohtsuki, M.; Ikenaga, N.;
Suzuki, T. Fuel 1997, 76 (11), 1043–1048.(18) Biller, P.; Ross, A. B. Bioresour. Technol. 2011, 102 (1),
215–225.(19) Duan, P.; Savage, P. E. Ind. Eng. Chem. Res. 2010, 50 (1), 52–61.(20) Yang, C.; Jia, L.; Chen, C.; Liu, G.; Fang, W. Bioresour. Technol.
2011, 102 (6), 4580–4584.(21) Minowa, T.; Sawayama, S. Fuel 1999, 78 (10), 1213–1215.(22) Jena, U.; Vaidyanathan, N.; Chinnasamy, S.; Das, K. C.
Bioresour. Technol. 2011, 102 (3), 3380–3387.(23) Department of Energy (DOE). National Algal Biofuels Technol-
ogy Roadmap; U.S. Department of Energy, Office of Energy Efficiencyand Renewable Energy, Biomass Program: 2010.(24) Bligh, E. G.; Dyer, W. J. Can. J. Biochem. 1959, 37 (8), 911–917.(25) Hara, A.; Radin, N. S. Anal. Biochem. 1978, 90 (1), 420–426.(26) Hoekstra, E.; Kersten, S. R. A.; Tudos, A.; Meier, D.;
Hogendoorn, K. J. A. J. Anal. Appl. Pyrolysis 2011, 91 (1), 76–88.(27) Jena, U.; Das, K. C.; Kastner, J. R. Bioresour. Technol. 2011, 102
(10), 6221–6229.(28) Anastasakis, K.; Ross, A. B. Bioresour. Technol. 2011, 102 (7),
4876–4883.(29) Zhou, D.; Zhang, L.; Zhang, S.; Fu, H.; Chen, J. Energy Fuels
2010, 24 (7), 4054–4061.(30) Brown, T. M.; Duan, P.; Savage, P. E. Energy Fuels 2010, 24 (6),
3639–3646.(31) Aresta, M.; Dibenedetto, A.; Carone, M.; Colonna, T.; Fragale,
C. Environ. Chem. Lett. 2005, 3 (3), 136–139.(32) Biller, P.; Riley, R.; Ross, A. B. Bioresour. Technol. 2011, 102 (7),
4841–4848.(33) Demirbas, A. Energy Convers. Manage. 2000, 41 (6), 633–646.(34) Yuan, X. Z.; Tong, J. Y.; Zeng, G.M.; Li, H.; Xie,W.Energy Fuels
2009, 23 (6), 3262–3267.(35) Akiya, N.; Savage, P. E. Chem. Rev. 2002, 102 (8), 2725–2750.(36) De Miguel Mercader, F.; Groeneveld, M. J.; Kersten, S. R. A.;
Way, N. W. J.; Schaverien, C. J.; Hogendoorn, J. A. Appl. Catal., B 2010,96 (1�2), 57–66.(37) De Miguel Mercader, F.; Groeneveld, M. J.; Kersten, S. R. A.;
Venderbosch, R. H.; Hogendoorn, J. A. Fuel 2010, 89 (10), 2829–2837.(38) Westerhof, R. J. M.; Brilman, D.W. F.; Garcia-Perez, M.; Wang,
Z.; Oudenhoven, S. R. G.; van Swaaij, W. P. M.; Kersten, S. R. A. EnergyFuels 2011, 25 (4), 1817–1829.(39) Zepka, L. Q.; Jacob-Lopes, E.; Goldbeck, R.; Queiroz, M. I.
Chem. Eng. Process 2008, 47 (8), 1305–1310.(40) Chronakis, I. S. J. Agric. Food. Chem. 2001, 49 (2), 888–898.(41) Peterson, A. A.; Lachance, R. P.; Tester, J. W. Ind. Eng. Chem.
Res. 2010, 49 (5), 2107–2117.(42) Versteegh, G. J. M.; Blokker, P. Phycol. Res. 2004, 52 (4),
325–339.
(43) Salmon, E.; Behar, F.; Lorant, F.; Hatcher, P. G.; Metzger, P.;Marquaire, P.-M. Org. Geochem. 2009, 40 (3), 400–415.
(44) Torri, C.; Garcia Alba, L.; Samorì, C.; Fabbri, D.; Brilman,D. W. F. Energy Fuels 2011; just accepted manuscript.
(45) Vicente, G.; Martínez, M.; Aracil, J. Bioresour. Technol. 2004,92 (3), 297–305.
(46) Lee, J.; Yoo, C.; Jun, S.; Ahn, C.; Oh, H. Bioresour. Technol.2010, 101 (1, Supplement 1), S75–S77.
(47) Kita, K.; Okada, S.; Sekino, H.; Imou, K.; Yokoyama, S.; Amano,T. Appl. Energy 2010, 87 (7), 2420–2423.
(48) Minowa, T.; Yokoyama, S.; Kishimoto, M.; Okakura, T. Fuel1995, 74 (12), 1735–1738.
(49) Yang, Y. F.; Feng, C. P.; Inamori, Y.; Maekawa, T. Resour.Conserv. Recycl. 2004, 43 (1), 21–33.
(50) De Miguel Mercader, F.; Koehorst, P. J. J.; Heeres, H. J.;Kersten, S. R. A.; Hogendoorn, J. A. AlChE J. 2011, 57, 3160–3170.


![IMPA HTT 2 - pumpfundamentals.com1].pdf · HTT PUMPS POMPE HTT HTT PUMPS POMPE HTT CURVES / CURVE SECTION / SEZIONE DIMENSIONS / DIMENSIONI DI INGOMBRO * Different from the manufacturer](https://img.pdfslide.us/doc/110x75/5a744fdf7f8b9a0d558bb18d/impa-htt-2-1pdfaa-htt-pumps-pompe-htt-htt-pumps-pompe-htt-curves-curve.jpg)