Embed Size (px)
Citation preview

Hydrophobicity measurements of microfiltration andultrafiltration membranesCitation for published version (APA):Keurentjes, J. T. F., Harbrecht, J. G., Brinkman, D., Hanemaaijer, J. H., Cohen Stuart, M. A., & Riet, van 't, K.(1989). Hydrophobicity measurements of microfiltration and ultrafiltration membranes. Journal of MembraneScience, 47(3), 333-344. https://doi.org/10.1016/S0376-7388(00)83084-7
DOI:10.1016/S0376-7388(00)83084-7
Document status and date:Published: 01/01/1989
Document Version:Publisher’s PDF, also known as Version of Record (includes final page, issue and volume numbers)
Please check the document version of this publication:
• A submitted manuscript is the version of the article upon submission and before peer-review. There can beimportant differences between the submitted version and the official published version of record. Peopleinterested in the research are advised to contact the author for the final version of the publication, or visit theDOI to the publisher's website.• The final author version and the galley proof are versions of the publication after peer review.• The final published version features the final layout of the paper including the volume, issue and pagenumbers.Link to publication
General rightsCopyright and moral rights for the publications made accessible in the public portal are retained by the authors and/or other copyright ownersand it is a condition of accessing publications that users recognise and abide by the legal requirements associated with these rights.
• Users may download and print one copy of any publication from the public portal for the purpose of private study or research. • You may not further distribute the material or use it for any profit-making activity or commercial gain • You may freely distribute the URL identifying the publication in the public portal.
If the publication is distributed under the terms of Article 25fa of the Dutch Copyright Act, indicated by the “Taverne” license above, pleasefollow below link for the End User Agreement:www.tue.nl/taverne
Take down policyIf you believe that this document breaches copyright please contact us at:[email protected] details and we will investigate your claim.
Download date: 03. Feb. 2022

Journal of Membrane Science, 47 (1989) 333-344
Elsevier Science Publishers B.V., Amsterdam - Printed in The Netherlands 333
HYDROPHOBICITY MEASUREMENTS OF MICROFILTRATION AND ULTRAFILTRATION MEMBRANES
J.T.F. KEURENTJES’r*, J.G. HARBRECHT’, D. BRINKMAN’, J.H. HANEMAAIJER’z**, M.A. COHEN STUART3 and K. van ‘t RIET’
‘Agricultural University Wageningen, Department of Food Science, Food and Bioengineering Group, De Dreijen 12,6703 BC Wageningen (The Netherlands)
‘NIZO, P. 0. Box 20,671O BA Ede (The Netherlands) 3Agricultural University Wageningen, Department of Physical and Colloid Chemistry, De Dreijen 6,6703 BC Wageningen (The Netherlands)
(Received January 27,1989; accepted in revised form June 21,1989)
Summary
A method for the determination of the hydrophobicity of membrane materials is developed. The advantage of this method over existing methods is that it is not influenced by the presence of the pores. A piece of the membrane material is submerged horizontally in a liquid with surface tension yL. Hydrophobicity is expressed in terms of yd, the surface tension at which an air bubble brought into contact with the top surface of the membrane has a 50% chance of detaching from the surface. Values of yd are expected to be 2-4 mN/m higher than critical surface tension (y=) values found in the literature. For polypropylene, PTFE and polydimethylsiloxane membranes, a good agree- ment was found between ya and yc values. Poly(vinylidene fluoride), polysulfone and polyether- sulfone membranes appeared to be more hydrophilic than was expected on the basis of the liter- ature 7, values for the polymers. Using X-ray photoelectron spectroscopy, constituents that are not present in the pure polymer have been found in the surface of some membranes. These con- stituents and the production techniques are shown to influence the hydrophobicity of the mem- branes investigated.
Introduction
In many membrane processes, the choice of the membrane is based on the pore size of the material. However, for the separation of organic molecules from aqueous solutions in membrane distillation processes [ 1,2], for the separation of dispersions [ 3,4] or for explaining fouling phenomena [ 5,6], this property does not suffice. Interactions of the solvent and solutes with the membrane material will be an important parameter in these processes; therefore, in ad-
*To whom correspondence should be addressed. **Present address: MT-TNO, P.O. Box 108,370O AC Zeist, The Netherlands.
0376-7388/89/$03.50 0 1989 Elsevier Science Publishers B.V.

334
dition to the pore size, the hydrophobicity of the membrane material needs to be known.
Hydrophobicity of a solid material is usually expressed in terms of a contact angle (0) or a critical surface tension. The most widely used method for deter- mination of the contact angle of a liquid (with surface tension yL) on a surface is a direct measurement of 13 using a sessile drop of the liquid on the surface. Because of surface inhomogeneity, either an advancing, receding or equilib- rium contact angle can be determined [7]. The critical surface tension of a solid (7,) is defined as the surface tension at which the contact angle of a liquid just vanishes on that solid [ 8,9], or:
yc’c= lim (&+O)y, (1)
Usually, 8 is measured using different liquids or mixtures of two liquids hav- ing different surface tensions. If cos 0 is plotted versus the surface tension of the liquid (Zisman plot), extrapolation to cos 8= 1 gives the critical surface tension ye [ 91.
Conditions for correct measurement of 8 are a homogeneous and an ideally smooth surface. Because of surface roughness, the observed contact angle may differ significantly from the real contact angle. This is shown schematically in Fig. 1. The only general method to predict the effect of surface roughness on contact angle measurements is based on Wenzel’s theory [lo]. This theory gives a relationship between the advancing contact angle on the smooth sur- face (19,) and the advancing contact angle on a rough surface (e,):
cos e, = rS cos 0, (2)
in which the surface roughness is quantified by rs, the roughness factor, defined as the ratio of the actual to the apparent area of the surface. Several other models have been proposed, however, their use is restricted to special types of surface roughness [ 11-131. The surface roughness of membrane materials is caused by the presence of pores and the roughness of the polymer material, the latter often being in the order of several micrometres [ 21.
Beside surface roughness, capillary forces also play an important role in the determination of the hydrophobicity of a membrane material. Due to capillary forces, a droplet of liquid with yL> l/c can penetrate into a hydrophobic mem- brane, even though it does not spread on a non-porous sheet of the same ma-
Fig. 1. Two different metastable configurations of a liquid drop having the same contact angle 0
on a rough surface.

terial. Using the Laplace equation, a correction for these forces in cylindrical pores can be made. Franken et al. [ 1 ] introduced a pore geometry coefficient to correct for non-cylindrical pores.
A method for the determination of the hydrophobicity of membrane mate- rials should preferably be independent of the presence of pores. For this pur- pose, several existing methods can be taken into consideration. As mentioned before, methods for the direct determination of contact angles are sensitive to surface roughness. Therefore, these methods are of limited interest for the determination of the hydrophobicity of membrane materials. Two methods have been developed specifically to determine the hydrophobicity of porous or inhomogeneous materials. Of practical interest is the penetrating drop method [ 11, although this method is restricted to microporous membranes. Distribu- tion of material over two aqueous polymer phases has proven to be very useful for the determination of hydrophobicity of bacterial material [ 14,151. An ad- vantage of this method is that pore effects can be avoided. This method could perhaps be used for homogenous membranes, but must obviously be excluded for non-woven supported and composite membranes, unless a complete sepa- ration of the skin layer from the backing material can be achieved.
In this study, a method is developed for the determination of the hydropho- bicity of membrane materials. This method is not influenced by the presence of pores, and applies to homogeneous as well as to composite membranes and over a broad range of pore sizes.
Methods
1. Sticking bubble technique Bubble adhesion measurements are carried out as follows. A piece of mem-
brane material (about 1 cm’) is placed horizontally at the bottom of a beaker containing a liquid with surface tension yL. In order to vary yL, water-methanol mixtures are used, giving a range in yL from 23 to 72 mN/m. Using a 10 ~1 syringe (Hamilton, Co. ) with a flat ended needle (horizontal), air bubbles are brought into contact with the surface. The smallest distance between the open end of the needle and the membrane surface is about 0.5 times the bubble diameter. At high values of yL, air bubbles will stick easily to the surface. When the surface tension of the liquid decreases, the adhesion of the air bubbles becomes weaker. Below a certain value of yL, bubbles will not adhere at all because the liquid wets the surface completely (Fig. 2 ). The surface tension at detachment (yd) is determined by plotting the percentage of bubbles which sticks versus yL; a sudden transition is observed at y&
2. X-ray photoelectron spectroscopic measurements Surface analysis on membranes by X-ray photoelectron spectroscopy (XPS)
was performed at AKZO (Arnhem, The Netherlands) using a Vacuum Gen-
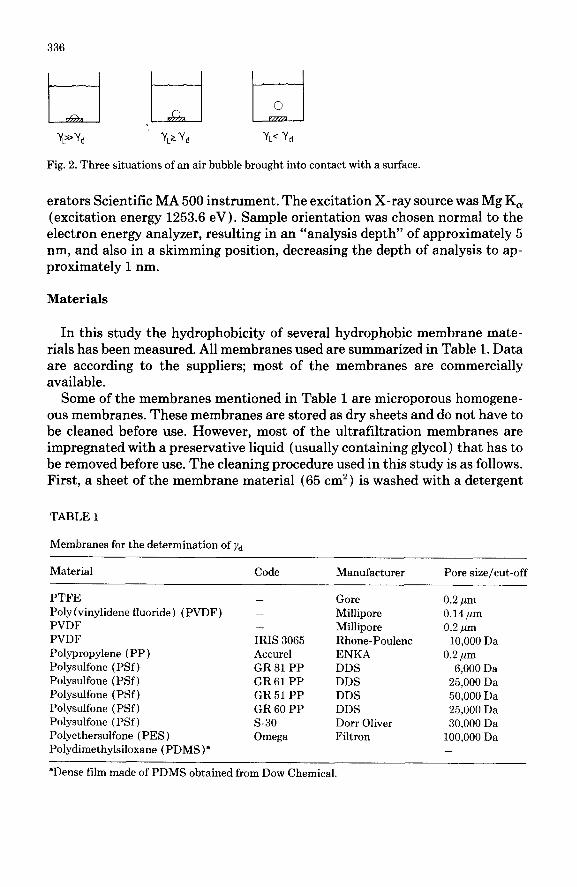
YpY, YLZ Yd YL< Yd
Fig. 2. Three situations of an air bubble brought into contact with a surface.
erators Scientific MA 500 instrument. The excitation X-ray source was Mg K, (excitation energy 1253.6 eV). Sample orientation was chosen normal to the electron energy analyzer, resulting in an “analysis depth” of approximately 5 nm, and also in a skimming position, decreasing the depth of analysis to ap- proximately 1 nm.
Materials
In this study the hydrophobicity of several hydrophobic membrane mate- rials has been measured. All membranes used are summarized in Table 1. Data are according to the suppliers; most of the membranes are commercially available.
Some of the membranes mentioned in Table 1 are microporous homogene- ous membranes. These membranes are stored as dry sheets and do not have to be cleaned before use. However, most of the ultrafiltration membranes are impregnated with a preservative liquid (usually containing glycol) that has to be removed before use. The cleaning procedure used in this study is as follows. First, a sheet of the membrane material (65 cm2) is washed with a detergent
TABLE I
Membranes for the determination of yd
Material
PTFE Poly (vinylidene fluoride ) ( PVDF ) PVDF PVDF Polypropylene (PP) Polysulfone ( PSf ) Polysulfone ( PSf ) Polysulfone ( PSf ) Polysulfone ( PSf) Polysulfone ( PSf)
Polyethersulfone (PES) Polydimethylsiloxane (PDMS)”
Code Manufacturer
- Gore - Millipore - Millipore IRIS 3065 Rhone-Poulenc Accurel ENKA GR 81 PP DDS GR 61 PP DDS GR 51 PP DDS GR 60 PP DDS s-30 Dorr Oliver Omega Filtron
Pore size/cut-off
0.2 ,um 0.14,um 0.2 ,um
10,000 Da 0.2 pm
6,000 Da 25,000 Da 50,000 Da 25,000 Da 30,000 Da
100,000 Da -
“Dense film made of PDMS obtained from Dow Chemical.

337
solution (1% SDS). Next, 20 1 of doubly distilled water is filtered through the membrane. Then the material is dried at 40’ C, and is ready for use.
All experiments are carried out at 20’ C. The water used is doubly distilled, and the methanol (analytical grade) was obtained from Merck (F.R.G.). Be- fore each experiment the water-methanol mixtures are freshly prepared. Udel polysulfone is obtained from Union Carbide Corp. (CU 4750) and polyether- sulfone from ICI (4800 G) .
Theory
We consider the simple case of a bubble with spherical contour attached to the surface with contact angle &, as shown in Fig. 3. At the point of detach- ment, the vertical component of the adhesion forces exactly compensates the gravitational forces:
Vdpg = 2nry, sin 6, (3)
where V is the air bubble volume, g the acceleration due to gravity, Ap the difference between liquid and air density, r the radius of the contact plane and yd the surface tension of the liquid at the point of detachment. The radius r is given by:
r=R sin 0, (4)
Since part of the sphere is only virtually present, the volume of the bubble ( V) is:
V=nR3($+ co&+os”&) (5)
Combining eqns. (3), (4) and (5) gives the surface tension (yd) of the liquid at which the bubble just will detach:
yd=
ApgR2($+ cos 6,-i cos3 0,) 2 sin2 0,
(6)
From eqn. (6) 0, can be calculated. Since air bubbles attached to a surface tend to deform (to an extent depend-
ing on their size), the approximation of a spherical bubble is not entirely cor- rect. The curvature at the bottom of the bubble is less than for the spherical case, and the contact angle with the surface changes from 0, to 8, while r re- mains the same. For this case (Fig. 4) one can write [ 161:
Vdpg=2nryd[sin e,- (R/b) sin e,] where b is the radius of curvature at the top of the bubble. In the case where R w b, eqn. (7) simplifies to:
v&g= 2xryd (sin 8, - sin 02) (3)

338
Fig. 3. The air bubble-liquid-membrane system in the case of an air bubble with spherical contour.
Fig. 4. The air bubble-liquid-membrane system in the case of a deformed air bubble.
It should be noted that R TZ b does not imply that the bubble is spherical. The deformation at the top of the bubble can be small with respect to that at the bottom. It was also shown in Ref. [ 161 that this approximation gives good agreement between experimental and theoretical results for & smaller than 30”.
Combining eqns. (5) and (8) gives the following expression for the calcu- lation of 8,:
sine=dp6R2(3+cose2-fcos3e2)+sine 1 2yd sin e2 2 (9)
Results and discussion
Exact determination of the surface tension at which there are just no bubbles that stick to the surface proved to be difficult. This might be caused by inhom- ogenities of the surface. Therefore, yd is (arbitrarily) chosen as the surface tension at which 50% of the bubbles brought into contact with the surface adheres. Graphically, this point can be determined as shown for the 0.2 pm polypropylene membrane in Fig. 5. Each point of this curve is determined by bringing 20 air bubbles into contact with the membrane surface. The standard deviation in the points around the 50% value is 4%, resulting in an accuracy of 0.2 mN/m in the 50% value.
As the air bubble size detaching from the needle end decreases with decreas- ing surface tension of the liquid, calculations have to be carried out with a different bubble radius R (and density pL) for each liquid mixture. In Table 2 the results are summarized. The values of 0, and 8, are calculated from eqns. (6) and (9), respectively. Values for JJ~ are obtained from Ref. [ 171, and were measured on a flat non-porous sheet of the pure polymer.

% sticking bubbles
30
y,(mN/m ) yL (mN/m)
Fig. 5. Percentage of air bubbles brought into contact with the surface of a 0.2 pm PP membrane that becomes attached, versus the surface tension of the liquid.
Fig. 6. Contact angle of droplets of water-butanol mixtures on graphite. Data are from Ref. [ 181.
TABLE 2
Results from hydrophobicity measurements for different hydrophobic membranes
Membrane ~~,kg/m~ R, 10e4 m Yd,mN/m L mN/m %, deg 6, deg
PP 853 PVDF 0.2 pm 924 PVDF 0.14 pm 922 PVDF IRIS 3065 941 PTFE 805 PSf GR 51 PP 990 PSf GR 61 PP 1000 PSf GR 81 PP 973 PSf GR 60 PP 1000 PSf s-30 992 PES 1000 PDMS 807
4.7 5.2 5.1 5.3 4.6 5.9 -
5.6 -
6.0
4.6
29.5 29-34 11.9 24.3 42.4 25 11.2 22.9 41.3 25 11.3 23.0 47.0 25 11.1 22.6 24.2 16-22 12.3 25.2 65.0 41 10.7 21.9
>72 41 -
56.3 41 10.9 22.2 > 72 41 -
66.8 41 10.7 21.8 > 72 a -
24.5 24.2 12.2 25.1
“No value found in literature; yd on bulk material 56.3 mN/m
Plotting a number of contact angle data given by Fowkes [ 181 for water- butanol droplets on graphite (Fig. 6) reveals that the difference in yL between 8= 25’ and 13= 0’ is of the order of l-2 mN/m. Since yC is defined at 0= 0 ’ it is clear that values of yd should be 1-2 mN/m higher than yC values. Together with the systematic error introduced by taking the 50% adhesion value instead of 0% (which is also of the order of l-2 mN/m), it can be concluded that yd values obtained with this method are expected to be 2-4 mN/m higher than l/C values found in literature.
Table 2 shows that the results obtained for PP. PDMS and PTFE mem-

340
branes show a fairly good agreement between ?/d and yC values. However, the other membrane materials show measured yd values more than 2-4 mN/m above the l/c values reported in the literature. We now discuss possible reasons for these discrepancies.
PVDF membranes XPS measurements performed on the PVDF IRIS 3065 ultrafiltration mem-
brane clearly show the presence of oxygen and nitrogen in the top layer of the membrane (Table 3 ). From these results it may be concluded that, at least, the IRIS 3065 PVDF membrane surface has some constituents that may make the membrane more hydrophilic than the pure polymer.
Microporous PVDF membranes (obtained from ENKA AG) have been in- vestigated by Franken [l] using the penetrating drop method. He found a value for yp of about 38 mN/m, i.e. 13 mN/m above the yC value and in agree- ment with our results. The same method applied to polypropylene membranes gives y*z 29 mN/m, in good agreement with the yC value (29-34 mN/m) and our results. It might therefore be concluded from these results that the high values found for PVDF membranes, as compared to bulk PVDF, are an inher- ent property of the membrane surface, rather than an artifact introduced by the method.
Polysulfone membranes Measurements were carried out on pure bulk PSf and PES (grains and
sheets). Values for yd of 48.8 and 56.3 mN/m, respectively, were obtained. The yC value reported for PSf is 41 mN/m. This value indicates that, on somewhat more hydrophilic materials, the deviation between yd and yC might be larger (although only one reference for yC data was found). The value found for the polysulfone membranes is more than 15 mN/m above the yC value in the lit- erature. For both PSf and PES we found yd on membranes more than 7 mN/m higher than the value obtained by us on the pure polymer. Possible explanations for this phenomenon are (i) constituents that are present in the
TABLE 3
Atomic ratios found by XPS measurements of the PVDF IRIS 3065 ultrafiltration membrane
Atom Theor. Depth of analysis
5nm 1 nm
C 50 57.6 60.6
F 50 29.1 26.1
0 0 7.1 7.9
N 0 5.6 5.3

341
membrane material but not in the pure polymer and (ii) conformational changes induced by the production method.
(i) From XPS measurements carried out on the DDS PSf membranes (Ta- ble 4), it can be concluded that the GR 51,61 and 81 membranes seem to be made of the same material (Udel polysulfone), which was shown before and confirmed by the manufacturer [ 191. Oxygen and nitrogen are obviously more abundant than would be expected on the basis of atomic ratios in the pure polymer. It therefore seems plausible that the membrane surface is more hy- drophilic, although it is impossible to quantify this effect. The nitrogen and oxygen may come from dimethylformamide (DMF) used as a solvent in the production [ 201.
(ii) Conditions during production used for polysulfone membranes (made by phase inversion techniques) may also influence the value of yd. We checked this as follows. Membranes of the pure Udel polysulfone or polyethersulfone were made by spreading a viscous solution of PSf in DMF on a polypropylene sheet. This sheet was submerged in water and rinsed with water. It was found, that, by varying polymer concentrations and the time of exposure to air before immersion, measured values for l/d varied between 49 and 72 mN/m for PSf and between 56 and 72 mN/m for PES. This is probably due to surface-induced conformational changes of the polymer, which are “frozen in” at a particular stage of the phase inversion process. This kind of induced orientation of poly- mers has been reported by Ray et al. [21] and Lee [22]. It can therefore be concluded that, eventhough membranes are made of the same polymeric ma- terial, hydrophobicity may vary significantly with conditions during production.
The effect of surface roughness can be estimated using eqns. (6) and (9). The effect of a rough surface will be expressed in a longer contact line than the same bubble will have on a flat surface. Therefore 0, and 8, have been calcu- lated for a flat surface for which the contact line is doubled. The results for the two extremes (PFTE and PSf) are given in Table 5. Obviously, on a rough surface, the values for the contact angles are smaller than those on a smooth
TABLE 4
Atomic ratios as determined by XPS (1 nm) for the DDS PSf GR 51,61 and 81 membranes; the theoretical ratio is given for Udel polysulfone and Victrex polyethersulfone
Atom Theoretical GR 51 GR 61 GR 81
C 0 S N
Udel Victrex
84.5 75.0 12.5 18.75 3.0 6.25 0 0
82.5 81.6 82.6 13.8 14.9 13.2 3.0 2.3 2.2 0.7 1.1 2.0

342
TABLE 5
Calculated effect of surface roughness on 0, and 0,; the effect of roughness is introduced by mul- tiplying the length of the contact line on the flat surface by an arbitrary factor of 2.
Membrane yd
Rough
4
Smooth
02
PTFE 24.2 8.6 17.5 12.3 25.2 PSf GR 51 PP 65.0 7.6 15.3 10.7 21.9
surface. However, the lower the contact angle at the point of detachment, the closer the value of l/d will approach the value of l/o as can be seen in Fig. 6. From this it may be concluded that values of yd obtained on a rough surface are even closer to the values of yc than values obtained on a smooth surface. Therefore, yd values measured on membranes will differ by less than 2-4 mN/ m from l/c values measured on smooth surfaces.
Conclusions
In this study a method has been developed to measure hydrophobicity of porous materials, such as membranes, which is not influenced by the presence of the pores. Hydrophobicity is expressed in terms of yd, the surface tension at which an air bubble has a 50% chance of detaching from the surface. Values of yd may be compared with ‘yc values found in literature, although the present method gives values that are expected to be 2-4 mN/m higher. By means of XPS, it has been found that some membrane surfaces are representative of the pure polymer, whereas others have surface atomic compositions which differ from those of the pure polymer, perhaps due to trace contaminants. This may be the reason why some membranes are more hydrophilic than might be ex- pected on the basis of the chemistry of the pure polymer. It was also found that, for PSf membranes, the conditions during production have a large effect on the hydrophobicity of the membrane surface.
Acknowledgement
The authors wish to thank the Dutch Program Committee for Industrial Biotechnology (PCIB ) for their financial support.
List of symbols
YL liquid surface tension [N-m-l]
Yc critical surface tension [N-m-’ ]
yd surface tension at detachment [N-m-’ ]
YP surface tension at penetration [N-m-l]

343
contact angle [ ’ ] contact angle of a spherical air bubble [ ’ ] contact angle of a deformed air bubble [ ’ ] advancing contact angle on a rough surface [ o ] advancing contact angle on a smooth surface [ ’ ] density difference between liquid and gas [kg-m-3] liquid density [ kg-mm31 air bubble volume [ m3 ] acceleration due to gravity [m-secV2] contact plane radius [m] air bubble radius [m] radius at the top of a deformed air bubble [m] surface roughness factor [ - ]
References
1
2 3
4
5
6
7
8
9
10
11
12
13
14
15
A.C.M. Franken, J.A.M. Nolten, M.H.V. Mulder, D. Bargeman and C.A. Smolders, Wetting criteria for the applicability of membrane distillation, J. Membrane Sci., 33 (1987) 315. K. Schneider and T.J. van Gassel, Membrane distillation, Chem.-Ing.-Tech., 56 (1984) 514. F. Vigo, C. Uliana and P. Lupino, The performance of a rotating module in oily emulsions ultrafiltration, Sep. Sci. Technol., 20 (1985) 213. J.T.F. Keurentjes, W. Pronk, G.I. Doornbusch and K. van ‘t Riet, Downstream processing of fatty acid/lipid mixtures using membranes, Proc. Second Ann. Nat. Meet. North American Membrane Sot., Syracuse, NY, June l-3,1988. R.E. Baier, Modification of surfaces to reduce fouling and/or improve cleaning. Proc. Work- shop, Fundamentals and Applications of Surface Phenomena associated with Fouling and Cleaning in Food Processing, Tyliisand, Halmstad, Sweden, April 6-9, 1981. M. Fontyn, B.H. Bijsterbosch and K. van ‘t Riet, Chemical characterization of ultrafiltration membranes by spectroscopic techniques, J. Membrane Sci., 36 (1988) 141. C.G.L. Furmidge, Studies at phase interphases. I. The sliding of liquid drops on solid surfaces and a theory for spray retention, J. Colloid Sci., 17 (1962 ) 309. H.W. Fox and W.A. Zisman, The spreading of liquids on low-energy surfaces. I. Polytetra- fluoroethylene, J. Colloid Sci., 5 (1950) 514. W.A. Zisman, Relation of the equilibrium contact angle to liquid and solid constitution, Adv. Chem. Ser., 43 (1964) 1. R.N. Wenzel, Resistance of solid surfaces to wetting by water, Ind. Eng. Chem., 28 (1936) 988. H.J. Busscher, A.W.J. van Pelt, P. de Boer, H.P. de Jong and J. Arends, The effect of surface roughening of polymers on measured contact angles of liquids, Colloids Surf., 9 (1984) 319. R.E. Johnson and R.H. Dettre, Contact angle hysteresis. I. Idealized rough surface, Adv. Chem. Ser., 43 (1964) 112. J.F. Oliver, C. Huh and S.G. Mason, An experimental study of some effects of solid surface roughness on wetting, Colloids Surf., 1 (1980) 79. M.C.M. van Loosdrecht, J. Lyklema, W. Norde, G. Schraa and A.J.B. Zehnder, The role of bacterial cell wall hydrophobicity in adhesion, Appl. Environ. Microbial., 53 (1987) 1893. D.F. Gerson and J. Akit, Cell surface energy, contact angles and phase partition. II. Bacterial cells in biphasic aqueous mixtures, Biochim. Biophys. Acta., 602 (1980) 281.

344
16 B. Janczuk, Detachment force of air bubble from the solid surface (sulfur or graphite) in
water, J. Colloid Interface Sci., 93 (1983) 411. 17 E.G. Shafrin, in: J. Brandrup and E.H. Immergut (Eds.), Polymer Handbook, Wiley and
Sons, New York, NY, 2nd edn., 1975, p. 111-221. 18 F.M. Fowkes and W.D. Harkins, The state of monolayers adsorbed at the interface solid-
aqueous solution, J. Amer. Chem. Sot., 62 (1940) 3377.
19 J.H. Hanemaaijer, T. Robbertsen, T.H. van de Boomgaard and J.W. Gunnink, Fouling of
ultrafiltration membranes. The role of protein adsorption and salt precipitation, J. Mem-
brane Sci., 40 (1989) 199.
20 M. Fontyn, K. van ‘t Riet and B.H. Bijsterbosch, to be published.
21 B.R. Ray, J.R. Anderson and J.J. Scholz, Wetting of polymer surfaces. I. Contact angles of
liquids on starch, amylose, amylopectin, cellulose and polyvinyl alcohol, J. Phys. Chem., 62
(1958) 1220. 22 L.H. Lee, Adhesion of high polymers. II. Wettability of elastomers, J. Polym. Sci., Part A-2,
5 (1967) 1103.