Embed Size (px)
Citation preview
Journal of Minerals and Materials Characterization and Engineering, 2018, 6, 271-293 http://www.scirp.org/journal/jmmce
ISSN Online: 2327-4085 ISSN Print: 2327-4077
DOI: 10.4236/jmmce.2018.63020 May 4, 2018 271 J. Minerals and Materials Characterization and Engineering
Hydrometallurgical Processing of a Nigerian Galena Ore in Nitric Acid: Characterization and Dissolution Kinetics
Ikechukwu A. Nnanwube*, Okechukwu D. Onukwuli
Department of Chemical Engineering, Nnamdi Azikiwe University, Awka, Nigeria
Abstract
The physico-chemical characterization and dissolution kinetics study of a Ni-gerian galena ore in nitric acid has been undertaken. The effects of acid con-centration, temperature, particle size, stirring speed and solid/liquid ratio on the leaching of galena were investigated. The X-ray fluorescence data showed that the galena ore used in the study exists mainly as PbS. Lead (Pb) was de-tected as the major metal for galena with metals such as Na, Ca, Fe, Zn, Al and Mg occurring as minor elements. The XRD analysis also confirmed the origi-nality of the galena ore as it revealed that galena exists mainly as lead sulphide (PbS). The Fourier transform infrared (FTIR) analysis also supported the XRF and XRD analysis by revealing the presence of sulphur in the ore. The scan-ning electron micrograph (SEM) analysis revealed a high level of crystallinity of the ore. Results of the leaching studies showed that galena dissolution in nitric acid (HNO3) increases with increasing concentration of nitric acid, temperature and stirring rate, and decreases with increasing particle diameter and solid/liquid ratio. In 10 M HNO3 at a temperature of 90˚C using 75 µm particle diameter with solid/liquid ratio of 20 g/L and stirring speed of 540 rpm, about 84.5% of galena was dissolved in 150 minutes. The values of acti-vation energy, order of reaction and Arrhenius constant calculated at the con-ditions above for galena were 27.01 KJ/mol, 0.93, 26.71 s−1 respectively. The mechanism of dissolution of galena was established to follow the shrinking core model for the diffusion controlled mechanism, with surface chemical reaction as the rate controlling step for the leaching process. Finally, the XRD analysis of the post-leaching residue revealed the presence of gahnite and an-glesite.
Keywords
Galena, Nigeria, Characterization, Leaching, Dissolution Kinetics, Nitric Acid
How to cite this paper: Nnanwube, I.A. and Onukwuli, O.D. (2018) Hydrometal-lurgical Processing of a Nigerian Galena Ore in Nitric Acid: Characterization and Dissolution Kinetics. Journal of Minerals and Materials Characterization and Engi-neering, 6, 271-293. https://doi.org/10.4236/jmmce.2018.63020 Received: March 1, 2018 Accepted: May 1, 2018 Published: May 4, 2018 Copyright © 2018 by authors and Scientific Research Publishing Inc. This work is licensed under the Creative Commons Attribution International License (CC BY 4.0). http://creativecommons.org/licenses/by/4.0/
Open Access
I. A. Nnanwube, O. D. Onukwuli
DOI: 10.4236/jmmce.2018.63020 272 J. Minerals and Materials Characterization and Engineering
1. Introduction
Galena, also called lead glance, is the natural mineral form of lead (II) sulphide. It is the most important ore of lead and an important source of silver. It is one of the most abundant and widely distributed sulphide minerals. It crystallizes in the cubic crystal system often showing octahedral forms. It is often associated with the minerals sphalerite, calcite and fluorite [1].
In general, many occurrences of the lead and zinc ores are known in Nigeria, Such as those of Ameka, Ameri and Enyigba near Abakaliki, at Benue and Zurak to name only few. It is estimated that there are at least 30 lodes within an aggre-gate length of about 600 m as detailed [2] [3].
Lead metal has several useful mechanical properties, including high density, low melting point, ductility, and relative inertness [4]. Lead has been used for bullets since their invention in the middle ages. It is inexpensive; its low melting point means small arms ammunition and shot gun pellets can be cast with mi-nimal technical equipment; and it is denser than other common metals, which allows for better retention of velocity.
Its high density and resistance to corrosion have been exploited in a number of related applications. It is used as ballast in sailboat kneels [5]. Its weight al-lows it to counterbalance the heeling effect of wind on the sails; being so dense it takes up a small volume and minimizes water resistance. It is used in Scuba di-ving weight belts to counteract the diver’s buoyancy [6]. Because of its corrosion resistance, lead is used as a protective sheath for underwater cables [7].
In general, the recovery of lead from galena via a hydrometallurgical route has been studied by several investigators under various chemical conditions. A hy-drometallurgical alternative has been sought because of the growing concern about the adverse environmental impact of high-temperature processing of ga-lena as detailed by Feurstenau et al. [8]. A detailed review of some previous stu-dies on the characterization and dissolution kinetics of galena varieties in acid and oxidative reagents is presented in the following sections.
1.1. Galena Ore Characterization
Several studies on the characterization of galena ore have been carried out in the recent past. Some of the reported results on the composition of galena from dif-ferent parts of the world are summarized in Table 1.
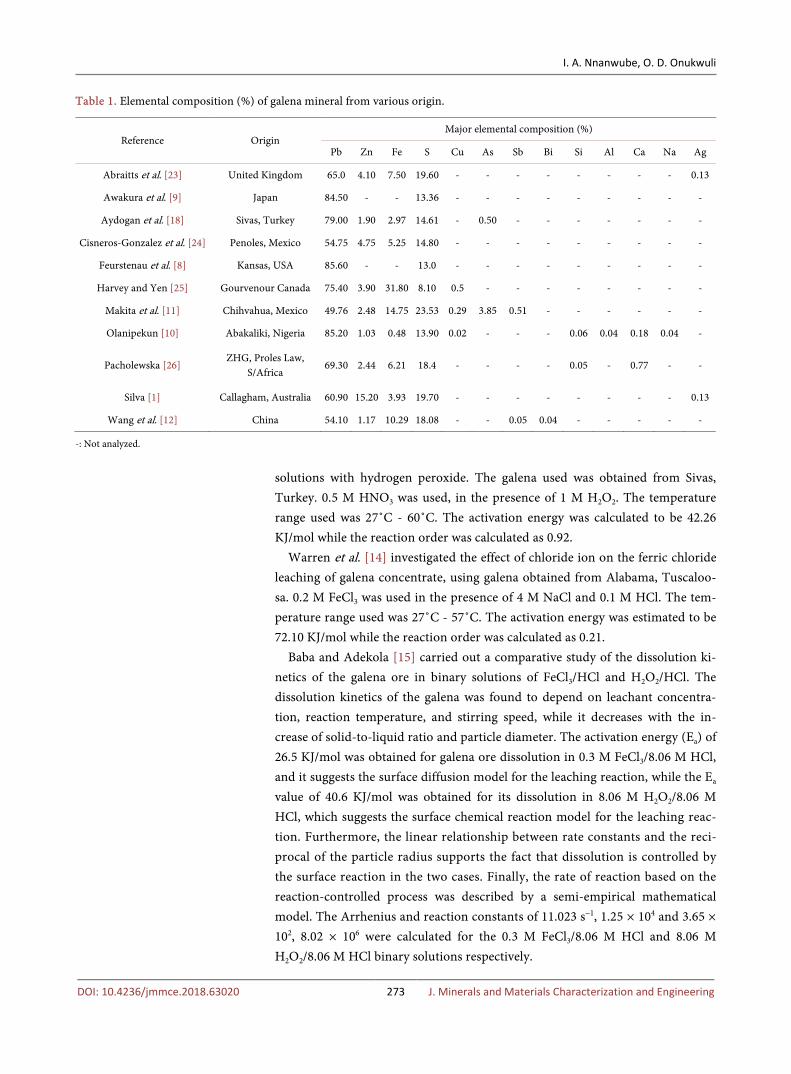
Galena is composed of lead as a dominant metal followed by sulphur, iron and zinc in that order. The composition of galena varies from one location to anoth-er. The different values can be accounted for by the variation in geochemical and environmental effects. The richest galena was found in Japan as reported by Awakura et al. [9], Nigeria: Olanipekun [10] and USA: Feurstenau et al. [8]; while the poorest was in Mexico: Makita et al. [11] and China: Wang et al. [12].
1.2. Galena Dissolution Kinetic Studies
Aydogan et al. [13] investigated the kinetics of galena dissolution in nitric acid
I. A. Nnanwube, O. D. Onukwuli
DOI: 10.4236/jmmce.2018.63020 273 J. Minerals and Materials Characterization and Engineering
Table 1. Elemental composition (%) of galena mineral from various origin.
Reference Origin Major elemental composition (%)
Pb Zn Fe S Cu As Sb Bi Si Al Ca Na Ag
Abraitts et al. [23] United Kingdom 65.0 4.10 7.50 19.60 - - - - - - - - 0.13
Awakura et al. [9] Japan 84.50 - - 13.36 - - - - - - - - -
Aydogan et al. [18] Sivas, Turkey 79.00 1.90 2.97 14.61 - 0.50 - - - - - - -
Cisneros-Gonzalez et al. [24] Penoles, Mexico 54.75 4.75 5.25 14.80 - - - - - - - - -
Feurstenau et al. [8] Kansas, USA 85.60 - - 13.0 - - - - - - - - -
Harvey and Yen [25] Gourvenour Canada 75.40 3.90 31.80 8.10 0.5 - - - - - - - -
Makita et al. [11] Chihvahua, Mexico 49.76 2.48 14.75 23.53 0.29 3.85 0.51 - - - - - -
Olanipekun [10] Abakaliki, Nigeria 85.20 1.03 0.48 13.90 0.02 - - - 0.06 0.04 0.18 0.04 -
Pacholewska [26] ZHG, Proles Law,
S/Africa 69.30 2.44 6.21 18.4 - - - - 0.05 - 0.77 - -
Silva [1] Callagham, Australia 60.90 15.20 3.93 19.70 - - - - - - - - 0.13
Wang et al. [12] China 54.10 1.17 10.29 18.08 - - 0.05 0.04 - - - - -
-: Not analyzed.
solutions with hydrogen peroxide. The galena used was obtained from Sivas, Turkey. 0.5 M HNO3 was used, in the presence of 1 M H2O2. The temperature range used was 27˚C - 60˚C. The activation energy was calculated to be 42.26 KJ/mol while the reaction order was calculated as 0.92.
Warren et al. [14] investigated the effect of chloride ion on the ferric chloride leaching of galena concentrate, using galena obtained from Alabama, Tuscaloo-sa. 0.2 M FeCl3 was used in the presence of 4 M NaCl and 0.1 M HCl. The tem-perature range used was 27˚C - 57˚C. The activation energy was estimated to be 72.10 KJ/mol while the reaction order was calculated as 0.21.
Baba and Adekola [15] carried out a comparative study of the dissolution ki-netics of the galena ore in binary solutions of FeCl3/HCl and H2O2/HCl. The dissolution kinetics of the galena was found to depend on leachant concentra-tion, reaction temperature, and stirring speed, while it decreases with the in-crease of solid-to-liquid ratio and particle diameter. The activation energy (Ea) of 26.5 KJ/mol was obtained for galena ore dissolution in 0.3 M FeCl3/8.06 M HCl, and it suggests the surface diffusion model for the leaching reaction, while the Ea value of 40.6 KJ/mol was obtained for its dissolution in 8.06 M H2O2/8.06 M HCl, which suggests the surface chemical reaction model for the leaching reac-tion. Furthermore, the linear relationship between rate constants and the reci-procal of the particle radius supports the fact that dissolution is controlled by the surface reaction in the two cases. Finally, the rate of reaction based on the reaction-controlled process was described by a semi-empirical mathematical model. The Arrhenius and reaction constants of 11.023 s−1, 1.25 × 10⁴ and 3.65 × 10², 8.02 × 10⁶ were calculated for the 0.3 M FeCl3/8.06 M HCl and 8.06 M H2O2/8.06 M HCl binary solutions respectively.
I. A. Nnanwube, O. D. Onukwuli
DOI: 10.4236/jmmce.2018.63020 274 J. Minerals and Materials Characterization and Engineering
Liu et al. [16] studied the acidic, non-oxidative dissolution of galena (PbS) nanocrystals using transmission electron microscopy (TEM) to follow the evolu-tion of the size and shape of the nanocrystals before and after dissolution expe-riments, X-ray photoelectron spectroscopy (XPS) to follow particle chemistry, and dissolution rate analysis to compare dissolution rates between nanocrystal-line and bulk galena. Dissolution characteristics were also studied as a function of nanocrystals access to bulk versus confined solution due to the degree of proximity of next-nearest grains. Detailed XPS analysis showed the nanocrystals to be free of unwanted contamination, surface complexes, and oxidative arti-facts, except for small amounts of lead-containing oxidation species in both pre- and post-dissolution samples which have been observed in fresh, natural bulk galena.
According to Gerson and O’Dea [17], surface species found on galena during oxidation and dissolution has been studied using many techniques. It has been assumed that complexation takes place at the surface of hydrous galena sul-phides. The adsorption of H+ ions onto a surface of the S atom in the aqueous phase is found to be favourable, whereas the adsorption unto the surface of Pb atom is not favourable as suggested by Aydogan et al. [18]. In view of the above reasons, the dissolution rates are often analyzed with the shrinking core models which state that the leaching process is controlled by:
1) the diffusion of the reactant through the solution boundary layer or through a solid product layer; or
2) by the rate of chemical reaction; or 3) by mixed controlled process, which are chemical and diffusion controlled
reactions as reported by Baba [19], Levenspiel [20] and Merwe [21]. Therefore, understanding the mechanism of a leaching system is an important
aspect of this work, while a knowledge of the kinetics of the rate controlling process and solid reaction products are crucial for a complete understanding of the system as evidenced by Aydogan et al. [18].
The non-oxidative leaching of the base metal sulphide ore including galena in acidic solution, releasing hydrogen sulphide has been studied in various labora-tories and tested in pilot plants as demonstrated by Awakura et al. [9].
Generally, there are insufficient kinetic studies to explain the complete me-chanism of the dissolution of galena in nitric acid solution in the literature. Most of the available dissolution studies did not address some basic important kinetic parameters such as reaction order, activation energy, Arrhenius factors and cor-relation constant. This often makes the proposition of the dissolution mechan-ism difficult. Results of selected kinetic studies on galena dissolution extracted from literature are summarized in Table 4.
It is evident from Table 4 that most of the kinetics parameters necessary for the prediction of the actual dissolution mechanism (activation energy, reaction order, residual product, etc.) were lacking and thus making the mechanism proposition to be ambiguously difficult. Consequently, the scope of this investi-
I. A. Nnanwube, O. D. Onukwuli
DOI: 10.4236/jmmce.2018.63020 275 J. Minerals and Materials Characterization and Engineering
gation is to address these problems. Due to the increased demand for lead in Nigeria and other developing countries of the world, there is the need to develop simple and practicable routes for the recovery of this valuable metal from Nige-rian galena ore which is among the richest in the world [22].
2. Materials and Methods
The galena ore used for this study was collected from Abakaliki, Enyigba mining site in Ebonyi State of Nigeria. The galena ore was finely pulverized and sieved into five fractions: 75, 106, 212, 300, and 425 µm. All experiments were per-formed with 75 µm fraction except otherwise stated. Solutions of HNO3 were prepared from analytical grade reagents with deionized water.
2.1. Characterization of the Ore
2.1.1. Spectrophotometric Analysis The X-ray fluorometer (XRF), X-supreme 600 oxford instruments was used for the elemental analysis of the ore. The mineralogical analysis of the ore was done using ARL X’TRA X-ray Diffractometer, Thermoscientific with the serial num-ber 197492086 and Empyrean by PanAnalytical model with CuKα (1.54 Å) radi-ation generated and 40 mA and 45 kV. This unit comprises of a single compact cabinet. The cabinet houses a high speed, high precision Goniometer; high effi-ciency generator (X-ray) and an automatic sample loading facility.
The petrographic slides of galena ore were prepared using Epoxy and Lakeside 70 media according to the method of Hutchison [27].
2.1.2. FTIR and SEM Analysis FTIR analysis was carried out using Buck Scientific M530 Infrared Spectropho-tometer. SEM analysis was carried out using Q250 by FEI model from the Neth-erlands.
2.2. Leaching Procedure
Leaching experiments were performed in a 500 ml glass reactor fitted with a condenser to prevent losses through evaporation. The two major variables (heat and stirring rate) necessary for accelerating the rate of chemical reaction was provided by the aid of a magnetically-stirred hot plate (Model 78HW-1). For every leaching experiment, the solution mixture was freshly prepared by dis-solving 20 g/L of the ore sample in the acid solution at 90˚C. The concentration which gave the maximum dissolution was subsequently used to study other leaching parameters including temperature and particle size. At the end of each reaction time, the undissolved materials in the suspension was allowed to settle and separated by filtration. The resulting solutions were diluted and analyzed for lead using atomic absorption spectrophotometer (AAS).
The mole fraction of lead passing into the solution from galena was calcu-lated by the formula given in Equation (1), where x designates quantity dis-solution.
I. A. Nnanwube, O. D. Onukwuli
DOI: 10.4236/jmmce.2018.63020 276 J. Minerals and Materials Characterization and Engineering
Amount of Pb passing into the solutionAmount of Pb in original sample
x = (1)
The activation energy, aE , and rate constants were evaluated from the Arr-henius plots. The post-leached residues after dissolution in the optimum condi-tions were subjected to XRD and SEM examination.
3. Results and Discussion
3.1. Results of Characterization Studies
3.1.1. Elemental Composition by XRF The results of the elemental composition of galena by X-ray fluorescence tech-nique showed that the galena mineral exist mainly as PbS with metals such as Na, Mg, Al, Ca, Fe and Zn occurring as minor elements, and K, Cr, and Sr as traces. The elemental analysis gave Pb (60.01%), S (14.66%), Fe (4.32%), Na (3.78%), Si (7.69%), Mg (1.21%), Al (1.94%), P (1.37%), Cl (1.19%), K (0.09%), Ca (1.99%), Cr (0.01%), Mn (0.49%), Zn (1.22%), and Sr (0.04%).
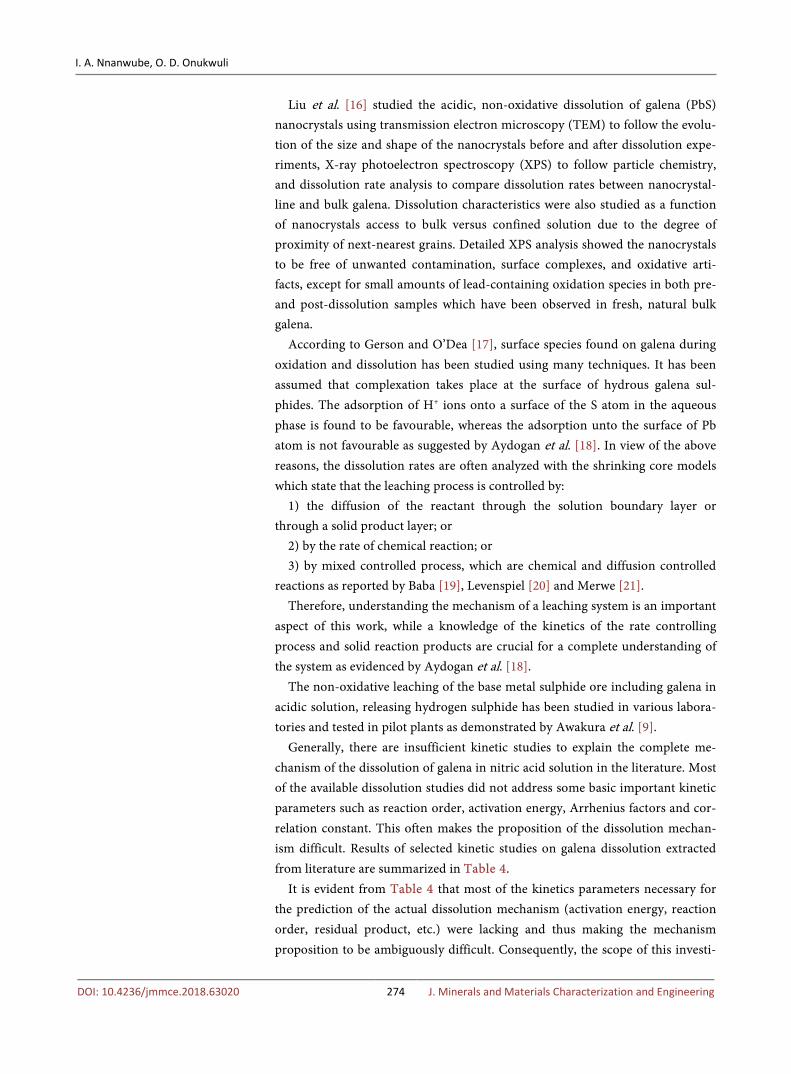
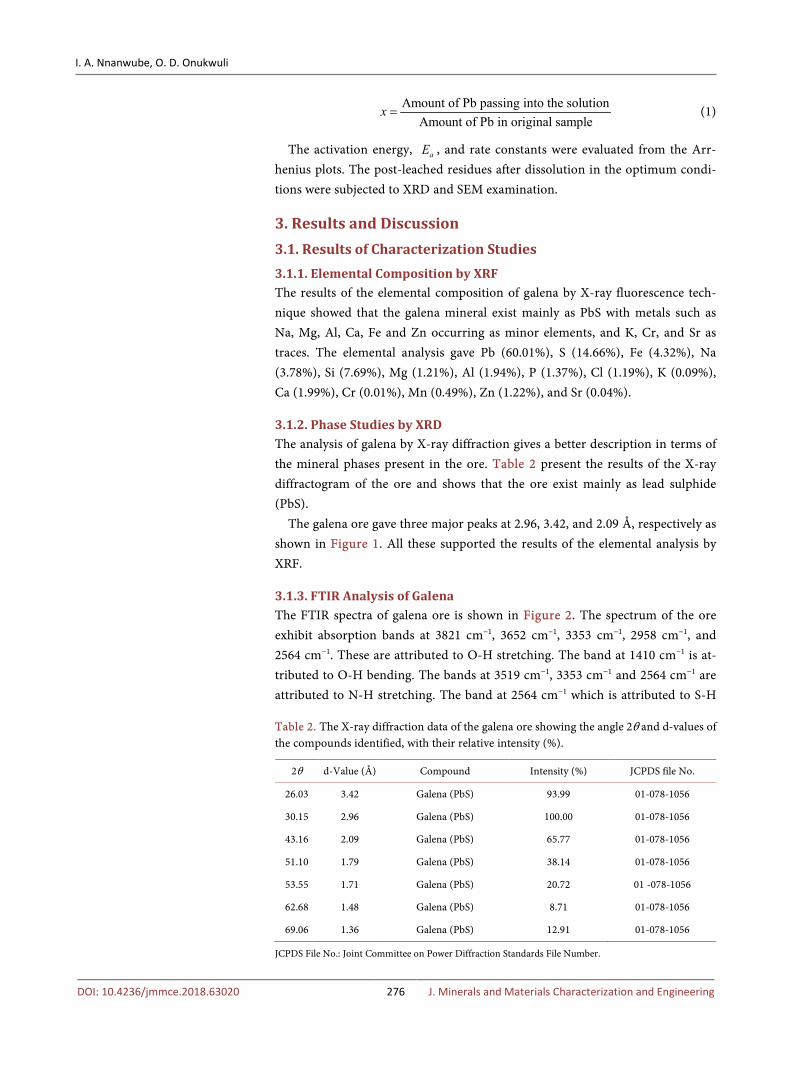
3.1.2. Phase Studies by XRD The analysis of galena by X-ray diffraction gives a better description in terms of the mineral phases present in the ore. Table 2 present the results of the X-ray diffractogram of the ore and shows that the ore exist mainly as lead sulphide (PbS).
The galena ore gave three major peaks at 2.96, 3.42, and 2.09 Å, respectively as shown in Figure 1. All these supported the results of the elemental analysis by XRF.
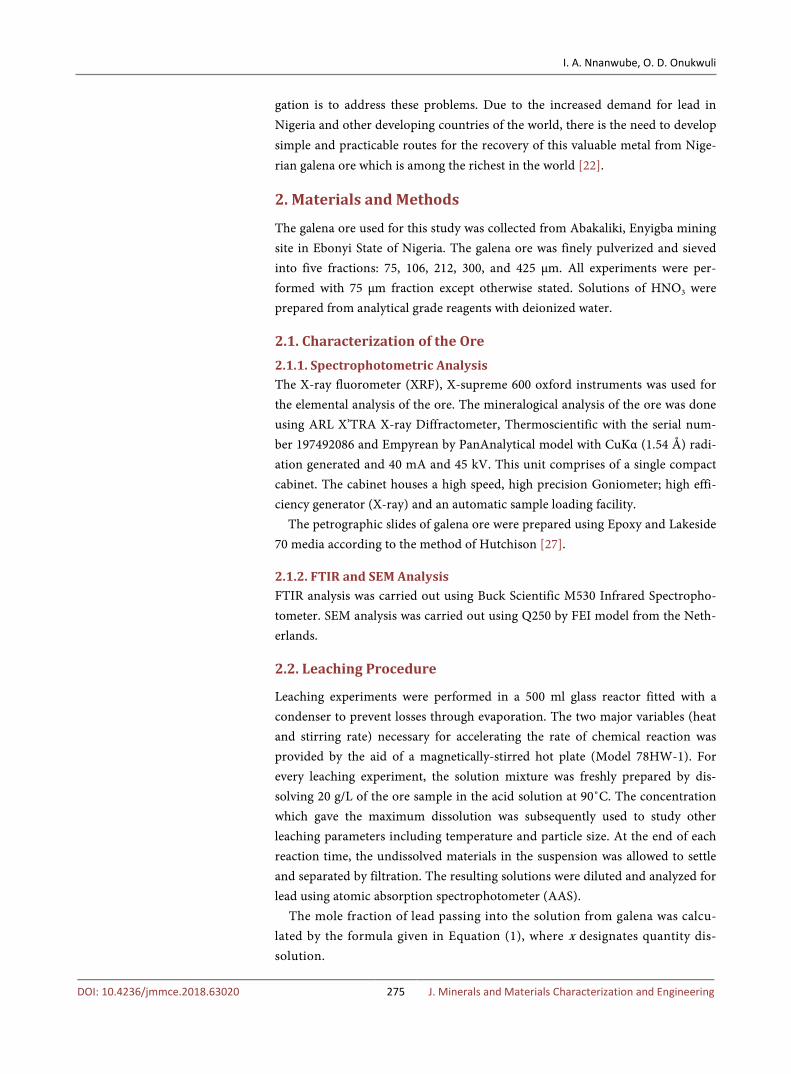
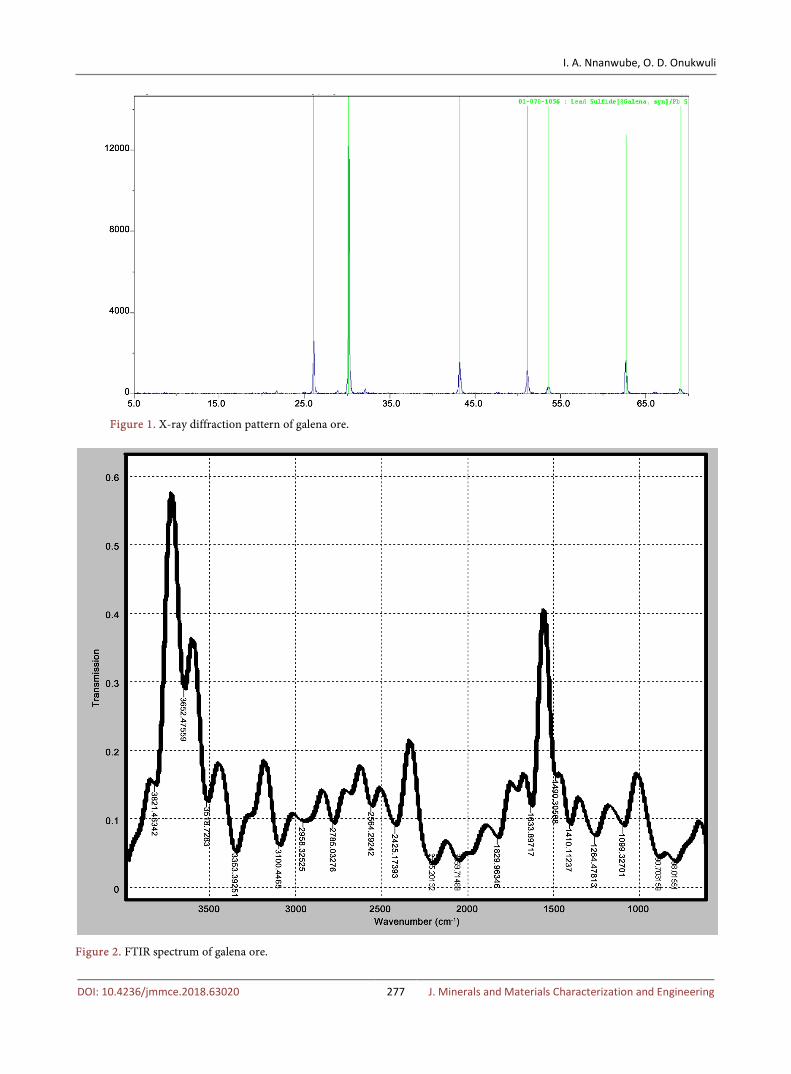
3.1.3. FTIR Analysis of Galena The FTIR spectra of galena ore is shown in Figure 2. The spectrum of the ore exhibit absorption bands at 3821 cm−1, 3652 cm−1, 3353 cm−1, 2958 cm−1, and 2564 cm−1. These are attributed to O-H stretching. The band at 1410 cm−1 is at-tributed to O-H bending. The bands at 3519 cm−1, 3353 cm−1 and 2564 cm−1 are attributed to N-H stretching. The band at 2564 cm−1 which is attributed to S-H
Table 2. The X-ray diffraction data of the galena ore showing the angle 2θ and d-values of the compounds identified, with their relative intensity (%).
2θ d-Value (Å) Compound Intensity (%) JCPDS file No.
26.03 3.42 Galena (PbS) 93.99 01-078-1056
30.15 2.96 Galena (PbS) 100.00 01-078-1056
43.16 2.09 Galena (PbS) 65.77 01-078-1056
51.10 1.79 Galena (PbS) 38.14 01-078-1056
53.55 1.71 Galena (PbS) 20.72 01 -078-1056
62.68 1.48 Galena (PbS) 8.71 01-078-1056
69.06 1.36 Galena (PbS) 12.91 01-078-1056
JCPDS File No.: Joint Committee on Power Diffraction Standards File Number.
I. A. Nnanwube, O. D. Onukwuli
DOI: 10.4236/jmmce.2018.63020 277 J. Minerals and Materials Characterization and Engineering
Figure 1. X-ray diffraction pattern of galena ore.
Figure 2. FTIR spectrum of galena ore.
I. A. Nnanwube, O. D. Onukwuli
DOI: 10.4236/jmmce.2018.63020 278 J. Minerals and Materials Characterization and Engineering
stretching confirms the presence of sulphur in the ore. The band at 1634 cm−1 is attributed to Si-O and Al-O stretching while the band at 1634 cm−1 is also attri-buted to Al-O-H stretching.
The FTIR result is in agreement with XRF and XRD results which confirmed the presence of the minerals detected.
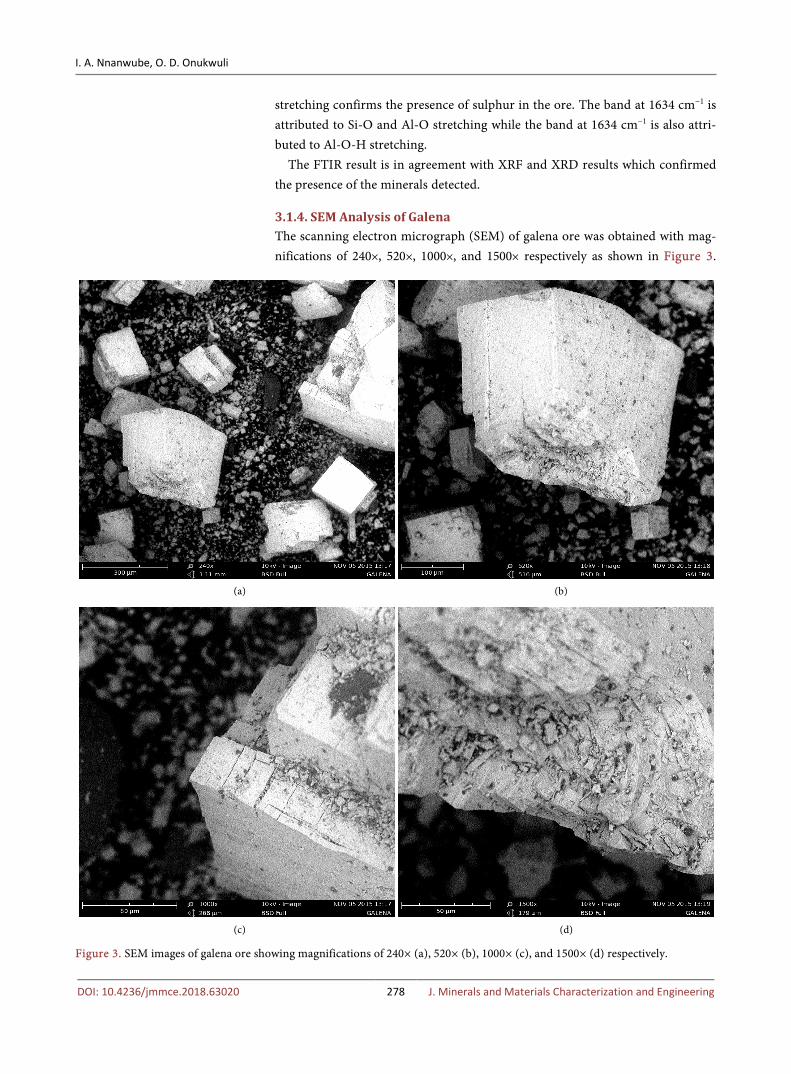
3.1.4. SEM Analysis of Galena The scanning electron micrograph (SEM) of galena ore was obtained with mag-nifications of 240×, 520×, 1000×, and 1500× respectively as shown in Figure 3.
(a) (b)
(c) (d)
Figure 3. SEM images of galena ore showing magnifications of 240× (a), 520× (b), 1000× (c), and 1500× (d) respectively.
I. A. Nnanwube, O. D. Onukwuli
DOI: 10.4236/jmmce.2018.63020 279 J. Minerals and Materials Characterization and Engineering
The average cell diameter of the ore ranges from 8 to 62 µm while the average cell density ranges from 0.0042 to 1.13 cells/mm. The results indicate that the ore particles are very cohesive, forming an aggregate mass that appeared to have been formed by several flaky particles stacked together in form of agglomerates [28]. The particles have irregular shapes with rough edges, and are highly crys-talline due to the high level of purity of the ore.
3.2. Leaching Studies
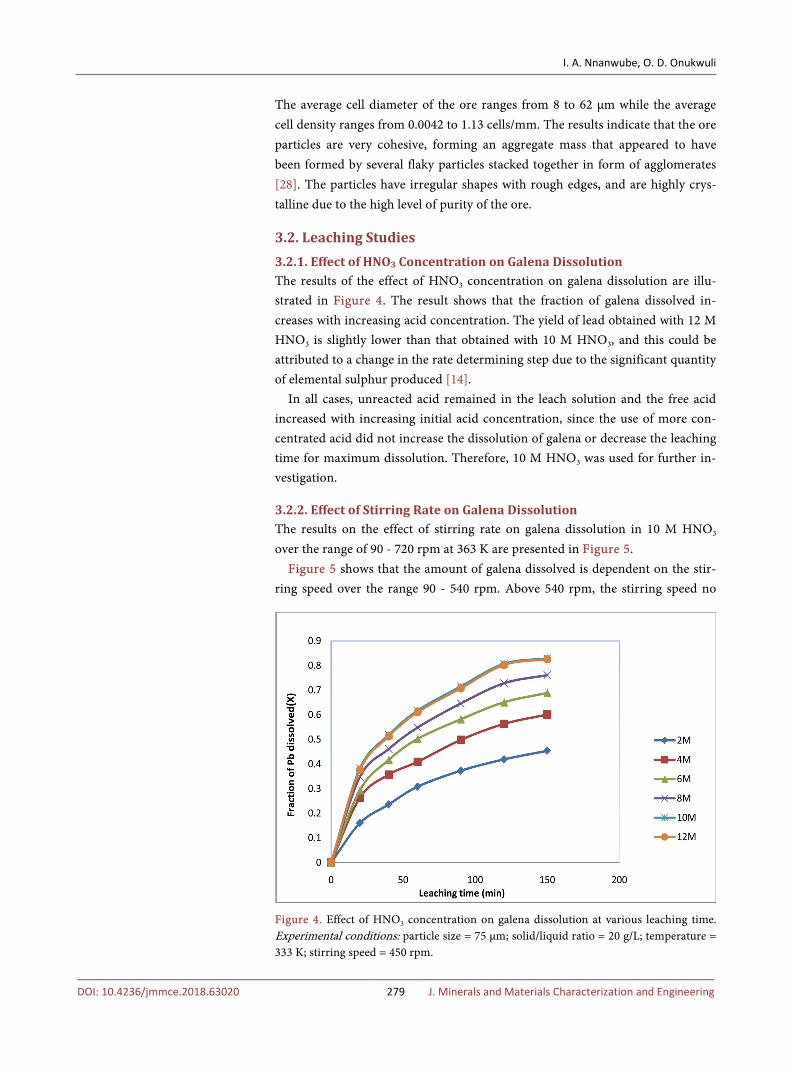
3.2.1. Effect of HNO3 Concentration on Galena Dissolution The results of the effect of HNO3 concentration on galena dissolution are illu-strated in Figure 4. The result shows that the fraction of galena dissolved in-creases with increasing acid concentration. The yield of lead obtained with 12 M HNO3 is slightly lower than that obtained with 10 M HNO3, and this could be attributed to a change in the rate determining step due to the significant quantity of elemental sulphur produced [14].
In all cases, unreacted acid remained in the leach solution and the free acid increased with increasing initial acid concentration, since the use of more con-centrated acid did not increase the dissolution of galena or decrease the leaching time for maximum dissolution. Therefore, 10 M HNO3 was used for further in-vestigation.
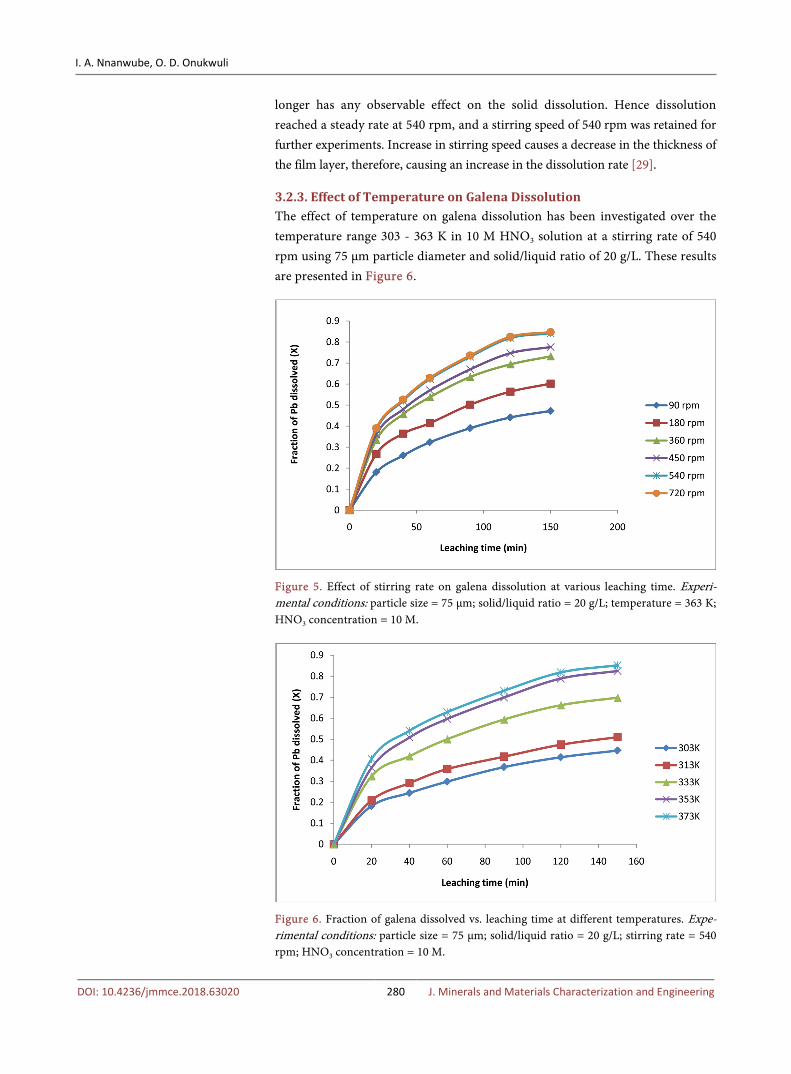
3.2.2. Effect of Stirring Rate on Galena Dissolution The results on the effect of stirring rate on galena dissolution in 10 M HNO3 over the range of 90 - 720 rpm at 363 K are presented in Figure 5.
Figure 5 shows that the amount of galena dissolved is dependent on the stir-ring speed over the range 90 - 540 rpm. Above 540 rpm, the stirring speed no
Figure 4. Effect of HNO3 concentration on galena dissolution at various leaching time. Experimental conditions: particle size = 75 µm; solid/liquid ratio = 20 g/L; temperature = 333 K; stirring speed = 450 rpm.
I. A. Nnanwube, O. D. Onukwuli
DOI: 10.4236/jmmce.2018.63020 280 J. Minerals and Materials Characterization and Engineering
longer has any observable effect on the solid dissolution. Hence dissolution reached a steady rate at 540 rpm, and a stirring speed of 540 rpm was retained for further experiments. Increase in stirring speed causes a decrease in the thickness of the film layer, therefore, causing an increase in the dissolution rate [29].
3.2.3. Effect of Temperature on Galena Dissolution The effect of temperature on galena dissolution has been investigated over the temperature range 303 - 363 K in 10 M HNO3 solution at a stirring rate of 540 rpm using 75 µm particle diameter and solid/liquid ratio of 20 g/L. These results are presented in Figure 6.
Figure 5. Effect of stirring rate on galena dissolution at various leaching time. Experi-mental conditions: particle size = 75 µm; solid/liquid ratio = 20 g/L; temperature = 363 K; HNO3 concentration = 10 M.
Figure 6. Fraction of galena dissolved vs. leaching time at different temperatures. Expe-rimental conditions: particle size = 75 µm; solid/liquid ratio = 20 g/L; stirring rate = 540 rpm; HNO3 concentration = 10 M.
I. A. Nnanwube, O. D. Onukwuli
DOI: 10.4236/jmmce.2018.63020 281 J. Minerals and Materials Characterization and Engineering
As seen in Figure 6, galena dissolution increases with increasing temperature. This is as a result of high kinetic energy available for the reacting molecules [29]. For instance, at 363 K, the amount of galena dissolved within 150 min was 85.2%.
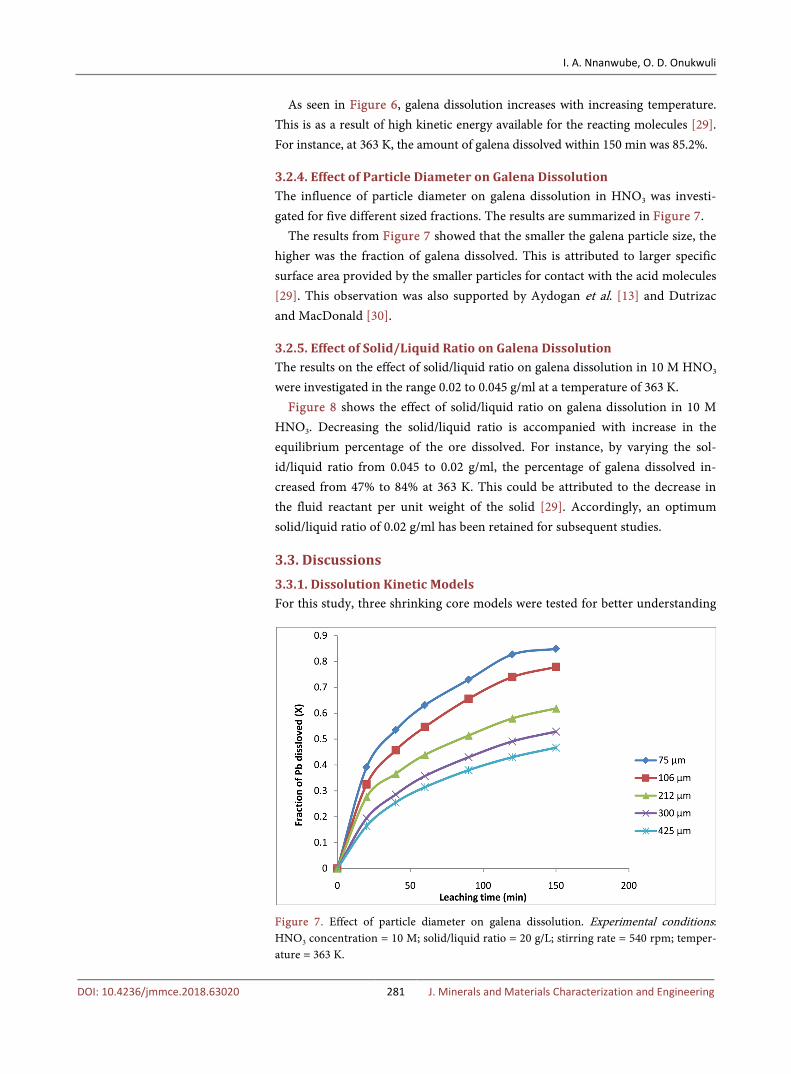
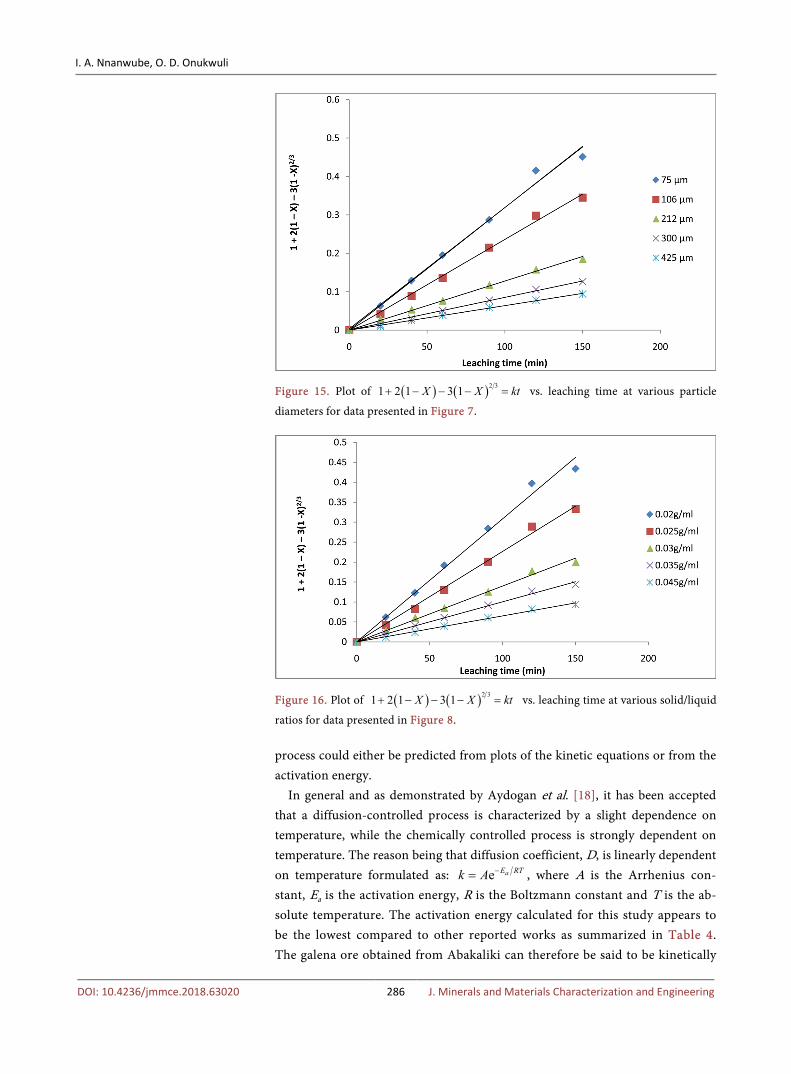
3.2.4. Effect of Particle Diameter on Galena Dissolution The influence of particle diameter on galena dissolution in HNO3 was investi-gated for five different sized fractions. The results are summarized in Figure 7.
The results from Figure 7 showed that the smaller the galena particle size, the higher was the fraction of galena dissolved. This is attributed to larger specific surface area provided by the smaller particles for contact with the acid molecules [29]. This observation was also supported by Aydogan et al. [13] and Dutrizac and MacDonald [30].
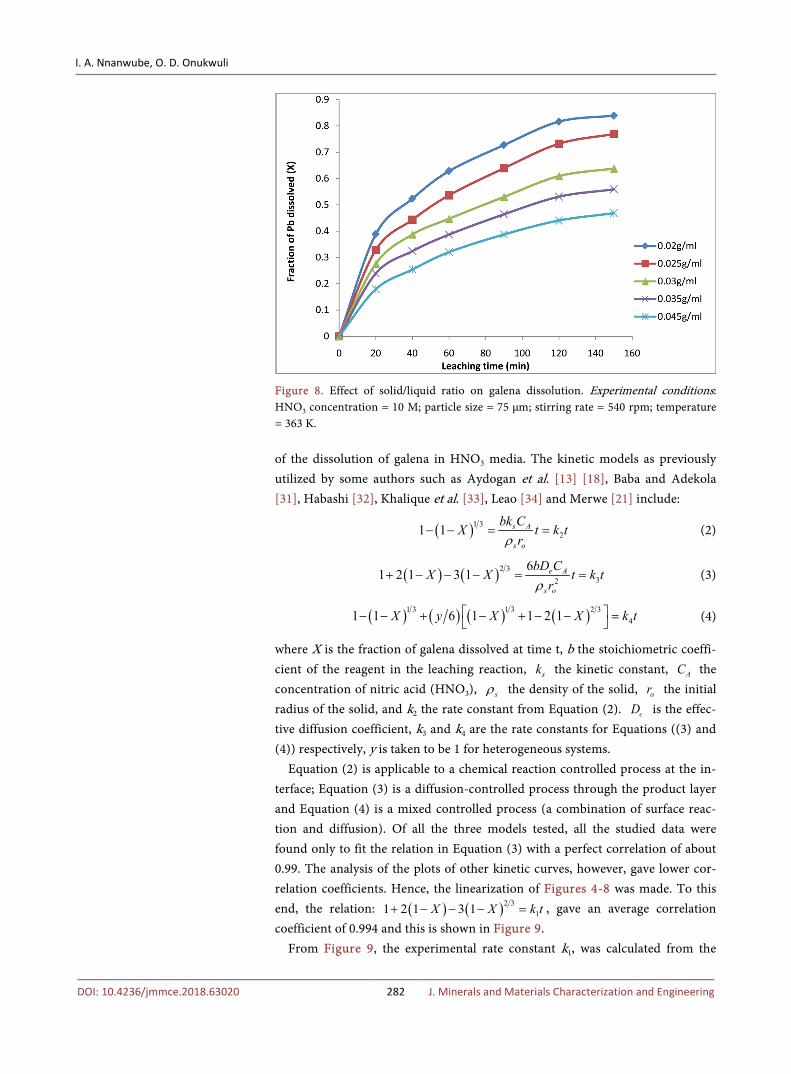
3.2.5. Effect of Solid/Liquid Ratio on Galena Dissolution The results on the effect of solid/liquid ratio on galena dissolution in 10 M HNO3 were investigated in the range 0.02 to 0.045 g/ml at a temperature of 363 K.
Figure 8 shows the effect of solid/liquid ratio on galena dissolution in 10 M HNO3. Decreasing the solid/liquid ratio is accompanied with increase in the equilibrium percentage of the ore dissolved. For instance, by varying the sol-id/liquid ratio from 0.045 to 0.02 g/ml, the percentage of galena dissolved in-creased from 47% to 84% at 363 K. This could be attributed to the decrease in the fluid reactant per unit weight of the solid [29]. Accordingly, an optimum solid/liquid ratio of 0.02 g/ml has been retained for subsequent studies.
3.3. Discussions
3.3.1. Dissolution Kinetic Models For this study, three shrinking core models were tested for better understanding
Figure 7. Effect of particle diameter on galena dissolution. Experimental conditions: HNO3 concentration = 10 M; solid/liquid ratio = 20 g/L; stirring rate = 540 rpm; temper-ature = 363 K.
I. A. Nnanwube, O. D. Onukwuli
DOI: 10.4236/jmmce.2018.63020 282 J. Minerals and Materials Characterization and Engineering
Figure 8. Effect of solid/liquid ratio on galena dissolution. Experimental conditions: HNO3 concentration = 10 M; particle size = 75 µm; stirring rate = 540 rpm; temperature = 363 K.
of the dissolution of galena in HNO3 media. The kinetic models as previously utilized by some authors such as Aydogan et al. [13] [18], Baba and Adekola [31], Habashi [32], Khalique et al. [33], Leao [34] and Merwe [21] include:
( )1 321 1 s A
s o
bk Ct tX k
rρ− − = = (2)
( ) ( )232
31 2 1 3 16 e A
s o
bD Ct k t
rX X
ρ− − =+ − = (3)
( ) ( ) ( ) ( )1 34
1 3 2 31 1 6 1 1 2 1X X ty X k − − + − + − − = (4)
where X is the fraction of galena dissolved at time t, b the stoichiometric coeffi-cient of the reagent in the leaching reaction, sk the kinetic constant, AC the concentration of nitric acid (HNO3), sρ the density of the solid, or the initial radius of the solid, and k2 the rate constant from Equation (2). D is the effec-tive diffusion coefficient, k3 and k4 are the rate constants for Equations ((3) and (4)) respectively, y is taken to be 1 for heterogeneous systems.
Equation (2) is applicable to a chemical reaction controlled process at the in-terface; Equation (3) is a diffusion-controlled process through the product layer and Equation (4) is a mixed controlled process (a combination of surface reac-tion and diffusion). Of all the three models tested, all the studied data were found only to fit the relation in Equation (3) with a perfect correlation of about 0.99. The analysis of the plots of other kinetic curves, however, gave lower cor-relation coefficients. Hence, the linearization of Figures 4-8 was made. To this end, the relation: ( ) ( )2 3
11 2 1 3 1X X k t+ − − − = , gave an average correlation coefficient of 0.994 and this is shown in Figure 9.
From Figure 9, the experimental rate constant k1, was calculated from the
I. A. Nnanwube, O. D. Onukwuli
DOI: 10.4236/jmmce.2018.63020 283 J. Minerals and Materials Characterization and Engineering
slope of the straight line at various HNO3 concentrations and the plots of Ink1 versus In[HNO3] are shown in Figure 10.
From Figure 10, the slope of the resulting plot gave 0.93. This shows that the order of reaction with respect to H+ ion concentration is 0.93 with correlation coefficient of 0.990.
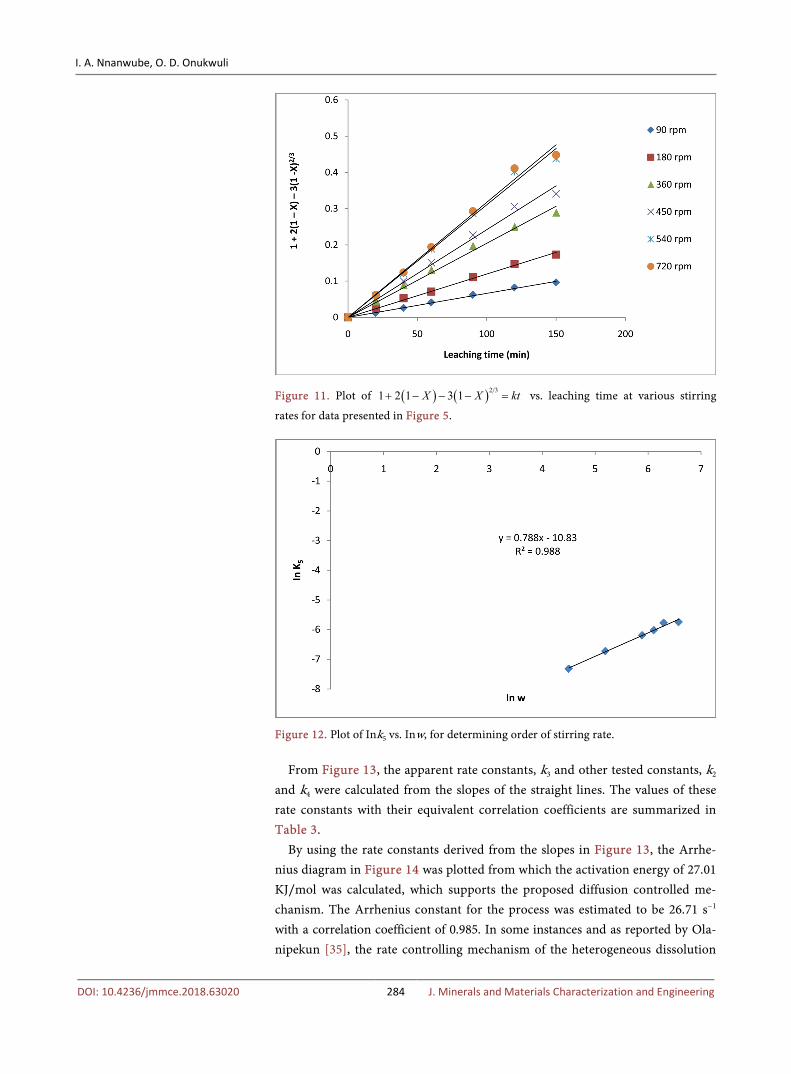
Similarly, the apparent rate constant k5 was calculated from the slope of the straight line at various stirring rates (w) as shown in Figure 11 and the plots of Ink5 versus Inw are shown in Figure 12.
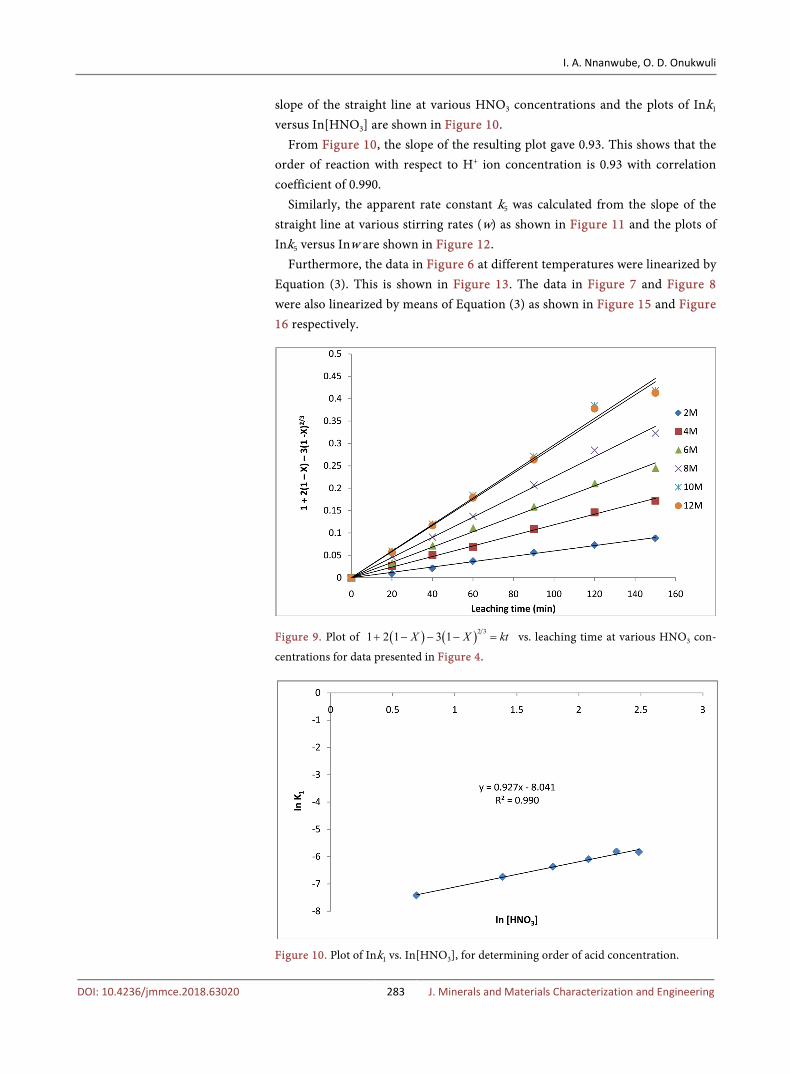
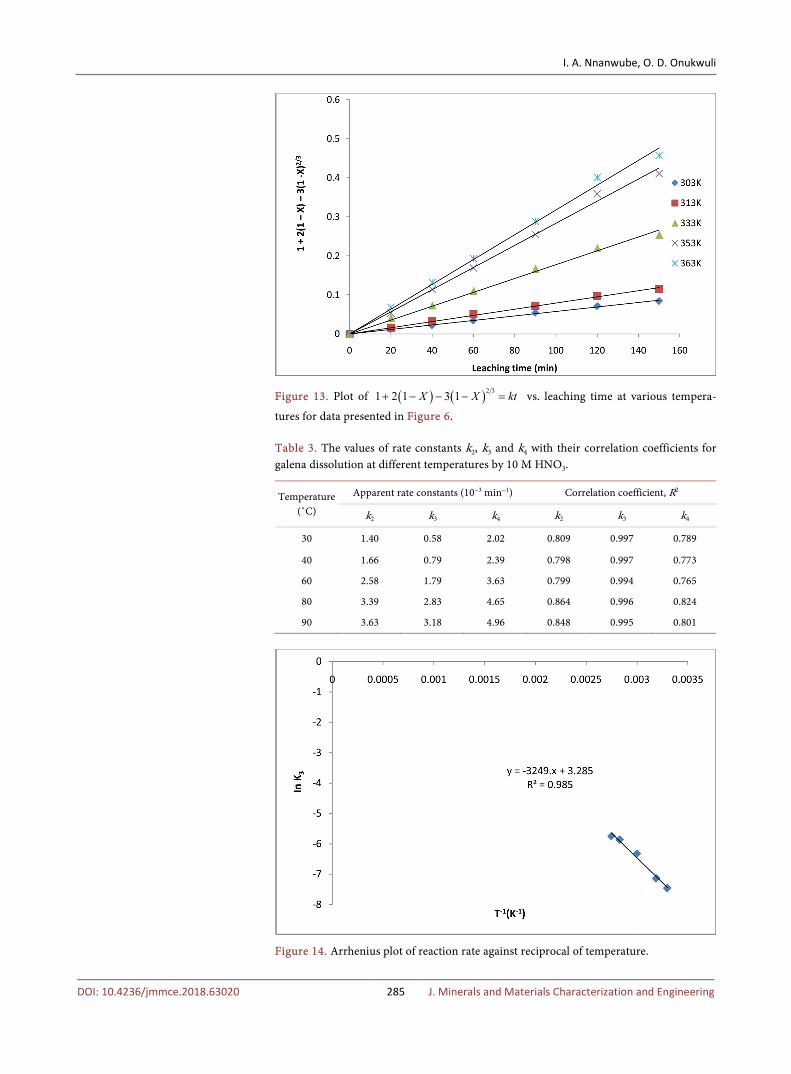
Furthermore, the data in Figure 6 at different temperatures were linearized by Equation (3). This is shown in Figure 13. The data in Figure 7 and Figure 8 were also linearized by means of Equation (3) as shown in Figure 15 and Figure 16 respectively.
Figure 9. Plot of ( ) ( )2 31 2 1 3 1X X kt+ − − − = vs. leaching time at various HNO3 con-
centrations for data presented in Figure 4.
Figure 10. Plot of Ink1 vs. In[HNO3], for determining order of acid concentration.
I. A. Nnanwube, O. D. Onukwuli
DOI: 10.4236/jmmce.2018.63020 284 J. Minerals and Materials Characterization and Engineering
Figure 11. Plot of ( ) ( )2 31 2 1 3 1X X kt+ − − − = vs. leaching time at various stirring
rates for data presented in Figure 5.
Figure 12. Plot of Ink5 vs. Inw, for determining order of stirring rate.
From Figure 13, the apparent rate constants, k3 and other tested constants, k2 and k4 were calculated from the slopes of the straight lines. The values of these rate constants with their equivalent correlation coefficients are summarized in Table 3.
By using the rate constants derived from the slopes in Figure 13, the Arrhe-nius diagram in Figure 14 was plotted from which the activation energy of 27.01 KJ/mol was calculated, which supports the proposed diffusion controlled me-chanism. The Arrhenius constant for the process was estimated to be 26.71 s−1 with a correlation coefficient of 0.985. In some instances and as reported by Ola-nipekun [35], the rate controlling mechanism of the heterogeneous dissolution
I. A. Nnanwube, O. D. Onukwuli
DOI: 10.4236/jmmce.2018.63020 285 J. Minerals and Materials Characterization and Engineering
Figure 13. Plot of ( ) ( )2 31 2 1 3 1X X kt+ − − − = vs. leaching time at various tempera-
tures for data presented in Figure 6.
Table 3. The values of rate constants k2, k3 and k4 with their correlation coefficients for galena dissolution at different temperatures by 10 M HNO3.
Temperature (˚C)
Apparent rate constants (10−3 min−1) Correlation coefficient, R2
k2 k3 k4 k2 k3 k4
30 1.40 0.58 2.02 0.809 0.997 0.789
40 1.66 0.79 2.39 0.798 0.997 0.773
60 2.58 1.79 3.63 0.799 0.994 0.765
80 3.39 2.83 4.65 0.864 0.996 0.824
90 3.63 3.18 4.96 0.848 0.995 0.801
Figure 14. Arrhenius plot of reaction rate against reciprocal of temperature.
I. A. Nnanwube, O. D. Onukwuli
DOI: 10.4236/jmmce.2018.63020 286 J. Minerals and Materials Characterization and Engineering
Figure 15. Plot of ( ) ( )2 31 2 1 3 1X X kt+ − − − = vs. leaching time at various particle
diameters for data presented in Figure 7.
Figure 16. Plot of ( ) ( )2 31 2 1 3 1X X kt+ − − − = vs. leaching time at various solid/liquid
ratios for data presented in Figure 8.
process could either be predicted from plots of the kinetic equations or from the activation energy.
In general and as demonstrated by Aydogan et al. [18], it has been accepted that a diffusion-controlled process is characterized by a slight dependence on temperature, while the chemically controlled process is strongly dependent on temperature. The reason being that diffusion coefficient, D, is linearly dependent on temperature formulated as: e aE RTk A −= , where A is the Arrhenius con-stant, Ea is the activation energy, R is the Boltzmann constant and T is the ab-solute temperature. The activation energy calculated for this study appears to be the lowest compared to other reported works as summarized in Table 4. The galena ore obtained from Abakaliki can therefore be said to be kinetically
I. A. Nnanwube, O. D. Onukwuli
DOI: 10.4236/jmmce.2018.63020 287 J. Minerals and Materials Characterization and Engineering
Table 4. Some reported activation energies for galena leaching by different leaching sys-tems.
Origin of galena Leachant Ea (KJ/mol) References
Sivas, Turkey 0.5 M HNO3/1 M H2O2 42.26 Aydogan et al. [13]
Sivas, Turkey 3 M CH3COOH/0.5 M H2O2 65.60 Aydogan et al. [18]
Bor, Yugoslavia 2 M H2O2/2 M H2SO4 60.00 Antonijevic et al. [36]
Abakaliki, Nigeria 8.06 M H2O2/8.06 M HCl 40.55 Baba and Adekola [31]
Abakaliki, Nigeria 10 M HNO3 27.01 This work
more favorable to leaching by HNO3 compared to other galena types.
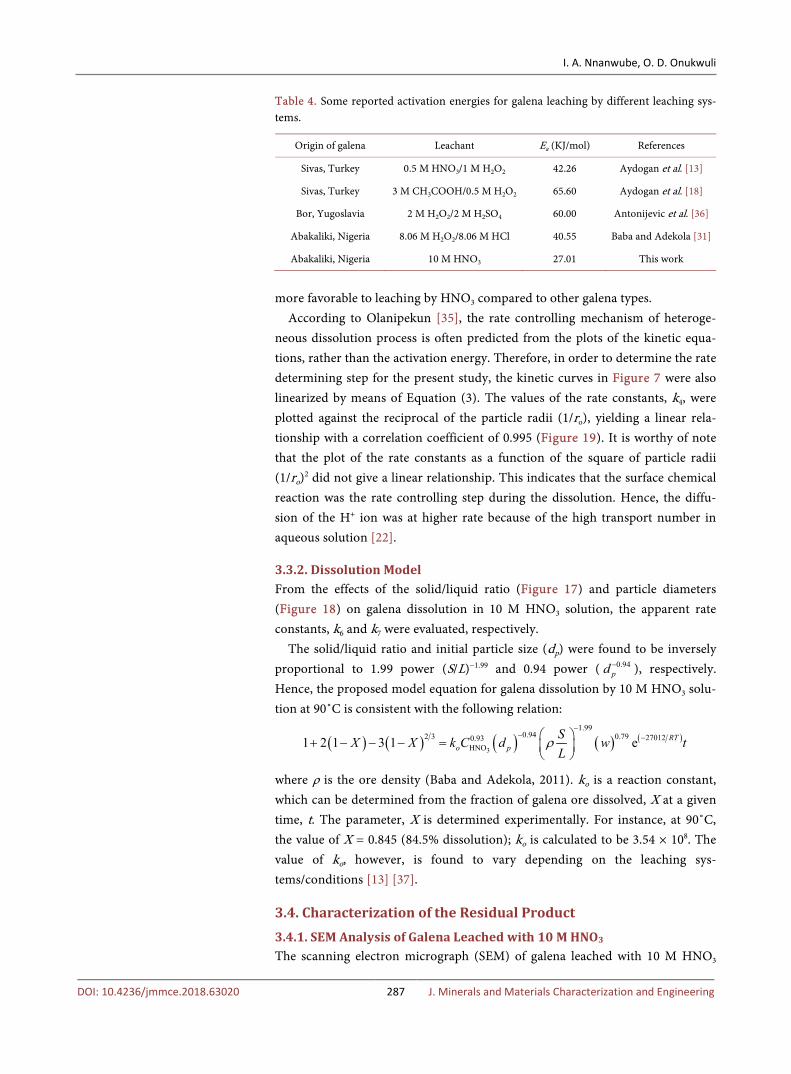
According to Olanipekun [35], the rate controlling mechanism of heteroge-neous dissolution process is often predicted from the plots of the kinetic equa-tions, rather than the activation energy. Therefore, in order to determine the rate determining step for the present study, the kinetic curves in Figure 7 were also linearized by means of Equation (3). The values of the rate constants, k4, were plotted against the reciprocal of the particle radii (1/ro), yielding a linear rela-tionship with a correlation coefficient of 0.995 (Figure 19). It is worthy of note that the plot of the rate constants as a function of the square of particle radii (1/ro)2 did not give a linear relationship. This indicates that the surface chemical reaction was the rate controlling step during the dissolution. Hence, the diffu-sion of the H+ ion was at higher rate because of the high transport number in aqueous solution [22].
3.3.2. Dissolution Model From the effects of the solid/liquid ratio (Figure 17) and particle diameters (Figure 18) on galena dissolution in 10 M HNO3 solution, the apparent rate constants, k6 and k7 were evaluated, respectively.
The solid/liquid ratio and initial particle size (dp) were found to be inversely proportional to 1.99 power (S/L)−1.99 and 0.94 power ( 0.94
pd − ), respectively. Hence, the proposed model equation for galena dissolution by 10 M HNO3 solu-tion at 90˚C is consistent with the following relation:
( ) ( ) ( ) ( ) ( )3
1.990.94 0.79 270120.93
HNO2 31 2 1 3 1 eo
RTp
SC d wL
X X k tρ−
− −+ − −
= −
where ρ is the ore density (Baba and Adekola, 2011). ko is a reaction constant, which can be determined from the fraction of galena ore dissolved, X at a given time, t. The parameter, X is determined experimentally. For instance, at 90˚C, the value of X = 0.845 (84.5% dissolution); ko is calculated to be 3.54 × 10⁸. The value of ko, however, is found to vary depending on the leaching sys-tems/conditions [13] [37].
3.4. Characterization of the Residual Product
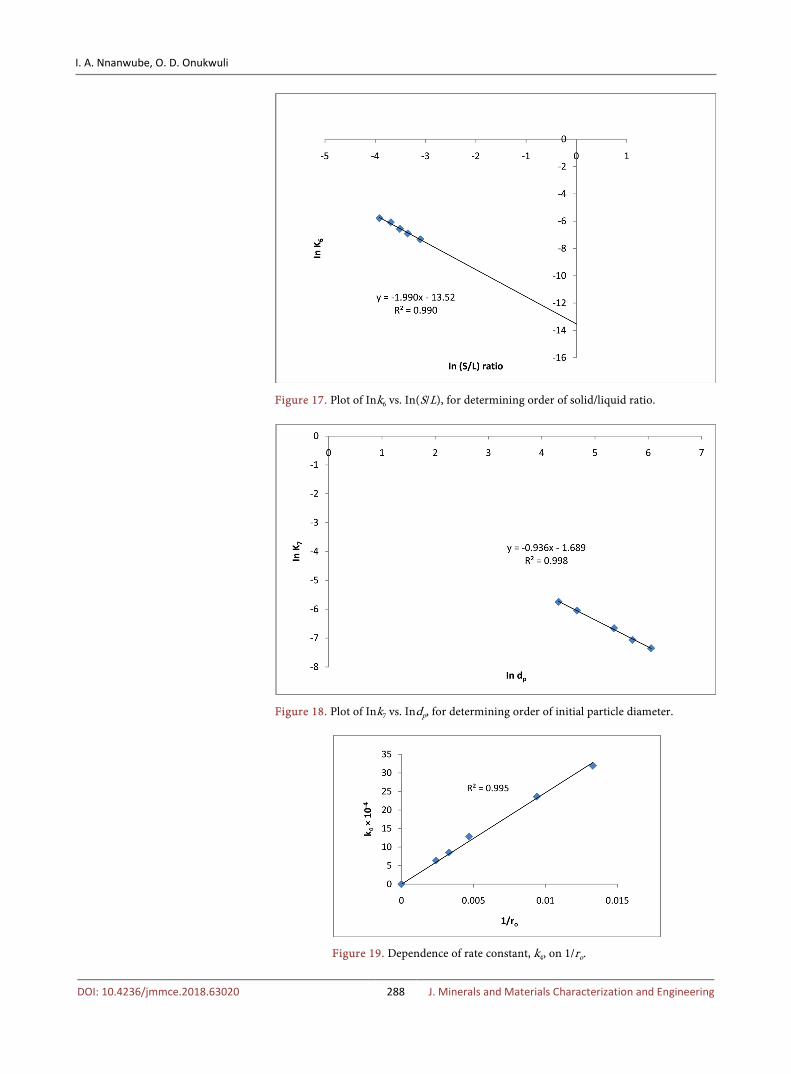
3.4.1. SEM Analysis of Galena Leached with 10 M HNO3
The scanning electron micrograph (SEM) of galena leached with 10 M HNO3
I. A. Nnanwube, O. D. Onukwuli
DOI: 10.4236/jmmce.2018.63020 288 J. Minerals and Materials Characterization and Engineering
Figure 17. Plot of Ink6 vs. In(S/L), for determining order of solid/liquid ratio.
Figure 18. Plot of Ink7 vs. Indp, for determining order of initial particle diameter.
Figure 19. Dependence of rate constant, k4, on 1/ro.
I. A. Nnanwube, O. D. Onukwuli
DOI: 10.4236/jmmce.2018.63020 289 J. Minerals and Materials Characterization and Engineering
was obtained with magnifications of 150×, 500× and 1000× respectively as shown in Figure 20. The average cell diameter ranges from 26 µm to 104 µm while the average cell density ranges from 0.0938 cell/mm to 0.156 cell/mm. The results above indicate an increase in the diameter of the particles and a corres-ponding decrease in density as the particle volume automatically increases and therefore decreases the specific gravity [28]. The micrographs of the leaching re-sidues show a progressive increase in the roughness of the solid and also an in-crease in the amount of elemental sulphur covering the particle surfaces [38]. The particles have irregular shapes and may be poorly crystalline due to acid at-tack.
3.4.2. XRD Analysis of Galena Leached with 10 M HNO3
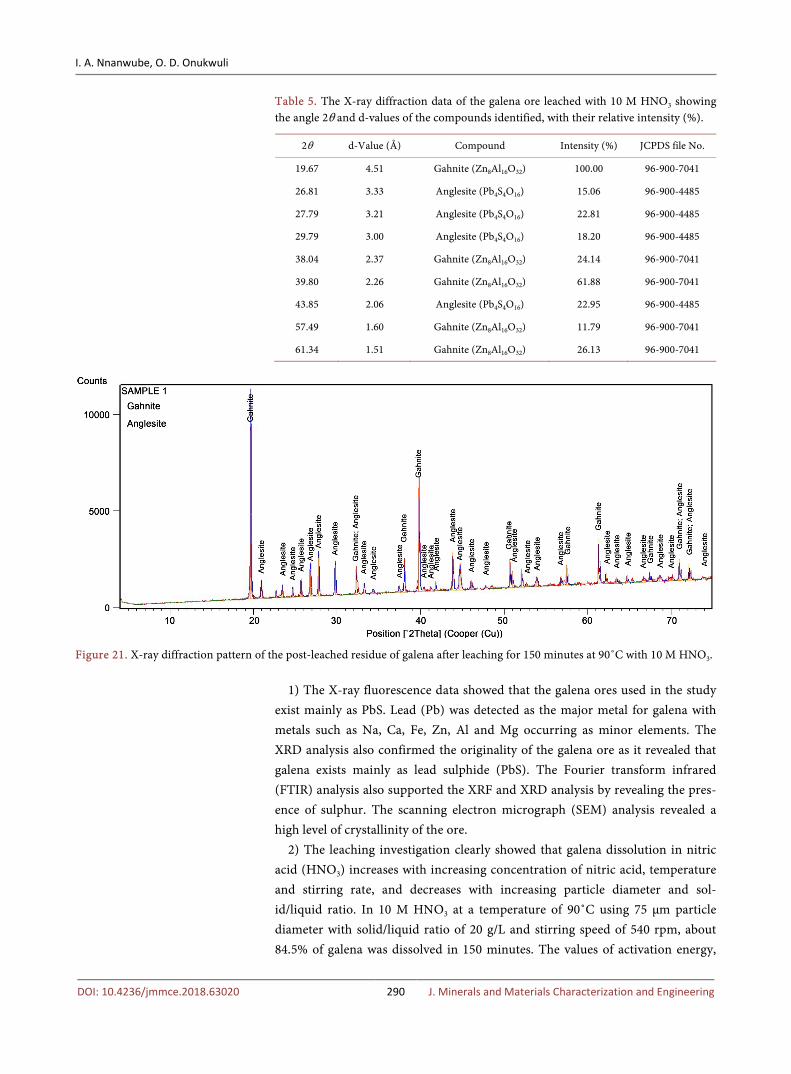
The analysis of galena leached with 10 M HNO3 at 90˚C by X-ray diffraction gives a description of the mineral phases present in the residue. Table 5 present the results of the X-ray diffractogram of the residue with important compounds identified. The result showed two major and one minor peaks at 4.51, 2.26, and 1.51 Å, respectively. The XRD data revealed the presence of gahnite and angle-site as shown in Figure 21. The XRD result agrees with the SEM result of the re-sidue. In summary, the overall dissolution reaction of galena in HNO3 solution can be described by the following stoichiometry:
( )( )
( ) ( ) ( )( )
2s ggalena 85% released into solut
2aq aq
ion
PbS 2 H SH Pb+ +
≅
+ +
4. Conclusions
Based on the results of the characterization and leaching investigations underta-ken in this study, the following conclusions can be drawn:
(a) (b) (c)
Figure 20. SEM image of galena leached with 10 M HNO3 with magnifications of 150× (a), 500× (b) and 1000× (c) respectively.
I. A. Nnanwube, O. D. Onukwuli
DOI: 10.4236/jmmce.2018.63020 290 J. Minerals and Materials Characterization and Engineering
Table 5. The X-ray diffraction data of the galena ore leached with 10 M HNO3 showing the angle 2θ and d-values of the compounds identified, with their relative intensity (%).
2θ d-Value (Å) Compound Intensity (%) JCPDS file No.
19.67 4.51 Gahnite (Zn8Al16O32) 100.00 96-900-7041
26.81 3.33 Anglesite (Pb4S4O16) 15.06 96-900-4485
27.79 3.21 Anglesite (Pb4S4O16) 22.81 96-900-4485
29.79 3.00 Anglesite (Pb4S4O16) 18.20 96-900-4485
38.04 2.37 Gahnite (Zn8Al16O32) 24.14 96-900-7041
39.80 2.26 Gahnite (Zn8Al16O32) 61.88 96-900-7041
43.85 2.06 Anglesite (Pb4S4O16) 22.95 96-900-4485
57.49 1.60 Gahnite (Zn8Al16O32) 11.79 96-900-7041
61.34 1.51 Gahnite (Zn8Al16O32) 26.13 96-900-7041
Figure 21. X-ray diffraction pattern of the post-leached residue of galena after leaching for 150 minutes at 90˚C with 10 M HNO3.
1) The X-ray fluorescence data showed that the galena ores used in the study exist mainly as PbS. Lead (Pb) was detected as the major metal for galena with metals such as Na, Ca, Fe, Zn, Al and Mg occurring as minor elements. The XRD analysis also confirmed the originality of the galena ore as it revealed that galena exists mainly as lead sulphide (PbS). The Fourier transform infrared (FTIR) analysis also supported the XRF and XRD analysis by revealing the pres-ence of sulphur. The scanning electron micrograph (SEM) analysis revealed a high level of crystallinity of the ore.
2) The leaching investigation clearly showed that galena dissolution in nitric acid (HNO3) increases with increasing concentration of nitric acid, temperature and stirring rate, and decreases with increasing particle diameter and sol-id/liquid ratio. In 10 M HNO3 at a temperature of 90˚C using 75 µm particle diameter with solid/liquid ratio of 20 g/L and stirring speed of 540 rpm, about 84.5% of galena was dissolved in 150 minutes. The values of activation energy,
I. A. Nnanwube, O. D. Onukwuli
DOI: 10.4236/jmmce.2018.63020 291 J. Minerals and Materials Characterization and Engineering
order of reaction and Arrhenius constant calculated at the conditions above for galena were 27.01 KJ/mol, 0.93, 26.71 s−1.
3) The results of the dissolution studies indicated that the data fitted the shrinking core model for the diffusion controlled mechanism, with surface chemical reaction as the rate controlling step. This is consistent with the follow-ing relation:
( ) ( ) ( ) ( ) ( )3
1.990.94 0.79 270120.932 3
0 HNO1 2 1 3 e1 RTp
SC d wL
X X k tρ−
− −+ − −
= − ; where k0
is the reaction constant, which can be determined experimentally. 4) The post-leaching residue was found to be constituted of gahnite and an-
glesite.
References
[1] Da Silva, G. (2004) Kinetics and Mechanism of the Bacterial and Ferric Sulphate Oxidation of Galena. Hydrometallurgy, 75, 99-110. https://doi.org/10.1016/j.hydromet.2004.07.001
[2] Ukpong, E.E. and Olade, M.A. (1979) Geochemical Surveys for Lead-Zinc Minera-lization, Southern Benue Trough, Nigeria. Transactions of Institute of Mining and Metallurgy, 88B, 81-92.
[3] Rahman, M.A.O. (2004) Nigeria’s Minerals Endowment and Sustainable Develop-ment. 2nd Mosobalaje Oyawoye Endowed Faculty of Science Lecture, University of Ilorin, Unilorin Press, Illorin, 1-40.
[4] Baird, C. and Cann, N. (2012) Environmental Chemistry. 5th Edition, W. H. Free-man and Company, New York.
[5] Parker, R.B. (2005) The New Cold-Molded Boatbuilding: From Lofting to Launch-ing. Wooden Boat Publications, Brooklin.
[6] Krestovnikoff, M. and Halls, M. (2006) Scuba Diving. Dorling Kindersley, London.
[7] Jensen, C.F. (2013) Online Location of Faults on AC Cables in Underground Transmission. Springer, Berlin.
[8] Feursternau, M.C., Nebo, C.O., Elango, B.V. and Han, K.H. (1987) The Kinetics of Leaching Galena with Ferric Nitrate. Metallurgical and Materials Transactions B, 18, 25-30.
[9] Awakura, Y., Kamei, S. and Majima, H. (1980) A Kinetic Study of Non-Oxidative Dissolution of Galena in Aqueous Acid Solution. Metallurgical and Materials Transactions B, 11, 377-381. https://doi.org/10.1007/BF02676882
[10] Olanipekun, E.O. (2000) Quantitative Leaching of Galena. Bulletin of the Chemical Society of Ethiopia, 14, 25-32. https://doi.org/10.4314/bcse.v14i1.71994
[11] Makita, M., Esperon, M., Lopez, B.P. and Orrantia, E. (2004) Reduction of Arsenic Content in a Complex Galena by Acidithiobacillus ferrooxidans. BMC Biotechnol-ogy, 4, 22-38. https://doi.org/10.1186/1472-6750-4-22
[12] Wang, S., Fang, Z., Wang, Y. and Chen, Y. (2003) Electronegative Leaching of Ga-lena with Ferric Chloride. Minerals Engineering, 16, 869-872.
[13] Aydogan, S., Erdemoglu, M., Ucar, G. and Aras, A. (2007) Kinetics of Galena Dis-solution in Nitric Acid Solutions with Hydrogen Peroxide. Hydrometallurgy, 88, 52-57. https://doi.org/10.1016/j.hydromet.2007.03.005
[14] Warren, G.W., Kim, S. and Henein, H. (1986) The Effect of Chloride Ion on the
I. A. Nnanwube, O. D. Onukwuli
DOI: 10.4236/jmmce.2018.63020 292 J. Minerals and Materials Characterization and Engineering
Ferric Chloride Leaching of Galena Concentrate. Metallurgical and Materials Transactions B, 18, 59. https://doi.org/10.1007/BF02658432
[15] Baba, A.A. and Adekola, F.A. (2011) Comparative Analysis of the Dissolution Ki-netics of Galena in Binary Solutions of HCl/FeCl3 and HCl/H2O2. International Journal of Minerals, Metallurgy and Materials, 18, 9-17. https://doi.org/10.1007/s12613-011-0393-1
[16] Liu, J., Aruguete, D.M., Jinschek, J.R., Rimstidt, J.D. and Hochella, M.F. (2008) The Non-Oxidative Dissolution of Galena Nano-Crystals: Insights into Mineral Dissolu-tion Rates as a Function of Grain Size, Shape, and Aggregation State. Geochimica et Cosmochimica Acta, 72, 5984-5996. https://doi.org/10.1016/j.gca.2008.10.010
[17] Gerson, R.A. and O’Dea, A.R. (2003) A Quantum Chemical Investigation of the Oxidation and Dissolution Mechanism of Galena. Geochimica et Cosmochimica Acta, 67, 813-822.
[18] Aydogan, S., Erdemoglu, M., Ucar, G. and Aras, A. (2007) Dissolution Kinetics of Galena in Acetic Acid Solutions with Hydrogen Peroxide. Hydrometallurgy, 89, 189-195. https://doi.org/10.1016/j.hydromet.2007.07.004
[19] Baba, A.A. (2008) Recovery of Zinc and Lead from Sphalerite, Galena and Waste Materials by Hydrometallurgical Treatments. University of Ilorin, Ilorin, 675.
[20] Levenspiel, O. (1972) Chemical Reaction Engineering. 2nd Edition, John Wiley & Sons, New York.
[21] Merwe, W. (2003) Dissolution of Sphalerite Minerals from Rosh Pinah Tailings, Magister Scientiae. Faculty of Natural and Agric. Sciences, University of Pretoria, Pretoria, 106.
[22] Baba, A.A. and Adekola, F.A. (2012) A Study of Dissolution Kinetics of a Nigerian Galena Ore in Hydrochloric Acid. Journal of Saudi Chemical Society, 16, 377-386. https://doi.org/10.1016/j.jscs.2011.02.005
[23] Abraitts, P.K., Pattrick, R.A.D., Kelsall, G.H. and Vaughan, D.J. (2004) Acid Leach-ing and Dissolution of Major Sulphide Ore Minerals: Processes and Galvanic Effects in Complex System. Mining Magazine, 68, 343-351. https://doi.org/10.1180/0026461046820191
[24] Cisneros-Gonzalez, I., Oropeza-Guzman, M. and Gonzalez, T. (2000) Galena and Sphalerite Process in Acidic Chloride Media, Electrochemistry in Mineral and Metal Processing. Proceedings of the Electrochemical Society, No. 14, 248-254.
[25] Harvey, T.J. and Yen, W.T. (1998) The Influence of Chalcopyrite, Galena and Pyrite on the Selective Extraction of Zinc from Base Metal Sulphide Concentrates. Miner-als Engineering, 11, 1-21. https://doi.org/10.1016/S0892-6875(97)00135-0
[26] Pacholewska, M. (2004) Bioleaching of Galena Flotation Concentrates. Physico-chemical Problems of Mineral Processing, 38, 281-291.
[27] Hutchison, C.S. (1974) Laboratory Handbook of Petrography Techniques. John Wiley and Sons Inc., New York, 1-14.
[28] Bendou, S. and Amrani, M. (2014) Effect of Hydrochloric Acid on the Structural of Sodic-Bentonite Clay. Journal of Minerals and Materials Characterization and En-gineering, 2, 404-413. https://doi.org/10.4236/jmmce.2014.25045
[29] Ajemba, R.O. and Onukwuli, O.D. (2012) Application of the Shrinking Core Model to the Analysis of Alumina Leaching from Ukpor Clay using Nitric Acid. Interna-tional Journal of Engineering Research & Technology, 1, 1-13.
[30] Dutrizac, J.E. and MacDonald, R.J.C. (1977) CIM Annual Volume, 186-194.
[31] Baba, A.A. and Adekola, F.A. (2010) Hydrometallurgical Processing of a Nigerian
I. A. Nnanwube, O. D. Onukwuli
DOI: 10.4236/jmmce.2018.63020 293 J. Minerals and Materials Characterization and Engineering
Sphalerite in Hydrochloric Acid: Characterization and Dissolution Kinetics. Hy-drometallurgy, 101, 69-75. https://doi.org/10.1016/j.hydromet.2009.12.001
[32] Habashi, F. (2005) Hydrometallurgy of Lead. Metallurgia, 59, 114-118.
[33] Khalique, A., Akram, A., Ahmed, A.S. and Hamid, N. (2005) Effect of Sodium Chloride on Dissolution of Galena in Aqueous Acid Solution. Pakistan Journal of Scientific and Industrial Research, 48, 236-239.
[34] Leao, V.A., Souza, A.D., Pina, P.S., Silva, C.A. and Siqueira, P.F. (2007) The Leach-ing Kinetics of a Zinc Sulphide Concentrate in Acid Ferric Sulphate. Hydrometal-lurgy, 89, 72-81. https://doi.org/10.1016/j.hydromet.2007.05.008
[35] Olanipekun, E.O. and Oderinde, R.A. (1999) Hydrochloric Acid Leaching of Spha-lerite in the Presence of an Oxidizing Agent. Pakistan Journal of Scientific and In-dustrial Research, 42, 204-208.
[36] Antonijevic, M.M., Jankovic, Z.D. and Dimitrijevic, M.D. (2004) Kinetics of Chal-copyrite Dissolution by Hydrogen Peroxide in Sulphuric Acid. Hydrometallurgy, 71, 329-334. https://doi.org/10.1016/S0304-386X(03)00082-3
[37] Fuerstenau, M.C., Nebo, C.O., Elango, B.V. and Han, K.N. (1986) The Kinetics of Leaching Galena with Ferric Nitrate. Metallurgical and Materials Transactions B, 18, 25-30. https://doi.org/10.1007/BF02658428
[38] Souza, A.D., Pina, P.S. and Leao, V.A. (2007) Bioleaching and Chemical Leaching as an Integrated Process in the Zinc Industry. Minerals Engineering, 20, 591-599. https://doi.org/10.1016/j.mineng.2006.12.014