Embed Size (px)
Citation preview

HYDROLOGY AND WATER QUALITY OF THE PRINCIPAL SPRINGS IN PUERTO RICO
By Senen Guzman-Rfos
U.S. GEOLOGICAL SURVEY
WATER-RESOURCES INVESTIGATIONS REPORT 85-4269
Prepared in cooperation with thePUERTO RICO DEPARTMENT OF NATURAL RESOURCES
and theWATER RESOURCES RESEARCH INSTITUTE OF THE UNIVERSI1Y OF PUERTO RICO (MAYAGUEZ CAMPUS)
San Juan, Puerto Rico 1988

DEPARTMENT OF THE INTERIOR
DONALD PAUL MODEL, Secretary
U.S. GEOLOGICAL SURVEY
Dallas L. Peck, Director
For additional Information write to:
Chief, Caribbean District, WRDU.S. Geological SurveyGPO Box 4424San Juan, Puerto Rico 00936
Copies of this report can be purchased from:
U.S. Geological Survey Books and Open-File Reports Federal Center, Bldg. 4 1 Box 25425 Denver, Colorado 80225

IllCONTENTS
Figure 5,
Figure 6,
Figure 7,
Figure 8,
Hydrograph showing mean daily discharge at San Pedro Spring near Arecibo, October 1983-June 198A ....
Hydrographs showing comparison of rainfall todischarge at Rio Tanama near Utuado, San PedroSpring near Arecibo and Rio Tanama atCharco Hondo, October 1983-June 198A.............
Hydrograph showing mean daily discharge of Bafios de Coamo near Coamo, November 1983-July 198A ......
Page
Abstract ...................................................... 1Introduction .................................................. 1
Purpose and scope ........................................ 2Methods and procedures ................................... 2Previous investigations .................................. 3Spring numbering system .................................. 3
Hydrogeologic setting ......................................... 6The origin of springs in Puerto Rico ..................... 6Principal springs of the North Coast ..................... 7Principal springs of the South Coast ..................... 9
Physical, chemical, and bacteriologicalcharacteristics of spring waters ......................... 10Physical characteristics.................................. 10
Springflow ......................................... 10Specific conductance, pH,
and temperature ............................... 18Chemical characteristics ................................. 20
Chemical characteristics ofspring water .................................. 20
General water quality .............................. 23Bacteriological characteristics .......................... 27
Conclusions ................................................... 29References .................................................... 30
ILLUSTRATIONSPage
Figure 1. Map showing surficial geology and locationsof springs ..................................... A
Figure 2. Diagram showing the hydrologic cycle on thenorth coast of Puerto Rico...................... 6
Figure 3. Map showing geologic formations of the northcoast limestone area ........................... 8
Figure A. Hydrograph showing mean daily discharge of Ojo de Agua Spring at Vega Baja, October 1983- June 198A....................................... 12
1A
Map showing Stiff diagrams for chemical character of the principal springs in Puerto Rico ......
15
17
22

IV
TABLES
Page Table 1. Map number, latitude and longitude, and name of
principal springs in Puerto Rico ................ 5
Table 2. Instantaneous water discharge of the principalsprings of Puerto Rico, 1982-84 ................. 11
Table 3. Mean daily discharge of Ojo de Agua at Vega Baja,July 1983-June 198A ............................. 13
Table A. Mean daily discharge of San Pedro Spring nearArecibo, June 1983-June 198A .................... 1A
Table 5. Mean daily discharge of Bafios de Coamo near Coamo,November 1983-June 198A ......................... 17
Table 6. Mean daily specific conductance and temperature of Bafios de Coamo near Coamo, February 1983- March 198A ...................................... 19
Table 7. Physical, chemical, and bacteriological characteristicsof the principal springs of Puerto Rico, 1982-83. 2A
Table 8. Trace metals at the principal springs of PuertoRico, 1982-83.................................... 28
CONVERSION FACTORS
The following conversion table is included for the convenience of those who prefer to use the SI (International System of Units or metric units) rather than the inch-pound system of units. Concentrations of chemical parameters are given in milligrams per liter (mg/L) or micro- grams per liter (ug/L), which are for the values presented numerically equal to parts per million (ppm) and parts per billion (ppb) respec tively. Specific conductance values are given in microsiemens per centimeter at 25 degrees Celsius (pS/cm at 25°C).
Multiply inch-pound units
inches (in.) feet (ft) miles (mi)
acres miles (mi )
gallons (gal) acre-feet (acre-ft) cubic feet (ftp cubic miles (mi ) million gallons (Mgal)
By
LenRth
25.400.30481.609
Area
A,0472.590
Volume
3.7851,233
0.028324.168
3,785
To obtain metric units
millimeters (mm) meters (m) kilometers (km)
square meters (m ) ~ square kilometers (km )
liters (L) ~ cubic meters (m_) cxibic meters (m ) cubic kilometers«(km ) cubic meters (m )
Volume Per Unit Time
gallons per minute(gal/min)
cubic-feet per second(ftJ /s)
million gallons per day (Mgal/d)
degrees Fahrenheit (°F)
micromhos per centimeter at 25 degrees Celsius (umhos/cm at 25°C)
liters per second (L/s)
cubicQmeters per second
cubic^meters per second (mJ /s)
0.06308
.02832
.04381
Temperature
°C = 0.56 (°F-32 ) degrees Celsius (°C)
Specific Conductance
1.0
microsiemens per centi meter at 25 degrees Celsius US/cm at 25°C)
HYDROLOGY AND WATER QUALITY OF THE
PRINCIPAL SPRINGS IN PUERTO RICO
By Senen Guzman-Rfos
ABSTRACT
Springs are a valuable natural resource in Puerto Rico that can be utilized to supplement domestic water-supply sources or for recreational purposes. The hydrology and water quality of the principal springs in Puerto Rico were investigated from 1982-84. Seventeen springs were selected for the study to determine flow and physical, chemical, and bacteriological characteristics of spring-water. Most of the springs (14) are located in the north coast limestone area. Two springs on the south coast have thermal properties. Maximum recorded springflow occurred at San Pedro Spring near Arecibo, where as much as 35 cubic feet per second (about 22.6 million gallons per day) were discharged. Average springflow from the 17 springs totals 36 cubic feet per second (approximately 23.5 million gallons per day).
Calcium, bicarbonate, sodium, chloride, and sulfate are the principal ions in spring water. Most of the springs along the north coast have waters of the calcium-magnesium-bicarbonate type. Several springs in coastal areas are affected by seawater intrusion and the waters are of the sodium-chloride type. Banos de Coamo near Coamo are the most important thermal springs, discharging from 0.05 to 0.13 cubic feet per second (32,000 to 83,000 gallons per day). Mean daily water temperature at this spring is 43 degrees Celsius. Fecal coliform and fecal strepto cocci bacteria are present in most of the springs in concentrations ranging from 1 to 2200 colonies per 100 milliliters of sample.
INTRODUCTION
There are a large number of fresh and saline-water springs throughout Puerto Rico, some of which discharge significant amounts of water. The springs are a valuable natural resource that could be utilized to supplement domestic water supply sources or used for recreational purposes.
Until recently, the magnitude of the flow and quality of the water from those springs had not been investigated in detail. In 1982, in cooperation with the Water Resources Research Institute of the University of Puerto Rico (WRRI-UPR) and the Puerto Rico Department of Natural Resources, the U.S. Geological Survey began a two-year study of the hydrology and geochemistry of the principal springs of the island. Preliminary results of the data collected through 1983 were published in the report "Reconnaissance of the Principal Springs of Puerto Rico, 1982-83" (Guzman-Rios, 1983). This report summarizes the data collected during the project and presents an analyses of the hydrology and water quality of the springs included in the investigation.
1

INTRODUCTION (Continued)
Purpose and Scope
The principal objectives of the investigation were to determine the principal physical, chemical and bacteriological characteristics of the springs and to evaluate their use for water supply or recreational purposes.
The objectives were accomplished by measuring the instantaneous discharge from the springs at different times during the year and to determine any seasonal variations. At selected springs, discharge was measured on a continuous basis to establish a data base necessary for future development of water resources. Water samples were collected from the 17 springs twice during the study and analyzed to better define the chemistry and quantify the concentrations of possible contaminants in ground waters. Bacteriological analyses were also performed to quantify the fecal coliform and fecal streptoccocal bacteria in ground waters and better define the suitability of the water for human consumption and recreational purposes. Field determinations were made for pH, total alkalinity, specific conductance, and temperature.
Continuous-recording gaging stations were installed at three of the springs to record water stage and relate it to discharge measurements. At one of the springs, continuous monitoring devices were installed to record specific conductance and temperature on an hourly basis. Records of springflow and water quality provide a good measure of long-term hydrologic trends. A spring is more representative of the character of a large part of an aquifer than a ground-water well.
Methods and Procedures
Water samples from each of the springs included in the investigation were collected at least twice during the study period. The samples were collected as close to the spring's source as possible utilizing methods described by Wood (1976). During the August 1983 sampling, La Cambija Spring at Cano Tiburones was sampled 100 ft. below the previous sampling site for reasons of inaccessibility. Pozo de la Virgen near Sabana Grande was not sampled because it was dry. Determinations made in the field included pH, specific conductance, temperature, total alkalinity as CaCO,,, and concentration of the fecal coliform and fecal streptoccocal group of bacteria. Raw water samples were filtered at the site and preserved for further analyses according to procedures described by Brown and others (1970). The samples were analyzed at the U.S. Geological Survey National Water Quality Laboratory-Atlanta in Doraville, Georgia for most common ions (Ca, Mg, Na, K, Cl, SO^, F, Si02 , Br), trace metals (Al, As, Ba, Be, B, Cd, Cr, Co, Cu, Fe, Pb, Li, Mn, Hg, Mo, Se, Sr, V, Zn), nutrients (total nitrogen, nitrite plus nitrate, ammonia, ammonia plus organic nitrogen, and phosphorus), dissolved cyanide organic carbon (DOC) and dissolved cyanide (CN), and total sulfide (S). Results for nutrients, DOC, CN, and S were published in a previous report (Guzman-Rios, 1983). Procedures described by Greeson and others (1977) were used for the collection and analyses of the bacteria samples. Immediately after filtering through 0.70 micrometers filters, incubation of the bacteria samples began.
Methods and Procedures (Continued)
Springflow measurements were made at most of the springs at least five times during the study period. Methods described by Rantz and others (1982) were utilized for the flow measurements. At three of the springs (Ojo del Agua at Vega Baja, San Pedro near Arecibo, and Bafios de Coamo near Coamo) recording devices were installed to measure the springflow on a continuous basis. The temperature and specific conduc tance at the Bafios de Coamo spring was also monitored on a continuous basis with a recording instrument.
Previous Investigations
A previous study by Giusti (1978) showed that virtually hundreds of springs existed throughout Puerto Rico. Most of the springs occur along the north-coast limestone belt from Aguada to Loiza. A field reconnaissance in November 1982 led to the selection of 17 springs to meet the objectives of this study. The main^selection criterion was spring discharge greater than 0.01 cubic ft /s (approximately 6,500 gal/d).
Springs Numbering System
Locations of the springs included in this survey and the geologic formations of Puerto Rico are shown in figure 1. Fourteen (14) of the springs occur within the limestone formations of the north coast. An arbitrary numbering system was utilized to identify the springs in this report. The spring closest to San Juan was assigned the number one (1). Numbering of the springs proceeds in a counterclock-wise direction around the island. Latitude-longitude identifiers were determined and are included in table 1 with the name of each spring.

67
°00
*
18°30'-
66
030'
-|
AR
EC
IBO
__B
AR
CE
LO
NE
TA
66°0
0'
SA
N
JU
AN
LO
IZA
18°0
0
EX
PL
AN
AT
ION
QU
AT
ER
NA
RY
S
UR
FIC
IAL
D
EP
OS
ITS
MIO
CE
NE
S
ED
IME
NT
AR
Y
RO
CK
S
OL
IGO
CE
NE
S
ED
IME
NT
AR
Y
RO
CK
S
INT
RU
SIV
E
IGN
EO
US
R
OC
KS
PR
E-O
LIG
OC
EN
E V
OL
CA
NIC
A
ND
S
ED
IME
NT
AR
Y
RO
CK
S
P
SE
RP
EN
TIN
ITE
A
ND
C
HE
RT
FA
UL
T
SP
RIN
G
AN
D S
ITE
N
UM
BE
R-
Nu
mb
ers
are
re
ferr
ed
to
Ta
ble
1.
Fig
ure
1.-
-Su
rfic
iai
ge
olo
gy
an
d l
ocati
on
of
sp
rin
gs
.

Table 1. Site number, latitude and longitude, and name of principal springs In Puerto Rico
Map No. Latitude & Longitude
1
2
3
A
5
6
7
8
9
10
11
12
13
1A
15
16
17
18°2A'A6"N. 66°15'55"W.
18°26'57"N. 66°25'06"W.
18°20'OA"N. 66 0 26'38"W.
IS^O'lQ"!*. 66 0 28'53"W.
18°22'18"N. 66°29'10"W.
18°25'A1"N. 66°31'36"W.
18°28 I 25"N. 66°35'53"W.
18°27'2A"N. 66°39'20"W.
18°2A'35"N. 66°A1'A5"W.
18°2A'10"N. 66°A7'A3"W.
18°23'59"N. 66°A8 ! 16"W.
18°23 ! A4"N. 66°53 I AA"W.
18 0 20'06"N. 66°56 I A6"W.
18°26'02"N. 67 0 09'17"W.
18°05'A3"N. 66°56'50"W.
18°02 I 2A"N. 66°36 I A2"W.
18°02'19"N. 66°22'25"W.
Spring Name
Maguayo spring at highway 693 near Dorado
Ojo de Agua spring at Vega Baja
Ojo de Agua at Torrecillas near Morovis
Represa Sonadora de Ciales at Ciales
Aguas Frias spring near Ciales
Ojo de Guillo spring near Manati
La Cambija spring at Cafio Tiburones
Zanja Fria spring at Cafio Tiburones
San Pedro spring near Arecibo
Sonadora spring near Camuy
Tiburon spring near Camuy
Sumbadora spring at Los Puertos near Camuy
Salto Collazo spring near San Sebastian
Ojo de Agua spring at Aguadilla
Pozo de la Virgen near Sabana Grande
Banos Quintana near Ponce
Bafios de Coamo near Coamo

HYDROGEOLOGIC SETTING
The Origin of Springs in Puerto Rico
Springs occur in many geologic settings and have been classified as to their source, cause, discharge, temperature, and variability. Springs may result from volcanic activity, rock fissures, depressions in the terrain, artesian conditions, contact between formations of different porosity, solution channels, or fractures in the rocks (Bryan, 1919). The water discharging from springs is one element in the hydrologic cycle (fig. 2). Water that infiltrates to the subsurface may eventually be discharged as springflow.
Thermal springs can be produced by chemical reactions (nuclear and non-nuclear) below the surface (Young and Lewis, 1982). Energy-producing reactions (exothermic) may heat the ground water, which may escape to the surface through fissures due to the temperature-pressure gradient.
WINDS
//X ' ' f ! ' / * ' ! ' / ' I / I i DRAINAGE
/ / 77 '/ /-'-///// EVAPORATION AND TRANSPIRATION CHANNELS
//////////////' ' IN8WAMP/fe'7^///7'
Q^c^ ^v f i. 11 WATERTABLE ARTESIAN
-WELL___WELL
rs A
COO< z^DC COO.CO
SOLAR RADIATION
tEVAPORATION
;r:̂ v -^BFACIJ
SEAWATER
CRETACEOUS ROCKS ILLUSTRATION NOT TO SCALE
Figure 2. The hydrologic cycle on the north coast of Puerto Rico.
The Origin of Springs in Puerto Rico (Continued)
Depression, contact, artesian, and solution conduit springs are all affected by hydrostatic pressures. Depression springs occur when the land surface slopes down to the water table. Contact springs result from the difference in porosity between two adjoining geologic formations. Water moving from one formation into another of less permeability may not infiltrate completely. This excess water may discharge to the surface in response to increasing hydrostatic head. Artesian springs result from the effects of a confining layer on an aquifer. The water under pressure from the confined aquifer may be released at an outcrop of the aquifer. A fissure, fracture, or a more permeable facies may also be the outlet for the artesian spring. Conduit or solution-channel springs occur when the aquifer or soil material is easily dissolved, creating a pathway for water to discharge to the surface. A hydrostatic head greater than the elevation of the outlet is required to produce the flow. In Puerto Rico, all of these types of springs are known to occur.
The principal springs in Puerto Rico occur mostly in limestone or volcanic rocks. Along the north coast, where the average annual precipitation is about 70 inches per year, (Calvesbert, 1961) springflow occurs from each of the limestone formations described by Monroe (1980). Although precipitation is high (80 in/yr) in the central part of the island, springflow issuing from the volcanic rocks is low. Along the south coast a much lower average annual precipitation rate (35 in/yr), and aquifers of much lower permeability (limestone and alluvial sediments), inhibit spring occurrence.
Principal Springs of the North Coast
Springs of the north coast are associated with various limestone formations that occupy an area of about 620 mi 2 between Aguada and Loiza (fig. 3). About one fifth of the island is covered by a tropical karst formed on a series of six limestone formations: San Sebastian Formation, Lares Limestone, Cibao Formation, Aguada Formation, Aymamon Limestone, and Camuy Formation. The San Sebastian formation underlies all the other limestone formations (Monroe, 1980). It consists primarily of clay and sandy clay, has a low permeability and in many areas acts as a confining layer. The Ojo de Agua spring at Torrecilla (number 3 in fig. 3) issues from the San Sebastian Formation.
The springs Represa Sonadora near Ciales, Aguas Frias near Ciales, and Salto Collazo near San Sebastian (numbers A, 5, and 13, fig. 3) emerge from the Lares Limestone. Aguas Frias spring is the resurgence of the Rio Encantado cave system. Represa Sonadora and Salto Collazo springs flow from the vicinity of the contact with the San Sebastian Formation, and may result from the differences in permeabilities between the two geologic formations. The Lares Limestone is predominantly calcium carbonate (CaCO.,) with varying permeability, but in general is much more permeable than the San Sebastian Formation (Giusti, 1978).

rf*c?
«*>*
<**#
\° A\
O^e
0"
$r
a0̂
AR
EC
IBp
/o
^
B
AR
CE
LO
NE
TA
<
&'
.#
P<
£l
/ o ^
H--£
^-^^^^
/***&
>~
~^
j**'
*jH
!^^:
. r£
5>
T*r^
T^ "
~
~""
"~ ^^^»*%
jjj^
~^^-|
^|-
-j^^-^
-^-
jlk-^
x^pz^r.
....... zz^z^r.
:.^vj»
n
20
K
ILO
ME
TE
RS
EX
PL
AN
AT
ION
SU
RF
ICIA
L
DE
PO
SIT
S
CA
MU
Y
FO
RM
AT
ION
AY
MA
MO
N
LIM
ES
TO
NE
AG
UA
DA
L
IME
ST
ON
E
CIB
AO
F
OR
MA
TIO
N
CIB
AO
F
OR
MA
TIO
NM
ON
TE
BE
LL
O
LIM
ES
TO
NE
M
EM
BE
R
LA
RE
S
LIM
ES
TO
NE
SA
N
SE
BA
ST
IAN
F
OR
MA
TIO
N
1 S
PR
ING
L
OC
AT
ION
A
ND
N
UM
BE
R
Fig
ure
3. G
eo
log
ic
form
ati
on
s o
f th
e n
ort
h co
ast
lim
esto
ne are
a.
(Ad
ap
ted
fro
m G
lus
tl,
1978.)
HYDROGEOLOGIC SETTING (Continued)
Principal Springs of the North Coast (Continued)
The San Pedro spring near Arecibo, one of the largest springs in the island, and Sonadora and Tiburon springs near Camuy, emerge from the Cibao Formation (numbers 9, 10, and 11, fig.3). San Pedro spring issues from the top of the Montebello Limestone Member of the Cibao Formation. This limestone is confined by clastic layers in the upper Cibao Formation (Giusti, 1978). The Montebello Limestone Member is one of the most productive artesian aquifers of the north coast of Puerto Rico (Monroe, 1980). Sonadora spring and Tiburon spring emerge from the upper part of the Cibao Formation or from the contact zone between the Cibao Formation and the overlaying Aguada Limestone.
The Maguayo spring near Dorado, Sumbadora spring near Camuy, and Ojo de Agua at Aguadilla, discharge from the upper part of the Aguada Limestone (numbers 1, 12 and 1A, fig. 3). The Aguada Limestone is generally a hard, thick-bedded, layered limestone, alternating with chalky and rubbly layers and fair to poor permeability. Ojo de Agua at Aguadilla is near the coast, higher in the formation than the other locations of ground-water discharge from the aquifer (Giusti, 1978).
The more numerous springs along the north coast issue from the Aymamon Limestone. Ojo de Agua near Vega Baja, Ojo de Guillo near Manati, La Cambija and Zanja Fria at Cafio Tiburones, (numbers 2, 6, 7, and 8, fig.3) flow from this formation. The Aymamon Limestone is the most permeable of the limestone formations of the north coast. Permeability due to solution is common in the outcrops of the formation. These four springs flowing from the Aymamon are located near the contact zone with the blanket sands that overlie the Aymamon Limestone in the north coastal plains.
Principal Springs of the South Coast
The other three springs included in this investigation flow from volcanic rocks along the south coast near Sabana Grande, Ponce, and Coamo where springflow is limited by lower precipitation. Two of the springs (Bafios Quintana near Ponce and Banos de Coamo near Coamo), (numbers 16 and 17, fig.l) have higher than normal water temperatures (thermal properties). The source of these springs is unknown, although several hypotheses have been suggested. Giusti (1973) suggested that the natural geothermal gradient of the earth with depth could be the heat source. The springs are recharged locally probably along fault zones where water may travel to depths of A,000 to 5,000 ft. The water would be heated by the increase in temperature in the Earth's crust. A fault or fracture would allow the water to reach the surface at a temperature much higher than when it entered the recharge area. The springflow is produced by the head differential between the points of recharge and discharge, and temperature-pressure differentials. The water temperature probably decreases slightly as it rises and mixes with infiltration from local rainfall.

10
HYDROGEOLOGIC SETTING (Continued)
Principal Springs of the South Coast (Continued)
Another hypothesis suggests that exothermic chemical reactions could be occurring with a large amount of heat generated, absorbed and transported by the water. A typical example of this condition is the reduction of sulfate (SO, ) by sulfate bacteria in anaerobic condition as occurs in sanitary landfills. In those places, the temperature is known to increase by as much as 12 degrees Celsius (°C) above mean ambient temperature (Gomez-Gomez, 1980). However, a source of organic carbon would have to be available for this process.
The third spring investigated along the south coast (Pozo de la Virgen Spring near Sabana Grande, number 15, fig. l) is small and intermittent during periods of low rainfall. The spring is located within the volcanics rocks of central Puerto Rico. Its ephemeral flow indicates that it originates from small fractures replenished by recharge from rainfall. It has more importance as an attraction to religious groups than as a potential water resource.
PHYSICAL, CHEMICAL, AND BACTERIOLOGICAL CHARACTERISTICS OF SPRING WATERS
Physical Characteristics
Springflow
Flow magnitude is the most important physical characteristic of a spring that may be developed as a water-supply source. A system for spring classification based on discharge magnitude was developed by Meinzer (1927). An order of magnitude from 1 to 8 was assigned on the basis of flow as follows (modified from Meinzer):
ORDER OF AMOUNT OF FLOW MAGNITUDE ft /s
1 > 1002 10 to 1003 1 to 104 0.222 to 1.05 0.022 to 0.2226 0.002 to 0.027 <0.0028 <0.0002
On the basis of the above classification system, the breakdown for the seventeen springs considered in this study is as follows:
ORDER OF NUMBER OF MAGNITUDE SPRINGS
3 6A 55 46 2
Ta
ble
2
. In
sta
nta
ne
ou
s
wate
r d
isc
ha
rge
o
f th
e[Abbreviations: ft
/s=cubic feet per second;
Mgal/d=Million gallons
pri
ncip
al
sp
rin
gs
o
f P
ue
rto
Ric
o,
1982-8
4p
er
day
; --
- no
data
avail
ab
le]
SITE
NUMBER /
1 2
DATE
INSTANTANEOUS
WATER
DISCHARGE
ft3/s(Mgal/d)
/
^
fDec.
6, 1982
Mar.
3,
19
83
Apr.
28
, 19
83
Aug.
5,
1983
Jan.
30,
1984
Nov.
30,
1982
Mar.
3,
1983
Apr. 28
, 19
83
July
21
, 19
83
Aug. 11,
1983
Dec.
6,
19
83
Jan.
30
, 19
84
Mar. 23,
1984
May
18,
1984
I Ju
ne 26,
1984
3 Dec.
9, 19
82
Feb. 24
, 19
83
May
3, 19
83
, Aug.
5, 19
83
Ja
n. 25
, 1984
4 Dec.
9, 19
82
Feb.
24,
1983
May
3, 1983
0.52 (0
.34)
.40
( .2
6)
1.7
(1.1
)
.77
( .5
0)
.80
( .5
2)
.63
( .4
1)
.90
( .5
8)
1.3
( .84)
.33
( .21)
3.9
(2.5
)
3.0
(1.9
)
... .29
( .1
9)
.98
( .63)
1.2
( .7
8)
.18
( .12)
.17
( .1
1)
.19
( .12)
.04
( .03)
.02
( .0
1)
.54
( .35)
.27
( .1
7)
.26
( .1
7)
SITE
NUMBER /
4 5 6 7 8 9
DATE
INSTANTANEOUS
WATER
DISCHARGE
ft3/s(Mgal/d)
/
\'Aug.
5, 19
83
Jan. 25,
1984
Dec. 16
, 1982
Mar.
3, 1983
May
3, 1983
Aug.
11
, 19
83
Jan. 25,
1984
Nov. 30,
1982
Mar.
2,
1983
Apr. 28,
1983
Aug.
4, 1983
Jan. 30
, 19
84
Dec.
8, 1982
Feb. 24,
1983
Apr. 26,
1983
Aug.
4, 1983
Mar. 29,
1984
Dec.
8, 1982
Feb.
24
, 1983
Apr. 26,
1983
Aug.
4, 1983
Dec.
1, 1982
Feb.
23,
1983
0.16 (0.10)
.27
( .1
7)
10
(6.5
)
10
(6.5
)
11
(7.1
)
6.1
(3.9
)
5.3
(3.4
)
1.6
(1.1
)
.95
( .61)
1.5
( .98)
1.5
( .98)
.94
( .6
1)
9.2
(6.0
)
9.0
(5.8
)
9.4
(6.1
)
9.9
(6.4
)
7.5
(4.8
)
10
(6.5
)
7.3
(4.7
)
9.3
(6.0
)
9.5
(6.1
)
16
(10
)
8.4
(5.4
)
SITE
NUMBER /
9 10 11
DATE
INSTANTANEOUS
WATER
DISCHARGE
ft3/s(
Mgal
/d)
''Ap
r. 26
, 1983
June 24,
1983
July 21,
1983
Aug
. 3,
19
83
Sept
. 7, 19
83
Dec.
6, 19
83
Mar
May
. 23
, 19
84
18,
1984
June 26
, 19
84
Dec
Mar
Apr
Aug
. 14,
1982
. 2, 1983
. 27,
1983
. 9,
1983
Nov. 23,
1983
Dec
. 7, 19
82
Mar.
2, 1983
Apr
Aug
. 27,
1983
. 8,
1983
Nov. 23
, 1983
12 |
Dec
Mar
. 7,
1982
. 2,
1983
! Apr. 27
, 1983
Aug
. 9,
19
83
12
(7.8
)
16
(10
)
8.1
(5.2
)
8.4
(5.4
)
5.0
(3.2
)
7.7
(5.0
)
3.3
(2.1
)
4.2
(2.7
)
6.5
(4.2
)
.24
( .16)
.03
( .0
2)
.10
( .06)
.14
( .09)
.16
( .10)
.58
( .37)
.29
( .1
9)
.67
( .43)
.53
( .3
4)
.72
( .42)
.58
( .37)
.23
( .15)
.36
( .23)
.38
( .25)
SITE
NUMBER
12 13 14 15 16 17
DATE
INSTANTANEOUS
WATER
DISCHARGE
ft3/s(Mgal/d)
'Nov
. 23,
igS^
Dec.
1, 19
82
Feb.
23,
1983
Apr. 27
, 19
83
Aug.
3, 19
83
Jan. 24,
1984
Dec.
2, 1982
Feb.
23
, 19
83
Apr. 28,
1983
Aug.
3, 19
83
Jan. 30
, 1984
Dec.
2, 1982
Feb.
23
, 19
83
Apr. 29,
1983
Aug.
10,
1983
Dec. 15,
1982
Feb.
25
, 19
83
Apr. 29
, 19
83
Aug.
10,
1983
, De
c.
3, 19
82
Feb.
25,
1983
Apr. 29,
1983
Aug.
10,
1983
0.36 (0
.23)
.44
( .28)
.17
( .11)
.17
( .11)
.03
( .02)
.09
( .06)
2.1
(1.4
)
.70
( .45)
1.0
( .65)
1.0
( .65)
.48
( .31)
.01
( .0
1)
.00
( .00)
.00
( .00)
DRY
.03
( .02)
.01
( .01)
.02
( .01)
.02
( .01)
.11
( .07)
.06
( .04)
.09
( .06)
.06
( .04)
12
PHYSICAL. CHEMICAL, AND BACTERIOLOGICAL CHARACTERISTICS OF SPRING WATERS (Continued)
Physical Characteristics (Continued)
Springflow (Continued)
Except for the Pozo de la Virgen Spring near Sabana Grande all of the springs were perennial during the study period (table 2). Interviews with local residents indicate that perennial flow occurs in the other springs even during long droughts. Along the north coast, the abundance and uniformity of rainfall is probably the main factor for maintaining perennial flow conditions. The flow of the thermal springs of the south coast appears to respond to factors other than precipitation, as they are not affected significantly by limited rainfall.
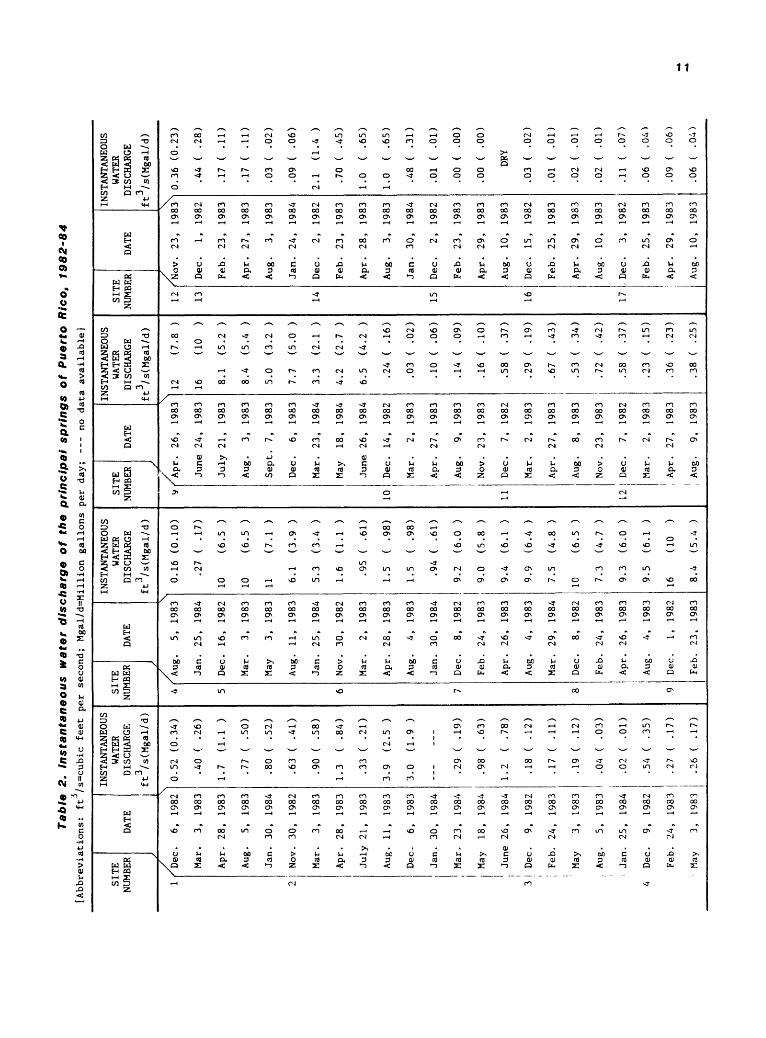
3 Average springflow from the 17 springs totals 36 ft /s (23.5 Mgal/d).
However, the total amount of springflow available from springs throughout Puerto Rico may be as much as 50 ft /s (32 Mgal/d) including known springs not considered in this study.
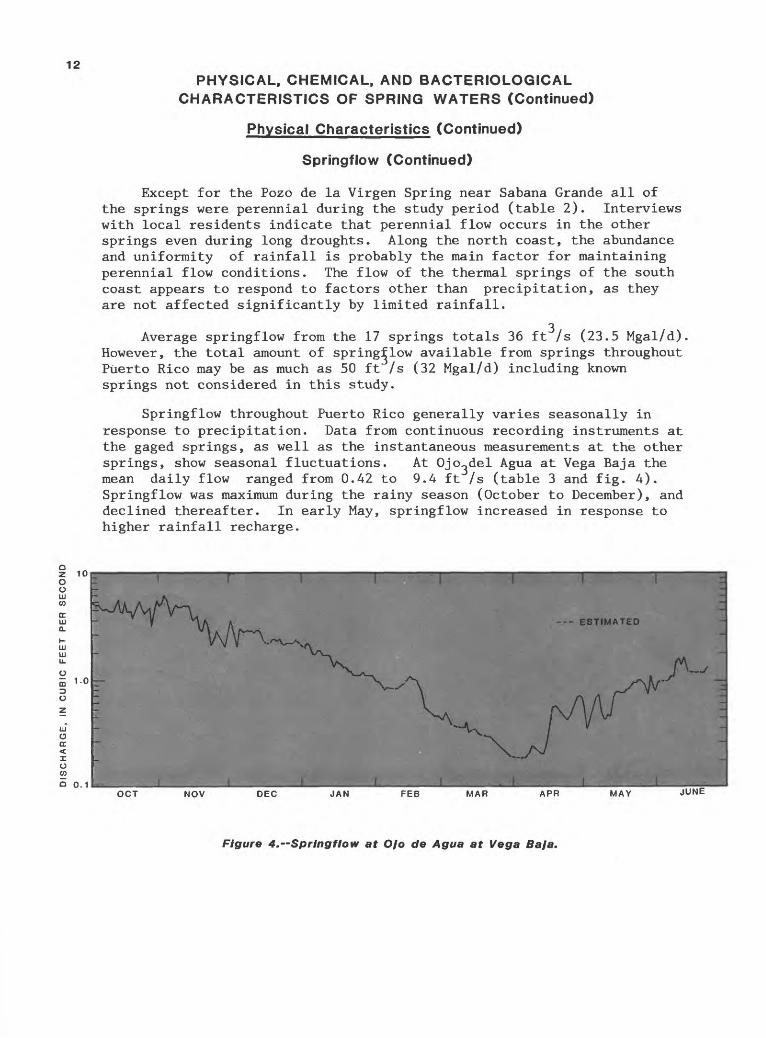
Springflow throughout Puerto Rico generally varies seasonally in response to precipitation. Data from continuous recording instruments at the gaged springs, as well as the instantaneous measurements at the other springs, show seasonal fluctuations. At Ojo^del Agua at Vega Baja the mean daily flow ranged from 0.42 to 9.4 ft /s (table 3 and fig. 4). Springflow was maximum during the rainy season (October to December), and declined thereafter. In early May, springflow increased in response to higher rainfall recharge.
10
mLL
Oo 1-0
oz
ill a ccXo
o 0.1
./-:
OCT NOV DEC JAN FEB MAR APR MAY JUNE
Figure 4.--Springflow at O/o de Agua at Vega Baja.
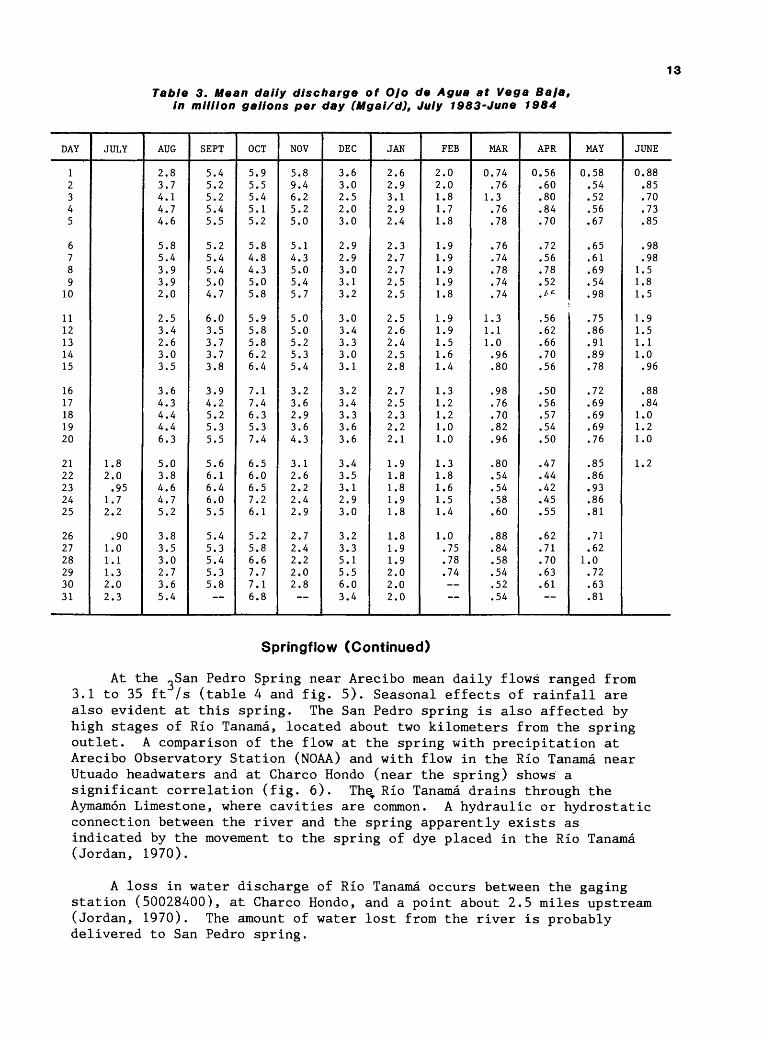
Table 3. Mean dally discharge of O/o de Agua at Vega Baja, In million gallons per day CMgal/d), July 1983-June 1984
13
DAY
12345
6789
10
1112131415
1617181920
2122232425
262728293031
JULY
1.82.0.95
1.72.2
.901.01.11.32.02.3
AUG
2.83.74.14.74.6
5.85.43.93.92.0
2.53.42.63.03.5
3.64.34.44.46.3
5.03.84.64.75.2
3.83.53.02.73.65.4
SEPT
5.45.25.25.45.5
5.25.45.45.04.7
6.03.53.73.73.8
3.94.25.25.35.5
5.66.16.46.05.5
5.45.35.45.35.8
OCT
5.95.55.45.15.2
5.84.84.35.05.8
5.95.85.86.26.4
7.17.46.35.37.4
6.56.06.57.26.1
5.25.86.67.77.16.8
NOV
5.89.46.25.25.0
5.14.35.05.45.7
5.05.05.25.35.4
3.23.62.93.64.3
3.12.62.22.42.9
2.72.42.22.02.8
DEC
3.63.02.52.03.0
2.92.93.03.13.2
3.03.43.33.03.1
3.23.43.33.63.6
3.43.53.12.93.0
3.23.35.15.56.03.4
JAN
2.62.93.12.92.4
2.32.72.72.52.5
2.52.62.42.52.8
2.72.52.32.22.1
1.91.81.81.91.8
1.81.91.92.02.02.0
FEE
2.02.01.81.71.8
1.91.91.91.91.8
1.91.91.51.61.4
1.31.21.21.01.0
1.31.81.61.51.4
1.0.75.78.74
MAR
0.74.76
1.3.76.78
.76
.74
.78
.74
.74
1.31.11.0.96.80
.98
.76
.70
.82
.96
.80
.54
.54
.58
.60
.88
.84
.58
.54
.52
.54
APR
0.56.60.80.84.70
.72
.56
.78
.52
.l-f-
.56
.62
.66
.70
.56
.50
.56
.57
.54
.50
.47
.44
.42
.45
.55
.62
.71
.70
.63
.61
MAY
0.58.54.52.56.67
.65
.61
.69
.54
.98
.75
.86
.91
.89
.78
.72
.69
.69
.69
.76
.85
.86
.93
.86
.81
.71
.621.0.72.63.81
JUNE
0.88.85.70.73.85
.98
.981.51.81.5
1.91.51.11.0.96
.88
.841.01.21.0
1.2
Springflow (Continued)
At the -San Pedro Spring near Arecibo mean daily flows ranged from 3.1 to 35 ft /s (table 4 and fig. 5). Seasonal effects of rainfall are also evident at this spring. The San Pedro spring is also affected by high stages of Rio Tanama, located about two kilometers from the spring outlet. A comparison of the flow at the spring with precipitation at Arecibo Observatory Station (NOAA) and with flow in the Rio Tanama near Utuado headwaters and at Charco Hondo (near the spring) shows a significant correlation (fig. 6). The^ Rio Tanama drains through the Aymamon Limestone, where cavities are common. A hydraulic or hydrostatic connection between the river and the spring apparently exists as indicated by the movement to the spring of dye placed in the Rio Tanama (Jordan, 1970).
A loss in water discharge of Rio Tanama occurs between the gaging station (50028400), at Charco Hondo, and a point about 2.5 miles upstream (Jordan, 1970). The amount of water lost from the river is probably delivered to San Pedro spring.

14
Table 4. Mean dally discharge of San Pedro Spring near Areclbo, in million gallons per day (Mgal/d), June 1983-June 1984
DAY
12345
6789
10
1112131415
1617181920
2122232425
262728293031
JUNE
1616
1616151514
JULY
1414141315
1413131210
9.79.79.08.98.9
8.78.88.58.28.0
8.18.28.28.68.3
8.28.28.28.38.38.4
AUG
8.58.58.48.37.7
7.47.57.47.67.3
7.28.47.47.57.5
7.27.87.57.07.0
7.27.37.06.96.8
7.07.37.26.77.37.4
SEPT
7.16.86.76.86.8
6.86.46.26.26.0
6.06.16.05.95.9
6.06.0
12156.7
6.46.06.06.06.8
121211127.7
OCT
6.56.36.16.06.0
5.96.8
202417
1514131211
8.97.7
102129
2622181724
211716161515
NOV
1514152825
2018171614
109.59.19.08.7
8.48.38.07.97.9
7.87.77.67.67.6
7.67.67.67.67.5
DEC
7.47.47.57.57.6
7.67.67.67.57.5
7.57.57.47.47.4
7.27.57.87.47.0
6.96.66.56.56.5
6.56.66.46.46.36.5
JAN
6.36.26.26.56.4
6.56.56.56.56.2
6.26.26.56.36.1
6.26.05.95.95.9
5.95.85.85.85.8
5.65.65.75.85.65.5
FEE
5.35.35.35.25.1
5.15.15.05.15.4
5.75.25.05.46.0
6.16.16.05.85.9
5.86.05.55.55.5
5.45.35.15.1
MAR
5.14.74.14.14.0
4.03.93.73.73.8
3.83.63.53.53.5
3.53.63.53.63.6
3.43.63.23.23.1
3.33.23.23.33.33.3
APR
3.43.43.43.33.5
3.53.43.53.63.6
3.73.83.83.83.9
3.93.94.04.04.0
4.04.14.04.04.0
4.24.44.34.34.3
MAY
4.24.24.44.74.5
4.64.64.54.84.7
4.74.84.95.15.0
5.24.54.84.84.5
6.61611137.5
7.213105.85.04.6
JUNE
4.34.24.15.87.4
3533181118
139.67.36.96.4
6.19.8
119.37.9
8.77.86.76.36.1
6.36.36.26.16.0
OCT NOV DEC JAN FEB MAR APR MAY JUNE
Figure S. Hydrograph for San Pedro Spring near Areclbo, October 1983-June 1984.

if s ??>
* 2*5
a 3*
2.a,
vta
«H
O81 *
;5
1-
o »
!»
3
3 J,
Q- °-
2 P
,° 8
O *
n 5
o g
o *
3
^0
-» ^
??s
5 ?s
* 3
2(o
O
« ?
«
?
5-5 p§ a
RA
INF
AL
L,
IN
INC
HE
SD
ISC
HA
RG
E,
IN C
UB
IC F
EE
T P
ER
SE
CO
ND
_*
-*
o
-*_i
O
O
O
o
m
o m a> > -< c "2. m
o
m a
x
O CO o o z
m 33 m
o m
O

16
PHYSICAL, CHEMICAL, AND BACTERIOLOGICAL CHARACTERISTICS OF SPRING-WATERS (Continued)
Physical Characteristics (Continued)
Springflow (Continued)
Turbid flow occasionally occurs in some springs in Puerto Rico. At springs that are hydraulically connected to a sediment-laden river, turbid discharge may occur during high river flow. When high river stages inundate the spring opening, the spring flow is decreased. As the river stage lowers, the water that inundated the spring is discharged along with suspended-sediment. In sinkhole areas flooding due to high river stages and surface runoff containing suspended-sediment may recharge shallow aquifers and move quickly through solution channels to discharge from nearby springs. This sediment-laden discharge has been observed at Ojo de Guillo near Manati and Aguas Frias near Ciales springs.
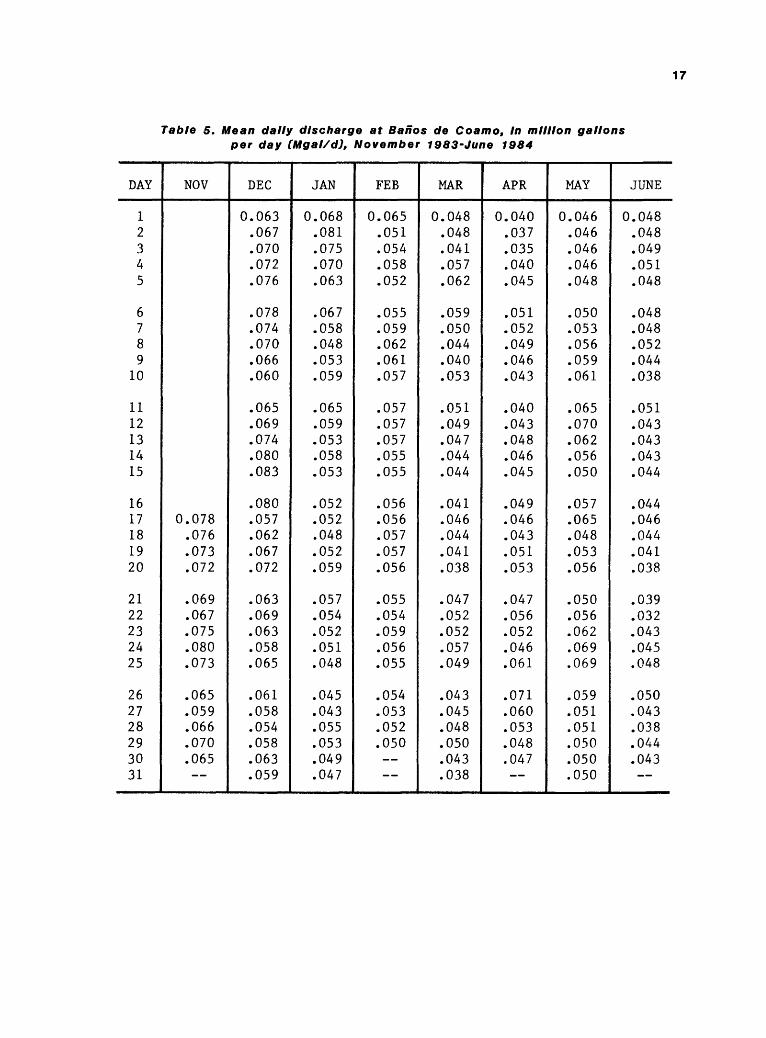
At Banos de Coamo near Coamo spring, the mean daily flow ranged from 32,000 to 83,000 gal/d during the period of record (fig. 7 and table 5). The Coamo area is in a zone of multiple faults and known seismic activity (Giusti, 1973). Springflow can be affected by earthquakes in areas where faults or fractures are the main source of the water. Seismic movements can increase or decrease the hydraulic connections between openings. Preliminary data from the Banos de Coamo spring suggests that the earthquake of June 30, 1984 -may have significantly increased the flow from the springs. Prior to the earthquake, the average discharge was about 60 gal/min. A measurement on July 10, 1984 resulted in a discharge of 110 gal/min. The number of seeps in the spring's area also appears to have increased after the earthquake. Although changes in discharge of springs and appearance of new springs are among the variety of effects that earthquakes have on ground water, more study is necessary to determine this relationship.
i.oo
0,01 NOV DEC JAN FEB MAR APR MAY JUNE JULY
Figure 7. Hydrograph for Banos de Coamo near Coamo, November 1983-July 1984.
17
Table 5. Mean dally discharge at Banos de Coamo, In million gallons per day (Mgal/d), November 1983-June 1984
DAY
12345
6789
10
1112131415
1617181920
2122232425
262728293031
NOV
0.078.076.073.072
.069
.067
.075
.080
.073
.065
.059
.066
.070
.065
DEC
0.063.067.070.072.076
.078
.074
.070
.066
.060
.065
.069
.074
.080
.083
.080
.057
.062
.067
.072
.063
.069
.063
.058
.065
.061
.058
.054
.058
.063
.059
JAN
0.068.081.075.070.063
.067
.058
.048
.053
.059
.065
.059
.053
.058
.053
.052
.052
.048
.052
.059
.057
.054
.052
.051
.048
.045
.043
.055
.053
.049
.047
FEE
0.065.051.054.058.052
.055
.059
.062
.061
.057
.057
.057
.057
.055
.055
.056
.056
.057
.057
.056
.055
.054
.059
.056
.055
.054
.053
.052
.050 --
MAR
0.048.048.041.057.062
.059
.050
.044
.040
.053
.051
.049
.047
.044
.044
.041
.046
.044
.041
.038
.047
.052
.052
.057
.049
.043
.045
.048
.050
.043
.038
APR
0.040.037.035.040.045
.051
.052
.049
.046
.043
.040
.043
.048
.046
.045
.049
.046
.043
.051
.053
.047
.056
.052
.046
.061
.071
.060
.053
.048
.047
MAY
0.046.046.046.046.048
.050
.053
.056
.059
.061
.065
.070
.062
.056
.050
.057
.065
.048
.053
.056
.050
.056
.062
.069
.069
.059
.051
.051
.050
.050
.050
JUNE
0.048.048.049.051.048
.048
.048
.052
.044
.038
.051
.043
.043
.043
.044
.044
.046
.044
.041
.038
.039
.032
.043
.045
.048
.050
.043
.038
.044
.043

18
PHYSICAL, CHEMICAL, AND BACTERIOLOGICAL CHARACTERISTICS OF SPRING WATERS (Continued)
Physical Characteristics (Continued)
Specific Conductance, pH, and Temperature
Specific conductance, pH, and temperature are among the most important physical properties measured in determining the suitability of springs as a water-supply source. The specific conductance provides an indirect estimate of the concentration of dissolved solids in water, while the pH provides information about the acidity or alkalinity of the sample. Temperature is an important factor when investigating thermal waters, and it can provide information on the source of water to a spring.
The specific conductance of the springs investigated ranged from 360 to 12,100 microsiemens per centimeter (nS/cm). The range indicates that most of the springs resemble ground-water from the areas where they flow. High specific conductance values at the La Cambija and Zanja Fria springs at Cafio Tiburones indicate that some saltwater occurs in the adjacent surficial sediments. A recent investigation (Quifiones-Aponte, 1986) indicates that these springs receive flow from Rio Grande de Arecibo. A relatively high specific conductance in waters from Bafios Quintana spring near Ponce could be due to residual saltwater in the aquifer. At Bafios de Coamo Spring, chemical species other than those related to saltwater account for a large portion of the high specific conductance. This is discussed in another section of this report.
The pH of the water from the springs ranged from slightly acid to moderate alkaline (6.7 to 9.3 standard units). The springs along the north coast contain high concentrations of calcium and bicarbonate, which provide a high buffering capacity and maintains the pH of the waters in the slightly alkaline range. Waters from the thermal springs at Ponce and near Coamo contain high concentrations of sulfate, and boron. These constituents form complexes that increase the pH value by hydrolysis and formation of weak bases.
The temperature of the springs other than those with thermal waters varied over a narrow range. Seasonal fluctuations were only a few degrees, with temperatures of the water resembling air temperatures. The near uniform air temperature in Puerto Rico accounts for this condition,
At the Bafios de Coamo near Coamo, data from the specific conductance continuous recorder show nearly constant values (table 6). Daily fluctuations in the water temperature are minimal and probably associated with changes in air temperature that affect the water from the point of emergence. The specific conductance is nearly equal to instantaneous values collected during prior samplings.
The average daily temperature of the water at the Bafios de Coamo near Coamo ranged from 42.5 to 43.0 °C (table 6). Comparison with the historical data collected by Giusti (1973) does not show any significant change in the temperature of the water. At Bafios Quintana near Ponce, instantaneous temperature measurements ranged from 31 to 32 °C.
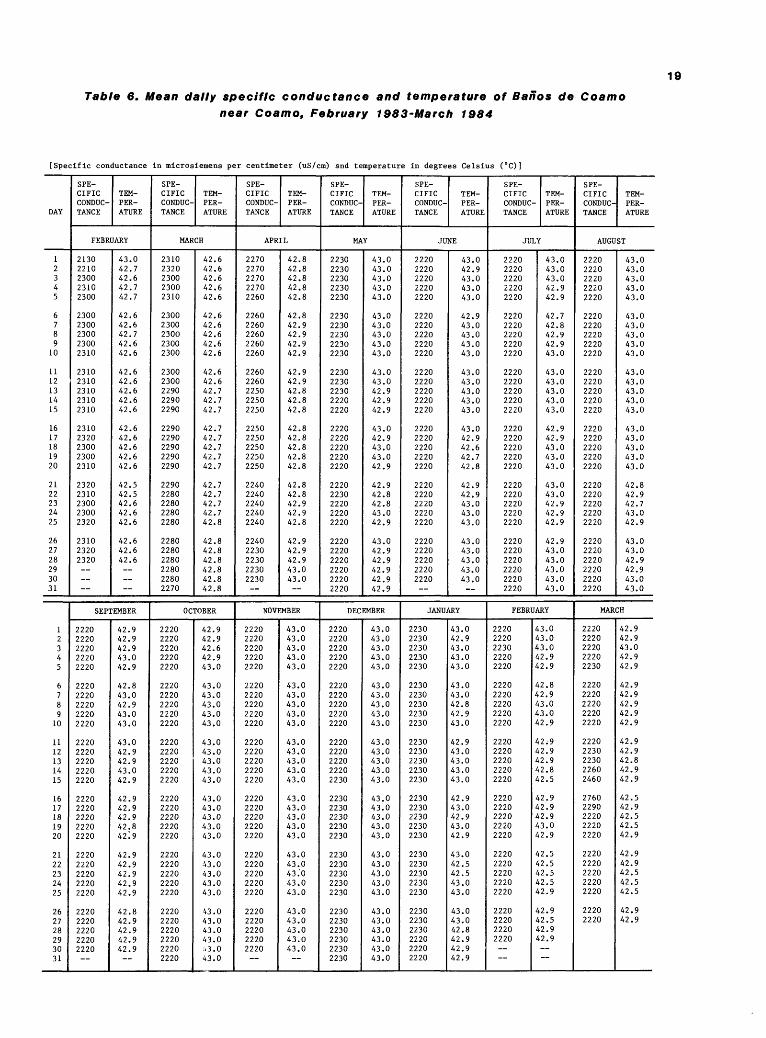
Table 6. Mean dally specific conductance and temperature of Banos de Coamo near Coamo, February 1933-March 1984
19
[Specific conductance in microsiemens per centimeter (uS/cm) snd temperature in degrees Celsius (°C)]
DAY
12345
6789
10
1112131415
1617181920
2122232425
262728293031
12345
6789
10
1112131415
1617181920
2122232425
262728293031
SPECIFICCONDUCTANCE
TEMPERATURE
FEBRUARY
21302210230023102300
23002300230023002310
23102310231023102310
23102320230023002310
23202310230023002320
231023202320
43.042.742.642.742.7
42.642.642.742.642.6
42.642.642.642.642.6
42.642.642.642.642.6
42.542.542.642.642.6
42.642.642.6
SEPTEMBER
22202220222022202220
22202220222022202220
22202220222022202220
22202220222022202220
22202220222022202220
22202220222022202220
42.942.942.943.042.9
42.843.042.943.043.0
43.042.942.943.042.9
42.942.942.942.842i9
42.942.942.942.942.9
42.842.942.942.942.9
SPECIFICCONDUCTANCE
TEMPERATURE
MARCH
23102320230023002310
23002300230023002300
23002300229022902290
22902290229022902290
22902280228022802280
228022802280228022802270
42.642.642.642.642.6
42.642.642.642.642.6
42.642.642.742.742.7
42.742.742.742.742.7
42.742.742.742.742.8
42.842.842.842.842.842.8
OCTOBER
22202220222022202220
22202220222022202220
22202220222022202220
22202220222022202220
22202220222022202220
222022202220222022202220
42.942.942.642.943.0
43.043.043.043.043.0
43.043.043.043.043.0
43.043.043.043.043.0
43.043.043.043.043.0
43.043.043.043.0..3.043.0
SPECIFICCONDUCTANCE
TEMPERATURE
APRIL
22702270227022702260
22602260226022602260
22602260225022502250
22502250225022502250
22402240224022402240
22402230223022302230
42.842.842.842.842.8
42.842.942.942.942.9
42.942.942.842.842.8
42.842.842.842.842.8
42.842.842.942.942.8
42.942.942.943.043.0
NOVEMBER
22202220222022202220
22202220222022202220
22202220222022202220
22202220222022202220
22202220222022202220
22202220222022202220
43.043.043.043.043.0
43.043.043.043.043.0
43.043.043.043.043.0
43.043.043.043.043.0
43.043.043. '043.043.0
43.043.043.043.043.0
SPECIFICCONDUCTANCE
TEMPERATURE
MAY
22302230223022302230
22302230223022302230
22302230223022202220
22202220222022202220
22202230222022202220
222022202220222022202220
43.043.043.043.043.0
43.043.043.043.043.0
43.043.042.942.942.9
43.042.943.043.042.9
42.942.842.843.042.9
43.042.942.942.942.942.9
DECEMBER
22202220222022202220
22202220222022202220
22202220222022202230
22302230223022302230
22302230223022302230
223022302230223022302230
43.043.043.043.043.0
43.043.043.043.043.0
43.043.043.043.043.0
43.043.043.043.043.0
43.043.043.043.043.0
43.043.043.043.043.043.0
SPECIFICCONDUCTANCE
TEMPERATURE
JUNE
22202220222022202220
22202220222022202220
22202220222022202220
22202220222022202220
22202220222022202220
22202220222022202220
43.042.943.043.043.0
42.943.043.043.043.0
43.043.043.043.043.0
43.042.942.642.742.8
42.942.943.043.043.0
43.043.043.043.043.0
JANUARY
22302230223022302230
22302230223022302230
22302230223022302230
22302230223022302230
22302230223022302230
223022302230222022202220
43.042.943.043.043.0
43.043.042.842.943.0
42.943.043.043.043.0
42.943.042.943.042.9
43.042.542.543.043.0
43.043.042.842.942.942.9
SPECIFICCONDUCTANCE
TEMPERATURE
JULY
22202220222022202220
22202220222022202220
22202220222022202220
22202220222022202220
22202220222022202220
222022202220222022202220
43.043.043.042.942.9
42.742.842.942.943.0
43.043.043.043.043.0
42.942.943.043.043.0
43.043.042.942.942.9
42.943.043.043.043.043.0
FEBRUARY
22202220223022202220
22202220222022202220
22202220222022202220
22202220222022202220
22202220222022202220
2220222022202220
43.043.043.042.942.9
42.842.943.043.042.9
42;942.942.942.842.5
42.942.942.943.042.9
42.542.542.542.542.9
42.942.542.942.9 "
SPECIFICCONDUCTANCE
TEMPERATURE
AUGUST
22202220222022202220
22202220222022202220
22202220222022202220
22202220222022202220
22202220222022202220
222022202220222022202220
43.043.043.043.043.0
43.043.043.043.043.0
43.043.043.043.043.0
43.043.043.043.043.0
42.842.942.743.042.9
43.043.042.942.943.043.0
MARCH
22202220222022202230
22202220222022202220
22202230223022602460
27602290222022202220
22202220222022202220
22202220
42.942.943.042.942.9
42.942.942.942.942.9
42.942.942.842.942.9
42.542.942.542.542.9
42.942.942.542.542.5
42.942.9

20
PHYSICAL, CHEMICAL, AND BACTERIOLOGICAL CHARACTERISTICS OF SPRING-WATERS (Continued)
Chemical Characteristics
Chemical Characteristics of Spring water
The general chemical character of the waters from the springs investigated was defined utilizing Stiff diagrams (Hem, 1970). This method uses four parallel horizontal axes extending on each side of a vertical zero axis. Concentrations of four cations can be plotted, one on each axis to the left of zero, and likewise four anion concentrations may be plotted, one on each axis to the right of zero. The concentrations are in milliequivalents per liter (meq/L), a measure of the equivalent weights or of the equivalent chemical reactivity. Normally the chemical constituents are reported in milligrams per liter (mg/L) or micrograms per liter (pg/L). Milliequivalents per liter can be calculated by multiplying the amount of ion present in milligrams per liter by the reciprocal of the gram-equivalent weight of the ion. The factors for this conversion for the chemical constituents considered are:
Bicarbonate
Calcium
Chloride
Carbonate
Iron
Magnesium
Potassium
Sodium
Sulfate
HC03 "
Ca2+
Cl~
co3 2 "
Fe3+
Mg2+
K+
Na+
so, 2 "4
0.01639
.04990
.02821
.03333
.05372
.08226
.02558
.04350
.02082
The plotted points are joined by straight segments, resulting in a geometrical figure characteristic of the particular water sample. The width of the geometrical figure is an approximate indication of the total ionic content.
The chemical types of water determined by the analyses are: 1) Calcium-magnesium-bicarbonate (Ca-Mg-HCCL), 2) Sodium-chloride (Na-Cl), and 3) Sodium-chloride-sulfate (Na-Cl-SO ). Results are shown on figure 8.
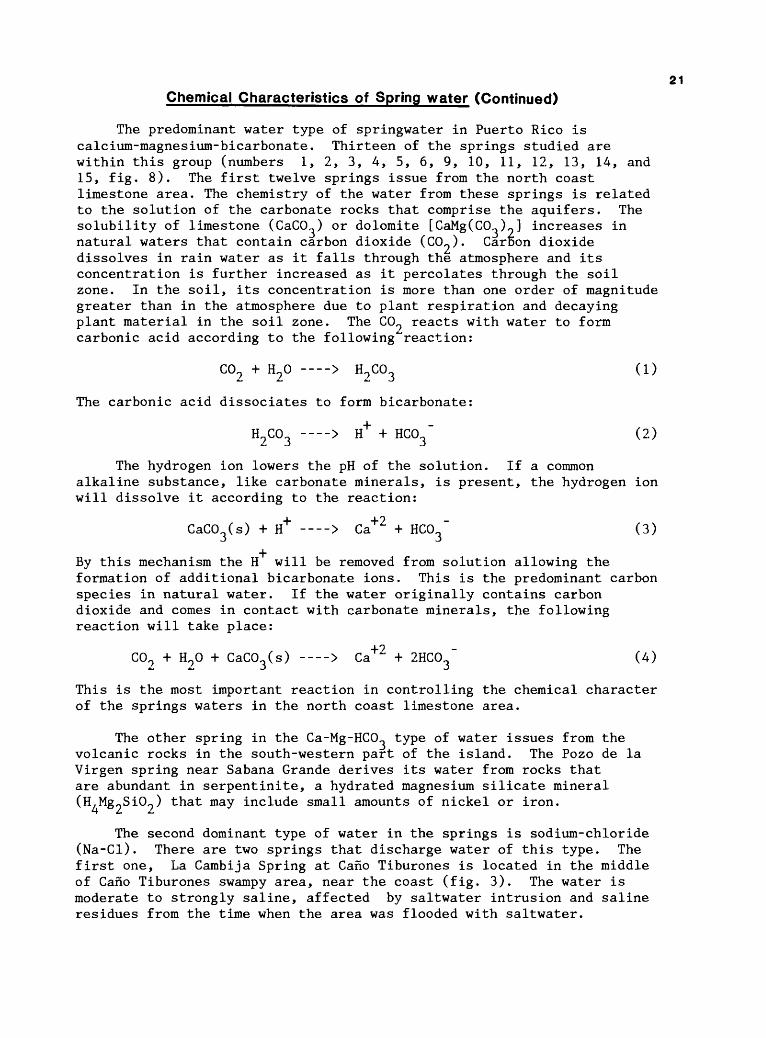
21
Chemical Characteristics of Spring water (Continued)
The predominant water type of springwater in Puerto Rico is calcium-magnesium-bicarbonate. Thirteen of the springs studied are within this group (numbers 1, 2, 3, A, 5, 6, 9, 10, 11, 12, 13, 1A, and 15, fig. 8). The first twelve springs issue from the north coast limestone area. The chemistry of the water from these springs is related to the solution of the carbonate rocks that comprise the aquifers. The solubility of limestone (CaCCL) or dolomite [CaMgCCO.,)^] increases in natural waters that contain carbon dioxide (CO.-). CarBon dioxide dissolves in rain water as it falls through the atmosphere and its concentration is further increased as it percolates through the soil zone. In the soil, its concentration is more than one order of magnitude greater than in the atmosphere due to plant respiration and decaying plant material in the soil zone. The C0_ reacts with water to form carbonic acid according to the following reaction:
C02 + H20 > H2C03 (1)
The carbonic acid dissociates to form bicarbonate:
H2C°3 > H+ + HC°3~
The hydrogen ion lowers the pH of the solution. If a common alkaline substance, like carbonate minerals, is present, the hydrogen ion will dissolve it according to the reaction:
CaCO (s) + H+ > Ca+2 + HC03 " (3)
By this mechanism the H will be removed from solution allowing the formation of additional bicarbonate ions. This is the predominant carbon species in natural water. If the water originally contains carbon dioxide and comes in contact with carbonate minerals, the following reaction will take place:
C02 + H20 + CaC03 (s) > Ca+2 + 2HCC>3 ~ (A)
This is the most important reaction in controlling the chemical character of the springs waters in the north coast limestone area.
The other spring in the Ca-Mg-HCO- type of water issues from the volcanic rocks in the south-western part of the island. The Pozo de la Virgen spring near Sabana Grande derives its water from rocks that are abundant in serpentinite, a hydrated magnesium silicate mineral (H.Mg^SiCL) that may include small amounts of nickel or iron.
The second dominant type of water in the springs is sodium-chloride (Na-Cl). There are two springs that discharge water of this type. The first one, La Cambija Spring at Cano Tiburones is located in the middle of Cano Tiburones swampy area, near the coast (fig. 3). The water is moderate to strongly saline, affected by saltwater intrusion and saline residues from the time when the area was flooded with saltwater.

67°
15'
18°4
5'-
30'
R(b
Cuf
abrt
aas
15'
Rfo
Qra
nda
-
da
Ail
atc
o
Rfo
Yag
uez
Rfo
Gua
naflb
o
18°0
0'
67°0
q'
46'_
_________
A T
LA
NT
IC
30'
16'
66° o
a'
OC
EA
N
ro
ro4
5'
65
° 3
0'
Rfo
Fa/
ardo
Rfo
Dag
uao
^ ju
ob
rad
a P
alm
a \
\ R
fo S
antia
go
I R
fo B
lanc
o , R
fo A
nto1
i R
ulz
Rfo
Hum
acao
'Rfo
Gua
yana
$
XP
LA
NA
TIO
N
FO
R
ST
IFF
D
IAG
RA
MS
MIL
LfE
QU
IVA
LE
NT
S
PE
R
LIT
ER
17°4
5'10
20 K
ILO
ME
TE
RS
(Ca)i
(M
g),
(F
e)'
H
I (8
04)
-"
i (C
03)
10
20 M
ILE
SC
AR
IBB
EA
NS
EA
1
7 S
PR
ING
L
OC
AT
ION
S
AN
D
MA
P
NU
MB
ER
Fig
ure
8.
Sti
ff d
iag
ram
s fo
r ch
emic
al c
ha
rac
ter
of
the
pri
nc
ipa
l sp
rin
gs
In P
uer
to R
ico
.
23
PHYSICAL, CHEMICAL, AND BACTERIOLOGICAL CHARACTERISTICS OF SPRING WATERS (Continued)
Chemical Characteristics (Continued)
Chemical Characteristics of Spring water (Continued)
The second spring, Zanja Fria at Cano Tiburones is also located at Cano Tiburones. The water that flows from this spring is a mixture of freshwater migrating from the recharge areas in the mountains mixing with residual saltwater in the discharge areas.
The Banos de Coamo near Coamo and Banos Quintana near Ponce are the only springs that discharge water of sodium chloride sulfate type. The origin of the sulfate in the water of Banos de Coamo near Coamo is unknown.
The Banos Quintana near Ponce is located in the south coast area several miles inland. It discharges water that is a mixture of local recharge water that moves slowly through the rocks acquiring their chemical characteristics, and water that travels very deep and rises very quickly. This water acquires the chemical characteristics of buried crystalline rock and probably mixes with residual seawater that remains in parts of the ground water system.
The quality of the water from the springs in Puerto Rico does not vary significantly with time. Comparison of the data collected by Giusti along the north coast (Giusti, 1978), and at Banos de Coamo (Giusti, 1973) show that the chemical character of the water has not changed significantly. Seasonal variations at springs affected by saline water probably occur in response to pumpage in nearby wells and recharge.
General Water Quality
Calcium, chloride, sodium, and sulfate are the principal ions in spring waters throughout Puerto Rico (table 7). Calcium concentrations range from 30 mg/L at Pozo de La Virgen spring to 220 mg/L at Banos de Coamo. Among the springs on the north coast, the calcium concentration ranged from 61 to 130 mg/L. These concentrations are very similar to those of ground water samples collected by Giusti (1978). At most of the springs, supersaturation of calcium carbonate (CaCCL ) occurs, and precipitation of the solid phase is evident. At Banos de Coamo, saltwater does not appear to be the source of calcium (as discussed in a later section of this report).
Chloride concentrations in water determine the suitability of the water for various uses. Chloride is derived in large part from sodium chloride and to a lesser part from magnesium chloride that is present in some rocks. Among the springs investigated, chloride concentrations ranged from 6.7 mg/L at Salto Collazo near San Sebastian to 3,800 mg/L at La Cambija at Cano Tiburones. However, the samples collected at La Cambija spring may have been affected by saltwater intrusion into the spring opening from the salty Cano Tiburones. In addition to the La Cambija spring, the Zanja Fria at Cano Tiburones (200 mg/L), Banos Quintana near Ponce (260 mg/L), and Banos de Coamo near Coamo (140 mg/L) springs also contain water with high chloride concentrations.

24Table 7. Physical, chemical, and bacteriological characteristics
of the principal springs of Puerto Rico, 1982-83
andard units; DEC O rs; Kl AGAR=culture gnesmr; AS NAzas So AS N=as Nitrogen]
edia for fecal
SPRINGMAPNUMBER
1
2
3
4
5
6
7
8
9
10
11
12
13
14
15
16
17
SPRINGMAPNUMBER
1
2
3
4
5
6
7
8
9
10
11
12
13
14
15
16
17
DATE
DEC. 6, 1982AUG. 5, 1983NOV. 30, 1982AUG. 11, 1983DEC. 9, 1982AUG. 5, 1983
NOV. 30, 1982AUG. 5, 1983DEC. 16, 1982AUG. 11, 1983NOV. 30, 1982AUG. 4, 1983
DEC. 8, 1982AUG. 4, 1983DEC. 8, 1982AUG. 4, 1983DEC. 1, 1982AUG. 3, 1983
DEC. 14, 1982AUG. 9, 1983DEC. 7, 1982AUG. 9, 1983DEC. 7, 1982AUG. 9, 1983
DEC. 1, 1982AUG. 3, 1983DEC. 2, 1982AUG. 3, 1983DEC. 2, 1982AUG. 10, 1983
DEC. 15, 1982AUG. 10, 1983DEC. 3, 1982AUG. 10, 1983
SEAWATER
DATE
DEC. 6, 1982AUG. 5, 1983NOV. 30, 1982AUG. 11, 1983DEC. 9, 1982AUG. 5, 1983
NOV. 30, 1982AUG. 5, 1983DEC. 16, 1982AUG. 11, 1983NOV. 30, 1982AUG. 4, 1983
DEC. 8, 1982AUG. 4, 1983DEC. 8, 1982AUG. 4, "1983DEC. 1, 1982AUG. 3, 1983
DEC. 14, 1982AUG. 9, 1983DEC. 7, 1982AUG. 9, 1983DEC. 7, 1982AUG. 9, 1983
DEC. 1, 1982AUG. 3, 1983DEC. 2, 1982AUG. 3, 1983DEC. 2, 1982AUG. 10, 1983
DEC. 15, 1982AUG. 10, 1983DEC. 3, 1982AUG. 10, 1983
SEAWATER
SPRINGFLOW,
INSTANTANEOUS(FT3/SEC
0.5.7.6
3.9.1.0
.5
.1106.11.61.5
9.29.9
109.5
168.4
.2
.1
.5
.5
.5
.3
.4
.02.11.0.0DR
.0
.0
.1
.0
"
POTASSIUM,DISSOLVED(MG/LAS K)
1.61.82.42.1.9
1.0
.2
.4
.5
.41.6.9
31794.95.11.51.0
1.11.6.6.7.2.7
.5
.5
.5
.6
.6DRY
1.21.32.22.2
380
)
273
84
46
448388
43
1Y
3216
SPECIFICCONDUCTANCE(US/CM)
572585860820470470
390388360384525522
5,47012,1001,3901,420
430470
465518460445465517
455410540555825
1,5201,4902,2502,210
35,000
5ULFATE,DISSOLVEDCMG/LAS S04)
9.08.51518139.6
7.06.13.03.54.04.8
27054041389.07.7
11178.06.48.06.9
6.09.17.06.4
12
300300
1,0001,000
2,700
PH(STDUNITS)
.7
.0
.8
.1
.7
.2
.8
.5
.7
.3
.8
.0
.2
.1
.2
.4
.0
.4
.5
.3
.7
.3
.4
.4
7.46.96.97.26.8
9.39.28.89.0
-
ALKALINITY,FIELD(MG/LAS
CAC03)
220240280260240220
180170160180250230
250280240240200210
210210220200220240
230200250?60430
lit237
20
116
TEMPERATURE(DEG C)
24.525.024.525.024.024.5
23.023.522.523.024.024.5
24.024.024.025.523.524.0
23.524.523.523.523.524.0
23.023.525.025.024.5
31.032.043.043.0
"
CHLOR-RIDE,DISSOLVED(MG/LAS CL)
322888
1001313
9.91210101819
1,9003,800
280280
8.810
131813141115
6.77.8
151626
250260130140
19,000
COLI-FORM ,FFCAL ,0.7t'M/MF(COLS/100 ML)
450660414
72430
2095
1,8003405115
2822 78
38042
380360100220580400
10026074
2701,900
4801,500
410
--
FLUO-RIDEDISSOLVED(MG/LAS F)
0.1.1.1.1.1.2
.1
.1
.1
.1
.1
.1
.1
.1
.1
.1
.1
.1
.1
.1
.1
.1
.1
.1
.1
.2
.1
.11.0
.4
.41 .11.1
1.3
STREPTOCOCCIFECAL
KF AGAK(COLS/100 ML)
32051058
196
210
50310830360
410
1007240
67013052
6401,000
240630220550
40610
42,2001,000
850410
1
"
SILICA,DISSOLVED(MG/LASSI02)
7.87.59.09.3
1217
3.64.05.43.76.46.5
6.35.96.86.78.37.4
5.15.85.14.64.95.4
4.64.16.26.4
49
26261030
6.4
HARDNESS(J!G/IASCAC03)
250260310320220230
180180160190240250
7101,400
320330200230
210230220200220250
220200250250460
170170550550
-
SOLIDS,RESIDUEAT 180DEG C,DISSOLVED(MG/L)
303333555494290281
222253197214317348
3,3607,550
788881216239
224304224261246309
237225300305478
874970
1,8601,880
-
HARDNESSNONCAR-BONATE(Mt/LCAC03)
9155760
19
4120101717
4601,100
77920
19
31642
357
0100
19
150150530530
"
SOLIDS,SUM OFCONSTITUENTS,DISSOLVED(MG/L)
312303437455264274
207205186208275282
3,5107,180
751746231247
251268251236231281
244222244287491
901
1,710
"
CALCIUM,DISSOLVED(MG/LAS CA)
92931101108285
706961729394
13019095
1007283
808584788696
8476949130
6968
220220
400
SOLIDS,DIS
SOLVED(TONSPERDAY)
0.42.69.94
5.20.14.03
.32
.115.33.521.361.42
83.420121.322.69.335.42
.17
.11
.35
.37
.39
.32
.28
.021.70.82.01
.07
.05
.30
.30
-
MAGNESIUM,DISSOLVED(MG/LAS MG)
5.85.69.5
113.24.1
1.92.22.02.52.92.9
9222019204.85.1
3.13.22.51.71.41.7
2.92.54.54.6
93
.05
.08
.15
.10
1,350
NITROGEN,
NITRATETOTAL(MG/LAS N)
1.0
2.4
3.4
2.2 .96 1.2
.01
-
SODIUM,DISSOLVED(MG/LAS NA)
161548478.89.9
6.06.76.46.7
1212
9302,200
160150
5.85.6
7.67.9.5.1.0.9
.2
.08.68.7
15
270230340300
10,500
D

25
PHYSICAL, CHEMICAL, AND BACTERIOLOGICAL CHARACTERISTICS OF SPRING WATERS (Continued)
Chemical Characteristics (Continued)
General Water Quality (Continued)
The ratio of chloride in spring water to chloride in sea water can be used as an indicator of the degree of mixing between fresh and seawaters. Ratios of other ions such as boron and sulfate can also be used with the chloride ratio to establish seawater as the source of the ions. Ratios of chloride, boron and sulfate ions in these two springs to seawater are as follows:
RATIO OF ELEMENT CONCENTRATION IN SPRING TO SEAWATER
Constituent
Chloride
Boron
Sulfate
Zanja Fria
0.02
.02
.02
La Cambija
0.10
.08
.10
The similarity of the ratios shows that the springs are discharging near the fresh-seawater interface. The chemistry of these springs show about two percent seawater at Zanja Fria and eight percent at La Cambija. Most of the other springs aj_ong the north coast are further inland and exhibit chloride concentrations typical of ground water.
Sodium ion concentrations correlate with those of chloride, mainly because of the chemical association with sodium chloride from seawater. Many sodium compounds are highly soluble. Also, sodium is a common constituent of many minerals like sodium feldspars. Higher sodium concentrations in some of the spring waters could be due to cation exchange reactions in which sodium is exchanged by other positively charged ions:
Ca2+ + Na X CaX + 2Na
where X = substrate in which the exchange occurs .
Sulfate ion is the next most abundant dissolved constituent in spring waters in Puerto Rico. The source of sulfate in ground or spring waters is usually from seawater intrusion or contamination from sewage discharges. Occasionally, minerals in the rocks may yield high sulfate concentrations. Gypsum (CaSO, .2H9 0) and anhydrite (CaSO.) deposits can be a source of sulfate ions in ground water. Also the oxidation of sulfide minerals such as pyrite and marcasite are sources of sulfate ions. Sulfate is usually present in mine waters and some industrial waters. Concentrations of sulfate in springflow throughout Puerto Rico range from 3 mg/L at Aguas Frias near Ciales to 1,000 mg/L at Bafios de Coamo. High sulfate concentrations are also present at La Cambija and Zanja Fria, springs affected by saltwater intrusion.

26
PHYSICAL, CHEMICAL, AND BACTERIOLOGICAL CHARACTERISTICS OF SPRING WATERS (Continued)
Chemical Characteristics (Continued)
General Water Quality (Continued)
An analysis of the ratios of chloride, boron, strontium, and sulfate ions for the Banos de Coamo and Banos Quintana thermal springs compared to seawater shows the following:
RATIO OF ELEMENT CONCENTRATION IN SPRING TO SEAWATER
Constituent
Chloride
Boron
Strontium
Sulfate
Banos Coamo
0.007
.543
.225
.370
Banos Quintana
0.014
.283
.125
.111
If the discharges from these springs were a mixture with seawater, these ionic ratios should be about the same for each spring.
The concentration of boron in seawater is about 4,600 Mg/L« The ratios above show that at Banos de Coamo, if the boron was from seawater an ion such as chloride should have a concentration of about 10,000 mg/L. It is evident then that seawater is not a component in the thermal springs. High concentrations of boron, sulfate, and other constituents are probably from minerals in volcanic rocks and from overlaying alluvium. Similar concentrations have been observed in other thermal springs in Nevada and California (Hem, 1970).
Other ions of importance in spring waters include silica (SiO«), bicarbonate (HCO~ ) and magnesium (Mg). High silica concentrations in the thermal springs (Banos de Coamo and Banos Quintana) are probably derived from high solubility of silica in hot waters. The Pozo de la Virgen spring exhibits the highest silica concentration among the springs studied (49 mg/L). Water from this spring emerges from rock with a high content of silicate. Spring waters throughout Puerto Rico are generally moderately hard, with CaCO~ hardness values ranging from 170 to 1,400 mg/L, but with a median value of about 225 mg/L.
Nutrients (nitrogen and phosphorus) and organic carbon can be used as an indicator of contamination of ground waters. Spring waters in Puerto Rico contain relatively high concentrations of nitrogen, but low phosphorus and organic carbon levels. The highest nitrogen concentrations were measured at Ojo de Agua at Vega Baja (5.9 mg/L), Ojo de Guillo near Manati (3.4 mg/L), and Ojo de Agua at Aguadilla (3.1 mg/L). These concentrations, although relatively high, are below the safe drinking water standard of 10 mg/L of nitrate as nitrogen (USEPA, 1972, 1976). These springs are in the vicinity of highly urbanized areas where the potential for contamination from sewage is high.

27
General Water Quality (Continued)
Field investigations at Ojo de Guillo near Manati indicate that wastewater from the sewage-treatment plant near the town of Florida could be flowing into the spring. The partially treated sewage from the plant is discharged into a nearby sinkhole and drainage patterns from the area indicate that an ancient channel could be serving as a hydraulic connection between the spring and the sinkhole. The spring opening shows excessive algal growth and gray-turbid water, typical of sewage. Crustaceans and other aquatic life are killed occasionally, possibly by chlorine or other disinfectants in the spring discharge.
Analyses of trace metals (table 8) indicate that with the excep tion of the thermal springs, concentrations are generally low, typical of ground waters, and never exceed the Safe Drinking Water Act standards (EPA, 1972, 1976). The highest boron concentrations ranged from 90 Mg/L at Zanja Fria to 2,500 (Jg/L at Bafios de Coamo.
Bacteriological Characteristics
Fecal coliform (FC) and fecal streptococci (FS) bacteria are present in most of the spring waters throughout Puerto Rico. Concentrations of FC bacteria range from 4 to 1,900 colonies per 100 mL sample.
The FS concentrations range from 1 to 2,200 col/100 mL of sample. Drinking water standard recommends that the geometric mean of fecal coliform bacteria density in raw waters for public supply should not exceed 2,000 col/100 mL of water (USEPA, 1973). The standard for contact and recreational purposes is 1,000 col/100 mL. Except for Aguas Frias near Ciales and the Pozo de la Virgen spring near Sabana Grande, the bacteria concentrations are relatively low. Both of these springs are affected by bird rookeries very close to the spring mouths.

28
Table 8. Trace metals at the principal springs of Puerto Rico, 1982-83
[Abbreviations: UG/L=micrograms per liter; As AL=as Aluminum; AS AS=as Arsenic; AS BA=as Barium, AS BE=as Beryllium; AS B=as BororAS CD=as Cadmium; AS CR=as Chromium; AS C0=as Cobalt; AS CU=as Copper; AS FE=as Iron; =less than; as PB=as Lead; AS LI=as LithiuAS MN=as Manganese; AS HG=as Mercury; AS M0=as Molybdenum; AS SE= as Selenium; AS SR= as Strontium; AS V=as Vanadium; AS ZN= as Zi
SPRING MAP
NUMBER
1
2
3
4
5
6
7
8
9
10
11
12
13
14
15
16
17
DATE
DEC. 6, 1982AUG. 5, 1983NOV. 30, 1982AUG. 11, 1983DEC. 9, 1982AUG. 5, 1983
NOV. 30, 1982AUG. 5, 1983DEC. 16, 1982AUG. 11, 1983NOV. 30, 1982AUG. it, 1983
DEC. 8, 1982AUG. 4, 1983DEC. 8, 1982AUG. 4, 1983DEC. 1, 1982AUG. 3, 1983
DEC. 6, 1982AUG. 5, 1983NOV. 30, 1982AUG. 11, 1983DEC. 9, 1982AUG. 5, 1983
NOV. 30, 1982AUG. 5, 1983DEC. 16, 1982AUG. 11, 1983NOV. 30, 1982AUG. 4, 1983
DEC. 8, 1982AUG. 4, 1983DEC. 8, 1982AUG. 4, 1983
ALUMI NUM, DIS SOLVED (UG/L AS AL)
10 10 10
10 50
<10
10 20 30
20 10
<10
30 20 10
50 20
ARSENIC, DIS SOLVED (UG/L AS AS)
1
<1
1
1
1
3
<1
1
1
1
1
1
1
1
3
<1
5
BARIUM, DIS SOLVED (UG/L AS BA)
28 41 24
9 16 19
24 16 21
12 12 12
19 15 79
19 32
BERYL LIUM, DIS SOLVED (UG/L AS BE)
<1
<1 <1~
<1
<1 <1~
<1
<1
<1~
<1 <1 <1
<1 <1 <1~
<1 <1
BORON , DIS SOLVED (UG/L AS B)
20 30 70
30 70 30
370 90 10
30 10 10
10 10 40
1300
2500
CADMIUM, DIS SOLVED (UG/L AS CD)
<1
<1
<1
<1
<1
<1
<1
<1
2~
<1
<1
<1~
3
<1
2
<1
<1
CHRO MIUM, DIS SOLVED (UG/L AS CR)
<1
<1
<1
<1
<1
<1~
<1
<1
3
<1
<1
<1~
3
3
3--
<1
3
COBALT , DIS SOLVED (UG/L AS CO)
<3
<3
<3
<3
<3
<3
<3
<3
<3
<3
<3
<3
<3
<3
<3~
<3
<3
COPPER, DIS SOLVED (UG/L AS CU)
<10
<10
<10
<10
<10
<10
<10
<10
<10
<10
<10
<10
<10
<10
<10
<10
<10
IRON, DIS SOLVED (UG/L AS FE)
7<3<3
484
56
<3<3<3
6
950
8<3
1910
<3<3
915
68
21<3
75
16
44
2420
SPRING MAP
NUMBER
1
2
3
4
5
6
7
8
9
10
11
12
13
14
15
16
17
DATE
DEC. 6, 1982AUG. 5, 1983NOV. 30, 1982AUG. 11, 1983DEC. 9, 1982AUG. 5, 1983
NOV. 30, 1982AUG. 5, 1983DEC. 16, 1982AUG. 11, 1983NOV. 30, 1982AUG. 4, 1983
DEC. 8, 1982AUG. 4, 1983DEC. 8, 1982AUG. 4, 1983DEC. 1, 1982AUG. 3, 1983
DEC. 6, 1982AUG. 5, 1983NOV. 30, 1982AUG. 11, 1983DEC. 9, 1982AUG. 5, 1983
NOV. 30, 1982AUG. 5, 1983DEC. 16, 1982AUG. 11, 1983NOV. 30, 1982AUG. 4, 1983
DEC. 8, 1982AUG. 4, 1983DEC. 8, 1982AUG. 4, 1983
LEAD, DIS SOLVED (UG/L AS PB)
<10
<10
<10
<10
<10
<10
<10
<10 20~
<10
<10
<10
<10
<10
<10
<10
<10
LITHIUM, DIS SOLVED (UG/L AS LI)
<4
<«
5--
<4
<4
<4
<17
7
<4
<*
<4
<4
<4
<4
<4
23 63
MANGA NESE, DIS SOLVED (UG/L AS MN)
3
1
<1
<1
< 1 14
1
1
1~
1
1
1~
1
1
<16
1
2
MERCURY, DIS SOLVED (UG/L AS HG)
<0.1 .1 .1
.1 .4 .1
.3 .2 .1~
< -1 .1
< .1
.1 .2 .1
.4 .3
MOLYB DENUM, DIS SOLVED (UG/L AS MO)
<10
<10
<10
<10
<10
<10
<10
<10
<10
<10
<io
<10
<10
<10
<10
<10
<10
SELE NIUM, DIS SOLVED (UG/L AS SE)
<1
<1 <1
<1
<1
<1
<1
<1
<1
<1
<1 <1
<1
<1
<1
<1
<1
STRON TIUM, DIS SOLVED (UG/L AS SR)
120120170
200210
150150140170110120
8601700210220330470
17016011090
110120
700790230220160
1000100016001800
VANA DIUM, DIS SOLVED (UG/L AS V)
<6
<6
<6
<6
<6
9
<6
<6
<6
<6
<6
<6" -
<6
<6
<6
<6
<6
ZINC, DIS SOLVED (UG/L AS ZN)
O
5
5
<4
5
<4
<«
<4
<4
<4
<*
<«
o
<4
<4
26
O
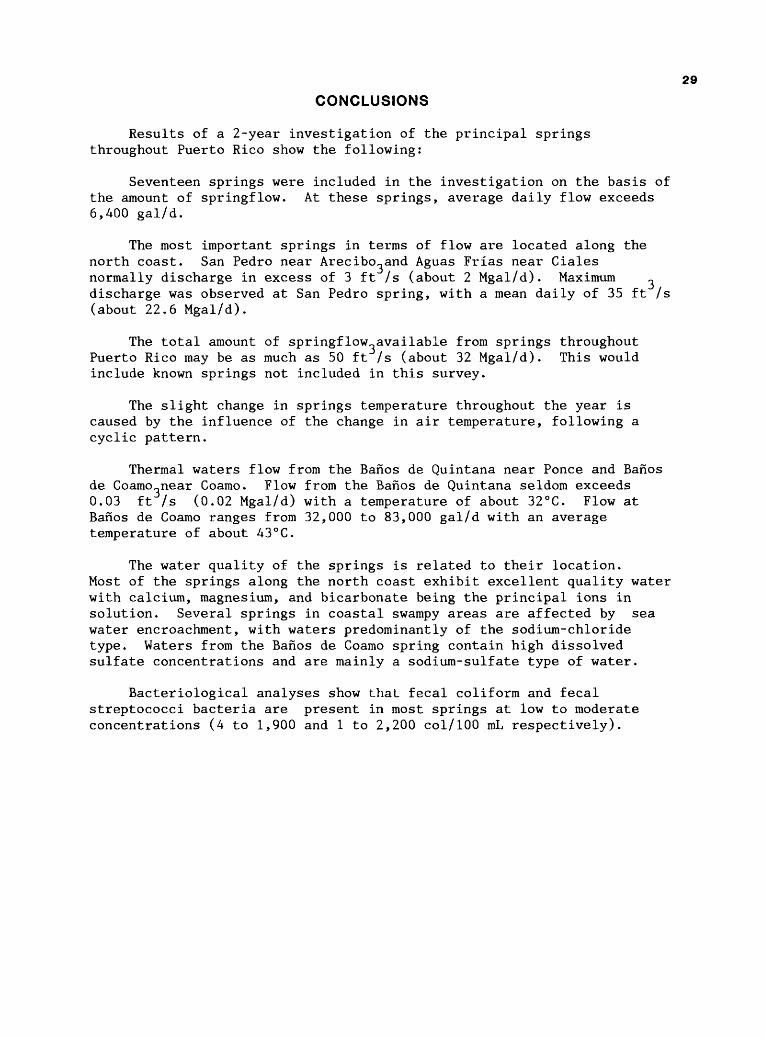
29
CONCLUSIONS
Results of a 2-year investigation of the principal springs throughout Puerto Rico show the following:
Seventeen springs were included in the investigation on the basis of the amount of springflow. At these springs, average daily flow exceeds 6,400 gal/d.
The most important springs in terms of flow are located along the north coast. San Pedro near Arecibo,,and Aguas Frias near Ciales normally discharge in excess of 3 ft Is (about 2 Mgal/d). Maximum discharge was observed at San Pedro spring, with a mean daily of 35 ft /s (about 22.6 Mgal/d).
The total amount of springflow^available from springs throughout Puerto Rico may be as much as 50 ft /s (about 32 Mgal/d). This would include known springs not included in this survey.
The slight change in springs temperature throughout the year is caused by the influence of the change in air temperature, following a cyclic pattern.
Thermal waters flow from the Banos de Quintana near Ponce and Banos de Coamo^near Coamo. Flow from the Banos de Quintana seldom exceeds 0.03 ft Is (0.02 Mgal/d) with a temperature of about 32°C. Flow at Banos de Coamo ranges from 32,000 to 83,000 gal/d with an average temperature of about 43°C.
The water quality of the springs is related to their location. Most of the springs along the north coast exhibit excellent quality water with calcium, magnesium, and bicarbonate being the principal ions in solution. Several springs in coastal swampy areas are affected by sea water encroachment, with waters predominantly of the sodium-chloride type. Waters from the Banos de Coamo spring contain high dissolved sulfate concentrations and are mainly a sodium-sulfate type of water.
Bacteriological analyses show that fecal coliform and fecal streptococci bacteria are present in most springs at low to moderate concentrations (A to 1,900 and 1 to 2,200 col/100 mL respectively).

30REFERENCES
Brown, Eugene, Skougstad, M.W., and Fishman, M.J., 1970, Methods for the collection and analysis of water samples for dissolved minerals and gases: U.S. Geological Survey Techniques of Water-Resources Investigations, Book 5, Chapter Al, 160 p.
Bryan, Kirk, 1919, Classification of springs: Jour. Geol., vol. 27, pp. 522-561
Calvesbert, R.J., 1961, Climate of Puerto Rico and U.S. Virgin Islands: Environmental Science Services Administration Climatography Report, 50 p.
Giusti, E. V., 1973, Water Resources of the Coamo Area, Puerto Rico: U.S. Geological Survey Water Resources Bulletin 9, 31 p.
Giusti, E. V., 1978, Hydrogeology of the karst of Puerto Rico: U.S. Geological Survey Professional Paper 1012, 68 p.
Gomez-Gomez, Fernando, 1980, Reconnaissance of six solid-waste disposal sites in Puerto Rico and effects on water quality: U.S. Geological Survey Open-File Report 79-1338, 62 p.
Greeson, P. E., Ehlke, T.A., Irwin, G.A., Livun, B.W., and Slack, K.V.,1977, Methods for collection and analysis of aquatic biological and microbiological samples: U.S. Geological Survey Techniques of Water Resources Investigations, Book 5. Chapter A4, 332 p.
Guzman-Rios, Senen, 1983, Reconnaissance of the principal springs of Puerto Rico, 1982-83: U.S. Geological Survey Open-File Data Report 82-683, 1 pi.
Hem, J. D., 1970, Study and interpretation of the chemicalcharacteristics of natural water (Second Edition): U.S. Geological Survey Water-Supply Paper 1473, 363 p.
Jordan, D. G., 1970, Water and copper-mine tailings in karst terrane of Rio Tanama Basin, Puerto Rico: U.S. Geological Survey Open-File Report, 24 p.
Meinzer, 0. E., 1927, Large springs in the United States: U. S. Geological Survey Water Supply Paper 557, 94 p.
Monroe, W. H., 1980, Geology of the middle Tertiary Formations of Puerto Rico: U. S. Geological Survey Professional Paper 953, 93 p.
Quinones-Aponte, Vicente, 1986, Water resources of the lower Rio Grande de Arecibo valley, Puerto Rico: U.S. Geological Survey, Water- Resources Investigations Report 85-4179, 38 p.
Rantz, S. E., and others, 1982, Measurements and Computation ofStreamflow; Volume 1, Measurement of Stage and Discharge: U. S. Geological Survey Water Supply Paper 2175, 631 p.
U.S. Environmental Protection Agency, 1972, Water Quality Criteria:Environmental Protection Agency Report of the Committee on Water Quality Criteria, 594 p.
U.S. Environmental Protection Agency, 1976, National Interim Primary Drinking Water Regulations: U. S. Environmental Protection Agency Regulation Report, 159 p.
Wood, W. W., 1976, Guidelines for collection and field analysis ofground-water samples for selected constituents: U. S. Geological Survey Techniques of Water Resources Investigations, Book 1, Chapter D2, 24 p.
Young, H.W., and Lewis, R.E., 1982, Hydrology and geochemistry ofthermal ground water in Southwestern Idaho and North-Central Nevada: U.S. Geological Survey Professional Paper 1044-J, 20p.
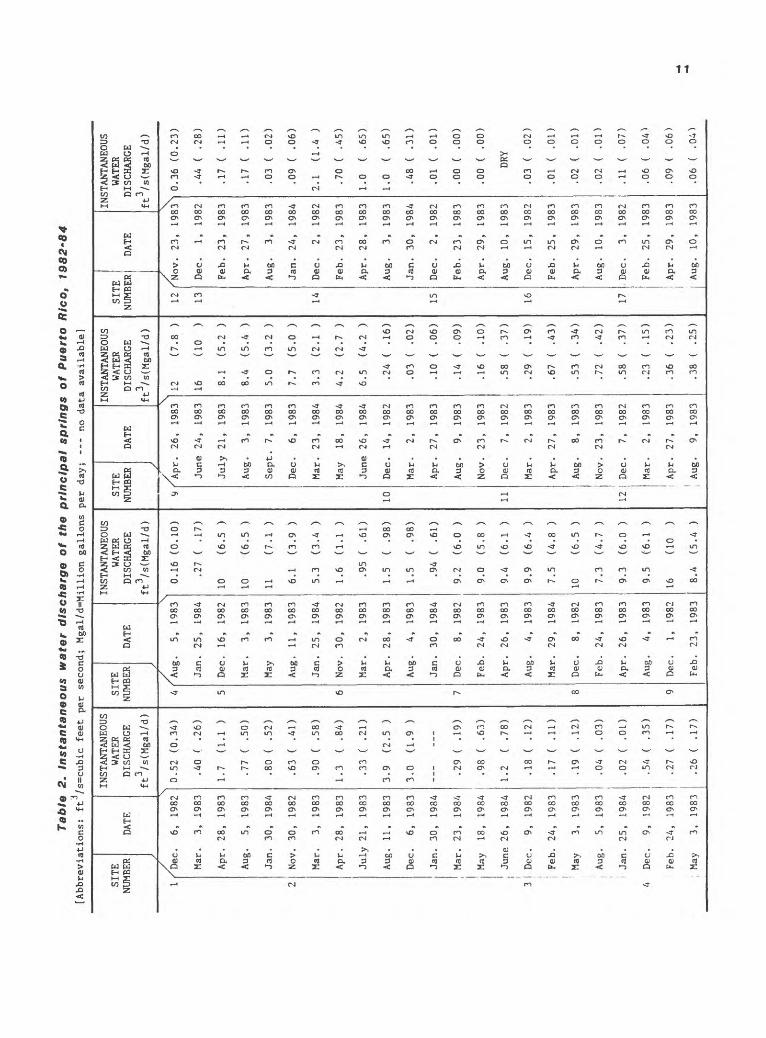
Ta
ble
2
. In
sta
nta
ne
ou
s
wate
r d
isc
ha
rge
o
f th
e p
rin
cip
al
sp
rin
gs
o
f P
ue
rto
R
ico
, 1982-8
4[Abbreviations:
ft /s=cubic feet pe
r se
cond
; Mg
al/d
=Mil
lion
ga
llon
s per
day;
---
no data av
aila
ble]
SITE
NUMBER
/
1 2
DATE
r^De
c.
6, 1982
INST
ANTA
NEOU
S WATER
DISC
HARG
E
ft3/
s(Mgal/d)
\
Mar.
3, 1983
Apr. 28,
1983
Aug.
5, 19
83
Jan.
30,
1984
Nov. 30,
1982
Mar.
3, 19
83
Apr. 28,
1983
July
21,
1983
Aug. 11,
1983
Dec.
6, 19
83
Jan.
30
, 1984
Mar. 23,
1984
May
18,
1984
June 26,
1984
3 De
c.
9, 1982
Feb.
24
, 1983
: Ma
y 3, 1983
, Aug.
5, 1983
i Ja
n. 25,
1984
4 Dec.
9, 1982
Feb.
24,
1983
May
3, 19
83
0.52 (0
.34)
.40
( .2
6)
1.7
(1.1
)
.77
( .50)
.80
( .5
2)
.63
( .4
1)
.90
( .5
8)
1.3
( .8
4)
.33
( .2
1)
3.9
(2.5
)
3.0
(1.9
)
.29
( .1
9)
.98
( .6
3)
1.2
( .78)
.18
( .1
2)
.17
( .1
1)
.19
( .1
2)
.04
( .0
3)
.02
( .0
1)
.54
( .35)
.27
( .1
7)
.26
( .1
7)
SITE
NUMBER
/
4 5 6 7 8 9
DATE
INST
ANTA
NEOU
S WA
TER
DISC
HARG
E
ft3/
s(Mg
al/d
)
/
\'Aug.
5, 1983
Jan. 25
, 1984
Dec. 16
, 1982
Mar.
3,
19
83
May
3, 19
83
Aug.
11,
1983
Jan. 25,
1984
Nov.
30,
1982
Mar.
2,
1983
Apr. 28,
1983
Aug.
4,
1983
Jan. 30
, 1984
Dec.
8, 1982
Feb. 24
, 19
83
Apr. 26
, 19
83
Aug.
4, 19
83
Mar.
29,
1984
Dec.
8, 19
82
Feb. 24,
1983
Apr.
26
, 1983
Aug.
4,
19
83
Dec.
1, 19
82
Feb.
23
, 1983
0.16 (0.10)
.27
( .1
7)
10
(6.5
)
10
(6.5
)
11
(7.1
)
6.1
(3.9
)
5.3
(3.4
)
1.6
(1.1
)
.95
( .6
1)
1.5
( .9
8)
1.5
( .98)
.94
( .6
1)
9.2
(6.0
)
9.0
(5.8
)
9.4
(6.1
)
9.9
(6.4
)
7.5
(4.8
)
10
(6.5
)
7.3
(4.7
)
9.3
(6.0
)
9.5
(6.1
)
16
(10
)
8.4
(5.4
)
SITE
NUMBER
/
^
10 11
DATE
INST
ANTA
NEOU
S WATER
DISCHARGE
ft3/s(
Mgal
/d)
/Apr
. 26,
1983
June 24,
1983
July 21
, 1983
Aug.
3, 19
83
Sept.
7, 1983
Dec.
6,
1983
Mar
. 23
, 1984
May
18,
1984
June 26
, 19
84
Dec
Mar
Apr
Aug
Nov
Dec
Mar
. 14,
1982
. 2,
19
83
. 27
, 1983
. 9,
1983
. 23,
1983
. 7, 1982
. 2, 1983
Apr.
27
, 19
83
Aug
Nov
12
Dec
Mar
. 8, 1983
. 23
, 1983
. 7,
1982
. 2, 1983
Apr.
27,
1983
, Au
S.
9, 1983
12
(7.8
)
16
(10
)
8.1
(5.2
)
8.4
(5.4
)
5.0
(3.2
)
7.7
(5.0
)
3.3
(2.1
)
4.2
(2.7
)
6.5
(4.2
)
.24
( .1
6)
.03
( .0
2)
.10
( .0
6)
.14
( .0
9)
.16
( .1
0)
.58
( .3
7)
.29
( .1
9)
.67
( .4
3)
.53
( .3
4)
.72
( .4
2)
.58
( .3
7)
.23
( .1
5)
.36
( .2
3)
.38
( .2
5)
SITE
NUMB
ER
12 13 14 15 16 17
DATE
INST
ANTA
NEOU
S WATER
DISC
HARG
E
ft3/s
(Mga
l/d)
"Nov.
23,
1983^
Dec.
1, 1982
Feb. 23,
1983
Apr. 27
, 1983
Aug.
3, 1983
Jan. 24,
1984
Dec.
2, 1982
Feb. 23,
1983
Apr. 28
, 1983
Aug.
3, 1983
Jan. 30,
1984
Dec.
2, 1982
Feb.
23
, 1983
Apr. 29
, 1983
Aug.
10,
1983
Dec. 15,
1982
Feb.
25,
1983
Apr. 29,
1983
Aug. 10,
1983
Dec.
3, 19
82
Feb. 25
, 1983
Apr. 29,
1983
Aug.
10,
1983
0.36 (0
.23)
.44
( .2
8)
.17
( .1
1)
.17
( .1
1)
.03
( .0
2)
.09
( .0
6)
2.1
(1.4
)
.70
( .45)
1.0
( .65)
1.0
( .6
5)
.48
( .3
1)
.01
( .0
1)
.00
( .00)
.00
( .0
0)
DRY
.03
( .0
2)
.01
( .0
1)
.02
( .01)
.02
( .0
1)
.11
( .0
7)
.06
( .0
4)
.09
( .0
6)
.06
( .0
4)