Embed Size (px)
Citation preview
HYDROLOGICAL PROCESSESHydrol. Process. 18, 415–434 (2004)Published online in Wiley InterScience (www.interscience.wiley.com). DOI: 10.1002/hyp.1277
Hydrology and nitrogen balance of a seasonally inundatedDanish floodplain wetland
Hans Estrup Andersen*National Environmental Research Institute, Vejlsøvej 25, P.O. Box 314, DK-8600 Silkeborg, Denmark
Abstract:
This paper characterizes a seasonally inundated Danish floodplain wetland in a state close to naturalness and includesan analysis of the major controls on the wetland water and nitrogen balances.
The main inputs of water are precipitation and percolation during ponding and unsaturated conditions. Lateralsaturated subsurface flow is low. The studied floodplain owes its wetland status to the hydraulic properties of itssediments: the low hydraulic conductivity of a silt–clay deposit on top of the floodplain maintains ponded waterduring winter, and parts of autumn and spring. A capillary fringe extends to the soil surface, and capillary rise fromgroundwater during summer maintains near-saturated conditions in the root zone, and allows a permanently veryhigh evapotranspiration rate. The average for the growing season of 1999 is 3Ð6 mm day�1 and peak rate is 5Ð6 mmday�1. In summer, the evapotranspiration is to a large degree supplied by subsurface storage in a confined peat layerunderlying the silt–clay.
The floodplain sediments are in a very reduced state as indicated by low sulphate concentrations. All nitratetransported into the wetland is thus denitrified. However, owing to modest water exchange with surroundinggroundwater and surface water, denitrification is low; 71 kg NO3 –N ha�1 during the study period of 1999. Reductionof nitrate diffusing into the sediments during water ponding accounts for 75% of nitrate removal. Biomass productionand nitrogen uptake in above-ground vegetation is high—8Ð56 t dry matter ha�1 year�1 and 103 kg N ha�1 year�1.Subsurface ammonium concentrations are high, and convective upward transport into the root zone driven byevapotranspiration amounted to 12Ð8 kg N ha�1year�1. The floodplain wetland sediments have a high nitrogen content,and conditions are very favourable for mineralization. Mineralization thus constitutes 72% of above-ground plantuptake.
The study demonstrates the necessity of identifying controlling factors, and to combine surface flow with vadoseand groundwater flow processes in order to fully comprehend the flow and nitrogen dynamics of this type ofwetland. Copyright 2004 John Wiley & Sons, Ltd.
KEY WORDS floodplain wetland; hydrology; nitrogen
INTRODUCTION
In recent years there has been considerable focus on the function and value of wetlands (e.g. Carter, 1986).Floodplains or riparian wetlands are thought to be of particular value because they have a high level ofbiodiversity, provide critical habitats for many plants and animals, and are an important, natural elementin the maintenance of water quality (Whiting and Pomeranets, 1997; Hupp, 2000). The characteristics andfunction of a floodplain are intimately linked to the river that flows upon it. In their natural state, floodplainscan be highly dynamic like most fluvial landforms, and frequently inundated by overbank floods. Typically, theriver is bordered by levees consisting of relatively coarse material. The levees are often the highest points onthe floodplain, which may otherwise be extremely flat. Consequently, elevation differences on the floodplainof just a few centimetres create differences in the hydroperiod (duration of inundation), and hence a profound
* Correspondence to: Hans Estrup Andersen, National Environmental Research Institute, Vejlsøvej 25, P.O. Box 314, DK-8600 Silkeborg,Denmark. E-mail: [email protected]
Received 8 February 2002Copyright 2004 John Wiley & Sons, Ltd. Accepted 15 January 2002

416 H. E. ANDERSEN
zonation in vegetation patterns (Mitsch and Gosselink, 1986). Sediment trapping on a floodplain is stronglyinfluenced by the length of the hydroperiod, and hence by the height of the levees. Sediment retention hasalso been found to be strongly correlated with backwater flow patterns and influenced by vegetation cover,which decreases flow velocities (Bendix and Hupp, 2000; Tabacchi et al., 2000). Analysis of time-seriesfor all major Danish streams shows an increase in annual mean runoff over the past 80 years, linked toan increase in precipitation of 0Ð76 mm year�1 during the period 1874–1998 (p D 0Ð02%) (Ovesen et al.,2000). If these trends continue, the importance of floodplains as buffers for water and sediment is likely toincrease.
Wetlands are distinguished hydrologically from adjacent upland areas by the presence of water, whichcreates alternating or permanently saturated conditions. The consequence is substantial water storage withinwetlands and the development of readily identifiable wetland vegetation adapted to periodic anoxic conditions(Bradley and Gilvear, 2000). The water budget thus provides the framework for investigations of environmen-tal conditions in a wetland (Lent et al., 1997) and linkages between upland, wetland and river (Drexler et al.,1999). In spite of this, relatively few comprehensive water-balance studies of wetlands exist (e.g. Gilvearet al., 1993; Hyashi et al., 1998; Raisin et al., 1999). As the surface and subsurface hydrological processeswithin a wetland are inseparable (Roulet, 1990) a water balance needs to quantify both surface and subsurfacewater fluxes.
The main inputs of water include precipitation (P), influent river seepage (qi�, overbank floods (qov)and groundwater inflow (qgr�i). Outflows of water include evapotranspiration (E), effluent river seepage(qo�, surface runoff (qsu�, and groundwater outflow (qgr�o�. Problems with the quantification of waterfluxes, and the groundwater flux in particular, using direct measurements have often been articulated in theliterature (e.g. Gilvear et al., 1993; McKillop et al., 1999). The physical determination of this water flux iscommonly based on observations of the hydraulic head in piezometers and point-measurements of hydraulicconductivity, and extrapolation of neither of these is necessarily possible. A direct means of determiningthe groundwater flux is by tracer study (Blicher-Mathiesen, 1998). In other cases, groundwater flow modelshave been applied instead of measurements (e.g. Bradley, 1996; Stewart et al., 1998; Restrepo et al., 1998;Zeeb and Hemond, 1998). Direct measurement of evapotranspiration is also often omitted and substitutedby empirical formulae or determined as the residual in the water-budget equation (Carter, 1986). Somewetlands are permanently water-saturated, however, many wetlands exhibit partly unsaturated conditions,particularly during the growing season. The unsaturated zone is potentially very important for wetlandecology for a number of reasons: (i) water content in the root zone is a strong determinant of speciescomposition of vegetation communities owing to different adaptations (e.g. Bridgham and Richardson, 1993;Grevilliot et al., 1998; Silvertown et al., 1999); (ii) the degree of saturation, hence aeration, substantiallyinfluences the decomposition of organic matter and mineralization of nutrients (Ponnamperuma, 1984);and (iii) the water budget is affected because hydraulic conductivity and evapotranspiration depend onsoil-water content (Brandyk et al., 1995); and (iv) with the existence of a substantially unsaturated zone,some or all precipitation infiltrating the surface will be retained here rather than percolate (Winter andRosenberry, 1995). However, in water-balance studies of wetlands, the unsaturated zone is generally neglected.One exception is Bradley and Gilvear (2000), who described conditions in the unsaturated zone viamodelling. The literature, however, contains examples on studies directed more specifically at the unsaturatedcharacteristics of wetland soils; e.g. Bloemen (1983), Brandyk et al. (1985), da Silva et al. (1993) andWeiss et al. (1998).
Denmark during the last decade has seen a strong public interest in river restoration and re-establishmentof wetlands. In fact, the Danish Parliament in 1998 decided on the restoration of 16 000 h of wetlands withthe chief purpose of reducing agricultural nitrate loading to the aquatic environment. In spite of this Danishfloodplain wetlands have received relatively little scientific attention. The purpose of the present study istherefore to characterize a Danish floodplain wetland in a state close to naturalness and to provide insightinto the major controls on the wetland water and nitrogen balances.
Copyright 2004 John Wiley & Sons, Ltd. Hydrol. Process. 18, 415–434 (2004)
FLOODPLAIN HYDROLOGY AND NITROGEN BALANCE 417
STUDY SITE
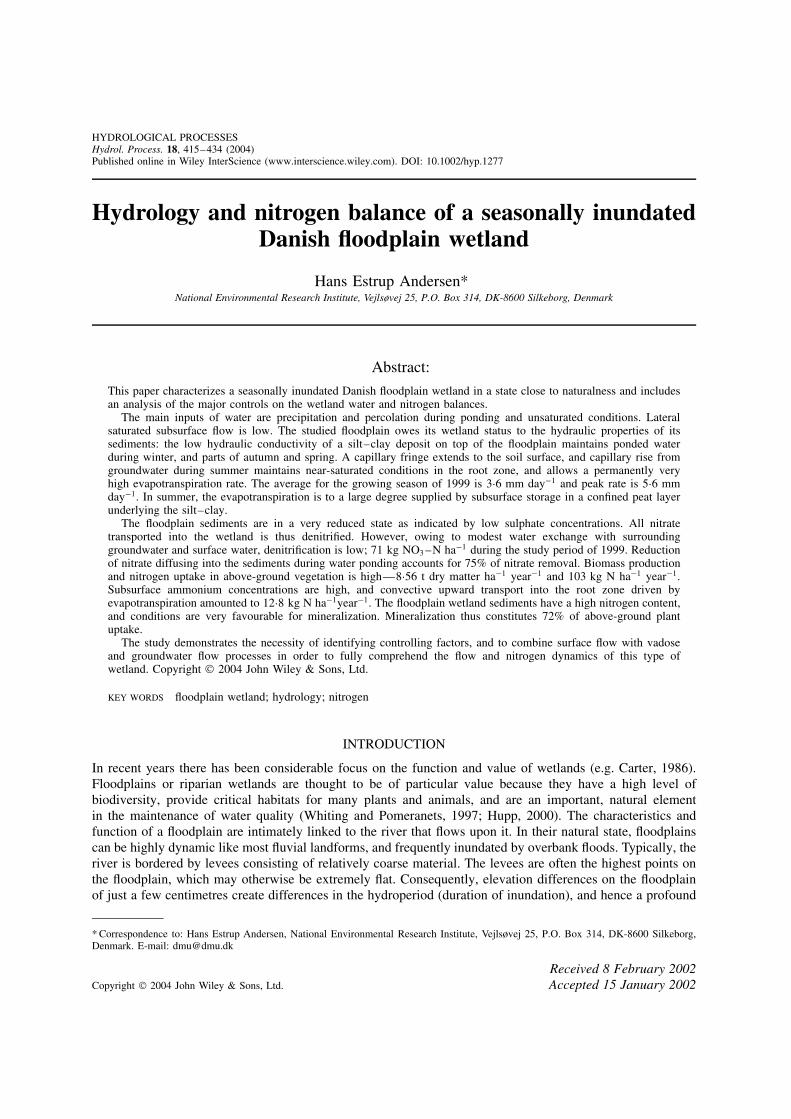
A wetland situated on the floodplain of the River Gjern in Jutland, Denmark (56°220N, 9°410E) was selectedas the study site (Figure 1). The site is located at the lower end of the catchment, 500 m upstream of theoutlet in Lake Sminge (0Ð18 km2�. Lake Sminge is situated on the middle reach of the larger River Gudena(total catchment area D 2638 km2�. The floodplain at the study site is 200 m wide and to the north and southis delineated by terraced hillslopes rising 7 m. The wetland covers the entire floodplain. For the study, a100 m ð 120 m plot was instrumented. The 4-m-wide river is bordered by levees. The floodplain is generallyflat with a very gentle slope (0Ð4%) away from the levees. The upland areas consist of sandy soils dominatedby agriculture and small plantations of mainly coniferous trees. Vegetation in the wetland is strongly zonatedfollowing a dry-to-wet gradient from the riverbank to the hillslope. Dominant species on the gradient areAlopecurus pratensis, Deschampsia caespitosa and Glyceria maxima listed by increasing soil wetness. Thehillslope is bordered by a 25-m-wide Alnus glutinosa woodland. Species richness ranges from 5–10 speciesm�2 on the driest parts up to 40 species m�2 close to the wet Glyceria maxima-dominated zone.
The River Gjern is representative of rivers in eastern Denmark, which are eroded into relatively youngmoraine sediments deposited during the Weichselian glacial stage. It is a typical lowland river with a low-energy regime, which drains 114 km2. Overbank floods occur at regular intervals during autumn, winter andspring. The floodplain has been only slightly altered physically by river regulation, and the natural disturbanceregime, including active meandering and flooding, is intact. Moreover, the floodplain is extensively managed,consisting either of grazing or one annual mowing. The floodplain at the study site is thereby in a state ofapproximate naturalness, which is often pursued in river restoration projects and held as an ideal for floodplainmanagement (Bren, 1993).
The stratigraphy of the wetland at the study site, obtained by hand-augering along a 125-m transect from theriver and supported by a 200-m electrical resistivity survey transect, is given in Figure 2. Four characteristicpost-glacial geological units were mapped. At the bottom is a layer of gyttja at least 3–4 m thick. The gyttjais overlain by 4–5 m of sandy deposits with a high organic content and lenses of hemic peat. Near the
Figure 1. Location of the study area
Copyright 2004 John Wiley & Sons, Ltd. Hydrol. Process. 18, 415–434 (2004)

418 H. E. ANDERSEN
19.0
18.5
18.0
17.5
17.0
16.5
16.0
15.5
15.0
14.5
14.0
13.5
13.0
12.5
12.0
11.5
11.0
10.5
10.00 10 20 30 40 50 60 70 80 90
m.a
.s.l
Distance (m)
Fibric peat
Piezometer
Fibric/hemic peatHemic peatSapric peatGyttja
Medium sandPeaty medium sandFine sandPeaty fine sand
Sandy loamClay loam
Diluvial sand
21 22 23 24 25 35
Silt-clay
Peat
Peaty sand
Gyttja
Figure 2. Sedimentological profile at transect II
hillslope the post-glacial peaty sand is substituted by well-sorted median sand devoid of organic material.This sediment is interpreted as a diluvial late-glacial deposit. The sand is overlain by peat. In the central partof the wetland the peat is 1Ð5 m thick and is mainly hemic. Towards the hillslope the thickness of the peatlayer increases and the peat is increasingly non-decomposed. On top of the peat is a silty–clayey layer with amaximum thickness of 0Ð4 m close to the river and decreasing thickness towards the hillslope. The riverbankitself consists of a layered mixture of sandy and organic deposits. The stratigraphy suggests that the areawas covered initially by a lake with the gyttja deposited on the lake bottom. During the post-glacial period,the sea level dropped and the lake retracted to present-day Lake Sminge, and the River Gjern was formed.During its meandering across the floodplain, sand was deposited and mixed with organic matter. Organicmatter accumulated owing to the high water content (thus anaerobic conditions) prevailing in the floodplainsoils. The silty–clayey top layer was formed during overbank floods when suspended material was depositedowing to a decrease in flow velocity.
METHODS
Hydrological measurements
A network of 63 piezometers was installed to monitor groundwater potential heads and to allow groundwatersampling. Piezometers consisted of PVC pipes with an inside diameter of 28 mm and a slotted well screen
Copyright 2004 John Wiley & Sons, Ltd. Hydrol. Process. 18, 415–434 (2004)
FLOODPLAIN HYDROLOGY AND NITROGEN BALANCE 419
of 10 cm. Screen depths ranged from 0Ð15 m to 3Ð10 m, and piezometers were installed in all geologicalunits identified. The heights of the piezometers were surveyed and related to local base level. Depths to thewater table were read at a mean frequency of 7 days for the duration of the study from January 1999 to June2000. A transect 55 m long with six nests each of two to four water-filled tensiometers inserted to depths of10, 25, 40 and 55 cm, was laid out from the riverbank to the hillslope. Soil-water pressure potential headswere measured automatically at 30-min intervals by pressure transducers (RS Components) connected to aMylog datalogger (Dansk Elektronik Design) from May to September 1999. Temperature effects on transducerreadings were controlled by a pressure transducer inserted into a constant head reservoir sealed at the top toprevent evaporation. This pressure transducer exhibited an amplitude in head of no more than 5 cm duringthe study period. River stage was measured automatically in a stilling well at 10-min intervals and recordedon a Mylog datalogger. Measurements started in 1973. Saturated hydraulic conductivity, Ks , was measuredin the piezometers: a pressure transducer (Druck Ltd) was inserted into the piezometer, and a water level riseof about 15 cm was induced by adding water to the piezometer. This small increase in the hydraulic gradientminimized hydraulic stresses near the well screen, which in peat can cause an expansion of the peat matrixand hence transient changes in water content of the peat rather than a steady-state flow field (Hemond andGoldman, 1985). Moreover, only the last part of the head recovery curve (75–85% recovery of initial head)was used for analysis as recommended by Baird and Gaffney (1994) and Butler (1998). Head recovery datawere recorded on a datalogger (Grant Instruments Ltd) and analysed using the formula of Luthin and Kirkham(1949) with shapefactors from Youngs (1968).
Meteorological measurements
Precipitation was measured at a height of 1Ð5 m (RIMCO, Rauchfuss Instruments) at a climate stationclose to the riverbank. Windspeed (Vector Instruments) and wind direction (Malling Kontrol) were measuredat 2 m. Precipitation was summed every 10 min. The other variables were 10-min averages. All data werestored on a Mylog datalogger. Evapotranspiration from the wetland was estimated using the Bowen ratioenergy balance approach (BREB). A Bowen tower was erected on the central part of the wetland 50 m fromthe river. Evapotranspiration, E (g m�2 s�1), was estimated via its energy equivalent, the latent heat flux �E(W m�2�, within the framework of the surface energy balance
Rn D H C �E C G�W m�2� �1�
where Rn is net radiation, H sensible heat flux, G is surface soil heat flux and � is latent heat of vaporizationof water (J g�1�. Minor components of the energy balance such as photosynthesis and biomass storage havebeen ignored. The energy balance can be rewritten to give the latent heat flux as
�E D �Rn � G�/�1 C ˇ� �2�
where the Bowen ratio (ˇ) describes the ratio of sensible to latent heat fluxes and ˇ D �T/e, � is thepsychometric constant (Pa K�1�, and T and e are measured differences in air temperature ( °C) and vapourpressure (Pa) respectively, between two heights above the canopy. Commercially available instrumentation(Campbell Scientific Inc.) was used for all measurements and is described in detail by Andersen et al. (2003).Penman’s potential open water evaporation, E0, was computed from the formula given in Koerselman andBeltman (1988). A linear relation (R2 D 0Ð94) between E and E0 was used to give estimates for E on dayswithout BREB measurements.
Vegetation structure
Prior to the study period, vegetation was mapped along transects perpendicular to the river and spaced at10 m. Borders between vegetation zones were identified and dominant species in each zone were noted. Atransect traversing all vegetation zones identified was laid out from the riverbank extending 100 m to the
Copyright 2004 John Wiley & Sons, Ltd. Hydrol. Process. 18, 415–434 (2004)

420 H. E. ANDERSEN
north. Biomass was harvested in seven plots each measuring 0Ð25 m2 on this transect eight times during thegrowing season at approximately 2-week intervals. The harvested samples were subsequently dried for 24 hat 105 °C and weighed. Total N in biomass was determined using the method of Kjeldahl (Bremmer andMulvaney, 1985).
Soil analyses
Soil profiles were excavated and described at the riverbank, the central floodplain and the Glyceria maxima-zone. Samples were taken in each identified horizon and analysed for bulk density, organic matter content,textural composition, pH, total N and water retention characteristics. The topography of the wetland wasdetermined by surveying more than 2500 points and related to local base-level.
Water analyses
Geochemical sampling from the network of monitoring piezometers and from the river was conducted ontwo separate occasions: 16 September 1999 and 16 March 2000. Prior to sampling the piezometers wereemptied. The piezometers were then sampled within 24 h. All samples were filtered through 1Ð2 µm glassfilter prior to analysis. Ammonia-N, nitrate-N and nitrite-N were determined on an automated ion analyser(Lachat Instruments). Sulphate and nitrate-N (>1 mg NO3 –N L�1� were determined by ion chromatography(Shimadzu Corporation). Samples for ion chromatography were additionally filtered through 0Ð2 µm membranefilter.
RESULTS AND DISCUSSION
Meteorological conditions
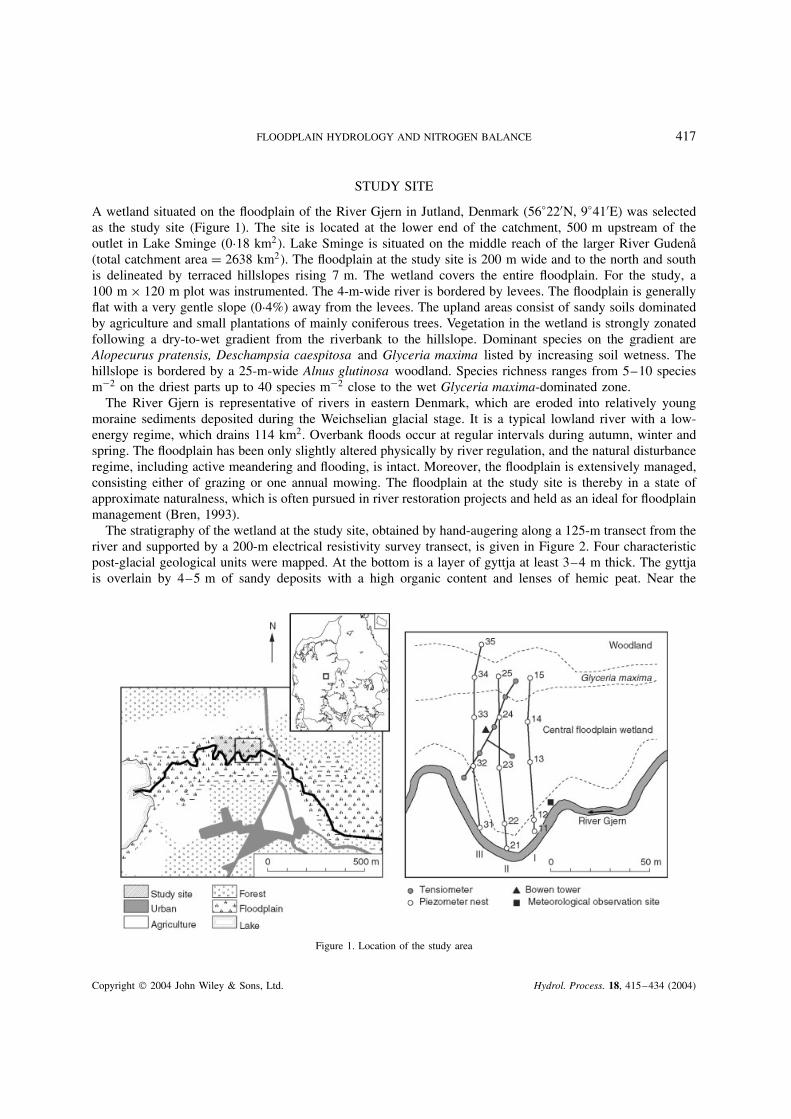
The year 1999 was, like most other years in the decade, warm (Figure 3): 1Ð1 °C above the 1961–1990normal of 7Ð7 °C. Precipitation totalled 1004 mm compared with a normal value of 918 mm (Figure 3). Evap-otranspiration measured over the wetland in 1999 amounted to 667 mm. In April–August, evapotranspirationexceeded precipitation by 154 mm.
Hydrological characteristics of the River Gjern
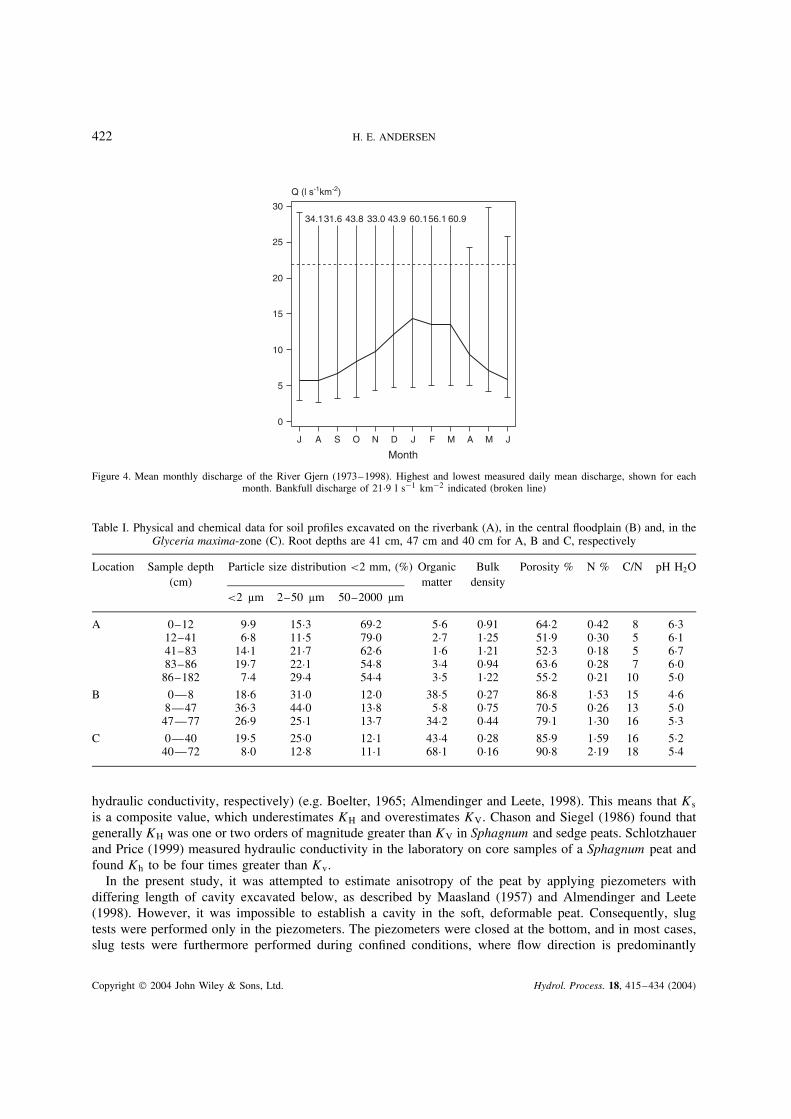
During the period 1973–1998, mean monthly discharge of the River Gjern measured close to thecatchment outlet varied from a seasonal maximum of 14Ð4 L s�1 km�2 (1Ð6 m3 s�1� in January to a minimumof 5Ð7 L s�1 km�2 (0Ð6 m3 s�1� in July (Figure 4). During the period 1995–1999, there was a total of21 overbank floods associated with discharges above 21Ð9 L s�1 km�2 (2Ð5 m3 s�1�. Flooding conditionspersisted for 4Ð6 days on average. The flood frequency is relatively high (review by Richards, 1982, chapter 5).However, Lake Sminge regularly causes backwater conditions in the lower part of River Gjern. A study on theretention of sediments and phosphorus conducted on the floodplain along a 100-m river stretch just upstreamof the bridge (Figure 1) during 1992–1993 (Kronvang et al., 2002), showed that: (i) sediment deposition ratedecreased exponentially with distance to the river, (ii) the coarsest material was deposited on the riverbankand the diameter of deposited material decreased with distance from the river, (iii) average annual depositionof sediments amounted to 2100 g dry weight m�2, and (iv) the entrapment of sediment and phosphorusconstituted 4% and 1Ð8%, respectively, of annual cumulated transport in the River Gjern. Sediment depositionrates are comparable to those reported by Walling (1996), who found a long-term deposition rate of 3000 gdry weight m�2 year�1 on a floodplain of the River Culm, UK. For the floodplain from the bridge to thelake (Figure 1), a storage capacity of 45 000 m3 between the levees and the hillslopes was calculated by thisstudy. When river water enters the floodplain it is trapped behind the levees and flows slowly parallel to theriver towards Lake Sminge. During a flood event the average discharge is 3Ð2 m3 s�1 (based on 1995–1999).With a bankfull discharge of 2Ð5 m3 s�1 surface water enters the floodplain at a rate of 0Ð7 m3 s�1. Hydraulic
Copyright 2004 John Wiley & Sons, Ltd. Hydrol. Process. 18, 415–434 (2004)
FLOODPLAIN HYDROLOGY AND NITROGEN BALANCE 421
Temperature 1999Normal (1961-90)
0
50
100
150
200
DNOSAJJMAMFJ
D JNOSAJJMAMFJ
Month
Precipitation 1999Evapotranspiration 1999
Normal (1961-90)
-10
-5
0
5
10
15
20(°C)
(mm)
Figure 3. Daily mean air temperature at the study site and normal air temperature (1961–90) for Denmark (top). Precipitation andevapotranspiration at the study site, monthly accumulated values. Normal precipitation, monthly accumulated values at the regional
scale (bottom)
residence time for surface water on the floodplain during a flood is thus 18 h. It is therefore believed thatsedimentation efficiency will be at least as high downstream of the bridge as it is upstream, where a drainageditch limits the retention time to 1 h.
Hydraulic characteristics of alluvial–organic deposits
The hydraulic characteristics of wetland sediments can vary significantly over short horizontal and verticaldistances (e.g. Zeeb and Hemond, 1998). This reflects the coincidence, in floodplain wetlands, of alluvialcoarse sediments and fine silt and clay from overbank deposition with heterogeneous organic deposits of peat(Bradley, 1996). Tables I and II document the variation in physical characteristics of the upper layers of thefloodplain wetland from the riverbank towards the hillslope. Soiltypes were classified respectively as GleyicFluvisol (FAO, 1998) on the riverbank, Histic Gleysol in the central part and Histic/Fibric Histosol in theGlyceria maxima-zone.
Head recovery data were analysed assuming isotropic conditions (Table II). However, layering duringsedimentation typically causes peat to be anisotropic with KH > KV (KH and KV being horizontal and vertical
Copyright 2004 John Wiley & Sons, Ltd. Hydrol. Process. 18, 415–434 (2004)
422 H. E. ANDERSEN
34.131.6 43.8 33.0 43.9 60.156.1 60.9
0
5
10
15
20
25
30
J A S O N JMD J F M A
Month
Q (l s-1km-2)
Figure 4. Mean monthly discharge of the River Gjern (1973–1998). Highest and lowest measured daily mean discharge, shown for eachmonth. Bankfull discharge of 21Ð9 l s�1 km�2 indicated (broken line)
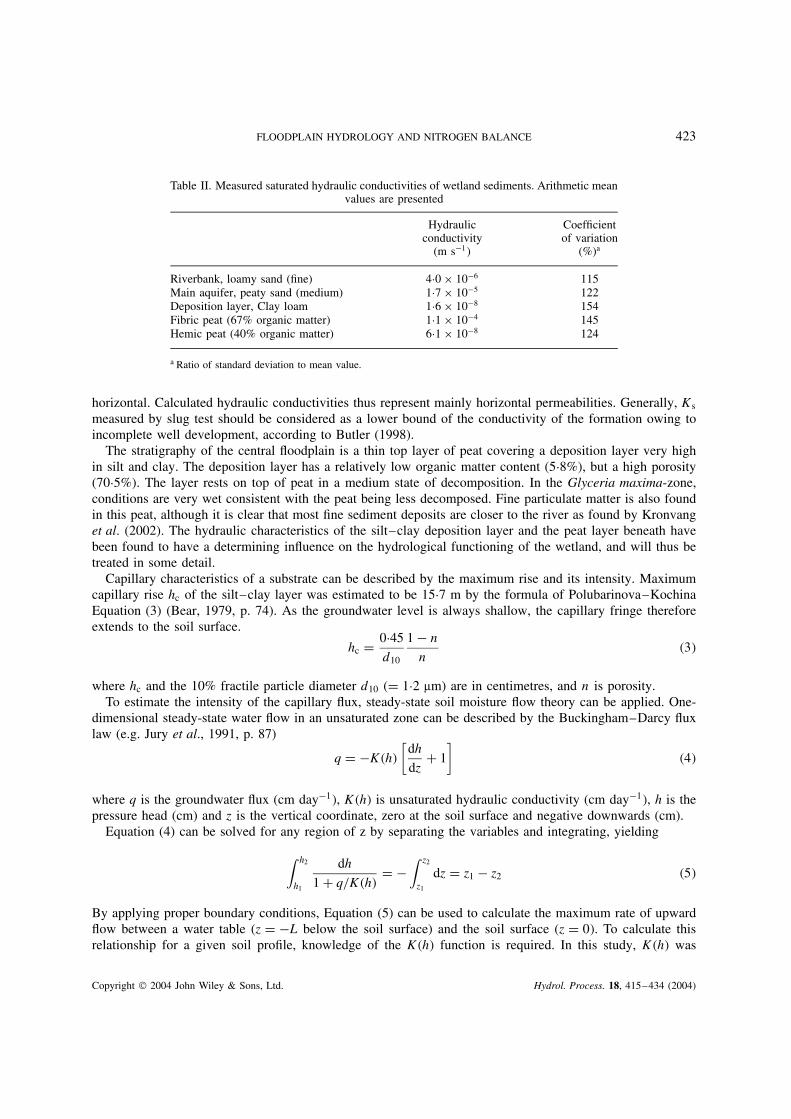
Table I. Physical and chemical data for soil profiles excavated on the riverbank (A), in the central floodplain (B) and, in theGlyceria maxima-zone (C). Root depths are 41 cm, 47 cm and 40 cm for A, B and C, respectively
Location Sample depth Particle size distribution <2 mm, (%) Organic Bulk Porosity % N % C/N pH H2O(cm) matter density
<2 µm 2–50 µm 50–2000 µm
A 0–12 9Ð9 15Ð3 69Ð2 5Ð6 0Ð91 64Ð2 0Ð42 8 6Ð312–41 6Ð8 11Ð5 79Ð0 2Ð7 1Ð25 51Ð9 0Ð30 5 6Ð141–83 14Ð1 21Ð7 62Ð6 1Ð6 1Ð21 52Ð3 0Ð18 5 6Ð783–86 19Ð7 22Ð1 54Ð8 3Ð4 0Ð94 63Ð6 0Ð28 7 6Ð0
86–182 7Ð4 29Ð4 54Ð4 3Ð5 1Ð22 55Ð2 0Ð21 10 5Ð0B 0—8 18Ð6 31Ð0 12Ð0 38Ð5 0Ð27 86Ð8 1Ð53 15 4Ð6
8—47 36Ð3 44Ð0 13Ð8 5Ð8 0Ð75 70Ð5 0Ð26 13 5Ð047—77 26Ð9 25Ð1 13Ð7 34Ð2 0Ð44 79Ð1 1Ð30 16 5Ð3
C 0—40 19Ð5 25Ð0 12Ð1 43Ð4 0Ð28 85Ð9 1Ð59 16 5Ð240—72 8Ð0 12Ð8 11Ð1 68Ð1 0Ð16 90Ð8 2Ð19 18 5Ð4
hydraulic conductivity, respectively) (e.g. Boelter, 1965; Almendinger and Leete, 1998). This means that Ks
is a composite value, which underestimates KH and overestimates KV. Chason and Siegel (1986) found thatgenerally KH was one or two orders of magnitude greater than KV in Sphagnum and sedge peats. Schlotzhauerand Price (1999) measured hydraulic conductivity in the laboratory on core samples of a Sphagnum peat andfound Kh to be four times greater than Kv.
In the present study, it was attempted to estimate anisotropy of the peat by applying piezometers withdiffering length of cavity excavated below, as described by Maasland (1957) and Almendinger and Leete(1998). However, it was impossible to establish a cavity in the soft, deformable peat. Consequently, slugtests were performed only in the piezometers. The piezometers were closed at the bottom, and in most cases,slug tests were furthermore performed during confined conditions, where flow direction is predominantly
Copyright 2004 John Wiley & Sons, Ltd. Hydrol. Process. 18, 415–434 (2004)
FLOODPLAIN HYDROLOGY AND NITROGEN BALANCE 423
Table II. Measured saturated hydraulic conductivities of wetland sediments. Arithmetic meanvalues are presented
Hydraulicconductivity
(m s�1�
Coefficientof variation
(%)a
Riverbank, loamy sand (fine) 4Ð0 ð 10�6 115Main aquifer, peaty sand (medium) 1Ð7 ð 10�5 122Deposition layer, Clay loam 1Ð6 ð 10�8 154Fibric peat (67% organic matter) 1Ð1 ð 10�4 145Hemic peat (40% organic matter) 6Ð1 ð 10�8 124
a Ratio of standard deviation to mean value.
horizontal. Calculated hydraulic conductivities thus represent mainly horizontal permeabilities. Generally, Ks
measured by slug test should be considered as a lower bound of the conductivity of the formation owing toincomplete well development, according to Butler (1998).
The stratigraphy of the central floodplain is a thin top layer of peat covering a deposition layer very highin silt and clay. The deposition layer has a relatively low organic matter content (5Ð8%), but a high porosity(70Ð5%). The layer rests on top of peat in a medium state of decomposition. In the Glyceria maxima-zone,conditions are very wet consistent with the peat being less decomposed. Fine particulate matter is also foundin this peat, although it is clear that most fine sediment deposits are closer to the river as found by Kronvanget al. (2002). The hydraulic characteristics of the silt–clay deposition layer and the peat layer beneath havebeen found to have a determining influence on the hydrological functioning of the wetland, and will thus betreated in some detail.
Capillary characteristics of a substrate can be described by the maximum rise and its intensity. Maximumcapillary rise hc of the silt–clay layer was estimated to be 15Ð7 m by the formula of Polubarinova–KochinaEquation (3) (Bear, 1979, p. 74). As the groundwater level is always shallow, the capillary fringe thereforeextends to the soil surface.
hc D 0Ð45
d10
1 � n
n�3�
where hc and the 10% fractile particle diameter d10 (D 1Ð2 µm) are in centimetres, and n is porosity.To estimate the intensity of the capillary flux, steady-state soil moisture flow theory can be applied. One-
dimensional steady-state water flow in an unsaturated zone can be described by the Buckingham–Darcy fluxlaw (e.g. Jury et al., 1991, p. 87)
q D �K�h�
[dh
dzC 1
]�4�
where q is the groundwater flux (cm day�1�, K�h� is unsaturated hydraulic conductivity (cm day�1�, h is thepressure head (cm) and z is the vertical coordinate, zero at the soil surface and negative downwards (cm).
Equation (4) can be solved for any region of z by separating the variables and integrating, yielding
∫ h2
h1
dh
1 C q/K�h�D �
∫ z2
z1
dz D z1 � z2 �5�
By applying proper boundary conditions, Equation (5) can be used to calculate the maximum rate of upwardflow between a water table (z D �L below the soil surface) and the soil surface (z D 0�. To calculate thisrelationship for a given soil profile, knowledge of the K�h� function is required. In this study, K�h� was
Copyright 2004 John Wiley & Sons, Ltd. Hydrol. Process. 18, 415–434 (2004)
424 H. E. ANDERSEN
estimated by the Brooks and Corey (1966) function (Mualem theory)
K�h� D Ks
[ha
h
]�2C2Ð5��
�6�
where Ks is saturated hydraulic conductivity (cm day�1�, ha is the air entry value (cm) and � a modelparameter.
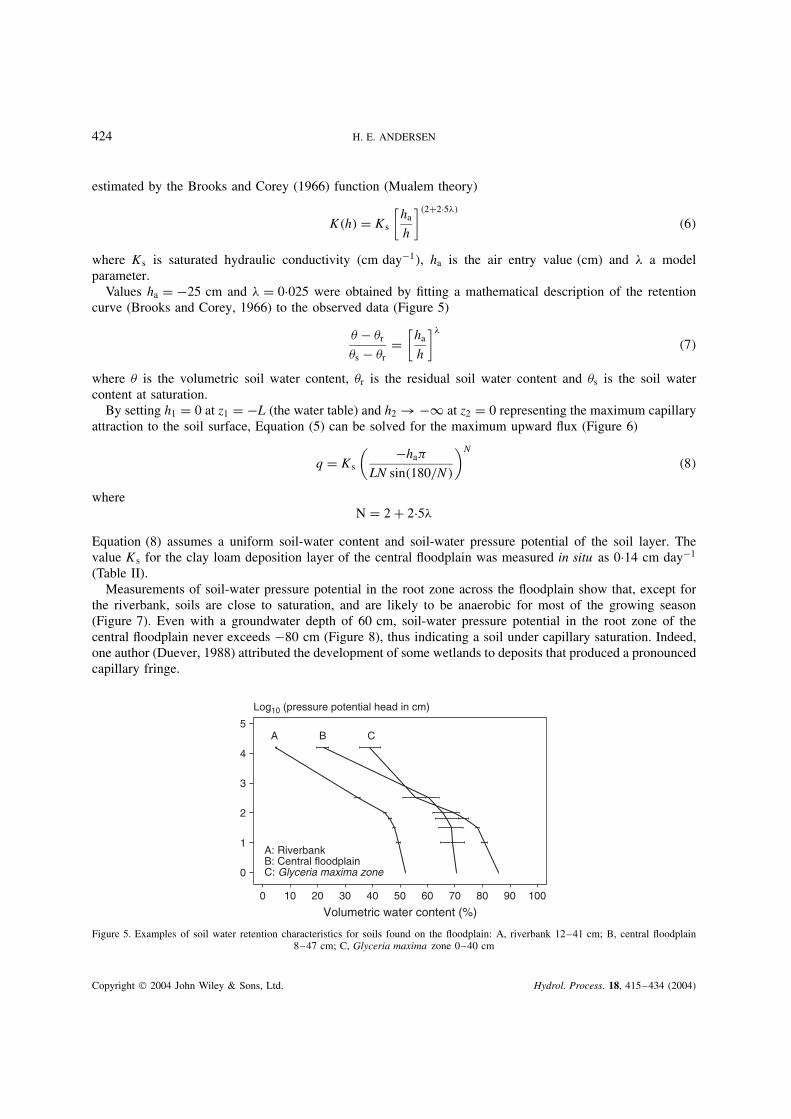
Values ha D �25 cm and � D 0Ð025 were obtained by fitting a mathematical description of the retentioncurve (Brooks and Corey, 1966) to the observed data (Figure 5)
� � �r
�s � �rD
[ha
h
]�
�7�
where � is the volumetric soil water content, �r is the residual soil water content and �s is the soil watercontent at saturation.
By setting h1 D 0 at z1 D �L (the water table) and h2 ! �1 at z2 D 0 representing the maximum capillaryattraction to the soil surface, Equation (5) can be solved for the maximum upward flux (Figure 6)
q D Ks
( �ha�
LN sin�180/N�
)N
�8�
whereN D 2 C 2Ð5�
Equation (8) assumes a uniform soil-water content and soil-water pressure potential of the soil layer. Thevalue Ks for the clay loam deposition layer of the central floodplain was measured in situ as 0Ð14 cm day�1
(Table II).Measurements of soil-water pressure potential in the root zone across the floodplain show that, except for
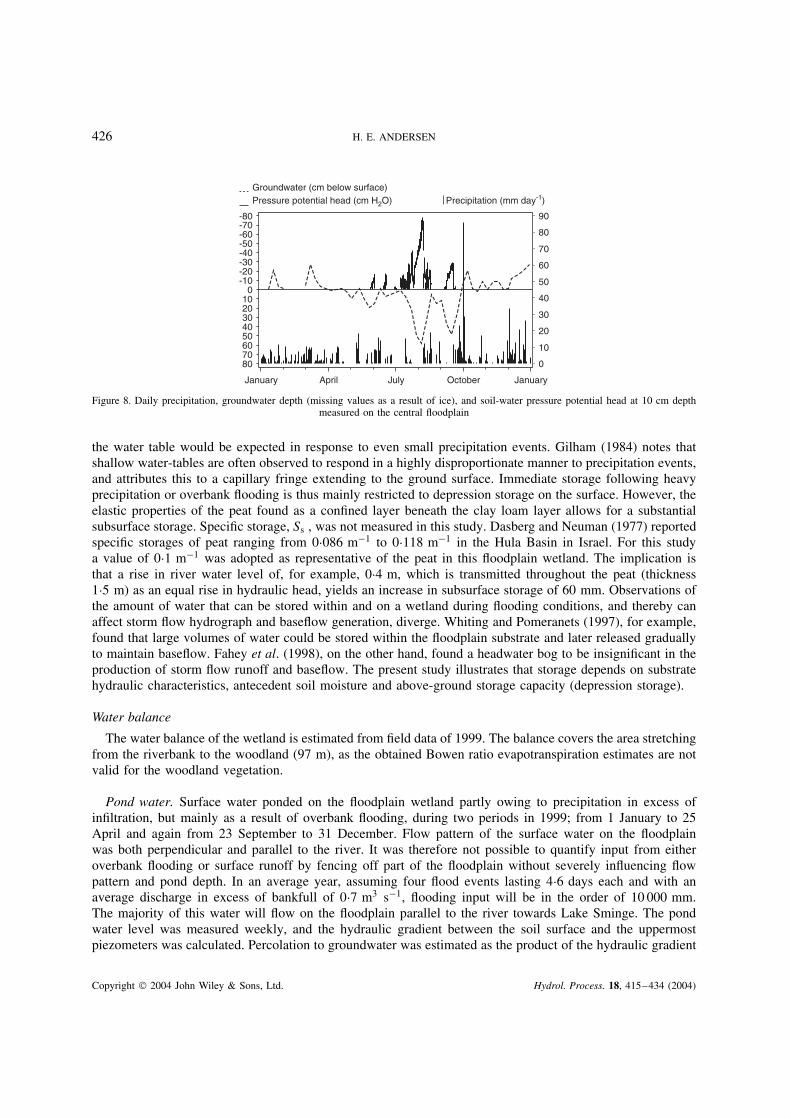
the riverbank, soils are close to saturation, and are likely to be anaerobic for most of the growing season(Figure 7). Even with a groundwater depth of 60 cm, soil-water pressure potential in the root zone of thecentral floodplain never exceeds �80 cm (Figure 8), thus indicating a soil under capillary saturation. Indeed,one author (Duever, 1988) attributed the development of some wetlands to deposits that produced a pronouncedcapillary fringe.
0 10 20 30 40 50 60 70 80 90 100
Volumetric water content (%)
0
1
2
3
4
5
Log10 (pressure potential head in cm)
A B C
A: RiverbankB: Central floodplainC: Glyceria maxima zone
Figure 5. Examples of soil water retention characteristics for soils found on the floodplain: A, riverbank 12–41 cm; B, central floodplain8–47 cm; C, Glyceria maxima zone 0–40 cm
Copyright 2004 John Wiley & Sons, Ltd. Hydrol. Process. 18, 415–434 (2004)

FLOODPLAIN HYDROLOGY AND NITROGEN BALANCE 425
01
23
4
56
78
9
10Maximum upward flux (mm day-1)
0 10 20 30 40 10050 60 70 80 90
Depth to simulated water table (cm)
Figure 6. The relationship between maximum steady upward flux and the groundwater level for the clay loam deposition layer of the centralfloodplain
Glyceria maxima zoneCentral floodplainRiverbank0
302010
5040
60
8070
90100
Duration (%)
0 -25 -50 -75 -100 -125 -150
Soil water pressure head (cm)
Figure 7. Cumulated frequency of measured soil water pressure potential at 10 cm depth in May–September. The anaerobiosis point at�50 cm (Brandyk et al., 1995) is indicated
Evapotranspiration from this floodplain wetland has been subject to a detailed study by Andersen et al.(2003). Evapotranspiration rates were higher than those published for most other wetlands, with an average forthe growing season of 3Ð6 mm day�1 and a peak rate of 5Ð6 mm day�1. Daily average evapotranspiration was110% of Penmans potential open water evaporation, which is considerably higher than results publishedfor other wetland types. The high rates were ascribed to enhancement by local advection and to thecapillary characteristics of the deposition layer. Figure 6 shows that for groundwater depths above 25 cm, anevapotranspiration rate of 3Ð6 mm day�1 can be sustained by capillary rise alone. Moreover, the roots of thevascular vegetation are capable of extracting soil water so as to maintain a very high transpiration rate eventhough the water table drops. The groundwater table rarely goes below 25 cm; this happened most notably inJuly, which saw a precipitation deficit of �104 mm.
By combining measured soil-water pressures at depths of 10, 25, 40 and 55 cm with the corresponding soil-water retention characteristics (Figure 5), it was calculated that at the time of maximum groundwater depth,the saturation deficit of the central floodplain soil amounted to only 22 mm. Consequently, the unconfinedstorage of the upper sediments is very limited even during summer, and an immediate and large rise in
Copyright 2004 John Wiley & Sons, Ltd. Hydrol. Process. 18, 415–434 (2004)
426 H. E. ANDERSEN
80706050403020100
-10-20-30-40-50-60-70-80
0
10
20
30
40
50
60
70
80
90
Precipitation (mm day-1)Groundwater (cm below surface)Pressure potential head (cm H2O)
January April July October January
Figure 8. Daily precipitation, groundwater depth (missing values as a result of ice), and soil-water pressure potential head at 10 cm depthmeasured on the central floodplain
the water table would be expected in response to even small precipitation events. Gilham (1984) notes thatshallow water-tables are often observed to respond in a highly disproportionate manner to precipitation events,and attributes this to a capillary fringe extending to the ground surface. Immediate storage following heavyprecipitation or overbank flooding is thus mainly restricted to depression storage on the surface. However, theelastic properties of the peat found as a confined layer beneath the clay loam layer allows for a substantialsubsurface storage. Specific storage, Ss , was not measured in this study. Dasberg and Neuman (1977) reportedspecific storages of peat ranging from 0Ð086 m�1 to 0Ð118 m�1 in the Hula Basin in Israel. For this studya value of 0Ð1 m�1 was adopted as representative of the peat in this floodplain wetland. The implication isthat a rise in river water level of, for example, 0Ð4 m, which is transmitted throughout the peat (thickness1Ð5 m) as an equal rise in hydraulic head, yields an increase in subsurface storage of 60 mm. Observations ofthe amount of water that can be stored within and on a wetland during flooding conditions, and thereby canaffect storm flow hydrograph and baseflow generation, diverge. Whiting and Pomeranets (1997), for example,found that large volumes of water could be stored within the floodplain substrate and later released graduallyto maintain baseflow. Fahey et al. (1998), on the other hand, found a headwater bog to be insignificant in theproduction of storm flow runoff and baseflow. The present study illustrates that storage depends on substratehydraulic characteristics, antecedent soil moisture and above-ground storage capacity (depression storage).
Water balance
The water balance of the wetland is estimated from field data of 1999. The balance covers the area stretchingfrom the riverbank to the woodland (97 m), as the obtained Bowen ratio evapotranspiration estimates are notvalid for the woodland vegetation.
Pond water. Surface water ponded on the floodplain wetland partly owing to precipitation in excess ofinfiltration, but mainly as a result of overbank flooding, during two periods in 1999; from 1 January to 25April and again from 23 September to 31 December. Flow pattern of the surface water on the floodplainwas both perpendicular and parallel to the river. It was therefore not possible to quantify input from eitheroverbank flooding or surface runoff by fencing off part of the floodplain without severely influencing flowpattern and pond depth. In an average year, assuming four flood events lasting 4Ð6 days each and with anaverage discharge in excess of bankfull of 0Ð7 m3 s�1, flooding input will be in the order of 10 000 mm.The majority of this water will flow on the floodplain parallel to the river towards Lake Sminge. The pondwater level was measured weekly, and the hydraulic gradient between the soil surface and the uppermostpiezometers was calculated. Percolation to groundwater was estimated as the product of the hydraulic gradient
Copyright 2004 John Wiley & Sons, Ltd. Hydrol. Process. 18, 415–434 (2004)

FLOODPLAIN HYDROLOGY AND NITROGEN BALANCE 427
19.0
18.5
18.0
17.5
17.00 10 20 30 40 50 60 70 80 90 100
Max.MeanMin.
m.a
.s.l
Distance (m)
Figure 9. Mean, minimum and maximum depths to groundwater during the growing season April–September 1999 along a transectperpendicular to the river. Solid line indicates the ground surface
and hydraulic conductivity for the clay loam deposition layer. For 1999, percolation during periods of waterponding amounted to 105 mm. Hydraulic conductivity of the hemic peat in the Glyceria maxima-zone ishigher than that of the clay loam. This is, however, offset by hydraulic head in the peat usually being higherthan on the central floodplain (Figure 9), so that the hydraulic gradient during ponding is smaller. As thepond water level was higher by the end of 1999 compared with 1 January 1999, there is a net increase insurface storage. Surface runoff is calculated as the residual in the pond water balance. It is the net differencebetween overbank flooding and surface runoff and does not reflect the large amounts of water flowing acrossthe floodplain during autumn, winter and spring.
Unsaturated zone. An unsaturated zone exists from 26 April to 22 September. At three locations—the riverbank, the central floodplain and the Glyceria maxima-zone—water content was calculated for each soil horizonbetween the soil surface and maximum observed groundwater depth. Calculations were made on a weekly basisusing obtained soil-water retention curves and measured soil-water tension. Evapotranspiration was assumedto be the same at all three locations. The maximum depth of the unsaturated zone decreased from 0Ð86 m atthe riverbank to 0Ð19 m at the Glyceria maxima-zone (Figure 9). Capillary rise and percolation in the Glyceriamaxima-zone amounted to 304 mm and 103 mm, respectively. Both fluxes decreased inversely proportionalto the depth of the unsaturated zone. At the riverbank, the capillary rise was 242 mm and percolation 54 mm,illustrating that a larger proportion of infiltrated precipitation is retained in the unsaturated zone from whereit evaporates, rather than percolates to groundwater.
Groundwater. Syncronous measurements of river discharge were carried out close to the bridge and at astation 500 m downstream of the bridge in June and September 1999. Differences in discharge between thetwo stations were not significant and lay within the 5% uncertainty on discharge measurements. It is thereforenot possible to conclude from the measurements whether the wetland receives water from, or contributesgroundwater to, the river. It is, however, clear that exchange with floodplain groundwater does not have adetermining influence on river discharge.
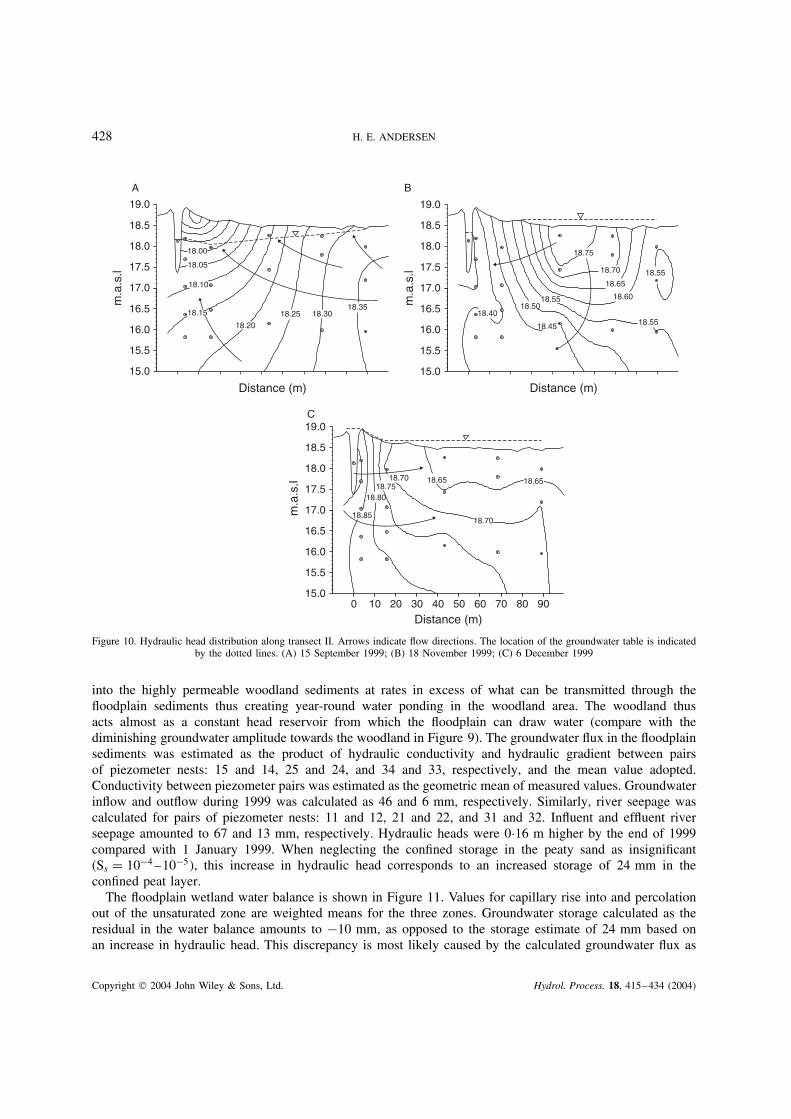
Inspection of data from the three-dimensional network of piezometers revealed that subsurface flow isgenerally perpendicular to the river, and thus can be analysed as a two-dimensional situation. Owing toits thickness, the gyttja layer is assumed to be impervious and to constitute a no-flow boundary belowthe peaty-sand aquifer. Figure 10a–c illustrates typical flow fields. The hydraulic gradient was generallyfrom the hillslope towards the river in the summer and early autumn of 1999 (Figure 10a). An upwardgradient further indicates that the root zone received water from below in addition to precipitation on thesurface. In late autumn and winter, subsurface water flow was also directed towards the river at intermediateriver water levels, but with a downward component following infiltration induced by overbank floodingand ponding (Figure 10b). At very high river-water levels, the flow direction changed and there was aninput of water from the river into the wetland sediments (Figure 10c). Groundwater flows from the hillslope
Copyright 2004 John Wiley & Sons, Ltd. Hydrol. Process. 18, 415–434 (2004)
428 H. E. ANDERSEN
18.85
18.80
18.70 18.6518.75
19.0
18.5
18.0
17.5
17.0
16.5
16.0
15.5
15.0
C
18.40
18.70
18.75
18.5518.50
18.45
18.55
18.55
18.65
18.60m.a
.s.l
m.a
.s.l
m.a
.s.l
19.0
18.5
18.0
17.5
17.0
16.5
16.0
15.5
15.0
B
18.20
18.25 18.3018.35
19.0
18.5
18.0
17.5
17.0
16.5
16.0
15.5
15.0
0 10 20 30 40 50 60 70 80 90
Distance (m)
Distance (m)
A
18.00
18.05
18.10
18.15
18.70
18.65
Distance (m)
Figure 10. Hydraulic head distribution along transect II. Arrows indicate flow directions. The location of the groundwater table is indicatedby the dotted lines. (A) 15 September 1999; (B) 18 November 1999; (C) 6 December 1999
into the highly permeable woodland sediments at rates in excess of what can be transmitted through thefloodplain sediments thus creating year-round water ponding in the woodland area. The woodland thusacts almost as a constant head reservoir from which the floodplain can draw water (compare with thediminishing groundwater amplitude towards the woodland in Figure 9). The groundwater flux in the floodplainsediments was estimated as the product of hydraulic conductivity and hydraulic gradient between pairsof piezometer nests: 15 and 14, 25 and 24, and 34 and 33, respectively, and the mean value adopted.Conductivity between piezometer pairs was estimated as the geometric mean of measured values. Groundwaterinflow and outflow during 1999 was calculated as 46 and 6 mm, respectively. Similarly, river seepage wascalculated for pairs of piezometer nests: 11 and 12, 21 and 22, and 31 and 32. Influent and effluent riverseepage amounted to 67 and 13 mm, respectively. Hydraulic heads were 0Ð16 m higher by the end of 1999compared with 1 January 1999. When neglecting the confined storage in the peaty sand as insignificant(Ss D 10�4 –10�5�, this increase in hydraulic head corresponds to an increased storage of 24 mm in theconfined peat layer.
The floodplain wetland water balance is shown in Figure 11. Values for capillary rise into and percolationout of the unsaturated zone are weighted means for the three zones. Groundwater storage calculated as theresidual in the water balance amounts to �10 mm, as opposed to the storage estimate of 24 mm based onan increase in hydraulic head. This discrepancy is most likely caused by the calculated groundwater flux as
Copyright 2004 John Wiley & Sons, Ltd. Hydrol. Process. 18, 415–434 (2004)

FLOODPLAIN HYDROLOGY AND NITROGEN BALANCE 429
∆Muz = 0
∆Mgr = -10
∆Mpond = 210
P ET
271
278
67
13
Capill. 69Perc.
480
qi
q0
P ET
733
46
6
105Perc.
186
qgr_i
qgr_0
232 qsu
Figure 11. Water balance for 1999 for the floodplain wetland studied. All figures in mm year�1. P, precipitation; ET, evapotranspiration;Capill., capillary rise; Perc., percolation; qi, influent river seepage; qo, effluent river seepage; qgr i, groundwater inflow; qgr o, groundwateroutflow; qsu, surface runoff; Muz, change in soil-water storage; Mpond, change in surface water storage; Mgr, change in groundwa-
ter storage
well as the river seepage being too low owing to too low estimates of hydraulic conductivity, as argued inthe previous section.
During autumn, winter and spring, precipitation in excess of infiltration together with overbank floodingcreate a water pond with an average depth of 0Ð17 m on the central floodplain, which has specific ecologicalimplications, e.g. in selecting adapted plant species (e.g. Bridgham and Richardson, 1993; Grevilliot et al.,1998). Evapotranspiration from this wetland is very high. In periods with no water ponding, evapotranspirationis fed from the vadose zone. The water loss here is replenished by infiltrated precipitation retained in theunsaturated zone, and by water abstracted from the groundwater by capillary forces. Groundwater inflowis low all the year round indicating that the majority of recharge in the upland area is going to a deeper,regional aquifer below the gyttja layer, or flows parallel to the river. Hillslope water entering the wetland istherefore shallow groundwater of local origin. Influent seepage is mainly associated with overbank flooding,which occurs outside the unsaturated period. However, given the elastic properties of the confined peat layer,considerable amounts of water can be taken out of subsurface storage to maintain near-saturated conditionsin the root zone also in periods with considerable evaporative demand. Hydraulic heads were observed todecline from c. 18Ð8 m in early spring to 18Ð0 m when they were at the lowest in August and September.This decline corresponds to a release of approximately 120 mm water from the peat.
Water chemistry
Denitrification. Concentration of sulphate was very low even immediately after cessation of flooding withsulphate-rich surface water (Figure 12). Except for one location close to the surface, sulphate concentrationswere generally well below 5 mg L�1 or even nil, indicating very reducing conditions at least during andafter water ponding. Sulphate is reduced to sulphide at a redox potential of �100 mV to �200 mV. Notsurprisingly, analysis of water samples from all piezometers both before and after a growing season thusrevealed that the sediments are devoid of nitrate at all times. Nitrate reduction takes place at a redox potentialof 300 to 100 mV. Hence, all nitrate that comes into contact with the anaerobic soil is denitrified to nitrousoxide, N2O, or gaseous nitrogen, N2.
There are five sources of nitrate: (i) dry and wet atmospheric deposition; (ii) influent river seepage;(iii) infiltration of ponding surface water; (iv) diffusion of nitrate from ponding surface water into thesediments; and (v) groundwater inflow. Data from the Nationwide Monitoring Programme for Air Quality(Ellermann et al., 2000) indicate that approximately 2Ð5 kg NO3 –N ha�1 is deposited annually outside thegrowing season. All this nitrate is considered denitrified owing to the water saturated condition of the floodplainwetland. Nitrate concentration was measured in River Gjern 786 times from 1995 to 1998. Concentrationsvaried from a summer mean of 1Ð56 mg NO3 –N l�1 to 4Ð95 mg NO3 –N L�1 in winter. The winter mean
Copyright 2004 John Wiley & Sons, Ltd. Hydrol. Process. 18, 415–434 (2004)

430 H. E. ANDERSEN
0 10 20 30 40 50 60 70 80 90
m.a
.s.l
Distance (m)
19.0
18.5
18.0
17.5
17.0
16.5
16.0
15.5
15.0
6.38
6.67
4.91
7.52
6.33
3.04
7.87
11.37
1.59
5.670.35
1.62
3.1910.49
0.095.66
5.42
9.28
10.63
0.19
0
0.64
0
0.35
00
0 0
62.59
1.42
0
2.96
0.360.45
0.72
00.12
41.84
12.3 9.1 9.2 8.9 15.6 14.9 12.7
SO4(mg l-1)NH4(mg l-1)
a b c d e f g
N Plant-N (g N m-2)
Figure 12. Cross-section at transect II. Sulphate (mg L�1� and ammonium (mg L�1) measured at different depths in groundwater on 16March 1999. (a–g) vegetation zones. Dominant species, with Ellenberg nitrogen index in parenthesis, are: a, Phalaris arundinacea (6Ð8);b, Alopecurus pratensis (6Ð8); c, Alopecurus pratensis/Deschampsia caespitosa (5Ð9); d, Deschampsia caespitosa (3Ð0); e, Juncus effusus(4Ð0); f, Filipendula ulmaria (4Ð0); g, Glyceria maxima (7Ð3). Maximum nitrogen content in above-ground biomass (g m�2) is shown for
each vegetation zone
concentration is adopted here as representing both influent river seepage and infiltrating surface water. Allnitrate entering the sediments by river seepage or infiltrating surface water is assumed lost by denitrification.In addition to convective transport by infiltrating surface water, nitrate also enters the sediments by diffusionduring ponding. A recent study on denitrification was carried out on soil cores sampled few hundred metresupstream of the location of the present study (Jacobsen, 2002). The soil cores were flooded by water containing15N-labelled nitrate. Prior to the experiments the soil cores were water saturated, thus infiltration could beignored. Denitrification was determined by measuring the production of gaseous N2. The flux of N2 (mmolN2 –N m�2 day�1� could be described by (Equation 9) which is in accordance with other work (Davidssonand Leonardson (1998) and Davidsson and Stahl (2000) on flooded meadows; Windolf et al. (1996) onshallow lakes)
N2 D k[NO3]Q�T/10�10 �9�
where k D 0Ð024 m day�1, [NO3] is nitrate concentration in ponding water (mmol NO3 –N m�3�, Q10 D 1Ð76and T is water temperature ( °C).
With a pond water depth of 17 cm, an initial nitrate concentration of 4Ð95 mg NO3–N L�1, and a watertemperature of 7 °C, 95% of all nitrate in the pond will be reduced within 2 weeks. As the number of floods ison average four per year this process of nitrate removal is limited by supply. The study period of 1999 saw fourfloodings and the total nitrate removal owing to diffusion amounted to 52Ð7 kg N ha�1. Nitrate concentrationof groundwater entering from the hillslope was not measured, however, shallow groundwater (1Ð5–5 m)in six agriculturally dominated catchments has been monitored bi-monthly since 1990 in the Nationwide
Copyright 2004 John Wiley & Sons, Ltd. Hydrol. Process. 18, 415–434 (2004)
FLOODPLAIN HYDROLOGY AND NITROGEN BALANCE 431
Table III. Nitrate removal from water of different sources getting into contact with the floodplain sediments. Influent riverseepage and groundwater inflow are evaluated per river and upscaled afterwards
Source Concentrationmg NO3 –N l�1
Water flux Nitrate-N removalg N m�1 yr�1
Nitrate-N removalkg N ha�1 yr�1
Influent river seepage 4Ð95 6Ð5 m3 m�1 year�1 32Ð2 5Ð2a
Infiltrating surface water 4Ð95 105 mm year�1 5Ð2Nitrate diffusion into sediments 4Ð95c 52Ð7Groundwater inflow 11Ð7 4Ð5 m3 m�1 year�1 52Ð7 5Ð2b
Atmospheric deposition 2Ð5
a Both sides of the river considered. The floodplain is 200 m wide, but owing to meandering the river runs 80 m to cover 50 m straightdownstream.b Hillslopes at both sides of the floodplain were considered.c Initial concentration.
Agricultural Watershed Monitoring Programme (Grant et al., 1999). Mean nitrate concentration during theperiod 1990–1998 was 11Ð7 mg NO3 –N L�1, and this value was adopted for this study. Denitrificationwithin the floodplain sediments totals 70Ð8 kg N ha�1 year�1 (Table III), which is in the low end of the rangemeasured in other Danish undrained wet meadows and fens; 57 to 2179 N ha�1 year�1 (Hoffmann, 1998).Nitrate removal rate is controlled by the supply of nitrate with groundwater and surface water.
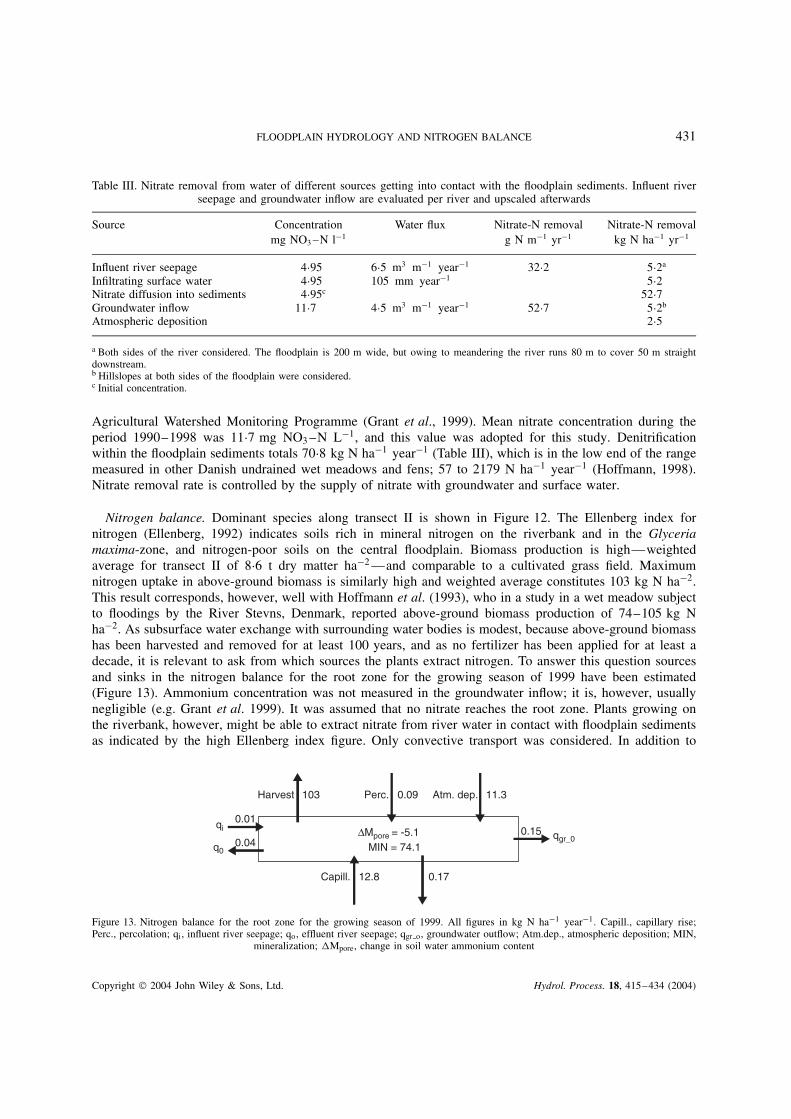
Nitrogen balance. Dominant species along transect II is shown in Figure 12. The Ellenberg index fornitrogen (Ellenberg, 1992) indicates soils rich in mineral nitrogen on the riverbank and in the Glyceriamaxima-zone, and nitrogen-poor soils on the central floodplain. Biomass production is high—weightedaverage for transect II of 8Ð6 t dry matter ha�2 —and comparable to a cultivated grass field. Maximumnitrogen uptake in above-ground biomass is similarly high and weighted average constitutes 103 kg N ha�2.This result corresponds, however, well with Hoffmann et al. (1993), who in a study in a wet meadow subjectto floodings by the River Stevns, Denmark, reported above-ground biomass production of 74–105 kg Nha�2. As subsurface water exchange with surrounding water bodies is modest, because above-ground biomasshas been harvested and removed for at least 100 years, and as no fertilizer has been applied for at least adecade, it is relevant to ask from which sources the plants extract nitrogen. To answer this question sourcesand sinks in the nitrogen balance for the root zone for the growing season of 1999 have been estimated(Figure 13). Ammonium concentration was not measured in the groundwater inflow; it is, however, usuallynegligible (e.g. Grant et al. 1999). It was assumed that no nitrate reaches the root zone. Plants growing onthe riverbank, however, might be able to extract nitrate from river water in contact with floodplain sedimentsas indicated by the high Ellenberg index figure. Only convective transport was considered. In addition to
∆Mpore = -5.1MIN = 74.1
103
0.01
0.04
Harvest 0.09Perc.
qi
q0
0.15
11.3Atm. dep.
qgr_0
12.8Capill. 0.17
Figure 13. Nitrogen balance for the root zone for the growing season of 1999. All figures in kg N ha�1 year�1. Capill., capillary rise;Perc., percolation; qi, influent river seepage; qo, effluent river seepage; qgr o, groundwater outflow; Atm.dep., atmospheric deposition; MIN,
mineralization; Mpore, change in soil water ammonium content
Copyright 2004 John Wiley & Sons, Ltd. Hydrol. Process. 18, 415–434 (2004)
432 H. E. ANDERSEN
capillary driven transport of ammonium, diffusion of ammonium into the root zone might take place. Rootzone ammonium concentration after the growing season of 1999 was 0Ð60 mg NH4 –N L�1. A value of2Ð42 mg NH4 –N L�1 was measured in March 2000 and was adopted as a pre-growing season value for 1999.Nitrogen mineralization was calculated as the residual in the mass balance. Mineralization within the root zoneconstituted 74Ð1 kg N ha�1 year�1 during 1999 and is thus by far the most dominant N source. Laboratorymeasurements of mineralization (ammonification) were carried out in the study by Hoffmann et al. (1993).Rates of 1Ð1–1Ð4 kg N ha�2 day�1 were found. Mineralization thus by far exceeded above-ground plantuptake of 0Ð3–0Ð6 kg N ha�2 day�1. Sediment ammonium concentrations are high in the floodplain wetlandof the present study, and increase downward (Figure 12) with only little variation between measurementsin March and September. At the same time, conditions for mineralization are very favourable, with C : Nratios far below 80 (Table I), above which value immobilization dominates in anaerobic environments (Reddyand Patrick, 1984). In aerobic environments, the corresponding value is 20–23. According to Reddy andPatrick (1984), this explains why ammonium release in connection with mineralization of organic matteris higher under anaerobic than aerobic conditions despite the fact that decomposition is more extensiveand more rapid under aerobic conditions. The pH in the root zone is generally above 5, meaning thatneither mineralization nor plant uptake are restrained by acidic conditions. Owing to the very reducedconditions, nitrification of ammonium and subsequent denitrification are believed to be negligible. As thewater exchange with the surrounding environment is mainly vertical across the soil surface, and as there is nodeep percolation, leaching of nitrogen is therefore very limited, leaving harvest as the only important nitrogensink.
CONCLUSIONS
The floodplain wetland studied is in a state of near-naturalness characterized by frequent overbank floodingduring winter, and parts of autumn and spring, and an associated high retention of riverine sediments andP compounds. The main inputs of water are precipitation and percolation during ponding and unsaturatedconditions. Lateral subsurface flow is low, but it does have a large degree of uncertainty and is believedto be underestimated. Groundwater flow direction is from the hillslope towards the river in summer and atintermediate river levels. At high river water levels, flow direction is reversed and influent river seepage takesplace.
The floodplain studied owes its wetland status to the hydraulic properties of its sediments: the lowhydraulic conductivity of a clay loam deposition layer maintains ponded water during winter, and in partsof autumn and spring. A capillary fringe extends to the soil surface, and capillary rise from groundwaterduring summer maintains near-saturated conditions in the root zone, and allows a permanent very highevapotranspiration rate. In summer, the evapotranspiration is to a large degree supplied by subsurface storagein a confined peat layer underlying the clay loam. Peat can—even under confined conditions, and because ofits elastic properties—release considerable amounts of water. This water in turn is replenished by groundwaterinflow, influent seepage during high river water level, and percolation both during unsaturated and pondingconditions.
Owing to low exchange of water with surrounding groundwater and surface water, denitrification is amodest 70Ð8 kg NO3 –N ha�1 year�1 during the study period of 1999. Reduction of nitrate diffusing intothe sediments during water ponding accounts for 75% of nitrate removal. Biomass production and nitrogenuptake in above-ground vegetation is high—8Ð56 t dry matter ha�1 and 103 kg N ha�1. The floodplain wetlandsediments have a high nitrogen content, and conditions are very favourable for mineralization. Mineralizationthus constitutes 72% of above-ground plant uptake.
The study emphasizes the necessity of identifying controlling factors, and to combine surface flow withvadose and groundwater flow processes in order to fully comprehend the flow and nitrogen dynamics of thistype of wetland.
Copyright 2004 John Wiley & Sons, Ltd. Hydrol. Process. 18, 415–434 (2004)
FLOODPLAIN HYDROLOGY AND NITROGEN BALANCE 433
REFERENCES
Almendinger JE, Leete JH. 1998. Regional and local hydrogeology of calcareous fens in the Minnesota River Basin, USA. Wetlands 18(2):184–202.
Andersen HE, Hansen S, Jensen HE. 2003. Evapotranspiration from a riparian fen wetland. Nordic Hydrology .Baird AJ, Gaffney SW. 1994. Cylindrical piezometer responses in a humified fen peat. Nordic Hydrology 25: 167–182.Bear J. 1979. Hydraulics of Groundwater . McGraw-Hill Inc: London.Bendix J, Hupp CR. 2000. Hydrological and geomorphological impacts on riparian plant communities. Hydrological Processes 14:
2977–2990.Blicher-Mathiesen G. 1998. Nitrogen removal in riparian areas. PhD thesis, Natural Environment Research Institute, Silkeborg. (In Danish.)Bloemen GW. 1983. Calculation of hydraulic conductivities and steady state capillary rise in peat soils from bulk density and solid matter
volume. Zeitschrift fuer Pflanzenernaehrung und Bodenkunde 146: 460–473.Boelter DH. 1965. Hydraulic conductivity of peats. Soil Science 100(4): 227–231.Bradley C. 1996. Transient modelling of water-table variation in a floodplain wetland, Narborough Bog, Leicestershire. Journal of Hydrology
185: 87–114.Bradley C, Gilvear DJ. 2000. Saturated and unsaturated flow dynamics in a floodplain wetland. Hydrological Processes 14: 2945–2968.Brandyk TJ, Dodd VA, Grace PM. 1985. An assessment of some unsaturated hydraulic conductivity characteristics for a range of Irish peat
soils. Irish Journal of Agricultural Research 24: 237–251.Brandyk T, Szunirwicz J, Skapsi K, Szatylowicz J. 1995. The soil moisture regime study of fen peat soils in the Middle Biebrza Basin as
a basis for soil protection. Zeitschrift fuer Kulturtechnik und Landentwicklung 36: 78–83.Bremmer JM, Mulvaney S. 1985. Nitrogen—total. In Methods of Soil Analyses , Part 2, Page AL, Miller RH, Keeney DR (eds). Series in
Agronomy, No. 9, Soil Science Society of America: Madison, WI; 595–622.Bren LJ. 1993. Riparian zone, stream, and floodplain issues: a review. Journal of Hydrology 150: 277–299.Bridgham SD, Richardson CJ. 1993. Hydrology and nutrient gradients in North Carolina peatlands. Wetlands 13: 207–218.Brooks RH, Corey AT. 1966. Properties of porous media affecting fluid flow. Journal of the Irrigation Division, American Society of Civil
Engineers 92: 61–88.Butler JJ. 1998. The Design, Performance, and Analysis of Slug Tests . Lewis Publishers: London.Carter V. 1986. An overview of the hydrologic concerns related to wetlands in the United States. Canadian Journal of Botany 64: 364–374.Chason DB, Siegel DI. 1986. Hydraulic conductivity and related physical properties of peat, Lost River Peatland. Northern Minnesota. Soil
Science 142(2): 91–99.Da Silva FF, Wallach R, Chen Y. 1993. Hydraulic properties of sphagnum peat moss and tuff (scoria) and their potential effects on water
availability. Plant and Soil 154: 119–126.Davidsson TE, Leonardson LG. 1998. Seasonal dynamics of denitrification activity in two water meadows. Hydrobiologia 364: 189–198.Davidsson TE, Stahl M. 2000. The influence of organic carbon on nitrogen transformation in five wetland soils. Soil Science Society of
America Journal 64: 1129–1136.Dasberg S, Neuman SP. 1977. Peat hydrology in the Hula Basin, Israel: I. Properties of peat. Journal of Hydrology 32: 219–239.Drexler JZ, Bedford BL, DeGaetano AT, Siegel DI. 1999. Quantification of the water budget and nutrient loading in a small peatland.
Journal of the American Water Resources Association 35(4): 753–769.Duever MJ. 1988. Hydrologic processes for models of freshwater wetlands. In Wetland Modelling , Mitsch WJ, Straskroba M, Jørgensen SE
(eds). Developments in Environmental Modelling, Elsevier: Amsterdam; 9–39.Ellenberg H, Weber HE, Dull R, Wirth V, Werner W, Paulissen D. 1992. Zeigerwerte von Planzen in Mitteleuropa. Scripta Geobotanica
18: 1–248.Ellermann T, Hertel O, Skjøth CA. 2000. Atmospheric Deposition 1999. Technical Report No. 332, Natural Environment Research Institute:
Silkeborg. (In Danish.)Fahey B, Bowden WB, Smith J, Murray DL. 1998. Hillslope–wetland hydrological linkages in the headwaters of a tussock grassland
catchment at Glendhu, South Island, New Zealand; In Hydrology, Water Resources and Ecology in Headwaters (Proceedings of theHeadWater ’98 Conference held at Meran/Merano, Italy, April 1998). Publication 248, International Association of Hydrological Sciences:Wallingford: 157–164.
FAO. 1998. World Reference Base for Soils. World Soil Resource Report 84, Food and Agriculture Organization of United Nations: Rome;International Society of Soil Science and Soils Reference and Information Centre: Wageningen.
Gilham RW. 1984. The capillary fringe and its effect on water-table response. Journal of Hydrology 67: 307–324.Gilvear DJ, Andrews R, Tellam JH, Lloyd JW, Lerner DN. 1993. Quantification of the water balance and hydrogeological processes in the
vicinity of a small groundwater-fed wetland, East Anglia, UK. Journal of Hydrology 144: 311–334.Grant R, Paulsen I, Andersen HE A, Laubel, Jørgensen JO, Jensen PG, Pedersen M, Rasmussen P. 1999. The Agricultural Watershed
Monitoring Programme, 1998. Technical Report No 293, Natural Environment Research Institute: Silkeborg. (In Danish.)Grevilliot F, Krebs L, Muller S. 1998. Comparative importance and interference of hydrological conditions and soil nutrient gradients in
floristic biodiversity in flood meadows. Biodiversity and Conservation 7: 1495–1520.Hemond HF, Goldman JC. 1985. On non-Darcian water flow in peat. Journal of Ecology 73: 579–584.Hoffmann CC. 1998. Nutrient retention in wet meadows and fens. PhD thesis, Natural Environment Research Institute: Silkeborg.Hoffmann CC, Dahl M, Kamp-Nielsen L, Stryhn H. 1993. Vand- og stofbalance i en natureng. Environmental Project No 231, Danish
Environmental Protection Agency: Copenhagen. (In Danish.)Hupp CR. 2000. Hydrology, geomorphology and vegetation of Coastal Plain rivers in the south-eastern USA. Hydrological Processes 14:
2991–3010.Hyashi M, van der Kamp G, Rudolph DL. 1998. Water and solute transfer between a prairie wetland and adjacent uplands, 1. Water balance.
Journal of Hydrology 207: 42–55.
Copyright 2004 John Wiley & Sons, Ltd. Hydrol. Process. 18, 415–434 (2004)

434 H. E. ANDERSEN
Jacobsen JP. 2002. Denitrifikation i vadomrader. MSc thesis, University of Arhus. (In Danish.)Jury WA, Gardner WR, Gardner WH. 1991. Soil Physics . Wiley: Chichester.Koerselman W, Beltman B. 1988. Evapotranspiration from fens in relation to Penman’s potential free water evaporation (Eo) and pan
evaporation. Aquatic Botany 31: 307–320.Kronvang B, Falmum Ø, Svendsen LM, Laubel A. 2001. Deposition of sediment and phosphorus during overbank flooding. Verh Internat
Verein Limnol 28: 1289–1293.Lent RM, Weiskel PK, Lyford FP, Armstrong DS. 1997. Hydrological indices for nontidal wetlands. Wetlands 17(1): 19–30.Luthin JN, Kirkham D. 1949. A piezometer method for measuring permeability of soil in situ below a water-table. Soil Science 68: 349–358.McKillop R, Kouwen N, Soulis ED. 1999. Modelling the rainfall–runoff response of a headwater wetland. Water Resources Research 35(4):
1165–1177.Mitsch WJ, Gosselink JG. 1986. Wetlands , Van Nostrand Reinhold: New York.Maasland M. 1957. II. The Theory of Land Drainage. In Drainage of Agricultural Lands , Luthin JN (ed.). American Society of Agronomy:
265–285.Ovesen NB, Iversen HL, Larsen SE, Muller-Wohlfeil D-I, Svendsen LM, Blicher AS, Jensen PM. 2000. Discharge in Danish Streams.
Technical Report no. 340, Natural Environment Research Institute: Silkeborg. (In Danish.).Ponnamperuma FN. 1984. Effects of flooding on soils. In Flooding and Plant Growth, Kozlowski TT (ed.). Academic Press: 10–45.Raisin G, Bartley J, Croome R. 1999. Groundwater influence on the water balance and nutrient budget of a small natural wetland in
Northeastern Victoria, Australia. Ecological Engineering 12: 133–147.Reddy KR, Patrick WH. 1984. Nitrogen transformations and loss in flooded soils and sediments. CRC Critical Reviews Environmental
Control 13(4): 273–309.Restrepo JI, Montoya AM, Obeysekera J. 1998. A wetland simulation module for the MODFLOW ground water model. Ground Water
36(5): 764–770.Richards K. 1982. Rivers, Form and Process in Alluvial Channels . Methuen: London.Roulet N. 1990. Hydrology of a headwater basin wetland: groundwater discharge and wetland maintenance. Hydrological Processes 4:
387–400.Schlotzhauer SM, Price JS. 1999. Soil water flow dynamics in managed cutover peat field, Quebec: field and laboratory investigations. Water
Resources Research 35(12): 3675–3683.Silvertown J, Dodd ME, Gowing DJG, Mountford JO. 1999. Hydrologically defined niches reveal a basis for species richness in plant
communities. Nature 400: 61–63.Stewart LK, Hudak PF, Doyle RD. 1998. Modelling hydrologic alterations to a developing wetland in an abandoned borrow pit. Journal of
Environmental Management 53: 231–239.Tabacchi E, Lambs L, Guilloy H, Planty-Tabacchi A-M, Muller E, Decamps H. 2000. Impacts of riparian vegetation on hydrological
processes. Hydrological Processes 14: 2959–2976.Walling DE. 1996. Illumination drainage basin sediment delivery systems. In Kronvang B, Svendsen LM, Sibbesen E (eds). Sediments and
Phosphorus—Erosion and Delivery, Transport and Fate of Sediment and Sediment Associated Nutrients in Watersheds. Technical ReportNo. 178, Natural Environment Research Institute: Silkeborg; 135–142.
Weiss R, Alm J, Laiho R, Laine J. 1998. Modelling moisture retention in peat soils. Soil Science Society of America Journal 62: 305–313.Whiting PJ, Pomeranets M. 1997. A numerical study of bank storage and its contribution to streamflow. Journal of Hydrology 202: 121–136.Windolf J, Jeppesen E, Jensen JP, Kristensen P. 1996. Modelling of seasonal variation in nitrogen retention and in-lake concentration: a
four-year mass balance study in 16 shallow Danish lakes. Biogeochemistry 33: 25–44.Winter TC, Rosenberry DO. 1995. The interaction of ground water with prairie pothole wetlands in the Cottonwood Lake area, East-central
North Dakota, 1979–1990. Wetlands 15(3): 193–211.Youngs EG. 1968. Shape factors for Kirkham’s piezometer method for determining the hydraulic conductivity of soil in situ for soils
overlying an impermeable floor or infinitely permeable stratum. Soil Science 106(3): 235–237.Zeeb PJ, Hemond HF. 1998. Hydrologic response of a wetland to changing moisture conditions. Modeling effects of soil heterogeneity.
Climatic Change 40: 211–227.
Copyright 2004 John Wiley & Sons, Ltd. Hydrol. Process. 18, 415–434 (2004)