Embed Size (px)
Citation preview
HYDROLOGY AND IRRIGATION ENGINEERING 10CV55
Dept of Civil Engg, ACE 1
SYLLABUS
PART-A –HYDROLOGY
UNIT 1: INTRODUCTION & PRECIPITATION
Introduction, Hydrologic cycle (Horton‘s representation). Water budget equation Precipitation:
introduction, forms of precipitation, types of precipitation, measurement of precipitation
(Simon‘s gauge & Syphon gauge only), selection of rain gauge station. Adequacy of rain
gauges, methods of computing average rainfall, interpolation of missing data, adjustment of
missing data by double mass curve method. Hyetograph and mass curve of rainfall,
07 hrs
UNIT 2 : LOSSES FROM PRECIPITATION
Evaporation: Definition, factors affecting, measurement (Class A pan). Estimation using
empirical methods (Meyer‘s and Rohwer‘s equation), Evaporation control. Evapo-
transpiration-Definition, factors affecting, measurement, estimation (Blaney Criddle method)
Infiltration - Definition, factors affecting, measurement (double ring infiltrometer), infiltration
indices, Horton‘s equation of Infiltration. ` 07 hrs
UNIT 3: HYDROGRAPHS
Definition, components of hydrographs, unit hydrograph and its derivation from simple
storm hydrograph, base flow separation, Prepositions of unit hydrograph- problems. 06 hrs
UNIT 4: ESTIMATION OF FLOOD & FLOOD ROUTING
Definition of flood, factors affecting flood, methods of estimation (envelope curves,
empirical formulae, rational method ).
Flood routing: Introduction to hydrological routing, relationship of out flow and storage,
general storage equation, Muskingum routing method. 07 hrs
PART-B - IRRIGATION ENGINEERING
UNIT 5 : INTRODUCTION
Introduction, need for irrigation, advantages and disadvantages of irrigation, environmental
impacts of irrigation, Systems of irrigation: Gravity irrigation, lift irrigation, well irrigation,
tube well irrigation, infiltration galleries, sewage irrigation, supplemental irrigation. 06 hrs
HYDROLOGY AND IRRIGATION ENGINEERING 10CV55
Dept of Civil Engg, ACE 2
UNIT 6: SOIL-WATER-CROP RELATIONSHIP
Introduction, soil profile, physical properties of soil, soil classification. Indian soils, functions
of irrigation soils, maintaining soil fertility, soil-water-plant relationship, soil moisture
constants. Irrigation relationship, frequency of irrigation. 06 hrs
UNIT 7: WATER REQUIREMENT OF CROPS
Introduction, definitions, crop seasons of India, water requirement of a crop, duty, delta, base
period. Consumptive use. Irrigation efficiencies. Assessment of irrigation water. 07 hrs
UNIT 8: CANALS
Definition, Types of canals, Alignment of canals, Design of canals by Kenedy‘s and
Lacey‘smethods- Problems 06 hrs
TEXT BOOKS:
1. Engineering Hydrology – Subramanya.K; Tata Mcgraw Hill NewDelhi-2008 (Ed)
2. Hydrology- Madan Mohan Das, Mim Mohan Das-PHI Learning private Ltd. New Delhi-
2009
3. A Text Book Of Hydrology- Jayarami Reddy, Laksmi Publications, New Delhi-2007 (Ed)
4. Irrigation, Water Resources and water power Engineering- P.N.Modi- standard book house,
New Delhi.
5. Irrigation and Water Power Engineering-Madan Mohan Das & Mimi Das Saikia; PHI
Learning Pvt. Ltd. New Delhi 2009 (Ed).
REFERENCE BOOKS:
1. Hydrology & Soil Conservation Engineering- Ghanshyam Das- PHI Learning Private Ltd.,
New Delhi- 2009 (Ed)
2. Hydrology & Water Resources Engineering- Patra K.C. Narosa Book Distributors Pvt. Ltd.
New Delhi-2008 (Ed)
3. Hydrology & Water Resources Engineering- R.K.Sharma & Sharma, Oxford and IBH, New
Delhi
4. Irrigation Engineering and Hydraulic structures- S. K.Garg- Khanna Publication, New Delhi
HYDROLOGY AND IRRIGATION ENGINEERING 10CV55
Dept of Civil Engg, ACE 3
UNIT-1
INTRODUCTION & PRECIPITATION
The world‘s total water resources are estimated to be around 1.36X 10¹⁴ ha-m. 92.7% of this
water is salty and is stored in oceans and seas. Only 2.8% of total available water is fresh water.
Out of this 2.8% fresh water, 2.2% is available as surface water and 0.6% as ground water. Out
Of the 2.2% surface water, 2.15% is stored in glaciers and ice caps, 0.01% in lakes and streams
and the rest is in circulation among the different components of the Earth‘s atmosphere. Out
of the 0.6% ground water only about 0.25% can be economically extracted. It can be
summarized that less than 0.26% of fresh water is available for use by humans and hence water
has become a very important resource. Water is never stagnant (except in deep aquifers), it
moves from one component to other component of the earth through various process of
precipitation, run off, infiltration, evaporation etc. For a civil engineer, it is important to know
the occurrence, flow, distribution etc. it important to design and construct many structures in
contact with water.
Hydrology
Hydrology may be defined as applied science concerned with water of the Earth in all its states,
their occurrences, distribution and circulation through the unending hydrologic cycle of
precipitation, consequent runoff, stream flow, infiltration and storage, eventual evaporation
and re-precipitation. Hydrology is a highly inter-disciplinary science. It draws many principles
from other branches of science like –
1. Meteorology and Climatology
2. Physical Geography
3. Agronomy and Forestry
4. Geology and Soil science
5. Oceanography
6. Hydraulics
7. Probability and Statistics
8. Ecology
Hydrology concerns itself with three forms of water –
1. Above land as atmospheric water or precipitation.
2. On land or surface as stored water or runoff
3. Below the land surface as ground water or percolation
HYDROLOGY AND IRRIGATION ENGINEERING 10CV55
Dept of Civil Engg, ACE 4
The Importance of Hydrology is seen in-
1. Design of Hydraulic Structures: - Structures such as bridges, causeways, dams, spillways
etc. are in contact with water. Accurate hydrological predictions are necessary for their proper
functioning. Due to a storm, the flow below a bridge has to be properly predicted. Improper
prediction may cause failure of the structure. Similarly the spillway in case of a dam which is
meant for disposing excess water in a dam should also be designed properly otherwise flooding
water may overtop the dam.
2. Municipal and Industrial Water supply: - Growth of towns and cities and also industries
around them is often dependent on fresh water availability in their vicinity. Water should be
drawn from rivers, streams, ground water. Proper estimation of water resources in a place will
help planning and implementation of facilities for municipal (domestic) and industrial water
supply.
3. Irrigation: - Dams are constructed to store water for multiple uses. For estimating maximum
storage capacity seepage, evaporation and other losses should be properly estimated. These
can be done with proper understanding of hydrology of a given river basin and thus making
the irrigation project a successful one. Artificial recharge will also increase ground water
storage. It has been estimated that ground water potential of Gangetic basin is 40 times more
than its surface flow.
4. Hydroelectric Power Generation: - A hydroelectric power plant need continuous water
supply without much variations in the stream flow. Variations will affect the functioning of
turbines in the electric plant. Hence proper estimation of river flow and also flood occurrences
will help to construct efficient balancing reservoirs and these will supply water to turbines at a
constant rate.
5. Flood control in rivers: - Controlling floods in a river is a complicated task. The flow
occurring due to a storm can be predicted if the catchment characteristics are properly known.
In many cases damages due to floods are high. Joint work of hydrologist and meteorologists
in threatening areas may reduce damage due to floods. Flood plain zones maybe demarked to
avoid losses.
6. Navigation: - Big canals in an irrigation scheme can be used for inland navigation. The depth
of water should be maintained at a constant level. This can be achieved by lock gates provided
and proper draft to be maintained. If the river water contains sediments, they will settle in the
channel and cause problems for navigation. Hence the catchment characteristics should be
considered and sediment entry into the canals should be done.
7. Pollution control: - It is an easy way to dispose sewage generated in a city or town into
streams and rivers. If large stream flow is available compared to the sewage discharge,
pollution problems do not arise as sewage gets diluted and flowing water also has self-
purifying capacity. The problem arises when each of the flows are not properly estimated. In
case sewage flow is high it should be treated before disposal into a river or stream.
HYDROLOGY AND IRRIGATION ENGINEERING 10CV55
Dept of Civil Engg, ACE 5
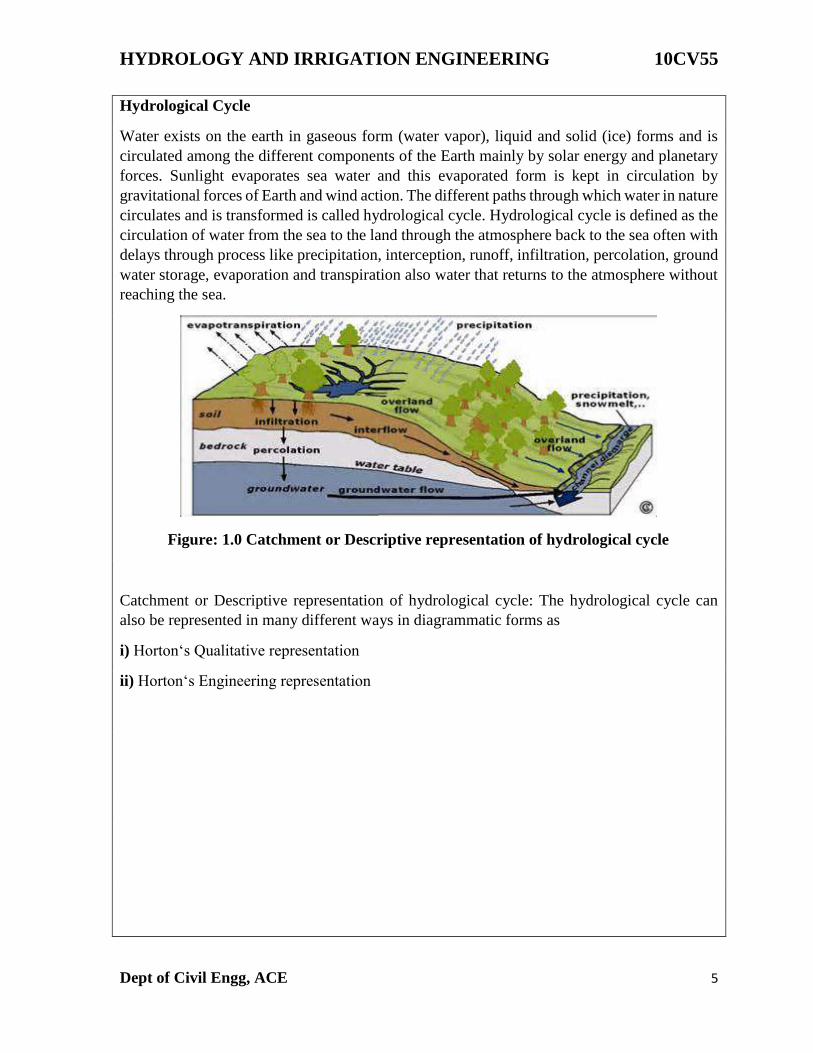
Hydrological Cycle
Water exists on the earth in gaseous form (water vapor), liquid and solid (ice) forms and is
circulated among the different components of the Earth mainly by solar energy and planetary
forces. Sunlight evaporates sea water and this evaporated form is kept in circulation by
gravitational forces of Earth and wind action. The different paths through which water in nature
circulates and is transformed is called hydrological cycle. Hydrological cycle is defined as the
circulation of water from the sea to the land through the atmosphere back to the sea often with
delays through process like precipitation, interception, runoff, infiltration, percolation, ground
water storage, evaporation and transpiration also water that returns to the atmosphere without
reaching the sea.
Figure: 1.0 Catchment or Descriptive representation of hydrological cycle
Catchment or Descriptive representation of hydrological cycle: The hydrological cycle can
also be represented in many different ways in diagrammatic forms as
i) Horton‘s Qualitative representation
ii) Horton‘s Engineering representation

HYDROLOGY AND IRRIGATION ENGINEERING 10CV55
Dept of Civil Engg, ACE 6
Figure: 1.1 Qualitative representation of Horton‘s hydrological Cycle
HYDROLOGY AND IRRIGATION ENGINEERING 10CV55
Dept of Civil Engg, ACE 7
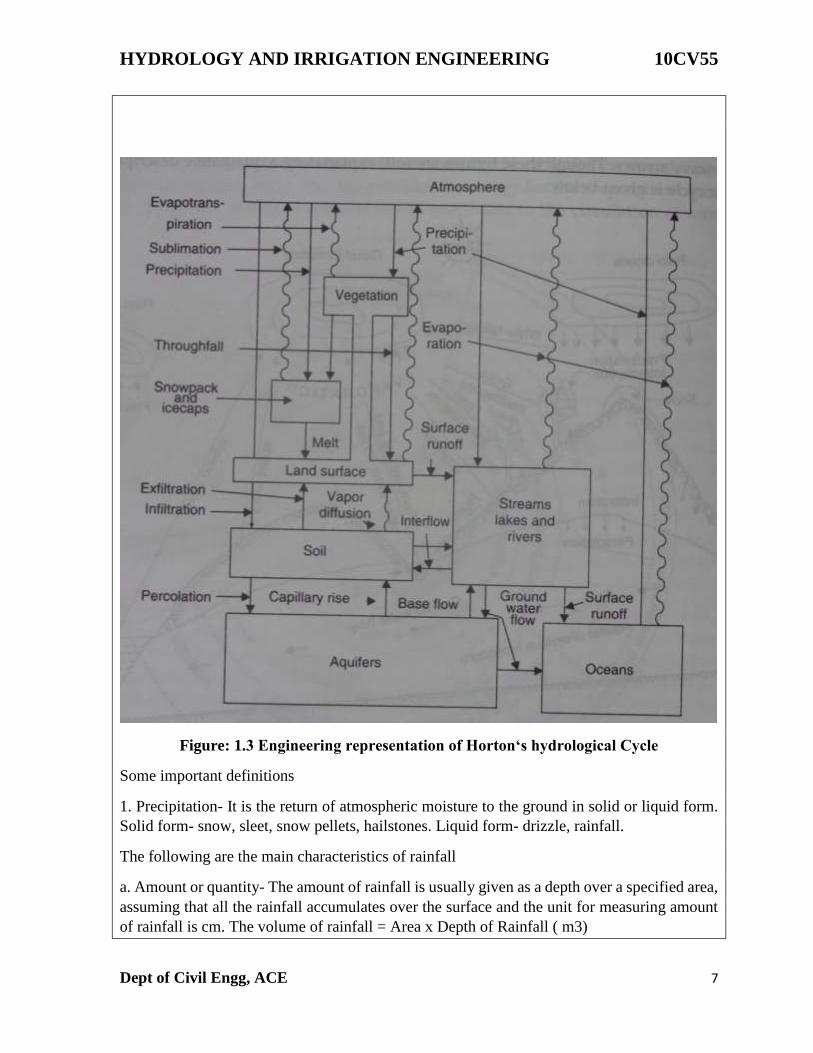
Figure: 1.3 Engineering representation of Horton‘s hydrological Cycle
Some important definitions
1. Precipitation- It is the return of atmospheric moisture to the ground in solid or liquid form.
Solid form- snow, sleet, snow pellets, hailstones. Liquid form- drizzle, rainfall.
The following are the main characteristics of rainfall
a. Amount or quantity- The amount of rainfall is usually given as a depth over a specified area,
assuming that all the rainfall accumulates over the surface and the unit for measuring amount
of rainfall is cm. The volume of rainfall = Area x Depth of Rainfall ( m3)
HYDROLOGY AND IRRIGATION ENGINEERING 10CV55
Dept of Civil Engg, ACE 8
The amount of rainfall occurring is measured with the help of rain gauges.
b. Intensity- This is usually average of rainfall rate of rainfall during the special periods of a
c. Duration of Storm- In the case of a complex storm, we can divide it into a series of storms
of different durations, during which the intensity is more or less uniform.
d. Aerial distribution- During a storm, the rainfall intensity or depth etc. will not be uniform
over the entire area. Hence we must consider the variation over the area i.e. the aerial
distribution of rainfall over which rainfall is uniform.
2. Infiltration- Infiltration is the passage of water across the soil surface. The vertical
downward movement of water within the soil is known as percolation. The infiltration capacity
is the maximum rate of infiltration for the given condition of the soil. Obviously the infiltration
capacity decreases with time during/ after a storm.
3. Overland Flow- This is the part of precipitation which is flowing over the ground surface
and is yet to reach a well-defined stream.
4. Surface runoff- When the overland flow enters a well-defined stream it is known as surface
runoff (SRO).
5. Interflow for Sub surface flow- A part of the precipitation which has in-filtered the ground
surface may flow within the soil but close to the surface. This is known as interflow. When the
interflow enters a well-defined stream, then and only it is called run off.
6. Ground water flow- This is the flow of water in the soil occurring below the ground water
table. The ground water table is at the top level of the saturated zone within the soil and it is at
atmospheric pressure. Hence it is also called phreatic surface. A portion of water may enter a
well-defined stream. Only then it is known as runoff or base flow. Hence we say that runoff is
the portion of precipitation which enters a well-defined stream and has three components;
namely- surface runoff, interflow runoff and ground water runoff or base flow.
7. Evaporation- This is the process by which state of substance (water) is changed from liquid
state to vapor form. Evaporation occurs constantly from water bodies, soil surface and even
from vegetation. In short evaporation occurs when water is exposed to atmosphere (during
sunlight). The rate of evaporation depends on the temperature and humidity.
8. Transpiration – This is the process by which the water extracted by the roots of the plants is
lost to the atmosphere through the surface of leaves and branches by evaporation. Hence it is
also known as evapotranspiration.
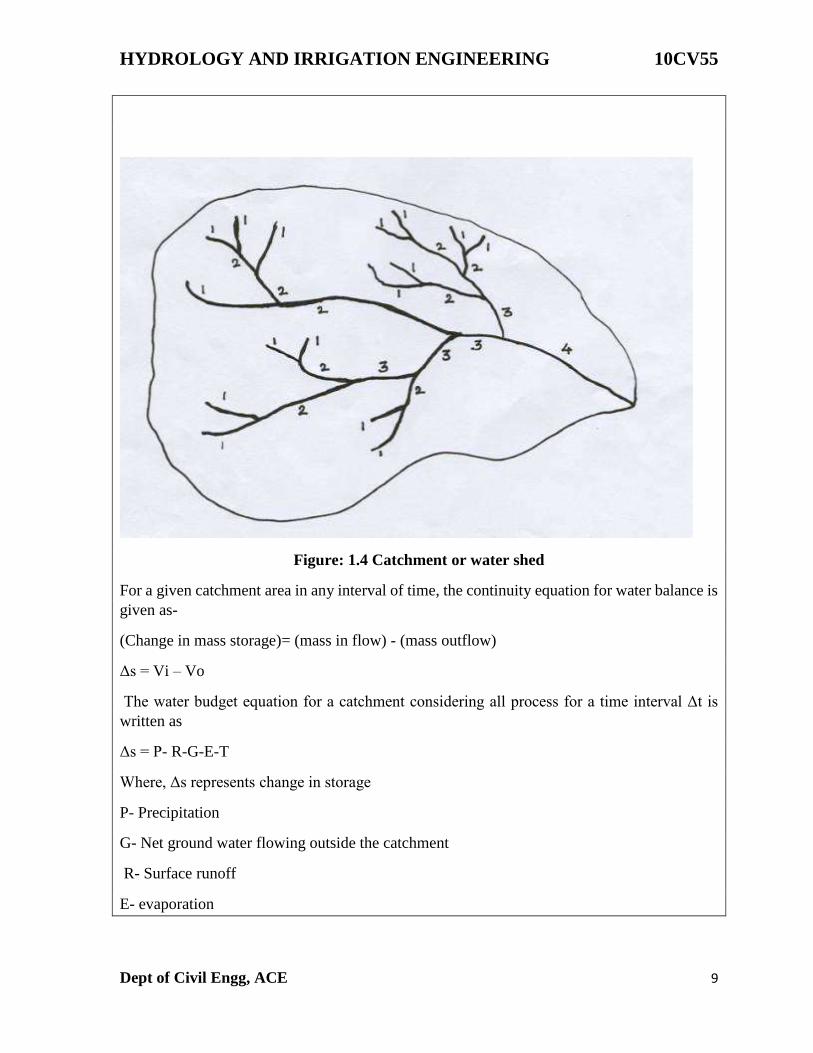
Water budget equation for a catchment
The area of land draining into a stream at a given location is known as catchment area or
drainage area or drainage basin or water shed.
HYDROLOGY AND IRRIGATION ENGINEERING 10CV55
Dept of Civil Engg, ACE 9
Figure: 1.4 Catchment or water shed
For a given catchment area in any interval of time, the continuity equation for water balance is
given as-
(Change in mass storage)= (mass in flow) - (mass outflow)
Δs = Vi – Vo
The water budget equation for a catchment considering all process for a time interval Δt is
written as
Δs = P- R-G-E-T
Where, Δs represents change in storage
P- Precipitation
G- Net ground water flowing outside the catchment
R- Surface runoff
E- evaporation
HYDROLOGY AND IRRIGATION ENGINEERING 10CV55
Dept of Civil Engg, ACE 10
T- transpiration Storage of water in a catchment occurs in 3 different forms and it can be written
as S= Ss +Sm +Sg where S- storage,
Ss- surface water storage, Sm- soil moisture storage Sg- ground water storage
Hence change in storage maybe expressed as ΔS = ΔSs + ΔSm + ΔSg
The rainfall runoff relationship can be written as R= P – L
R- Surface runoff, P- Precipitation, L- Losses i.e. water not available to runoff due to
infiltration, evaporation, transpiration and surface storage. Problems
Precipitation
It is defined as the return of atmospheric moisture to the ground in the form of solids or
liquids.
Forms of Precipitation
1. Drizzle- This is a form of precipitation consisting of water droplets of diameter less than
0.05 cm with intensity less than 0.01cm/ hour.
2. Rainfall- This is a form of precipitation of water drops larger than 0.05cm diameter up to
0.5cm diameter. Water drops of size greater than 0.5 cm diameter tend to break up as they
fall through the atmosphere. Intensity varies from 0.25 cm/ hour to 0.75cm/ hour.
3. Glaze- This is the ice coating formed when a drizzle or rainfall comes in contact with very
old objects on the ground
4. Sleet- This occurs when rain drops fall through air which is below 00c. The grains are
transparent, round with diameter between 0.1 cm to 0.4 cm.
5. Snow Pellets- These are white opaque round grains of ice. They are crystalline and
rebound when falling onto the ground. The diameter varies from 0.05cm to 0.5cm.
6. Snow- This is precipitation in the form of ice crystals, usually a no. of ice crystals
combining to form snowflakes.
7. Hails- These are balls or irregular lumps of ice of over 0.5cm diameter formed by repeated
freezing and melting. These are formed by upward and downward movement of air masses in
turbulent air currents.
Necessary conditions for occurrence of Precipitation
For precipitation to occur, moisture (water vapor) is always necessary to be present. Moisture
is present due to the process of evaporation. There must also be some mechanism for large
scale lifting of moist, warm air so that there will be sufficient cooling. This will cause
condensation (conversion of vapors) to liquid and growth of water drops.
HYDROLOGY AND IRRIGATION ENGINEERING 10CV55
Dept of Civil Engg, ACE 11
Condensation nuclei such as the oxides of nitrogen, salt crystals, carbon dioxide, silica etc.
must be present such that water vapor condenses around them. The conditions of electric
charge in the cloud, size of water droplets or ice crystals, temperature and relative movement
of clouds must be favorable so that the size of the condensed water drop increases and
ultimately they begin to fall to the ground due to gravity. A drop of size 0.5mm can fall
through 2000m in unsaturated air.
Types of Precipitation
One of the essential requirements for precipitation to occur is the cooling of large masses of
moist air. Lifting of air masses to higher altitudes is the only large scale process of cooling.
Hence the types of precipitation based on the mechanism which causes lifting of air masses
are as follows-
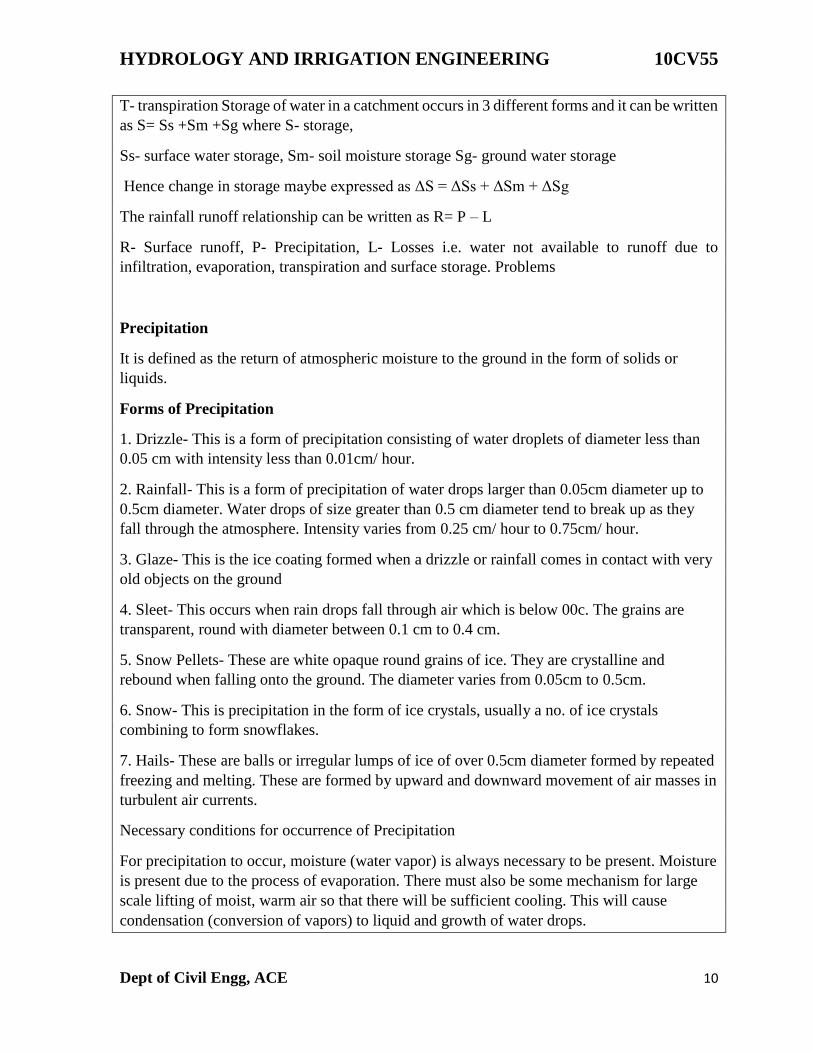
1. Cyclonic Precipitation- This is the precipitation associated with cyclones or moving
masses of air and involves the presence of low pressures. This is further sub divided into 2
categories-
a. Non Frontal cyclonic precipitation- In this, a low pressure area develops. (Low-pressure
area is a region where the atmospheric pressure is lower than that of surrounding locations.)
The air from surroundings converges laterally towards the low pressure area. This results in
lifting of air and hence cooling. It may result in precipitation.
b. Frontal cyclonic precipitation- FRONT is a barrier region between two air masses having
different temperature, densities, moisture, content etc. If a warm and moist air mass moves
upwards over a mass of cold and heavier air mass, the warm air gets lifted, cooled and may
result in precipitation. Such a precipitation is known as warm front precipitation.
Figure: 1.5 Cyclonic Precipitation
HYDROLOGY AND IRRIGATION ENGINEERING 10CV55
Dept of Civil Engg, ACE 12
The precipitation may extend for 500km ahead of the front i.e. the colder air region. If a moving
mass of cold air forces a warm air mass upwards, we can expect a cold Front precipitation. The
precipitation may extend up to 200kms ahead of the Front surface in the warm air.
2. Convective precipitation- This is due to the lifting of warm air which is lighter than the
surroundings. Generally this type of precipitation occurs in the tropics where on a hot day, the
ground surface gets heated unequally causing the warmer air to lift up and precipitation occurs
in the form of high intensity and short duration.
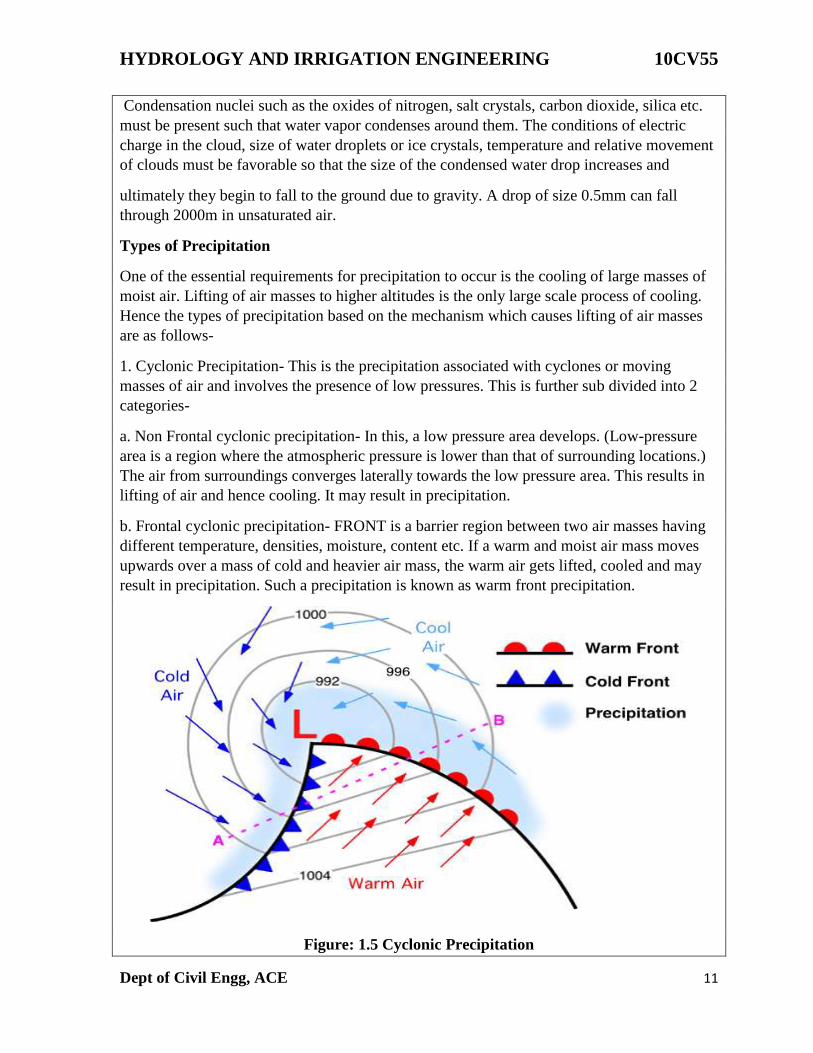
3. Orographic Precipitation- It is the most important precipitation and is responsible for most
of heavy rains in India. Orographic precipitation is caused by air masses which strike some
natural topographic barriers like mountains and cannot move forward and hence the rising
amount of precipitation. The greatest amount of precipitation falls on the windward side and
leeward side has very little precipitation.
Figure: 1.6 Orographic Precipitation
4. Turbulent Precipitation- This precipitation is usually due to a combination of the several of
the above cooling mechanisms. The change in frictional resistance as warm and moist air
moves from the ocean onto the land surface may cause lifting of air masses and hence
precipitation due to cooling. This precipitation results in heavy rainfall.
Rain gauging (Measurement of Rainfall): Rainfall is measured on the basis of the vertical
depth of water accumulated on a level surface during an interval of time, if all the rainfall
remained where it fell. It is measured in ‗mm‘. The instrument used for measurement of
rainfall is called ―Rain gauge‖.
These are classified as
a. Non recording types
HYDROLOGY AND IRRIGATION ENGINEERING 10CV55
Dept of Civil Engg, ACE 13
b. Recording types.
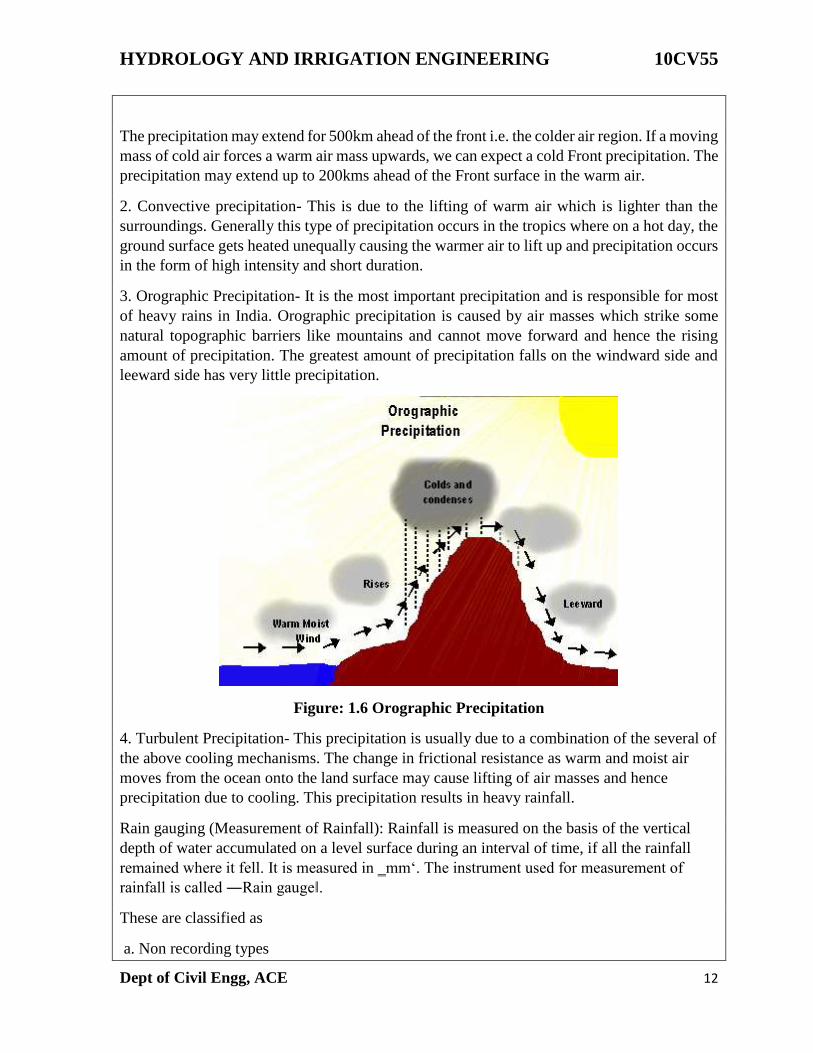
a. Non recording type Raingauges: These rain gauges which do not record the depth of
rainfall, but only collect rainfall. Symon‘s rain gauge is the usual non recording type of rain
gauge. It gives the total rainfall that has occurred at a particular period. It essentially consists
of a circular collecting area 127 mm in diameter connected to a funnel. The funnel discharges
the rainfall into a receiving vessel. The funnel and the receiving vessel are housed in a
metallic container. The components of this rain gauge are a shown in figure below.
Figure: 1.7 Non recording type Raingauges
The water collected in the receiving bottle is measured by a graduated measuring jar with an
accuracy of 0.1 ml. the rainfall is measured every day at 8:30 am IST and hence this rain gauge
gives only depth of rainfall for previous 24 hours. During heavy rains, measurement is done 3
to 4 times a day. b. Recording type Raingauges : These are rain gauges which can give a
permanent, automatic rainfall record (without any bottle recording) in the form of a pen
mounted on a clock driven chart. From the chart intensity or rate of rainfall in cm per hour or
6 hrs, 12 hrs….., besides the total amount of rainfall can be obtained.
Advantages of recording rain gauges:
1. Necessity of an attendant does not arise
2. Intensity of rainfall at anytime as well as total rainfall is obtained, where as non recording
gauge gives only total rainfall.
3. Data from in accessible places (hilly regions) can be continuously obtained once gauge is
established.
HYDROLOGY AND IRRIGATION ENGINEERING 10CV55
Dept of Civil Engg, ACE 14
4. Human errors are eliminated.
5. Capacity of gauges is large.
6. Time intervals are also recorded.
Disadvantages of recording rain gauges:
1. High initial investment cost.
2. Recording is not reliable when faults in gauge arise (mechanical or electrical) till faults are
corrected.
Types of recording or automatic rain gauges:
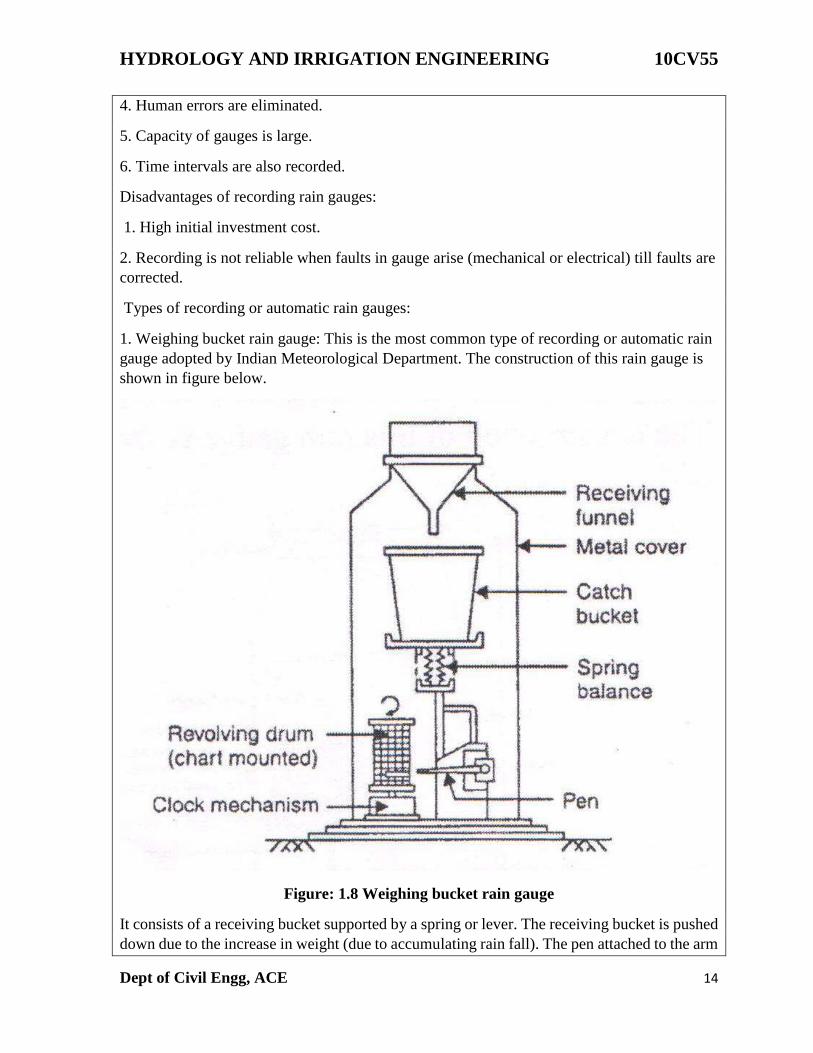
1. Weighing bucket rain gauge: This is the most common type of recording or automatic rain
gauge adopted by Indian Meteorological Department. The construction of this rain gauge is
shown in figure below.
Figure: 1.8 Weighing bucket rain gauge
It consists of a receiving bucket supported by a spring or lever. The receiving bucket is pushed
down due to the increase in weight (due to accumulating rain fall). The pen attached to the arm

HYDROLOGY AND IRRIGATION ENGINEERING 10CV55
Dept of Civil Engg, ACE 15
continuously records the weight on a clock driven chart. The chart obtained from this rain
gauge is a mass curve of rain fall.
Figure: 1.8 Mass curve of rainfall
From the mass curve the average intensity of rainfall (cm/hr) can be obtained by calculating
the slope of the curve at any instant of time. The patterns as well as total depth of rain fall at
different instants can also be obtained.
2. Tipping bucket rain gauge: This is the most common type of automatic rain gauge adopted
by U S Meteorological Department.
Figure: 1.9 Tipping bucket rain gauge
HYDROLOGY AND IRRIGATION ENGINEERING 10CV55
Dept of Civil Engg, ACE 16
This consists of receiver draining into a funnel of 30 cm diameter. The catch (rainfall) from
funnel falls into one of the pair of small buckets (tipping buckets). These buckets are so
balanced that when 0.25 mm of rainfall collects in one bucket, it tips and brings the other
bucket into position. The tipping of the bucket is transmitted to an electricity driven pen or to
an electronic counter. This is useful in remote areas.
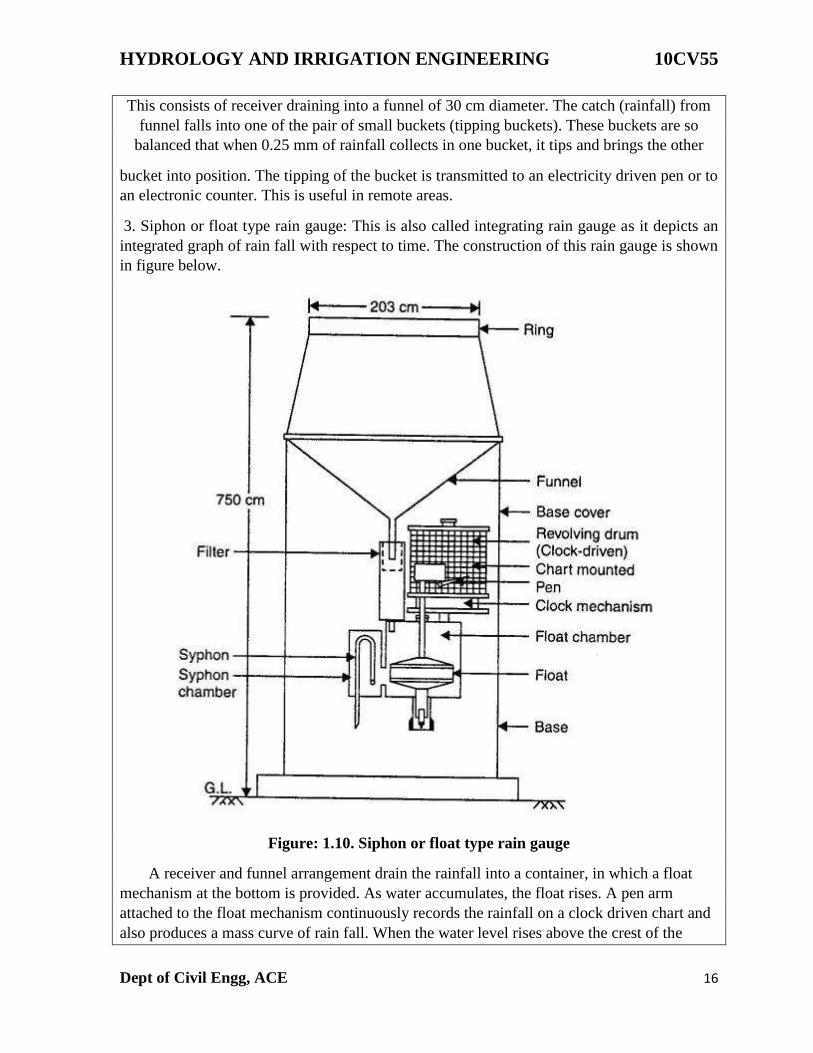
3. Siphon or float type rain gauge: This is also called integrating rain gauge as it depicts an
integrated graph of rain fall with respect to time. The construction of this rain gauge is shown
in figure below.
Figure: 1.10. Siphon or float type rain gauge
A receiver and funnel arrangement drain the rainfall into a container, in which a float
mechanism at the bottom is provided. As water accumulates, the float rises. A pen arm
attached to the float mechanism continuously records the rainfall on a clock driven chart and
also produces a mass curve of rain fall. When the water level rises above the crest of the
HYDROLOGY AND IRRIGATION ENGINEERING 10CV55
Dept of Civil Engg, ACE 17
siphon, the accumulated water in the container will be drained off by siphonic action. The
rain gauge is ready to receive the new rainfall.
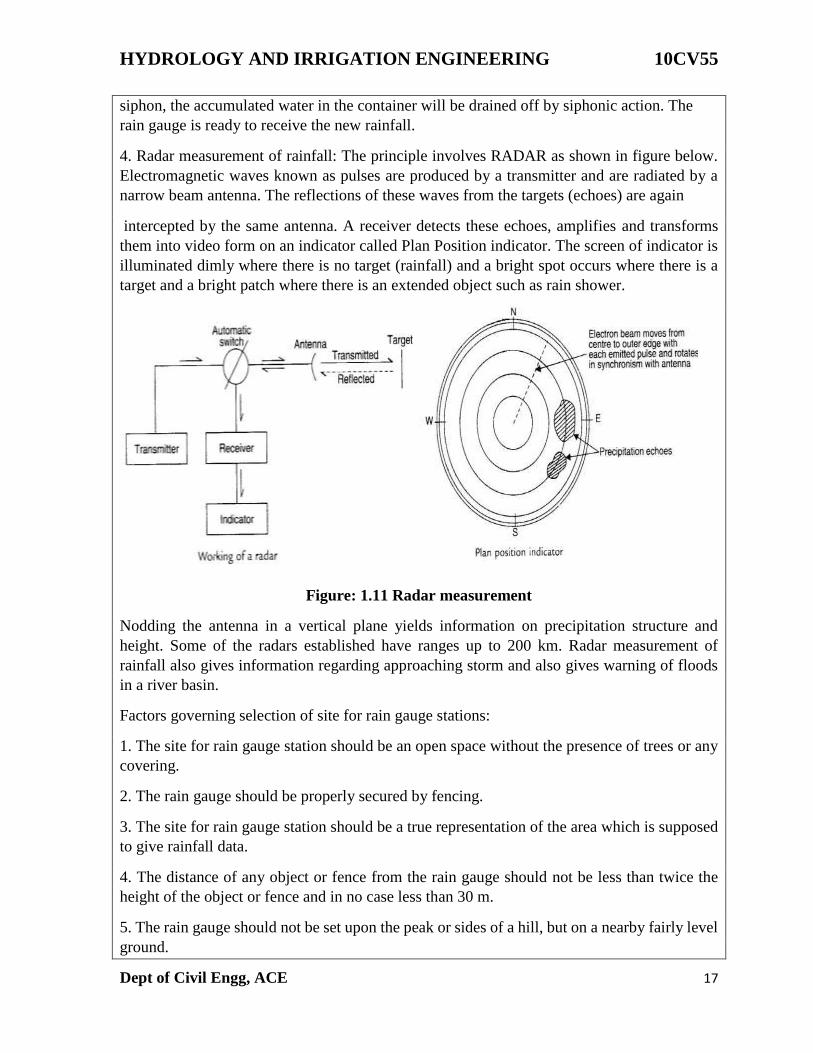
4. Radar measurement of rainfall: The principle involves RADAR as shown in figure below.
Electromagnetic waves known as pulses are produced by a transmitter and are radiated by a
narrow beam antenna. The reflections of these waves from the targets (echoes) are again
intercepted by the same antenna. A receiver detects these echoes, amplifies and transforms
them into video form on an indicator called Plan Position indicator. The screen of indicator is
illuminated dimly where there is no target (rainfall) and a bright spot occurs where there is a
target and a bright patch where there is an extended object such as rain shower.
Figure: 1.11 Radar measurement
Nodding the antenna in a vertical plane yields information on precipitation structure and
height. Some of the radars established have ranges up to 200 km. Radar measurement of
rainfall also gives information regarding approaching storm and also gives warning of floods
in a river basin.
Factors governing selection of site for rain gauge stations:
1. The site for rain gauge station should be an open space without the presence of trees or any
covering.
2. The rain gauge should be properly secured by fencing.
3. The site for rain gauge station should be a true representation of the area which is supposed
to give rainfall data.
4. The distance of any object or fence from the rain gauge should not be less than twice the
height of the object or fence and in no case less than 30 m.
5. The rain gauge should not be set upon the peak or sides of a hill, but on a nearby fairly level
ground.
HYDROLOGY AND IRRIGATION ENGINEERING 10CV55
Dept of Civil Engg, ACE 18
6. The rain gauge should be protected from high winds.
7. The rain gauge should be easily accessible to the observers at all times.
Point rainfall: It is the total liquid form of precipitation or condensation from the atmosphere
as received and measured in a rain gauge. It is expressed as so many ‗mm‘ of depth of water.
Rain gauge Density: The catchment area of a rain gauge is very small compared to the areal
extent of a storm. It becomes obvious that to get a representative picture of a storm over a
catchment, the number of rain gauges should be as many as possible. On the other hand
topographic conditions and accessibility restrict the number of rain gauges to be set up. Hence
one aims at optimum number of rain gauges from which accurate information can be obtained.
From practical considerations IMD as per IS 4987 has recommended the following rain gauge
densities depending upon the type of area.
a. Plain areas – 1 station per 520 km2
b. Areas with 1000 m average elevation - 1 station per 260 to 350 km2
c. Predominantly hilly areas with heavy rainfall - 1 station per 130 km2
Determination of average precipitation over an area: The rainfall measured by a rain gauge is
called point precipitation because it represents the rainfall pattern over a small area surrounding
the rain gauge station. However in nature rain fall pattern varies widely. The average
precipitation over an area can be obtained only if several rain gauges are evenly distributed
over the area. But there is always limitation to establish several rain gauges. However this draw
back can be overcome by adopting certain methods as mentioned below, which give fair
results.
a. Arithmetic mean method: In this method to determine the average precipitation over an
area the rainfall data of all available stations are added and divided by the number of stations
to give an arithmetic mean for the area. That is if P1, P2 and P3 are the precipitations
recorded at three stations A, B and C respectively, then average precipitation over the area
covered by the rain gauges is given by gauges is given by
𝑃𝑎𝑣 =𝑃1 + 𝑃2 + 𝑃3
3
This method can be used if the area is reasonably flat and individual gauge readings do not
deviate from the mean (average). This method does not consider aerial variation of rainfall,
non-even distribution of gauges, Orographic influences (presence of hills), etc. This method
can also be used to determine the missing rain fall reading from any station also in the given
area.
b. Thiessen Polygon method: This is also known as weighted mean method. This method is
very accurate for catchments having areas from 500 to 5000 km2. In this method rainfall
HYDROLOGY AND IRRIGATION ENGINEERING 10CV55
Dept of Civil Engg, ACE 19
recorded at each station is given a weight age on the basis of the area enclosing the area. The
procedure adopted is as follows
1. The rain gauge station positions are marked on the catchment plan.
2. Each of these station positions are joined by straight lines.
3. Perpendicular bisectors to the previous lines are drawn and extended up to the boundary of
the catchment to form a polygon around each station.
4. Using a planimeter, the area enclosed by each polygon is measured.
5. The average precipitation over an area is given as
𝑃𝑎𝑣 =𝑃1𝐴1 + 𝑃2𝐴2 + 𝑃3𝐴3 + ⋯ + 𝑃𝑛𝐴𝑛
𝐴1 + 𝐴2 + 𝐴3 + ⋯ + 𝐴𝑛
where P1 , P2, P3 , … … Pn are rainfall amounts obtained from 1 to n rain gauge stations
respectively
A1, A2, A3, … … An are areas of polygons surrounding each station.
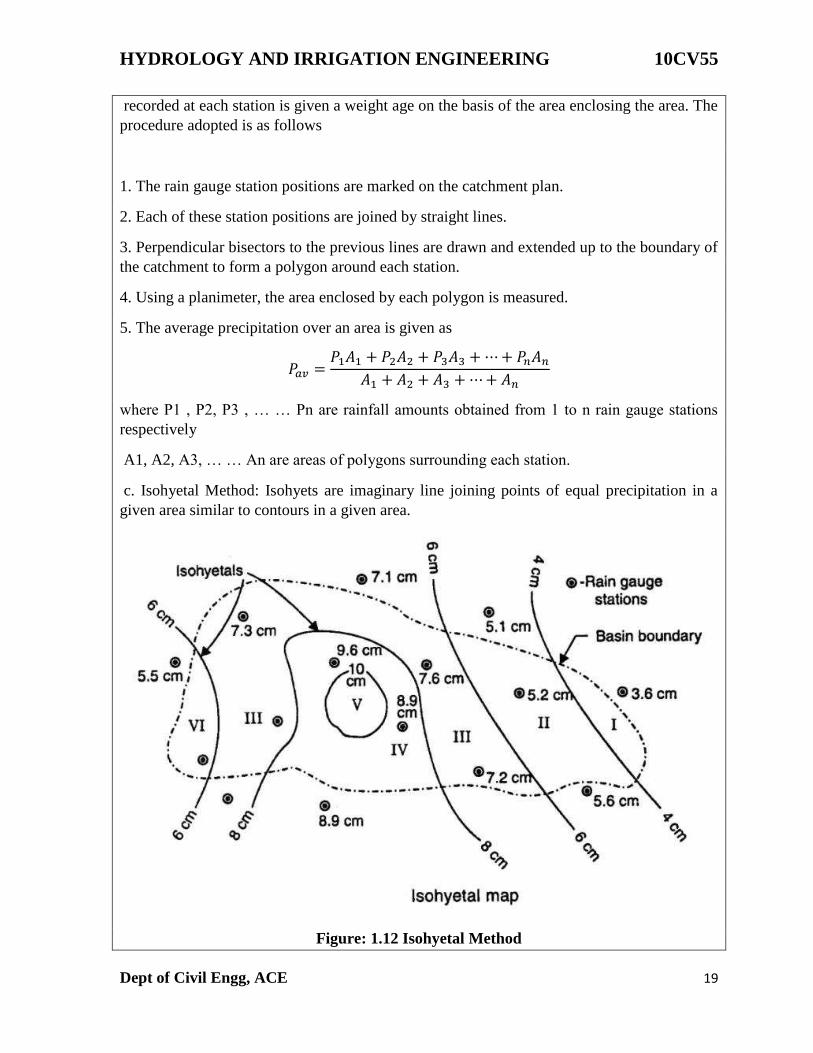
c. Isohyetal Method: Isohyets are imaginary line joining points of equal precipitation in a
given area similar to contours in a given area.
Figure: 1.12 Isohyetal Method
HYDROLOGY AND IRRIGATION ENGINEERING 10CV55
Dept of Civil Engg, ACE 20
In Isohyetal Method for determining the average precipitation over an area, Isohyets of
different values are sketched in a manner similar to contours in surveying in a given area.
The mean (average) of two adjacent Isohyetal values is assumed to be the precipitation over
the area lying between the two isohyets. To get the average precipitation over an area the
procedure to be followed is
i. Each area between the isohyets is multiplied with the corresponding mean Isohyetal value
(precipitation).
ii. All such products are summed up.
iii. The sum obtained from above is divided by the total area of the catchment (gauging area).
iv. The quotient obtained from above represents average precipitation over gauging area.
OPTIMUM NUMBER OF RAIN GAUGE STATIONS If there are already some raingauge
stations in a catchment, the optimal number of stations that should exist to have an assigned
percentage of error in the estimation of mean rainfall is obtained by statistical analysis as
N=(Cv/ε) 2 -------------(2.3)
where N= optimal number of stations, £= allowable degree of error in the estimate of he
mean rainfall and Cv = coefficient of variation of the rainfall values at the existing n stations
(in percent).
If there are m stations in the catchment each recording rainfall values P1, P2…….Pp... Pm in
a known time, the coefficient of variation Cv is calculated as:
Cv= 100xσm-1/ P σm-1 = √ Σ(Pi−P)2 m−1
Pi= Precipitation magnitude in the ith station
P= 1/m (ΣPi)= Mean precipitation.
calculating N from Eq. (2.3) it is usual to take ε = 10%. It is seen that if the value of ε is
small, the number of rain gauge stations will be more.
According to WMO recommendations, at least 10% of the total raingauges should be of self-
recording type.
Estimation of missing precipitation record.
A sufficiently long precipitation record is required for frequency analysis of rainfall data. But
a particular rain gauge may not be operative for sometime due to many reasons it becomes
necessary to estimate missing record & fill the gap rather than to leave it empty. This is done
by the following method.
1. Interpolation from isohyetal map
HYDROLOGY AND IRRIGATION ENGINEERING 10CV55
Dept of Civil Engg, ACE 21
In a isohytal map of the area the passion of the station (rain gauge) where record is missing is
marked by interpolation techniques the missing record is worked out the factors like storm
factor, topography nearness to sea are considered for proper estimation.
2. Arithmetic average method.
Here number of other rain gauge station record surrounding station in question (missing
record) are required.
The missing rainfall record at the station is taken as average o fall available data surrounding
station in question. P1, P2, P3-------- etc Pn are rainfall record from ―n‖ station surrounding
a non operative station ‗x‖ the rainfall data for station ― x‖ is given as
Px= (P1+ P2+ P3------+ Pn) / N
This method is applicable when normal annual rainfall at station ―x‖ does not differ by more
than 10% with the surrounding station.
3. Normal ratio method.
This method is applicable when normal annual rainfall at required station differ more than
10% of annual rainfall at surrounding station.
Let P1, P2, P3-------- Pn be rainfall record at ―n‖ station during a particular storm
surrounding station ― “x”( with missing record)
Let N1, N2 -------- Nn be annual normal rainfall for ―n‖ station Nx be annual rainfall for
station ―”x”
Then the rainfall at station ―x‖ during a given storm is calculated as
Px = 1/n (Nx/N1 P1+ Nx/N2 P2---- + Nx/ Nx Pn)
Px= Nx/n Σ Pi/ Ni , i=1 to n
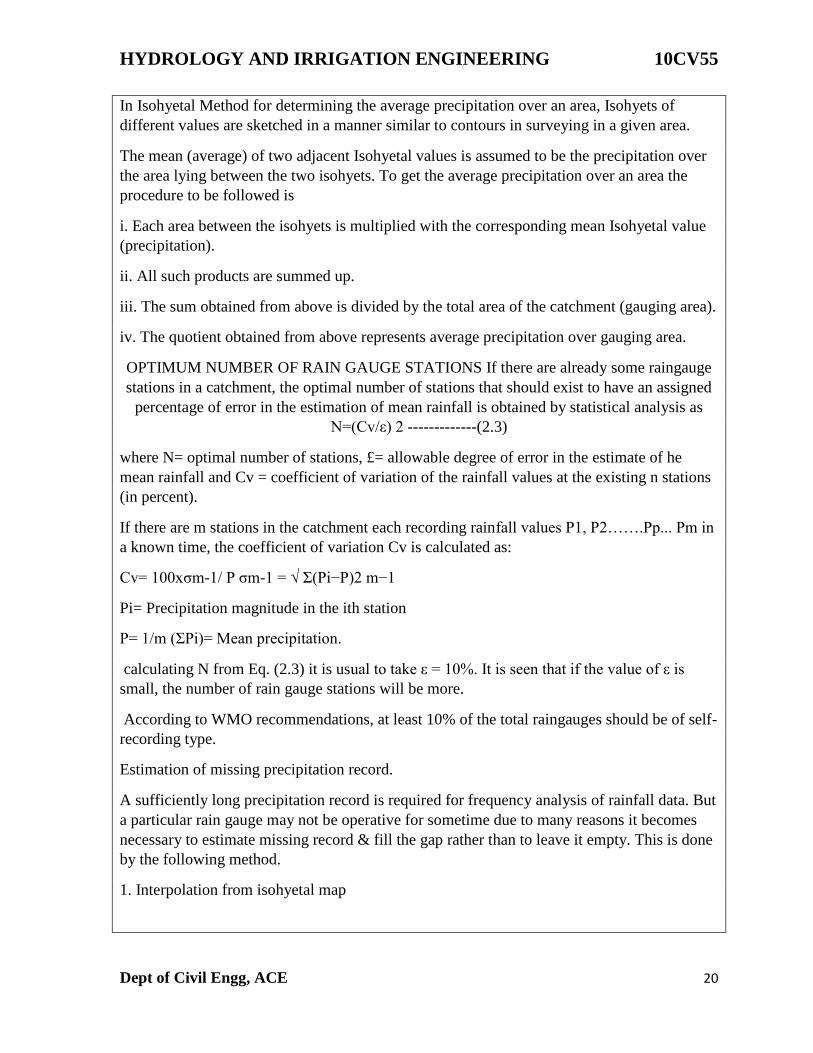
The Mass Curve of Rainfall
The mass curve of rainfall is a plot of the accumulated precipitation against time, plotted in
chronological order. Records of float type and weighing bucket type gauges are of this form.
A typical mass curve of rainfall at a station during a storm is shown in figure below. Mass
curve of rainfall are very useful in extracting the information on the duration and magnitude
of a storm. Also, intensities at various time interval s in a storm can be obtained by the slope
of the curve. For nonrecording rain gauges, mass curves are prepared from knowledge of the
approximate beginning and end of a storm and by using the mass curve of adjacent recording
gauge stations as a guide.
HYDROLOGY AND IRRIGATION ENGINEERING 10CV55
Dept of Civil Engg, ACE 22
Figure: 1.13 Mass Curve of Rainfall
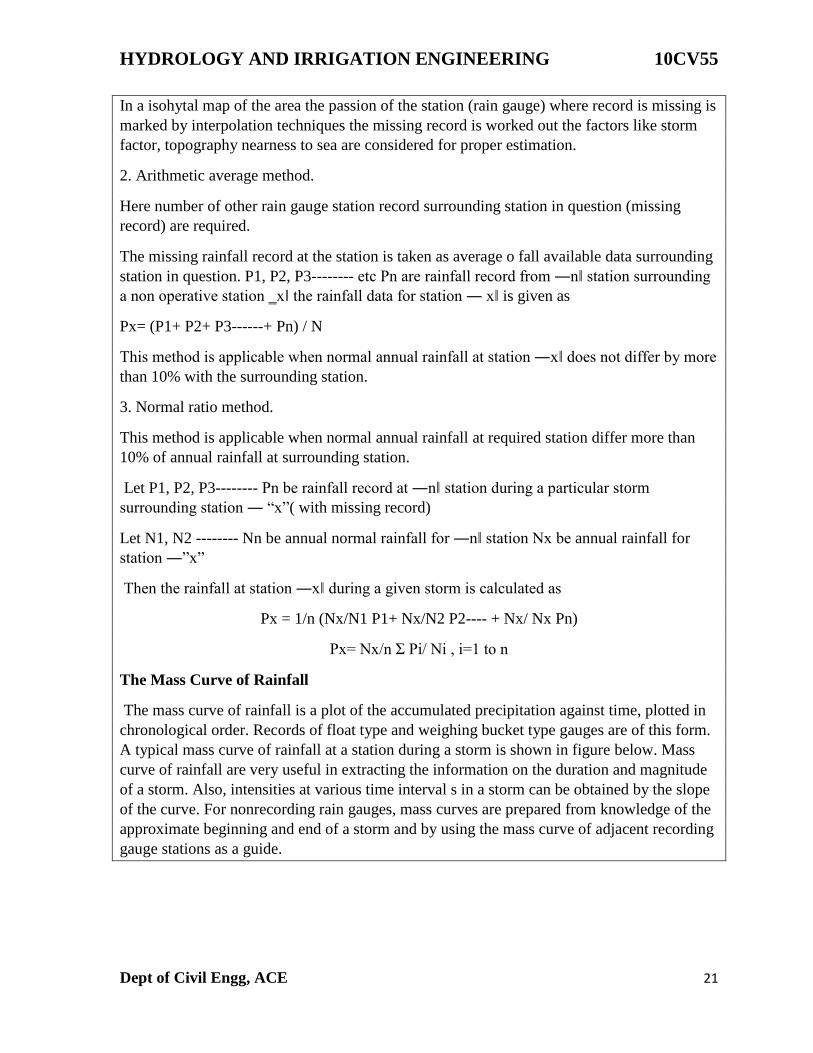
Hyetograph
A hyetograph is a plot of the intensity of rainfall against the time interval. The hyetograph is
derived from the mass curve and is usually represented as a bar chart. It is very convenient
way of representing the characteristics of a storm and is particularly important in the
development of design storms to predict extreme floods. The area under a hyetograph
represents the total precipitation received in the period. The time interval used depends on
the purpose, in urban drainage problems small durations are used while flood flow
computations in larger catchments the intervals are about 6h.
Figure: 1.13 Hyetograph
HYDROLOGY AND IRRIGATION ENGINEERING 10CV55
Dept of Civil Engg, ACE 23
UNIT -2
LOSSES FROM PRECIPITATION
The hydrological equation states that ‗Runoff = Rainfall – Losses‘. Hence the runoff from a
watershed resulting due to a storm is dependent on the losses. Losses may occur due to the
following reasons
1. Evaporation
2. Evapotranspiration
3. Infiltration
4. Interception
5. Watershed leakage
The first three contribute to the major amount of losses.
EVAPORATION :It is the process by which a liquid changes to gaseous state at the free
surface through transfer of heat energy. In an exposed water body like lakes or ponds, water
molecules are in continuous motion with arrange of velocities (faster at the top and slower at
the bottom). Additional heat on water body increases the velocities. When some water
molecules posses‘sufficient kinetic energy they may cross over the water surface.
Simultaneously the water molecules in atmosphere surrounding the water body may penetrate
the water body due to condensation. If the number of molecules leaving the water body is
greater than the number of molecules arriving or returning, difference in vapour pressure
occurs, leading to evaporation.
Factors affecting Evaporation
1. Vapour pressure difference: The number of molecules leaving or entering a water body
depends on the vapour pressure of water body at the surface and also the vapour pressure of
air. Higher water temperature leads to high vapour pressure at surface and tends to increase the
rate of evaporation. High humidity in air tends to increase vapour pressure in air and in turn
reduces rate of evaporation.
2. Temperature of air and water: The rate of emission of molecules from a water body is a
function of its temperature. At higher temperature molecules of water have greater energy to
escape. Hence maximum evaporation from water bodies takes place in summer. It has been
estimated that for every 1o C rise in atmospheric temperature increases 5 cm of evaporation
annually.
3. Wind Velocity: When wind velocity is more the saturated air (humid air) is drifted away and
dry air comes in contact with water surface which is ready to absorb moisture. Hence rate of
evaporation is dependent on wind velocity. It has been estimated that 10% increase in wind
velocity increases 2 – 3% of evaporation.
HYDROLOGY AND IRRIGATION ENGINEERING 10CV55
Dept of Civil Engg, ACE 24
4. Quality of water: The rate of evaporation of fresh water is greater than saline water. (Specific
gravity of saline water is greater than that of fresh water. It is established that saline water has
lesser vapour pressure and it is observed that evaporation from fresh water is 3 – 4% more than
sea water.
5. Atmospheric pressure and Altitude: Evaporation decreases with increase in atmospheric
pressure as the rate of diffusion from water body into the air is suppressed. At higher altitude
the atmospheric pressure is usually lesser and there by evaporation rate is higher.
6. Depth of water body: Evaporation shallow water bodies is greater when compared to deep
water bodies as the water at lower levels in deep water bodies is not heated much and vapour
pressure at lower levels is also reduced.
DALTON‘S LAW OF EVAPORATION
The rate of evaporation is function of the difference in vapour pressure at the water surface
and the atmosphere.
Dalton‘s law of evaporation states that ―Evaporation is proportional to the difference in
vapour pressures of water and air.
i e E α (ew – ea) or E = k (ew – ea)
Where E = daily evaporation
ew = saturated vapour pressure of water at a given temperature
ea = vapour pressure of air
k = proportionality constant
Considering the effect of wind Dalton‘s Law is expressed as E = kl (ew – ea) (a+b V)
where V = wind velocity in km/hour
kl , a & b are constants for a given area.
Measurement of Evaporation
In order to ensure proper planning and operation of reservoirs and irrigation systems estimation
of evaporation is necessary. However exact measurement of evaporation is not possible. But
the following methods are adopted as they give reliable results.
1. Pan measurement methods
2. Use of empirical formulae
HYDROLOGY AND IRRIGATION ENGINEERING 10CV55
Dept of Civil Engg, ACE 25
3. Storage equation method
4. Energy budget method
Pan measurement method: Any galvanized iron cylindrical vessel of 1.2 m to 1.8 m diameter,
300 mm depth with opening at the top can be used as an evaporimeter or evaporation pan.
During any interval of time evaporation is measured as the drop in water level in the pan.
Rainfall data, atmospheric pressure data, temperature, etc should also be recorded. It has been
correlated that evaporation from a pan is not exactly the same as that taking place from a water
body. Hence while using a pan measurement data for measuring evaporation from a lake or a
water body, a correction factor has to be applied or multiplied by a pan co-efficient.
𝑃𝑎𝑛 𝑐𝑜𝑒𝑓𝑓𝑖𝑐𝑖𝑒𝑛𝑡 =𝑎𝑐𝑡𝑢𝑎𝑙 𝑒𝑣𝑎𝑝𝑜𝑟𝑎𝑡𝑖𝑜𝑛 𝑓𝑟𝑜𝑚 𝑟𝑒𝑠𝑒𝑟𝑣𝑜𝑖
𝑚𝑒𝑎𝑠𝑢𝑟𝑒𝑑 𝑒𝑣𝑎𝑝𝑜𝑟𝑎𝑡𝑖𝑜𝑛 𝑓𝑟𝑜𝑚 𝑝𝑎𝑛
The evaporation pans adopted in practice have a pan coefficient of 0.7 to 0.8. The popularly
used evaporation pans are
1. ISI standard pan or Class A pan
2. U S Class A pan
3. Colorado sunken pan
4. U S Geological Survey floating pan
ISI standard pan or Class A pan:
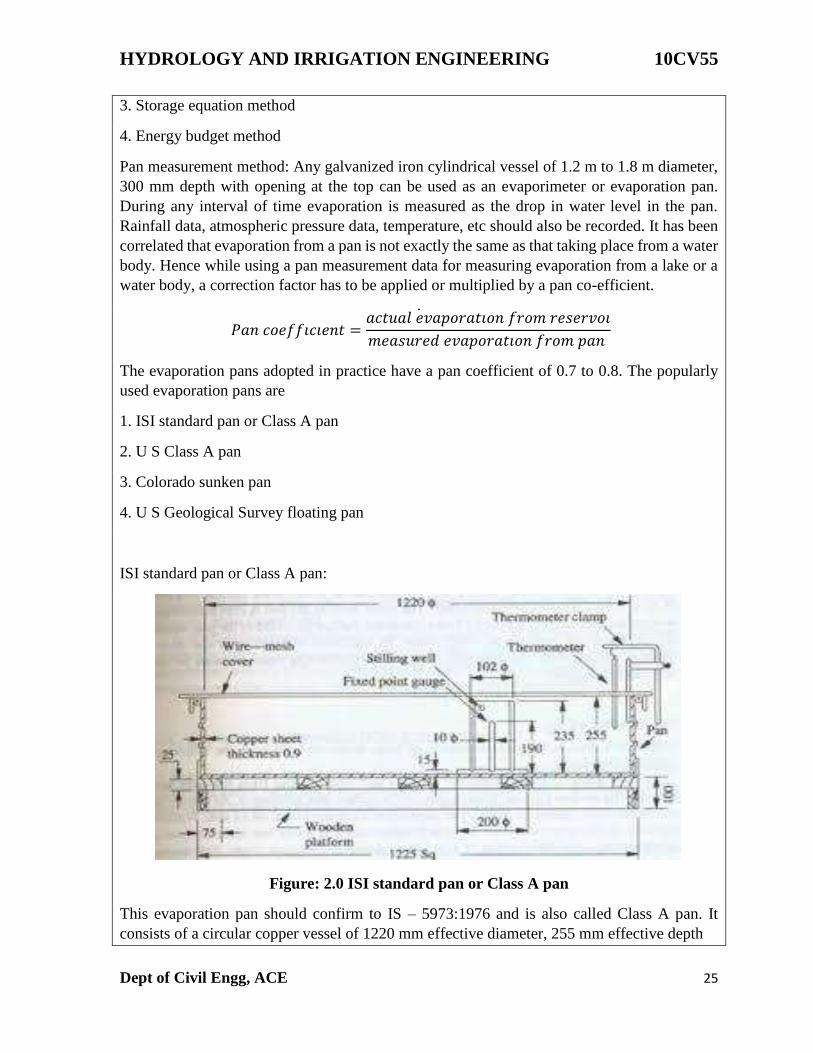
Figure: 2.0 ISI standard pan or Class A pan
This evaporation pan should confirm to IS – 5973:1976 and is also called Class A pan. It
consists of a circular copper vessel of 1220 mm effective diameter, 255 mm effective depth
HYDROLOGY AND IRRIGATION ENGINEERING 10CV55
Dept of Civil Engg, ACE 26
and a wall thickness of 0.9 mm. A thermometer is assembled to record the variation in
temperature. A wire mesh cover with hexagonal openings is provided at the top to prevent
entry of foreign matter. A fixed gauge housed in a stilling well as shown in figure is provided.
During evaporation measurement a constant water level is maintained at the top level of fixed
gauge. For this purpose water has to be added or removed periodically. The water level
measurements are done using micrometer hook gauge. The entire assembly is mounted on a
level wooden platform.
Use of empirical formulae: Based on Dalton‘s law of evaporation, various formulae have been
suggested to estimate evaporation.
a) Meyer‘s formula: It states that
𝐸 = 𝐾𝑚 (𝑒𝑠−𝑒𝑎)[1 +
𝑉9
16 ]
Where E= evaporation from water body (mm/day)
es= saturation vapour pressure at water surface (mm of mercury)
ea = vapour pressure of overlying air measured at a height of 9 m above free water surface (mm
of mercury)
V9 = mean monthly wind velocity measured at a height of 9 m above free water surface (km/hr)
Km= a constant (0.36 for large deep water bodies, 0.5 for small shallow water bodies)
b) Rohwer‘s formula: It states that
E=0.771(1.465-0.00073Pa)(0.44+0.0733V0.6)(es-ea)
E, es and ea have the same meaning as above.
Pa = atmospheric pressure (mm of mercury)
V0.6= mean wind velocity measured at a height of 0.6 m above free water surface (km/hr)
Methods to control evaporation from lakes:
Following are some recommended measures to reduce evaporation from water surfaces.
1. Storage reservoirs should have more depth and less surface area. The site for construction
of a dam should be so chosen that a deep reservoir with minimum surface area exposed to
atmosphere is formed.
2. Tall trees on the wind ward side of the reservoir should be planted so that they act as wind
breakers
HYDROLOGY AND IRRIGATION ENGINEERING 10CV55
Dept of Civil Engg, ACE 27
3. By spraying a chemical such as Acetyl Alcohol on water surface, a film of 0.15 microns
thickness is produced on the surface. This film allows precipitation in but does not allow
evaporation. This is suitable when wind velocities are less and for small and medium sized
reservoirs.
4. In case of ponds and lakes entire water body can be covered by thin polythene sheets as
mechanical covering.
5. In reservoirs outlet arrangements should be so done to let out warmer water at top than cold
water from bottom.
6. De-weeding the reservoirs should be done such that water consumed by weeds is reduced.
7. The streams and channels to be straightened so that length and in turn exposed area to
atmosphere are reduced.
Transpiration: It is the process by which the water vapour escapes from living plants from
surfaces of leaves, branches and enter the atmosphere.
Plants also consume water for building tissue. It has been estimated that water lost by
transpiration is about 800 times more than that required for tissue building. Hence transpiration
losses must also be fairly accounted or measured.
One of the widely used laboratory methods is by phytometer. It is consists of a closed water
tight tank with soil for plant growth. The soil is covered by a polythene sheet with the plant
only exposed. The entire set up with the plant is weighed in the beginning (W1) and at the end
(W2). The amount of water applied during plant growth (W) is noted. Water consumed by
transpiration is given as
Wt = (W1+W) - W2
The laboratory results are multiplied by a co-efficient to obtain field results.
Transpiration ratio is defined as follows,
𝑇𝑟𝑎𝑛𝑠𝑝𝑖𝑟𝑎𝑡𝑖𝑜𝑛 𝑟𝑎𝑡𝑖𝑜 =𝑊𝑒𝑖𝑔ℎ𝑡 𝑜𝑓 𝑤𝑎𝑡𝑒𝑟 𝑡𝑟𝑎𝑛𝑠𝑝𝑖𝑟𝑒𝑑
𝑊𝑒𝑖𝑔ℎ𝑡 𝑜𝑓 𝑑𝑟𝑦 𝑚𝑎𝑡𝑡𝑒𝑟 𝑝𝑟𝑜𝑑𝑢𝑐𝑒𝑑
Evapotranspiration: In agricultural fields apart from transpiration, water is also lost due to
evaporation from adjacent soil. The sum of these two losses is often termed as
evapotranspiration (Et) or consumptive use (Cu).
Potential evapotranspiration: When sufficient moisture is freely available to completely
meet the needs of the vegetation fully covering an area, the resulting evapotranspiration is
called potential evapotranspiration.
HYDROLOGY AND IRRIGATION ENGINEERING 10CV55
Dept of Civil Engg, ACE 28
Actual evapotranspiration: The real evapotranspiration occurring in a specific situation in
the field is called actual evapotranspiration. The knowledge of evapotranspiration, potential
evapotranspiration and actual evapotranspiration are very much useful in designing irrigation
systems (in deciding the amount of water to be supplied for raising crops).
Factors affecting evapotranspiration:
Potential evapotranspiration is controlled by meteorological facts but actual evapotranspiration
is affected by plant and soil factors. In total the factors affecting evapotranspiration are,
1. Temperature
2. Humidity
3. Percentage sunshine hours
4. Wind speed
5. Type of crop
6. Season
7. Moisture holding capacity of soil
8. Irrigation Methods
9. Cropping patterns
Determination of Evapotranspiration (Et) or Consumptive use of water.
The time interval for supplying water to agricultural crops, is a factor dependent on water
requirement of crops, soil properties and as well as consumptive use. Hence accurate
determination of consumptive use or evapotranspiration is very much essential. The methods
of determining consumptive use are:-
i) Direct measurement method
ii) By use of empirical formulae
Direct measurement methods The different methods of direct measurement are
a. Soil moisture studies on plots
b. Tank and lysimeter method
c. Field experimental plots
d. Integration method
HYDROLOGY AND IRRIGATION ENGINEERING 10CV55
Dept of Civil Engg, ACE 29
e. Inflow and outflow studies for large areas
a) Soil moisture studies on plots
Soil moisture measurements are done before and after supplying water. The quantity of water
extracted per day from the soil is computed for each required period. A curve is drawn by
plotting the rate of water consumed against time. This curve is useful for determining the
average consumption daily or on monthly basis.
b) Tank and lysimeter method
Tanks are watertight cylindrical containers which are open at one end. They have a diameter
of 1-3 m and depth of 2-3 m. They are set in ground with the rim in flush with the ground
surface. The quantity of water to keep a constant moisture content (for optimum growth) is
determined, which itself represents consumptive use. A lysimeter is a container similar to tank
but has pervious bottom free drainage through the bottom is collected in a pan which is kept
below. The consumptive use of water in this case therefore the difference between the water
applied and drainage collected in the pan.
c) Field experimental plots
In this method water is applied to selected field plots in such a way that there is neither runoff
nor deep percolation. Yield obtained from different plots is plotted against total water used. It
can be observed that increase in yield occurs with increase in water applied up to a certain
point. Further increase in water content reduces yield. This break point in water application is
taken as consumptive use.
d) Integration method
In this method the consumptive use of water for large areas is determined as the sum of the
following products.
I) Consumptive use of each crop and its area
II) Consumptive use of natural vegetation and its area
III) Evaporation from water surfaces and their area
IV) Evaporation from open lands and their area
e) Inflow and outflow studies for large areas
HYDROLOGY AND IRRIGATION ENGINEERING 10CV55
Dept of Civil Engg, ACE 30
In this method consumptive use of water for large areas is given by the equation
Cu= I+P + (Gs- Ge) - O
where I= Total inflow into the area during a year
P= Total precipitation in the area during a year
Gs= Ground water storage at the beginning of the year
Ge= Ground water storage at the end of the year
O= Outflow from the area during the year
By Use of Empirical formulae Following are some of the empirical methods or relations
suggested for calculating consumptive use
a) Blaney Criddle method
b) Penman method
c) Lowry and Johnson method
d) Hargreaves pan method
e) Thornthwaite method.
Infiltration:
The water entering the soil at the ground surface after overcoming resistance to flow is called
infiltration. The process is also termed as infiltration.
Infiltration fills the voids in the soil. Excess water moves down by gravity and it is known as
percolation. Percolation takes place till water reaches ground water table. For continuous
infiltration to occur it is essential that percolation should also be continuous, which is also
dependent of ground water movement.
Infiltration process: Infiltration plays an important role in the runoff process and it can be easily
understood by a simple analogy as shown below.
The soil medium where infiltration is to be observed may be considered as a small container
covered with a wire gauge mesh. If water is poured over the gauge, part of it enters the soil and
some part over flows. Further the runoff and infiltration depend on the condition of soil. When
soil reaches saturated condition infiltration stops and all input becomes runoff.
Usually at the beginning of a storm infiltration is more and runoff is less and when storm
continues infiltration becomes lesser and runoff become constant. The volume of rainfall that
will result in runoff is called “Rainfall excess”.
HYDROLOGY AND IRRIGATION ENGINEERING 10CV55
Dept of Civil Engg, ACE 31
Infiltration rate (f): It is actually the prevailing rate at which the water is entering the given soil
at any given instant of time. It is expressed in cm/hr (i.e. depth of water entering soil per unit
time).
Infiltration Capacity (fp): It is the maximum rate at which a soil in any given condition is
capable of absorbing water.
Factors affecting infiltration Capacity: The variations in the infiltration capacity are large. The
infiltration capacity is influenced by many factors. Some factors contribute to long term
variation, but some cause temporary variations.
a. Depth of surface retention and thickness of saturated layer of soil.
b. Texture of soil and its gradation.
c. Compactness of soil
d. Surface cover condition
e. Current moisture level in soil.
f. Soil temperature
g. Intensity of rainfall
h. Season of year
Measurement of infiltration: Infiltration rates are required in many hydrological problems such
as runoff estimation, soil moisture studies in agriculture, etc. The different methods of
determination of infiltration are
1. Use of Infiltro-meters
2. Hydrograph analysis method
Infiltro-meters are of two types.
a) Flooding type Infiltro-meters
b) Rainfall simulators
In flooding type Infiltro-meters water is applied in form of a sheet, with constant depth of
flooding. The depletion of water depth is observed with respect to time. In case of rainfall
simulators water is applied by sprinkling at a constant rate in excess of infiltration capacity and
the runoff occurring is also recorded.
Infiltro-meters adopted in practice are,
HYDROLOGY AND IRRIGATION ENGINEERING 10CV55
Dept of Civil Engg, ACE 32
1.Simple (Tube Type) Infiltro-meters
2. Double ring Infiltro-meters
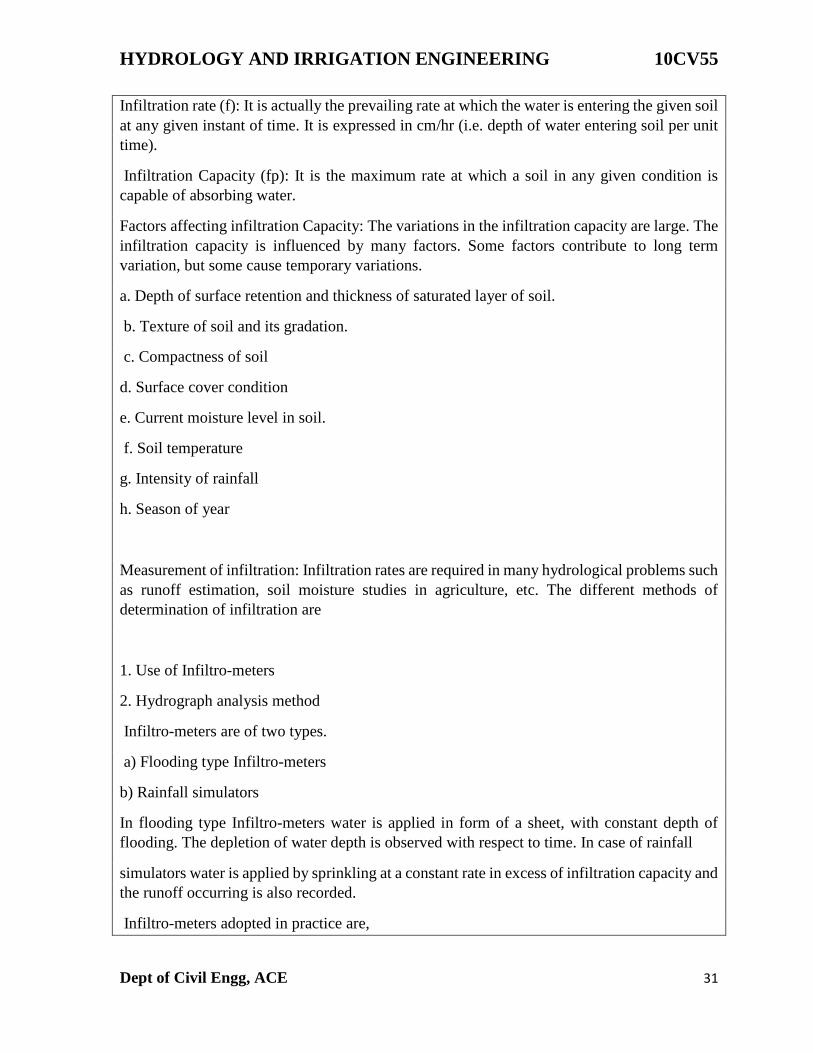
1. Simple (Tube Type) Infiltro-meters
It is essentially a metal cylinder with openings at both ends. It has a diameter of 30 cm and
length of 60 cm. This is driven into the ground as shown and water is poured from the top till
the pointer level as shown. As infiltration continues the depleted volume of water is made up
by adding water from a burette or measuring jar to maintain constant water level. Knowing the
volume of water added during different time intervals the infiltration capacity curve is plotted.
The experiment is continued till a uniform rate of infiltration is obtained, which may take 2 to
3 hours.
Figure: 2.1 Simple (Tube Type) Infiltro-meters
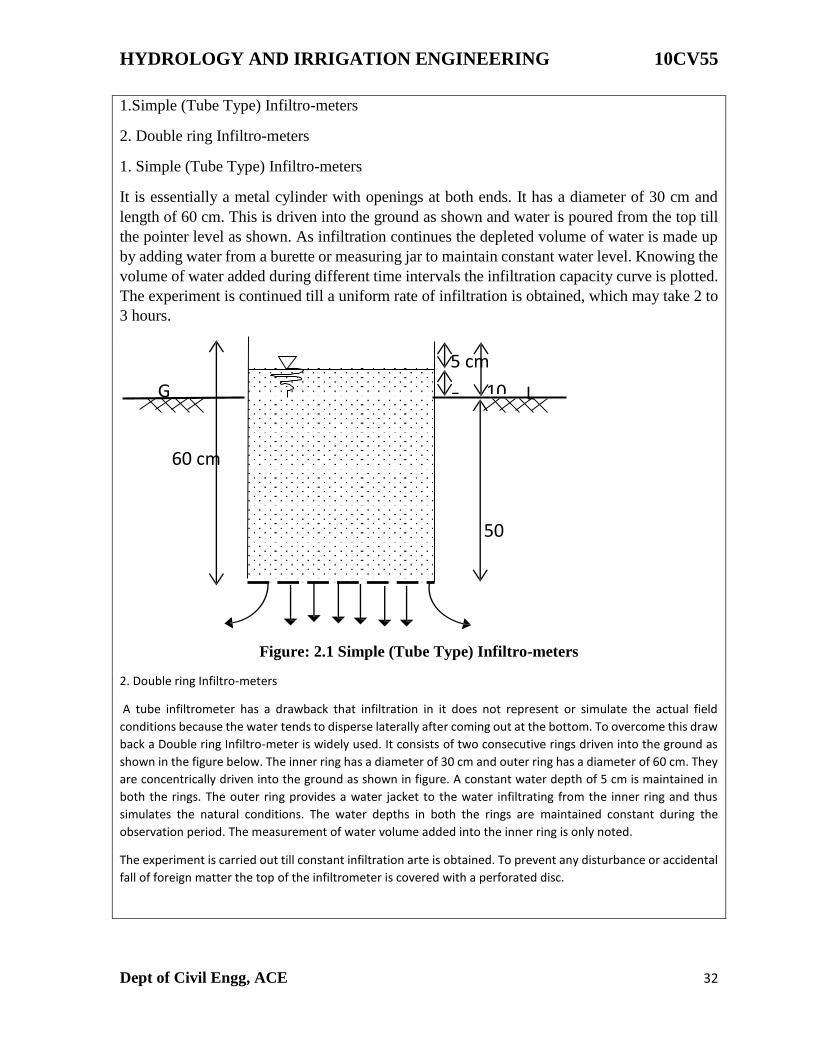
2. Double ring Infiltro-meters
A tube infiltrometer has a drawback that infiltration in it does not represent or simulate the actual field
conditions because the water tends to disperse laterally after coming out at the bottom. To overcome this draw
back a Double ring Infiltro-meter is widely used. It consists of two consecutive rings driven into the ground as
shown in the figure below. The inner ring has a diameter of 30 cm and outer ring has a diameter of 60 cm. They
are concentrically driven into the ground as shown in figure. A constant water depth of 5 cm is maintained in
both the rings. The outer ring provides a water jacket to the water infiltrating from the inner ring and thus
simulates the natural conditions. The water depths in both the rings are maintained constant during the
observation period. The measurement of water volume added into the inner ring is only noted.
The experiment is carried out till constant infiltration arte is obtained. To prevent any disturbance or accidental
fall of foreign matter the top of the infiltrometer is covered with a perforated disc.
G
5 cm
5 cm10 L
60 cm
50
HYDROLOGY AND IRRIGATION ENGINEERING 10CV55
Dept of Civil Engg, ACE 33
Figure: 2.2 Double ring Infiltro-meters
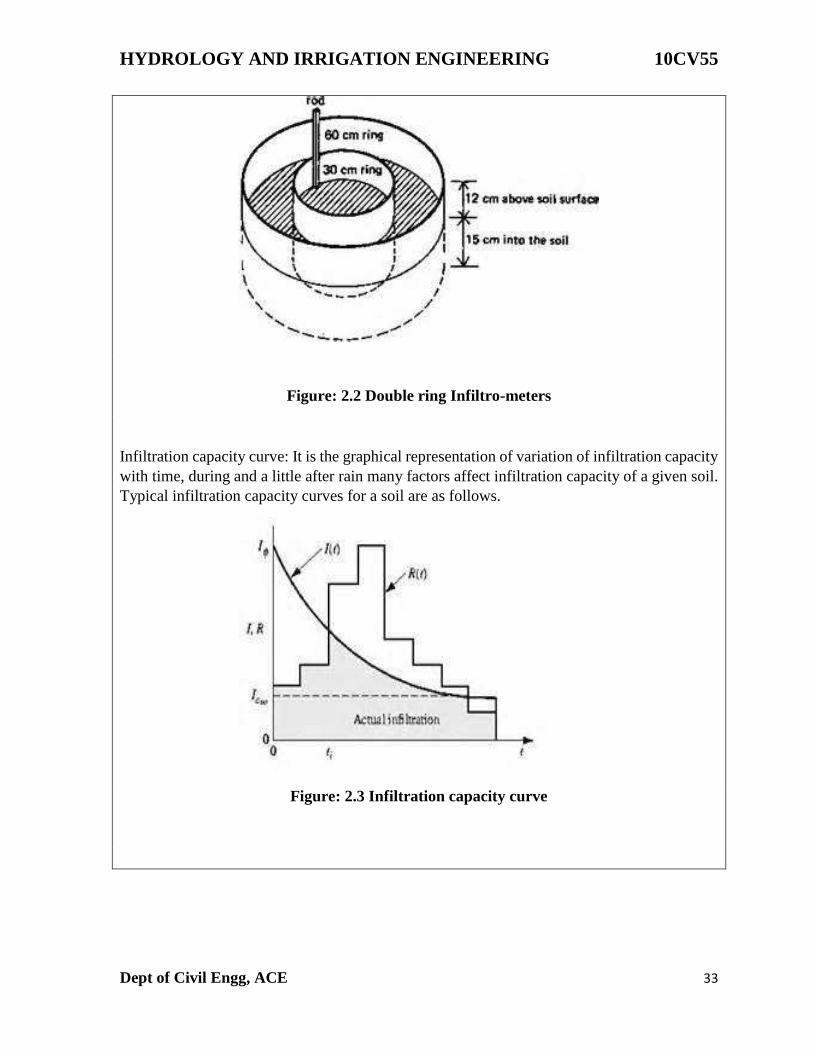
Infiltration capacity curve: It is the graphical representation of variation of infiltration capacity
with time, during and a little after rain many factors affect infiltration capacity of a given soil.
Typical infiltration capacity curves for a soil are as follows.
Figure: 2.3 Infiltration capacity curve
HYDROLOGY AND IRRIGATION ENGINEERING 10CV55
Dept of Civil Engg, ACE 34
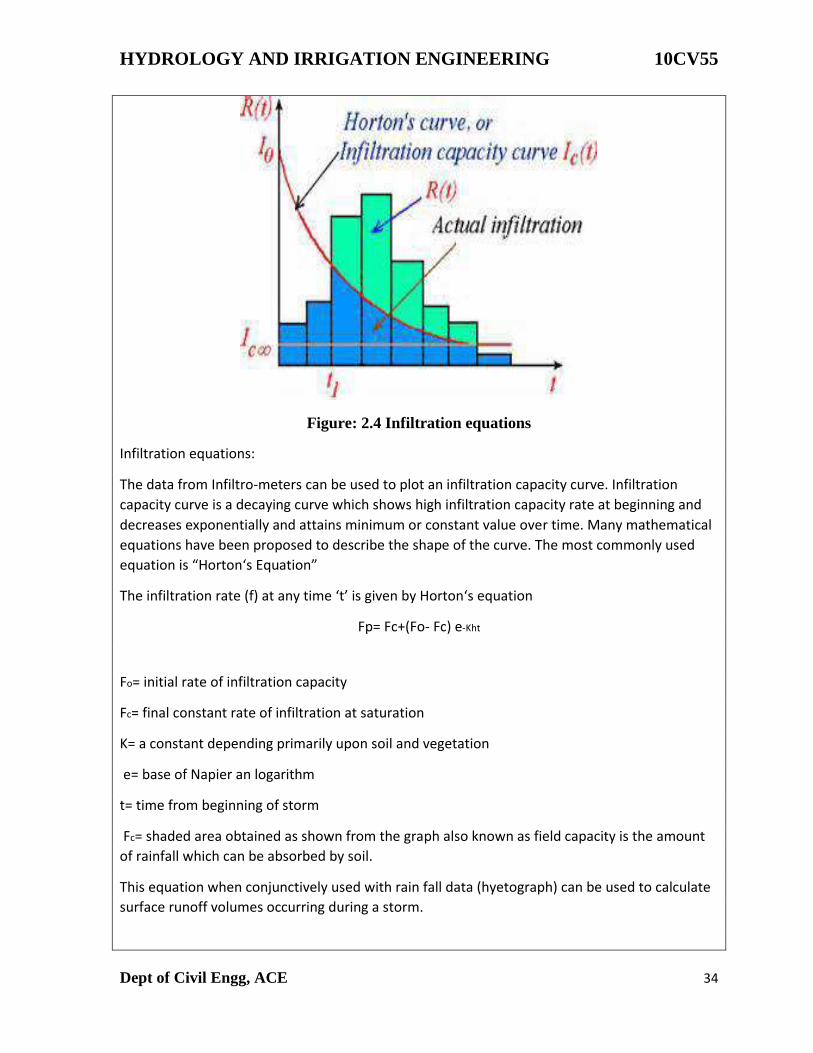
Figure: 2.4 Infiltration equations
Infiltration equations:
The data from Infiltro-meters can be used to plot an infiltration capacity curve. Infiltration
capacity curve is a decaying curve which shows high infiltration capacity rate at beginning and
decreases exponentially and attains minimum or constant value over time. Many mathematical
equations have been proposed to describe the shape of the curve. The most commonly used
equation is “Horton‘s Equation”
The infiltration rate (f) at any time ‘t’ is given by Horton‘s equation
Fp= Fc+(Fo- Fc) e-Kht
Fo= initial rate of infiltration capacity
Fc= final constant rate of infiltration at saturation
K= a constant depending primarily upon soil and vegetation
e= base of Napier an logarithm
t= time from beginning of storm
Fc= shaded area obtained as shown from the graph also known as field capacity is the amount
of rainfall which can be absorbed by soil.
This equation when conjunctively used with rain fall data (hyetograph) can be used to calculate
surface runoff volumes occurring during a storm.
HYDROLOGY AND IRRIGATION ENGINEERING 10CV55
Dept of Civil Engg, ACE 35
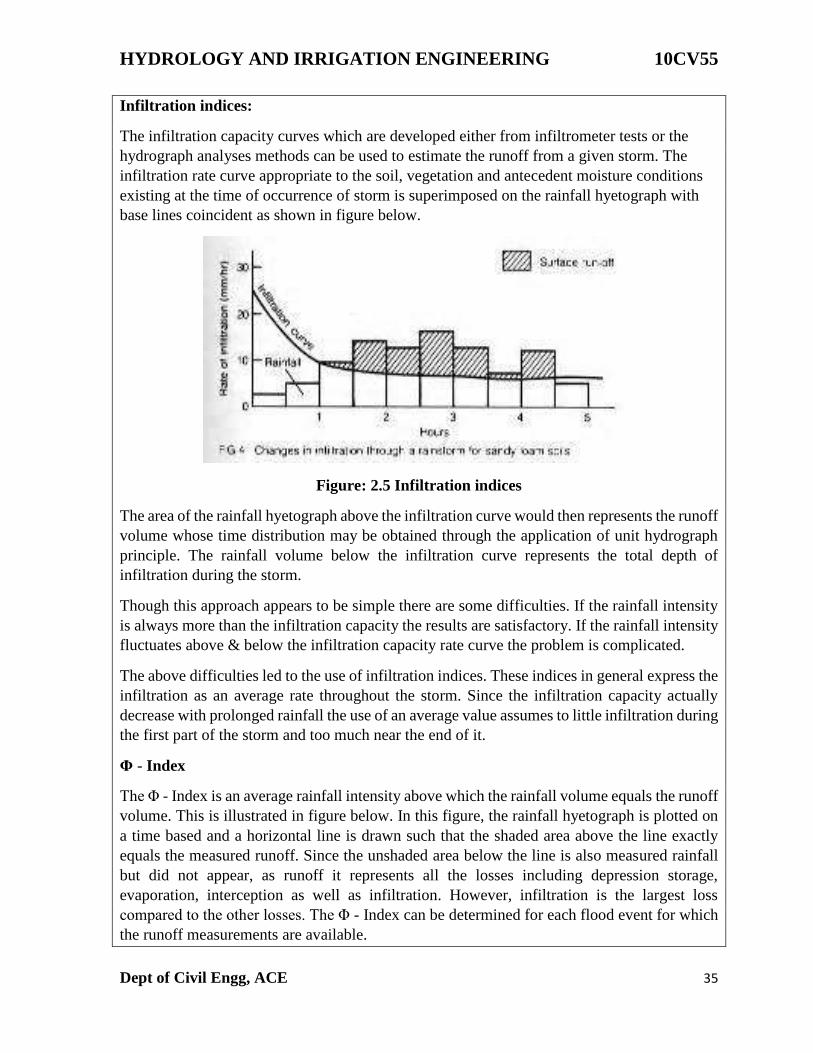
Infiltration indices:
The infiltration capacity curves which are developed either from infiltrometer tests or the
hydrograph analyses methods can be used to estimate the runoff from a given storm. The
infiltration rate curve appropriate to the soil, vegetation and antecedent moisture conditions
existing at the time of occurrence of storm is superimposed on the rainfall hyetograph with
base lines coincident as shown in figure below.
Figure: 2.5 Infiltration indices
The area of the rainfall hyetograph above the infiltration curve would then represents the runoff
volume whose time distribution may be obtained through the application of unit hydrograph
principle. The rainfall volume below the infiltration curve represents the total depth of
infiltration during the storm.
Though this approach appears to be simple there are some difficulties. If the rainfall intensity
is always more than the infiltration capacity the results are satisfactory. If the rainfall intensity
fluctuates above & below the infiltration capacity rate curve the problem is complicated.
The above difficulties led to the use of infiltration indices. These indices in general express the
infiltration as an average rate throughout the storm. Since the infiltration capacity actually
decrease with prolonged rainfall the use of an average value assumes to little infiltration during
the first part of the storm and too much near the end of it.
Φ - Index
The Φ - Index is an average rainfall intensity above which the rainfall volume equals the runoff
volume. This is illustrated in figure below. In this figure, the rainfall hyetograph is plotted on
a time based and a horizontal line is drawn such that the shaded area above the line exactly
equals the measured runoff. Since the unshaded area below the line is also measured rainfall
but did not appear, as runoff it represents all the losses including depression storage,
evaporation, interception as well as infiltration. However, infiltration is the largest loss
compared to the other losses. The Φ - Index can be determined for each flood event for which
the runoff measurements are available.
HYDROLOGY AND IRRIGATION ENGINEERING 10CV55
Dept of Civil Engg, ACE 36
W – Index
The W – Index is refined version of Φ - Index. It excludes the depression storage and
interpolation from the total losses. It is the average infiltration rate during the time rainfall
intensity exceeds the capacity rate. That is
W= F/t= (P-Q-S)/ t
Where F is the total infiltration,
t is the time during which rainfall intensity exceeds infiltration capacity,
P is the total precipitation corresponding to t,
Q is the total storm runoff and S is the volume of depression, storage and interception.
Thus W- index is essentially equal to Φ - Index minus the depression and interception storage.
Wmin – Index
This is the lowest value of W – Index which is observed under very wet initial conditions.
Under these conditions since the retention rate is very low W - Index and Φ - Index tend to be
equal .. This index is principally used in studies of maximum flood potential.
HYDROLOGY AND IRRIGATION ENGINEERING 10CV55
Dept of Civil Engg, ACE 37
UNIT -3
HYDROGRAPHS
Run off
When precipitation occurs on land, a part of it is intercepted by vegetation and some part of it
is stored as depression storage. A part of precipitation infiltrates into the ground. The rate of
infiltration depends on the nature of the soil, moisture content in soil, topography, etc. If the
rate of precipitation is greater than the rate of infiltration, then the rainfall in excess of
infiltration will start flowing over the ground surface and is also known as over land flow.
When overland flow is occurring infiltration and evaporation may also occur. When over land
flow reaches a well-defined stream it is known as surface run off.
A portion of infiltrating water will satisfy soil-moisture deficiency.A portion may move in soil
but very close to the surface. If this also reaches a well-defined stream it is known as inter flow
or subsurface flow.
Another portion of infiltration may percolate deeper into the soil to reach ground water table.
Under favorable conditions some of the ground water may reach the streams and this portion
is known as Base flow or ground water flow.
A part of precipitation may occur directly on stream surface and this is known as channel
precipitation.
Hence Total runoff = Surface run off + Inter flow + Base flow + Channel precipitation.
It is also evident that evaporation always occurs along with transpiration.
Hence
Precipitation = Run off + Evaporation
or
Precipitation = (Surface run off + Inter flow + Base flow + Channel precipitation) +
Evaporation
Definitions:
1. Total Run off: This is the part of precipitation which appears in streams. It consists of
Surface run off, Inter flow, Base flow, and Channel precipitation.
2. Surface run off (SRO): This is the part of overland flow which reaches the streams.
HYDROLOGY AND IRRIGATION ENGINEERING 10CV55
Dept of Civil Engg, ACE 38
3. Direct run off (DRO): It consists of Surface run off, Inter flow, and Channel precipitation,
but does not include Base flow.
Since channel precipitation is small and inter flow is uncertain, it is usual to include these two
run offs in surface run off. Hence there is no difference between direct run off and surface run
off. Hence Total run off = Surface run off + Base flow Since the base flow occurs in the stream
after a longer time compared to surface run off, it is necessary to separate the base flow and
surface run off in preparing hydrographs.
4. Hydrograph: A hydrograph is a plot of the run off or discharge in a stream versus time.
Hydrographs may be developed for isolated or complex storms using stream gauging data.
The area under the hydrograph gives the total volume of runoff and each ordinate gives the
discharge at the instant considered. It also indicates the peak discharge and the time base of
the flood in the stream.
5. Rainfall excess: This is the portion of rainfall appearing in the stream as surface run off.
6. Effective rainfall: This is the portion of rainfall which appears in the stream as the sum of
Surface run off, Inter flow, and Channel precipitation.
Since channel precipitation is small and inter flow is uncertain, it is usual to include these two
run offs in surface run off. Thus rainfall excess and effective rainfall may be considered to be
the same.
Note: Surface run off = Precipitation – (interception + depression storage + evaporation +
infiltration)
7. Channel storage: As runoff occurs in the stream, the water level will rise along the length of
the stream. Thus a large volume of water is temporarily stored in the channel. This is known
as channel storage. It reduces or moderates flood peaks. The channel storage therefore causes
delay in the appearance of discharge at any section of the stream.
Methods of estimating run off from basins: (The basin area contributing to the flow in a stream
goes on increasing as we go down along a stream. Hence the section at which the flow is
measured should be specified.) The various methods for estimating run off from basins are
a. Empirical formulae and charts
b. By estimating losses (evaporation, transpiration, etc.)
HYDROLOGY AND IRRIGATION ENGINEERING 10CV55
Dept of Civil Engg, ACE 39
c. By infiltration
d. Unit Hydrograph method
e. Synthetic Unit Hydrograph method (Synder‘s method)
It is difficult to obtain even a fairly approximate estimate of run off because the various
processes such as overland flow, base flow, infiltration, evaporation, etc are highly irregular
and complex. Thus none of the above methods can be considered as accurate. However the
Unit Hydrograph method is easier and is considered as the best among the methods mentioned.
Hydrograph:
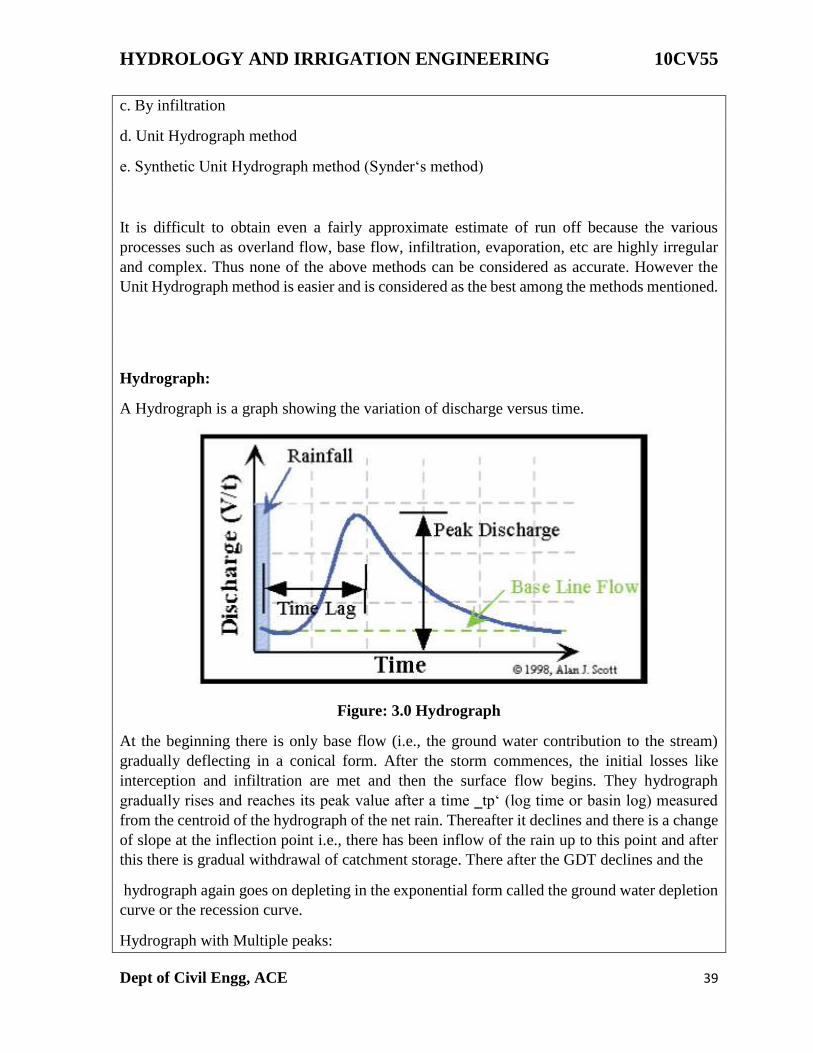
A Hydrograph is a graph showing the variation of discharge versus time.
Figure: 3.0 Hydrograph
At the beginning there is only base flow (i.e., the ground water contribution to the stream)
gradually deflecting in a conical form. After the storm commences, the initial losses like
interception and infiltration are met and then the surface flow begins. They hydrograph
gradually rises and reaches its peak value after a time ‗tp‘ (log time or basin log) measured
from the centroid of the hydrograph of the net rain. Thereafter it declines and there is a change
of slope at the inflection point i.e., there has been inflow of the rain up to this point and after
this there is gradual withdrawal of catchment storage. There after the GDT declines and the
hydrograph again goes on depleting in the exponential form called the ground water depletion
curve or the recession curve.
Hydrograph with Multiple peaks:
HYDROLOGY AND IRRIGATION ENGINEERING 10CV55
Dept of Civil Engg, ACE 40
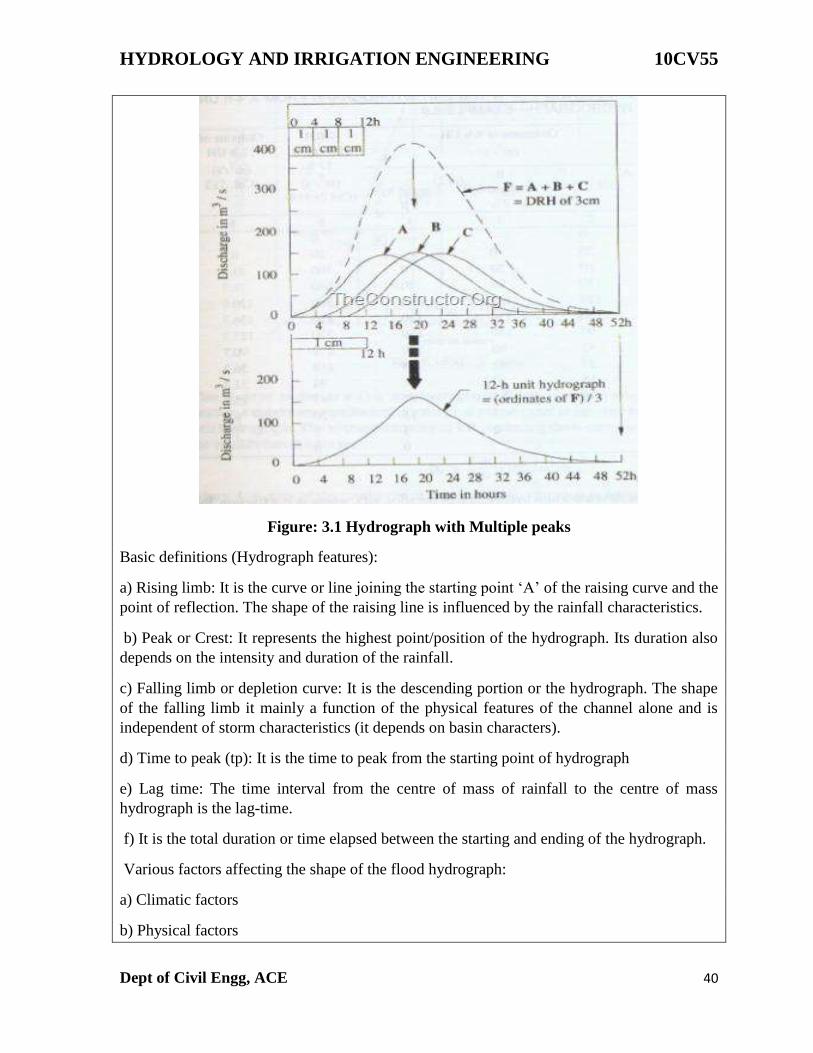
Figure: 3.1 Hydrograph with Multiple peaks
Basic definitions (Hydrograph features):
a) Rising limb: It is the curve or line joining the starting point ‘A’ of the raising curve and the
point of reflection. The shape of the raising line is influenced by the rainfall characteristics.
b) Peak or Crest: It represents the highest point/position of the hydrograph. Its duration also
depends on the intensity and duration of the rainfall.
c) Falling limb or depletion curve: It is the descending portion or the hydrograph. The shape
of the falling limb it mainly a function of the physical features of the channel alone and is
independent of storm characteristics (it depends on basin characters).
d) Time to peak (tp): It is the time to peak from the starting point of hydrograph
e) Lag time: The time interval from the centre of mass of rainfall to the centre of mass
hydrograph is the lag-time.
f) It is the total duration or time elapsed between the starting and ending of the hydrograph.
Various factors affecting the shape of the flood hydrograph:
a) Climatic factors
b) Physical factors
HYDROLOGY AND IRRIGATION ENGINEERING 10CV55
Dept of Civil Engg, ACE 41
Climatic factors include
1) Storm characteristics, intensity, duration, magnitude and movement of storm
2) Initial loss due to interception etc.
3) Evapotranspiration
Physical factors include
1) Basic characteristics, shape, size, slope, nature of the valley, elevation, drainage density
2) Infiltration characteristics, land use and cover, soil type, geological conditions etc.
3)Channel characteristics, cross section, roughness and storage capacity
(For a given duration, the peak and volume of surface runoff are essentially proportional to the
rainfall intensity. Duration of rainfall of given intensity directly effects the volume of runoff.
If the storm moves in the downstream direction flow will be quicker at the basin. Smaller
catchments yield a more rapid and intense flood per unit area. Vegetation and forests increase
infiltration and also the storage capacity of the soils; vegetal cover reduces the peak flow.
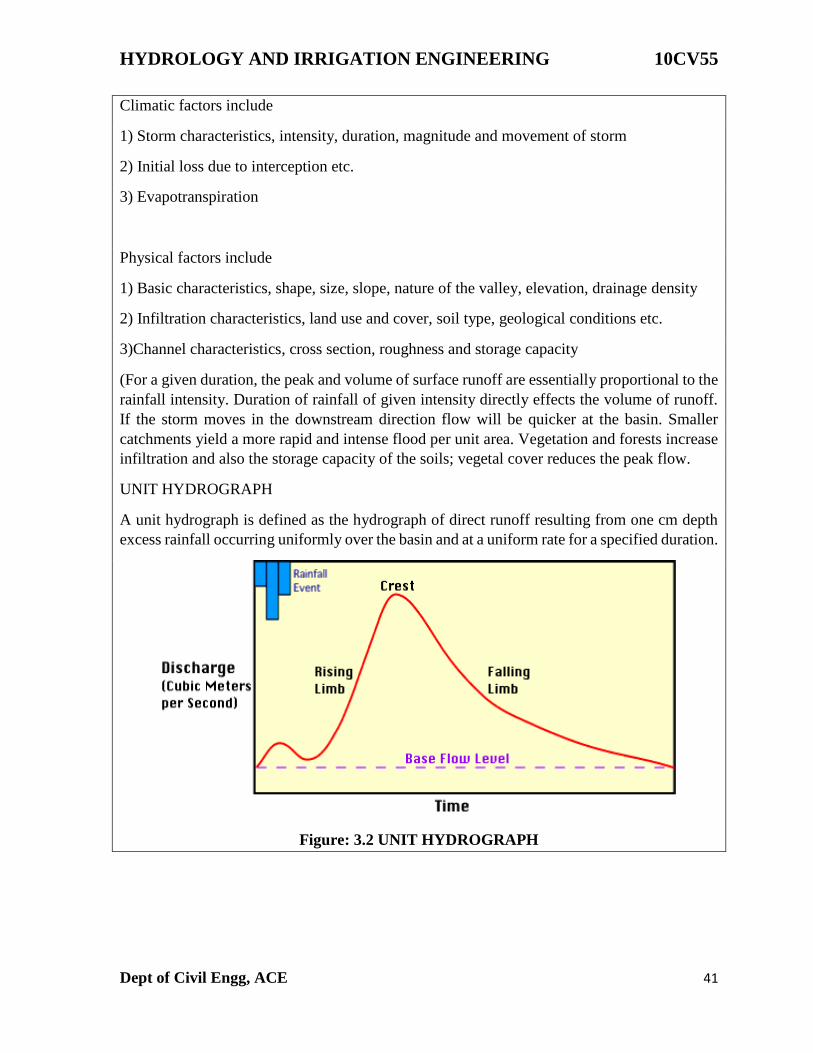
UNIT HYDROGRAPH
A unit hydrograph is defined as the hydrograph of direct runoff resulting from one cm depth
excess rainfall occurring uniformly over the basin and at a uniform rate for a specified duration.
Figure: 3.2 UNIT HYDROGRAPH
HYDROLOGY AND IRRIGATION ENGINEERING 10CV55
Dept of Civil Engg, ACE 42
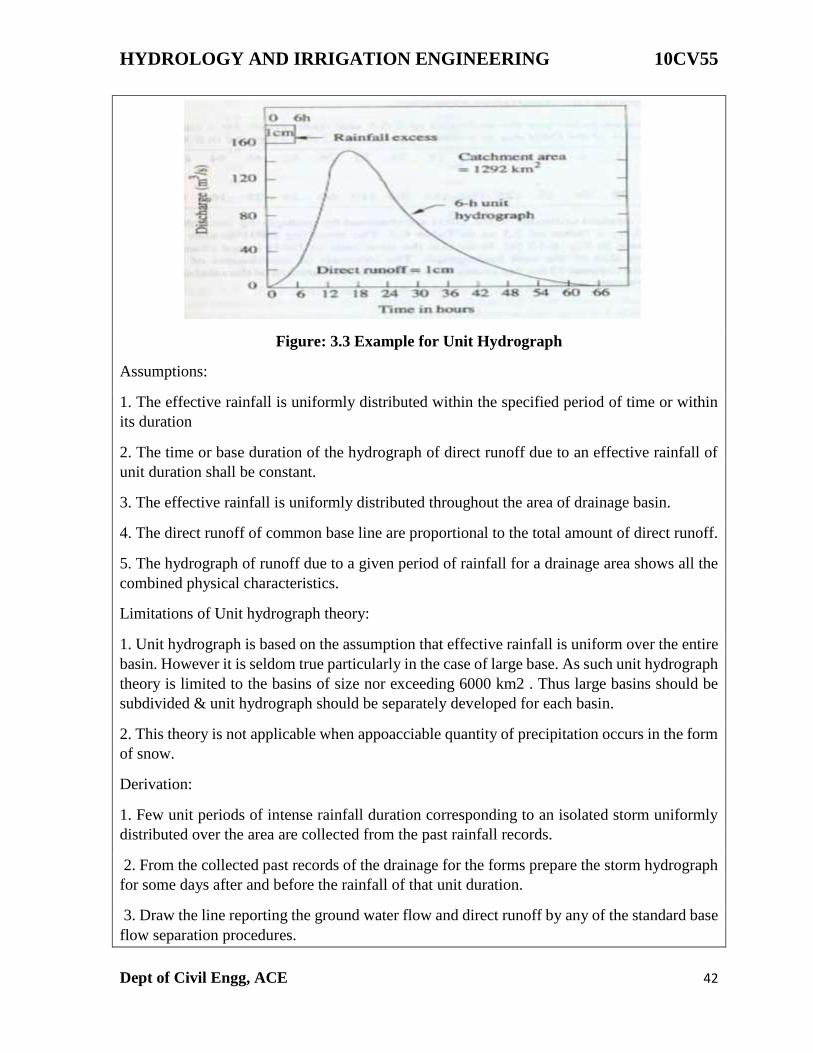
Figure: 3.3 Example for Unit Hydrograph
Assumptions:
1. The effective rainfall is uniformly distributed within the specified period of time or within
its duration
2. The time or base duration of the hydrograph of direct runoff due to an effective rainfall of
unit duration shall be constant.
3. The effective rainfall is uniformly distributed throughout the area of drainage basin.
4. The direct runoff of common base line are proportional to the total amount of direct runoff.
5. The hydrograph of runoff due to a given period of rainfall for a drainage area shows all the
combined physical characteristics.
Limitations of Unit hydrograph theory:
1. Unit hydrograph is based on the assumption that effective rainfall is uniform over the entire
basin. However it is seldom true particularly in the case of large base. As such unit hydrograph
theory is limited to the basins of size nor exceeding 6000 km2 . Thus large basins should be
subdivided & unit hydrograph should be separately developed for each basin.
2. This theory is not applicable when appoacciable quantity of precipitation occurs in the form
of snow.
Derivation:
1. Few unit periods of intense rainfall duration corresponding to an isolated storm uniformly
distributed over the area are collected from the past rainfall records.
2. From the collected past records of the drainage for the forms prepare the storm hydrograph
for some days after and before the rainfall of that unit duration.
3. Draw the line reporting the ground water flow and direct runoff by any of the standard base
flow separation procedures.
HYDROLOGY AND IRRIGATION ENGINEERING 10CV55
Dept of Civil Engg, ACE 43
4. From the ordinate of the total runoff hydrograph deduct the corresponding ordinates of base
flow to obtain the ordinates of direct runoff.
5. Divide the volume of direct runoff by the area of the drainage basin to obtain the net
precipitation depth(x) over the basin.
6. Divide each of the ordinates of direct runoff by net precipitation depth to obtain the ordinates
of the unit hydrograph. i.e., ordinate of unit hydrograph (UHG) = Ordinate of direct runoff
(FHG)/Depth of net precipitation(x) i.e, UHG=FHG/x
7. Plot the ordinates of the unit hydrograph against time since the beginning of direct runoff,
which is the unit hydrograph for the basin for the duration of the storm.
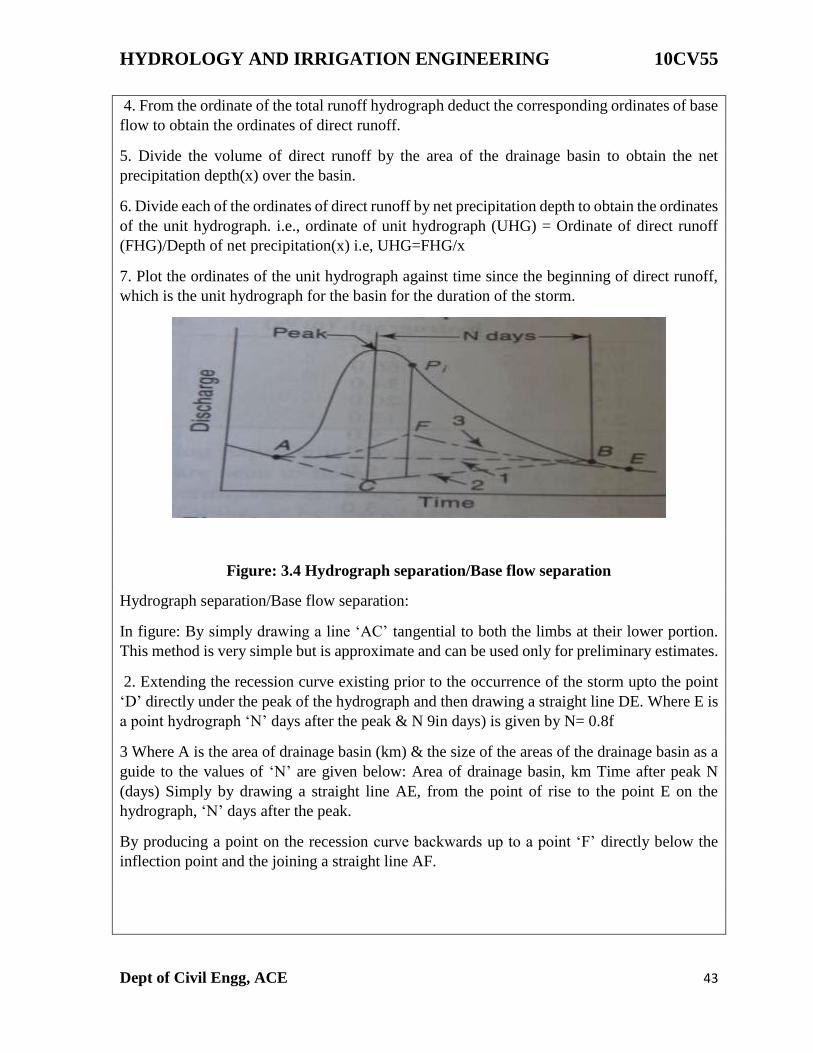
Figure: 3.4 Hydrograph separation/Base flow separation
Hydrograph separation/Base flow separation:
In figure: By simply drawing a line ‘AC’ tangential to both the limbs at their lower portion.
This method is very simple but is approximate and can be used only for preliminary estimates.
2. Extending the recession curve existing prior to the occurrence of the storm upto the point
‘D’ directly under the peak of the hydrograph and then drawing a straight line DE. Where E is
a point hydrograph ‘N’ days after the peak & N 9in days) is given by N= 0.8f
3 Where A is the area of drainage basin (km) & the size of the areas of the drainage basin as a
guide to the values of ‘N’ are given below: Area of drainage basin, km Time after peak N
(days) Simply by drawing a straight line AE, from the point of rise to the point E on the
hydrograph, ‘N’ days after the peak.
By producing a point on the recession curve backwards up to a point ‘F’ directly below the
inflection point and the joining a straight line AF.
HYDROLOGY AND IRRIGATION ENGINEERING 10CV55
Dept of Civil Engg, ACE 44
UNIT 4
ESTIMATION OF FLOOD & FLOOD ROUTING
Engineering hydrology is concerned with the quantitative relationship between rainfall and
'runoff' (i.e. passage of water on the surface of the Earth) and, in particular, with the magnitude
and time variations of runoff. This is because all water resource schemes require such estimates
to be made before design of the relevant structures may proceed. Examples include reservoir
design, Road alleviation schemes and land drainage. Each of these examples involves different
aspects of engineering hydrology, and all involve subsequent hydraulic analysis before safe
and economical structures can be constructed.
Engineering hydrology is conveniently subdivided into two main areas of interest, namely,
surface water hydrology and groundwater hydrology. The first of these is further subdivided
into rural hydrology and urban hydrology, since the runoff response of these catchment types
to rainfall is very different.
The most common use of engineering hydrology is the prediction of 'design' events. This may
be considered analogous to the estimation of 'design' loads on structures. Design events do not
mimic nature, but are merely a convenient way of designing safe and economical structures
for water resources schemes. As civil engineers are principally concerned with the extremes of
nature, design events may be either floods or droughts. The design of hydraulic structures will
normally require the estimation of a suitable design flood (e.g. for spillway sizing) and
sometimes a design drought (e.g. for reservoir capacity).
Catchment characteristics:
A good starting point for a quantitative assessment of runoff is to consider the physical
processes occurring in the hydrological cycle and within the catchment, as shown in Figure 1.
Circulation of water takes place from the ocean to the atmosphere by evaporation, and this
water is deposited on a catchment mainly as rainfall from there, it may follow several routes,
but eventually the water is returned to the sea via the rivers.
Within the catchment, several circulation routes are possible. Rainfall is initially intercepted
by vegetation and may be evaporated. Secondly, infiltration into the soil or overland Row to a
stream channel or river may occur. Water entering the soil layer may remain in storage (in the
unsaturated zone) or may percolate to the groundwater table (the saturated zone). All
subsurface water may move laterally and eventually enter a stream channel.
A set of characteristics may be proposed which determine the response of the catchment to
rainfall. These might include the following:
(a) Catchment area:
(b) Soil type(s) and depth(s):
HYDROLOGY AND IRRIGATION ENGINEERING 10CV55
Dept of Civil Engg, ACE 45
(c) Vegetation cover:
(d) Stream slopes and surface slopes:
(e) Rock type(s) and area(s)
(f) Drainage network (natural and man-made):
(g) Lakes and reservoirs:
(h) Impermeable areas (e.g. roads, buildings, etc.).
In addition, different catchments will experience different climates, and hence the response of
the catchment to rainfall will depend also on the prevailing climate. This may be represented
by:
(a) Rainfall (depth, duration and intensity):
(b) Evaporation potential (derived from temperature, humidity, wind speed and solar radiation
measurements or from evaporation pan records.)
However, from an engineering viewpoint, qualitative measures of catchment characteristics
are inadequate in themselves, and quantitative measures are necessary to predict flood
magnitudes. Flood Studies lead to the following equation for catchments:
Q = const x AREA0.94 x STMFRQ0.27 x S10850.16 x SOIL1.23 x RSMD1.03 x (1 + LAKE)-
0.85
Where;
Q = the mean annual flood (m3/s);
const. = a number depending on location;
AREA = the catchment area (km2);
STMFRQ = the stream frequency (no. of stream junctions/AREA):
S1085 = the slope of the main stream (m/km);
SOIL = a number depending on soil type;
RSMD= I day rainfall of 5 year return period minus the mean soil moisture deficit (mm);
LAKE = the area of lakes or reservoirs (as a fraction of AREA).
Methods for estimating flood To estimate the magnitude of a flood peak the following
alternative methods available:
1. Rational method
2. Empirical method
3. Unit-hydrograph technique
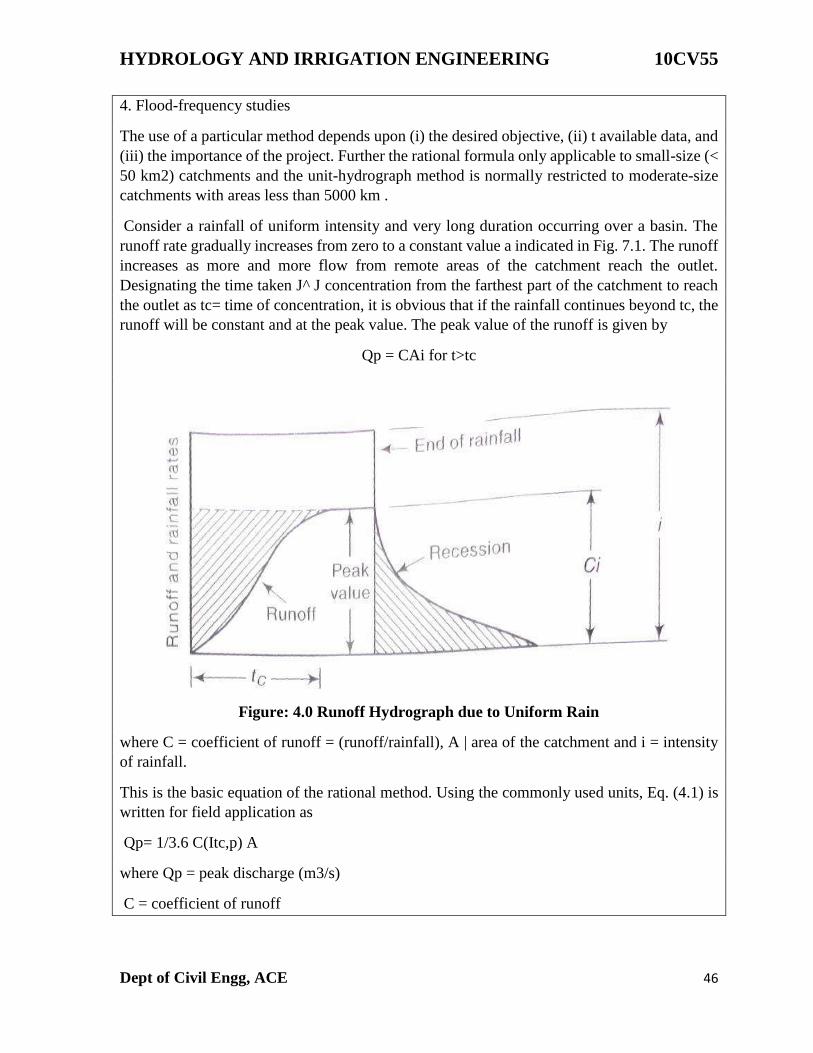
HYDROLOGY AND IRRIGATION ENGINEERING 10CV55
Dept of Civil Engg, ACE 46
4. Flood-frequency studies
The use of a particular method depends upon (i) the desired objective, (ii) t available data, and
(iii) the importance of the project. Further the rational formula only applicable to small-size (<
50 km2) catchments and the unit-hydrograph method is normally restricted to moderate-size
catchments with areas less than 5000 km .
Consider a rainfall of uniform intensity and very long duration occurring over a basin. The
runoff rate gradually increases from zero to a constant value a indicated in Fig. 7.1. The runoff
increases as more and more flow from remote areas of the catchment reach the outlet.
Designating the time taken J^ J concentration from the farthest part of the catchment to reach
the outlet as tc= time of concentration, it is obvious that if the rainfall continues beyond tc, the
runoff will be constant and at the peak value. The peak value of the runoff is given by
Qp = CAi for t>tc
Figure: 4.0 Runoff Hydrograph due to Uniform Rain
where C = coefficient of runoff = (runoff/rainfall), A | area of the catchment and i = intensity
of rainfall.
This is the basic equation of the rational method. Using the commonly used units, Eq. (4.1) is
written for field application as
Qp= 1/3.6 C(Itc,p) A
where Qp = peak discharge (m3/s)
C = coefficient of runoff
HYDROLOGY AND IRRIGATION ENGINEERING 10CV55
Dept of Civil Engg, ACE 47
(Itc,p) = the mean intensity of precipitation (mm/h) for a duration equal to tc and an exceedence
probability P
A = drainage area in km2 .
The use of this method to compute Qp requires three parameters: tc, (itcp) and C.
"TIME OF CONCENTRATION (tc)
There are a number of empirical equations available for the estimation of the time of
concentration. Two of these are described below.
US PRACTICE : For small drainage basins, the time of concentration is assumed to be equal
to the lag time of the peak flow. Thus
Tc= Tp of = CtL(LLca/√𝑆 )n
where tc = time of concentration in hours, CtL, L, Lca, n and S have the same meaning as in
Eq. (6.10) .
KIRPICH EQUATION (1940): This is the popularly used formula relating the time of
concentration of the length of travel and slope of the catchment as
tc= 0.01947 L0J7 ST0385 (4.1)
K1= √𝐿3/𝐻
where tc = time of concentration (minutes)
L = maximum length of travel of water (m), and S = slope of the catchment = A H/L in which
AH= difference in elevation between the most remote point on the catchment and the outlet.
For easy use Eq. (4.1) is sometimes written
Tc= 0.01947K10.77
RAINFALL INTENSITY (itcp)
The rainfall intensity corresponding to a duration tc and the desired probability of exceedence
P, (i.e. return period T= 1/P) is found from the rainfall-frequency-duration relationship
for the given catchment area . This will usually be a relationship of the form of Eq. (2.15), viz.
itc,p = KTx/ (tc+ a)n
in which the coefficients K, a, x and n are specific to a given area.
HYDROLOGY AND IRRIGATION ENGINEERING 10CV55
Dept of Civil Engg, ACE 48
RUNOFF COEFFICIENT (C)
The coefficient C represents the integrated effect of the catchment losses and hence depends
upon the nature of the surface, surface slope and rainfall intensity. The effect of rainfall
intensity is not considered in the available tables of values of C. Some typical values of C are
indicated in Table 7. l(a & b).
Equation (7.2) assumes a homogeneous catchment surface. If however, the catchment is non-
homogeneous but can be divided into distinct sub areas each having a different runoff
coefficient, then the runoff from each sub area is calculated separately and merged in proper
time sequence. Sometimes, a non-homogeneous catchment may have component sub areas
distributed in such a complex manner that distinct sub zones cannot be separated. In such cases
a weighted equivalent runoff coefficient Ce as below is used.
Ce=∑ CiAi𝑁1 /𝐴
Empirical formulae
The empirical formulae used for the estimation of the flood peak are essential regional
formulae based on statistical correlation of the observed peak and important an catchment
properties. To simplify the form of the equation, only a few of the many parameters affecting
the flood peak are used. For example, almost all formulae use u catchment area as a parameter
affecting the flood peak and most of them neglect u flood frequency as a parameter. In view of
these, the empirical formulae are applicable only in the region from which they were developed
and when applied to other areas they can at best give approximate values.
FLOOD PEAK-AREA RELATIONSHIPS
By far the simplest of the empirical relationships are those which relate the flood pea to the
drainage area. The maximum flood discharge Qp from a catchment area A given by these
formulae as
Qp= f(A)
While there are a vast number of formulae of this kind proposed for various parts c the world,
only a few popular formulae used in various parts of India are given below.
DICKENS FORMULA (1865)
Qp = CD A3/4
where Qp = maximum flood discharge (m3/s)
A = catchment area (km2)
CD = Dickens constant with value between 6 to 30 .
The following are some guidelines in selecting the value of CD
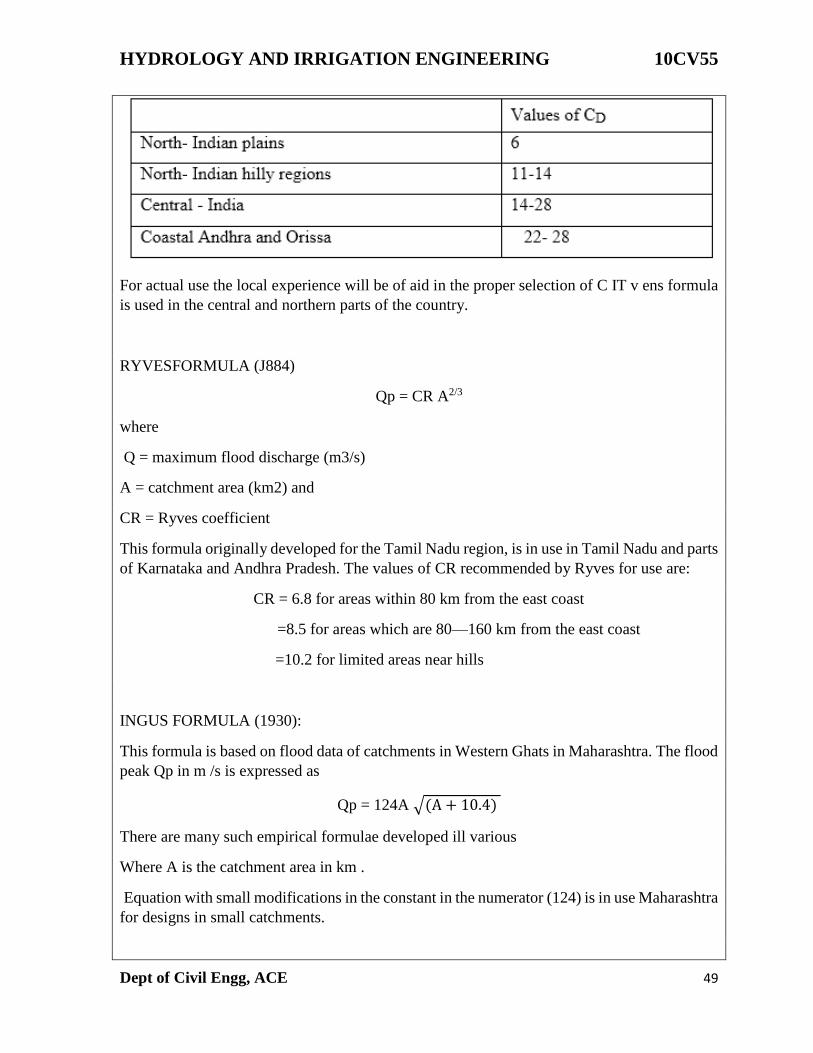
HYDROLOGY AND IRRIGATION ENGINEERING 10CV55
Dept of Civil Engg, ACE 49
For actual use the local experience will be of aid in the proper selection of C IT v ens formula
is used in the central and northern parts of the country.
RYVESFORMULA (J884)
Qp = CR A2/3
where
Q = maximum flood discharge (m3/s)
A = catchment area (km2) and
CR = Ryves coefficient
This formula originally developed for the Tamil Nadu region, is in use in Tamil Nadu and parts
of Karnataka and Andhra Pradesh. The values of CR recommended by Ryves for use are:
CR = 6.8 for areas within 80 km from the east coast
=8.5 for areas which are 80—160 km from the east coast
=10.2 for limited areas near hills
INGUS FORMULA (1930):
This formula is based on flood data of catchments in Western Ghats in Maharashtra. The flood
peak Qp in m /s is expressed as
Qp = 124A √(A + 10.4)
There are many such empirical formulae developed ill various
Where A is the catchment area in km .
Equation with small modifications in the constant in the numerator (124) is in use Maharashtra
for designs in small catchments.
HYDROLOGY AND IRRIGATION ENGINEERING 10CV55
Dept of Civil Engg, ACE 50
OTHER FORMULAE parts of the world, References 3 and 5 list many such formulae
suggested for use in various parts of India as well as of the world.
There are some empirical formulae which relate the peak discharge to the basin area and also
include the flood frequency, Fuller's formula (1914) derived for catchments in USA is a typical
one of this kind and is given by
Qp = Cf A0.8 (1+0.8 log T)
QTP= Maximum 24-h flood with a frequency of T years in m3/s , A= catchment area n km2
, Cf= a constant with values between 0.18 to 1.88.
ENVELOPE CURVES
In regions having same climatologically characteristics, if the available flood data are meager,
the enveloping curve technique can be used to develop a relationship between the maximum
flood flow and drainage area. In this method the available flood peak data from a large number
of catchments which do not significantly differ from each other in terms of meteorological and
topographical characteristics are collected. The data are then plotted on a log-log paper as flood
peak v, catchment area. This would result in a plot in which the data would be scattered. If an
enveloping curve that would encompass all the plotted data points is drawn, it can be used to
obtain maximum peak discharges for any given area. Envelop curves thus obtained are very
useful in getting quick rough estimations of peak values. If equa tions are fitted to these
enveloping curves, they provide empirical flood formulae of the type,
Q =f(A).
Kanwarsain and Karpov (1967) have presented enveloping curves representing the
relationship between the peak-flood flow and catchment area for Indian conditions. Two
curves, one for the south Indian rivers and the other for north Indian and central Indian rivers,
are developed (Fig. 7.2). These two curves are based on data covering large catchment areas,
in the range 103 to 106 km2.
Based on the maximum recorded floods throughout the world, Baird and Mclllwraitli (1951)
have correlated the maximum flood discharge Qmp in m3/s with catchment area A in km2 as
Qmp= 3025A/ (278+A) 0.78
Frequency Analysis
For gauged catchments with long records (e.g. greater than 25 years) the techniques of
frequency analysis may be applied directly to determine the magnitude of any flood event (Q)
with a specified return period (Tt) The concept of return period is an important one because it
enables the determination of risk (economic or otherwise) associated with a given flood
magnitude. It may be formally defined as the number of years, on average, between a flood
event of magnitude (X) which is greater than or equal to a specified value (Q). The qualifier
'on average' is often misunderstood For example, although a 100 year flood event will occur,
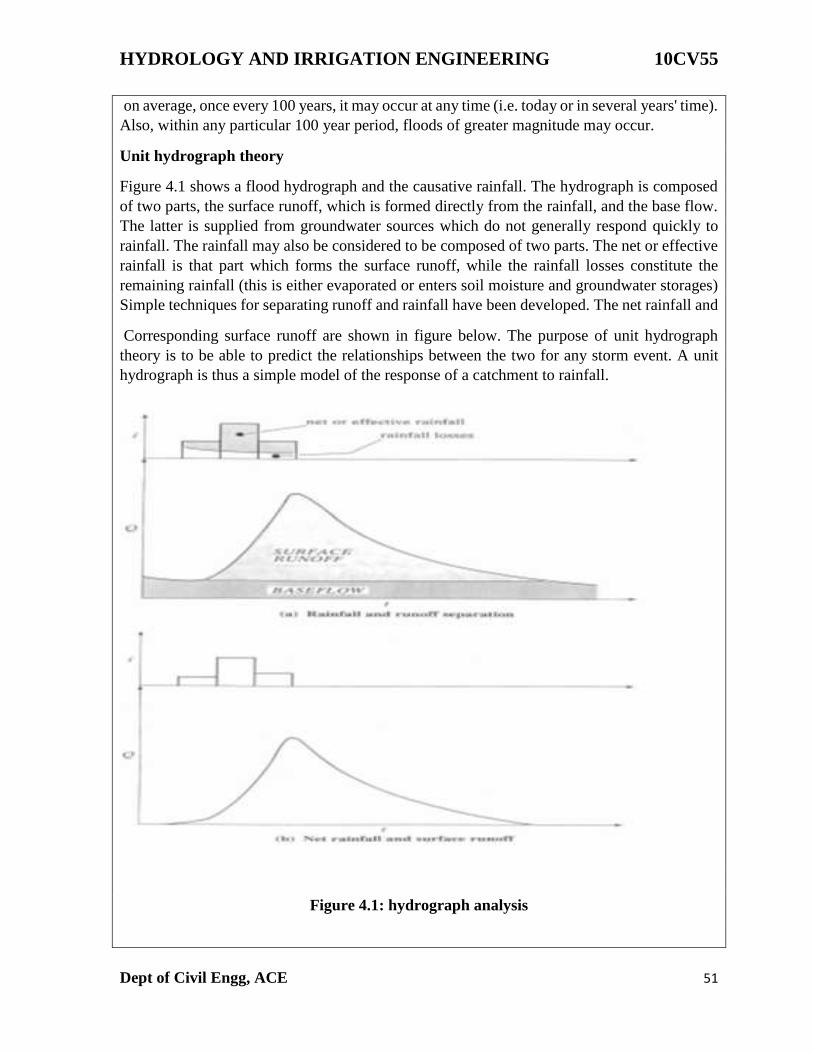
HYDROLOGY AND IRRIGATION ENGINEERING 10CV55
Dept of Civil Engg, ACE 51
on average, once every 100 years, it may occur at any time (i.e. today or in several years' time).
Also, within any particular 100 year period, floods of greater magnitude may occur.
Unit hydrograph theory
Figure 4.1 shows a flood hydrograph and the causative rainfall. The hydrograph is composed
of two parts, the surface runoff, which is formed directly from the rainfall, and the base flow.
The latter is supplied from groundwater sources which do not generally respond quickly to
rainfall. The rainfall may also be considered to be composed of two parts. The net or effective
rainfall is that part which forms the surface runoff, while the rainfall losses constitute the
remaining rainfall (this is either evaporated or enters soil moisture and groundwater storages)
Simple techniques for separating runoff and rainfall have been developed. The net rainfall and
Corresponding surface runoff are shown in figure below. The purpose of unit hydrograph
theory is to be able to predict the relationships between the two for any storm event. A unit
hydrograph is thus a simple model of the response of a catchment to rainfall.
Figure 4.1: hydrograph analysis
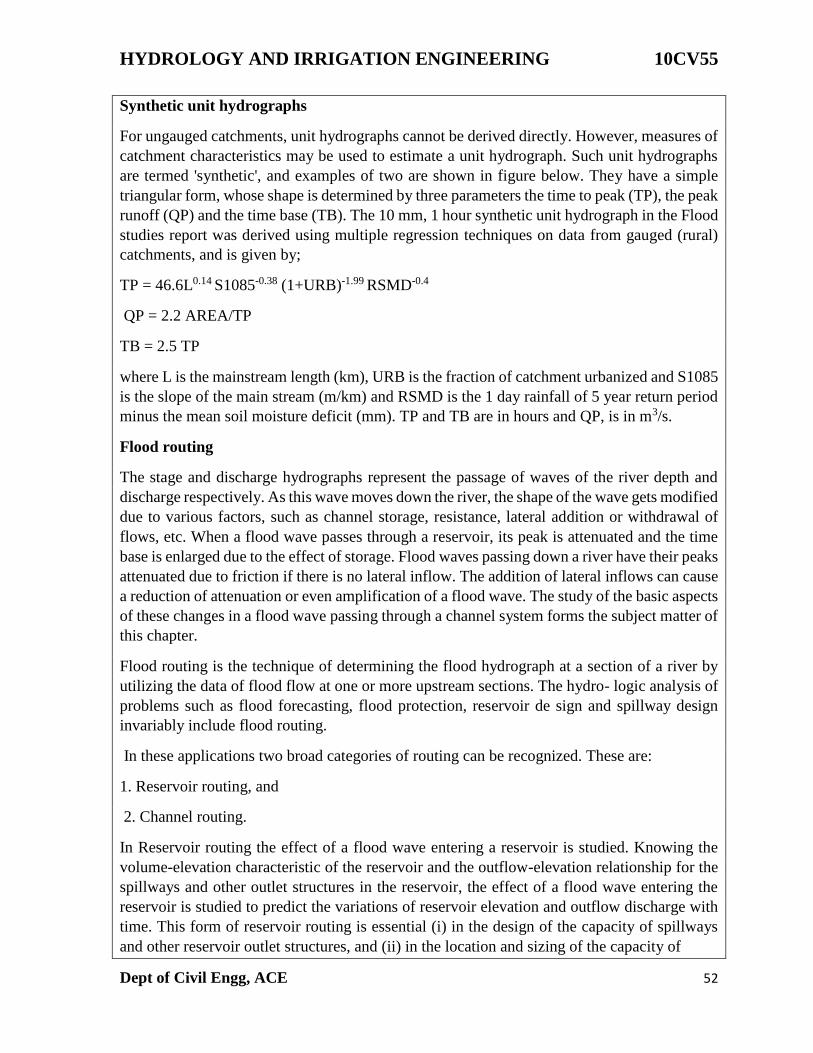
HYDROLOGY AND IRRIGATION ENGINEERING 10CV55
Dept of Civil Engg, ACE 52
Synthetic unit hydrographs
For ungauged catchments, unit hydrographs cannot be derived directly. However, measures of
catchment characteristics may be used to estimate a unit hydrograph. Such unit hydrographs
are termed 'synthetic', and examples of two are shown in figure below. They have a simple
triangular form, whose shape is determined by three parameters the time to peak (TP), the peak
runoff (QP) and the time base (TB). The 10 mm, 1 hour synthetic unit hydrograph in the Flood
studies report was derived using multiple regression techniques on data from gauged (rural)
catchments, and is given by;
TP = 46.6L0.14 S1085-0.38 (1+URB)-1.99 RSMD-0.4
QP = 2.2 AREA/TP
TB = 2.5 TP
where L is the mainstream length (km), URB is the fraction of catchment urbanized and S1085
is the slope of the main stream (m/km) and RSMD is the 1 day rainfall of 5 year return period
minus the mean soil moisture deficit (mm). TP and TB are in hours and QP, is in m3/s.
Flood routing
The stage and discharge hydrographs represent the passage of waves of the river depth and
discharge respectively. As this wave moves down the river, the shape of the wave gets modified
due to various factors, such as channel storage, resistance, lateral addition or withdrawal of
flows, etc. When a flood wave passes through a reservoir, its peak is attenuated and the time
base is enlarged due to the effect of storage. Flood waves passing down a river have their peaks
attenuated due to friction if there is no lateral inflow. The addition of lateral inflows can cause
a reduction of attenuation or even amplification of a flood wave. The study of the basic aspects
of these changes in a flood wave passing through a channel system forms the subject matter of
this chapter.
Flood routing is the technique of determining the flood hydrograph at a section of a river by
utilizing the data of flood flow at one or more upstream sections. The hydro- logic analysis of
problems such as flood forecasting, flood protection, reservoir de sign and spillway design
invariably include flood routing.
In these applications two broad categories of routing can be recognized. These are:
1. Reservoir routing, and
2. Channel routing.
In Reservoir routing the effect of a flood wave entering a reservoir is studied. Knowing the
volume-elevation characteristic of the reservoir and the outflow-elevation relationship for the
spillways and other outlet structures in the reservoir, the effect of a flood wave entering the
reservoir is studied to predict the variations of reservoir elevation and outflow discharge with
time. This form of reservoir routing is essential (i) in the design of the capacity of spillways
and other reservoir outlet structures, and (ii) in the location and sizing of the capacity of
HYDROLOGY AND IRRIGATION ENGINEERING 10CV55
Dept of Civil Engg, ACE 53
reservoirs to meet specific requirements. In Channel routing the change in the shape of a
hydrograph as it travels down a channel is studied. By considering a channel reach and an input
hydrograph at the upstream end, this form of routing aims to predict the flood hydrograph at
various sections of the reach. Information on the flood-peak attenuation and the duration of
high-water levels obtained by channel routing is of utmost importance in flood-forecasting
operations and flood-protection works.
A variety of routing methods are available and they can be broadly classified into two
categories as: (i) hydrologic routing, and (ii) hydraulic routing. Hydrologic-routing methods
employ essentially the equation of continuity. Hydraulic methods, on the other hand, employ
the continuity equation together with the equation of motion of unsteady flow. The basic
differential equations used in the hydraulic routing, known as St. Venant equations afford a
better description of unsteady flow than hydrologic methods.
Flood routing
So far, the discussion has centred on methods of estimating flood events at a given location.
However, the engineer requires estimates of both the stage and discharge along a watercourse
resulting from the passage of a flood wave. The technique of flood routing is used for this
purpose. There are two distinct kinds of problem:
(a) Reservoir routing: to find the outflow hydrograph over the spillway from the inflow
hydrograph.
(b) Channel routing: to find the outflow hydrograph from a river reach from the inflow
hydrograph.
In each case the peak flow of the outflow hydrograph is less than and later than that of the
inflow hydrograph. These processes are referred to as attenuation and translation, respectively.
To determine the outflow hydrograph from the inflow hydrograph requires the application of
the continuity equation in the form:
I - O = dV/dt
Where I is the inflow rate, O the outflow rate, V is the volume and t is time.
HYDROLOGIC CHANNEL ROUTING
In reservoir routing presented in the previous sections, the storage was a unique function of
the outflow discharge, S=f(Q). However, in channel routing the storage is a function of both
outflow and inflow discharges and hence a different routing method is needed. The flow in a
river during a flood belongs to the category of gradually varied unsteady flow. The water
surface in a channel reach is not only not parallel to die channel bottom but also varies with
time . Considering a channel reach having a flood flow, the total volume in storage can be
considered under two categories as
HYDROLOGY AND IRRIGATION ENGINEERING 10CV55
Dept of Civil Engg, ACE 54
1. Prism storage
2. Wedge storage
Inflow
Figure 4.2 Prism Storage and Wedge Storage
PRISM STORAGE
It is the volume that would exist if the uniform flow occurred at the downstream depth, i.e.
the volume formed by an imaginary plane parallel to the channel bottom drawn at the
outflow section water surface.
WEDGE STORAGE
It is the wedge-like volume formed between the actual water surface profile and the top
surface of the prism storage.
At a fixed depth at a downstream section of a river reach, the prism storage is constant while
the wedge storage changes from a positive value at an advancing flood to a negative value
during a receding flood. The prism storage Sp is similar to a reservoir and can be expressed
as a function of the outflow discharge, Sp = f(Q). The wedge storage can be accounted for by
expressing it as Sw =/(/). The total storage in the channel reach can then be expressed as
HYDROLOGY AND IRRIGATION ENGINEERING 10CV55
Dept of Civil Engg, ACE 55
S= K(xIm+ (1-x)Qm)
Using m=1.0, equation reduces to a linear relationship for S in terms of I and Q as
S=K(xI+(1-x)Q)
And this relationship is known as the Muskingum equation .
In this parameter x is known as weight age factor and takes a values between 9 and 0.5.
when x=0, obviously the storage is a function of discharge only and equation reduces to
S = KQ
Such a storage is known as linear storage or linear reservoir. When x = 0.5 both the inflow
and outflow are equally important in determining the storage.
The coefficient K is known as storage-time constant and has the dimensions o time. It is
approximately equal to the time of travel of a flood wave through the channel reach.
FLOOD CONTROL
The term flood control is commonly used to denote all the measures adopted to reduce
damages to life and property by floods. Currently, many people prefer to use the term flood
management instead of flood control as it reflects the activity more realistically. As there is
always a possibility, however remote it may be, of an extremely large flood occurring in a
river the complete control of the flood to a level of zero losfs is neither physically possible
nor economically feasible. The flood control measures that are to use can be classified as:
1. Structural measures:
• Storage and detention reservoirs • Levees (flood embankments)
• Flood ways (new channels) • Channel improvement
• Watershed management
2. Non-structural methods:
• Flood plain zoning •Flood forecast/warning
• Evacuation and relocation • Flood insurance
STRUCTURAL METHODS
Storage Reservoirs: Storage reservoirs offer one of the most reliable and effective methods of
flood control. Ideally, in this method, a part of the storage in the reservoir is kept apart to
absorb the incoming flood. Further, the stored water is released in a controlled way over an
HYDROLOGY AND IRRIGATION ENGINEERING 10CV55
Dept of Civil Engg, ACE 56
extended time so that downstream channels do not get flooded. Figure shows an ideal
operating plan of a flood control reservoir. As most of the present-day storage reservoirs have
multipurpose commitments, the manipulation of reservoir levels to satisfy many conflicting
demands is a very difficult and complicated task. It so happens that many storage reservoirs
while reducing the floods and flood damages do not always aim at achieving optimum benefits
in the flood-control aspect. To achieve complete flood control in the entire length of the river,
a large number of reservoirs at strategic locations in the catchment will be necessary.
DETENTION RESERVOIRS
A detention reservoir consists of an obstruction to river with an uncontrolled outlet. These are
essentially small structures and operate t reduce the flood peak by providing temporary storage
and by restriction of the outflow rate. These structures are not common in India.
LEVEES: Levees, also known as dikes or flood embankments are earthen banks constructed
parallel to the course of the river to confine it to a fixed course and limited cross-sectional
width. The heights of levees will be higher than the design flood level with sufficient free
board. The confinement of the river to a fixed path frees large tracts of land from inundation
and consequent damage
Levees are one of the oldest and most common methods of flood-protection works adapted to
the world. Also, they are probably the Cheapest of structural flood-control measures. While
the protection offered by a levee against food damage is obvious, what is not often appreciated
is the potential damage in the event of a levee failure. The levees, being earth embankments
require considerable care and maintenance, In the event of being overtopped, they fail and the
damage caused can be enormous. In fact, the sense of protection offered by a levee encourages
economic activity along the embankment and if the levee is overtopped the loss would be more
than what would have been if there were no levees. Confinement of flood banks of a river by
levees to a narrower space leads to higher flood levels for a given discharge. Further, if the bed
levels of the river also rise, as they do in aggrading rivers, the top of the levees have to be
raised at frequent time intervals to keep up its safety margin.
The design of a levee is a major task in which costs and economic benefits have to be
considered. The cross-section of a levee will have to be designed like an earth dam. Regular
maintenance and contingency arrangements to fight floods are absolutely necessary to keep
the levees functional.
Masonry structures used to confine the river in a manner similar to levees are known as flood
walls. These are used to protect important structures against floods, especially where the land
is at a premium.
FLOOD WA YS
Floodways are natural channels into which a part of the flood will be diverted during high
stages. A floodway can be a natural or man-made channel and its location is controlled
essentially by the topography. Generally, wherever they are feasible, floodways offer an
economical alternative to other structural flood-control measures. To reduce the level of the
HYDROLOGY AND IRRIGATION ENGINEERING 10CV55
Dept of Civil Engg, ACE 57
river Jhelum at Srinagar, a supplementary channel has been constructed to act as a floodway
with a capacity of 300 m3/s. This channel is located 5 km upstream of Srinagar city and has its
outfall in lake Wullar. In Andhra Pradesh a floodway has been constructed to transfer a part of
the flood waters of the river Budamaru to river Krishna to prevent flood damages to the urban
areas lying on the downstream reaches of the river Budamaru.
CHANNEL IMPROVEMENT:
The works under this category involve:
1. Widening or deepening of the channel to increase the cross-sectional area.
2. Reduction of the channel roughness, by clearing of vegetation from the channel perimeter.
3. Short circuiting of meander loops by cutoff channels, leading to increased slopes.
All these three methods are essentially short-term measures and require continued
maintenance.
WATERSHED MANAGEMENT: Watershed management and land treatment in the
catchment aims at cutting down and delaying the runoff before it gets into the river. Watershed
management measures include developing the vegetative and soil cover in conjunction with
land treatment words like Nalabunds, check dams, contour bunding, zing terraces etc. These
measures are towards improvement of water infiltration capacity of the soil and reduction of
soil erosion. These treatments cause increased infiltration, greater evapotranspiration and
reduction in soil erosion; all leading to moderation of the peak flows and increasing of dry
weather flows. Watershed treatment is nowadays an integral part of flood management. It is
believed that while small and medium floods are reduced by watershed management measures,
the magnitude of extreme floods are unlikely to be affected by these measures.
NON-STRUCTURALMETHODS The flood management strategy has to include the
philosophy of Living with the floods. The following non-structural measures encompass this
aspect.
FLOOD PLAIN ZONING: When the river discharges are very high, it is to be expected that
the river will overflow its banks and spill into flood plains. In view of the increasing pressure
of population this basic aspects of the river are disregarded and there are greater encroachment
of flood plains by man leading to distress. Flood plain management identifies the flood prone
areas of a river and regulates the land use to restrict the damage due to floods. The locations
and extent of areas likely to be affected by floods of different return periods are identified and
development plans of these areas are prepared in such a manner that the resulting damages due
to floods are within acceptable limits of risk. Figure shows a conceptual zoning of a flood
prone area.
FLOOD FORECASTING AND WARNING
Forecasting of floods sufficiently in advance enables a warning to be given to the people likely
to be affected and further enables civil authorities to take appropriate precautionary measures.
HYDROLOGY AND IRRIGATION ENGINEERING 10CV55
Dept of Civil Engg, ACE 58
It thus forms a very important and relatively inexpensive non-structural flood management
measure. However, it must be realized that a flood warning is meaningful only if it is given
sufficiently in advance. Further, erroneous warnings will cause the populace to lose confidence
and faith in the system. Thus the dual requirements of reliability and advance notice are the
essential ingredients of a flood-forecasting system.
The flood forecasting techniques can be broadly divided into three categories:
(i) Short range forecasts
(ii) Medium range forecasts
(iii) Long range forecasts.
Short-Range Forecasts
In this the river stages at successive stations on a river are correlated with hydrological
parameters, such as rainfall over the local area, antecedent precipitation index, and variation
of the stage at the upstream base point during the travel time of a flood. This method can give
advance warning of 12-40 hours for floods. The flood forecasting used for the metropolitan
city of Delhi is based on this technique.
Medium-Range Forecasts In this method rainfall-runoff relationships are used to predict flood
levels with warning of 2-5 days. Coaxial graphical correlations of runoff, with rainfall and
other parameters like the time of the year, storm duration and antecedent wetness have been
developed to a high stage of refinement by the US Weather Bureau.
Long-Range Forecasts: Using radars and meteorological satellite data, advance information
about critical storm-producing weather systems, their rain potential and time of occurrence of
the event are predicted well in advance.
EVACUATION AND RELOCATION: Evacuation of communities along with their live
stocks and other valuables in the chronic flood affected areas and relocation of them in nearby
safer locations is an area specific measure of flood management. This would be considered as
non-structural measure when this activity is a temporary measure confined to high floods.
However, permanent shifting of communities to safer locations would be termed as structural
measure. Raising the elevations of buildings and public utility installations above normal flood
levels is termed as flood proofing and is sometimes adopted in coastal areas subjected to severe
cyclones.
FLOOD INSURANCE Flood insurance provides a mechanism for spreading the loss over
large numbers of individuals and thus modifies the impact of loss burden. Further, it helps,
though indirectly, flood plain zoning, flood forecasting and disaster preparedness activities.
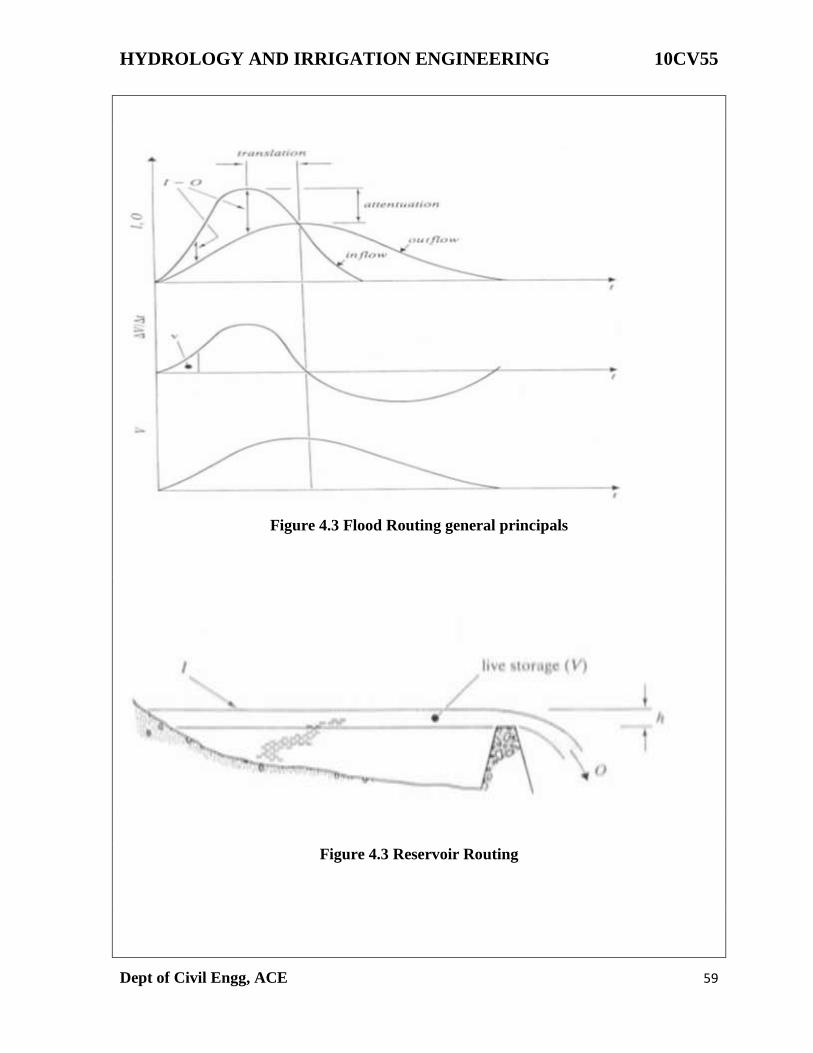
HYDROLOGY AND IRRIGATION ENGINEERING 10CV55
Dept of Civil Engg, ACE 59
Figure 4.3 Flood Routing general principals
Figure 4.3 Reservoir Routing
HYDROLOGY AND IRRIGATION ENGINEERING 10CV55
Dept of Civil Engg, ACE 60
UNIT 5
IRRIGATION ENGINEERING
Introduction:
Irrigation may be defined as the process of artificially supplying water to the soil for raising
crops. It is a science of planning and designing an efficient low cost irrigation system to suite
the natural conditions. It is the engineering of controlling and harnessing the various natural
sources of water by the construction of dams and reservoirs, canals and head works and finally
distributing the water to the agricultural fields. Irrigation engineering includes the study and
design of works connected with river control, drainage of water logged areas and generations
of hydroelectric power.
Necessity or Importance of Irrigation:
India is basically an agricultural country and its resources on depend on the agricultural output.
Prosperity of our country depends mainly upon proper development of agriculture. Even after
60 years of Independence, we have not succeeded in solving our food problems. The main
reason for this miserable state of affair is that we still continue to remain at the mercy of rain
and practice age old methods of cultivation.
Plants usually derive water from nature through rainfall. However, the total rainfall in a
particular area may be either insufficient or ill timed. In order to get the maximum yield, it is
necessary to have a systematic irrigation system for supplying optimum quantity of water at
correct timing.
Importance of irrigation can be summarized under the following four aspects:
1. Area of less rainfall: Artificial supply of water is necessary when the total rainfall is less
than the water requirement of crops in such cases, irrigation works may be constructed at a
place where more water is available and conveyed to water deficit areas.
Eg: The Rajasthan canal supplies water from the river Yamuna to the arid regions of Rajasthan
where annual rainfall is less than 100 to 200 mm.
2. Non-Uniform rainfall: The rainfall in a particular area may not be uniform over the entire
crop period. Rainfall may be there during the early period of crops and may become scanty or
unavailable at the end resulting in lesser yield or total loss of the crop. Collection of water
during periods of excess rainfall and supplying the stored water during periods of scarcity may
prove beneficial to the farmers. Most irrigation projects in India are based on this aspect.
3. Commercial crops with additional water: The rainfall in a particular area may be sufficient
to raise the usual crops but insufficient for raising commercial and cash crops such as sugarcane
and cotton. In such situations, utilizing stored water by irrigation facilities is advantageous.
HYDROLOGY AND IRRIGATION ENGINEERING 10CV55
Dept of Civil Engg, ACE 61
4. Controlled Water Supply: Dams are normally meant for storing water during excess flow
periods. But in situations of heavy rainfall, flooding can be controlled by arresting the flow in
the river and excess water can be released during low flow conditions.
Benefits of Irrigation:
There are many direct and indirect benefits or advantages of irrigation which can be listed as
follows.
1. Increase in food production: Crops need optimum quantity of water at required intervals
assured and timely supply of water helps in achieving good yield and also superior crops can
be grown and thus, the value of the crops increases.
2. Protection from famine: Irrigation works can be constructed during famine (drought). This
helps in employment generation and people also get protection from famine. After completion
of such works, continuous water supply may be available for crops and people.
3. Cultivation of Cash crops: With the availability of continuous water supply, cash crops such
as sugarcane, indigo, tobacco, cotton etc. can be grown.
4. Increase in prosperity of people: Due to assured water supply people can get good yield and
returned for their crops. Land value increases and this raises the standard of living of the people
and hence prosperity takes place.
5. Generation of hydroelectric power: Major river valley projects are designed to provide
power generation facilities also apart from irrigation needs.
6. Domestic and Industrial water supply: Water stored in reservoirs can also be used to serve
other purposes like domestic water supply to towns and cities and also for industrial use. Canals
can also be effectively used to serve these purposes.
7. Inland Navigation: In some cases, the canals are very large enough to be used as channels
for inland navigation as water ways are the cheapest means of transportation.
8. Improvement in communication: Main canals in large irrigation projects are provided with
inspection roads all along the sides. These roads can be asphalted and used as a means of
communication.
9. Canal plantation: Due to continuous flow of water adjoining areas of a canal are always
saturated with water. In such places, trees can be planted which increases the timber wealth of
the country.
10. Improvement in ground water storage: Due to constant percolation and seepage of
irrigation water, ground water table rises. The ground water may percolate and may be
beneficial to other areas.
11. Aid in civilization: Due to introduction of river valley projects, tribal people can adopt
agriculture as their profession which helps in improving the standards of living.
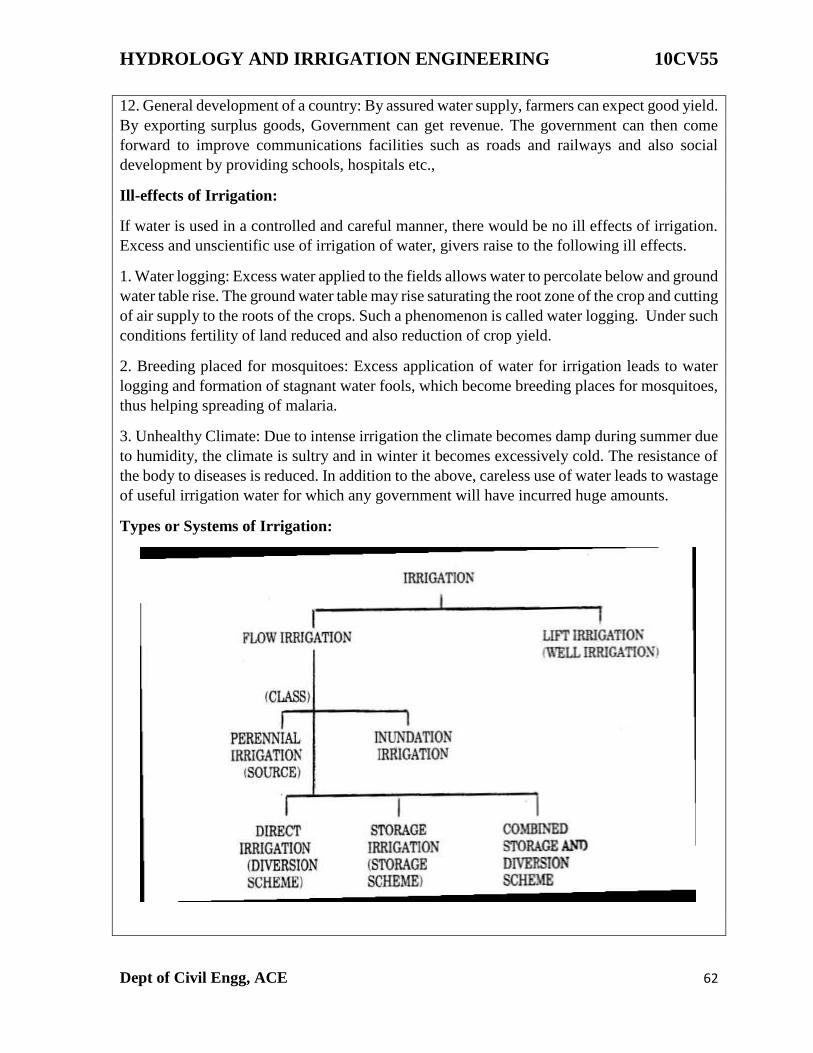
HYDROLOGY AND IRRIGATION ENGINEERING 10CV55
Dept of Civil Engg, ACE 62
12. General development of a country: By assured water supply, farmers can expect good yield.
By exporting surplus goods, Government can get revenue. The government can then come
forward to improve communications facilities such as roads and railways and also social
development by providing schools, hospitals etc.,
Ill-effects of Irrigation:
If water is used in a controlled and careful manner, there would be no ill effects of irrigation.
Excess and unscientific use of irrigation of water, givers raise to the following ill effects.
1. Water logging: Excess water applied to the fields allows water to percolate below and ground
water table rise. The ground water table may rise saturating the root zone of the crop and cutting
of air supply to the roots of the crops. Such a phenomenon is called water logging. Under such
conditions fertility of land reduced and also reduction of crop yield.
2. Breeding placed for mosquitoes: Excess application of water for irrigation leads to water
logging and formation of stagnant water fools, which become breeding places for mosquitoes,
thus helping spreading of malaria.
3. Unhealthy Climate: Due to intense irrigation the climate becomes damp during summer due
to humidity, the climate is sultry and in winter it becomes excessively cold. The resistance of
the body to diseases is reduced. In addition to the above, careless use of water leads to wastage
of useful irrigation water for which any government will have incurred huge amounts.
Types or Systems of Irrigation:
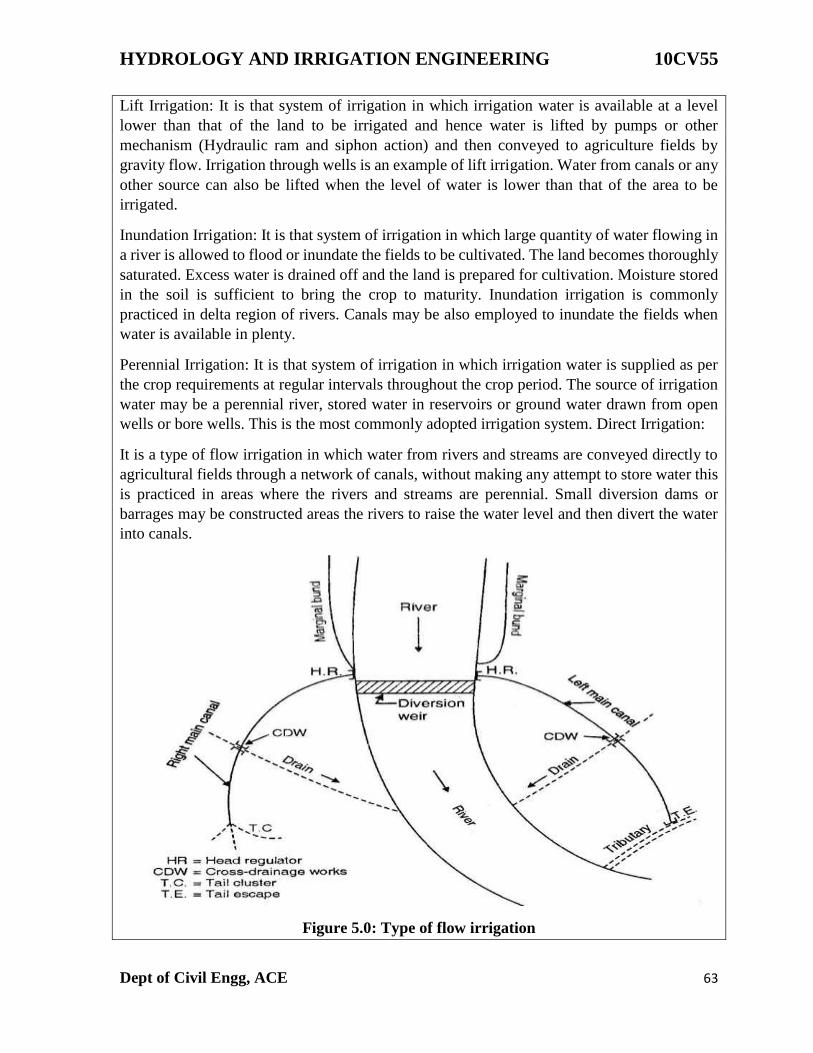
HYDROLOGY AND IRRIGATION ENGINEERING 10CV55
Dept of Civil Engg, ACE 63
Lift Irrigation: It is that system of irrigation in which irrigation water is available at a level
lower than that of the land to be irrigated and hence water is lifted by pumps or other
mechanism (Hydraulic ram and siphon action) and then conveyed to agriculture fields by
gravity flow. Irrigation through wells is an example of lift irrigation. Water from canals or any
other source can also be lifted when the level of water is lower than that of the area to be
irrigated.
Inundation Irrigation: It is that system of irrigation in which large quantity of water flowing in
a river is allowed to flood or inundate the fields to be cultivated. The land becomes thoroughly
saturated. Excess water is drained off and the land is prepared for cultivation. Moisture stored
in the soil is sufficient to bring the crop to maturity. Inundation irrigation is commonly
practiced in delta region of rivers. Canals may be also employed to inundate the fields when
water is available in plenty.
Perennial Irrigation: It is that system of irrigation in which irrigation water is supplied as per
the crop requirements at regular intervals throughout the crop period. The source of irrigation
water may be a perennial river, stored water in reservoirs or ground water drawn from open
wells or bore wells. This is the most commonly adopted irrigation system. Direct Irrigation:
It is a type of flow irrigation in which water from rivers and streams are conveyed directly to
agricultural fields through a network of canals, without making any attempt to store water this
is practiced in areas where the rivers and streams are perennial. Small diversion dams or
barrages may be constructed areas the rivers to raise the water level and then divert the water
into canals.
Figure 5.0: Type of flow irrigation
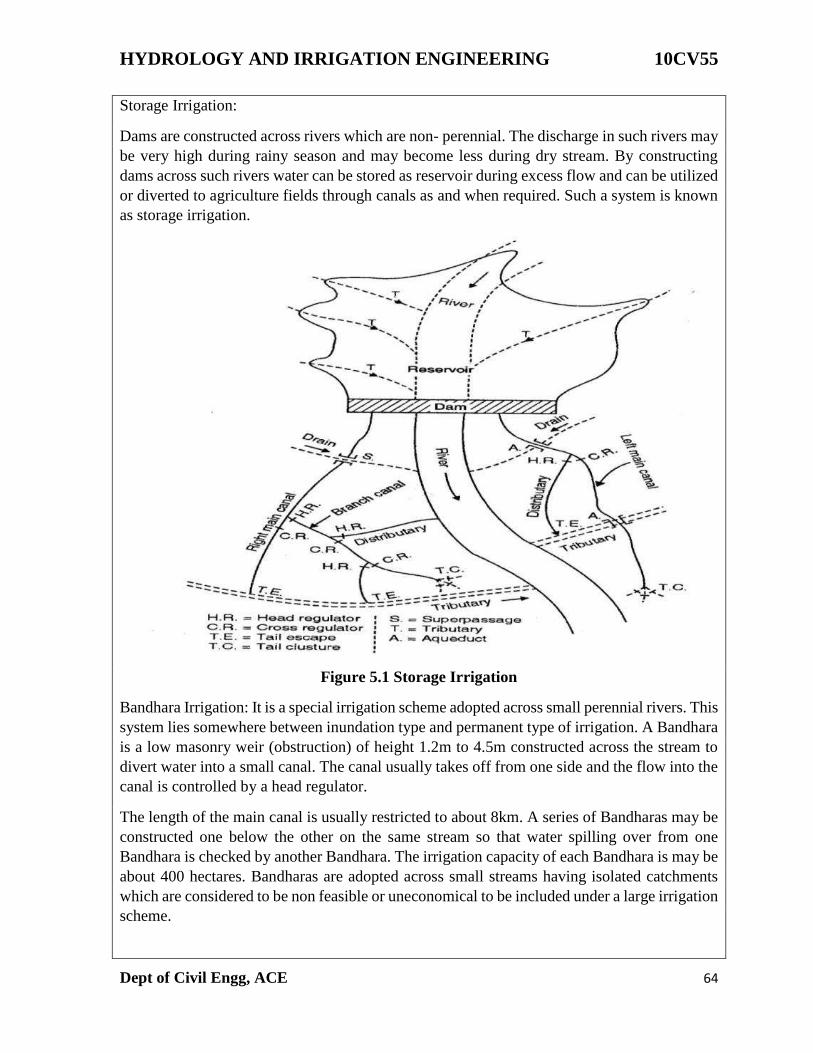
HYDROLOGY AND IRRIGATION ENGINEERING 10CV55
Dept of Civil Engg, ACE 64
Storage Irrigation:
Dams are constructed across rivers which are non- perennial. The discharge in such rivers may
be very high during rainy season and may become less during dry stream. By constructing
dams across such rivers water can be stored as reservoir during excess flow and can be utilized
or diverted to agriculture fields through canals as and when required. Such a system is known
as storage irrigation.
Figure 5.1 Storage Irrigation
Bandhara Irrigation: It is a special irrigation scheme adopted across small perennial rivers. This
system lies somewhere between inundation type and permanent type of irrigation. A Bandhara
is a low masonry weir (obstruction) of height 1.2m to 4.5m constructed across the stream to
divert water into a small canal. The canal usually takes off from one side and the flow into the
canal is controlled by a head regulator.
The length of the main canal is usually restricted to about 8km. A series of Bandharas may be
constructed one below the other on the same stream so that water spilling over from one
Bandhara is checked by another Bandhara. The irrigation capacity of each Bandhara is may be
about 400 hectares. Bandharas are adopted across small streams having isolated catchments
which are considered to be non feasible or uneconomical to be included under a large irrigation
scheme.

HYDROLOGY AND IRRIGATION ENGINEERING 10CV55
Dept of Civil Engg, ACE 65
Figure 5.2 Bandhara irrigation layout
This method of irrigation is followed in Central Maharashtra and is commonly known there as
the ‘Phad’ system. Advantages of Bandharas:
1. Small quantity of flow in streams can be fully utilized or otherwise might have gone as a
waste.
2. As the length of the canal is short, seepage and evaporation losses are less.
3. Intensive irrigation with high duty may be achieved and the area to be irrigated is close to
the source
4. The initial investment and maintenance cost of the system is low.
Disadvantages of Bandharas:
1. The supply of water is unreliable when the flow in streams becomes lesser.
2. Excess water available cannot be utilized as area for cultivation below each Bandhara is
fixed.
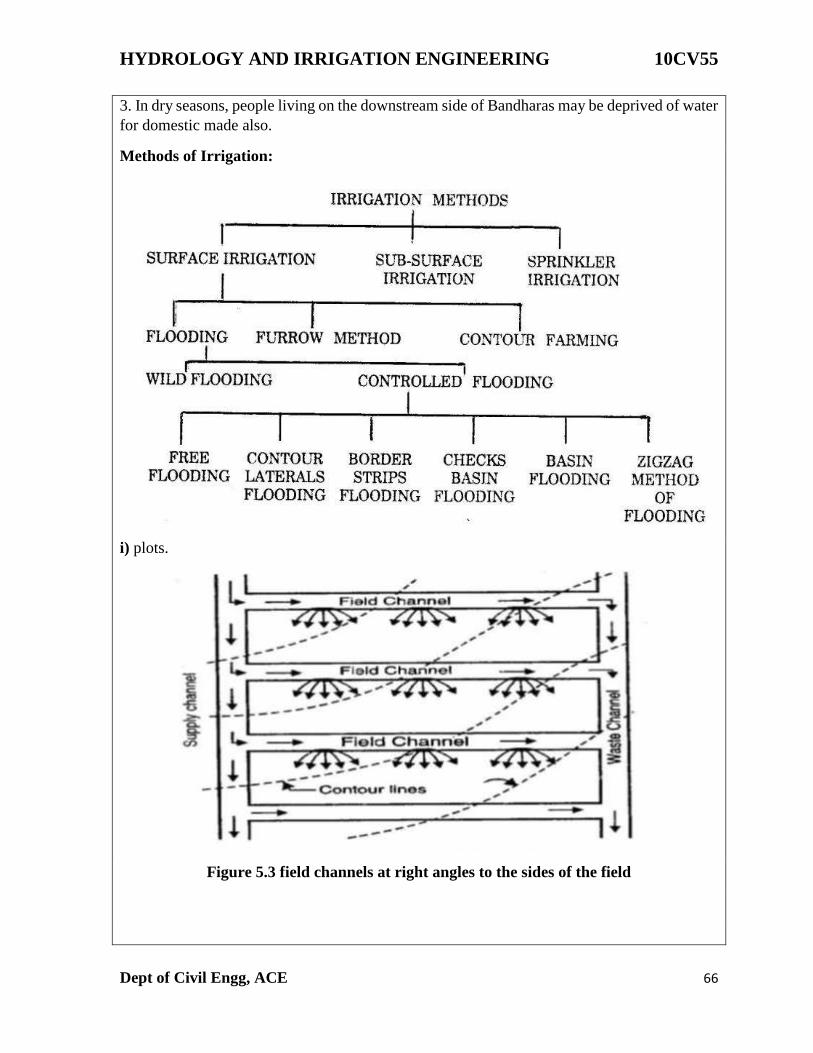
HYDROLOGY AND IRRIGATION ENGINEERING 10CV55
Dept of Civil Engg, ACE 66
3. In dry seasons, people living on the downstream side of Bandharas may be deprived of water
for domestic made also.
Methods of Irrigation:
i) plots.
Figure 5.3 field channels at right angles to the sides of the field
HYDROLOGY AND IRRIGATION ENGINEERING 10CV55
Dept of Civil Engg, ACE 67
Irrigation water may be applied to the crops by three basic methods, viz.
a. Surface irrigation methods
b. Subsurface irrigation methods
c. Sprinkler irrigation
Good irrigation methods result in increased yield, conservation of soil productivity and
economic utilization of water. Over irrigation results in soil erosion, water logging, salt
accumulation, nutrient leeching etc. The overall objective of an irrigation method is to see that
the required amount of moisture is available in the root zone of the crops. The objectives or
reasons for adopting any irrigation method for applying water to fields are as follows.
1. For light irrigation uniform water distribution with a small depth of application, as small as
cm should be possible
2. For heavy irrigation uniform water depth application of 15 to 20 cm should be possible.
3. Large concentrated flow should be possible for reducing conveyance losses and labour costs.
4. Mechanical farming should be facilitated.
a. Surface irrigation method: In this method the irrigation water is applied by spreading water
as a sheet or as a small stream on the land to be irrigated. Various surface irrigation methods
that are practiced are listed as follows.
1. Wild flooding: In this method water is applied by spreading water over the land to be
irrigated without any preparation. There is no restriction for the movement of water. It follows
the natural slope of the land. The water may be applied to the land directly from a natural
stream during season of high flow as in inundation irrigation. This method is suitable for flat
and smooth land but involves wastage of water and hence it can be practiced where water is
abundant and inexpensive.
2. Controlled flooding: In this method water is applied by spreading it over the land to be
irrigated with proper control over the flow of water and as well as the quantity of water to be
applied. In such methods prior land preparation is essential.
Various controlled flooding methods are as follows.
i)Free flooding: This method is also known as irrigation by plots. Here the field is divided
into a number of small sized plots which are practically level. Water is admitted at the higher
end of the plots and the water supply is cut off as soon as the water reaches the lower end of
the plots.
ii) Border strip method: In this method the land to be irrigated is divided into a series of long
narrow strips separated from each other by levees (Earthen bunds) or borders. The width of the
strips varies between 10 to 20 m and the length of the strip varies between 60 to 300 m
depending upon the nature of the soil and rate of water supply.
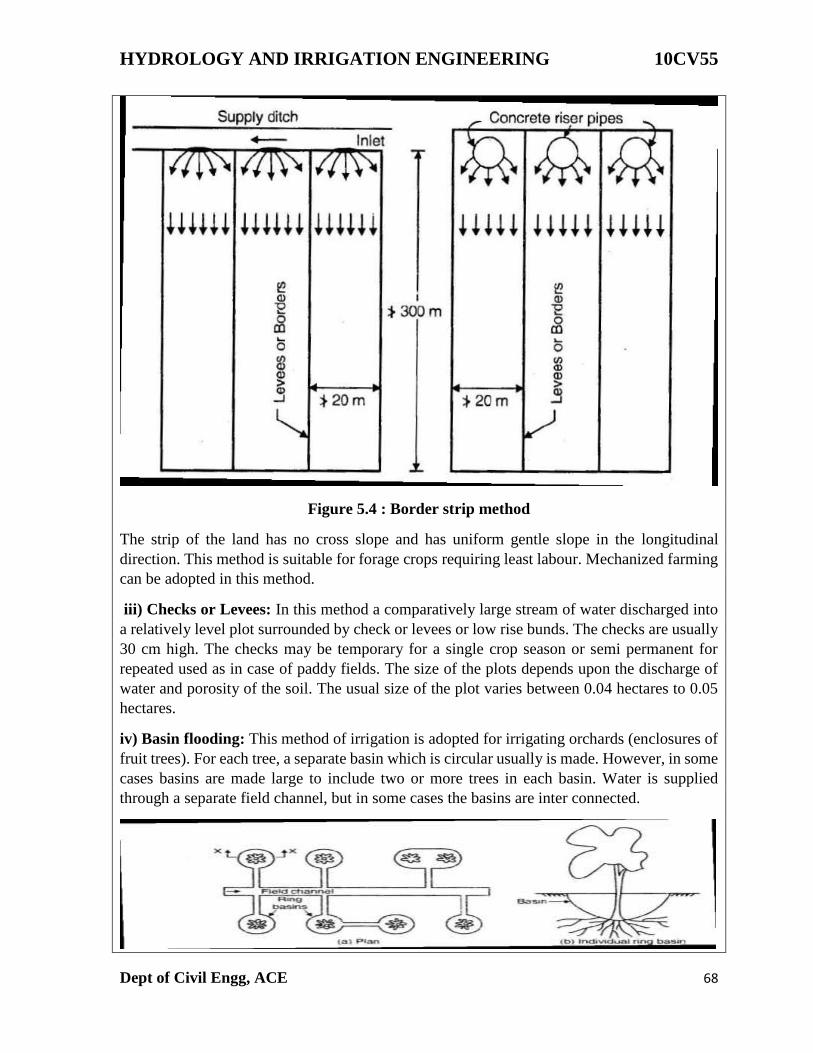
HYDROLOGY AND IRRIGATION ENGINEERING 10CV55
Dept of Civil Engg, ACE 68
Figure 5.4 : Border strip method
The strip of the land has no cross slope and has uniform gentle slope in the longitudinal
direction. This method is suitable for forage crops requiring least labour. Mechanized farming
can be adopted in this method.
iii) Checks or Levees: In this method a comparatively large stream of water discharged into
a relatively level plot surrounded by check or levees or low rise bunds. The checks are usually
30 cm high. The checks may be temporary for a single crop season or semi permanent for
repeated used as in case of paddy fields. The size of the plots depends upon the discharge of
water and porosity of the soil. The usual size of the plot varies between 0.04 hectares to 0.05
hectares.
iv) Basin flooding: This method of irrigation is adopted for irrigating orchards (enclosures of
fruit trees). For each tree, a separate basin which is circular usually is made. However, in some
cases basins are made large to include two or more trees in each basin. Water is supplied
through a separate field channel, but in some cases the basins are inter connected.
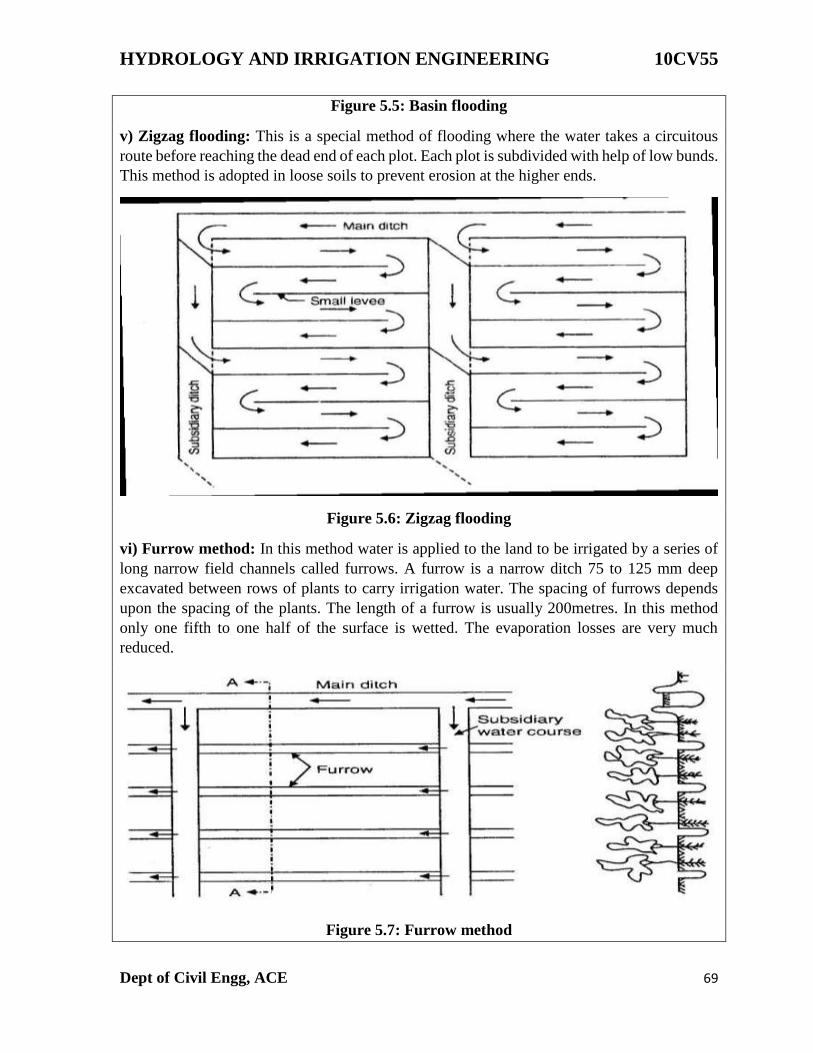
HYDROLOGY AND IRRIGATION ENGINEERING 10CV55
Dept of Civil Engg, ACE 69
Figure 5.5: Basin flooding
v) Zigzag flooding: This is a special method of flooding where the water takes a circuitous
route before reaching the dead end of each plot. Each plot is subdivided with help of low bunds.
This method is adopted in loose soils to prevent erosion at the higher ends.
Figure 5.6: Zigzag flooding
vi) Furrow method: In this method water is applied to the land to be irrigated by a series of
long narrow field channels called furrows. A furrow is a narrow ditch 75 to 125 mm deep
excavated between rows of plants to carry irrigation water. The spacing of furrows depends
upon the spacing of the plants. The length of a furrow is usually 200metres. In this method
only one fifth to one half of the surface is wetted. The evaporation losses are very much
reduced.
Figure 5.7: Furrow method
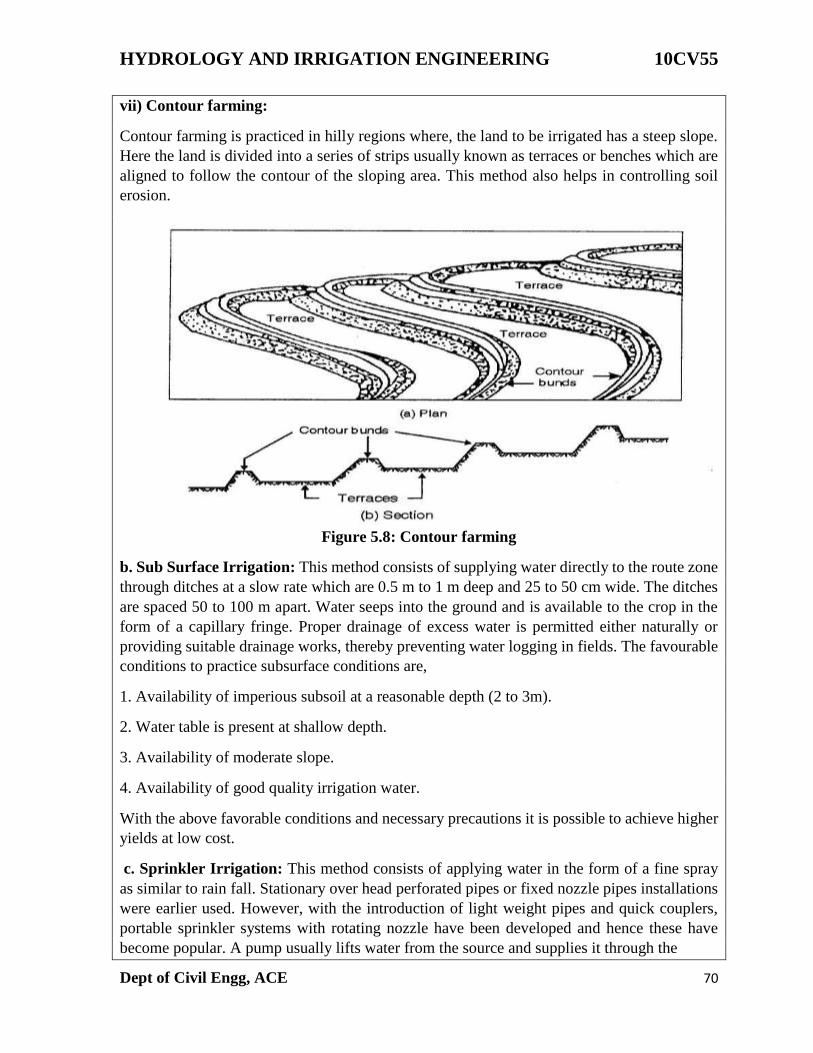
HYDROLOGY AND IRRIGATION ENGINEERING 10CV55
Dept of Civil Engg, ACE 70
vii) Contour farming:
Contour farming is practiced in hilly regions where, the land to be irrigated has a steep slope.
Here the land is divided into a series of strips usually known as terraces or benches which are
aligned to follow the contour of the sloping area. This method also helps in controlling soil
erosion.
Figure 5.8: Contour farming
b. Sub Surface Irrigation: This method consists of supplying water directly to the route zone
through ditches at a slow rate which are 0.5 m to 1 m deep and 25 to 50 cm wide. The ditches
are spaced 50 to 100 m apart. Water seeps into the ground and is available to the crop in the
form of a capillary fringe. Proper drainage of excess water is permitted either naturally or
providing suitable drainage works, thereby preventing water logging in fields. The favourable
conditions to practice subsurface conditions are,
1. Availability of imperious subsoil at a reasonable depth (2 to 3m).
2. Water table is present at shallow depth.
3. Availability of moderate slope.
4. Availability of good quality irrigation water.
With the above favorable conditions and necessary precautions it is possible to achieve higher
yields at low cost.
c. Sprinkler Irrigation: This method consists of applying water in the form of a fine spray
as similar to rain fall. Stationary over head perforated pipes or fixed nozzle pipes installations
were earlier used. However, with the introduction of light weight pipes and quick couplers,
portable sprinkler systems with rotating nozzle have been developed and hence these have
become popular. A pump usually lifts water from the source and supplies it through the
HYDROLOGY AND IRRIGATION ENGINEERING 10CV55
Dept of Civil Engg, ACE 71
distribution system and then through the sprinkler nozzle or sprinkler head mounted on the
riser pipes. About, 80 % irrigation efficiency is possible with sprinkler irrigation, particularly
in semi-arid and humid regions. The efficiency of this system decreases by 5 % for every 7.5
km/hour of increase in wind velocity.
Note: Irrigation efficiency (𝜂) is given as,
𝜂= (𝑤𝑠
𝑤𝑝×100) %
Where
𝑤𝑠 - represents amount of irrigation water stored in root zone
𝑤𝑝 - amount of water pumped or supplied into the system.
Sprinkler irrigation method is adopted in regions where, surface irrigation methods cannot be
used due to the following reasons.
1. The soil is too pervious or impervious.
2. The nature of the soil is too erosive.
3. The topography is not uniform or very steep.
4. The land is not suitable for surface irrigation method.
Advantages:
1. Soil erosion is well controlled by adjusting the discharge through the nozzle.
2. Uniform water application is possible.
3. In case of seedlings and young plants, light irrigation is possible easily.
4. Much land preparation is not essential and hence labour cost is reduced.
5. More land for cropping is available since borders and ditches are not required.
6. Small amounts of irrigation water in water scarcity regions can be effectively utilized.
Disadvantages:
1. Wind will distort the sprinkling pattern.
2. Constant water supply under pressure is required for economic use of equipment.
3. Irrigation water must be free from silt, sand and impurities.
4. Initial investment is high.
5. Energy requirement for pumping water is high.
6. Heavy soil with poor infiltration (clayey soil) cannot be irrigated efficiently.
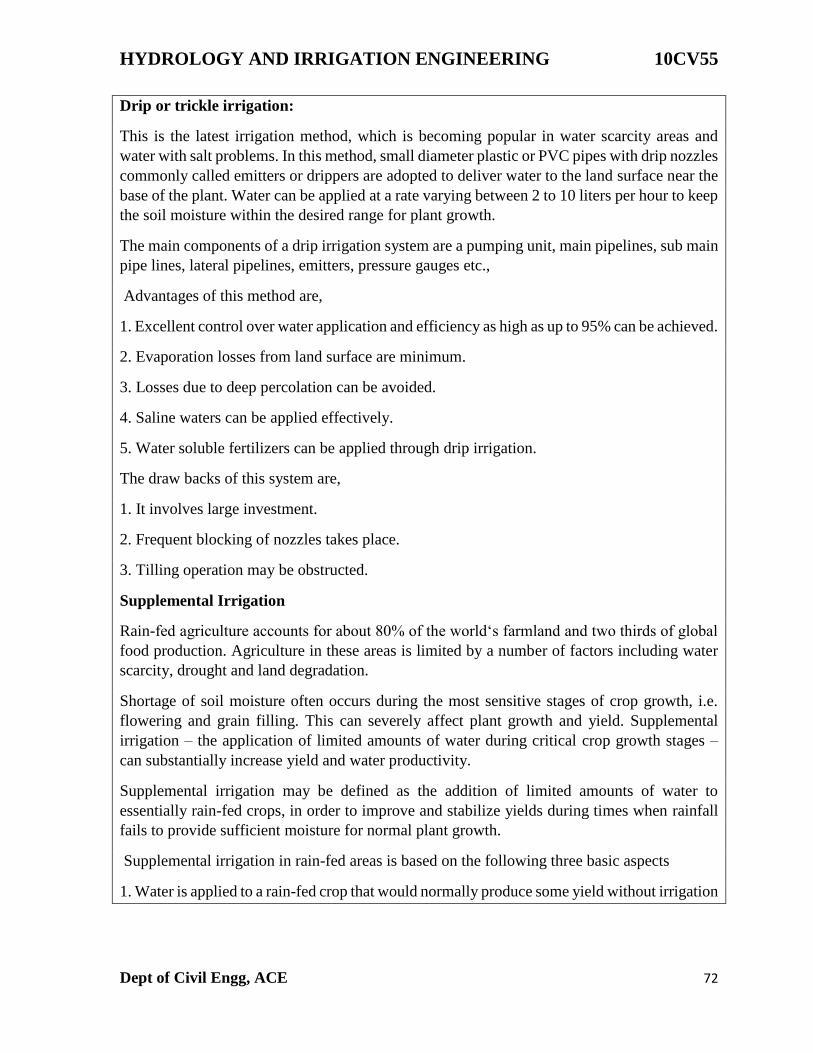
HYDROLOGY AND IRRIGATION ENGINEERING 10CV55
Dept of Civil Engg, ACE 72
Drip or trickle irrigation:
This is the latest irrigation method, which is becoming popular in water scarcity areas and
water with salt problems. In this method, small diameter plastic or PVC pipes with drip nozzles
commonly called emitters or drippers are adopted to deliver water to the land surface near the
base of the plant. Water can be applied at a rate varying between 2 to 10 liters per hour to keep
the soil moisture within the desired range for plant growth.
The main components of a drip irrigation system are a pumping unit, main pipelines, sub main
pipe lines, lateral pipelines, emitters, pressure gauges etc.,
Advantages of this method are,
1. Excellent control over water application and efficiency as high as up to 95% can be achieved.
2. Evaporation losses from land surface are minimum.
3. Losses due to deep percolation can be avoided.
4. Saline waters can be applied effectively.
5. Water soluble fertilizers can be applied through drip irrigation.
The draw backs of this system are,
1. It involves large investment.
2. Frequent blocking of nozzles takes place.
3. Tilling operation may be obstructed.
Supplemental Irrigation
Rain-fed agriculture accounts for about 80% of the world‘s farmland and two thirds of global
food production. Agriculture in these areas is limited by a number of factors including water
scarcity, drought and land degradation.
Shortage of soil moisture often occurs during the most sensitive stages of crop growth, i.e.
flowering and grain filling. This can severely affect plant growth and yield. Supplemental
irrigation – the application of limited amounts of water during critical crop growth stages –
can substantially increase yield and water productivity.
Supplemental irrigation may be defined as the addition of limited amounts of water to
essentially rain-fed crops, in order to improve and stabilize yields during times when rainfall
fails to provide sufficient moisture for normal plant growth.
Supplemental irrigation in rain-fed areas is based on the following three basic aspects
1. Water is applied to a rain-fed crop that would normally produce some yield without irrigation
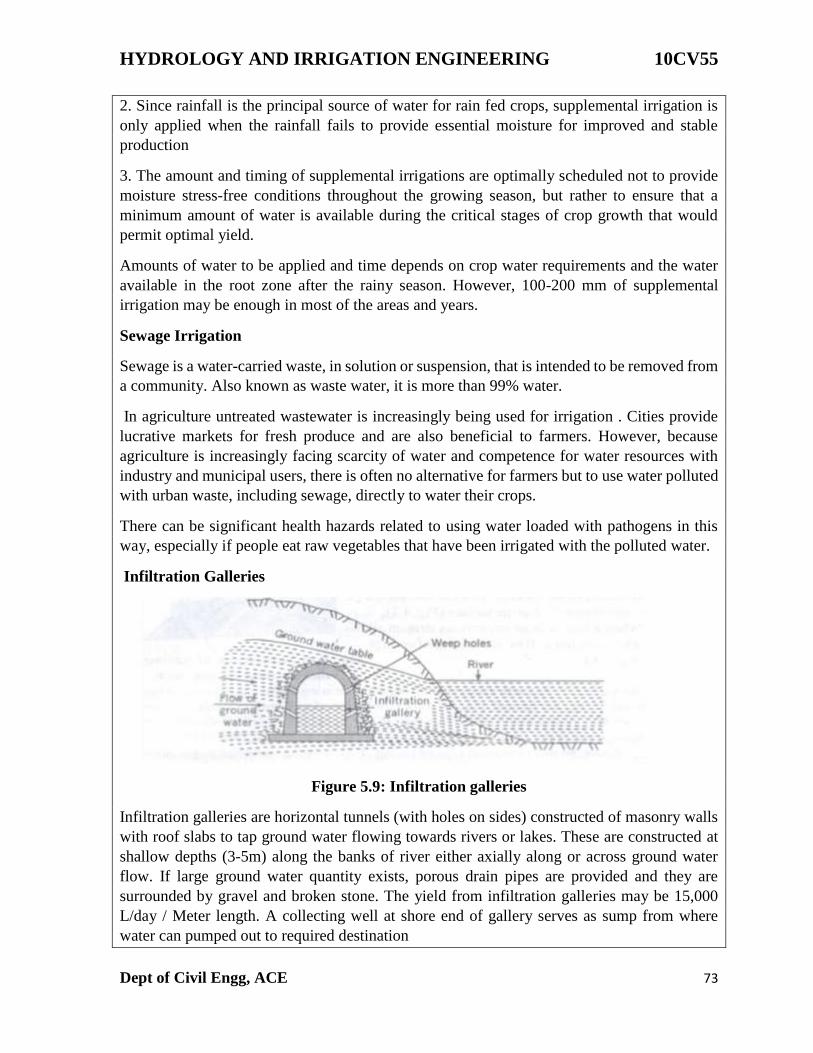
HYDROLOGY AND IRRIGATION ENGINEERING 10CV55
Dept of Civil Engg, ACE 73
2. Since rainfall is the principal source of water for rain fed crops, supplemental irrigation is
only applied when the rainfall fails to provide essential moisture for improved and stable
production
3. The amount and timing of supplemental irrigations are optimally scheduled not to provide
moisture stress-free conditions throughout the growing season, but rather to ensure that a
minimum amount of water is available during the critical stages of crop growth that would
permit optimal yield.
Amounts of water to be applied and time depends on crop water requirements and the water
available in the root zone after the rainy season. However, 100-200 mm of supplemental
irrigation may be enough in most of the areas and years.
Sewage Irrigation
Sewage is a water-carried waste, in solution or suspension, that is intended to be removed from
a community. Also known as waste water, it is more than 99% water.
In agriculture untreated wastewater is increasingly being used for irrigation . Cities provide
lucrative markets for fresh produce and are also beneficial to farmers. However, because
agriculture is increasingly facing scarcity of water and competence for water resources with
industry and municipal users, there is often no alternative for farmers but to use water polluted
with urban waste, including sewage, directly to water their crops.
There can be significant health hazards related to using water loaded with pathogens in this
way, especially if people eat raw vegetables that have been irrigated with the polluted water.
Infiltration Galleries
Figure 5.9: Infiltration galleries
Infiltration galleries are horizontal tunnels (with holes on sides) constructed of masonry walls
with roof slabs to tap ground water flowing towards rivers or lakes. These are constructed at
shallow depths (3-5m) along the banks of river either axially along or across ground water
flow. If large ground water quantity exists, porous drain pipes are provided and they are
surrounded by gravel and broken stone. The yield from infiltration galleries may be 15,000
L/day / Meter length. A collecting well at shore end of gallery serves as sump from where
water can pumped out to required destination
HYDROLOGY AND IRRIGATION ENGINEERING 10CV55
Dept of Civil Engg, ACE 74
UNIT-6
SOIL – WATER - CROP RELATIONSHIPS
Introduction
The aim of the irrigation practice is to ensure that the
plants have an adequate supply of water in their root zone for achieving optimum yield of crops
without damaging the quality of the soil. This necessitates a clear understanding of the
interaction among the soil, water and plants in the root zone of the plants. The soil provides
the structural base to the plants and allows the root system t get firmly embedded in the soil.
Further the soil also provides water as well as the nutrients required by the plants for their
growth.
Water is required by plants in small quantities for metabolism and transportation of plant
nutrients, and in much larger quantities in the physiological process of transpiration which
protects the plants against the injurious effects of high temperature. In addition to water, air
must also be present in the root zone for the respiration of the microorganisms to occur and to
provide a favorable environment for root development and the absorption of nutrients. As such
the excess water must be drained out from the soil to enable free circulation of air in the root
zone.
For proper growth of the plants requisite quantities of water, air and nutrients must be available
in the soil. Therefore while practicing irrigation it must be ensured that there quantities are
available in correct proportions.
Composition of Soil, soil texture.
A soil is usually classified according to the size of its particles. The material having particles
of diameter between 20 mm and 2 mm is called gravel, while that having particles smaller than
2 mm in diameter is called fine earth. The term soil in general refers to fine earth, which has
three components sand, silt and clay. According to International Soil classification the range
of diameters of particles of each or these components of the soil are as indicated below.
Type of soil Range of particle diameter in millimetre
Coarse sand 2 to 0.2 Fine
sand 0.2 to 0.02
Silt 0.02 to 0.002
Clay Less than 0.002
Soil Texture. Soil texture refers to the composition of the soil and it is reflected by the particle
size, hape and gradation. Generally the soils occurring in nature are a combination of sand, silt
and clay. The relative proportions of sand, silt and clay in a soil mass determines the soil
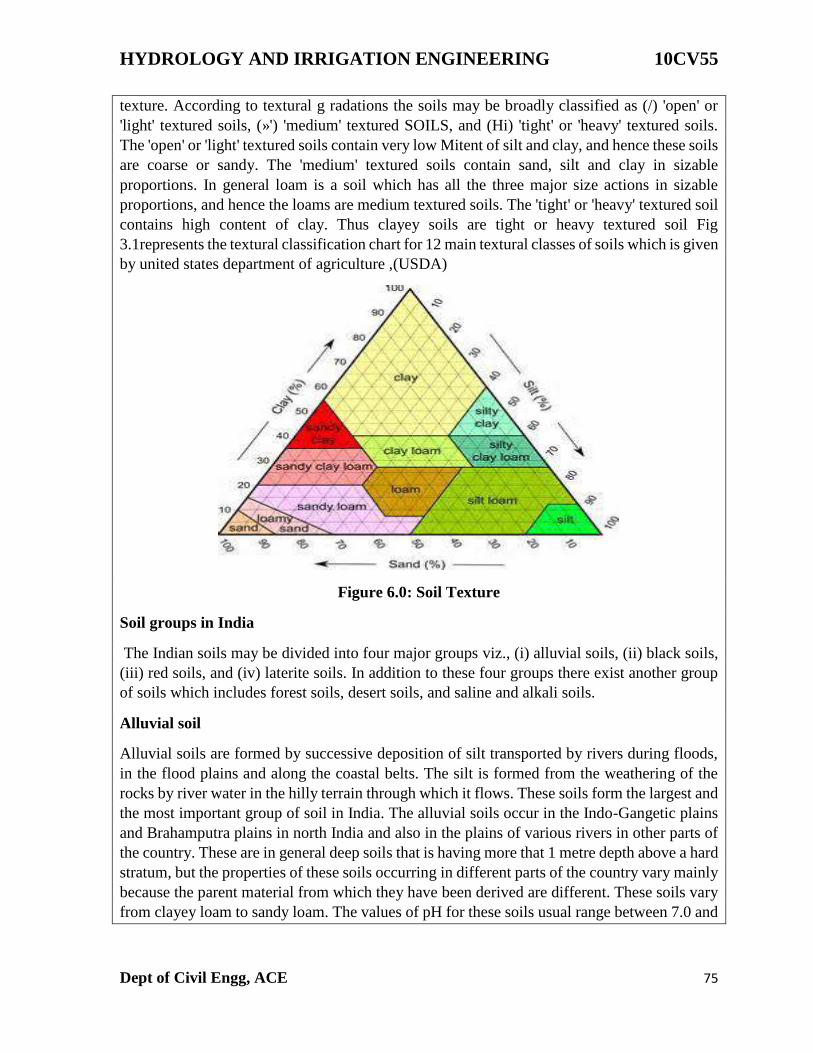
HYDROLOGY AND IRRIGATION ENGINEERING 10CV55
Dept of Civil Engg, ACE 75
texture. According to textural g radations the soils may be broadly classified as (/) 'open' or
'light' textured soils, (»') 'medium' textured SOILS, and (Hi) 'tight' or 'heavy' textured soils.
The 'open' or 'light' textured soils contain very low Mitent of silt and clay, and hence these soils
are coarse or sandy. The 'medium' textured soils contain sand, silt and clay in sizable
proportions. In general loam is a soil which has all the three major size actions in sizable
proportions, and hence the loams are medium textured soils. The 'tight' or 'heavy' textured soil
contains high content of clay. Thus clayey soils are tight or heavy textured soil Fig
3.1represents the textural classification chart for 12 main textural classes of soils which is given
by united states department of agriculture ,(USDA)
Figure 6.0: Soil Texture
Soil groups in India
The Indian soils may be divided into four major groups viz., (i) alluvial soils, (ii) black soils,
(iii) red soils, and (iv) laterite soils. In addition to these four groups there exist another group
of soils which includes forest soils, desert soils, and saline and alkali soils.
Alluvial soil
Alluvial soils are formed by successive deposition of silt transported by rivers during floods,
in the flood plains and along the coastal belts. The silt is formed from the weathering of the
rocks by river water in the hilly terrain through which it flows. These soils form the largest and
the most important group of soil in India. The alluvial soils occur in the Indo-Gangetic plains
and Brahamputra plains in north India and also in the plains of various rivers in other parts of
the country. These are in general deep soils that is having more that 1 metre depth above a hard
stratum, but the properties of these soils occurring in different parts of the country vary mainly
because the parent material from which they have been derived are different. These soils vary
from clayey loam to sandy loam. The values of pH for these soils usual range between 7.0 and
HYDROLOGY AND IRRIGATION ENGINEERING 10CV55
Dept of Civil Engg, ACE 76
9.0, and hence these soils may be neutral or alkaline in character. The water holding capacity
of these soils is fairly good and they give good response to irrigation.
Black Soil
Black soils have evolved from the weathering of rocks such as basalts, traps, granites and
gneisse. These soils occur chiefly in the states of Andhra Pradesh, Gujrat, Madhya Pradesh,
Tamil Nadu, Maharashtra and Karnataka. The colour of these soils ranges from dark brown to
black. Furth< irrespective of the nature of the parent rock from which black soils have
developed, they do not differ much in general physical and chemical properties. These soils
are highly argillaceous and very fine grained. Thus these are heavy textured soils and their clay
content varies from 40 to 60 percent. The values of pH for these soils vary from 8.0 to 9.0 or
higher in different states, and hence these soils are alkaline in character. A special feature of
the black soils is that they are plastic and sticky when wet, an very hard when dry. These soils
possess a high water holding capacity but poor drainage. Black soils ai sub-divided as (i)
shallow black soils which have a depth of 0.3 metre or less, (ii) medium black soil which are
0.3 metre to 1.0 metre in depth, and (Hi) deep soils which are over 1 metre deep. Deep black
soils are also referred to as black cotton soils since cotton is the most important crop in these
soils.
Red Soil
Red soils are formed by the weathering of igneous and metamorphic rocks comprising
gneisses an schists. These soils mostly occur in Tamil Nadu, Karnataka, Maharashtra, Andhra
Pradesh, Madhya Pradesh and Orissa. They also occur in Bihar, West Bengal and some parts
of Uttar Pradesh. These soil are in general light textured loams, but the properties of these soils
vary from place to place. These are in general deep soils with values of pH ranging between
5.0 and 8.0, and hence in most of the cases these soils are acidic in character. The red soils
have low water holding capacity. These soils react well to the application of irrigation water
and on account of low water holding capacity they are well drained.
Laterite Soil
Laterite soils are derived from the weathering of the laterite rocks. These soils occur mostly ii
Karnataka, Kerala, Madhya Pradesh, the Eastern Ghat region, Orissa, Maharashtra, Malabar
and in some parts of Assam. These soils are reddish or yellowish-red in colour. The laterite
soils have values of pH between 5.0 and 6.0 and hence these soils are acidic in character. These
soils have low clay content and hence possess good drainage characteristics.
Forest Soil
Forest soils are formed by the deposition of organic matter derived from forest growth.
Desert Soil
These soils are found in the arid areas in the north-western region in the states of Rajasthan,
Haryana and Punjab and are lying between the Indus river on the west and the range of Aravali
Hills on the east. These soils are blown in from the coastal region and Indus valley, and are
HYDROLOGY AND IRRIGATION ENGINEERING 10CV55
Dept of Civil Engg, ACE 77
also derived from disintegration of rocks in the adjacent areas. These are light textured sandy
soils of depth extending beyond 0.5 metre and react well to the application of irrigation water.
However, these soils have a fairly high values of pH, and some of these soils contain a high
percentage of soluble salts.
Saline and Alkali Soil
These are the soils which have appreciable concentration of soluble salts and exchangeable
sodium content. These salts usually appear in the form of a white efflorescent crust on the
surface of the soil. These soils are formed due to inadequate drainage of the irrigated lands,
and hence these are found among the groups of alluvial, black and red soils. These soils are
not suitable for cultivation, unless these are reclaimed by adopting suitable methods.
Functions of the Soil:
Soil provide the following for the life and development of plants
1. Anchor for plants roots
2. Water for transpiration and metabolism
3. Minerals and nutrients for metabolism
4. Oxygen for metabolism
Factors affecting suitability of soil for irrigation:
The following properties play an important role in determining the depth of water available in
the root zone of the soil in a single application of water and in turn the frequency of watering.
1. Size of soil particles
2. Compactness
3. Depth
4. Organic matter content
5. Position of water table
Classification of soils
1. Classification according to age of formation: In this method soil has subdivided as
a) Youth full: Soil which is fully pervious
b) Mature soil: Soil which is less permeable
c) Senile Soil: Soil which has little or no productivity. It has become hard and impermeable
HYDROLOGY AND IRRIGATION ENGINEERING 10CV55
Dept of Civil Engg, ACE 78
2. Classification according to geological forces of formation
a) Residual soil: Soil formed by disintegration of rocks by various actions in the same place.
b) Alluvial soil: soils formed by deposition of water borne (carried by water) material.
c) Eolian soil: Solis formed by deposition of wind action.
d) Colluvial soil: soils formed by deposing by rain water below foot hills.
e) Glacial soil: Solis formed by transportation and deposition by glaciers.
f) Volcanic ash: Ash deposits due to volcanic eruptions.
g) Solis of aggradations: soils formed accumulation in layers.
h) Soils of degradation: soils which are continuously zoning out due to erosion.
i) Pan clay pan: Impervious soils deposited on hard layers to form new set of soils & cemented
by calcium carbonate, Iron oxide, silica etc.
3. Classification based on salt content
a) Ped-O- Cal: Soil rich in calcium carbonate
b) Ped-Al-Fer: Soil rich in aluminum and iron salts
c) Humus: Soil rich in organic matter or salts.
4. Soil classification based on particle size
A composed soil can be classified on the basis of particular soil as coarse , medium, fine grain
depending upon the percentage of sand, silt, and clay.
5. Soil classification according to regional basis
a) Regions of autogenous of soil development
b) Regions of balanced decomposition
c) Regions of excessive denudation
d) Regions of eroded eolian accumulation
6. Classification of Indian soil
a) Alluvial soils: These are soils formed due to deposition by water in Indo-Gangetic plains.
These soils are very fertile and also absorb good amount of rainfall.
b) Red soil: It is a residual soil which is left over in a same place as a result of decay of
underlying parent rock & covering parent rock. These have light texture and good porosity
varying fertility and low soluble salt content. Such soils are found in central and peninsular
India.
HYDROLOGY AND IRRIGATION ENGINEERING 10CV55
Dept of Civil Engg, ACE 79
c) Lateral soil: These are residual soils commonly found in coastal region. These are usually
porous and well drained & they do not contain common nutrients required for plant growth in
sufficient quality.
d) Black soil: The texture of this varies from clay to loamy
Functions of Irrigation Water:
Water and nutrients are the most important requirements of plants. Following are the main
functions of irrigation water
1. Water dissolves the nutrients, forms a solution of the nutrients and which are absorbed by
the roots and thus water acts as a nutrient carrier.
2. The irrigation water supplies moisture which is essential for the life of bacteria which are
beneficial to plant growth.
3. Irrigation water supplied moisture which is essential for the metabolism within the plant
leading to plant growth.
4. Some essential salts present in soil react in presence of water to produce nourishing food
products.
5. Water cools the soil and atmosphere, thus creating a healthy environment for plant growth.
6. It softens the tillage pans (area to be irrigated).
Suitability of water for irrigation:
In order to perform the required functions, for optimum growth of plants, the water may be
turned as unfit if,
1. Sediment concentration is excessive
2. Total concentration of salts of sodium (Na), calcium, magnesium and potassium is excessive.
3. Percentage of sodium ions to that of other ions is excessive.
4. Percentage of bicarbonates of calcium and magnesium becomes excessive.
5. Bacteria harmful to plant growth are present.
6. Contains chemicals toxic to plants, animals and humans.
Classification of soil water:
Water in the soil may be present in the following forms
1. Hygroscopic water:
2. Capillary water
3. Gravitational water
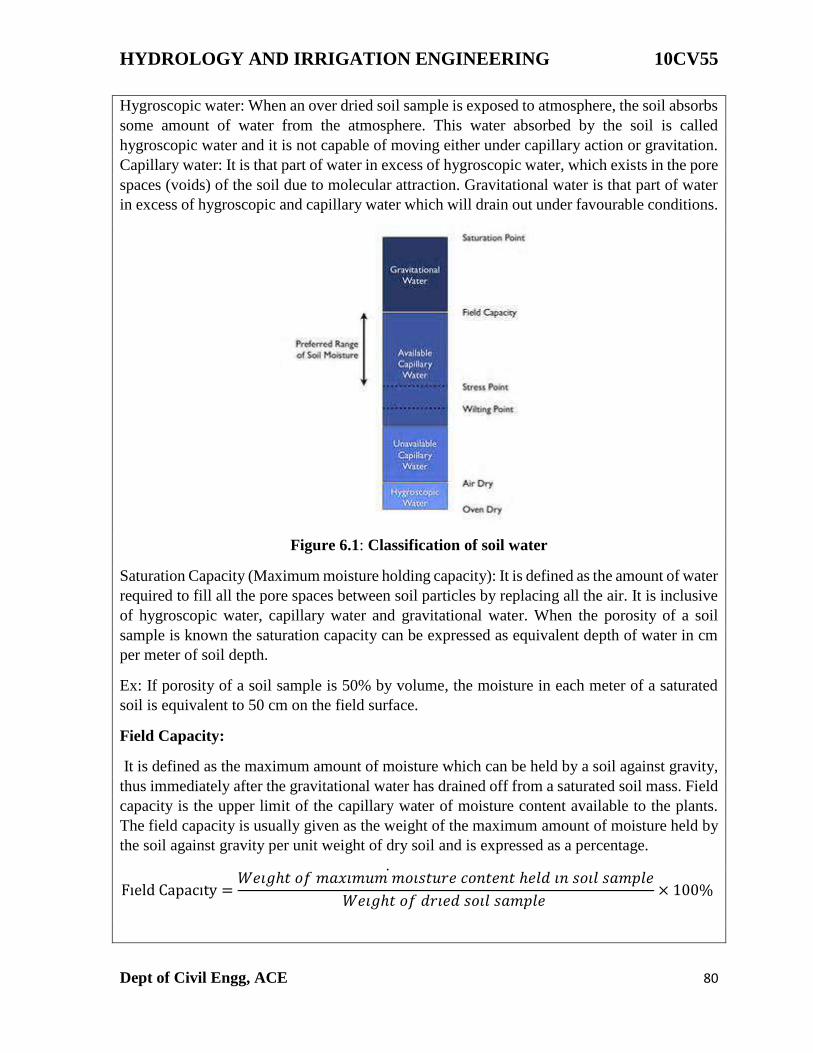
HYDROLOGY AND IRRIGATION ENGINEERING 10CV55
Dept of Civil Engg, ACE 80
Hygroscopic water: When an over dried soil sample is exposed to atmosphere, the soil absorbs
some amount of water from the atmosphere. This water absorbed by the soil is called
hygroscopic water and it is not capable of moving either under capillary action or gravitation.
Capillary water: It is that part of water in excess of hygroscopic water, which exists in the pore
spaces (voids) of the soil due to molecular attraction. Gravitational water is that part of water
in excess of hygroscopic and capillary water which will drain out under favourable conditions.
Figure 6.1: Classification of soil water
Saturation Capacity (Maximum moisture holding capacity): It is defined as the amount of water
required to fill all the pore spaces between soil particles by replacing all the air. It is inclusive
of hygroscopic water, capillary water and gravitational water. When the porosity of a soil
sample is known the saturation capacity can be expressed as equivalent depth of water in cm
per meter of soil depth.
Ex: If porosity of a soil sample is 50% by volume, the moisture in each meter of a saturated
soil is equivalent to 50 cm on the field surface.
Field Capacity:
It is defined as the maximum amount of moisture which can be held by a soil against gravity,
thus immediately after the gravitational water has drained off from a saturated soil mass. Field
capacity is the upper limit of the capillary water of moisture content available to the plants.
The field capacity is usually given as the weight of the maximum amount of moisture held by
the soil against gravity per unit weight of dry soil and is expressed as a percentage.
Field Capacity =𝑊𝑒𝑖𝑔ℎ𝑡 𝑜𝑓 𝑚𝑎𝑥𝑖𝑚𝑢𝑚 𝑚𝑜𝑖𝑠𝑡𝑢𝑟𝑒 𝑐𝑜𝑛𝑡𝑒𝑛𝑡 ℎ𝑒𝑙𝑑 𝑖𝑛 𝑠𝑜𝑖𝑙 𝑠𝑎𝑚𝑝𝑙𝑒
𝑊𝑒𝑖𝑔ℎ𝑡 𝑜𝑓 𝑑𝑟𝑖𝑒𝑑 𝑠𝑜𝑖𝑙 𝑠𝑎𝑚𝑝𝑙𝑒
× 100%
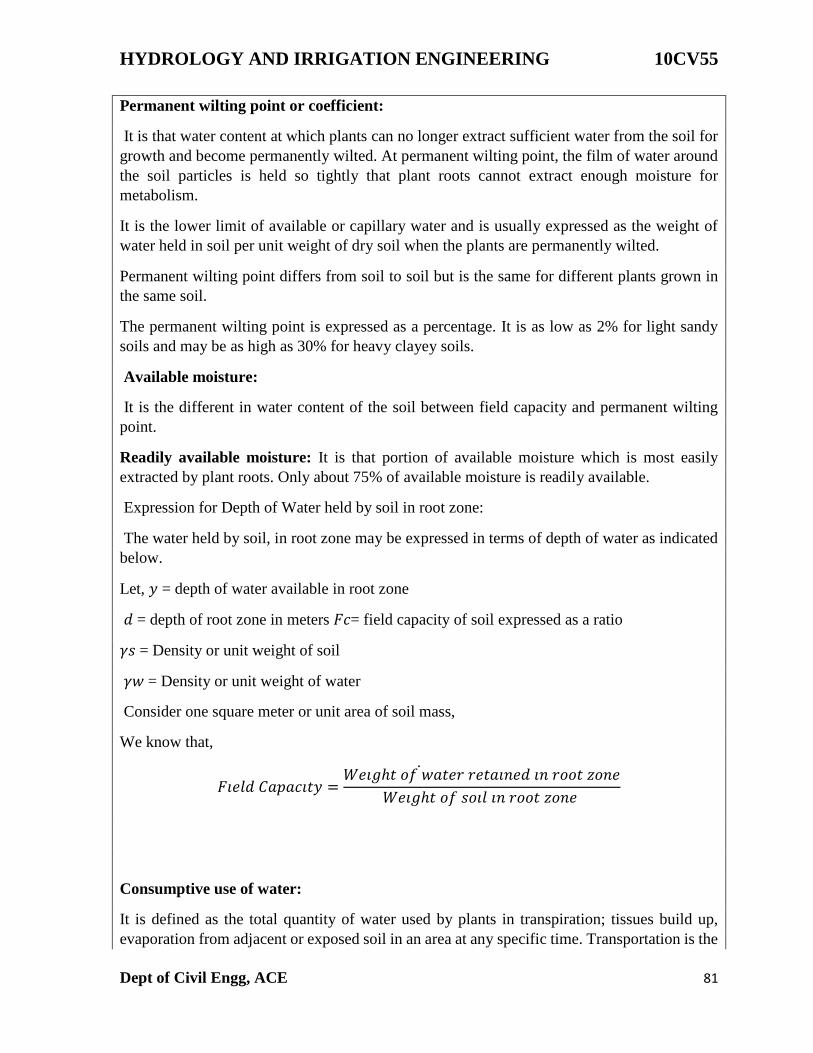
HYDROLOGY AND IRRIGATION ENGINEERING 10CV55
Dept of Civil Engg, ACE 81
Permanent wilting point or coefficient:
It is that water content at which plants can no longer extract sufficient water from the soil for
growth and become permanently wilted. At permanent wilting point, the film of water around
the soil particles is held so tightly that plant roots cannot extract enough moisture for
metabolism.
It is the lower limit of available or capillary water and is usually expressed as the weight of
water held in soil per unit weight of dry soil when the plants are permanently wilted.
Permanent wilting point differs from soil to soil but is the same for different plants grown in
the same soil.
The permanent wilting point is expressed as a percentage. It is as low as 2% for light sandy
soils and may be as high as 30% for heavy clayey soils.
Available moisture:
It is the different in water content of the soil between field capacity and permanent wilting
point.
Readily available moisture: It is that portion of available moisture which is most easily
extracted by plant roots. Only about 75% of available moisture is readily available.
Expression for Depth of Water held by soil in root zone:
The water held by soil, in root zone may be expressed in terms of depth of water as indicated
below.
Let, 𝑦 = depth of water available in root zone
𝑑 = depth of root zone in meters 𝐹𝑐= field capacity of soil expressed as a ratio
𝛾𝑠 = Density or unit weight of soil
𝛾𝑤 = Density or unit weight of water
Consider one square meter or unit area of soil mass,
We know that,
𝐹𝑖𝑒𝑙𝑑 𝐶𝑎𝑝𝑎𝑐𝑖𝑡𝑦 =𝑊𝑒𝑖𝑔ℎ𝑡 𝑜𝑓 𝑤𝑎𝑡𝑒𝑟 𝑟𝑒𝑡𝑎𝑖𝑛𝑒𝑑 𝑖𝑛 𝑟𝑜𝑜𝑡 𝑧𝑜𝑛𝑒
𝑊𝑒𝑖𝑔ℎ𝑡 𝑜𝑓 𝑠𝑜𝑖𝑙 𝑖𝑛 𝑟𝑜𝑜𝑡 𝑧𝑜𝑛𝑒
Consumptive use of water:
It is defined as the total quantity of water used by plants in transpiration; tissues build up,
evaporation from adjacent or exposed soil in an area at any specific time. Transportation is the
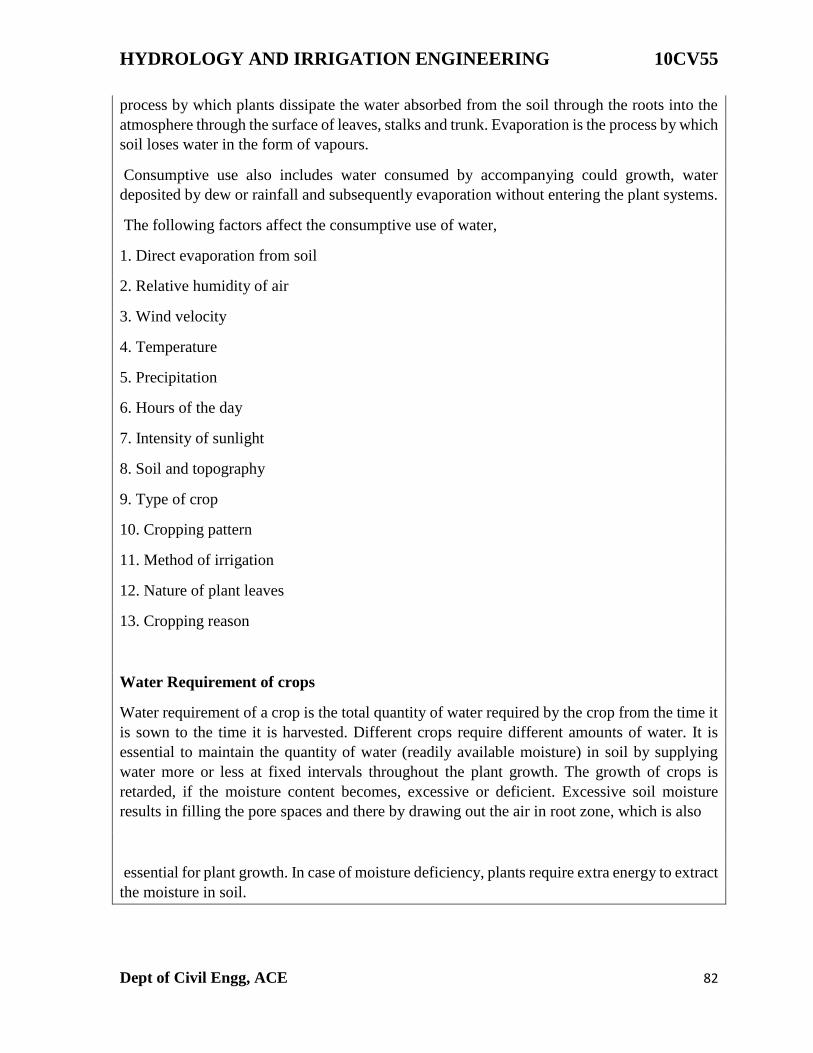
HYDROLOGY AND IRRIGATION ENGINEERING 10CV55
Dept of Civil Engg, ACE 82
process by which plants dissipate the water absorbed from the soil through the roots into the
atmosphere through the surface of leaves, stalks and trunk. Evaporation is the process by which
soil loses water in the form of vapours.
Consumptive use also includes water consumed by accompanying could growth, water
deposited by dew or rainfall and subsequently evaporation without entering the plant systems.
The following factors affect the consumptive use of water,
1. Direct evaporation from soil
2. Relative humidity of air
3. Wind velocity
4. Temperature
5. Precipitation
6. Hours of the day
7. Intensity of sunlight
8. Soil and topography
9. Type of crop
10. Cropping pattern
11. Method of irrigation
12. Nature of plant leaves
13. Cropping reason
Water Requirement of crops
Water requirement of a crop is the total quantity of water required by the crop from the time it
is sown to the time it is harvested. Different crops require different amounts of water. It is
essential to maintain the quantity of water (readily available moisture) in soil by supplying
water more or less at fixed intervals throughout the plant growth. The growth of crops is
retarded, if the moisture content becomes, excessive or deficient. Excessive soil moisture
results in filling the pore spaces and there by drawing out the air in root zone, which is also
essential for plant growth. In case of moisture deficiency, plants require extra energy to extract
the moisture in soil.
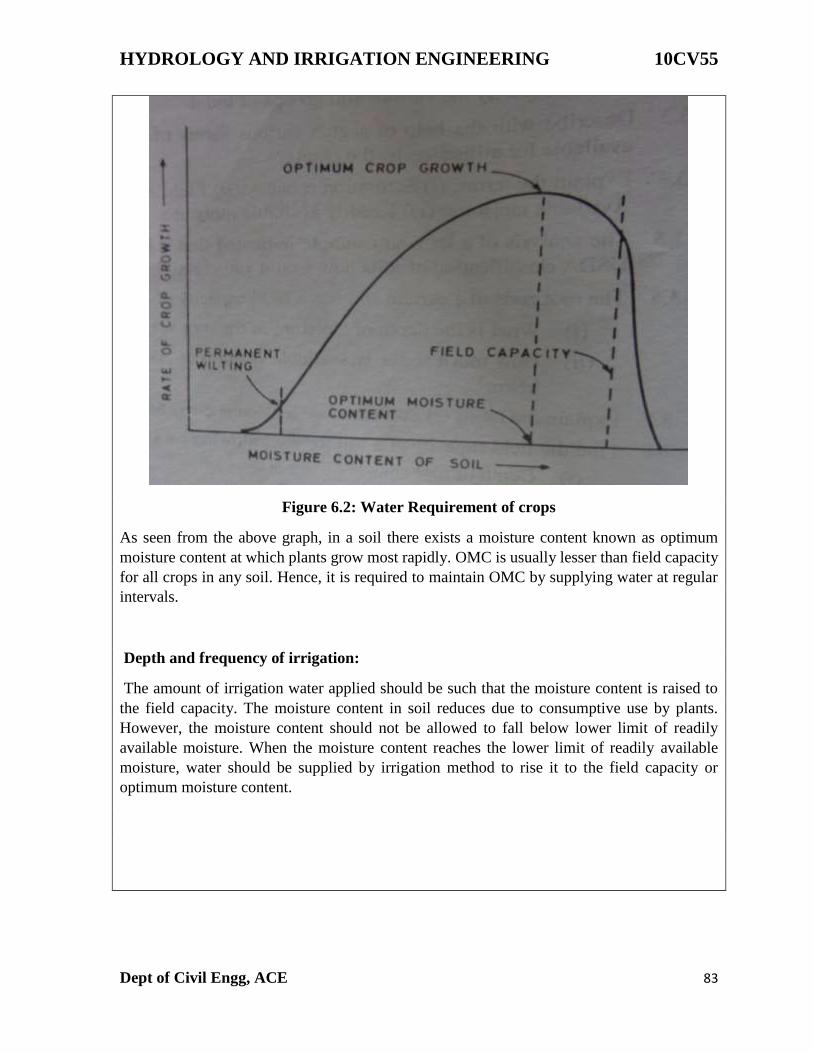
HYDROLOGY AND IRRIGATION ENGINEERING 10CV55
Dept of Civil Engg, ACE 83
Figure 6.2: Water Requirement of crops
As seen from the above graph, in a soil there exists a moisture content known as optimum
moisture content at which plants grow most rapidly. OMC is usually lesser than field capacity
for all crops in any soil. Hence, it is required to maintain OMC by supplying water at regular
intervals.
Depth and frequency of irrigation:
The amount of irrigation water applied should be such that the moisture content is raised to
the field capacity. The moisture content in soil reduces due to consumptive use by plants.
However, the moisture content should not be allowed to fall below lower limit of readily
available moisture. When the moisture content reaches the lower limit of readily available
moisture, water should be supplied by irrigation method to rise it to the field capacity or
optimum moisture content.
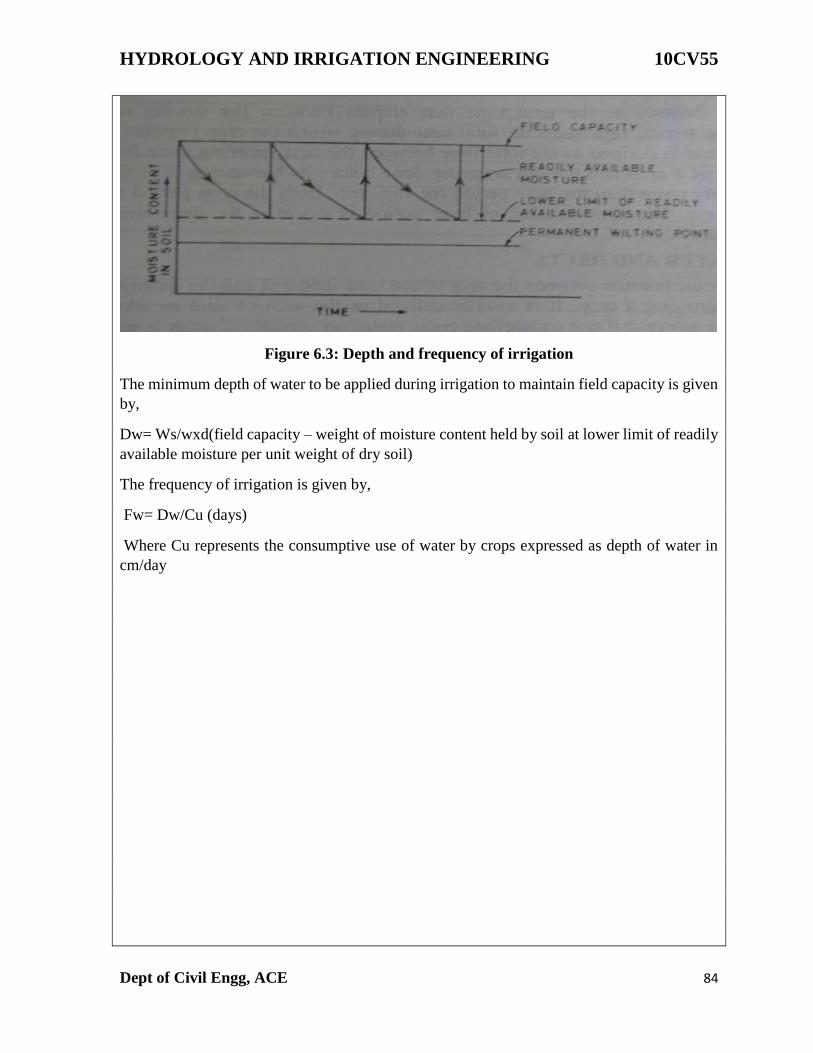
HYDROLOGY AND IRRIGATION ENGINEERING 10CV55
Dept of Civil Engg, ACE 84
Figure 6.3: Depth and frequency of irrigation
The minimum depth of water to be applied during irrigation to maintain field capacity is given
by,
Dw= Ws/wxd(field capacity – weight of moisture content held by soil at lower limit of readily
available moisture per unit weight of dry soil)
The frequency of irrigation is given by,
Fw= Dw/Cu (days)
Where Cu represents the consumptive use of water by crops expressed as depth of water in
cm/day
HYDROLOGY AND IRRIGATION ENGINEERING 10CV55
Dept of Civil Engg, ACE 85
UNIT 7
WATER REQUIREMENT OF CROPS
INTRODUCTION
Water requirement of a crop is the total quantity of water required by the crop from the time
it is sown to the time it is harvested. Different crops require different quantities of water. Since
the growing crops use water continuously, it is essential to maintain the quantity of readily
available moisture in the soil by irrigation. As such the total quantity of water required by a
crop is so distributed that a part of it is applied each time at a more or less fixed interval
throughout the period of growth. The quantity of water applied at each irrigation should be
such that water sufficient to meet the needs of the crop for a period between two successive
irrigations is stored in the soil. Therefore in addition to the total quantity of water required by
a crop, it is also essential to determine the frequency of irrigation as well as the quantitv of
water required to be applied during each application.
LIMITING SOIL MOISTURE CONDITIONS
The growth of most crops is retarded by either excessive or deficient amounts of soil moisture
content. The excessive moisture content in the soil results in filling the soil pore spaces
completely with water, thus driving out air from the soil in the root zone J Since for satisfactory
plant growth the presence of air in the root zone is essential the absence of the same retards the
plant growth. On the other hand soils having deficient amounts of moisture hold it so tightly
that plants are required to spend extra energy to obtain it. Moreover, if the rate of intake by the
plants is not sufficient to maintain turbidity of the leaves, permanent wilting follows. In
between these two extreme soil moisture conditions, there is a moisture content designated as
optimum moisture content at which plants grow most rapidly , resulting in the optimum growth
of crops.
Duty of Water:
Duty represents the irrigating capacity of a unit of water.
It is usually defined as the area of land in hectares which can be irrigated to grow a crop of one
cumec of water is continuously supplied for the entire period of the crop.
Ex: If 5100 hectares of land can be irrigated for growing a crop with a available discharge of
3 cumec continuously for the entire crop period, then the duty of water for this crop = 5100/3
= 1700 hectares/cumec.
Different crops require different amounts of water before their harvesting and hence duty of
water varies with the crops. Duty of water is said to be high, if the area of land irrigated per
cumic is large.
HYDROLOGY AND IRRIGATION ENGINEERING 10CV55
Dept of Civil Engg, ACE 86
Duty of water can be expressed in different ways as follows.
1. By the number of hectares that one cumec of water can irrigate during the base period.
2. By the total depth of water (Delta) applied
3. By the numbers of hectares can be irrigated by one million m3 of stored water
4. By the number of hectare-meters of water expended (used) per hectare of land irrigated.
As in case 1, the duty expressed is called flow duty of water and commonly used in canal
irrigation.
As in case 3, duty of water is suitable for tank irrigation because the area that can be irrigated
is less and amount of water stored in tanks is less. It is also known as quantity duty or storage
duty.
Case 4 is applicable for large storage volumes available in multi-purpose reservoirs.
The duty of water varies with the place of its measurement due to losses such as percolation;
evaporation etc. The quantity of water delivered to the fields is different to the quantity of
water leaving the head of the canal.
Ex: Let ‘C’ be the head of the field, ‘B’ be the head of field water course. ‘A’ be the head of
the distributory (Starting point).
If the area of the field to be irrigated is 1200 hectares and If 1 cumec of water be required at
the point ‘C’ then the duty of water at point ‘C’ is equal to 1200/1 = 1200 hectares/cumec.
Similarly let conveyance loss between B and A be 0.2 cumec
Discharge required at A = (1.0 + 0.1 + 0.2) cumec = 1.3 cumec
Duty of water at A = 1200/1.3 = 923 hectare/cumec.
Hence, the duty of water increases as we move from the lead of the canal system to the field.
Therefore, it is necessary to mention the place of measurement of duty.
Factors affecting duty:
The duty water of a canal system depends on the following factors.
1. Methods and systems of irrigation: Perennial system of irrigation has more duty of water
than inundation irrigation system the loss of water by deep percolation is minimum in the first
case. In flow irrigation by channels the duty is less as conveyance losses are more. In lift
irrigation the lands to be irrigated are very near to the source of water than any surface
irrigation method.
HYDROLOGY AND IRRIGATION ENGINEERING 10CV55
Dept of Civil Engg, ACE 87
2. Type of Crop: Different crops require varying quantities of water and therefore duty of water
varies from crop to crop. Crops requiring large quantity of water have lower duty than crops
requiring lesser quantity of water.
3. Climate conditions of the area: The climatic condition such as wind, temperature, humidity
and rainfall affect the duty of water. At high temperature losses due to evaporation and
transpiration are more and hence duty decreases. At higher wind velocity, rate of evaporation
and transpiration are more thereby, duty decreased. But in humid conditions evaporations and
transpiration losses are minimum, there by duty increases.
4. Canal conditions: In earthen canals, seepage losses are high resulting low duty. If canal is
lined, losses are minimum and hence duty increases. If the length of the canal is very large
before it reaches the irrigation fields (as in hilly areas) the duty of water decreases.
5. Quality of Water: If water contains harmful salts and alkali contents, then more water is to
be applied liberally to leach out these salts and in turn duty of water decreases.
6. Characteristics of soil and subsoil in field and canals: If the soil and subsoil of the field and
canals are made of coarse grained soils the seepage and percolation losses are more and hence
the duty of water decreases.
7. Topography of land: If the area to be irrigated is level, uniform water application is possible
which will result in economical views and hence duty of water increases.
8. Method of Cultivation: If the land is properly tilled up to the required depth and soil is made
loose before irrigation, water retaining capacity of soil increases. This reduces the number of
watering or frequency of watering and hence duty increases.
Delta:
It is the total depth of water required by a crop during the entire crop period and is denoted as
‘Δ’
Ex: A crop require 12 waterings at an interval of 10 days and depth of water required in each
watering is 10cms, the delta for the crop is 12x10cms=120cms=1.2m
If the crop is grown in an area of ‘A’ hectares, then the total quantity of water required is = 1.2
x A hectares-meter in a period of 120 days.
Some definitions:
1. Crop Period: It is the time in days that a crop takes from the instant of its sowing to that of
its harvesting.
2. Base period: It refers to the whole period of cultivation from the time when irrigation water
is first applied for preparation of the ground for planting the crop to its last watering before
harvesting.
HYDROLOGY AND IRRIGATION ENGINEERING 10CV55
Dept of Civil Engg, ACE 88
3. Gross command area: It is the total area laying between the drainage boundaries which can
be commanded or irrigated by a canal system.
4. Culturable command area: Gross command area may also contain villages, ponds, barrel
lands, alkaline lands etc., and such areas are turned as unculturable area. The remaining area
on which crops can be grown satisfactory is known as culturable command area.
Relationship between Duty and Delta:
Let D = Duty of water in hectares/cumec
Δ = Total depth of water required during base period in ‘m’
B = Base period in days
Δ=8.64𝐵/𝐷
Consider a field of ‘D’ hectare to be irrigated and Δ be the corresponding depth of water.
The total volume of water required to be supplied for the field of ‘D’ hectares, if cumec is to
be supplied during the entire base period ‘B’.
Problems 1:
Find the delta for a crop if the duty for a base period of 110 days is 1400 hectares/cumec.
Solution:
Δ=8.64𝐵/𝐷
Δ=8.64𝑥 110/1400
= 0.68m
= 68cm
Problems 2:
A crop requires a total depth of 9.2cm of water for a base period of 120 days. Find the duty of
water.
Solution :
𝐷=8.64𝐵/Δ
𝐷=8.64 𝑥 120/0.092
= 1300 hectare/ cumec
HYDROLOGY AND IRRIGATION ENGINEERING 10CV55
Dept of Civil Engg, ACE 89
Crop seasons of India:
Sowing of crops in irrigation of crops in India is usually done in 2 seasons, known as Crop
seasons. They are
1. Kharif season
2. Rabi season
Kharif season begins with the onset of south west monsoons sowing of crops in Kharif season
is done during June-July and these crops are harvested in October-November.
In Rabi season the crops are sown during September-October and harvested during march-
April. The various crops grown in different seasons and Delta for these crops are tabulated as
follows
Sugarcane has a delta of about 90cms but has a period of 1 year or more. It is as such termed
as a perennial crop.
Assessment of Irrigation water:
Multipurpose river projects are constructed to serve irrigation purposes also. They involve
huge amounts of money which has to be borne by the government or authority. Hence charges
have to be levied on farmers for consuming water and for other reasons as follows.
1. To recover the cost of construction of the project
2. To recover the maintenance cost of project
3. To collect revenue for the nation
4. To control the cultivators against uneconomical and careless use of water.
Methods of charging the farmers /Assessment of irrigation water are done by the
following methods:
1. Assessment on area basis/crop rate basis: In this method farmer is charged depending upon
the area cultivated by him and the type of crop grown by him.
2. Volumetric assessment: In this method the actual amount of water utilized by the farmers to
grow crops is done by measuring the discharge entering the field by device and then charges
are levied per unit of water.
3. Assessment on seasonal basis: Depending upon the cropping season the farmers are also
charged for the cropping area. In ruby season, availability of water is less and demand is more
and hence in Rabi season farmers are charged higher rates.
HYDROLOGY AND IRRIGATION ENGINEERING 10CV55
Dept of Civil Engg, ACE 90
4. Composite rate basis: In addition to water consumed by farmers for cultivation, they are
required to pay land revenue. Hence in this basis both these charges are collected together by
one single agency based on the extent of the area cultivated.
5. Permanent assessment: In some cases farmers have their own source of water supply such
as an open well or tube well. They may require water from a canal system only during droughts.
Hence, in such cases they are charged a nominal amount on a permanent basis.
CONSUMPTIVE USE OF WATER (EVAPO-TRANSPIRATION)
Evapo-transpiration or consumptive use of water by a crop is the depth of water consumed by
evaporation and transpiration during crop growth, including water consumed by accompanying
weed growth. Water deposited by dew or rainfall, and subsequently evaporating without
entering the plant system is part of consumptive use. When the consumptive use of the crop is
known, the water use of large units can be calculated.
Evaporation :
Evaporation is the transfer of water from the liquid to the vapour state. The rate of evaporation
from water surface is proportional to the difference between the vapour pressure at the surface
and the vapor pressure in the overlaying air (Dalton's law). When irrigation water is applied
by flooding methods, large amounts of water are lost by direct evaporation from soil surface
without having passed through the roots, stems and leaves of the plants.
Transpiration and Transpiration Ratio :
Transpiration is the process by which plants dissipate water from the surface of their leaves,
stalks and trunks in the process of growth. As much as 99% of total water received by a plant
through its roots is, lost to the atmosphere by this process.
Transpiration is associated with photosynthesis of plants; it is therefore, a process ofday light
hours. Water from soil is taken up by plant roots through a membrane by a process called
osmosis. Green cells, called chloroplasts in plant leaf prepare food in presence of sun light and
C02 and leave water through tiny openings called stomata the density of which may vary from
8000 to 12000 per sq. cm. The transpiration ratio is the ratio of the weight of water transpired
by the plant during its growth to the weight of dry matter produced by the plant exclusive of
roots. The average values of transpiration ratio for wheat and rice are 560 and 680 respectively.
Factors affecting Consumptive Use of Water
1. Evaporation, which depends upon humidity.
2. Mean monthly temperature.
3. Growing season of crop and cropping pattern.
4. Monthly precipitation in the area.
5. Irrigation depth or the depth of water applied for irrigation.
HYDROLOGY AND IRRIGATION ENGINEERING 10CV55
Dept of Civil Engg, ACE 91
6. Wind velocity in the locality.
7. Soil and topography.
8. Irrigation practices and methods of irrigation
Direct measurement of consumptive use:
The consumptive use or evapo- transpiration can be measured by five principal methods.
1. Tank and lysimeter methods
2. Field experiments plots
3. Soil moisture studies
4. Integration method
5. Inflow and outflow studies for large area
1. Tank and Lysimeter Method
Tanks are containers set flush with the ground level having an area of 10m and 3 m deep.
Larger the size of the tank greater is the resemblance to root development. The tank is filled
with soil of the field and crop is grown in it. Consumptive use is determined by measuring the
quantity of water required to maintain constant moisture conditions within the tank for
satisfactory proper growth of the crop. In Lysimeters, the bottom is pervious. Consumptive use
is the difference of water applied and that draining through pervious bottom and collected in a
pan.
2. Field Experimental Plots
This method is more dependable than the tank and lysimeter method. In this method, irrigation
water is applied to the selected field experimental plots in such a way that there is neither
runoff nor deep percolation. Yield obtained from different fields are plotted against the total
water used, and, as basis for arriving at the consumptive use, those yields are selected which
appear to be most profitable. It is seen from observations that for every type of crop, the yield
increases rapidly with an increase of water used to a certain point, and then decreases with
further increase in water. At the 'break in the curve the amount of water used is considered as
the consumptive use.
3. Soil Moisture Studies
This method is specially suited to those areas where soil is fairly uniform and ground water is
deep enough so that it does not affect the fluctuations in soil moisture within the root zone of
the soil. Soil moisture measurements are done before and after each irrigation. The quantity of
water extracted per day from soil is computed for each period. A curve is drawn by plotting
the rate of use against time and from this curve, seasonal use can be determined.
HYDROLOGY AND IRRIGATION ENGINEERING 10CV55
Dept of Civil Engg, ACE 92
4. Integration Method
In this method, it is necessary to know the division of total area under irrigation crqps, natural
vegetation, water surface area and bare land area. The integration method is summation of the
products of (i) unit consumptive use for each crop times its area, (w)^unit consumptive use of
native vegetation times its area, (Hi) water surface evaporation times the water surface area,
and (iv) evaporation from bare land times its area. Thus, in this method, annual consumptive
use for the whole of the area is found, in hectare-metre units.
5. Inflow-Outflow Studies for Large Areas
In this method also, annual consumptive use is found for large areas, is the valley consumptive
use, its value is given by
U=(I + P) + (Gs-Ge)-R
where, £7= Valley consumptive use (in hectare-metre) /= Total inflow
during 12-months year P = Yearly precipitation on valley floor
Gs = Ground storage at the beginning of the year
IRRIGATION EFFICIENCIES
Efficient use of irrigation water is an obligation of each user as well as of the planners Even
under the best method of irrigation, not all the water applied during an irrigation & is stored in
the root zone. In general, efficiency is the ratio of water output to the water input and is
expressed as percentage. The objective of efficiency concepts is to show when improvements
can be made which will result in more efficient irrigation. The following are the various types
of irrigation efficiencies : (i) water conveyance efficiency, (u) water application efficiency,
(Ui) water use efficiency, (iv) water storage efficiency, (v) water distribution efficiency and
(vi) consumptive use efficiency.
1. Water Conveyance Efficiency (ὴs ) :
This takes into account the conveyance or transit losses and is determined from the following
expression : Where
𝑛𝑠 =𝑊𝑓
𝑊𝑟
𝑛𝑠 =𝑊𝑓
𝑊𝑟
= water conveyance efficiency
Wf= water delivered to the farm or irrigation plot
HYDROLOGY AND IRRIGATION ENGINEERING 10CV55
Dept of Civil Engg, ACE 93
2. Water Application Efficiency (ὴa )
The water application efficiency is the ratio of the quantity of water stored intothe root zone of
the crops to the quantity of water delivered to the field. This focusesthe attention of the
suitability of the method of application of crater to the crops.
It is determined from the following expression
ὴ𝑎 =𝑊𝑠/𝑊𝑓
where ὴ𝑎 = water application efficiency
Ws= Water stored in the root zone during the irrigation
Wf= water delivered to the farm.
The common sources of loss of irrigation water during water application are (i) surface run off
Rf from the farm and (ii) deep percolation Df below the farm root-zone soil. Hence
Wf=Ws+Rf+Df
In a well-designed surface irrigation system, the water application efficiency should be atleast
60%. In the sprinkler irrigation system this efficiency is about 76%.
3. Water Use Efficiency (ὴu)
It is the ratio of water beneficially used, including leaching water, to the quantity water
delivered, and is determined from the following expression :
ὴu = Wu/Wdxl00 ...
(here ὴu = water use efficiency
Wu = water used beneficially or consumptively
Wd= water delivered.
4. Water Storage Efficiency (ὴs )
The concept of water storage efficiency gives an insight to how completely the required water
has been stored in the root zone during irrigation. It is determined from the following
expression:
(ὴs)= Ws/Wnx100 ...
where ὴs = water storage efficiency
Ws = water stored in the root zone during irrigation
Wn = water needed in the root zone prior to irrigation
=(field capacity - Available moisture).
5. Water Distribution Efficiency ((ὴd)
HYDROLOGY AND IRRIGATION ENGINEERING 10CV55
Dept of Civil Engg, ACE 94
Water distribution efficiency evaluates the degree to which water is uniformly distributed
throughout the root zone. Uneven distribution has many undesirable results, the more
uniformly the water is distributed, the better will be the crop response, It is determined from
the following expression4
ὴd=100(1−𝑦𝑑)
where ὴd = water distribution efficiency
y = average numerical deviation in depth of water stored from average depth stored during
irrigation.
d = average depth of water stored during irrigation.
The efficiency provides a measure for comparing various systems or methods of water
application, i.e. sprinkler compared to surface, one sprinkler system compared to the other
system or one surface method compared to other surface method.
6. Consumptive Use Efficiency (ὴCU )
It is given by
ὴcu= Wcu/Wdxl00
where Wcu or Cu = normal consumptive use of water
Wd= net amount of water depleted from root zone of soil.
The efficiency, therefore evaluates the loss of water by deep percolation and by excessive
surface evaporation following an irrigation.
DETERMINATION OF IRRIGATION REQUIREMENTS OF CROPS
In order to determine the irrigation requirements of certain crop, during its base period, the
tollowmg terms are required :
(i) Effective Rainfall (Re)
Effective rainfall is that part of the precipitation falling during the growing period of a crop
that is available to meet the evapo-transpiration needs of the crop.
(ii) Consumptive Irrigation Requirement (CIR)
Consumptive irrigation requirement is defined as the amount of irrigation water that is required
to meet the evapo-transpiration needs of the crop during its full growth. Therefore, CIR = CU-
Re where Cu is the consumptive use of water.
iii) Net Irrigation Requirement (NCR)
Net irrigation requirement is defined as the amount of irrigation water required at the plot to
meet the evapo-transpiration needs of water as well as other needs such as leaching etc. Thus
NIR= Cu - Re + water lost in deep percolation for the purpose of leaching etc.

HYDROLOGY AND IRRIGATION ENGINEERING 10CV55
Dept of Civil Engg, ACE 95
iv) Field Irrigation Requirement (FIR)
Field irrigation requirement is the amount of water required, to meet 'net irrigation
requirements, plus the water lost in percolation in the field water courses, field channels and
in field applications of water. If ὴ a is water application efficiency, we have
FIR=NIR/ὴ
v) Gross Irrigation Requirement (GTR) Gross irrigation requirement is the sum of water
required to satisfy the field irrigation requirement and the water lost as conveyance losses in
distributaries upto the field. If ὴa is the water conveyance efficiency, we have
GIR=FIR/ὴc
CROP ROTATION
The term rotation of crops is somewhat self-explanatory. It implies that nature of the crop sown
in a particular field is changed year after year. Necessity for rotation The necessity for rotation
arises from the fact that soil gradually losses its fertility if the same crop is sown every year
and the field has to be allowed to lie fallow in order to regain its fertility. The effect of fallow
is obtained by rotation of crops.
All crops require similar type of nutrients for their growth but all of them do not take in the
same quantities or proportions; some crop favours certain plant nutrients and take them more
than the others. Thus if a particular crop is grown year after year, the soil gets deficient in the
plant food favored by that crop. If different crops are to be raised there would certainly be more
balanced flooding and soil deficient in one particular type of nutrient is allowed to recoupled.
In a given plot of land different crops are grown one after the other in service in different
seasons such a practice is known as crop rotation. Crop rotation is necessary for the following
reasons.
1. Different crops require different types of nutrients available in soil
If crop rotation is adopted all nutrients are utilized beneficially
2. By growing the same crop in the field continuously diseases and pests cannot be controlled
easily.
By crop rotation such a hazard can be minimized.
3. Different crops have different depths of root zones hence the nutrients at different levels can
be well utilized by crop rotation.
4. By growing grams which are leguminous (they absorb more nitrogen) a plant, the nitrogen
content is soil is increased and becomes beneficial for subsequent crops.
HYDROLOGY AND IRRIGATION ENGINEERING 10CV55
Dept of Civil Engg, ACE 96
The usual crop rotations adopted in India are,
a. Wheat-Millet-gram
b. Paddy-gram
c. Cotton-wheat-gram
d. Cotton-wheat-sugarcane
e. Cotton-millet-gram
Crop diseases and insect pests will multiply at an alarming rate, if the same crop is to be grown
continuously. Rotation will check this disease.
A leguminous crop (such as gram) if introduced in rotation will increase nitrogen content of
the soil thus increasing its fertility.
Problems 3
A certain crop is grown in an area of 3000 hectares which is fed by a canal system. The data
pertaining to irrigation are as follows : Field capacity of soil= 26%
Optimum moisture= 12
Permanent wilting point-10%
Effective depth of root zone -80 cm
Relative density of soil=1.4
If the frequency of irrigation is 10 days and the overall efficiency is 23%,fina (i) the daily
consumptive use (ii) The water discharge in m2/sec required in the canal feeding the area.
Solution
dw = Sg.d [Fc - m0] = 1.4 x 80 [0.26 - 0.12]
=15.68 cm
Frequency of irrigation = 10 days.
Daily consumption use= 15.68/10= 1.568cm
= 15.68mm
Total water required in 10 days= Ax dw= 3000x 104x 15.68/100= 4704000m3
Discharge in the canal= 4704000/(10x24x3600) = 5.45 cumecs
HYDROLOGY AND IRRIGATION ENGINEERING 10CV55
Dept of Civil Engg, ACE 97
Problems 4
The gross commanded area for a distributory is 20000 hectares,75% of which can be irrigated.
The intensity of irrigation for Rabi season is 40% that for Kharif season is 10%. If kor period
is 4 weeks for rabi and 2.5 weeks for rice, determine he outlet discharge . Outlet factors for
rabi and rice may be assumed as 1800 hectares/ cumec and 775 hectares/ cumec. Also calculate
delta for each crop.
Gross commanded area = 20000 hectares
Culturable commanded area = 0.75 x 20000 = 15000 hectares.
Area under irrigation in Rabi season at 40% intensity = 15000 x 0.4 = 6000 hectares Area
under irrigation in Kharif season at 10% intensity = 15000 x 0.1 = 1500 hectares.
Outlet Discharge for Rabi = 6000/1800= 3.33 cumec
Outlet Discharge for Kharif = 1500/775= 1.94cumec
From the equation
Similarly for rabi Δ=8.64𝐵/𝐷 Δ=8.64(4𝑥7)/1800
Δ=0.134𝑚=134𝑚𝑚
Similarly for rice Δ=8.64𝐵/𝐷
Δ=8.64(2.5𝑥7)/775
Δ=0.195𝑚=195𝑚𝑚
Problems 5
A water course has a culturable command area of 1200 hectares. The intensity of irrigation for
crop A is 40 % and for B is 35%, both the crops being rabi crops. Crop A has a kor period of
20 days and crop B has kor period is 15 days. Calculate the discharge of the water course if the
kor depth for crop A is 10cm and for it is 16cm.
Solutions:
(A) For Crop A
Area under irrigation =1200 x0.4 = 480 hectares Kor period = b= 20days Kor depth = D=
10cm= 0.1m Duty = Δ=8.64𝐵/𝐷 = 8.64 x20/0.1 =1728 hectares/cumec Hence discharge
required = Area under irrigation/ outlet factor=480/1728 = 0.278 cumec
(B) For Crop B
Area under irrigation =1200 x0.35 = 420 hectares
Kor period = b= 15 days Kor
HYDROLOGY AND IRRIGATION ENGINEERING 10CV55
Dept of Civil Engg, ACE 98
depth = D= 16cm= 0.16m
Duty = Δ=8.64𝐵/𝐷 = 8.64 x15/0.16 =810 hectares/cumec
Hence discharge required = Area under irrigation/ outlet factor=420/810 = 0.519 cumec
Thus, the design discharge of water course= 0.276 +0.519= 0.8 cumec
Problems 6
A water course commands an irrigated area of 1000 hectares. The intensity of irrigation for
rice in this area is 70 %. The transplantation of rice crop takes 15days and during the
transplantation period the total depth of water required by the crop on the field is 500mm.
During the transplantation period , the useful rain falling on the field is 120mm. Find the duty
of irrigation water for the crop on the field during transplantation, at the head of the field is
and also at the head of the water course assuming losses of water to be 20% in the water course.
Also calculate the discharge required in the water course.
Solutions:
Depth of water required on the field during transplantation = 500mm
Useful rainfall during this period= 120mm
Depth of water required to be supplied by the water course= 500-120
= 380mm=
0.38m
Duty =
Δ=8.64𝐵/𝐷
Duty of water on the field is = Duty = Δ=8.64𝑥 0.15/0.38
= 341 hectares/ cumec
Since the losses of water in the water course are 20%, a discharge of 1 cumec at the head of
the water course will be reduced to 0.8cumec at the head of the field and hence will
irrigate. = 381x 0.8
= 272.8 hectares.
Duty of water at the head of the water course = 272.8 hectares.
Discharge at the head of water course = 700 / 272.8
= 2.57 cumecs
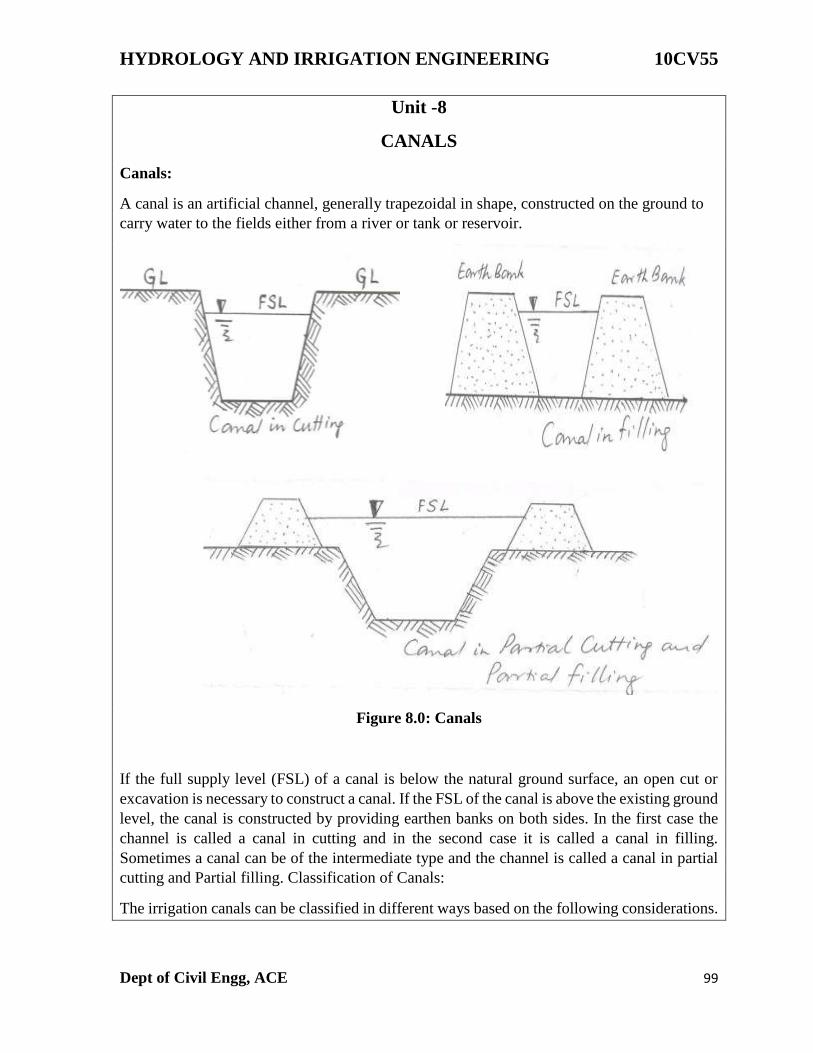
HYDROLOGY AND IRRIGATION ENGINEERING 10CV55
Dept of Civil Engg, ACE 99
Unit -8
CANALS
Canals:
A canal is an artificial channel, generally trapezoidal in shape, constructed on the ground to
carry water to the fields either from a river or tank or reservoir.
Figure 8.0: Canals
If the full supply level (FSL) of a canal is below the natural ground surface, an open cut or
excavation is necessary to construct a canal. If the FSL of the canal is above the existing ground
level, the canal is constructed by providing earthen banks on both sides. In the first case the
channel is called a canal in cutting and in the second case it is called a canal in filling.
Sometimes a canal can be of the intermediate type and the channel is called a canal in partial
cutting and Partial filling. Classification of Canals:
The irrigation canals can be classified in different ways based on the following considerations.
HYDROLOGY AND IRRIGATION ENGINEERING 10CV55
Dept of Civil Engg, ACE 100
1. Classification based on the nature of source of supply: In this method canals may be
classified as
a) Permanent canals
b) Inundation canals
A permanent canal is one which draws water from a permanent source of supply. The canal in
such cases is made as a regular graded canal (fixed slope). It is provided with permanent
regulation and distribution works. A permanent canal may also be perennial canal or non-
perennial canal depending on whether the source supplying water is a perennial one or a non-
perennial.
An inundation canal is one which draws water from a river when the water level in the river is
high or the river is in floods. These canals are not provided with any regulatory works, but an
open cut is made in the banks of the canal to divert water.
2. Classification based on the function of the canal: Here the canals may be classified as
a) Feeder canals
b) Carrier canals
c) Navigation canals
d) Power canals
A feeder canal is constructed for the purpose of supplying water to two or more canals only
but not directly irrigating the fields.
A carrier canal carries water for irrigating the fields and also feeds other canals for their needs.
A canal serving the purpose of in-land navigation is called a navigation canal.
A power canal supplies water to a hydro electric power generation plant for generation of
electrical power.
3. Classification based on the discharge and its relative importance in a given network of
canals: On this basis an irrigation canal system consists of
a) Main canal
b) Branch canal
c) Major distributory
d) Minor distributory
e) Water course or Field channel
A main canal is the principal canal in a network of irrigation canals. It directly takes off from
a river, reservoir or a feeder canal. It has large capacity and supplies water to branch canals
and even to major distributaries.
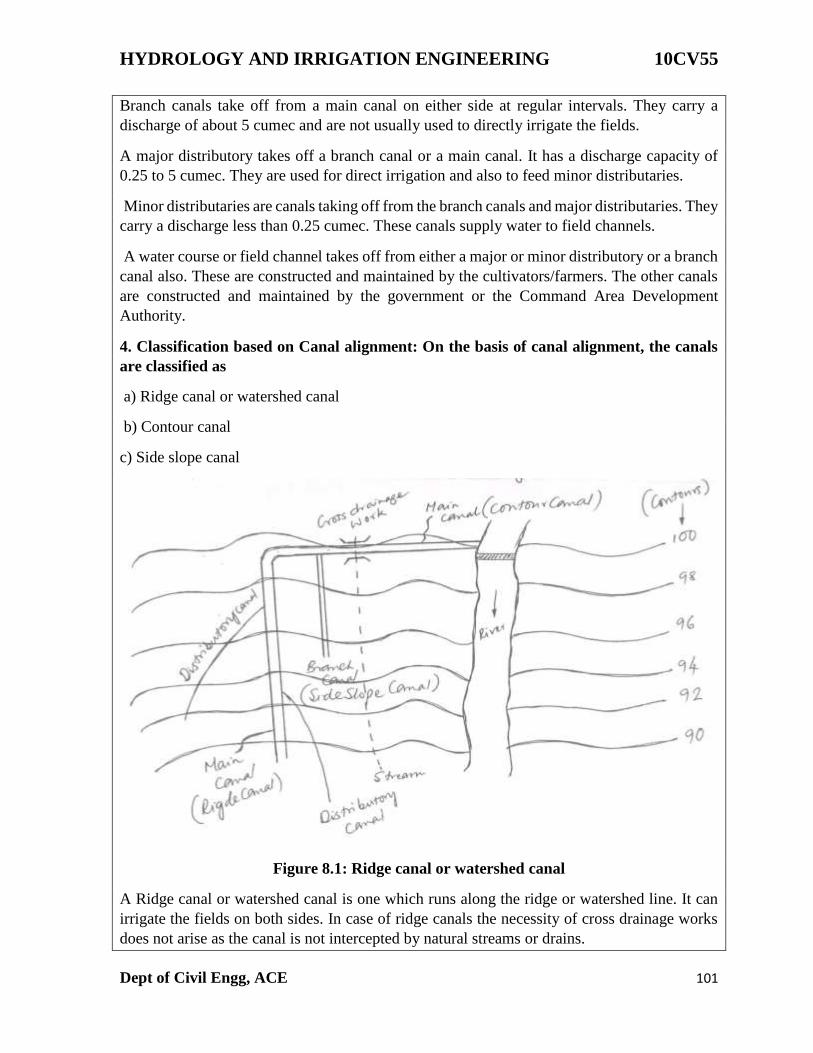
HYDROLOGY AND IRRIGATION ENGINEERING 10CV55
Dept of Civil Engg, ACE 101
Branch canals take off from a main canal on either side at regular intervals. They carry a
discharge of about 5 cumec and are not usually used to directly irrigate the fields.
A major distributory takes off a branch canal or a main canal. It has a discharge capacity of
0.25 to 5 cumec. They are used for direct irrigation and also to feed minor distributaries.
Minor distributaries are canals taking off from the branch canals and major distributaries. They
carry a discharge less than 0.25 cumec. These canals supply water to field channels.
A water course or field channel takes off from either a major or minor distributory or a branch
canal also. These are constructed and maintained by the cultivators/farmers. The other canals
are constructed and maintained by the government or the Command Area Development
Authority.
4. Classification based on Canal alignment: On the basis of canal alignment, the canals
are classified as
a) Ridge canal or watershed canal
b) Contour canal
c) Side slope canal
Figure 8.1: Ridge canal or watershed canal
A Ridge canal or watershed canal is one which runs along the ridge or watershed line. It can
irrigate the fields on both sides. In case of ridge canals the necessity of cross drainage works
does not arise as the canal is not intercepted by natural streams or drains.
HYDROLOGY AND IRRIGATION ENGINEERING 10CV55
Dept of Civil Engg, ACE 102
A contour canal is one which is aligned nearly parallel to the contours of the country/area.
These canals can irrigate the lands on only one side. The ground level on one side is higher
and hence bank on the higher side may not be necessary. A contour canal may be intercepted
by natural streams/drains and hence cross drainage works may be essential.
A Side slope canal is one which is aligned at right angles to the contour of the country/area. It
is a canal running between a ridge and a valley. This canal is not intercepted by streams and
hence no cross drainage works may be essential. This canal has steep bed slope since the
ground has steep slope in a direction perpendicular to the contours of the country/area.
5. Classification based on the financial output: On the basis of the financial output
/revenue from the canals, the canals are called as
a) Productive canals
b) Protective canals
A productive canal is one which is fully developed and earns enough revenue for its running
and maintenance and also recovers the cost of its initial investment. It is essential the cost of
its initial investment is recovered within 16 years of construction.
Protective canals are those constructed at times of famine to provide relief and employment
to the people of the area. The revenue from such a canal may not be sufficient for its
maintenance. The investment may also not be recovered within the stipulated time.
6. Classification based on the soil through which they are constructed: On the above
basis the canals are classified as
a) Alluvial canals
b) Non-alluvial canals.
Canals constructed in alluvial soils are known as alluvial canals. Alluvial soils are found in
the Indo-Gangetic plains of North India. The alluvial soils can be easily scoured and
deposited by water.
Canals constructed through hard soils or disintegrated rocks are called non-alluvial canals.
Such soils are usually found in Central and South India.
7. Classification based on lining being provided or not: On the above basis the canals
are classified as
a) Unlined canals
b) Lined canals
An unlined canal is one which the bed and banks of the canal are made up of natural soil
through which it is constructed. A protective lining of impervious material is not provided.
The velocity of flow is kept low such that bed and banks are not scoured.
HYDROLOGY AND IRRIGATION ENGINEERING 10CV55
Dept of Civil Engg, ACE 103
A lined canal is one which is provide with a lining of impervious material on its banks and
beds, to prevent the seepage of water and also scouring of banks and bed. Higher velocity for
water can be permitted in lined canals and hence cross sectional area can be reduced.
Canal alignment:
In aligning an irrigation canal, the following points must be considered.
1. An irrigation canal should be aligned in such a way that maximum area is irrigated with
least length of canal.
2. Cross drainage works should be avoided as far as possible, such that the cost is reduced.
3. The off taking point of the canal from the source should be on a ridge, such that the canal
must run as a ridge canal and irrigate lands on both sides.
4. Sharp curves in canals must be avoided.
5. In hilly areas, when it is not possible to construct ridge canals, the canal must be made to
run as a contour canal.
6. The canal should be aligned such that the idle length of the canal is minimum.
7. The alignment should be such that heavy cutting or heavy filling are avoided. If possible
balanced depth of cutting and filling is achieved.
8. It should not be aligned in rocky and cracked strata.
9. The alignment should avoid villages, roads, places of worship and other obligatory points.
Design of unlined canals in alluvial soils when water from the catchment or drainage basin
enters the river it carries huge amounts of silt or sediments along with it. The sediment is
carried either in suspension or dragged along the rivers bed. A portion of this silt or sediment
also entire the canals. These sediments can cause a problem in the design of unlined canals in
alluvial soils.
If the velocity of flowing water in the canal is less, the sediments get deposited on the bed of
the canal, thereby reducing the cross sectional area of flow and in turn the irrigating capacity
of the canal reduces. On the other hand, if the velocity is increased too much, erosion of the
bed and sides of the canal takes place. Thus the area of the channel increases, full supply
depth in canals decreases and also causing other damages. Hence, in case of unlined canals,
the velocity of flow should be such that it is neither silting nor scouring. Such a velocity is
called non-silting and non scouring velocity or also called as critical velocity.
To carry the required design discharge (Q), knowing the surface and soil properties such as
(N) and silt factor (f), the design of an irrigation channel includes determining
1. Cross sectional area of flow (A)
2. Hydraulic mean radius ( R )
HYDROLOGY AND IRRIGATION ENGINEERING 10CV55
Dept of Civil Engg, ACE 104
3. Velocity of flow (V)
4. Bed slope (S)
R G Kennedy, former Executive Engineer, Punjab Irrigation Department and Gerald Lacey,
former Chief Engineer, U P Irrigation Department made a lot of investigations in this area
and put forward theories named after them such as,
1. Kennedy‘s theory
2. Lacey‘s Regime theory.
1. Kennedy‘s theory of designing unlined Canals:
Kennedy selected a number of canal sections in the upper Bari-Doab region which did not
required any silt clearance for more than 35 years and were supposed to be flowing with non-
silting and non-scouring velocity. Kennedy put forward the following facts out of his study.
The bed of the canal offers frictional resistance to the flow of water, as a result critical
eddies (Turbulences) arise from the bottom of the bed. These eddies keep the sediments
carried by water in suspension. Some eddies also arise from the sides of the canal, but do not
support the sediments. Hence, the sediment supporting capacity is proportional to the bed
width of the canal.
The critical velocity or non-silting and non scouring velocity (Vo) is a function of the depth
of the flowing water (D). It is given by the relationship Vo = c m Dn
Where, ‘c’ is and ‘n’ are coefficients suggested by Kennedy for canals of Bari-Doad region.
The values of ‘c’ differs for different materials are
Light Sandy silt - c = 0.53 Coarse light sandy
silt - c = 0.59 Sandy loan - c = 0.65
Coarse silt - c = 0.70
Note: Unless otherwise specified, values of c and n can be taken as c = 0.55 and n = 0.64
Thus, the equation for critical velocity becomes Vo = 0.55 m D 0.64 In this above, ‘m’
represents critical velocity ratio which is given as 𝑚=𝑉
𝑉0 Where, V represents mean velocity
of flow.
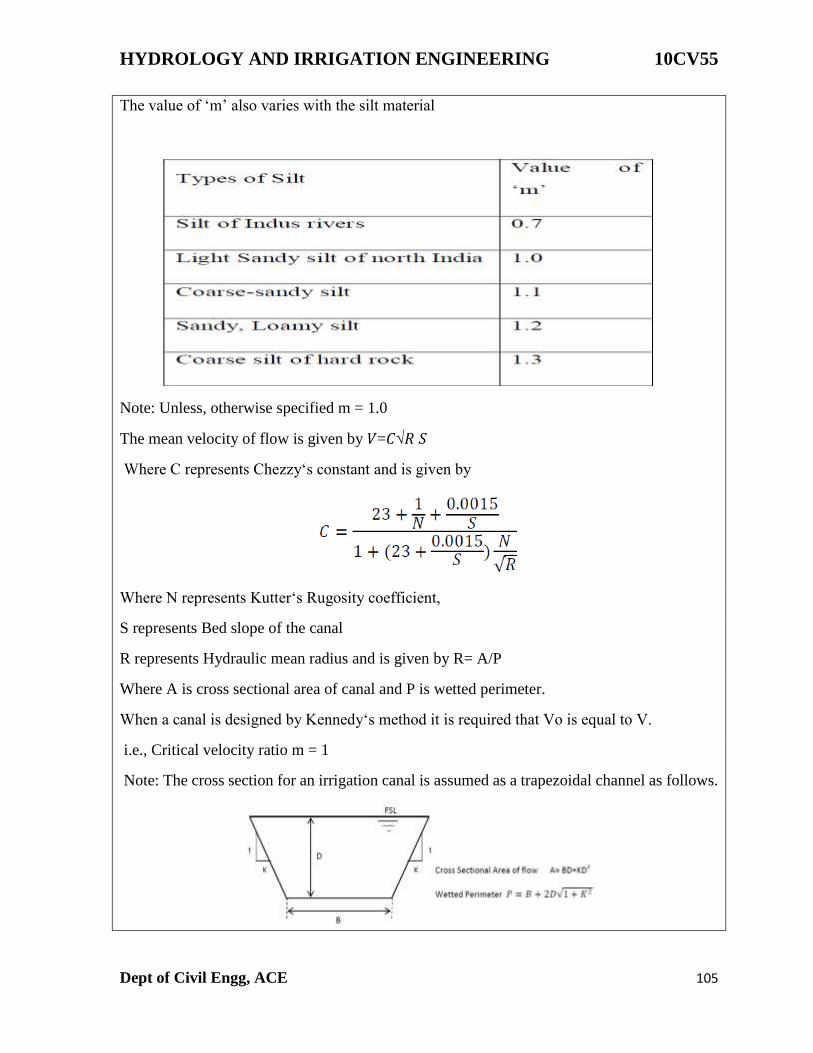
HYDROLOGY AND IRRIGATION ENGINEERING 10CV55
Dept of Civil Engg, ACE 105
The value of ‘m’ also varies with the silt material
Note: Unless, otherwise specified m = 1.0
The mean velocity of flow is given by 𝑉=𝐶√𝑅 𝑆
Where C represents Chezzy‘s constant and is given by
Where N represents Kutter‘s Rugosity coefficient,
S represents Bed slope of the canal
R represents Hydraulic mean radius and is given by R= A/P
Where A is cross sectional area of canal and P is wetted perimeter.
When a canal is designed by Kennedy‘s method it is required that Vo is equal to V.
i.e., Critical velocity ratio m = 1
Note: The cross section for an irrigation canal is assumed as a trapezoidal channel as follows.
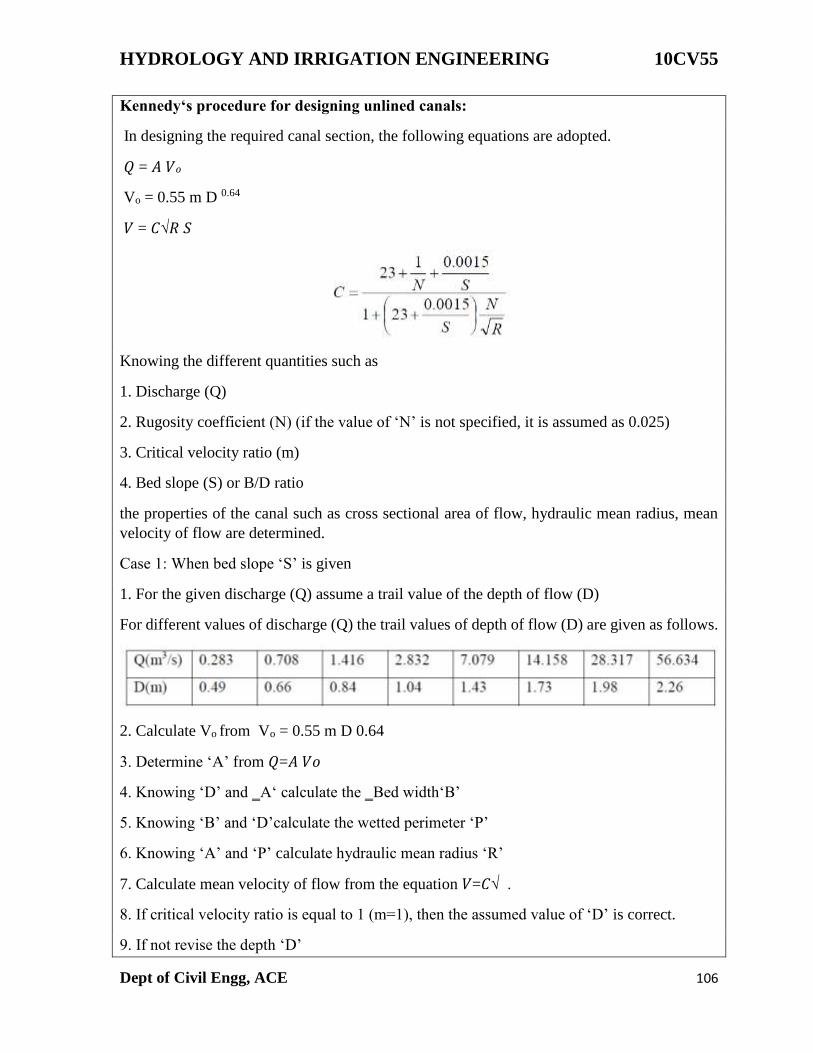
HYDROLOGY AND IRRIGATION ENGINEERING 10CV55
Dept of Civil Engg, ACE 106
Kennedy‘s procedure for designing unlined canals:
In designing the required canal section, the following equations are adopted.
𝑄 = 𝐴 𝑉𝑜
Vo = 0.55 m D 0.64
𝑉 = 𝐶√𝑅 𝑆
Knowing the different quantities such as
1. Discharge (Q)
2. Rugosity coefficient (N) (if the value of ‘N’ is not specified, it is assumed as 0.025)
3. Critical velocity ratio (m)
4. Bed slope (S) or B/D ratio
the properties of the canal such as cross sectional area of flow, hydraulic mean radius, mean
velocity of flow are determined.
Case 1: When bed slope ‘S’ is given
1. For the given discharge (Q) assume a trail value of the depth of flow (D)
For different values of discharge (Q) the trail values of depth of flow (D) are given as follows.
2. Calculate Vo from Vo = 0.55 m D 0.64
3. Determine ‘A’ from 𝑄=𝐴 𝑉𝑜
4. Knowing ‘D’ and ‗A‘ calculate the ‗Bed width‘B’
5. Knowing ‘B’ and ‘D’calculate the wetted perimeter ‘P’
6. Knowing ‘A’ and ‘P’ calculate hydraulic mean radius ‘R’
7. Calculate mean velocity of flow from the equation 𝑉=𝐶√ .
8. If critical velocity ratio is equal to 1 (m=1), then the assumed value of ‘D’ is correct.
9. If not revise the depth ‘D’
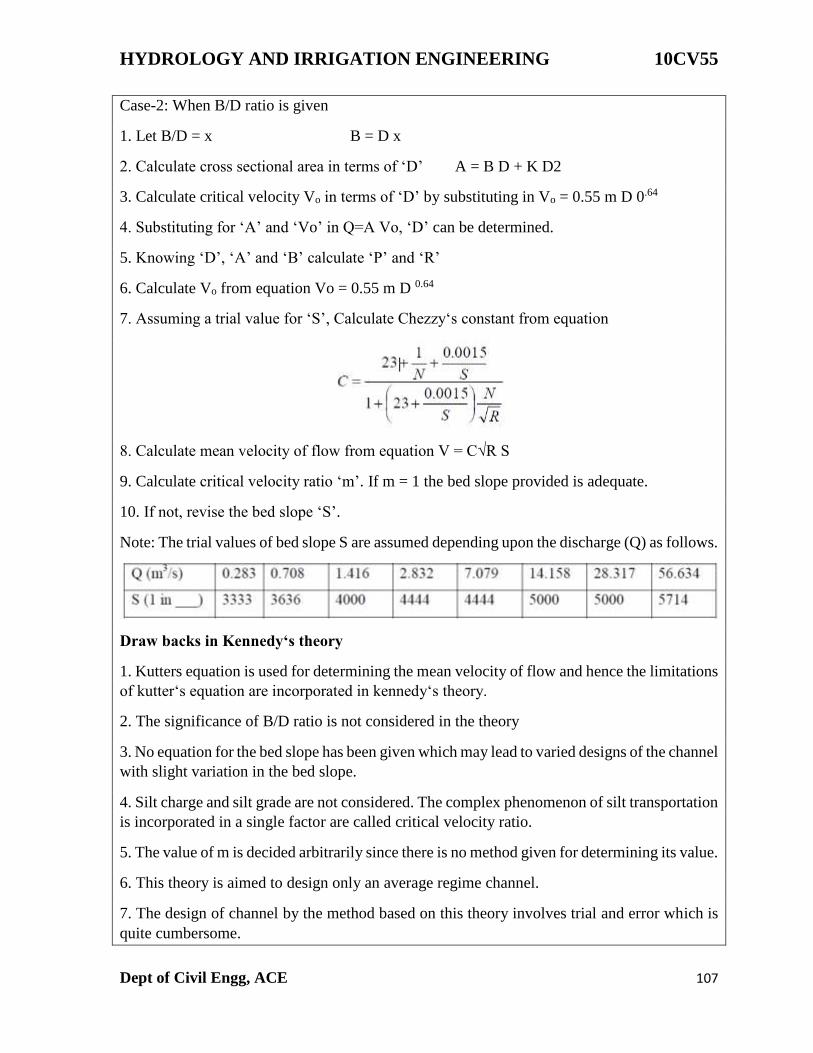
HYDROLOGY AND IRRIGATION ENGINEERING 10CV55
Dept of Civil Engg, ACE 107
Case-2: When B/D ratio is given
1. Let B/D = x B = D x
2. Calculate cross sectional area in terms of ‘D’ A = B D + K D2
3. Calculate critical velocity Vo in terms of ‘D’ by substituting in Vo = 0.55 m D 0.64
4. Substituting for ‘A’ and ‘Vo’ in Q=A Vo, ‘D’ can be determined.
5. Knowing ‘D’, ‘A’ and ‘B’ calculate ‘P’ and ‘R’
6. Calculate Vo from equation Vo = 0.55 m D 0.64
7. Assuming a trial value for ‘S’, Calculate Chezzy‘s constant from equation
8. Calculate mean velocity of flow from equation V = C√R S
9. Calculate critical velocity ratio ‘m’. If m = 1 the bed slope provided is adequate.
10. If not, revise the bed slope ‘S’.
Note: The trial values of bed slope S are assumed depending upon the discharge (Q) as follows.
Draw backs in Kennedy‘s theory
1. Kutters equation is used for determining the mean velocity of flow and hence the limitations
of kutter‘s equation are incorporated in kennedy‘s theory.
2. The significance of B/D ratio is not considered in the theory
3. No equation for the bed slope has been given which may lead to varied designs of the channel
with slight variation in the bed slope.
4. Silt charge and silt grade are not considered. The complex phenomenon of silt transportation
is incorporated in a single factor are called critical velocity ratio.
5. The value of m is decided arbitrarily since there is no method given for determining its value.
6. This theory is aimed to design only an average regime channel.
7. The design of channel by the method based on this theory involves trial and error which is
quite cumbersome.
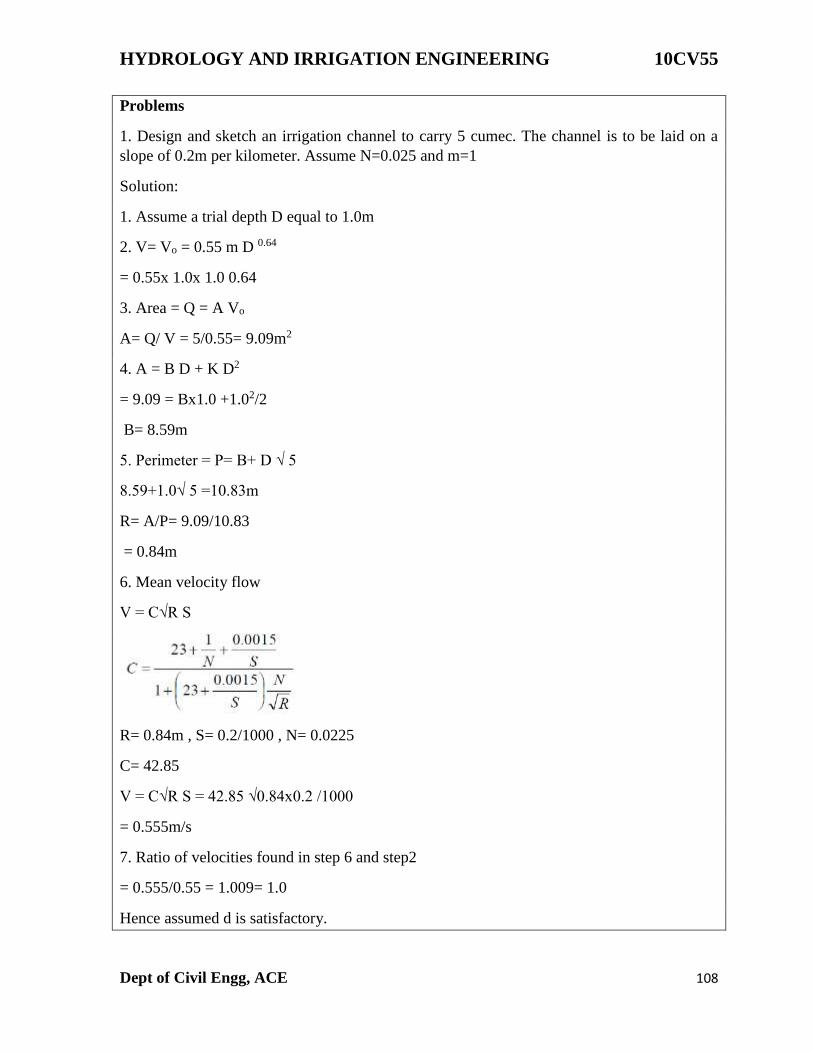
HYDROLOGY AND IRRIGATION ENGINEERING 10CV55
Dept of Civil Engg, ACE 108
Problems
1. Design and sketch an irrigation channel to carry 5 cumec. The channel is to be laid on a
slope of 0.2m per kilometer. Assume N=0.025 and m=1
Solution:
1. Assume a trial depth D equal to 1.0m
2. V= Vo = 0.55 m D 0.64
= 0.55x 1.0x 1.0 0.64
3. Area = Q = A Vo
A= Q/ V = 5/0.55= 9.09m2
4. A = B D + K D2
= 9.09 = Bx1.0 +1.02/2
B= 8.59m
5. Perimeter = P= B+ D √ 5
8.59+1.0√ 5 =10.83m
R= A/P= 9.09/10.83
= 0.84m
6. Mean velocity flow
V = C√R S
R= 0.84m , S= 0.2/1000 , N= 0.0225
C= 42.85
V = C√R S = 42.85 √0.84x0.2 /1000
= 0.555m/s
7. Ratio of velocities found in step 6 and step2
= 0.555/0.55 = 1.009= 1.0
Hence assumed d is satisfactory.
HYDROLOGY AND IRRIGATION ENGINEERING 10CV55
Dept of Civil Engg, ACE 109
2. Determine the dimensions of the irrigation canal for the following data B/D ratio = 3.7, N=
0.0225, m=1.0 and S= 1/ 4000 side slopes of the channel is ½ H : 1V. Also determine the
discharge which will be flowing in the channel.
Solution:
B/D = 3.7
B= 3.7D
For the channel with side slopes of 1/2H : 1V
From kennedy‘s equation ,
Vo = 0.55 m D 0.64
Vo = 0.55 D 0.64
Equating the two values of V, we get
0.55 D 0.64 = 0.975D1/2 / (1+0.781D-1/2)
0.55 D 0.64 + 0.4296D0.14 = 0.9795D1/2
Solving the above equation by trial and error , we get
D= 1.0m
B= 3.7m
V= 0.55m/s
A = B D + D2/2
A= 4.2m
Q= Ax V=4.2 x0.55
= 2.31 cumes
HYDROLOGY AND IRRIGATION ENGINEERING 10CV55
Dept of Civil Engg, ACE 110
Lacey‘s Regime Theory:
Lacey carried out a detailed study in designing suitable channels in alluvial soils. He developed
the regime theory and formulated a number of expressions based on his observations. The
salient features of Lacey‘s theory are stated as follows.
1. In a channel constructed in alluvial soil to carry a certain discharge, the bottom width, depth
and bed slope of the channel will undergo modifications by silting and scouring till equilibrium
is attained. The channel is now said to be a regime channel. (A regime channel is defined as a
stable channel whose bed width, depth and side slopes have undergone modifications by silting
and scouring and are so adjusted that equilibrium is attained.)
A channel is said to be in regime when the following conditions are satisfied.
a. The Channel is flowing in unlimited incoherent alluvium of the same character as that of the
transported sediment. (Incoherent alluvium is a soil composed of loose granular material which
can be scoured and deposited with the same ease.)
b. Silt grade (silt size) and silt charge (silt concentration) is the same throughout the channel.
c. Discharge in the canal is constant.
2. The silt carried by the flowing water in the canal is kept in suspension by vertical eddies
generated from the bed as well as from the sides of the canal.
3. The silt grade also plays an important role in controlling the regime conditions of the
channel. The silt factor is given by the relationship f=1.76√d where d represents diameter of
silt particle in mm.
Lacey‘s procedures for designing unlined canals:
In Lacey‘s method for designing unlined canals in alluvial soils for a known discharge ‘Q’ and
a mean diameter of silt particle ‘d’, the required quantities are calculated as follows.
1. The mean velocity of flow is computed from the relation.
Where Q is discharge in m3/s, f is silt factor given by f = 1.76√d, d is diameter of silt particle
in mm.
2. Calculate the cross sectional area of flow A = 𝑄
𝑉
3. Knowing the side slope express ‘A’ in terms of B and D A = B D + K D2
4. Determine the required wetted perimeter from the relationship P = 4.75 √𝑄-------(1)
5. Express the wetted perimeter in terms of B and D P = B + 2 D√1 + K2 -------------(2)
HYDROLOGY AND IRRIGATION ENGINEERING 10CV55
Dept of Civil Engg, ACE 111
6. From equations 1 and 2 solve for values of B and D
7. Calculate ‗Hydraulic mean radius‘ (R) from the relationship R=5
2[
𝑉2
𝑓]……….(3)
8. Also calculate hydraulic mean radius ‘R’ from the relationship
9. If the values of hydraulic mean radius ‘R’ worked out from equations 3 and 4 are the same
then the design is OK.
10. Calculated the Bed slope from the equation
Draw backs in Lacey‘s theory
1. The theory does not give a clear description of physical aspects of the problem.
2. It does not define what actually governs the characteristics of an alluvial channel.
3. The derivation of various formulae depends upon a single factor f and dependence on
single factor f is not adequate.
4. There are different phases of flow on bed and sides and hence different values of silt factor
for bed and side should have been used.
5. Lacey‘s equations do not include a concentration of silt as variable.
6. Lacey did not take into account the silt left in channel by water that is lost in absorption
which is as much as 12 to 15% of the total discharge of channel.
7. The effect of silt accumulation was also ignored. The silt size does actually go on
decreasing by the process attrition among the rolling silt particles dragged along the bed.
8. Lacey did not properly define the silt grade and silt charge.
9. Lacey introduced semiellipse as ideal shape of a regime channel which is not correct.
HYDROLOGY AND IRRIGATION ENGINEERING 10CV55
Dept of Civil Engg, ACE 112
Problems
1. Design a irrigation channel in alluvial soil according to Lace‘s silt theory for the following
data.
Full supply discharge= 10cumecs Lacey‘s silt factor= 0.9 Side slopes of channel= 1/2H: 1V
Solution:
1. Velocity =
2. The slope of a channel in alluvium is 1/4000, Lacey‘s silt factor is 0.9 and side slopes are
½ H : 1V. Find the channel section and maximum discharge which can be allowed to flow in
it.
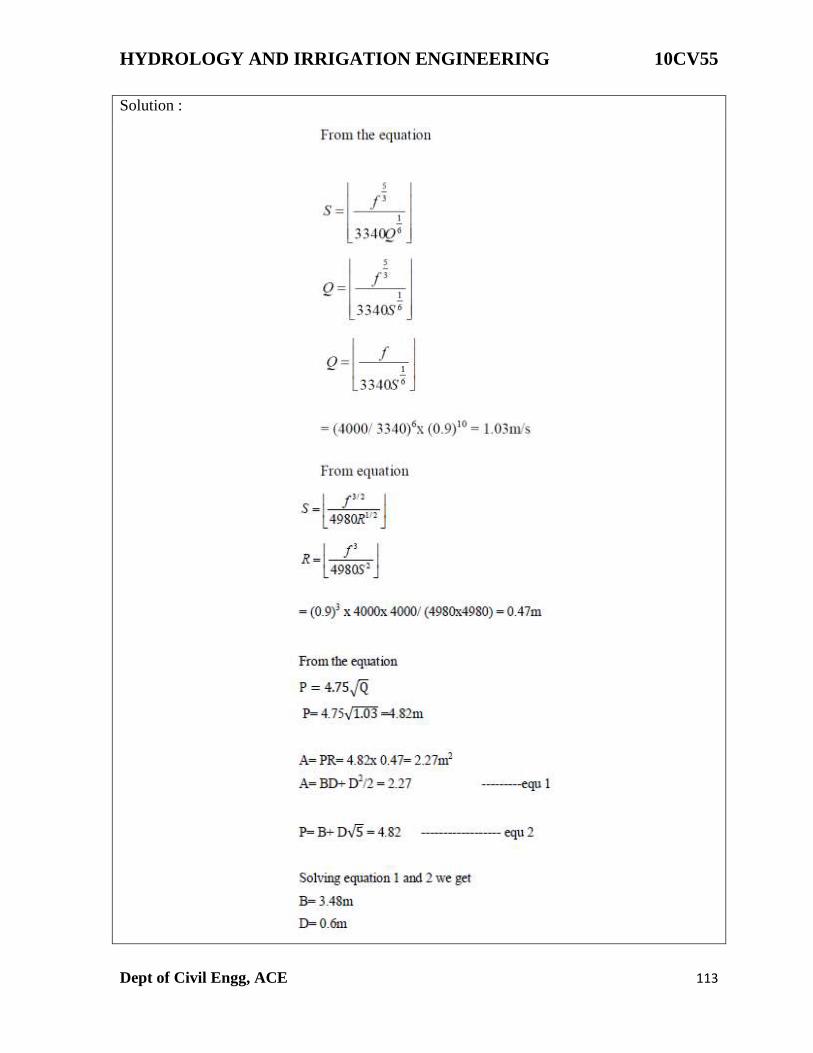
HYDROLOGY AND IRRIGATION ENGINEERING 10CV55
Dept of Civil Engg, ACE 113
Solution :

HYDROLOGY AND IRRIGATION ENGINEERING 10CV55
Dept of Civil Engg, ACE 114


![Hydrology and Irrigation Engineering 10CV55 - …vtusolution.in/uploads/9/9/9/...and_irrigation_engineering_[10cv55]... · PART-B - IRRIGATION ENGINEERING UNIT 5 : INTRODUCTION Introduction,](https://img.pdfslide.us/doc/110x75/5a9f15127f8b9a71178c4948/hydrology-and-irrigation-engineering-10cv55-10cv55part-b-irrigation.jpg)


![Civil-V-hydrology and Irrigation Engineering [10cv55]-Assignment](https://img.pdfslide.us/doc/110x75/563db837550346aa9a91a194/civil-v-hydrology-and-irrigation-engineering-10cv55-assignment.jpg)

![Civil-V-hydrology and Irrigation Engineering [10cv55]-Notes](https://img.pdfslide.us/doc/110x75/563db8d4550346aa9a975041/civil-v-hydrology-and-irrigation-engineering-10cv55-notes-568dc46ed8af7.jpg)
![Civil-V-hydrology and Irrigation Engineering [10cv55]-Solution](https://img.pdfslide.us/doc/110x75/563db8d4550346aa9a975055/civil-v-hydrology-and-irrigation-engineering-10cv55-solution.jpg)

![CIVIL-V-HYDROLOGY AND IRRIGATION ENGINEERING [10CV55]-NOTES.pdf](https://img.pdfslide.us/doc/110x75/577cc1711a28aba7119311b2/civil-v-hydrology-and-irrigation-engineering-10cv55-notespdf.jpg)