Embed Size (px)
Citation preview

International Water Technology Journal, IWTJ Vol. 4- N.2, June 2014
90
HYDROLOGICAL IMPACTS OF IRAQI BADUSH DAM ON GROUNDWATER
AQEEL Al-ADILI
1, SALEH KHASAF
2 AND AWS AJAJ
3
1 University of Technology, P.O. Box; 46027, Baghdad, Iraq, e-mail; [email protected]
2University of Kufa, College of Engineering, Najaf, Iraq.
3University of Anbar, College of Engineering, Ramadi, Iraq.
ABSTRACT
An environmental and groundwater impact assessment (EIA) study has been carried out, in order
to predict the effects of the proposed Badush dam on groundwater after 10 and 20 years after
construction, in view of its wide range of environmental impacts, both positive and negative. The
environmental impact assessment was drawn by comparison between the calculated results before and
after the dam building, using a groundwater flow model (Modflow). These calculations were
performed for two conditions of the reservoir storage: normal stage (245.5m a.s.l..) And maximum
stage (i.e., stressed: 307m a.s.l.), for a steady state single layer modeling.
The simulation of EIA for 10 and 20 years post construction in this model revealed that there is a
good compatibility between observed piezometric heads and calibrated groundwater heads. The dam
has a substantial impact on the storage in the aquifer (as the storage increases). Likewise, the dam
has a high effect on the quantity of groundwater inflow and outflow of the artificial lake. This study
concluded that about 2.5 times more groundwater inflow or outflow occurs in case of reservoir stage
of 307 m a.s.l. Than for reservoir stage of 245.5 m a.s.l.. The example indicates that the groundwater
is flowing towards the river before dam construction, while later the dam construction the reservoir
becomes a region of net recharge to the aquifer.
Keywords: Dam. ModFlow, Model, Simulation, Environmental impact.
Received: 3April, Accepted 18April
1. INTRODUCTION
Building dams to supply water and establishing power plants to generate electricity are all
necessary actions for people to have a comfortable life. Yet, no matter how necessary those
development projects are, the negative impacts on the environment must be counted and the project
justified in relation to environmental considerations. So, it's very important in the design stage of a
project to strike into account not only the social and economic aspects of the task, but also
environmental protection considerations. Environmental impact assessment (EIA) brings home the
bacon for the environmental impacts of development projects to be surveyed, forecasted and evaluated
by proponents in the operation of planning the project (Ministry of the Environment [1]). EIA of such
large-scale projects is real important for preventing environmental degradation and promoting a
sustainable company.
The anticipation of the impingements on the physical environment (erosion, water quality and
quantity) seems to have moved on to the usage of mathematical models and other appropriate
techniques Sacks et al. [2].
This work was concentrated on the EIA of the proposed Badush dam (as a case study), which will
be built along the Tigris River near Mosul city, in terms of impact on the groundwater, water balance
and budget. In fact, the construction will shift the upstream storage of the reservoir, especially in the

International Water Technology Journal, IWTJ Vol. 4- N.2, June 2014
91
event of bankruptcy of the Mosul dam (if it takes place) due to the disintegration of the gypsum
located beneath the dam foundation. The studied effects include: (i) the storage capability of the
aquifer; (ii) the elevations of ground-water in the surrounding aquifer and groundwater flow patterns
(this could affect the foundations strength of the nearby buildings) as well as irrigation, municipality
projects, (iii) The amount of soil-water inflow and outflow of the artificial lake.
The purpose of this research is for measuring the environmental impacts of the proposed Badush
dam on the groundwater after 10 and 20 years post construction, at normal storage (natural condition)
and maximum storage (stressed condition, in case of failure of Mosul dam) for the reservoir. It should
be mentioned here that the mussel dam, which is built near a large city (Mosul city) may be seen as an
instance of such condition (dam built on sedimentary rocks Limestone or Gypsum) near the cities, and
problems associated with its bankruptcy may be met in other urban centers with similar weather.
A groundwater flow model -Visual MODFLOW Package has been enforced in this study to depict
the environmental impact (both positive and minus) of proposed Badush dam on groundwater, water
balance and budget, with a peculiar focus on the reservoir stage as an important restraint on these
shocks.
In such proposed project, the impingement of the infrastructure construction must be predicted and
calculation must be established in order to lessen the negative impacts. This is the primary reason for
using a simulation modeling tool such as MODFLOW, which can give the post construction effects on
the land and open water with high detail.
2. FUNDAMENTALS OF EIA
Environmental Impacts Assessment (EIA) is the process of identifying, predicting, evaluating and
managing the biophysical, social, health and other relevant effects of development proposals before
major decisions are taken and commitments are made. The range of EIA includes consideration of all
potentially significant effects direct, indirect and cumulative Sadler et al [3].
The environmental impacts of projects are usually set during the former stages of project
preparation, site selection and design Sadler [4].
The purpose of an EIA is to identify possible impacts of a purposed project, in parliamentary
procedure to evaluate the significance of the potential adverse impacts, and to decide whether the
possible adverse impacts could be avoided or minimisedby mitigation measures, so that any residual
adverse impacts would not present a substantial risk to the environment in the long term Ross [5]. EIA
is now used worldwide as an official document for development planning and control Sadler, et al.[3].
The primary advantages and benefits of EIA are summarisedas follows Abaza [6]:
• Improved project design/sitting;
• Increased accountability and transparency during the development process.
• Improved integration of projects into their environment and societal context.
• Reduced environmental damage;
• More effective projects in terms of filling their financial and/or socio-economical objectives.
3. GENERAL CHARACTERISTICS OF THE PROPOSED BADUSH DAM
The final proposals for the Badush dam were outlined by the ENERGOPROJEKT company in
1988. According to this proposal, theBadush dam project is located on the Tigris River, approximately
40km downstream from the existing Mosul dam and approximately 15km upstream of Mosul city
(Fig.1). Table1, shows the general data for the proposed Badush dam ENERGOPROJEKT[7].

International Water Technology Journal, IWTJ Vol. 4- N.2, June 2014
92
Fig.1: Satellite Image of the study area (Badush dam).

International Water Technology Journal, IWTJ Vol. 4- N.2, June 2014
93
Table1:General data of the proposed Badush dam (from
http://www.medingegneria.it/files/download/BADUSH.pdf).
General data of the dam Units
Annual average discharge 667 m
3/s
Maximum probable flood 27000 m
3/s
Design flood during operation 8000 m
3/s
Maximum reservoir level (in case of Mosul Dam
failure)
307 m.a.s.l
Design flood level 250 ma.s.l.
Normal reservoir level 245.5 m.a.s.l.
Minimum reservoir level 243.8 m a.s.l
Spillway capacity 4000 m3/s
Outlet capacity 8000 m3/s
Dam crest level 312 ma.s.l
Maximum height of the main dam 92 ma.s.l
Length of the Dam crest 3.730 km
Spillway crest level of the Concrete Dam 294.7 ma.s.l
Maximum height of the Concrete Dam 102 ma.s.l
Length of the Concrete Dam 248
According to ENERGOPROJEKT [7] the new dam is mainly designed for the following purposes:
1. Flood protection of the downstream region of the Tigris River valley against the effect of the
potential Mosul dam failure, due to any possible reason.
2. Power generation, by using water discharged by the Mosul dam and by the regulating scheme
power plants. Therefore about 15 m head is provided for Badush hydroelectric power plants.
3. For a normal regime (up to 1/10,000 year flood) the Badush dam has to guarantee the operation of
the Mosul power plant as well as of the power plant of the regulating scheme by discharging
variable quantities of water, limited to 8000 m3/sec for the safety of Mosul city.
Climatic elements have been playing a main role in determining the relationship between the rain
(falling, infiltrating, and evaporating), and the recharge of ground-water. Climate information for
study area has been taken from the Mosul station for the period 1980-2010, (Meteorological directory-
Iraq, 2012).
The rainy season begins in October (13.31 mm) and it lasts till June (1.54 mm), reaching its
maximum in March (65.93 mm), while rainfall during the dry season July–September is
approximately zero (Fig.2). Therefore, an annual recharge of 32mm and annual evapotranspiration of
167mm were specified as model inputs for the aquifer (Al-Forat Center For Studies And Design Of
Irrigational Project [8]).

International Water Technology Journal, IWTJ Vol. 4- N.2, June 2014
94
Fig.2: Mean monthly rainfall recorded at the Mosul station for a period (1980-2010).
4. HYDROGEOLOGY
Groundwater is formed in the sediments of the upper far group of Miocene and Quaternary deposits
(EEO "AGROCOMPLECT" [9]). The Miocene formations and Quaternary deposits were considered
as one hydrogeologic unit (aquifer). The mud-incisive components located within Miocene formations
in the form of lenticular shape have no specific terms covering over some sites in the aquifer, which
makes the aquifer semi confined (Al-Forat Center [8]).
Analysis of aquifer-test data indicates that the horizontal hydraulic conductivity ranges from 3m/d
to more than 11.5m/day (ENERGOPROJEKT[7]), and the storage coefficient ranges from 4.7x10⁻⁴
to
23x10-4
(Al-Forat Center) Since the simulation runs as a steady state, the storage coefficient is
neglected in this model.
Drainage (outflow) of the aquifer direction is towards the Tigris river valley. The recharge (inflow)
is mainly through rainfall and partially through the lower laying aquifer (EEO "AGROCOMPLECT",
[9]. For this reason, the inflow from the surrounding aquifer will be neglected in this model.
5. MODEL CONFIGURATION
5.1. Steady-State Simulations
The transient flow equation becomes the steady-state flow equation when the storage term is zero.
For steady-state simulations, there is no direct requirement for the initial head, because the time
derivative is removed from the flow equation (McDonald, and Harbaugh [10]).
The factors governing the EIA of dams on groundwater, include the reservoir stage, a special
distribution of aquifer hydraulic properties, discharge boundaries, and recharge. An accurate
assessment of EI of the dam requires simultaneous consideration of those factors.
0
10
20
30
40
50
60
70
JA
N.
FE
B
MA
R
AP
R
MA
Y
JU
N
JU
L
AU
G
SE
P
OC
T
NO
V
DE
C
Month
Mo
nth
ly r
ain
fall m
m

International Water Technology Journal, IWTJ Vol. 4- N.2, June 2014
95
5.2. Model Design and Discretization
Groundwater flow in the aquifer was simulated as a three-dimensional, steady state, single layer,
and semi-confined aquifer system as described in the above sections.
The dimensions and numbers of rows and columns of the model grid result from the following
considerations: (i) adequate representation of aquifer geometry, hydraulic properties, and stresses; (ii)
minimization of computation time, and (iii) suitability of grid spacing for the application of the Visual
MODFLOW program.
Grid cell dimensions range from about 500m on each side of the Badush dam and Mosul city to
nearly 1000m along the boundaries of the model area (Fig.3). The grid cell size increases as the
distance from the dam and Mosul city increases, due to insufficient hydrogeologic data to support finer
grid spacing.
6. MODEL ANALYSIS
6.1. Model Geometry and Hydraulic Properties
A thickness of about 350m and horizontal hydraulic conductivity of 9m/d was specified as model
inputs for the aquifer. All four sides of the model grid are set as no-flow boundaries. These boundaries
are aligned approximately parallel to regional flow paths through the aquifer within the study area
(Fig.3).
The model has been used to assess the environmental impact of the dam on groundwater in the
surrounding aquifer under natural conditions (normal reservoir storage), where the reservoir stage is
245.5 m above sea level, and stressed conditions (maximum reservoir storage) where the reservoir
stage is 307 m above sea level, in the steady-state conditions.
Geological data from well logs and results of an aquifer test conducted in wells field provided the
basis for these inputs. The test of the aquifer has used four installed wells A, B, C, and D with a depth
of 50, 90, 100, and 177 respectively. All of these wells were installed as observation wells for the test
(Fig.3).

International Water Technology Journal, IWTJ Vol. 4- N.2, June 2014
96
Fig.3:Model grid, boundaries, and observation wells used for the Badush dam.
6.2. Model Boundary Conditions
The Tigris River is a head-dependent flux boundary. This boundary simulates the outflow from the
model as discharge to the Tigris river valley, which is considered to be the only mechanism of
discharge from the aquifer.
River bed conductance value was specified in the head-dependent flux boundary. This value
indicates the effectiveness of the hydraulic connection between the Tigris River and the aquifer. A
conductance of 1300 m2/d was specified in the head-dependent flux boundary.
The river stage specified in the head-dependent flux boundary was 228m a.s.l, this stage represents
the condition before construction of the Dam, and it's used for model calibration. While the upstream
head-dependent flux boundary for the dam was 245.5, and 307m a.s.l. Which represent normal, and
maximum reservoir storage respectively.
The river stage specified on down-stream was specified to be 17, and 18.5m lower than up-stream
stage for normal and maximum reservoir storage respectively ENERGOPROJEKT [7].
6.3. Model Calibration
To calibrate the groundwater heads, the hydrological data of the aquifer and river were used as
model inputs before the Dam construction.
Figure 4 shows the calculated hydraulic heads for calibrating ground-water flow model. Calibration
of the model was done primarily by comparison of simulated to observe groundwater levels for wells

International Water Technology Journal, IWTJ Vol. 4- N.2, June 2014
97
A, B, C, and D. The observed water levels in these wells were assumed to represent zero-pumping
steady state conditions of the aquifer.
The model was calibrated by adjustment of the riverbed conductance value at the head-dependent
flux boundary. The calibration is to produce residual (observed minus simulated) hydraulic heads as
shown in Table 2.
Fig.4: Calibrated hydraulic heads (m) for the ground-water flow model.
Table2: Residual Hydraulic Heads in the model.
Wells
Observed
Hydraulic
Heads
Simulated
Hydraulic
Heads
Residual
hydraulic heads
(m)
A 227.95 227.5 0.45
B 227.98 227.94 0.04
C 228.51 228.27 0.24
D 228.24 228.44 -0.2
6.4. Model Sensitivity
A sensitivity analysis of the calibrated model was made based on changes in the model-computed
hydraulic heads at four wells identified as A, B, C, and D; all of these wells were used as observation
wells.
The hydraulic heads are most sensitive to changes in the river stage of the head dependent flux
boundary. A change in the river stage of 1% result a change of less than 1% in hydraulic heads.
Figure5 shows the sensitivity of hydraulic heads to changes in river stage.

International Water Technology Journal, IWTJ Vol. 4- N.2, June 2014
98
Moreover, change in horizontal hydraulic conductivity of one order of magnitude resulted in
changes of -1.8% to 3.6% in hydraulic heads, this indicate that as the horizontal hydraulic conductivity
increases the hydraulic heads increase, because the ability of an aquifer to transmit water increase.
While, the model is least sensitive to river bed conductance and recharge.
Fig.5: Sensitivity of hydraulic heads vs. Changes in river stage for the observation wells.
7. RESULTS AND DISCUSSIONS
7.1. Impact of the dam on aquifer storage
A comparison between the aquifer storage before and after construction of theBadush dam has been
made in order to investigate the storage increase.
The simulation of 10 years effects in the framework of the EIA model (post dam construction)
indicates that the storage of the aquifer is increased by 52.4% and 79.5% for natural and stressed
storage conditions, respectively. While the increasing in storage for the future 20 years (post dam
construction) are 93.5% and 97.2%, for the natural storage condition and stressed storage condition
respectively (Table3).
Table 3: Aquifer storage before and after 10 and 20 years post dam construction for both
Natural and stressed conditions.
Before dam
Construction 10 years after dam Construction 20 years after dam Construction
River stage 228
m ASL
Normal
condition
(reservoir stage
245.5 m a.s.l)
Stressed
condition
(reservoir stage
307 m a.s.l)
Normal
condition
(reservoir stage
245.5 m a.s.l)
Stressed
condition
(reservoir stage
307 m a.s.l)
Total Storage
(m3)
1.00×10⁸
Total Storage
(m3)
2.10×10⁸
Total Storage
(m3)
4.88×10⁸
Total Storage
(m3)
1.54×10⁹
Total Storage
(m3)
3.584×10⁹
The storage increase in the aquifer after 20 years will be large in comparison to 10 years, with
percentage, approximately 41% and 18% for natural and stressed storage conditions respectively.
Also, simulation results indicate that the reservoir becomes a region of net recharge to the aquifer.
Converting surface-water within the reservoir into groundwater has two benefits: (I) flood control to
Mosul city and to cultivated lands downstream the dam, and (ii) groundwater investment, because the
227
228
229
230
231
232
233
234
235
236
237
0 0.5 1 1.5 2 2.5 3 3.5
INCREASE IN RIVER STAGE (%)
HY
DR
AU
LIC
HE
AD
(m
) obs. Well A
obs. Well B
obs. Well C
obs. Well D

International Water Technology Journal, IWTJ Vol. 4- N.2, June 2014
99
groundwater delivered from these wells has a good quality and can be used for aquatic life and
domestic use.
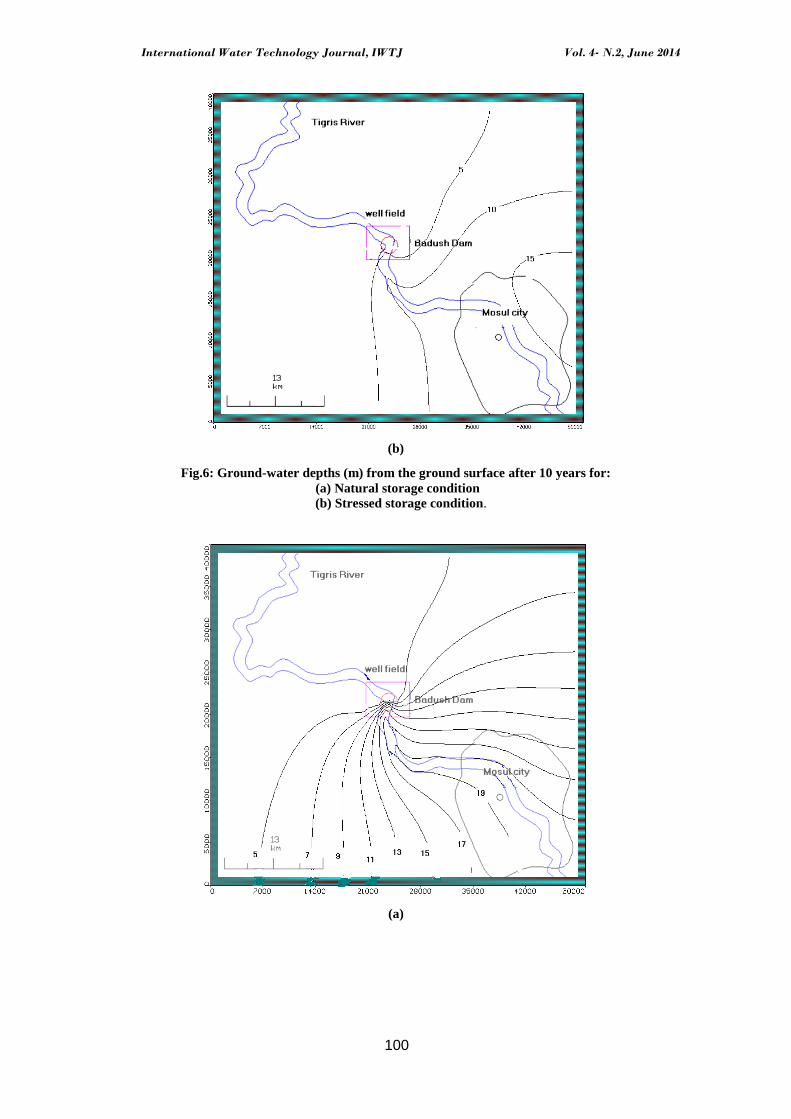
7.2. Impact on the groundwater levels
The evaluation of dam impact on the groundwater levels and subsurface structural foundations of
the study area has been done by evaluating a contour map of groundwater depths and their distribution
under and near the foundations of adjacent buildings, to explore if the groundwater levels (water-table)
is less than3m from the ground surface (Fig. 6a and b) and (Fig.7a and b), being this depth considered
as the critical depth at which the groundwater affects the foundation of the nearby buildings within the
study area.
The results of 10 years of EIA model show that the nearest contour to the ground surface is 5m
(Fig.6b), this indicates that the dam has no effect on the foundations of the nearby buildings of the
study area. Instead, the results for 20 years show that the nearest contour to the ground-surface is 3m
(Fig. 7b), indicating that the dam may have negative effects on the foundations of the nearby buildings
of the study area, because the water table rises near these foundations.
(a)
International Water Technology Journal, IWTJ Vol. 4- N.2, June 2014
100
(b)
Fig.6: Ground-water depths (m) from the ground surface after 10 years for:
(a) Natural storage condition
(b) Stressed storage condition.
(a)

International Water Technology Journal, IWTJ Vol. 4- N.2, June 2014
101
(b)
Fig.7: Ground-water depths (m) from the ground surface after 20 years for:
(a) Natural storage condition
(b) Stressed storage condition.
The calculated inflow and outflow of the reservoir under natural and stressed conditions are
summarized in Table4.
Steady-state simulation of 10 years in this model indicates that the total inflow to the reservoir is
about 210326 m3/d for natural storage condition, and 488066 m
3/d for stressed storage condition,
while a result of 20 years indicates that the total inflow 224696 m3/d to the reservoir for natural
storage and 504906 m3/d for stressed storage (Table4). However, the study showed that the total rate
of water outflow from the reservoir is210180 m3/d and 487890 m
3/d of natural and stressed storage
condition respectively, and the simulation of 20 years found these values were 224547.7m3/d and
504700 m3/d for natural storage and stressed
Storage conditions, respectively.
The results for both 10 and 20 years of EIA model indicate that the reservoir stage has a strong
effect on the amount of groundwater recharge (inflow) and discharge (outflow) for the reservoir. It is
revealed that the inflow and outflow rate are about 2.5 times for stressed stage than normal stage.
The potential benefit of the increased amount of water inflow to the reservoir relates to the
provision of irrigation. In the absence of flat and cultivable land around the area of the dam, this
benefit would primarily relate to improved irrigation downstream in the dry seasons, which represents
a positive impact.

International Water Technology Journal, IWTJ Vol. 4- N.2, June 2014
102
Table 4: Simulated groundwater inflow and outflow of the reservoir
Before dam
Construction
After 10 years of dam
Construction
After 20 years of dam
Construction
River stage
228 m a.s.l
Natural
condition
(reservoir
stage 245.5 m
a.s.l)
Stressed
condition
(reservoir
stage
307 m a.s.l)
Natural
condition
(reservoir
stage 245.5 m
a.s.l)
Stressed
condition
(reservoir
stage 307 m
a.s.l)
Sources
Inflo
w
Outflo
w Inflow
Outflo
w Inflow
Outflo
w Inflow
Outflo
w Inflow
Outflo
w
River
leakage
(m3/d) 95443
11038
0
20484
0
38812
0
16275
0
12475
0
21952
0
40496
0
17237
0
Recharge
(m3/d) 99949 99946 99946 99946 99946
Evapotra-
separation
(m3/d) 4503.1 5340 325140 5027.7 332330
Total
(m3/d) 99949 99946.1 210326 210180 488066 487890 224696 224547 504906 504700
7.3. Impact on groundwater flow patterns
Numerous factors affect the groundwater exchange with the reservoir; these factors include
recharge, reservoir stage, and physical features such as reservoir depth, basin steepness, and degree of
confinement between the reservoir and aquifer (Abazaet [6]).
For what regards the groundwater flow, Fig.8, Fig.9a & b and Fig. 10a& b shows the flow paths for
the simulations of 10 and 20 years in this model. The head gradient between the reservoir water
surface and the adjacent surficial aquifer will influence the groundwater flow.
Fig.8: Velocity vectors showing the groundwater flow directions before dam construction.

International Water Technology Journal, IWTJ Vol. 4- N.2, June 2014
103
(a)
(b)
Fig.9: Velocity vectors showing the ground-water flow directions for 10 years after the dam
Construction (a) for natural condition
(b) At stressed condition.

International Water Technology Journal, IWTJ Vol. 4- N.2, June 2014
104
(a)
(b)
Fig.10: Velocity vectors showing the ground-water flow directions for 20 years post dam
Construction (a) at natural condition.
(b) At stressed condition.

International Water Technology Journal, IWTJ Vol. 4- N.2, June 2014
105
The effects of velocity vector distribution in the aquifer showed that, the groundwater flow is mostly
toward the river for the conditions of freedom construction (Fig.8). This is because the groundwater
level is more eminent than the water surface in the river. On the other hand simulation of 10 and 20
years post dam construction under natural storage condition showed that the water is outflowing from
the reservoir at the upstream. Then generally flows towards aquifer and finally recirculating into the
Tigris river downstream (Fig.9a) and (Fig.10a), due to the fact that the water layer in the reservoir
becomes higher than the groundwater level in the surrounding aquifer. Also higher than the Tigris
river level, too.
Figures9b and Fig.10b show that the water is an outflowing from both the reservoir (upstream) and
the Tigris river (downstream), because their water levels get more eminent than the groundwater level.
The construction of theBadush dam leads to groundwater flow direction going towards Mosul city,
if there is a contaminant source (such as sewage systems, oil leak, etc.) Near the dam, in this case the
groundwater flow would carry this contaminant towards Mosul city, making significant contamination
of the groundwater within the aquifer near Mosul city.
8. CONCLUSIONS
From the results obtained in this study the following conclusions have been drawn:
Simulation results indicate that there is a compatible result between observed and
simulated heads. Besides, the present study shows a successful application of
MODFLOW in analyzing the response of ground and surface water to the construction of
Badush dam. The solutions obtained are found to be applicable and could be useful for
future studies for such proposed dams in Iraq or other nations.
The simulation of 10 years for EIA of Badush dam indicates that the storage after dam
construction is increased by 1.10×10⁸ m
3 and 2.78×10
8 m
3 2.78×10
8 m
3 for the natural
and stressed storage conditions respectively. While simulation of 20 years of the EIA
model indicates that the storage is increased by 1.54×10⁹
m3 and 3.58×10
9 m
3 of natural
and stressed storage, respectively, with an increasing percentage of 41 % and 18 % for
natural and stressed storage conditions respectively. This concludes indicate that the dam
causes a high effect on the memory of the aquifer.
The impacts upon the foundations of the nearby buildings due to go up in groundwater
levels, for long-terms like 20 years show that the dam may cause a negative impact on the
foundations of nearby buildings, while it bears no consequence after the first10 years.
Further investigation is required to assess this rise in the groundwater level as a possible
danger to the nearby construction.
The outcomes show that the dam causes a high effect on the quantity of groundwater
inflow and outflow of the artificial lake. The calculated groundwater inflow and outflow
increase as the reservoir stage increases. This increasing is about 2.5 times more for
groundwater inflow and outflow and occurs in stressed storage than natural storage.
The dam has a high effect on the groundwater flow directions due to jump in water level
of the reservoir, which produces a high heat gradient between the reservoir water surface
and the adjacent surficial aquifer.
The dam will make for a substantial role for the safety and stability of the large Mosul
city, in terms of protection from floods.

International Water Technology Journal, IWTJ Vol. 4- N.2, June 2014
106
REFERENCES
[1]. Ministry of Environment, Environmental Impacts Assessments in Japan, Environmental Impact
Assessment Division, Environmental Policy Bureau, Government of Japan, pp.1, Japan, 1998 .
[2]. Sacks, L. A., And Others, Estimating Ground-Water Exchange With Lakes Using Water-Budget
And Chemical Mass-Balance Approaches For Ten Lakes In Ridge Areas Of Polk And Highlands
Counties, Florida, U.S. Geological Survey, Water Resources Investigation Report 4133,1988.
[3]. Sadler, B., and others, V.2 Environmental and Social Impact Assessment for Large Scale Dams,
World Commission on Dams Secretariat, 2000.
[4]. Sadler, B., Environmental and Social Impact Assessment for Large Dams - Thematic Review
from the Point of View of Developing Countries, World Commission on Dams Secretariat,
Independent Expert,pp.2,Brazil,1992.
[5]. Ross, M. K., Expansion of Ash Lagoon Boundary Dam Power Station, Estevan, Saskatchewan,
Saskatchewan Power Corporation, Technical Review Comments on the Environmental Impact
Statement,2006.
[6]. Abaza, H., Environmental Impact Assessment and Strategic Environmental Assessment:towards
an Integrated Approach, the United Nations Environment Program (UNEP),2004.
[7]. ENERGOPROJEKT, Badush Dam Project 265, Feasibility Study, Preliminary Report for
BadushDam Project, Vol. 1,1988.
[8]. Al-Forat Center For Studies And Design Of Irrigational Projects, Interior Reports For Overlying
Aquifers And Chemical Compassion For The Wells Drillings in Western of Sinjar: Results of
Pumping".From Wells, Block 8, Vol III, pp110, Iraq,1987.
[9]. EEO "AGROCOMPLECT", Preliminary Report For The Execution Of Badush Dam Project On"
Turn Key Basis", Sofia, Bulgaria, for Ministry of Irrigation, Iraq,1984.
[10]. McDonald, M.G. and Harbaugh, A.W., A modular three-dimensional finite-difference ground-
water flow model, U.S. Geological Survey Techniques of Water-Resources Investigations, book
6,1988.