Embed Size (px)
Citation preview

GEOG309-14S2 Research Methods in Geography
Hydrological Characteristics of Lake Kate Sheppard
Emma Barr, Duncan Keenan, Vanessa Price,
Nathan Townsend & Harry Young
13th October 2014

Emma Barr, Duncan Keenan, Vanessa Price, Nathan Townsend & Harry Young Hydrological Characteristics of Lake Kate Sheppard
2
GEOG309-14S2 Research Methods in Geography
Table of Contents
1. Executive Summary………………………………………………………………………………………………………..3
2. Introduction……………………………………………………………………………………………………………………4
3. Theoretical Framework and Literature Review………………………………………………..…………….5
4. Methodology………………………………………………………………………………………………………………….5
4.1 Tidal Processes…………………………………………………………………………………………………………5
4.2 Lake Bathymetry………………………………………………………………………………………………………6
4.3 Water Quality…………………………………………………………………………………………………………..6
5. Results……………………………………………………………………………………………………………………………7
5.1 Tidal Processes…………………………………………………………………………………………………………7
5.2 Lake Bathymetry………………………………………………………………………………………………………8
5.3 Water Quality…………………………………………………………………………………………………………10
5.3a CT2X continuous measurement…………………………………………………………….………10
5.3b Spot-testing Eureka MANTA2…………………………………….…………………………………11
5.3c. Continuous-testing Eureka MANTA2…………………….……………………………………...13
6. Discussion…………………………………………………………………………………………………………………….20
6.1 Tidal Processes……………………………………………………………………………………………………….20
6.2 Lake Bathymetry…………………………………………………………………………………………………….21
6.3 Water Quality…………………………………………………………………………………………………………21
6.3a CT2X continuous measurement….………………………………………………………………..…21
6.3b Eureka MANTA2 spot and continuous-testing…………………………………………………22
6.4 Mahingā Kai……………………………………………………………………………………………………………23
6.5 Limitations……………………………………………………………………………………………………………..24
7. Conclusion……………………………………………………………………………………………………………………24
8. Acknowledgements………………………………………………………………………………………………………25
9. References……………………………………………………………………………………………………………………26
10. Appendices………………………………………………………………………………………………………………..…28

Emma Barr, Duncan Keenan, Vanessa Price, Nathan Townsend & Harry Young Hydrological Characteristics of Lake Kate Sheppard
3
GEOG309-14S2 Research Methods in Geography
1. Executive Summary
The aim of this project was to analyse several different hydrological characteristics of
Lake Kate Sheppard, a man-made urban lake in Christchurch’s Residential Red Zone. Lake Kate
Sheppard was originally designed as a floodwater holding system, allowing excess flood water
from the Avon River to transit into Travis Wetland. Following the Canterbury earthquakes in
2010 and 2011, many aspects of the lake have been significantly altered. This project was
inspired by the Avon-Ōtākaro Network, a group interested in investigating the suitability of Lake
Kate Sheppard as an exemplar for mahingā kai, and in particular whitebait.
With support from the Avon-Ōtākaro Network, the following physical properties were
surveyed: tidal processes, lake bathymetry, and various aspects of water quality.
Findings reveal significant oscillations in the lake water level due to tidal influences.
These substantial fluctuations were mirrored by water quality changes, in particular salinity.
Temperature, conductivity, dissolved oxygen, pH, nitrate and oxidation redox potential levels
showed various spatial distribution patterns, affected by changes in bathymetry. A bathymetric
map was produced of Lake Kate Sheppard using a sonar instrument attached to a jet boat. The
map revealed a deeper southern basin that contained a tidal island that gradually became
shallower moving northward into a channel. The volume of Lake Kate Sheppard during a high-
tide is 31,102 m3. Lake Kate Sheppard is linked to a larger waterway network; there are culvert
connections to the Avon River, Travis Wetland, and Anzac Drive Reserve.
These findings are base-line representations of the hydrological characteristics in Lake
Kate Sheppard. This will supply the Avon Ōtākaro Network with initial hydrological
measurements relevant to mahingā kai. These results are only indicative, further research is
required to ensure Lake Kate Sheppard’s success as a mahingā kai exemplar.

Emma Barr, Duncan Keenan, Vanessa Price, Nathan Townsend & Harry Young Hydrological Characteristics of Lake Kate Sheppard
4
GEOG309-14S2 Research Methods in Geography
2. Introduction
The physical geography of Lake Kate Sheppard (LKS) is of particular interest to the Avon-
Ōtākaro Network (AvON). Founded in 2011 following the Canterbury earthquake sequence,
AvON is a network of individuals and organisations with a vision of creating a natural reserve
from the Residential Red-Zone around the Avon River. AvON aims to restore and re-develop
mahingā kai in greater Christchurch, recognising the importance of mahingā kai for cultural and
heritage values (Avon-Ōtākaro Network, 2013). LKS influences the wider Canterbury
hydrological system; information regarding its hydrological dynamics will assist in developing
greater understanding of the wider Residential Red-Zone catchment. The information below
influenced this project’s collection and processing of data concerning LKS.
LKS is an urban man-made lake in Anzac Drive Reserve, located in the eastern suburbs of
Christchurch. During the earthquake sequence of 2010 and 2011, LKS was significantly altered
by liquefaction and lateral spreading (Zhang & Carrick, 2014). Many private properties
surrounding the lake are ‘red-zoned’, unfit for residential use. Originally, LKS was designed as a
floodwater holding system, allowing excess flood water from the Avon River to transit into
Travis Wetland (Zhang & Carrick, 2014). This system had the capacity to hold large volumes of
flood water before slowly releasing it back into the Avon River (Appendix 3) (Zhang & Carrick,
2014). Preceding the earthquakes, LKS was known as a successful īnanga (whitebait) spawning
ground.
The aim of this project is to provide AvON with initial hydrological measurements,
encouraging further investigation of LKS’ potential to successfully host īnanga and other
mahingā kai resources. The three properties investigated by this project are tidal processes,
lake bathymetry and water quality. These three characteristics were chosen as they are
significant to the establishment of a successful mahingā kai site. Quantitative, experimental
data was collected using a variety of instruments. This project’s focus was to investigate the
current hydrological characteristics of LKS; there is no emphasis on comparing pre and post-
earthquake data.
This report is structured using the three hydrological properties under investigation:
tidal processes, lake bathymetry, and water quality. Tidal processes were observed by
measuring conductivity and water height fluxes. A bathymetric map of LKS was produced by
recording lake soundings and utilising computer software. The water quality properties
examined were temperature, conductivity, dissolved oxygen (DO), pH, nitrate, and oxidation
redox potential (ORP - the measure of water’s disinfection efficiency defined by World Health
Organization, 2006).
Emma Barr, Duncan Keenan, Vanessa Price, Nathan Townsend & Harry Young Hydrological Characteristics of Lake Kate Sheppard
5
GEOG309-14S2 Research Methods in Geography
This project was supported by Bryan Jenkins, representing the Avon-Ōtākaro Network,
and technicians from the University of Canterbury Geography Department, specifically Justin
Harrison.
3. Theoretical framework and literature review
Literature reviews were focused on investigating hydrological dynamics of water bodies in
similar situations to LKS. The AvON does not have any current LKS hydrology information,
therefore it was important to find literature of all aspects related to LKS. However, lake
research for this project was primarily experimental and finding literature to support the
process was challenging. The majority of literature used for this project is referenced during
results analysis.
Barendregt & Swarth (2013) produced a report on the dynamics of tidal freshwater
wetland systems. LKS is affected by tidal input from the Avon River, the information about
water quality changes from saline intrusion was relevant. Barendregt & Swarth (2013) discuss
the significance of biotic diversity for trapping sediment and nutrients in tidal wetlands.
Waltham and Connolly (2013) found that producing lake systems instead of canal systems will
increase opportunities for aquatic fauna success. This information can be utilised for future
projects investigating the effects of riparian planting on water quality levels.
Moses et al. (2011) suggests that higher pollution is associated with smaller lakes, as
contaminants are diluted with larger volumes. Conversely, an increase in volume may decrease
water pollutants. Furthermore, sediment runoff from flooding events can cause pollution
(Moses et al. 2011).
Manga and Wang (2007) focus on hydrogeologic lake changes caused by earthquakes.
They outline a wide variety of hydrogeologic responses to seismicity, and provide a schematic
illustration to model these responses. This provides a basis for assessing LKS in a post-
earthquake environment.
4. Methodology
Both spot and continuous testing techniques were utilized during data collection. For data
analysis ArcGIS and Excel were used. ArcGIS was particularly useful when modelling the data,
and Excel proved essential when tabulating or graphing the findings. Due to the large datasets,
many of the values were averaged in order to identify trends and anomalies.

Emma Barr, Duncan Keenan, Vanessa Price, Nathan Townsend & Harry Young Hydrological Characteristics of Lake Kate Sheppard
6
GEOG309-14S2 Research Methods in Geography
4.1 Tidal Processes
Change in water height was recorded using an in-situ instrument (CT2X) located
alongside the dock in the lower lake basin. Continuous data for water pressure, conductivity
and temperature was logged every 10 minutes. The instrument logged from the 1st of August to
the 24th of September 2014 and was attached to a metal pole pushed into the lake floor,
ensuring stability (Appendix 4). The measurements were corrected for atmospheric pressure
using measurements from a separate in-situ air pressure instrument. The data was tabulated,
averaged hourly and graphed for interpretation.
4.2 Lake Bathymetry
Lake bathymetry was recorded using two instruments: the PA 500 Tri-Tex, an echo
sounding sonar; and the Trimble R8 GNSS, a surveying system. Attached to a remote controlled
jet boat, these instruments recorded geo-referenced depth soundings of the entire lake
bottom. Data collection was completed one hour either side of high tide, minimising tidal
influence during measurements.
Bathymetry data analysis was completed in ArcGIS (v.10.2). The data points were used
to interpolate a raster surface between the nearest points. Point anomalies in the raw data
were removed pre-analysis, any remaining spikes in the bathymetry may be attributed to sticks
or weed in the lake. The shoreline was defined by the edge of the point data. The raster surface
was then draped over an aerial image of LKS and transferred to ArcScene (v.10.2) for three
dimensional analysis. Due to the small variation in depth, a vertical exaggeration was applied to
illustrate the bathymetry more clearly. Since the depth below surface values were positive, the
values were inverted to get a bathymetric ‘bathtub’ model. Finally, basic volumetric analysis
was completed to calculate the area and volume of the lake model.
4.3 Water Quality
Two methods were employed to test water quality in the lake. The first method utilised
the CT2X, positioned beside the dock on the eastern side of the lower lake body (Appendix 4).
The second method utilised the Eureka MANTA2, a multi-parameter device recording
temperature, conductivity, dissolved Oxygen, pH, nitrate and ORP. The MANTA2 was used for
spot testing 10 significant areas in and around the lake, and continuous data logged within LKS.
The continuous measurement was achieved by attaching the device onto a kayak and paddling
around the lake (Appendix 2), each variable was logged every 60 seconds.
To evaluate the measured variables from the CT2X, each dataset was averaged hourly
and daily, then graphed to allow interpretation of significant fluctuations within variables. The
MANTA2 spot data was analysed by comparing the different levels across the study area, and
the continuous datasets were presented using ArcGIS. This presented the spatial distribution of
water quality variables in LKS.

Emma Barr, Duncan Keenan, Vanessa Price, Nathan Townsend & Harry Young Hydrological Characteristics of Lake Kate Sheppard
7
GEOG309-14S2 Research Methods in Geography
5. Results
5.1 Tidal Processes
Figure 1 shows the tidal influence seen within LKS for August, maximum height was
900mm, on August 15th, and minimum was 29.4mm, on August 26th.
Figure 1.CT2X water height measurements over the month of August.
Figure 2 shows LKS water height changes from 1st to 24th September, with a minimum
of 72mm and a maximum of 832mm.
Figure 2. CT2X water height measurements during September.
Figure 3 shows conductivity and water depth measurements for LKS during a period in
August, the largest flux in conductivity is during the 15th to 16th of August.

Emma Barr, Duncan Keenan, Vanessa Price, Nathan Townsend & Harry Young Hydrological Characteristics of Lake Kate Sheppard
8
GEOG309-14S2 Research Methods in Geography
Figure 3. Average water depth and conductivity levels from 1st to 20th August for LKS.
Figure 4 shows LKS salinity levels and water depths from 1st to 20th August. The largest
flux is during the 15th and 16th of August.
Figure 4. Water depth graphed against salinity levels.
5.2 Lake Bathymetry
The deepest point in the lake is 3.08 meters, located in a basin at the southern end of
the lake, near the Avon River culvert connection (Figure 6). The basin gradually becomes
shallower towards the narrow northern channel connecting Travis Wetland to LKS. The average
depth is 0.9 meters; Figure 5 shows the bathymetric sounding of LKS. The white colour
represents the deepest sections, while green illustrates the shallowest.
Emma Barr, Duncan Keenan, Vanessa Price, Nathan Townsend & Harry Young Hydrological Characteristics of Lake Kate Sheppard
9
GEOG309-14S2 Research Methods in Geography
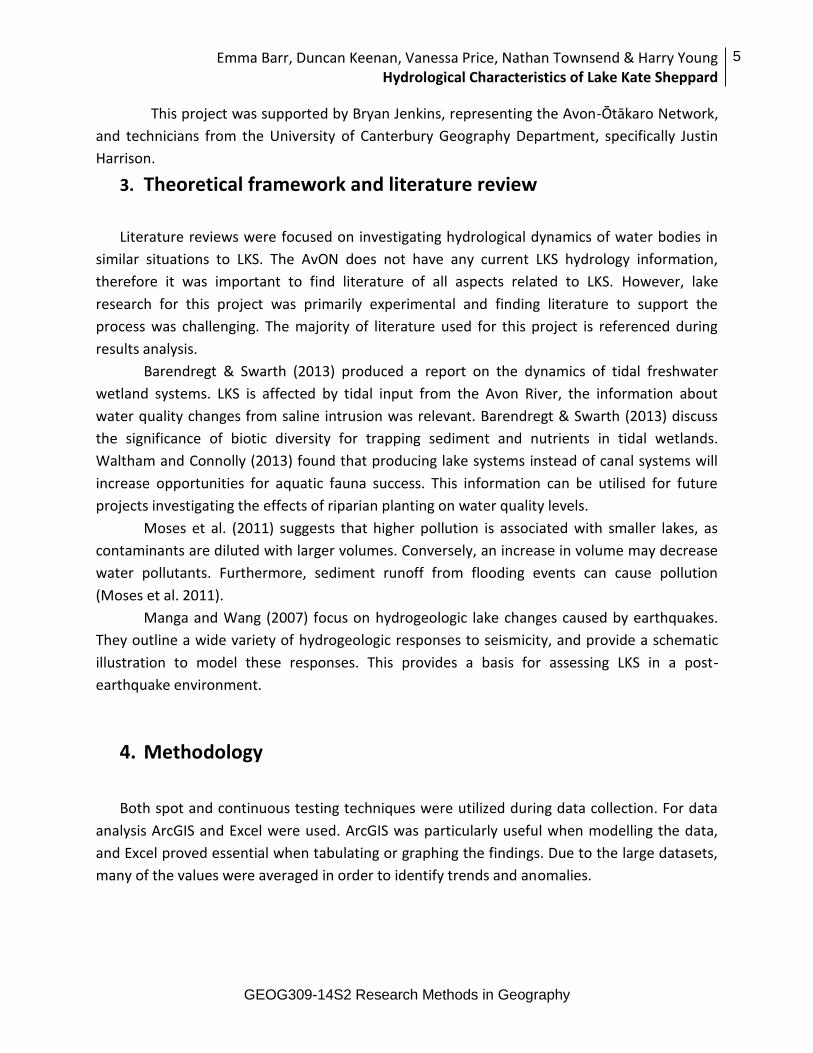
The effects of the tidal impacts are expected to be ± 5cm.
Figure 5. A 3-D side view of LKS bathymetry, illustrating the deeper southern basin and the shallow northern
reaches, captured using a jet boat containing a 500 Tri-Tex echo sounding radar and Trimble R8 GNSS surveying
system.
Figure 6. Plan view of raster surface draped over aerial image. Green indicates ground covered in interpolation;
yellow, pink, to white indicate lake bathymetry.
Table 1 shows the results of the volumetric analysis. The surface area of LKS was
calculated to be 42, 210.8 m2, and the water volume was calculated to be 31,102.8 m3. This
volume represents the specific tidal period during data collection.

Emma Barr, Duncan Keenan, Vanessa Price, Nathan Townsend & Harry Young Hydrological Characteristics of Lake Kate Sheppard
10
GEOG309-14S2 Research Methods in Geography
Table 1. Volumetric analysis results from LKS. Note, this includes the area covering land (refer to Figure 6 for
coverage extent).
5.3 Water Quality
5.3a. CT2X continuous measurement
The CT2X measured water temperature every 10 minutes from the 1st of August to the
24th of September 2014. Figure 7 indicates LKS’ water temperature during August, averaged
over the hour.
Figure 7. The average hourly water temperature of Lake Kate Sheppard during August, recorded using CT2X.
Figure 8 shows average hourly water temperature for LKS from the 1st-24th of
September.
Figure 8. The average hourly water temperature of Lake Kate Sheppard from the 1st to the 24th of September,
recorded using CT2X.
Emma Barr, Duncan Keenan, Vanessa Price, Nathan Townsend & Harry Young Hydrological Characteristics of Lake Kate Sheppard
11
GEOG309-14S2 Research Methods in Geography
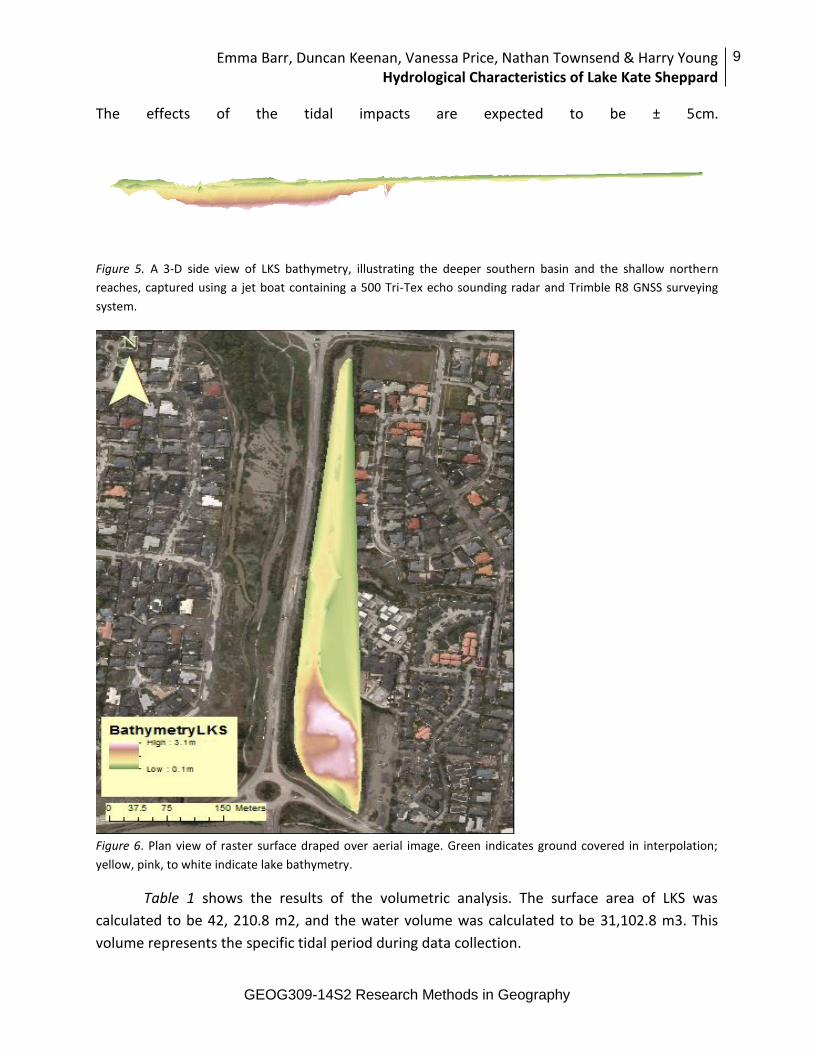
Figure 9 shows average daily water temperature for the entire study period 1st August
through to 24th September.
Figure 9. The average daily water temperature of LKS during the entire study period from the 1st of August to the
24th of September, recorded using CT2X.
In August the average water temperature was 9.89˚C. In September the average water
temperature increased to 12.31˚C. The total temperature range 10.05˚C: the lowest
temperature was recorded on August 15th at 7 a.m. at 5.25˚C, and the highest temperature
was 15.3˚C, recorded on September 11th at 4.30 p.m.
5.3b. Spot-testing MANTA2
Water quality spot-testing was completed on the afternoon of August the 1st, during a
high-tide. Testing occurred at 10 locations in and around LKS; Three in the lake, two in Avon
River, one in Travis Wetland and one in the swamp area west of Anzac Drive. These locations
are shown below in Figure 10.

Emma Barr, Duncan Keenan, Vanessa Price, Nathan Townsend & Harry Young Hydrological Characteristics of Lake Kate Sheppard
12
GEOG309-14S2 Research Methods in Geography
Figure 10. Values A-J representing the MANTA2 spot-testing locations.
Where MANTA2 spot-testing occurred, temperature, conductivity, dissolved oxygen, pH,
nitrate, and oxidation redox potential levels were measured. This data is presented in Table 2.

Emma Barr, Duncan Keenan, Vanessa Price, Nathan Townsend & Harry Young Hydrological Characteristics of Lake Kate Sheppard
13
GEOG309-14S2 Research Methods in Geography
Table 2.The measured variables from the spot-testing locations in and around LKS using the MANTA2 device.
Value Location Temp (C˚) Cond. (μS/cm) DO (mg/L) pH NO3(mg/L) ORP (mV)
A Dock 9.47 1460 12.33 7.75 3.5 187
B Avon Culvert 9.51 1549 10.45 7.65 3.7 130
C Avon River 9.48 1532 10.6 7.65 3.7 104
D Avon River Up 10.35 665.1 11.28 7.69 3.1 112
E Little Stream 13.15 151.6 5.05 7.66 0.2 63
F Top of LKS 9.66 436.8 12.33 7.45 3.5 184
G Travis Wetland 9.31 523.9 11.1 7.55 1.4 64
H Top Swamp 10.47 1121 6.7 7.07 1.4 85.1
I 1st Culvert 10.93 3153 14.23 7.8 4.6 19
J 2nd Culvert 10.84 523.9 12.72 7.55 1.4 64
The highest temperature, lowest dissolved oxygen, and lowest nitrate levels were
recorded in the stream adjacent to LKS, and the coldest temperature was found in Travis
Wetland. pH remained relatively consistent throughout the locations. ORP and conductivity
levels vary significantly throughout the test sites.
5.3c. Continuous-testing MANTA2
On September 18th during a high-tide, MANTA2 was attached to a kayak, taking
measurements every 60 seconds (Appendix 2). Temperature, conductivity, dissolved oxygen,
pH, nitrate and ORP variables were measured, and are shown below. The colour schemes are
explained for each variable below.

Emma Barr, Duncan Keenan, Vanessa Price, Nathan Townsend & Harry Young Hydrological Characteristics of Lake Kate Sheppard
14
GEOG309-14S2 Research Methods in Geography
Temperature: Figure 11 shows the temperatures recorded during testing. Red
represents warmer temperatures, while blue represents cooler temperatures. The maximum
temperature recorded was 15.1˚C and the minimum was 12.6˚C.
Figure 11. Distribution of temperature in LKS.

Emma Barr, Duncan Keenan, Vanessa Price, Nathan Townsend & Harry Young Hydrological Characteristics of Lake Kate Sheppard
15
GEOG309-14S2 Research Methods in Geography
Conductivity: Figure 12 shows conductivity in LKS. Red represents the higher, while blue
represents lower conductivity. The maximum was 4403 μS/cm and the minimum conductivity
was 1680 μS/cm.
Figure 12. Distribution of conductivity in LKS.

Emma Barr, Duncan Keenan, Vanessa Price, Nathan Townsend & Harry Young Hydrological Characteristics of Lake Kate Sheppard
16
GEOG309-14S2 Research Methods in Geography
Dissolved Oxygen: Figure 13 shows DO levels of LKS. Darker blue represents the higher
levels, while light blue represents the lower. The maximum DO was 10.3 mg/L and the
minimum was 15.6 mg/L.
Figure 13. Distribution of dissolved oxygen in LKS.

Emma Barr, Duncan Keenan, Vanessa Price, Nathan Townsend & Harry Young Hydrological Characteristics of Lake Kate Sheppard
17
GEOG309-14S2 Research Methods in Geography
pH: Figure 14 shows the pH levels of LKS. Darker blue represent higher values or more
alkaline water, while green represents the more neutral water. The maximum pH was 7.8 and
the minimum was 8.4.
Figure 14. Distribution of pH values in LKS.

Emma Barr, Duncan Keenan, Vanessa Price, Nathan Townsend & Harry Young Hydrological Characteristics of Lake Kate Sheppard
18
GEOG309-14S2 Research Methods in Geography
Nitrate: Figure 15 shows the nitrate levels in LKS. Dark blue represents lower nitrate,
while lighter yellow and green represents the higher nitrate levels. The maximum nitrate
recorded was 7.8mg/L, and the minimum nitrate level was 2.8 mg/L.
Figure 15. Distribution of nitrate levels in LKS.

Emma Barr, Duncan Keenan, Vanessa Price, Nathan Townsend & Harry Young Hydrological Characteristics of Lake Kate Sheppard
19
GEOG309-14S2 Research Methods in Geography
Oxidation Redox Potential: Figure 16 shows the oxidation reduction potential (ORP)
levels recorded in LKS. Red represents the lower (and negative) values, while yellow represents
the higher (and positive) values. The maximum recorded value was 149 mV, and the minimum
ORP value was -57 mV.
Figure 16. Distribution of ORP levels in LKS.

Emma Barr, Duncan Keenan, Vanessa Price, Nathan Townsend & Harry Young Hydrological Characteristics of Lake Kate Sheppard
20
GEOG309-14S2 Research Methods in Geography
6. Discussion
6.1 Tidal Processes
Tidal fluctuations within LKS were an area of great interest; the extent of tidal flux was
previously unknown, and tidal influence has an important role in LKS’ potential of hosting
mahingā kai.
Figure 1 and 2 reveal the significance of tidal processes acting in LKS. On average, a tidal
change of 450mm is seen. However, it should be noted that the tidal signature of LKS is
asymmetric; there is four hours on the rising limb and nine hours on the falling limb, as
opposed to a conventional tidal variation of six hours. A lag time of approximately 2.5 hours
exists between high-tides recorded in Lyttelton Harbour and high-tide in LKS. In conjunction
with this, there is also a low-tide lag of approximately 3 hours. This lag is likely to relate to the
tidal push travelling up the Avon River and continuing into LKS. This can be attributed to the
one way water valve located in the south of LKS (Appendix 4) and the distance the water needs
to return back into the ocean. As Figure 1 shows, from approximately the 6th of August through
to the 16th, there are larger high tide fluxes. These are approximately 1.5 times higher than
earlier in the week, this illustrates the effect of monthly tidal cycle.
When overlapping tidal fluxes and conductivity from August 1st to the 20th (Figure 3),it
was clear to deduce that conductivity increased during high tidal events. The largest increase
was recorded during the highest tidal push on the 15th, with conductivity levels increasing to
approximately 16000 microsiemens per centimeter. Conductivity is the amount of dissolved
minerals and ions within a water body (Conductivity, 2010). For context, conductivity of high-
quality deionized water is approximately 5.5 μS/m, typical drinking water is between 5-50
mS/m, and seawater approximately 5 S/m (i.e. sea water's conductivity is one million times
higher than that of deionized water (Lenntech, 2014)).
Conductivity and salinity have a linear relationship (Figure 4). Like conductivity, salinity
levels fluctuated with high and low-tides, illustrated in the corresponding spike during the
highest high-tide in August 15th. Salinity levels rose to approximately 15 ppt (parts per
thousand). For context, freshwater is 0.5 ppt and seawater is 35 ppt (Conductivity, 2010).
During the tidal push on the 15th of August (Figure 4) LKS recorded water that was
approximately 50/50 freshwater seawater.
Rainfall dilution was also analysed, noted during the tidal measurements (Figure 17).
The black arrows below depict two rainfall dilution events, on the 13th of August there was
10mm of rain and on the 11th of August there was 3mm. This dilution influence is seen as a
decrease in salinity.

Emma Barr, Duncan Keenan, Vanessa Price, Nathan Townsend & Harry Young Hydrological Characteristics of Lake Kate Sheppard
21
GEOG309-14S2 Research Methods in Geography
Figure 17. Dilution during rainfall events indicated by black arrows.
6.2 Lake Bathymetry
Variations in lake depth can be attributed to influences from water flow and sediment
transport. There are three features of interest that illustrate the aforementioned influences:
the northern Travis Wetland culvert, the southern Avon River culvert, and the eastern side
stream connection.
As a result of the noticeable tidal influence on LKS from the Avon River culvert, if
sediment was being transported from the Avon, it would likely settle out in the southern basin
due to a reduction in flow velocity with increased area. The placement of the Avon River culvert
may attribute to the uneven depth across the wide section. It appears that more transportation
is occurring on the eastern side of the island causing a shallow zone on the west side of the
island. The sediment may be transported northwards to the shallower reaches, however it
appears the flow continues to transport the sediment around the top of the island to the
western side, possibly adding to the shallower region.
The Travis Wetland culvert has visually limited flow; most sediment transported from
Travis Wetland is likely to be trapped by the dense aquatic vegetation at that end, attributing to
the shallow depth at the northern end. The deeper section halfway along the narrow reaches
coincides with the eastern side stream connection. Although flow through the stream is now
minimal, pre-earthquake flow may have been greater and transported sediment from the
stream into the lake.
6.3 Water Quality
CT2X continuous measurement:
During the research period there was an increase in water temperature (Figure 9). This
can be attributed to Canterbury progressing into spring, as water temperature is directly

Emma Barr, Duncan Keenan, Vanessa Price, Nathan Townsend & Harry Young Hydrological Characteristics of Lake Kate Sheppard
22
GEOG309-14S2 Research Methods in Geography
related to warming air temperature (Stenseth et al., 2002). Figures 7 and 8 show how average
water temperatures oscillate over a 24-hour period, warming throughout the day.
The coldest temperature was 5.25˚C and recorded the morning after a passing
southerly. The warmest temperature was 15.3˚C during a warm day reaching 20˚C (TuTiempo,
2014). In February, the maximum air temperature can exceed 30˚C in Canterbury (TuTiempo,
2014). It can be inferred that the water temperature of LKS will continue to increase during
summer. The maximum range in water temperature was 10.05˚C. The sensor remained
completely below the waterline during testing; the lowest tide recorded 10 mm over the sensor
plate, however the shallow water height would have absorbed and emitted more radiation,
resulting in greater temperature flux.
Eureka MANTA2 spot and continuous-testing (Table 2):
The locations were chosen to represent the relationship of LKS and the surrounding
water bodies. Spot and continuous testing was completed during high-tide. The continuous
testing was completed over a two hour period and while the measurements only characterise a
specific time period, the data is representative of the general spatial distribution of variables
within the lake. Each variable is discussed below;
Water Temperature (Figure 11): The warmest temperatures are located in the northern
section of the lake. The shallow and narrow channel holds less volume; warming faster than the
southern basin. The colder temperatures in the south are also influenced by influx of cooler
water from the Avon River during high-tide.
Spot-testing reveals that river water temperature was warmer than LKS upstream from
the culvert (Table 2). This was due to the effect of urban heat island from the central city (Li et
al., 2004).
Water Conductivity (Figure 12): The highest surface water conductivity is found at the
Avon River culvert; the only source of saline water into the system. Levels gradually decrease
moving north, increasing with distance from the culvert. It is important to note that
conductivity increases with depth; saline water has a higher density. Measurement of the entire
water profile would show a different conductivity spatial distribution in LKS. This may explain
why conductivity is less in the shallower northern areas; the saline water is more likely to pool
in the deep southern basin, pushing less saline water upwards to flow north. Spot-testing of
conductivity (Table 2) showed there is varying levels throughout the surrounding water body
system. This shows how conductivity levels are influenced by tidal changes, dilution from
rainfall and depth.
Dissolved Oxygen (Figure 13): The dissolved oxygen (DO) level in water bodies is
important for sustaining aquatic life (Utah State University, 2014). When DO levels drop below
5.0 mg/L the environment is considered to be stressed (Utah State University, 2014). DO levels

Emma Barr, Duncan Keenan, Vanessa Price, Nathan Townsend & Harry Young Hydrological Characteristics of Lake Kate Sheppard
23
GEOG309-14S2 Research Methods in Geography
were above 10 mg/L in LKS; there were two areas of high concentration in the north and middle
of the lake. These high concentrations may be attributed to the high number of aquatic and
riparian plants, as they increase DO levels during photosynthesis (Utah State University, 2014).
Saline water holds less DO than freshwater (James et al., 2003). Therefore, as testing was
completed during high-tide average levels are likely to be lower. Similarly, warm water holds
less DO than cold water (Blumberg & Toro, 1990). Therefore, it is likely that DO levels will
decrease as temperatures increases into summer.
pH Levels (Figure 14): LKS exhibits a distribution of neutral pH water in the southern
basin increasing in alkalinity northwards. Spot-testing revealed that the Avon River was neutral
(Table 2). Environment Canterbury recommends a pH range between 6.5 to 8.5 for safe
drinking water (Environment Canterbury, 2014), LKS measurements were within this range.
Increasing conductivity results in decreasing pH (James et al., 2003); due to testing close to
high-tide, average pH values for LKS are likely to be lower.
Nitrate (Figure 15): Understanding lake nitrate levels is important as excess nitrate can
be detrimental to health (Environment Canterbury, 2014). Ministry for Health New Zealand has
a maximum limit of 11.3 mg/L for drinking water (Environment Canterbury, 2014). The
maximum value measured in LKS was just over 7 mg/L. The highest nitrate levels were found in
the north of the lake. These levels were mirrored by similar spot-testing values (Table 2) from
the Travis Wetland culvert on LKS side, and the culvert connecting LKS to the water body west
of Anzac Drive (Figure 10). This suggests that LKS has higher nitrate levels which move into the
other water systems. Observations conclude that LKS has a population of ducks; this is likely to
be a factor in the high nitrate levels.
Oxidation Redox Potential (Figure 16): Oxidation (positive) and reduction (negative)
potential measures the ability of water to disinfect potential bacteria (Suslow, n.d.). ORP is
important for understanding the survival times of harmful viral and bacterial pathogens like
E.Coli and salmonella (Bastian & Brondum, 2009). The more positive the ORP value, the shorter
the survival rates of these pathogens. The most positive levels were found in the southern basin
(Figure 15), the highest ORP value was +120 mV (millivolts). The World Health Organisation
recommends an ORP values of above +680 mV suggest water is in good microbial condition
(World Health Organization, 2006). The current pathogen levels in LKS suggest survival rates of
over 300 seconds, indicating a high reproductive rate (World Health Organization, 2006).
6.4 Mahingā Kai
When considering suitable water quality to support īnanga populations, the water
measurements recorded at LKS were within recommendations prescribed from National
Institute of Water and Atmospheric Research (NIWA).

Emma Barr, Duncan Keenan, Vanessa Price, Nathan Townsend & Harry Young Hydrological Characteristics of Lake Kate Sheppard
24
GEOG309-14S2 Research Methods in Geography
The temperature readings show that LKS has a reasonably large temperature range
during the winter and spring seasons (Figure 7 & 8). These temperatures create a range
possible for īnanga habitats, however further research is required. Īnanga spawning and
the development of juvenile īnanga occurs over the summer period, between spring and
autumn (Richardson & Taylor, 2002). Figure 8 displays a warming trend, it is likely that
the temperature of LKS will reach the ideal 20˚C for hatching juvenile īnanga over the
summer season.
The near neutral pH profile of LKS (Figure 14 & Table 2) provide favourable conditions
for īnanga. Īnanga do not spawn in pH 10.5 and above (Richardson & Taylor, 2002).
Īnanga can survive in dissolved oxygen rates as low as 3 mg/L-1 for up to 48 hours
(Jowett, 2002). The lowest recorded measurement within the main water body was
10.36 mg/L-1(Figure 13). This suggests LKS has dissolved oxygen levels favourable for
supporting īnanga (Richardson & Taylor, 2002).
Tidal data shows (Figure 2) that LKS is heavily influenced by tides. This is beneficial for
īnanga as they may use the strong tidal currents to swim up the Avon River into LKS.
The bathymetry survey highlighted LKS has variable depths throughout the system
(Figure 5). Research indicates that īnanga would take advantage of these variable
depths, as they provide the ability for fish to escape external pressures such as solar
radiation and wind driven turbidity (Jowett, 2002).
6.5 Limitations
Due to the vast amount of unknown features for potential testing, it was difficult to
choose only three hydrological characteristics. The inclusion of more variables is likely to
affect conclusions.
It would have proven beneficial to measure flow rates for the culvert systems. This was
attempted early in the project, but later abandoned due to minimum time for setting up
suitable experimentation.
The amount of field sampling days was limited to suitable tides and significant distance.
The equipment availability and cost limited the inclusion of important variables; water
quality tests such as E.Coli and faecal coliform were not completed.
Conclusions were made by comparing relevant existing literature and the patterns of
primary quantitative data. Although knowledge gained from prior literature assisted in
building the conceptual framework, a greater knowledge base may have produced
conclusions with more relevance to the wider Christchurch Avon-Ōtākaro waterway
network.

Emma Barr, Duncan Keenan, Vanessa Price, Nathan Townsend & Harry Young Hydrological Characteristics of Lake Kate Sheppard
25
GEOG309-14S2 Research Methods in Geography
Previous experience with equipment was limited. Foreknowledge regarding appropriate
times, locations, and methods for data collection may have assisted in time saving.
Therefore, more relevant data may have been collected.
Time was a large determinant in the research. With more time, a greater quantity and
quality of data could be collected.
Considering the limitations listed above, the conclusions drawn from this research
project are still accurate to the best of this project’s ability and can be used for future research.
7. Conclusion
Investigation revealed significant tidal oscillations in Lake Kate Sheppard. These
fluctuations were mirrored by changes to various aspects of water quality, in particular salinity.
Temperature, conductivity, dissolved oxygen, pH, nitrate and oxidation redox potential levels
showed various spatial distribution patterns, affected by changes in bathymetry. A bathymetric
map was produced of the lake, this revealed a deeper southern basin and tidal island. The lake
gradually becomes a shallow channel moving northward. The total volume of Lake Kate
Sheppard during a high-tide is 31,102 m3. Lake Kate Sheppard is linked to a larger waterway
network; there are culvert connections to the Avon River, Travis Wetland, and Anzac Drive
Reserve.
These findings are base-line representations of the hydrological characteristics in Lake
Kate Sheppard. This will supply the Avon Ōtākaro Network with initial hydrological
measurements relevant to mahingā kai. These results are only indicative, further research is
required to ensure Lake Kate Sheppard’s success as a mahingā kai exemplar.
8. Acknowledgments
The authors would like to thank Professor Eric Pawson and Professor Simon Kingham for
the initiation of this new project topic, Professor Bryan Jenkins and the Avon-Ōtākaro Network,
the research community partner, for project guidance and direction, and Paul Bealing, Nicholas
Key, Tobias Schulmann and Graham Furniss for technical support. A special thank you to our
project tutors Justin Harrison for his technical expertise during data collection and consistent
supervision throughout this new project.

Emma Barr, Duncan Keenan, Vanessa Price, Nathan Townsend & Harry Young Hydrological Characteristics of Lake Kate Sheppard
26
GEOG309-14S2 Research Methods in Geography
9. References
Avon-Otakaro Network. (2013). Our Charter. Retrieved September 10, 2014, from Avon-
Otakaro Network: http://www.avonotakaronetwork.co.nz/about-us/charter.html
Barendregt, A. and Swarth, C.W. (2013) Tidal Freshwater Wetlands: Variation and Changes.
Estuaries and Coasts (36), 445-456. doi: 10.1007/s12237-013-9626-z
Bastian, T., & Brondum, J. (2009). Do Traditional Measures of Water Quality in Swimming Pools
and Spas Correspond with Beneficial Oxidation Reduction Potential? Public Health
Reports, 124(2), 255–261.
Blumberg, A., & Toro, D. (1990). Effects of Climate Warming on Dissolved Oxygen
Concentrations in Lake Erie. Transactions of the American Fisheries Society, 119, 210-
223.
Conductivity (2010). Oxford University Press. doi:10.1093/acref/9780199571123.013.m-en_gb-
msdict-00002-0170930
Environment Canterbury. (2014). Measuring water quality. Retrieved October 9, 2014, from
Environment Canterbury: http://ecan.govt.nz/advice/your-water/water-
quality/pages/measuring-water-quality.aspx#pH
James, K., Cant, B., & Ryan, T. (2003). Responses of freshwater biota to rising salinity levels and
implications for saline water management: a review. Australian Journal of Botany, 51,
703-713.
Jowett, I. G. (2002) In‐stream habitat suitability criteria for feeding inanga
(Galaxias maculatus), New Zealand Journal of Marine and Freshwater Research, 36:2
Lenntech, 2014,. Water Conductivity. Retrieved from
http://www.lenntech.com/applications/ultrapure/conductivity/water-conductivity.htm
Li, Q., Zhang, H., Liu, X., & Huang, J. (2004). Urban heat island effect on annual mean
temperature during the last 50 years in China. Theoretical and Applied Climatology, 165-
174.

Emma Barr, Duncan Keenan, Vanessa Price, Nathan Townsend & Harry Young Hydrological Characteristics of Lake Kate Sheppard
27
GEOG309-14S2 Research Methods in Geography
Manga, M., and C. -Y Wang (2007). "Earthquake Hydrology." 4 Vol. (p. 293-320).
Moses, S., Janaki, L., Joseph, S., Justus, J., & Vimala, S. (2011). Influence of lake morphology on
water quality. Environmental Monitoring and Assessment, 443-454.
Richardson, J. & Taylor, M. J. (2002). A guide to restoring inanga habitat. NIWA Science and
Technology Series (50), 31.
Stenseth, N., Mysterud, A., Ottersen, G., Hurrell, J., Chan, K., & Lima, M. (2002). Ecological
Effects of Climate Fluctuations. Science, 297(5585), 1292-1296.
Suslow, R. (n.d.). Oxidation-Reduction Potential (ORP) for Water Disinfection Monitoring,
Control, and Documentation. Los Angeles: University of California.
TuTiempo. (2014, September). Climate in Christchurch. Retrieved October 9, 2014, from
TuTiempo.net: http://www.tutiempo.net/en/Climate/Christchurch/09-2014/937800.htm
Waltham, N., & Connolly, R. (2013). Artificial tidal lakes: Built for humans, home for fish.
Ecological Engineering, 60, 414-420. doi:10.1016/j.ecoleng.2013.09.035
World Health Organization. (2006). Guidelines for Drinking-water Quality: First addendum to
volume 1, Recommendations. World Health Organization, 2006.
World Health Organization. (2006). Guidelines for safe recreational water environments.
Geneva: WHO.
Utah State University. (2014). Utah Water Quality: Dissolved Oxygen. Retrieved September 9,
2014, from Utah State University: http://extension.usu.edu/waterquality/htm/whats-in-
your-water/do
Zhang, A., & Carrick, S. (2014). Lake Kate Sheppard: An exemplar mahingā kai site? Christchurch:
University of Canterbury.
Word Count (excluding references and captions): 4684

Emma Barr, Duncan Keenan, Vanessa Price, Nathan Townsend & Harry Young Hydrological Characteristics of Lake Kate Sheppard
28
GEOG309-14S2 Research Methods in Geography
9. Appendices
Appendix 1. The remote controlled jet boat used to gather bathymetry data
Appendix 2. Towing the MANTA around LKS to gather pH, Nitrate, OPR and Dissolved Oxygen

Emma Barr, Duncan Keenan, Vanessa Price, Nathan Townsend & Harry Young Hydrological Characteristics of Lake Kate Sheppard
29
GEOG309-14S2 Research Methods in Geography
Appendix 3. One way valve at main culvert at the input/out from LKS into the Avon-Ōtākaro River.
Appendix 4. The in-situ CT2X situated on the dock to the Eastern side of LKS.