Embed Size (px)
Citation preview

U.S. Department of the InteriorU.S. Geological Survey
Scientific Investigations Report 2007–5141
Prepared in cooperation with the United City of Yorkville, Kendall County, the Village of Montgomery, Illinois Department of Natural Resources-Office of Water Resources, and Federal Emergency Management Agency
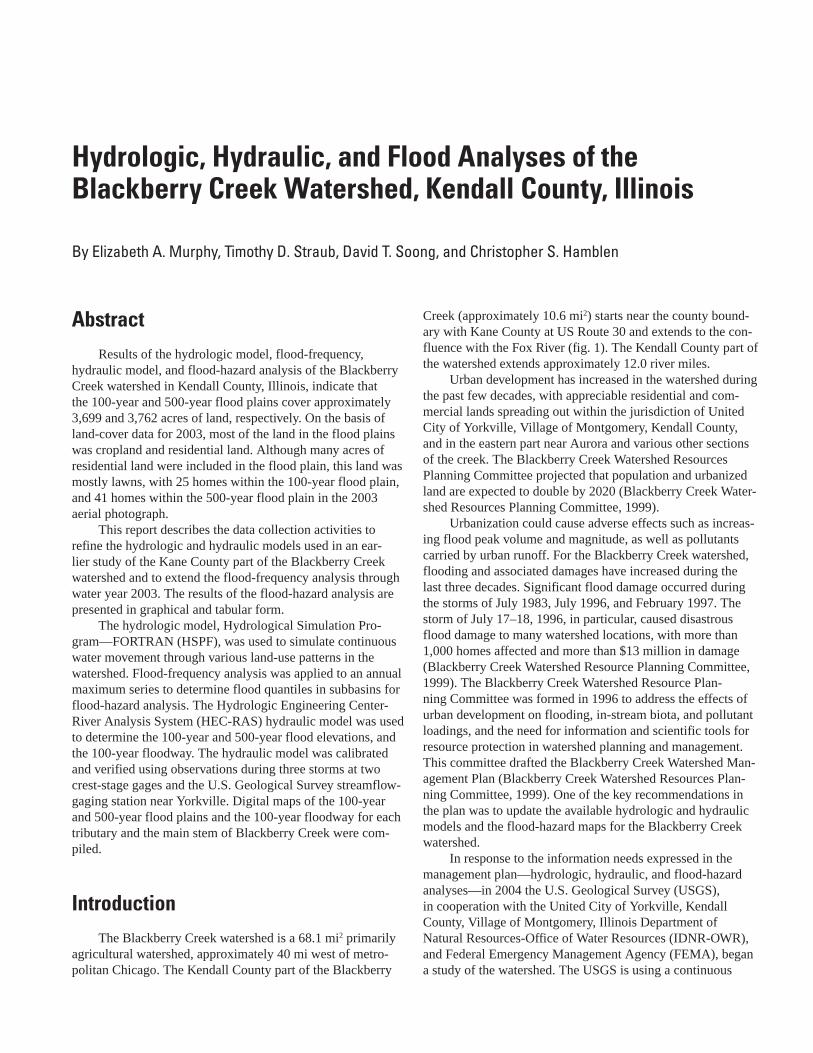
Hydrologic, Hydraulic, and Flood Analyses of the Blackberry Creek Watershed, Kendall County, Illinois

Cover. Photograph taken south of Galena Road and north of Plan Corp Railroad tracks in Kendall County, Illinois in April 2004.

Hydrologic, Hydraulic, and Flood Analyses of the Blackberry Creek Watershed, Kendall County, Illinois
By Elizabeth A. Murphy, Timothy D. Straub, David T. Soong, and Christopher S. Hamblen
Prepared in cooperation with the United City of Yorkville, Kendall County, the Village of Montgomery, Illinois Department of Natural Resources-Office of Water Resources, and Federal Emergency Management Agency
Scientific Investigations Report 2007–5141
U.S. Department of the InteriorU.S. Geological Survey

U.S. Department of the InteriorDIRK KEMPTHORNE, Secretary
U.S. Geological SurveyMark D. Myers, Director
U.S. Geological Survey, Reston, Virginia: 2007
For product and ordering information: World Wide Web: http://www.usgs.gov/pubprod Telephone: 1-888-ASK-USGS
For more information on the USGS--the Federal source for science about the Earth, its natural and living resources, natural hazards, and the environment: World Wide Web: http://www.usgs.gov Telephone: 1-888-ASK-USGS
Any use of trade, product, or firm names is for descriptive purposes only and does not imply endorsement by the U.S. Government.
Although this report is in the public domain, permission must be secured from the individual copyright owners to reproduce any copyrighted materials contained within this report.
Suggested citation:Murphy, E.A., Straub, T.D., Soong, D.T., and Hamblen, C.S., 2007, Hydrologic, hydraulic, and flood analyses of the Blackberry Creek watershed, Kendall County, Illinois: U.S. Geological Survey Scientific Investigations Report 2007–5141, 49 p. with appendixes.

iii
Contents
Abstract ...........................................................................................................................................................1Introduction.....................................................................................................................................................1
Purpose and Scope ..............................................................................................................................3Previous Studies ...................................................................................................................................3Approach ................................................................................................................................................3Study Area Description ........................................................................................................................4
Climate ...........................................................................................................................................4Topography and Physiography ..................................................................................................5Streamflow Characteristics .......................................................................................................5
Input Data ........................................................................................................................................................5Cross Section.........................................................................................................................................5Streamflow .............................................................................................................................................5Soil ...........................................................................................................................................................6Land-Use ................................................................................................................................................6Meteorology...........................................................................................................................................6Topography ............................................................................................................................................6
Hydrologic, Hydraulic, and Flood Analyses .............................................................................................10Continuous Hydrologic Model ..........................................................................................................10Flood-Frequency Analysis .................................................................................................................15Hydraulic Model ..................................................................................................................................15Flood-Hazard Analysis .......................................................................................................................17
Summary........................................................................................................................................................18Acknowledgments .......................................................................................................................................26References ....................................................................................................................................................26Appendix A. Digital Elevation Model Accuracy Statement ..................................................................28Appendix B. Flood Profiles .........................................................................................................................29
Figures 1. Map showing location of Blackberry Creek watershed in Kane and Kendall
Counties in northeastern Illinois ................................................................................................2 2. Diagram showing general approach used for the Blackberry Creek watershed
study ................................................................................................................................................4 3–6. Maps showing— 3. Hydrologic soil groups in the Blackberry Creek watershed ........................................7 4. Land cover in the Blackberry Creek watershed .............................................................8 5. Location of precipitation stations in the vicinity of the Blackberry Creek
watershed .............................................................................................................................9 6. Subbasins and their associated numbering system used in the Blackberry
Creek watershed in Kane and Kendall Counties ..........................................................11 7. Diagram showing Hydrological Simulation Program–FORTRAN process model ............12

iv
8–9. Graphs showing— 8. Simulated and observed hourly streamflow at the U.S. Geological
Survey Yorkville streamflow-gaging station, Blackberry Creek watershed, for selected storm events from water years 2000–03 ............................15
9. Simulated and observed hourly streamflow at the U.S. Geological Survey Yorkville streamflow-gaging station, Blackberry Creek watershed, for the July 1996 storm event ......................................................................16
10. Map showing 100- and 500-year flood plains and 100-year floodway for Blackberry Creek watershed ....................................................................................................24
Tables 1. Selected precipitation stations in the vicinity of the Blackberry Creek
watershed, Kendall County, Illinois............................................................................................9 2. Delineated subbasin numbering system used in this study of the Blackberry
Creek watershed .........................................................................................................................10 3. Land cover represented by PERLNDs (pervious lands) and IMPLNDs
(impervious lands) in the Hydrological Simulation Program–FORTRAN ...........................13 4. Percent values of PERLNDs (pervious lands) and IMPLNDs (impervious lands)
in the Kendall County part of the Blackberry Creek watershed .........................................13 5. Hydrologic Simulation Program–FORTRAN (HSPF) model parameters for the
Blackberry Creek watershed ....................................................................................................14 6. Estimated flood quantiles at 1.25-, 2-, 10-, 25-, 50-, 100-, 200-, and 500-year
recurrence intervals for subbasins (upstream to downstream) of the Kendall County part of Blackberry Creek watershed ..........................................................................16
7. Comparison of flood quantiles for three locations in the Kendall County part of Blackberry Creek watershed ....................................................................................................16
8. Comparision of peak-flood stages simulated with the hydraulic model and observed values at Galena Road bridge and Bristol Ridge Road bridge and at U.S. Geological Survey Yorkville streamflow gaging station (station number 05551700) ......................................................................................................................................17
9. The 2003 land cover (by area and percent) and areas included in the 100- and 500-year flood plains in the Blackberry Creek watershed, Kendall County ......................18
10. Hydraulic characteristics corresponding to 100-year flood elevation and floodway encroachment for the Blackberry Creek watershed, Kendall County ...............................19

v
Conversion Factors and Datums
Temperature in degrees Fahrenheit (°F) may be converted to degrees Celsius (°C) as follows:
°C=(°F-32)/1.8
Vertical coordinate information is referenced to the North American Vertical Datum of 1988 (NAVD 88). Historical data collected and stored as National Geodetic Vertical Datum of 1929 (NGVD 29) have been converted to NAVD 88 for use in this publication.
Horizontal coordinate information is referenced to the North American Datum of 1983 (NAD 83). Historical data collected and stored as North American Datum of 1927 (NAD 27) have been converted to NAD 83 for use in this publication.
Multiply By To obtainLength
inch (in.) 25.4 millimeter (mm)foot (ft) 0.3048 meter (m)mile (mi) 1.609 kilometer (km)
Areasquare foot (ft2) 0.09290 square meter (m2)square mile (mi2) 2.590 square kilometer (km2) acre 0.4047 square hectometer
Flow ratecubic foot per second (ft3/s) 0.02832 cubic meter per second (m3/s)inch per hour (in/h) 0.0254 meter per hour (m/h)
Hydraulic gradientfoot per mile (ft/mi) 0.1894 meter per kilometer (m/km)

vi
AbstractResults of the hydrologic model, flood-frequency,
hydraulic model, and flood-hazard analysis of the Blackberry Creek watershed in Kendall County, Illinois, indicate that the 100-year and 500-year flood plains cover approximately 3,699 and 3,762 acres of land, respectively. On the basis of land-cover data for 2003, most of the land in the flood plains was cropland and residential land. Although many acres of residential land were included in the flood plain, this land was mostly lawns, with 25 homes within the 100-year flood plain, and 41 homes within the 500-year flood plain in the 2003 aerial photograph.
This report describes the data collection activities to refine the hydrologic and hydraulic models used in an ear-lier study of the Kane County part of the Blackberry Creek watershed and to extend the flood-frequency analysis through water year 2003. The results of the flood-hazard analysis are presented in graphical and tabular form.
The hydrologic model, Hydrological Simulation Pro-gram—FORTRAN (HSPF), was used to simulate continuous water movement through various land-use patterns in the watershed. Flood-frequency analysis was applied to an annual maximum series to determine flood quantiles in subbasins for flood-hazard analysis. The Hydrologic Engineering Center-River Analysis System (HEC-RAS) hydraulic model was used to determine the 100-year and 500-year flood elevations, and the 100-year floodway. The hydraulic model was calibrated and verified using observations during three storms at two crest-stage gages and the U.S. Geological Survey streamflow-gaging station near Yorkville. Digital maps of the 100-year and 500-year flood plains and the 100-year floodway for each tributary and the main stem of Blackberry Creek were com-piled.
IntroductionThe Blackberry Creek watershed is a 68.1 mi2 primarily
agricultural watershed, approximately 40 mi west of metro-politan Chicago. The Kendall County part of the Blackberry
Creek (approximately 10.6 mi2) starts near the county bound-ary with Kane County at US Route 30 and extends to the con-fluence with the Fox River (fig. 1). The Kendall County part of the watershed extends approximately 12.0 river miles.
Urban development has increased in the watershed during the past few decades, with appreciable residential and com-mercial lands spreading out within the jurisdiction of United City of Yorkville, Village of Montgomery, Kendall County, and in the eastern part near Aurora and various other sections of the creek. The Blackberry Creek Watershed Resources Planning Committee projected that population and urbanized land are expected to double by 2020 (Blackberry Creek Water-shed Resources Planning Committee, 1999).
Urbanization could cause adverse effects such as increas-ing flood peak volume and magnitude, as well as pollutants carried by urban runoff. For the Blackberry Creek watershed, flooding and associated damages have increased during the last three decades. Significant flood damage occurred during the storms of July 1983, July 1996, and February 1997. The storm of July 17–18, 1996, in particular, caused disastrous flood damage to many watershed locations, with more than 1,000 homes affected and more than $13 million in damage (Blackberry Creek Watershed Resource Planning Committee, 1999). The Blackberry Creek Watershed Resource Plan-ning Committee was formed in 1996 to address the effects of urban development on flooding, in-stream biota, and pollutant loadings, and the need for information and scientific tools for resource protection in watershed planning and management. This committee drafted the Blackberry Creek Watershed Man-agement Plan (Blackberry Creek Watershed Resources Plan-ning Committee, 1999). One of the key recommendations in the plan was to update the available hydrologic and hydraulic models and the flood-hazard maps for the Blackberry Creek watershed.
In response to the information needs expressed in the management plan—hydrologic, hydraulic, and flood-hazard analyses—in 2004 the U.S. Geological Survey (USGS), in cooperation with the United City of Yorkville, Kendall County, Village of Montgomery, Illinois Department of Natural Resources-Office of Water Resources (IDNR-OWR), and Federal Emergency Management Agency (FEMA), began a study of the watershed. The USGS is using a continuous
Hydrologic, Hydraulic, and Flood Analyses of the Blackberry Creek Watershed, Kendall County, Illinois
By Elizabeth A. Murphy, Timothy D. Straub, David T. Soong, and Christopher S. Hamblen

2 Hydrologic, Hydraulic, and Flood Analyses of the Blackberry Creek Watershed, Kendall County, Illinois
Figure 1. Location of Blackberry Creek watershed in Kane and Kendall Counties in northeastern Illinois. The study area includes only that part of the watershed in Kendall County.

Introduction 3
hydrologic simulation/flood-frequency approach to generate the flood-peak streamflows used in the hydraulic model. This study demonstrates the successful application of this approach with the goal of promoting the use of this advanced technique for flood-hazard studies in other watersheds.
Purpose and Scope
This report describes the pro cedures used in developing hydrologic and hydraulic models, and estimating flood-peak magnitudes and recurrence intervals used for flood-hazard analysis. The report includes detailed flood-hazard maps on digi tal orthophoto quadrangles (DOQs) of the watershed, as well as flood-frequency estimates for the watershed and subwatersheds.
To address the flood-hazard analysis on the water shed scale, the entire watershed (the main stem as well as seven tributaries of Blackberry Creek in Kane and Kendall Counties) was included in the hydrologic analyses. The flood-frequency, hydraulic, and flood-hazard analysis for the Kane County part of the watershed was documented in Soong and others (2005) and is not included in this report.
Previous Studies
Effective peak-flood discharges for Blackberry Creek (Federal Emergency Management Agency, 2002) for two locations in Kendall County were determined in 1976 using a U.S. Department of Agriculture (USDA) Technical Report 20 hydrologic model (TR-20, USDA, 1992). These numbers were determined to be outdated by comparing them to the flood fre-quencies (Soong and others, 2004) estimated using data from the U.S. Geological Survey’s streamflow-gaging station near Yorkville (station 05551700, fig. 1).
A flood-hazard study of the Blackberry Creek watershed in Kane County, Illinois, has been completed by the USGS and Kane County Division of Environmental and Build-ing Management (KCDEM) (Soong and others, 2005). The 100- and 500-year flood plain and 100-year floodway maps were generated for the determination of flood hazard areas in Blackberry Creek watershed in Kane County; however, a refined digital elevation model (DEM) was not available for the Kendall County part of the watershed during the study period from 2000 to 2004. Without detailed elevation data, refined watershed boundaries and flood-hazard mapping could not be completed. Also, some cross-section intervals were too large in Kendall County for accurate flood-hazard analysis; therefore, flood-hazard analysis was performed only for the Kane County part of the Blackberry Creek watershed in the study. To gain confidence in the accuracy of estimated flood quantiles from various land uses in the watershed, the USGS used a continuous hydrologic simulation/flood frequency approach. Flood quantiles were estimated along the main stem and six major tributaries (excluding the Aurora Chain-of-Lakes tributary) of Blackberry Creek. The estimated flood
quantiles were used in the hydraulic model to determine flood stages and floodway encroachment. In 2005, the USGS and KCDEM completed an addendum to the report by Soong and others (2005) that added the Aurora Chain-of-Lakes tributary to the analyses.
Before the Soong and others (2005) study, the U.S. Department of Agriculture, Soil Conservation Service (now the Natural Resources Conservation Service (NRCS)) con-ducted a watershed-wide flood-hazard analysis to estimate flood quantiles and flood stages along Blackberry Creek (U.S. Department of Agriculture, Soil Conservation Service, 1989). The 1989 USDA study used the TR-20 hydrologic model with U.S Weather Bureau Technical Paper 40 rainstorms (Hershfield, 1961) for estimating peak discharges, and the Soil Conservation Service Water Surface Profile hydraulic model (WSP2, USDA, 1976) for estimating peak stages. Besides identifying the 100- and 500-year flood plains and the floodway, the study also identified developed areas prone to flooding, evaluated the importance of natural storage in the watershed, and suggested alternatives for flood-plain manage-ment.
Regional regression equations for Illinois were developed by Soong and others (2004). The regional regression equa-tion estimates the mean (logarithmic) value of flood quantiles obtained at different watersheds in a region with the same set of explanatory variables. These equations can be applied to the rural streams in the watershed, but could not be applied to the streams in urban areas because the equations were developed based on rural streams. Also, the FEMA guidelines suggest that regional regression equations be used only for preliminary studies.
Approach
The overall approach of this study is similar to that of Soong and others (2005) and is depicted in a flowchart shown in figure 2. The steps followed are listed below.
Observed precipitation and other meteorological 1. time series were input to a hydrologic model to sup-ply a continuous streamflow time series at the outlet of each subbasin in the watershed. The Hydrological Simulation Program–FORTRAN (HSPF, Bicknell and others, 2000) was used to perform the hydro-logic modeling.Utilizing the flood-peak data—specifically, the 2. annual maximum series (AMS), determined from the streamflow time series—flood quantiles for the 2-, 5-, 10-, 25-, 50-, 100-, and 500-year floods were estimated at selected locations using flood-frequency analysis procedures. Procedures for the flood-fre quency analysis followed the recommenda-tions described in Bulletin 17B (U.S. Interagency Advisory Committee on Water Data, 1982). The frequency analysis was completed with the PEAKFQ program (Ver sion 4.1, Thomas and others, 1998).

4 Hydrologic, Hydraulic, and Flood Analyses of the Blackberry Creek Watershed, Kendall County, Illinois
The HEC-RAS (Hydrological Engineering Cen ter-3. River Analysis System) hydraulic model (U.S. Army Corps of Engineers, 2002) was used in this study to route the flood-peak discharge and deter mine the flood elevations throughout Blackberry Creek watershed. The 100- and 500-year flood elevations subsequently were used to delineate flood plains for the main stem. Encroachment analysis also was performed in HEC-RAS to deter mine the floodway widths. Using geographic information system (GIS) tech-4. niques and digital datasets, the resulting flood eleva tions from the hydraulic model were mapped for the 100- and 500-year flood plains and for the floodway. These maps were overlaid on DOQs to determine flood-hazard areas. The FEMA designa-tion for the areas within the 100-year flood plain boundary, areas between the 100-year and 500-year flood plain boundaries, and areas within the 500-year flood plain boundaries are Special Flood Hazard Areas, Areas of Moderate Flood Hazard, and Areas of Minimal Flood Hazard, respectively. These maps are not FEMA-approved flood insur-ance rate maps (FIRMs) and are subject to revi-sion.
The approach used in this flood-hazard study was unique because flood quantiles were estimated using flood-frequency analysis on simulated flood data and not design
storms. This flood-hazard study details the continuous-simulation/flood-frequency approach and explains how the approach is applied in the Blackberry Creek watershed. The success of the contin uous-simulation/flood-frequency approach in this study indicates that this approach could be applied in flood-hazard studies in other watersheds in similar hydrogeo logic settings.
Study Area Description
The Blackberry Creek watershed extends approximately 33 river miles from northeast of the intersection of Illinois Routes 47 and 38 (fig. 1) to the confluence with the Fox River in Kendall County. The climate, topography, physiography, and streamflow are important characteristics in understanding the hydrology and hydraulics of the watershed.
ClimateThe climate of northeastern Illinois is humid continen-
tal with warm to hot summers and moderate to fairly cold winters. The proximity of the watershed to Lake Michigan (approximately 45 mi) has a moderating effect on climate at the watershed (Federal Emergency Management Agency, 1996). The long-term average annual precipitation is 37 in. and the long-term average temperature is approximately 49 °F at Aurora (U.S. Department of Commerce, 2001) for
Figure 2. General approach used for the Blackberry Creek watershed study, Kendall County, Illinois. [HSPF, Hydrological Simulation Program–FORTRAN; HEC-RAS, Hydrologic Engineering Center-River Analysis System].

Input Data 5
132 and 122 years of data, respectively. Cyclonic and convec-tive storms have caused excessive surface runoff in northern Illinois. The largest streamflow values often are observed from mid-winter to late spring, when ground conditions (soil mois-ture and vegetation growth) are conducive to minimal infiltra-tion rates and large runoff amounts. Intense, short-duration storms during the summer season have produced major floods in the Blackberry Creek watershed.
Topography and PhysiographyThe Blackberry Creek watershed is within the Bloom-
ington Ridged Plain (Leighton and others, 1948). The area is characterized by low, broad morainic ridges with intervening wide stretches of flat or gently undulating ground moraine. The physiographic contrasts between various parts of Illinois result because of the topography of the bedrock surface, extent of the multiple glaciations, differences in glacial morphology, the age of uppermost drift, and other factors (Leighton and others, 1948, p. 18). Parent soil materials in the Blackberry Creek watershed are loess, glacial till, lacustrine, outwash alluvium, and organic deposits. Illinois Episode and older drift are below the Wisconsin Episode in most places. The glacial deposits range from thin (less than 1 ft thick) near the Fox River to thick (exceeding 100 ft) in the uplands (Leighton and others, 1948, fig. 3). Older drift sheets fill and cover irregulari-ties of the bedrock surface. Watershed topography developed from the succession of two or three drift sheets resulting from subsequent glaciations. The topography varies from level and nearly level to rolling with numerous small depres sions and steeper slopes at headwater sections of the main stem and tributaries. The change in relief from the headwaters to the mouth of Blackberry Creek is about 300 ft.
Streamflow Characteristics Discharge at the USGS streamflow-gaging station at
Blackberry Creek near Yorkville (USGS station 05551700, fig. 1) was compared to the discharge simulated in the hydro-logic model. This gaging station has a drainage area of 65.41 mi2, so it drains most of the watershed. The average and range of surface-water flows from the watershed are discussed in terms of the daily mean discharges measured at the Blackberry Creek near Yorkville gaging station. Annual mean of the daily mean discharge is a characteristic of the yearly flow budget from the watershed. Overall, the annual mean of daily mean discharge of the Blackberry Creek watershed ranged from 16.7 ft3/s to 97.8 ft3/s, with an average of 53.5 ft3/s based on stream flow records from water year (WY) 1961 to WY 2004. During the same time period, the daily mean streamflow at this station ranged from 1.3 ft3/s recorded on September 20, 2003, to 3,460 ft3/s, recorded on July 18, 1996 (in which the maximum peak discharge was 5,510 ft3/s) (LaTour and others, 2006). A flow-duration curve for the same time period showed that the daily mean streamflow would equal or exceed 110 ft3/s
10 percent of the time, 31 ft3/s 50 percent of the time, and 9.9 ft3/s 90 percent of the time.
Input DataData needed for input and use in model development and
verification and flood-hazard mapping included stream and flood-plain cross sections, streamflow, soil, land use, meteo-rologic, and topographic. The coordinate system used in this report is the Illinois State Plane Coordinate System—East Zone HARN (High Accuracy Reference Network), NAD83, and NAVD88 altitude.
Cross Section
The WSP2 hydraulic routing model developed during the U.S. Department of Agriculture, Soil Conservation Service study (1989) included natural and structural cross sections sur-veyed by the Illinois Department of Transportation, Division of Water Resources (IDOT-DWR) in 1985 and by the Illinois State Water Survey in 1975. The WSP2 program (U.S. Depart-ment of Agriculture, Soil Conservation Service, 1976; U.S. Department of Agriculture, Soil Conservation Service, 1993) simulates hydraulic structures using fewer cross sections (no approach or departure cross sections) than the HEC-RAS pro-gram. Review and field verification of the data from 1985 also indicated that bridges had been modified since 1985 and that additional bridges needed to be added in model simulation. Also, the approach and departure cross sections of hydraulic structures were needed in the HEC-RAS models.
Limited surveys were conducted by the USGS and the IDNR-OWR to acquire data for new bridges and culverts, to survey approach and departure cross sections for the hydraulic structures, and to document natural cross sections in the water-shed. New natu ral cross-sectional surveys were conducted to fill in the gaps between available surveyed data in the main stem of Blackberry Creek. The cross sections surveyed in 1985 were kept in the model with the coordinates converted from NAD27/NGVD29 to NAD83/NAVD88 using the CORP-SCON program (U.S. Army Corps of Engi neers, 1997); the cross sections surveyed in 1975 were discarded because of uncertainties in georeferencing and because the cross sections were completed using a simplified approach (8-point surveys). The rest of the survey coordinates are referenced to the Illinois State Plane Coordinate System—East Zone HARN, NAD83, and NAVD88 altitude. During the model evaluation stage, additional cross sections were added by interpretation from the DEM.
Streamflow
Streamflow data are available at two locations in the watershed: the USGS streamflow-gaging station Blackberry

6 Hydrologic, Hydraulic, and Flood Analyses of the Blackberry Creek Watershed, Kendall County, Illinois
Creek near Yorkville (station 05551700) located close to the downstream end of the watershed, and the USGS streamflow-gaging station Blackberry Creek near Montgomery (station 05551675) located at the Jericho Road bridge crossing in Kane County (fig. 1). The unit-value discharges have been developed for the Yorkville station after September 1989 and for the Montgomery station for the period of record (water years 1998 to 2005). The unit-value discharges were aggre-gated to form the hourly streamflow time-series data so they could be compared to simulated hourly streamflow with the HSPF model simulation. The peak, daily mean, and unit-value discharge data for the two stations are published in the USGS annual water data report for Illinois (LaTour and others, 2006). The streamflow data at both stations were used in the calibra-tion and verification of the model parameters in the Soong and others (2005) study, but only data from the Yorkville station are used in this study.
Soil
The NRCS maintains three soil geographic data-bases: Soil Survey Geographic (SSURGO), the State Soil Geographic (STATSGO), and National Soil Geographic (NATSGO) databases. Among the data bases, the SSURGO database provides the most detailed soil information, whereas the NATSGO database pro vides the least detailed soil information. The SSURGO database for Illinois (U.S. Department of Agriculture, Natural Resources Conservation Service, 1995) was used for assessing soil information for the Kane County part of the Blackberry Creek watershed; the STATSGO database for Illinois (U.S. Department of Agri-culture, Natural Resources Conservation Service, 1994) was used for the Kendall County part of the watershed because the SSURGO database was not avail able for Kendall County at the time of this study.
The hydrologic soil groups A, B, C, and D (Doni gian and Davis, 1978, p. 61) were used to classify soils in the water-shed. Soil group A has the highest infiltra tion capacity (0.4-1.0 in/h). Soil group B has the second highest infiltration capacity (0.1-0.4 in/h), and soil groups C and D have smaller infiltra-tion capacities of 0.05-0.1 and 0.01-0.05 in/h, respectively (U.S. Environmental Protection Agency, 2000). Soil group A has the lowest runoff potential because of high infiltration capacity and good drainage, with the amount of runoff increas-ing for B, C, and D. Soil group B is the dominant soil type for the Blackberry Creek watershed (fig. 3). In the hydrologic model, soil groups A and B were simu lated as one soil type and soil groups C and D as another soil type.
Land-Use
The land-use categories used in the hydrologic model were interpreted from the Illinois land-cover database (Luman and others, 1996). The USGS digitized low-, medium-, and high-density urban areas using the 2004 Kane (Thomas
Nicoski, Kane County GIS-Technologies, written commun., 2005) and 2003 Kendall aerial maps (Arron Lee, The Sidwell Company, written commun., November 2005) and incorpo-rated the new data in the HSPF model. These land-cover data are presented in figure 4. Future conditions data are available for Kane representing 2020 conditions (Kevin Beutell, Conser-vation Design Forum, written commun., 2004) and complete build-out for Kendall (Todd Vanadilok, Teska Associates, Inc., written commun., 2005).
Meteorology
Meteorological data, including potential evapotranspira-tion, precipitation, air temperature, net solar radiation, wind movement, and dewpoint temperature, were input to HSPF for deriving the runoffs. A meteorological database for water years 1949–99 was established during the Soong and others (2005) study. This study extended meteorological data to water year 2003 with data available from the Argonne National Laboratory, including measured air temperature, dewpoint temperature, wind movement, and net solar radiation (LaTour and others, 2006). The potential evapotranspiration was com-puted externally using the Lamoreux Potential Evapotranspi-ration (LXPET) program (Lamoreux, 1962; Murphy, 2005); snowmelt and snowmelt accumulation were computed with the energy balance approach specified in the HSPF program (Bicknell and others, 2000).
Precipitation data collected from precipitation gages in the vicinity of the watershed used in the Soong and others (2005) study also were extended to water year 2003. These precipitation gaging stations are shown in table 1 and figure 5. All these stations have a reading accuracy of 0.01 in. and record at hourly or daily intervals. Because flow computations are performed at 1-hour intervals (treated as instantaneous flows), stations with time steps greater than 1 hour were disaggregated to a 1-hour time step by referring to information from nearby stations as outlined in Soong and others (2005). Precipitation data from Aurora and St. Charles were used in the calibration and verification of the HSPF model (Soong and others, 2005) and for further verification in this study because of their proximity to the Blackberry Creek watershed. The Thiessen method (Chow and oth ers, 1988) was used to assign station values to parts of the watershed (fig. 5). Argonne National Laboratory precipitation data were shown to be representative of the region (Soong and others, 2005) and are used for long-term hydrologic simulation in HSPF.
Topography
Topographic features of the watershed were determined with a DEM. The DEM also was used to analyze subbasin delineation and surface slopes and in flood-hazard mapping. Topographic points were provided to Kendall County in 2005 (Gary Lobdell, The Sidwell Company, written commun., 2005) and were determined from aerial photography com-

Input Data 7
Figure 3. Hydrologic soil groups in the Blackberry Creek watershed, Illinois.

8 Hydrologic, Hydraulic, and Flood Analyses of the Blackberry Creek Watershed, Kendall County, Illinois
Figure 4. Land cover in the Blackberry Creek watershed, Illinois.

Input Data 9
pleted in 2003. The USGS produced a 10-ft by 10-ft DEM using these topographic points (an accuracy statement can be found in appendix A). The refined DEM was used with Arc-Hydro (Maidment, 2002) to delineate subbasins of the Black-berry Creek watershed and in mapping the flood-hazard areas. The subbasin numbering system used in the study is shown in table 2 and figure 6. Considering the refined Kendall County elevation data, there are differences in the subbasin delineation as compared to Soong and others (2005). Manual adjustments to the watershed boundary were made to account for present and future developments that alter the natural drainage. Along the western part of the watershed in Kendall County, an exist-ing boundary for the Rob Roy watershed (Jeffrey Freeman, Engineering Enterprises, Inc., written commun., 2005) was matched where discrepancies existed.
Figure 5. Location of precipitation stations in the vicinity of the Blackberry Creek watershed, Illinois. [NWS, National Weather Service; ISWS, Illinois State Water Survey; ANL, Argonne National Laboratory].
Table 1. Selected precipitation stations in the vicinity of the Blackberry Creek watershed, Kendall County, Illinois.
Station name Station type Time step Installed1
National Weather Service
Aurora Standard nonrecording Daily 1948
Illinois State Water Survey
St. Charles Universal weighing Hourly 1989
Argonne National Laboratory
Argonne National Laboratory
Universal weighing Daily 1948
1All stations currently (2007) are in operation.

10 Hydrologic, Hydraulic, and Flood Analyses of the Blackberry Creek Watershed, Kendall County, Illinois
Hydrologic, Hydraulic, and Flood Analyses
Hydrologic analysis was completed using the continu-ous hydrologic model, HSPF. The simulated streamflow from the hydrologic model was used in a flood frequency analysis to estimate flood quantiles at the outlet of each subbasin in the watershed. The estimated flood quantiles were used as input for the hydraulic model, HEC-RAS. The flood eleva-tions simulated by the hydraulic model were used to map the 100- and 500-year flood plain boundaries. These analyses are described in more detail in the following sections.
Continuous Hydrologic Model
Observed precipitation and other meteorological time series were input to a hydrologic model, HSPF, to provide a continuous-streamflow time series at various locations in the Blackberry Creek watershed. From each stream flow time series, a flood-peak series was determined and used to calcu-late flood quantiles at that location with the flood-frequency analysis.
HSPF (Bicknell and others, 2000) is public-domain soft-ware supported by the USGS and U.S Envi ronmental Protec-tion Agency (USEPA). It is among the most comprehensive continuous- simulation hydrologic models available (Singh, 1995); it can be used for evaluating the effects of various land uses on runoff and stormwa ter-management practices. HSPF contains sediment and water-quality modules that could be used in later stud ies to perform water-quality analyses. HSPF also is an accepted hydrologic model by FEMA for use in the National Flood Insur ance Program (NFIP) (Federal Emer-gency Man agement Agency, 2007). HSPF was used in this study to simulate continuous water movement through various patterns of land uses in the watershed. In the simulation, vari-ous water movements in the hydrologic cycle, including inter-
ception, depression and storage, infiltration, interflow, ground water, soil moisture, surface runoff, and evapotranspiration (fig. 7) were described. Snow accumulation and melt also were simulated.
Simulating the physical processes of the hydrologic cycle in the Blackberry Creek watershed with HSPF involves pre-paring a user control input (UCI) file. The UCI file describes the conceptualized physical process of water (or other constit-uents) movement over the land, through the soil (fig. 7), and in the channels of the actual watershed so HSPF can simulate the movement.
In an HSPF simulation, computations are performed on land surfaces with spatially averaged land use and/or on channel reach segments. Land with a pervious surface is called a pervious-land segment (symbol PERLND) and land with impervious surface is called an impervi ous-land seg-ment (symbol IMPLND). Further division of PERLND or IMPLND to more descriptive land-use segments can be done based on the model simulation objectives. The PERLNDs and IMPLNDs used in describing the land uses of the Blackberry Creek watershed are given in table 3. As described previ-ously, the land-use categories generally follow the land-cover database categories (Luman and others, 1996). The USGS digitized low-, medium-, and high-density urban areas using the 2004 Kane and 2003 Kendall aerial maps. A summary of percentages of PERLND and IMPLND for Kendall County subbasins is presented in table 4.
Hydrologic model parameters that are used to simulate the continuous water movement and storage among various physical components in the hydrologic cycle significant to dif-ferent land-use segments were calibrated and verified in Soong and others (2005) and are used in this study (table 5); however, the streamflow simulations have been increased from 49 water years (WY 1950–99) to 54 WY (WY 1950–2003) based on observed meteorological data from Argonne National Labora-tory (LaTour and others, 2006). For event verifications, the precipitation data from St. Charles and Aurora also have been included for water year 2003.
Aside from the streamflow volumes estimated by the hydrologic analysis, channel storage and roughness character-istics can modify the shape and peaks of outflow hydrographs. To determine a streamflow time series at each subbasin outlet, a routing function (stage, storage volume, and discharge rating) was developed for each subbasin. The rating for the subbasin is developed in the HEC-RAS model by modeling the reach that is within the subbasin. A range of discharges expected in the subbasin are modeled, and the resulting stage and storage volume for each discharge are used in the HSPF routing function.
Kendall County, the City of Montgomery, and the United City of Yorkville all have regulations that include stormwater detention release rates. These regulations were put in place to control large storm run offs as the watershed has become more urbanized. Kendall County and the City of Montgomery have a release rate of 0.10 ft3/s-acre of impervious land, whereas the release rate in the United City of Yorkville is 0.15 ft3/s-acre of
Table 2. Delineated subbasin numbering system used in this study of the Blackberry Creek watershed, Illinois.
Stream reachSubbasins (upstream to downstream)
(fig. 6)
Tributary F 10
Tributary D 22, 21, 20
Tributary C 33, 32, 31, 30
Prestbury Tributary 41, 40
Lake Run Tributary 57, 56, 55, 54, 53, 52, 51, 50
East Run Tributary 64, 63, 62, 61, 60
Chain-of-Lakes Tributary 79, 78, 77, 76, 75, 74, 73, 72, 71, 70
Main stem of Blackberry Creek
208, 210, 213, 216, 218, 223, 226, 230, 233, 236, 240, 250, 260, 265, 270, 276, 278, 279, 280, 286, 290

Hydrologic, Hydraulic, and Flood Analyses 11
Figure 6. Subbasins and their associated numbering system used in the Blackberry Creek watershed in Kane and Kendall Counties, Illinois.

12 Hydrologic, Hydraulic, and Flood Analyses of the Blackberry Creek Watershed, Kendall County, Illinois
Figure 7. Hydrological Simulation Program–FORTRAN process model.

Hydrologic, Hydraulic, and Flood Analyses 13
Table 3. Land cover represented by PERLNDs (pervious lands) and IMPLNDs (impervious lands) in the Hydrological Simulation Program–FORTRAN.
HSPF Land cover
PERLND
Cropland Row crops, small grains, orchards/nurseries
Grassland Urban grassland, rural grassland
Forested and wooded land Deciduous woods, open woods, coniferous woods
Pervious residential 90 percent of low density urban; 50 percent of medium density urban
Wetland Shallow marsh/wet meadow, deep marsh, bottomland forest, swamp, shallow water wetland
Barren and exposed land Quarries, bare soil surfaces, beaches
IMPLND
High density urban All or nearly all of the land surface covered with manmade structures, open water (Open water is a separate category in the land-cover database but is simulated in the hydrologic model as impervious land.)
Impervious residential 10 percent of low density urban; 50 percent of medium density urban
Transportation Interstates, highways, primary roads
Table 4. Percent values of PERLNDs (pervious lands) and IMPLNDs (impervious lands) in the Kendall County part of the Blackberry Creek watershed, Illinois.
Percent in watershed1
PERLND or IMPLND Kendall County Kane and Kendall County
Cropland 46.1 47.0
Grassland 15.0 19.6
Forested and wooded land 5.1 3.9
Wetland 2.6 2.9
Pervious residential 11.1 8.7
High density urban 2.9 2.6
Impervious residential 15.4 11.9
Transportation .6 1.2
Barren and exposed land .0 .41Percent values are rounded to the tenth.

14 Hydrologic, Hydraulic, and Flood Analyses of the Blackberry Creek Watershed, Kendall County, Illinois
Tabl
e 5.
Hy
drol
ogic
Sim
ulat
ion
Prog
ram
–FOR
TRAN
(HSP
F) m
odel
par
amet
ers
for t
he B
lack
berr
y Cr
eek
wat
ersh
ed, I
llino
is.
[ft/f
t, fo
ot p
er f
oot;
Para
met
ers:
FO
RE
ST, f
ract
ion
of p
ervi
ous
land
cov
ered
by
fore
st; L
ZSN
, low
er z
one
nom
inal
sto
rage
; IN
FILT
, inf
iltra
tion;
NSU
R, M
anni
ng’s
n f
or o
verl
and
flow
pla
ne; A
GW
RC
, ac
tive
grou
nd-w
ater
rec
essi
on c
onst
ant;
DE
EPF
R, f
ract
ion
of g
roun
d-w
ater
infl
ow; A
GW
ET
P, a
ctiv
e gr
ound
-wat
er e
vapo
tran
spir
atio
n; I
NT
FW, i
nter
flow
; IR
C, i
nter
flow
rec
essi
on c
onst
ant;
Surf
ace
slop
es:
Flat
to m
oder
ate
is d
efin
ed b
y a
slop
e of
less
than
or
equa
l to
0.03
ft/f
t; St
eep
is d
efin
ed b
y a
slop
e gr
eate
r th
an 0
.03
ft/f
t; So
il gr
oups
: Soi
l 1 in
clud
es h
ydro
logi
c so
il gr
oups
A a
nd B
; Soi
l 2 in
clud
es h
ydro
-lo
gic
soil
grou
ps C
and
D (
see
figu
re 3
for
of
soil
grou
ps d
ata)
]
HSP
F m
odel
par
amet
ers
Perv
ious
land
seg
men
t (PE
RLN
D)
FORE
STLZ
SNIN
FILT
NSU
RA
GW
RCD
EEPF
RA
GW
ETP
INTF
WIR
C
Cro
plan
d (f
lat t
o m
oder
ate)
(so
il 1)
0.0
04.
0 0
.080
0.
100.
980
0.
05
0.0
54.
5
0.70
Cro
plan
d (f
lat t
o m
oder
ate)
(so
il 2)
.00
3.5
.030
.10
.98
0.0
5.0
54.
5.7
0
Cro
plan
d (s
teep
) (s
oil 1
).0
03.
5.0
75.1
0 .
980
.05
.05
4.0
.65
Cro
plan
d (s
teep
) (s
oil 2
).0
03.
0.0
25.1
0 .
980
.05
.05
4.0
.65
Gra
ssla
nd (
flat
to m
oder
ate)
(so
il 1)
.05
4.5
.085
.40
.98
0.0
5.0
55.
0.7
0
Gra
ssla
nd (
flat
to m
oder
ate)
(so
il 2)
.05
4.0
.035
.40
.98
0.0
5.0
55.
0.7
0
Gra
ssla
nd (
stee
p) (
soil
1).0
54.
0.0
80.4
0 .
980
.05
.05
4.5
.65
Gra
ssla
nd (
stee
p) (
soil
2).0
53.
5.0
30.4
0 .
980
.05
.05
4.5
.65
Fore
sted
and
woo
ded
land
(fl
at to
mod
erat
e) (
soil
1).4
05.
0.1
05.4
5 .
980
.05
.10
4.7
.70
Fore
sted
and
woo
ded
land
(fl
at to
mod
erat
e) (
soil
2).4
04.
5.0
55.4
5 .
980
.05
.10
4.7
.70
Fore
sted
and
woo
ded
land
(st
eep)
(so
il 1)
.40
4.5
.100
.45
.98
0.0
5.1
04.
2.6
5
Fore
sted
and
woo
ded
land
(st
eep)
(so
il 2)
.40
4.0
.050
.45
.98
0.0
5.1
04.
2.6
5
Perv
ious
res
iden
tial (
flat
to m
oder
ate)
(so
il 1)
.20
4.7
.090
.25
.98
0.0
5.0
54.
6.7
0
Perv
ious
res
iden
tial (
flat
to m
oder
ate)
(so
il 2)
.20
4.2
.040
.25
.98
0.0
5.0
54.
6.7
0
Perv
ious
res
iden
tial (
stee
p) (
soil
1).2
04.
2.0
85.2
5 .
980
.05
.05
4.1
.65
Perv
ious
res
iden
tial (
stee
p) (
soil
2).2
03.
7.0
35.2
5 .
980
.05
.05
4.1
.65
Wet
land
(so
il 1)
.10
4.5
.150
.20
.98
5.0
5.6
03.
5.7
0
Wet
land
(so
il 2)
.10
4.0
.100
.20
.98
5.0
5.6
03.
5.7
0
Bar
ren
and
expo
sed
(soi
l 1)
.00
7.5
.250
.05
.98
0.0
5.1
53.
5.7
0
Bar
ren
and
expo
sed
(soi
l 2)
.00
7.5
.200
.05
.98
0.0
5.1
53.
5.7
0

Hydrologic, Hydraulic, and Flood Analyses 15
impervious land. To incorporate these release rates, detention routing was added to the hydrologic model. The amount of detention required in each subbasin was determined by the increase in impervious land surface from the 1996 conditions to the 2003 and 2004 conditions.
To verify the model for the extended simulation [com-pared to the simulation in Soong and others (2005)], and other updated data, storm hydrographs were compared to evaluate the magnitude, timing, and flow duration during different storm events. Flows produced by three selected storms were compared at the Yorkville streamflow-gaging station (fig. 8).
In addition to the three storms during the extended simulation period, the performance of the model was verified for the July 1996 storm. This storm was larger than a 500-year return period event and tests the ability of the model to simu-late extreme events. The simulated peak discharge (5,280 ft3/s on July 18 at 18:00) is within 5 percent of the observed peak discharge (5,510 ft3/s on July 18 at 22:00) (fig. 9). Results, as shown in figures 8 and 9, indicate that simulated flow volumes, peak discharges, and the magnitude, timing, and duration of flow hydrographs were generally in good agreement with the observed data at the Yorkville streamflow-gaging station.
Flood-Frequency Analysis
Utilizing the AMS determined from simulated stream-flow records at various locations in the watershed from the hydrologic model, flood-frequency analysis was used to estimate flood quantiles. The 100- and 500-year floods deter-mined in this analysis were then used in the hydraulic model analysis. Precipitation data from Argonne National Laboratory (LaTour and others, 2006) was determined to be rep resentative for the long-term simulation with the HSPF Blackberry Creek hydrologic model in Soong and others (2005). Precipitation data from Argonne National Laboratory is also used in this study for long-term hydrologic simulation. The flood quantiles for the subbasins of Blackberry Creek watershed in Kendall County were calculated from the flood-frequency analysis for simulated AMS for the period of water years 1950 to 2003. The estimated 1.25-, 2-, 5-, 10-, 25-, 50-, 100-, 200-, and 500-year flood quantiles for these subbasins are presented in table 6. A comparison of the 10-, 100-, and 500-year flood quantiles at the county border, the USGS Yorkville streamflow-gaging station, and the outlet of the watershed is presented in table 7.
The USDA (1989) and FEMA (2002) studies were based on different land uses and drainage areas, and are included for general reference. The quantiles from the present study and those derived from the annual maximum series at the USGS Yorkville streamflow-gaging station differed by 11 percent for the Q
10, 4 percent for the Q
100, and 3 percent for the Q
500.
Hydraulic Model
The HEC-RAS hydraulic model (U.S. Army Corps of Engineers, 2002) was used in this study to compute the cor-
responding 100- and 500-year flood elevations with respect to flood quantiles estimated from hydrologic analysis, so that the flood elevations can be used for delineating flood plain bound-aries on maps; to compute the reach-wise, depth-surface, and area-volume relations for channel and reservoir routing in HSPF model simulation; and to perform encroachment
Figure 8. Simulated and observed hourly streamflow at the U.S. Geological Survey Yorkville streamflow-gaging station, Blackberry Creek watershed, Illinois, for selected storm events from water years 2000–03.

16 Hydrologic, Hydraulic, and Flood Analyses of the Blackberry Creek Watershed, Kendall County, Illinois
Table 6. Estimated flood quantiles at 1.25-, 2-, 10-, 25-, 50-, 100-, 200-, and 500-year recurrence intervals for subbasins (upstream to downstream) of the Kendall County part of Blackberry Creek watershed, Illinois.
[QT, flood quantile at T-year recurrence interval, in ft3/s cubic feet per second]
Subbasinnumber
Flood quantile, QT
Q1.25 Q2 Q5 Q10 Q25 Q50 Q100 Q200 Q500
270 331 565 981 1,316 1,810 2,229 2,692 3,206 3,968
276 335 569 985 1,321 1,816 2,237 2,704 3,222 3,993
278 340 572 982 1,313 1,798 2,211 2,668 3,173 3,925
279 345 580 993 1,326 1,814 2,228 2,687 3,196 3,951
280 356 595 1,013 1,349 1,842 2,260 2,721 3,232 3,991
286 363 605 1,028 1,366 1,863 2,284 2,749 3,263 4,026
290 370 614 1,040 1,381 1,881 2,303 2,771 3,287 4,053
Table 7. Comparison of flood quantiles for three locations in the Kendall County part of Blackberry Creek watershed, Illinois. The three scenarios include the present study, two previous studies of the watershed, and the flood-frequency analysis of the annual maximum series from the U.S. Geological Survey Yorkville streamflow-gaging station for the water years 1961–2003.
[QT, flood quantile at T-year recurrence interval, in ft3/s cubic feet per second; --, not applicable]
Subbasin 270 (county boundary)Subbasin 280 (Yorkville
streamflow gage) Subbasin 290 (outlet of watershed)
Scenario Q10 Q100 Q500 Q10 Q100 Q500 Q10 Q100 Q500
Present study 1,316 2,692 3,968 1,349 2,721 3,991 1,381 2,771 4,053
Based on Annual Maxi-mum Series calculated at Yorkville gage
-- -- -- 1,502 2,818 3,857 -- -- --
Federal Emergency Man-agement Agency Study (2002)1
870 1,750 -- -- -- -- 890 1,800 --
U.S. Department of Agri-culture Study (1989)
2,140 3,340 3,940 2,180 3,400 4,010 2,190 3,420 4,030
1 Drainage areas differ from the present study (59.6 mi2 at the county boundary and 73.5 mi2 at the mouth).
Figure 9. Simulated and observed hourly streamflow at the U.S. Geological Survey Yorkville streamflow-gaging station, Blackberry Creek watershed, Illinois, for the July 1996 storm event.

Hydrologic, Hydraulic, and Flood Analyses 17
analysis to determine proper floodway boundaries. HEC-RAS is an accepted computer hydraulic model by FEMA for NFIP usage (Federal Emergency Management Agency, 2003). Procedures for developing a HEC-RAS model can be found in the HEC-RAS users’ manual (U.S. Army Corps of Engineers, 2002).
Steady-state analysis was used in this study to deter-mine the water-surface elevations for flood-hazard analysis. Data needed for a steady-state flow simulation with HEC-RAS include boundary conditions, peak discharges, and flow regimes. Boundary conditions, as known stages or flood discharges, must be specified to start a water-surface computa-tion in a river reach. Stage boundary conditions were specified at the upstream and downstream ends of the Blackberry Creek HEC-RAS model for mixed flow analysis. Normal depth boundary conditions were specified at the uppermost stream cross section. A normal depth boundary condition also was specified at the most downstream cross section with the junc-tion of the Fox River. In HEC-RAS simulation, discharges are specified at cross sections within a subbasin utilizing the gen-erated flood quantiles specified at the outlet of the subbasin.
The ineffective flow areas option of HEC-RAS was used to define areas of cross sections that contained water not actively being conveyed (ineffective flow). Ineffective flow areas are specified at natural cross sections where the flood-plain is very wide and where contraction/expansion exists, and at hydraulic structures such as bridges and culverts. At very wide natural cross sections, the locations of ineffective flow area are first identified by inspection of an aerial photograph. Later, the locations are adjusted after inspecting the energy gradient line of HEC-RAS output, and inundation drawn on contour maps. For hydraulic structure sites, an initial estimate for locating ineffective areas at expansion and contraction cross sections was obtained using 1:4 and 1:1 ratios (stream-wise distance to lateral cross-section distance), respectively. Similarly, the locations of ineffective flow areas at approach-ing and departure cross sections are adjusted by inspecting energy gradient lines, channel velocity, and hydraulic output at structures.
To verify the model for the extended simulation [com-pared to the simulation in Soong and others (2005)], and other updated data, the Yorkville streamflow-gaging data and data from two crest-stage (CSG) gages were used from WY 2001–03. The results at Galena Road and Bristol Ridge Road bridges and Yorkville station (fig. 1) are presented in table 8. The average difference in observed and simulated flood elevations for the eight readings was 0.38 ft with a standard deviation of 0.24 ft. Possible reasons for discrepancies could be attributed to changes in channel geometry or seasonal vegetation differences that caused different flow resistances. Although adjusting the Manning’s roughness coefficients could modify the flood water-surface elevations and improve the comparison, adjustments were not done because the Man-ning’s coefficients were determined based on field reconnais-sance and will be used for other flood discharges.
Flood-Hazard Analysis
The estimated flood quantiles were used to establish the flow data for the HEC-RAS hydraulic model for estimat-ing flood stages and for flood plain and floodway analysis. An encroachment analysis was conducted to determine the floodway width using guidelines established by the State of Illinois (Illinois Department of Natural Resources, 2002), which stated that “The regulatory floodway boundaries are determined by hydraulic and hydrologic analyses, which cal-culate that portion of the flood plain that must be preserved to store and discharge floodwaters without causing damaging or potentially damaging increases in flood stage and flood veloci-ties or loss of flood storage which would result singularly or cumulatively in more than a 0.1 ft increase in flood stage or a 10 percent increase in velocity.” For floodway analysis, “In general, the final encroachments should have a consistent and smooth transition from one cross section to the next” (U.S. Army Corps of Engineers, 2002). A plan view of the floodway encroachments was used to determine if the encroachments transitioned smoothly or if they were erratic. Ineffective flow
Table 8. Comparision of peak-flood stages simulated with the hydraulic model and observed values at Galena Road bridge and Bristol Ridge Road bridge and at U.S. Geological Survey Yorkville streamflow gaging station (station number 05551700).
[All elevations presented are in NAVD88]
Location(fig. 1)
October 14–15, 2001 May 12–13, 2002 May 10–12, 2003
Simulated Observed Simulated Observed Simulated Observed
Galena Road bridge 643.93 643.32 644.24 644.18 643.17 --1
Bristol Ridge Road bridge 634.43 633.89 634.71 634.5 633.64 633.68
USGS Yorkville streamflow-gaging station 619.05 618.45 619.46 618.95 618.09 618.56
1Note: Vandalism of crest-stage gages at Galena Road caused no data to be collected for this event.

18 Hydrologic, Hydraulic, and Flood Analyses of the Blackberry Creek Watershed, Kendall County, Illinois
areas (defined in the Hydraulic Model section) can be a cause of erratic encroachment transitions. The erratic encroach-ments were further refined and the model was re-run to make sure encroachment guidelines were met. At bridge locations, natural cross sections upstream and downstream were used to make sure to make sure that the floodway at the contraction and expansion of the bridge was reasonable.
The resulting flood elevations from the hydraulic model were mapped for the 100- and 500-year flood plains and for the 100-year floodway. Boundaries of the flood plains and floodway are presented in figure 10. These maps are not FEMA-approved Flood Insurance Rate Maps, and are subject to revision.
The 100- and 500-year flood plains covered 3,699 and 3,762 acres of land, respectively (table 9). More than 40 percent of the land in the flood plains was used for cropland. Approximately 33 percent of the 100-year flood plain and 34 percent of the 500-year flood plain were classified as residen-tial. Although many acres of residential land were included in the flood plain, this land mostly was residential lawns with 25 homes within the 100-year flood plain and 41 homes within the 500-year flood plain in the 2003 aerial photograph.
The 100-year flood magnitude, selected hydraulic charac-teristics, and encroachment analysis at each cross section has been compiled from the hydraulic model analysis. The results are presented in table 10.
Summary
The Blackberry Creek watershed in Kane and Kendall Counties, Illinois, has undergone rapid urbanization in recent
decades. The population and urbanized lands in the watershed are projected to double from the 1990 condition by the year 2020. Flood-induced damage has occurred more frequently in recent years in urban areas of the watershed, and there are concerns about the effect of urbanization on flood peaks and volumes and potential effects on the water quality and stream habitats.
To address some of the issues listed above, the U.S. Geo-logical Survey (USGS), in cooperation with the United City of Yorkville, Kendall County, the Village of Montgomery, Illinois Department of Natural Resources, Office of Water Resources, and Federal Emergency Management Agency, conducted a flood-hazard study of the Blackberry Creek watershed during 2004–05. This report describes the data collected to refine the hydrologic and hydraulic models from those used in the Soong and others (2005) study of the Kane County part of the Blackberry Creek watershed and extension of the flood-fre-quency analysis through water year 2003, and presents a map of the 100- and 500-year flood plains and 100-year floodway. The USGS is using a continuous hydrologic simulation/flood frequency approach to generate the flood quantiles used in the hydraulic model. This study demonstrates the successful application of this approach with the goal of promoting the use of this advanced technique for flood-hazard studies in other watersheds.
The hydrologic model, Hydrologic Simulation Program–FORTRAN (HSPF), was used in this study to simulate continuous water movement through various land uses in the watershed. The hydrologic model was developed from a 2003 digital elevation model, and from soil and land-use data. Observed precipitation and other meteorologic time series were input to the hydrologic model to supply a continuous streamflow time series at various locations in the watershed.
Table 9. The 2003 land cover (by area and percent) and areas included in the 100- and 500-year flood plains in the Blackberry Creek watershed, Kendall County, Illinois.
Land-cover category100-Year flood plain area
(acres)Percent of total 100-year
flood plain area500-year flood plain area
(acres)Percent of total 500-year
flood plain area
Cropland 1,551.92 41.95 1,559.60 41.45
Forested and wooded land 297.66 8.05 299.71 7.97
Grassland 468.39 12.66 469.45 12.48
High density residential 4.72 .13 6.60 .18
Low density residential 434.78 11.75 484.96 12.89
Medium density residential 803.04 21.71 803.04 21.35
Transportation 40.07 1.08 40.07 1.07
Wetland 98.74 2.67 98.74 2.62
Total 3,699.32 100.00 3,762.18 100.00

Summary 19Ta
ble
10.
Hydr
aulic
cha
ract
eris
tics
corr
espo
ndin
g to
100
-yea
r flo
od e
leva
tion
and
flood
way
enc
roac
hmen
t for
the
Blac
kber
ry C
reek
wat
ersh
ed, K
enda
ll Co
unty
, Ill
inoi
s.—
Cont
inue
d
[All
elev
atio
ns g
iven
are
in N
AV
D88
. ft,
feet
; ft2 ,
squa
re f
oot;
ft/s
, fee
t per
sec
ond]
Cros
s se
c-tio
n la
bel
(app
endi
x B
)
Cros
s
sect
ion
nu
mbe
r
To
p w
idth
(ft)
Cros
s se
ctio
n ar
ea (f
t2 )M
ean
velo
city
(ft/s
)B
ase
flood
wat
er-s
urfa
ce e
leva
tion
(ft)
Dis
tanc
e
(ft)
With
out
flood
way
With
flo
odw
ayW
ithou
t flo
odw
ayW
ith
flood
way
Perc
ent
chan
geW
ithou
t flo
odw
ayW
ith
flood
way
Perc
ent
chan
geRe
gula
tory
W
ithou
t flo
odw
ayW
ith
flood
way
Chan
ge
10
92.6
867
.75
370.
0335
3.25
-57.
497.
845
572.
4557
2.45
572.
55 0
.10
A38
838
815
0.38
103.
0064
1.83
608.
03-5
4.32
4.56
657
4.79
574.
7957
4.84
.05
658
658
288.
5626
7.00
1,13
4.76
1,12
8.88
-12.
442.
450
575.
5757
5.57
575.
62.0
5
780
780
126.
9610
1.00
522.
6851
2.02
-25.
305.
412
575.
7657
5.76
575.
80.0
4
802
800
120.
0011
9.31
696.
6269
7.33
03.
983.
970
575.
9657
5.96
576.
00.0
4
833
830
119.
0011
8.61
1,27
8.04
1,27
9.23
02.
172.
170
576.
2757
6.27
576.
30.0
3
841
840
67.2
458
.80
594.
7254
8.23
-84.
665.
058
576.
1757
6.17
576.
18.0
1
B86
185
010
4.00
88.0
01,
372.
531,
364.
19-1
2.02
2.03
058
6.32
586.
3258
6.35
.03
934
944
201.
3513
5.00
804.
3677
7.63
-33.
443.
563
586.
2458
6.24
586.
28.0
4
1015
1,04
423
3.93
180.
001,
062.
871,
001.
82-6
2.61
2.77
658
6.54
586.
5458
6.55
.01
C25
431,
649
364.
4927
1.00
1,32
9.98
1,22
0.92
-82.
082.
279
587.
5058
7.50
587.
50.0
0
3020
2,04
647
1.09
379.
001,
675.
261,
562.
02-7
1.65
1.77
758
8.05
588.
0558
8.05
.00
3880
2,93
416
8.72
129.
0094
8.52
878.
20-7
2.92
3.16
858
9.15
589.
1558
9.16
.01
4405
3,45
935
4.21
291.
001,
420.
461,
309.
42-8
1.95
2.12
958
9.95
589.
9558
9.98
.03
4520
4,13
338
0.31
352.
001,
167.
101,
126.
19-4
2.37
2.46
459
1.41
591.
4159
1.47
.06
4874
4,48
731
0.93
244.
001,
109.
951,
029.
31-7
2.50
2.69
859
2.71
592.
7159
2.77
.06
D54
875,
100
346.
9728
2.55
1,04
7.01
979.
25-6
2.65
2.83
759
4.87
594.
8759
4.91
.04
5633
5,73
238
1.43
335.
911,
289.
731,
228.
22-5
2.15
2.26
559
6.73
596.
7359
6.78
.05
6425
6,08
545
8.69
366.
001,
308.
661,
206.
17-8
2.12
2.30
859
7.66
597.
6659
7.71
.05
E70
816,
741
522.
7740
6.54
1,55
6.90
1,44
2.05
-71.
781.
928
599.
3659
9.36
599.
40.0
4
7275
7,35
425
0.49
205.
2094
2.57
862.
97-8
2.94
3.21
960
0.94
600.
9460
0.99
.05
7765
7,84
460
4.32
446.
121,
753.
261,
598.
80-9
1.58
1.73
960
2.35
602.
3560
2.43
.08
8400
8,57
253
1.56
342.
201,
668.
861,
515.
17-9
1.66
1.83
1060
3.44
603.
4460
3.51
.07
F88
509,
022
661.
2754
0.95
1,76
6.54
1,60
9.20
-91.
571.
7210
604.
2460
4.24
604.
31.0
7
9532
9,66
946
3.68
329.
8191
5.07
833.
87-9
3.03
3.32
1060
5.90
605.
9060
5.97
.07

20 Hydrologic, Hydraulic, and Flood Analyses of the Blackberry Creek Watershed, Kendall County, IllinoisTa
ble
10.
Hydr
aulic
cha
ract
eris
tics
corr
espo
ndin
g to
100
-yea
r flo
od e
leva
tion
and
flood
way
enc
roac
hmen
t for
the
Blac
kber
ry C
reek
wat
ersh
ed, K
enda
ll Co
unty
, Ill
inoi
s.—
Cont
inue
d
[All
elev
atio
ns g
iven
are
in N
AV
D88
. ft,
feet
; ft2 ,
squa
re f
oot;
ft/s
, fee
t per
sec
ond]
Cros
s se
c-tio
n la
bel
(app
endi
x B
)
Cros
s
sect
ion
nu
mbe
r
To
p w
idth
(ft)
Cros
s se
ctio
n ar
ea (f
t2 )M
ean
velo
city
(ft/s
)B
ase
flood
wat
er-s
urfa
ce e
leva
tion
(ft)
Dis
tanc
e
(ft)
With
out
flood
way
With
flo
odw
ayW
ithou
t flo
odw
ayW
ith
flood
way
Perc
ent
chan
geW
ithou
t flo
odw
ayW
ith
flood
way
Perc
ent
chan
geRe
gula
tory
W
ithou
t flo
odw
ayW
ith
flood
way
Chan
ge
9712
9,81
184
.96
84.0
049
4.10
500.
541
5.61
5.54
-160
6.44
606.
4460
6.52
0.08
9772
9,86
686
.13
84.0
055
9.52
559.
360
4.91
4.91
060
7.22
607.
2260
7.22
.00
G10
267
10,4
0532
3.61
240.
001,
217.
051,
143.
90-6
2.26
2.40
660
8.35
608.
3560
8.36
.01
1068
011
,005
367.
8731
1.00
1,14
9.79
1,06
0.85
-82.
392.
598
609.
2660
9.26
609.
27.0
1
1154
611
,816
322.
1425
3.00
1,77
3.25
1,63
8.85
-81.
551.
688
610.
4461
0.44
610.
47.0
3
H12
150
12,9
1623
2.35
168.
0075
5.04
699.
33-7
3.64
3.93
861
3.11
613.
1161
3.13
.02
1340
013
,680
458.
1240
9.00
1,53
7.24
1,46
5.18
-51.
791.
885
615.
5561
5.55
615.
57.0
2
1419
814
,478
418.
3338
1.00
1,84
3.90
1,78
4.86
-31.
491.
543
616.
6961
6.69
616.
76.0
7
1484
515
,091
362.
9128
9.00
1,31
9.71
1,23
7.22
-62.
082.
227
617.
5261
7.52
617.
60.0
8
I15
428
15,6
7442
5.83
345.
001,
678.
901,
561.
46-7
1.64
1.76
761
8.54
618.
5461
8.60
.06
1647
016
,788
704.
6556
0.03
2,53
2.03
2,30
8.85
-91.
091.
199
619.
6961
9.69
619.
76.0
7
1722
217
,653
410.
7935
2.29
1,22
1.40
1,14
9.99
-62.
252.
396
621.
2162
1.21
621.
29.0
8
1729
917
,734
384.
5229
9.47
1,25
0.25
1,14
2.83
-92.
202.
4110
621.
4362
1.43
621.
52.0
9
J17
468
17,8
9851
3.87
394.
001,
647.
111,
516.
48-8
1.67
1.81
862
1.79
621.
7962
1.89
.10
1753
317
,966
96.6
397
.00
527.
1553
6.44
25.
165.
07-2
621.
8562
1.85
621.
95.1
0
1758
418
,046
94.5
595
.00
537.
5254
5.25
15.
064.
99-1
622.
1062
2.10
622.
18.0
8
1763
218
,064
439.
2935
8.95
1,44
1.82
1,31
2.87
-91.
892.
0710
622.
3962
2.39
622.
45.0
6
1777
318
,201
385.
8630
0.61
1,37
8.52
1,26
0.84
-91.
972.
1610
622.
6662
2.66
622.
73.0
7
1790
518
,332
76.3
475
.00
489.
5549
2.09
15.
565.
53-1
622.
9562
2.95
623.
02.0
7
K18
780
19,3
0359
3.02
466.
102,
801.
592,
555.
48-9
0.97
1.06
962
4.42
624.
4262
4.49
.07
1970
620
,229
601.
0846
6.71
2,48
9.03
2,26
7.28
-91.
091.
2010
624.
9162
4.91
624.
99.0
8
2100
021
,237
561.
4247
7.49
2,35
2.38
2,21
8.63
-61.
161.
236
625.
5362
5.53
625.
61.0
8
L22
067
22,5
601,
199.
921,
001.
373,
058.
632,
844.
06-7
0.89
0.96
862
6.61
626.
6162
6.71
.10
2297
923
,449
649.
4551
9.54
2,21
6.55
2,04
6.40
-81.
231.
338
627.
7662
7.76
627.
86.1
0
2412
024
,744
689.
0159
6.37
2,86
0.13
2,71
8.34
-50.
951.
005
629.
0362
9.03
629.
12.0
9
2471
825
,113
509.
2242
9.62
2,29
5.63
2,17
2.85
-51.
191.
255
629.
2862
9.28
629.
38.1
0

Summary 21Ta
ble
10.
Hydr
aulic
cha
ract
eris
tics
corr
espo
ndin
g to
100
-yea
r flo
od e
leva
tion
and
flood
way
enc
roac
hmen
t for
the
Blac
kber
ry C
reek
wat
ersh
ed, K
enda
ll Co
unty
, Ill
inoi
s.—
Cont
inue
d
[All
elev
atio
ns g
iven
are
in N
AV
D88
. ft,
feet
; ft2 ,
squa
re f
oot;
ft/s
, fee
t per
sec
ond]
Cros
s se
c-tio
n la
bel
(app
endi
x B
)
Cros
s
sect
ion
nu
mbe
r
To
p w
idth
(ft)
Cros
s se
ctio
n ar
ea (f
t2 )M
ean
velo
city
(ft/s
)B
ase
flood
wat
er-s
urfa
ce e
leva
tion
(ft)
Dis
tanc
e
(ft)
With
out
flood
way
With
flo
odw
ayW
ithou
t flo
odw
ayW
ith
flood
way
Perc
ent
chan
geW
ithou
t flo
odw
ayW
ith
flood
way
Perc
ent
chan
geRe
gula
tory
W
ithou
t flo
odw
ayW
ith
flood
way
Chan
ge
M25
448
25,9
881,
639.
0979
3.75
960.
1894
8.12
-12.
802.
831
630.
9863
0.98
631.
030.
05
2644
826
,947
876.
9766
6.33
3,35
1.94
3,09
0.36
-80.
800.
879
632.
1963
2.19
632.
19.0
0
2726
727
,766
997.
3375
4.32
2,62
8.31
2,39
4.53
-91.
021.
1210
632.
6663
2.66
632.
64-.
02
2836
428
,945
857.
4465
6.02
2,10
7.01
1,90
4.80
-10
1.28
1.41
1063
3.82
633.
8263
3.81
-.01
2908
329
,664
969.
8379
5.04
2,54
6.24
2,30
1.28
-10
1.06
1.17
1063
4.63
634.
6363
4.67
.04
N30
180
31,0
0172
6.00
620.
742,
331.
622,
201.
60-6
1.15
1.22
663
5.73
635.
7363
5.83
.10
3165
032
,327
1,10
2.24
881.
572,
861.
682,
643.
15-8
0.94
1.02
963
6.88
636.
8863
6.97
.09
3177
032
,401
962.
6173
6.82
2,57
0.49
2,35
3.31
-81.
051.
149
636.
9463
6.94
637.
03.0
9
3182
932
,452
304.
2315
3.77
774.
7678
9.41
23.
473.
40-2
636.
9263
6.92
637.
01.0
9
3185
832
,507
334.
2815
3.77
795.
3580
8.39
23.
383.
32-2
637.
0563
7.05
637.
13.0
8
3192
732
,614
252.
9124
5.12
1,32
7.25
1,30
7.54
-12.
022.
062
637.
2863
7.28
637.
35.0
7
O32
253
32,9
6983
1.60
687.
272,
458.
822,
256.
38-8
1.09
1.19
963
7.76
637.
7663
7.84
.08
3314
333
,907
1,21
0.34
1,09
0.56
3,32
0.73
3,18
1.69
-40.
810.
844
638.
3563
8.35
638.
44.0
9
3437
935
,075
661.
9350
7.39
1,63
1.46
1,49
4.59
-81.
651.
809
639.
6663
9.66
639.
74.0
8
P34
650
36,3
7865
4.25
514.
251,
995.
641,
807.
78-9
1.35
1.50
1064
1.54
641.
5464
1.62
.08
3560
337
,425
710.
5956
1.56
2,19
8.26
2,01
6.61
-81.
231.
349
642.
6064
2.60
642.
70.1
0
3748
438
,285
641.
3345
3.96
2,11
4.65
1,92
0.93
-91.
281.
4110
643.
1064
3.10
643.
20.1
0
3760
238
,404
93.3
293
.00
591.
4660
0.47
24.
574.
50-2
643.
1564
3.15
643.
25.1
0
3764
638
,454
90.7
190
.50
597.
8960
5.94
14.
524.
46-1
643.
6364
3.63
643.
72.0
9
3779
338
,610
598.
7546
0.04
2,48
2.89
2,25
9.83
-91.
091.
2010
644.
0764
4.07
644.
15.0
8
Q37
896
38,6
9950
4.74
360.
751,
630.
891,
485.
41-9
1.66
1.82
1064
4.10
644.
1064
4.18
.08
3870
039
,613
683.
6855
5.12
2,58
9.19
2,36
3.36
-91.
041.
1410
644.
9564
4.95
645.
02.0
7
3949
340
,406
1,13
0.73
953.
943,
601.
243,
315.
51-8
0.75
0.82
964
5.30
645.
3064
5.39
.09
R40
145
41,1
181,
571.
811,
192.
794,
231.
253,
840.
04-9
0.64
0.70
964
5.54
645.
5464
5.64
.10
4092
241
,895
994.
0678
7.47
2,90
9.72
2,72
7.99
-60.
930.
996
645.
8364
5.83
645.
93.1
0

22 Hydrologic, Hydraulic, and Flood Analyses of the Blackberry Creek Watershed, Kendall County, IllinoisTa
ble
10.
Hydr
aulic
cha
ract
eris
tics
corr
espo
ndin
g to
100
-yea
r flo
od e
leva
tion
and
flood
way
enc
roac
hmen
t for
the
Blac
kber
ry C
reek
wat
ersh
ed, K
enda
ll Co
unty
, Ill
inoi
s.—
Cont
inue
d
[All
elev
atio
ns g
iven
are
in N
AV
D88
. ft,
feet
; ft2 ,
squa
re f
oot;
ft/s
, fee
t per
sec
ond]
Cros
s se
c-tio
n la
bel
(app
endi
x B
)
Cros
s
sect
ion
nu
mbe
r
To
p w
idth
(ft)
Cros
s se
ctio
n ar
ea (f
t2 )M
ean
velo
city
(ft/s
)B
ase
flood
wat
er-s
urfa
ce e
leva
tion
(ft)
Dis
tanc
e
(ft)
With
out
flood
way
With
flo
odw
ayW
ithou
t flo
odw
ayW
ith
flood
way
Perc
ent
chan
geW
ithou
t flo
odw
ayW
ith
flood
way
Perc
ent
chan
geRe
gula
tory
W
ithou
t flo
odw
ayW
ith
flood
way
Chan
ge
4216
042
,652
731.
4455
1.25
2,22
1.49
2,04
2.22
-81.
221.
328
646.
2964
6.29
646.
380.
09
4233
042
,934
68.6
268
.62
441.
3444
5.88
16.
136.
06-1
646.
9364
6.93
647.
00.0
7
4239
342
,997
68.6
468
.62
483.
5648
6.69
15.
595.
56-1
647.
5564
7.55
647.
60.0
5
S42
604
43,2
371,
001.
3983
0.19
4,20
5.14
3,91
2.81
-70.
640.
698
648.
1764
8.17
648.
22.0
5
4305
643
,689
1,17
5.02
937.
704,
500.
994,
103.
52-9
0.60
0.66
1064
8.28
648.
2864
8.32
.04
4403
544
,668
860.
5062
2.88
2,71
1.00
2,48
2.75
-81.
001.
099
648.
6064
8.60
648.
64.0
4
4464
245
,302
772.
9061
3.24
2,30
9.18
2,08
8.00
-10
1.17
1.30
1064
8.95
648.
9564
8.98
.03
T45
561
46,2
211,
035.
9384
8.34
3,02
2.75
2,78
2.50
-80.
890.
979
649.
4764
9.47
649.
53.0
6
4587
346
,725
1,33
6.30
819.
502,
373.
072,
157.
97-9
1.14
1.25
1064
9.75
649.
7564
9.80
.05
4605
846
,907
1,15
0.76
486.
481,
413.
471,
301.
52-8
1.91
2.08
964
9.95
649.
9564
9.98
.03
4609
746
,947
1,31
4.45
589.
1468
7.06
690.
200
3.94
3.92
-165
0.03
650.
0365
0.06
.03
4615
447
,012
948.
5352
5.81
1,99
3.17
1,79
8.00
-10
1.36
1.50
1065
0.33
650.
3365
0.36
.03
4637
747
,228
1,02
6.77
609.
612,
189.
612,
039.
04-7
1.23
1.33
865
0.49
650.
4965
0.52
.03
4742
248
,091
872.
2962
1.09
2,37
5.58
2,16
6.74
-91.
141.
2510
651.
1465
1.14
651.
15.0
1
4795
948
,843
900.
9058
2.44
2,54
3.80
2,32
1.88
-91.
061.
169
651.
7965
1.79
651.
79.0
0
U48
534
49,3
7297
5.74
872.
003,
407.
723,
123.
15-8
0.79
0.87
1065
2.07
652.
0765
2.10
.03
4923
050
,068
1,17
7.28
925.
743,
818.
363,
449.
83-1
00.
710.
7810
652.
2965
2.29
652.
34.0
5
5100
650
,602
1,36
6.49
1,15
2.85
4,00
7.97
3,67
7.21
-80.
670.
7410
652.
4965
2.49
652.
54.0
5
5218
153
,093
990.
4077
6.97
2,89
7.42
2,68
1.58
-70.
931.
019
654.
0165
4.01
654.
09.0
8
V54
165
55,0
231,
026.
6395
3.01
4,18
3.34
4,01
9.51
-40.
650.
673
654.
8765
4.87
654.
97.1
0
5524
156
,077
770.
4953
5.24
2,56
6.59
2,33
9.28
-91.
051.
1610
655.
4465
5.44
655.
51.0
7
5570
056
,534
622.
3750
3.30
2,30
0.27
2,08
8.36
-91.
181.
299
655.
7965
5.79
655.
84.0
5
5580
056
,629
154.
6012
9.46
848.
9380
3.87
-53.
193.
365
655.
8265
5.82
655.
87.0
5
5586
056
,689
159.
7013
9.59
917.
5188
2.01
-42.
953.
074
656.
0065
6.00
656.
06.0
6
5588
056
,721
907.
2875
6.41
3,07
4.42
2,78
0.84
-10
0.88
0.97
1065
6.16
656.
1665
6.22
.06

Summary 23Ta
ble
10.
Hydr
aulic
cha
ract
eris
tics
corr
espo
ndin
g to
100
-yea
r flo
od e
leva
tion
and
flood
way
enc
roac
hmen
t for
the
Blac
kber
ry C
reek
wat
ersh
ed, K
enda
ll Co
unty
, Ill
inoi
s.—
Cont
inue
d
[All
elev
atio
ns g
iven
are
in N
AV
D88
. ft,
feet
; ft2 ,
squa
re f
oot;
ft/s
, fee
t per
sec
ond]
Cros
s se
c-tio
n la
bel
(app
endi
x B
)
Cros
s
sect
ion
nu
mbe
r
To
p w
idth
(ft)
Cros
s se
ctio
n ar
ea (f
t2 )M
ean
velo
city
(ft/s
)B
ase
flood
wat
er-s
urfa
ce e
leva
tion
(ft)
Dis
tanc
e
(ft)
With
out
flood
way
With
flo
odw
ayW
ithou
t flo
odw
ayW
ith
flood
way
Perc
ent
chan
geW
ithou
t flo
odw
ayW
ith
flood
way
Perc
ent
chan
geRe
gula
tory
W
ithou
t flo
odw
ayW
ith
flood
way
Chan
ge
W55
980
56,8
241,
034.
8288
7.83
4,05
4.93
3,70
5.49
-90.
670.
739
656.
2165
6.21
656.
270.
06
5676
057
,604
602.
8645
0.40
2,27
0.21
2,06
7.11
-91.
191.
3110
656.
4965
6.49
656.
57.0
8
5762
558
,428
1,22
8.11
1,24
7.00
3,62
6.21
3,73
5.84
30.
750.
72-4
656.
8265
6.82
656.
90.0
8
X58
600
59,6
2963
8.86
522.
272,
462.
742,
352.
15-4
1.10
1.15
565
7.35
657.
3565
7.44
.09
5957
560
,405
896.
6471
9.48
3,91
1.05
3,62
6.31
-70.
690.
759
657.
6965
7.69
657.
78.0
9
6099
861
,760
707.
8851
8.33
2,71
5.08
2,46
8.87
-91.
001.
1010
658.
2065
8.20
658.
27.0
7
Y62
421
63,2
4756
8.55
416.
542,
237.
722,
056.
21-8
1.21
1.32
965
9.23
659.
2365
9.25
.02
6256
363
,392
630.
2546
0.58
2,62
4.21
2,41
9.91
-81.
031.
129
659.
3465
9.34
659.
36.0
2
Z62
638
63,4
6764
0.42
461.
172,
461.
732,
271.
41-8
1.09
1.19
965
9.37
659.
3765
9.39
.02

Summary 2524 Hydrologic, Hydraulic, and Flood Analyses of the Blackberry Creek Watershed, Kendall County, Illinois
Figu
re 1
0.
100-
and
500
-yea
r flo
od p
lain
s an
d 10
0-ye
ar fl
oodw
ay fo
r Bla
ckbe
rry
Cree
k w
ater
shed
in K
enda
ll Co
unty
, Illi
nois
.

26 Hydrologic, Hydraulic, and Flood Analyses of the Blackberry Creek Watershed, Kendall County, Illinois
Results indicate that simulated flow volumes, peak discharges, and flow hydrographs are generally in good agreement with the observed data. The capability of the hydrologic model to simulate an extreme flood was verified with the July 17–18, 1996, flood event.
Flood-frequency analysis was applied to an annual maximum series to determine flood quantiles in subbasins for flood-hazard analysis. The simulated annual maximum series was determined from the long-term streamflow series (water years 1950–2003) continuously simulated with the HSPF model. Simulated flood quantiles were compared to observed flood quantiles at the USGS streamflow-gaging station near Yorkville. The simulated flood quantiles at locations inside the watershed other than the Yorkville streamflow-gaging station were compared to those determined in a US Depart-ment of Agriculture (1989) study and using the USGS regional flood-frequency equations. These comparisons confirmed that the flood quantiles estimated as part of the present study are reasonable. The 100- and 500-year flood discharges were then used in the hydraulic model.
The HEC-RAS hydraulic model was used to determine the 100- and 500-year flood elevations throughout Blackberry Creek watershed. Encroachment analysis also was performed using HEC-RAS to determine the floodway. The model was calibrated and verified using two crest-stage gages and the U.S. Geological Survey Yorkville streamflow-gaging sta-tion. The average difference in observed and simulated flood elevations for the eight readings was 0.38 ft with a standard deviation of 0.24 ft. Using geographic information system techniques, the flood elevations from the hydraulic model were digitally mapped for the 100- and 500-year flood plains and the 100-year floodway.
Results indicate that the 100-year and 500-year flood plains cover approximately 3,699 and 3,762 acres of land, respectively. Based on the 2003 land-cover data, most of the land in the flood plains was cropland and residential land. Although many acres of residential land were included in the flood plain, this land mostly was residential lawns with 25 homes within the 100-year flood plain, and 41 homes within the 500-year flood plain in the 2003 aerial photograph.
Acknowledgments
Joe Wyrot, City Engineer, and Anton Graf, former City Administrator, of the United City of Yorkville, Jeff Wilkins, Kendall County Administrator, and Anne Marie Gaura, Montgomery Village Manager, supported the format of this watershed study and use of advanced methodologies. They also assisted in data acquisition and facilitated communi-cations with municipalities and interested groups. Illinois Department of Natural Resources-Office of Water Resources provided surveying assistance including establishing control points and surveying channel cross sections. Stephen West-enbrook, USGS-Wisconsin Water Science Center and Chad
Menke, USGS-Indiana Water Science Center completed technical reviews of the report.
References
Bicknell, B.R., Imhoff, J.C., Kittle, J.L., Jr., Jobes, T.H., and Donigian, A.S., Jr., 2000, Hydrological simulation program–FORTRAN (HSPF): User’s manual for release 12: U.S. Environmental Protection Agency Research Labora-tory, Athens, Ga., variously paginated.
Blackberry Creek Watershed Resources Planning Commit-tee, 1999, Blackberry Creek watershed management plan, Volume 1: Management Plan: Blackberry Creek Watershed Resource Planning Committee c/o Kane-DuPage Soil and Water Conservation District, 88 p., plus appendixes.
Chow, V.T., Maidment, D.R., Mays, L.W., 1988, Applied hydrology, McGraw-Hill, Inc., New York, New York, 572 p.
Donigian, A.S., and Davis, H.H., 1978, User’s manual for agricultural runoff management (ARM) model: U.S. Envi-ronmental Protection Agency, EPA–600/3–78–080.
Duncker, J.J., and Melching, C.S., 1998, Regional rainfall-runoff relations for simulation of streamflow for watersheds in Du Page County, Illinois: U.S. Geological Survey Water-Resources Investigations Report 98–4035, 80 p.
Federal Emergency Management Agency, 1996, Flood insur-ance study, Kane County, Illinois (unincorporated areas): community number 170896, variously paginated.
Federal Emergency Management Agency, 2002, Flood insur-ance study, Kendall County, Illinois (unincorporated areas): community number 170896, revised June 4, 1996, Federal Emergency Management Agency, variously paginated.
Federal Emergency Management Agency, 2003, Guidelines and specification for flood map production coordination contractors: Washington, D.C., variously paginated.
Federal Emergency Management Agency, 2007, Hydro-logic models meeting the minimum requirement of NFIP: accessed June 2007 at URL http://www.fema.gov/plan/pre-vent/fhm/en_hydro.shtm.
Hershfield, D.M., 1961, Rainfall frequency atlas of the United States: U.S. Weather Bureau Technical Paper 40, 115 p.
Illinois Department of Natural Resources, 2002, Floodplain Management Resource Guide for Illinois Communities, Section 3708.60 Delineation of the Regulatory Floodway: accessed June 2007 at URL http://dnr.state.il.us/owr/resman/Downloads/resource_guide_for_IL.pdf.
LaTour, J.K., Weldon, E.A., Dupré, D.H., and Halfar, T.M., 2006, Water Resources Data-Illinois, Water Year 2005: U.S.

References 27
Geological Survey Water-Data Report IL–04, CD-ROM and accessed June 17, 2006, at URL http://il.water.usgs.gov/annual_report/start.html.
Lamoreux, W.W., 1962, Modern evaporation formulae adapted to computer use: Monthly Weather Review, v. 90, p. 26–28.
Leighton, M.M., Ekblaw, G.E., and Horberg, L., 1948, Phys-iographic divisions of Illinois: State Geological Survey, Department of Registration and Education, Reprinted from the Journal of Geology, v. 56, no. 1, 33 p.
Luman, D., Joselyn, M., and Suloway, L., 1996, Criti-cal Trends Assessment Land Cover Database of Illinois, 1991–1995: Illinois Department of Natural Resources, Champaign, Illinois, 157 p.
Maidment, D.R., 2002, ArcHydro: GIS for Water Resources: ESRI, Redlands, California, 220 p.
Murphy, E.A., 2005, Comparison of potential evapotrans-piration calculated by the LXPET (Lamoureux Potential Evaporation) program and by the WDMUtil (Watershed Data Management Utility) program: U.S. Geological Survey Open-File Report 2005–1020, 20 p.
Singh, V.P., 1995, (ed.) Computer models of watershed hydrol-ogy: Water Resources Publications, Highlands Ranch, Colorado, 1,130 p.
Soong, D.T., Ishii, A.L., Sharpe, J.B., and Avery, C.F., 2004, Estimating flood-peak discharge magnitudes and frequen-cies for rural streams in Illinois: U.S. Geological Survey Scientific Investigation Report 2004–5103, 147 p.
Soong, D.T., Straub,T.D., and Murphy, E.A., 2005, Continuous hydrologic simulation and flood-frequency, hydraulic, and flood-hazard analysis of the Blackberry Creek Watershed, Kane County, Illinois: U.S. Geological Survey Scientific Investigations Report 2005–5270, 66 p.
Thomas, W.O. Jr., Lumb, A.M., Flynn, K.M., and Kirby, W.H., 1998, Users manual for program PEAKFQ, annual flood-frequency analysis using Bulletin 17B guidelines: 89 p., accessed March 13, 2001, at URL http://water.usgs.gov/software/peakfq.html.
U.S. Army Corps of Engineers, 1997, CORPSCON, Version 5.x, Technical Documentation and Operating Instructions: Topographic Engineering Center, U.S. Army Corps of Engi-neers, Alexandria, Virginia, 20 p.
U.S. Army Corps of Engineers, 2002, HEC-RAS River Analy-sis System, Hydraulic Reference Manual—Version 3.1.: Hydrologic Engineering Center, U.S. Army Corps of Engi-neers, Davis, California, various chapters plus appendixes.
U.S. Department of Agriculture, Natural Resources Conserva-tion Service, 1994, State soil geographic (STATSGO) data base—data use information: miscellaneous publication number 1492 (rev. ed.): Fort Worth, Texas, National Soil Survey Center, variously paginated.
U.S. Department of Agriculture, Natural Resources Conser-vation Service, 1995, Soil Survey Geographic database: accessed June 2007 at URL http://www.ncgc.nrcs.usda.gov/products/datasets/ssurgo/.
U.S. Department of Agriculture, Soil Conservation Service, 1976, Technical Release 61, WSP2 Computer Program, U.S. Department of Agriculture.
U.S. Department of Agriculture, Soil Conservation Service, 1989, Floodplain management study, Blackberry Creek and Tributaries: Kane-Kendall Counties, Illinois: 24 p., plus appendixes.
U.S. Department of Agriculture, Soil Conservation Service, 1992, TR-20 Computer Program for Project Formulation Hydrology: accessed March 2003 at URL http://www.wcc.nrcs.usda.gov/hydro/hydro-tools-models-tr20.html.
U.S. Department of Agriculture, Soil Conservation Service, 1993, Computer Program for Water Surface Profiles: accessed March 2003 at URL http://www.wcc.nrcs.usda.gov/hydro/hydro-tools-models.html.
U.S. Department of Commerce, National Oceanic and Atmo-spheric Administration, 2001, Climatological data annual summary, Illinois: Asheville, N.C., Environmental Data Information Service, published annually.
U.S. Environmental Protection Agency, 2000, BASINS Tech-nical Note 6: Estimating Hydrology and Hydraulic param-eters for HSPF: Office of Water 4305, EPA–823–R–00–012, 32 p.
U.S. Interagency Advisory Committee on Water Data, 1982, Guidelines for determining flood flow frequency, Bulletin 17–B of the Hydrology Subcommittee: Reston, Virginia, U.S. Geological Survey, Office of Water Data Coordination, 183 p.

28 Hydrologic, Hydraulic, and Flood Analyses of the Blackberry Creek Watershed, Kendall County, Illinois
The 2003 DEM, with a 10-ft by 10-ft grid cov ering the Kendall County part of the Blackberry Creek watershed, was checked for elevation accuracy using a set of benchmarks. The check resulted in a vertical root-mean-square error (RMSE
z)
of 0.6 ft, with a mean of 0.0 ft and skew of -0.04 ft (error is defined as benchmark elevation minus DEM elevation) for 37 points selected by The Sidwell Company (Gary Lobdell, The Sidwell Company, written commun., 2006). According to the Guidelines and Specifications for Flood Hazard Mapping Part-ners (Federal Emergency Management Agency, 2003), a DEM used for a 2-ft contour interval map should have an RMSE
z
of 0.6 ft, which is equivalent to a vertical accuracy of 1.2 ft at the 95-percent confidence level when errors follow a normal distribution. Vertical accuracy is defined as “the linear uncer-tainty value, such that the true or theoretical location of the point falls within ± of that linear uncertainty value 95-percent of the time.” (Federal Emergency Management Agency, 2003). The RMSE
z of the 2003 DEM met these criteria, so the DEM
was used for model analysis.
Appendix A. Digital Elevation Model Accuracy Statement

Appendix B. Flood Profiles 29
Appendix B. Flood Profiles
Note: To convert from recurrence interval to annual chance, the percent exceedance probability percentage is divided by 100 to obtain a fraction and then the inverse of that fraction is calculated. For example, an annual chance of 50 percent corresponds to a recurrence interval of 2 years (50/100 = 0.5; 1/0.5 = 2).

Appendix B. Flood Profiles 3130 Hydrologic, Hydraulic, and Flood Analyses of the Blackberry Creek Watershed, Kendall County, Illinois
555
560
565 565
570 570
575 575
580 580
585 585
590 590
595 595
600 600
0 500 1000 1500 2000 2500 3000 3500 4000 4500 5000 5500 6000 6500
ELEV
ATIO
N IN
FEE
T (N
AVD
88)
STREAM DISTANCE IN FEET
FEDE
RAL
EME R
GENC
Y M
A NAG
EMEN
T AG
ENC Y
KEN D
ALL
COU N
TY, I
LF L
OOD
PRO F
ILES
B LAC
KBER
RY C
REE K
01P
A B C
D
Brid
ge o
n Ri
ver R
oad
York
ville
Dam
C onf
luen
ce w
ith F
ox R
iver
LEGEND0.2% ANNUAL CHANCE FLOOD
1% ANNUAL CHANCE FLOOD
2% ANNUAL CHANCE FLOOD
10% ANNUAL CHANCE FLOOD
STREAM BED
CROSS SECTION LOCATION

Appendix B. Flood Profiles 3332 Hydrologic, Hydraulic, and Flood Analyses of the Blackberry Creek Watershed, Kendall County, Illinois
580
585
590 590
595 595
600 600
605 605
610 610
615 615
620 620
625 625
6500 7000 7500 8000 8500 9000 9500 10000 10500 11000 11500 12000 12500 13000
ELEV
ATIO
N IN
FEE
T (N
AVD
88)
STREAM DISTANCE IN FEET
FEDE
RAL
EME R
GENC
Y M
A NAG
EMEN
T AG
ENC Y
KEN D
ALL
COU N
TY, I
LF L
OOD
PRO F
ILES
B LAC
KBER
RY C
REE K
02P
E F G
H
Brid
g e o
n Ro
u te
34
LEGEND0.2% ANNUAL CHANCE FLOOD
1% ANNUAL CHANCE FLOOD
2% ANNUAL CHANCE FLOOD
10% ANNUAL CHANCE FLOOD
STREAM BED
CROSS SECTION LOCATION

Appendix B. Flood Profiles 3534 Hydrologic, Hydraulic, and Flood Analyses of the Blackberry Creek Watershed, Kendall County, Illinois
595
600
605 605
610 610
615 615
620 620
625 625
630 630
635 635
640 640
13000 13500 14000 14500 15000 15500 16000 16500 17000 17500 18000 18500 19000 19500
ELEV
ATIO
N IN
FEE
T (N
AVD
88)
STREAM DISTANCE IN FEET
FEDE
RAL
EME R
GENC
Y M
A NAG
EMEN
T AG
ENC Y
KEN D
ALL
COU N
TY, I
LF L
OOD
PRO F
ILES
B LAC
KBER
RY C
REE K
03P
I J
K
Brid
g e o
n Ro
u te
47
LEGEND0.2% ANNUAL CHANCE FLOOD
1% ANNUAL CHANCE FLOOD
2% ANNUAL CHANCE FLOOD
10% ANNUAL CHANCE FLOOD
STREAM BED
CROSS SECTION LOCATION

Appendix B. Flood Profiles 3736 Hydrologic, Hydraulic, and Flood Analyses of the Blackberry Creek Watershed, Kendall County, Illinois
605
610
615 615
620 620
625 625
630 630
635 635
640 640
645 645
650 650
19500 20000 20500 21000 21500 22000 22500 23000 23500 24000 24500 25000 25500 26000
ELEV
ATIO
N IN
FEE
T (N
AVD
88)
STREAM DISTANCE IN FEET
FEDE
RAL
EME R
GENC
Y M
A NAG
EMEN
T AG
ENC Y
KEN D
ALL
COU N
TY, I
LF L
OOD
PRO F
ILES
B LAC
KBER
RY C
REE K
04P
L
M
LEGEND0.2% ANNUAL CHANCE FLOOD
1% ANNUAL CHANCE FLOOD
2% ANNUAL CHANCE FLOOD
10% ANNUAL CHANCE FLOOD
STREAM BED
CROSS SECTION LOCATION

Appendix B. Flood Profiles 3938 Hydrologic, Hydraulic, and Flood Analyses of the Blackberry Creek Watershed, Kendall County, Illinois
610
615
620 620
625 625
630 630
635 635
640 640
645 645
650 650
655 655
26000 26500 27000 27500 28000 28500 29000 29500 30000 30500 31000 31500 32000 32500
ELEV
ATIO
N IN
FEE
T (N
AVD
88)
STREAM DISTANCE IN FEET
FEDE
RAL
EME R
GENC
Y M
A NAG
EMEN
T AG
ENC Y
KEN D
ALL
COU N
TY, I
LF L
OOD
PRO F
ILES
B LAC
KBER
RY C
REE K
05P
N
Brid
ge o
n Br
istol
Rig
de R
oad
LEGEND0.2% ANNUAL CHANCE FLOOD
1% ANNUAL CHANCE FLOOD
2% ANNUAL CHANCE FLOOD
10% ANNUAL CHANCE FLOOD
STREAM BED
CROSS SECTION LOCATION

Appendix B. Flood Profiles 4140 Hydrologic, Hydraulic, and Flood Analyses of the Blackberry Creek Watershed, Kendall County, Illinois
615
620
625 625
630 630
635 635
640 640
645 645
650 650
655 655
660 660
32500 33000 33500 34000 34500 35000 35500 36000 36500 37000 37500 38000 38500 39000
ELEV
ATIO
N IN
FEE
T (N
AVD
88)
STREAM DISTANCE IN FEET
FEDE
RAL
EME R
GENC
Y M
A NAG
EMEN
T AG
ENC Y
KEN D
ALL
COU N
TY, I
LF L
OOD
PRO F
ILES
B LAC
KBER
RY C
REE K
06P
O P
Q
Brid
ge o
n Pl
anco
rp R
ail R
oad
LEGEND0.2% ANNUAL CHANCE FLOOD
1% ANNUAL CHANCE FLOOD
2% ANNUAL CHANCE FLOOD
10% ANNUAL CHANCE FLOOD
STREAM BED
CROSS SECTION LOCATION

Appendix B. Flood Profiles 4342 Hydrologic, Hydraulic, and Flood Analyses of the Blackberry Creek Watershed, Kendall County, Illinois
625
630
635 635
640 640
645 645
650 650
655 655
660 660
665 665
670 670
39000 39500 40000 40500 41000 41500 42000 42500 43000 43500 44000 44500 45000 45500
ELEV
ATIO
N IN
FEE
T (N
AVD
88)
STREAM DISTANCE IN FEET
FEDE
RAL
EME R
GENC
Y M
A NAG
EMEN
T AG
ENC Y
KEN D
ALL
COU N
TY, I
LF L
OOD
PRO F
ILES
B LAC
KBER
RY C
REE K
07P
R SBr
idge
on
Galen
a Ro
ad
LEGEND0.2% ANNUAL CHANCE FLOOD
1% ANNUAL CHANCE FLOOD
2% ANNUAL CHANCE FLOOD
10% ANNUAL CHANCE FLOOD
STREAM BED
CROSS SECTION LOCATION

Appendix B. Flood Profiles 4544 Hydrologic, Hydraulic, and Flood Analyses of the Blackberry Creek Watershed, Kendall County, Illinois
630
635
640 640
645 645
650 650
655 655
660 660
665 665
670 670
675 675
45500 46000 46500 47000 47500 48000 48500 49000 49500 50000 50500 51000 51500 52000
ELEV
ATIO
N IN
FEE
T (N
AVD
88)
STREAM DISTANCE IN FEET
FEDE
RAL
EME R
GENC
Y M
A NAG
EMEN
T AG
ENC Y
KEN D
ALL
COU N
TY, I
LF L
OOD
PRO F
ILES
B LAC
KBER
RY C
REE K
08P
T U
Brid
ge o
n W
illow
b roo
k Ro
a d
LEGEND0.2% ANNUAL CHANCE FLOOD
1% ANNUAL CHANCE FLOOD
2% ANNUAL CHANCE FLOOD
10% ANNUAL CHANCE FLOOD
STREAM BED
CROSS SECTION LOCATION

Appendix B. Flood Profiles 4746 Hydrologic, Hydraulic, and Flood Analyses of the Blackberry Creek Watershed, Kendall County, Illinois
635
640
645 645
650 650
655 655
660 660
665 665
670 670
675 675
680 680
52000 52500 53000 53500 54000 54500 55000 55500 56000 56500 57000 57500 58000 58500
ELEV
ATIO
N IN
FEE
T (N
AVD
88)
STREAM DISTANCE IN FEET
FEDE
RAL
EME R
GENC
Y M
A NAG
EMEN
T AG
ENC Y
KEN D
ALL
COU N
TY, I
LF L
OOD
PRO F
ILES
B LAC
KBER
RY C
REE K
09P
V W
Brid
ge o
n Co
nco r
d Ro
ad
LEGEND0.2% ANNUAL CHANCE FLOOD
1% ANNUAL CHANCE FLOOD
2% ANNUAL CHANCE FLOOD
10% ANNUAL CHANCE FLOOD
STREAM BED
CROSS SECTION LOCATION

50 Hydrologic, Hydraulic, and Flood Analyses of the Blackberry Creek Watershed, Kendall County, Illinois
Prepared by: USGS Enterprise Publishing Network Rolla Publishing Service Center 1400 Independence Road Rolla, MO 65401For more information concerning this publication, contact: Director U.S. Geological Survey Illinois Water Science Center 1201 West University Avenue, Suite 100 Urbana, IL 61801–2347 (217) 344–0037Or visit the Illinois Water Science Center website at: http://il.water.usgs.gov


Murphy and others—
Hydrologic, H
ydraulic, and Flood Analyses of the B
lackberry Creek Watershed, Kendall County, Illinois—
SIR 2007–5141
Printed on recycled paper