Embed Size (px)
Citation preview
Hydrographic Survey of the
Keith Lake-Salt Bayou System
April 2007 Survey
Prepared by:
The Texas Water Development Board
December 2007
Texas Water Development Board
J. Kevin Ward, Executive Administrator
Texas Water Development Board
E. G. Rod Pittman, Chairman Jack Hunt, Vice Chairman William W. Meadows, Member Thomas Weir Labatt III, Member Dario Vidal Guerra, Jr., Member James Herring, Member
Prepared for:
Texas Parks and Wildlife Department
Authorization for use or reproduction of any original material contained in this publication, i.e. not obtained from other sources, is freely granted. The Board would appreciate acknowledgment.
This report was prepared by staff of the Surface Water Resources Division:
Dharhas Pothina
Jordan Furnans, Ph.D., P.E. Tony Connell
Published and Distributed by the Texas Water Development Board
P.O. Box 13231 Austin, TX 78711-3231

Executive Summary
In April of 2007, the Texas Water Development Board (TWDB) entered into
agreement with the Texas Parks and Wildlife Department for the purpose of collecting
bathymetric data within the Keith Lake-Salt Bayou system near Port Arthur, Texas. Data
were collected in support of hydrodynamic modeling of the system. Data collection was
performed on April 10th, 11th, and 12th of 2007 using a Knudsen 200 kHz echosounder
integrated with differentially corrected global positioning system (DGPS) navigation
equipment.
The survey data collected by TWDB was augmented by two other datasets. This
report provides descriptions of the data collection effort, the descriptions of the data
processing methods, and maps showing the bathymetry of the Keith Lake-Salt Bayou
system as implied by the data collected by TWDB and other entities.
Table of Contents Keith Lake-Salt Bayou System General Information......................................................1 Bathymetric Survey of the Keith Lake – Salt Bayou Area .............................................2
Introduction.......................................................................................................................2 Datum................................................................................................................................2 TWDB Bathymetric Data Collection & Processing .........................................................2
Generating Bathymetric Coverage for the Entire System ..............................................5 Description of Bathymetric Datasets ................................................................................5 Merging the Bathymetric Surveys ....................................................................................6 Data Interpolation Methods ..............................................................................................7
Bathymetric Maps & Data Distribution ...........................................................................7 References ............................................................................................................................9
List of Tables Table 1: Water surface elevation gauging stations in the Keith Lake Salt Bayou
System Table 2: Vertical Datum Corrections for Bathymetric Surveys
List of Figures Figure 1: Keith Lake-Salt Bayou System Location Map Figure 2: Map of data collected during TWDB 2007 Survey Figure 3: Comparative plot of water surface elevations within the Keith Lake-Salt
Bayou system Figure 4: Water surface elevations based on proximity to gauging stations Figure 5: Spatial extent of data used in the Keith Lake-Salt Bayou TIN models Figure 6: Elevation relief map Figure 7: 1-foot Contour Map
Appendices Appendix A: Description of Electronic Data Files Appendix B: Hydrodynamic Model Bathymetry
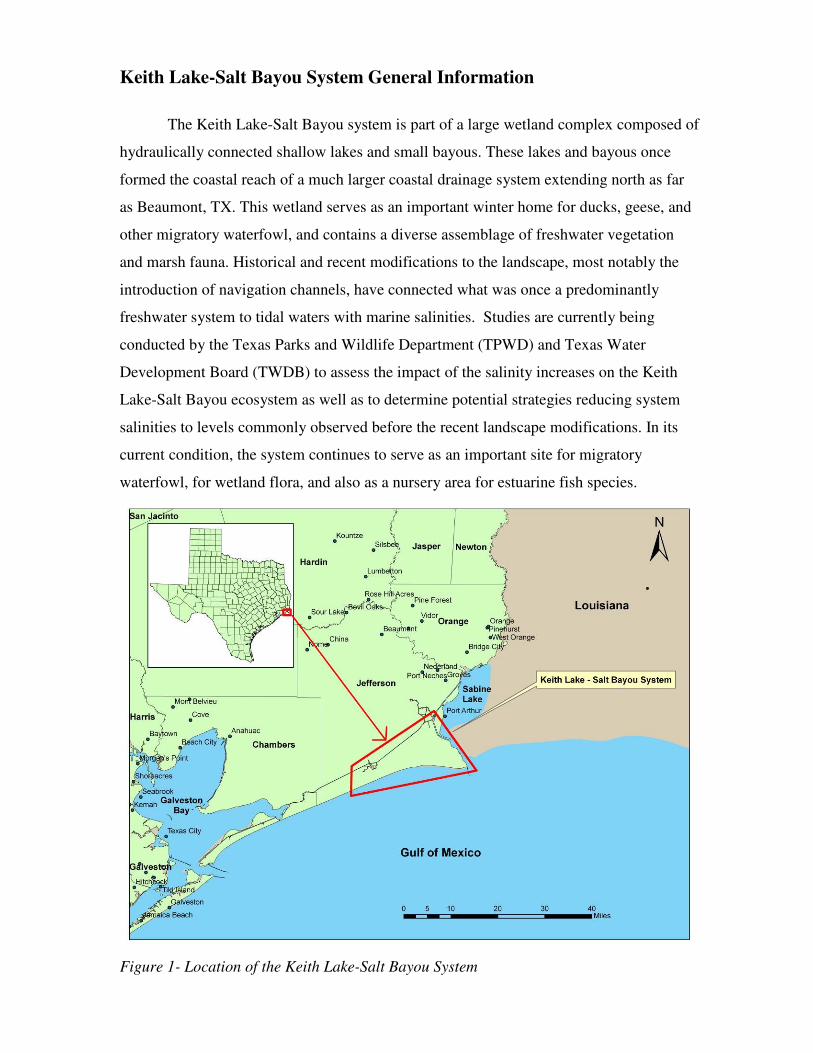
Keith Lake-Salt Bayou System General Information
The Keith Lake-Salt Bayou system is part of a large wetland complex composed of
hydraulically connected shallow lakes and small bayous. These lakes and bayous once
formed the coastal reach of a much larger coastal drainage system extending north as far
as Beaumont, TX. This wetland serves as an important winter home for ducks, geese, and
other migratory waterfowl, and contains a diverse assemblage of freshwater vegetation
and marsh fauna. Historical and recent modifications to the landscape, most notably the
introduction of navigation channels, have connected what was once a predominantly
freshwater system to tidal waters with marine salinities. Studies are currently being
conducted by the Texas Parks and Wildlife Department (TPWD) and Texas Water
Development Board (TWDB) to assess the impact of the salinity increases on the Keith
Lake-Salt Bayou ecosystem as well as to determine potential strategies reducing system
salinities to levels commonly observed before the recent landscape modifications. In its
current condition, the system continues to serve as an important site for migratory
waterfowl, for wetland flora, and also as a nursery area for estuarine fish species.
Figure 1- Location of the Keith Lake-Salt Bayou System
2
Bathymetric Survey of the Keith Lake-Salt Bayou Area
Introduction
In April of 2007, the Texas Water Development Board (TWDB) entered into
agreement with the Texas Parks and Wildlife Department for the purpose of collecting
bathymetric data within the Keith Lake-Salt Bayou system near Port Arthur, Texas. Data
were collected in support of a hydrodynamic and salinity transport modeling effort being
undertaken by TWDB. The data collection effort was not designed to determine water
volumes within the Keith Lake-Salt Bayou system or to aid in navigation. The data
collected by TWDB was augmented with other bathymetric datasets available for the
system in order to improve the bathymetric surface models representing the entire system.
In areas where no bathymetric data are available, TWDB made water-depth
approximations based on field observations and general knowledge of the system
characteristics.
Datum
All elevations reported throughout this report are referenced to the North
American Vertical Datum of 1988 (NAVD 88). The horizontal datum used for this report
is North American Datum of 1983 (NAD83) State Plane Texas South Central Zone (feet).
Unless otherwise noted, all elevations provided herein are referenced to the NAVD 88
datum.
TWDB Bathymetric Data Collection & Processing
Data collection was performed on April 10th, 11th, and 12th of 2007 using a
Knudsen 200 kHz echosounder integrated with differentially corrected global positioning
system (DGPS) navigation equipment. Where possible, data was collected to ensure
maximal coverage of the system. Data collection efforts were also focused in areas of
importance for the hydrodynamic model, as determined by TWDB. Within such areas, a
greater number of depth soundings were recorded. Where such focused data collection
was not possible, as in constricted channels or areas clogged with vegetation, limited data
were collected, allowing for only rough approximations of the local bathymetric surface to
be made. Data collection efforts were also located in areas previously surveyed by other
3
entities in order to appropriately couple bathymetries derived from each available dataset.
For all data collection efforts, the depth sounder was calibrated daily with a stadia rod.
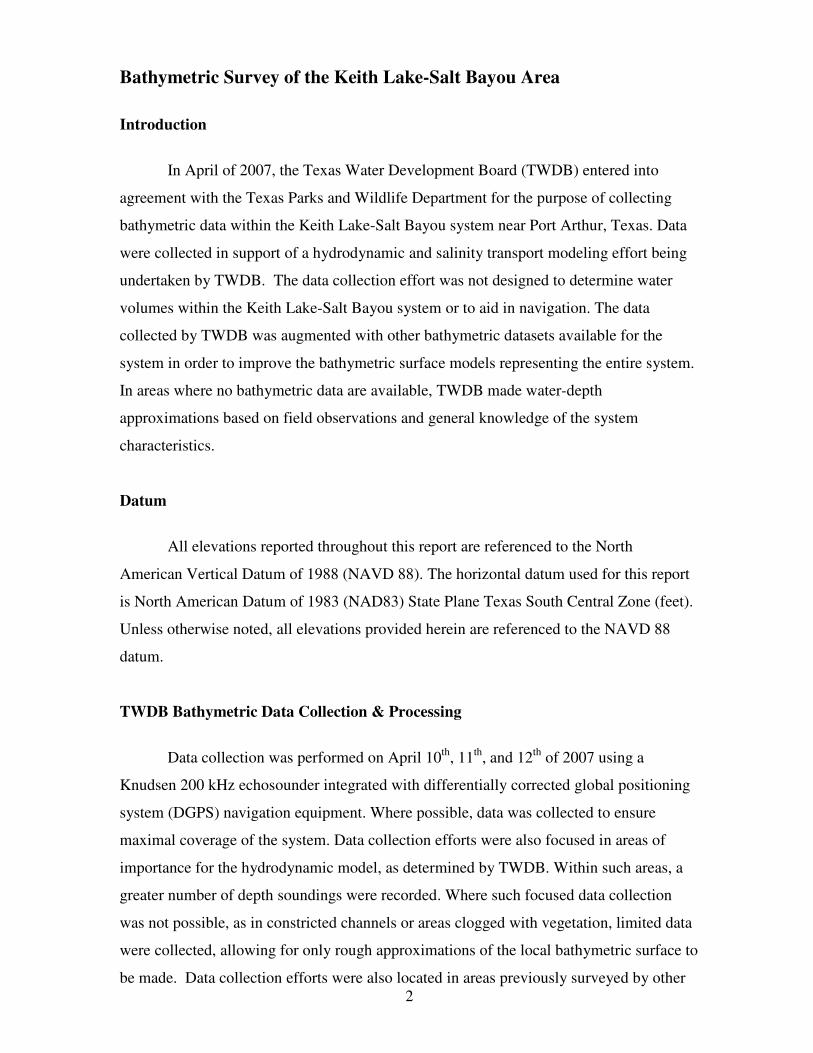
During the 2007 survey, team members collected 37,841 data points over boat tracks
totaling nearly 50 miles in length (Figure 2).
Figure 2 – TWDB data collection within the Keith Lake-Salt Bayou system
TWDB data was processed using the HydroEdit [1] software developed by
TWDB. This program applies a median filter to collected data in order to remove data
spikes and other invalid data points. The HydroEdit software is also used to convert the
water depth measurements to bathymetric elevations, by subtracting the depths from the
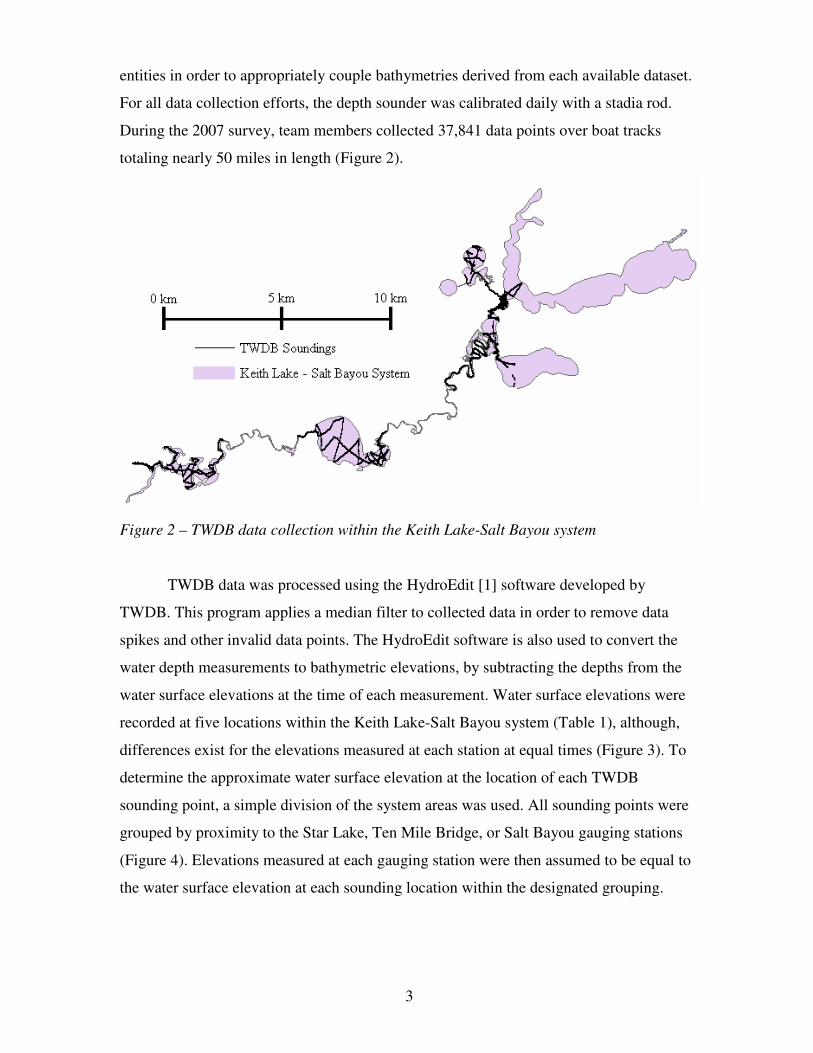
water surface elevations at the time of each measurement. Water surface elevations were
recorded at five locations within the Keith Lake-Salt Bayou system (Table 1), although,
differences exist for the elevations measured at each station at equal times (Figure 3). To
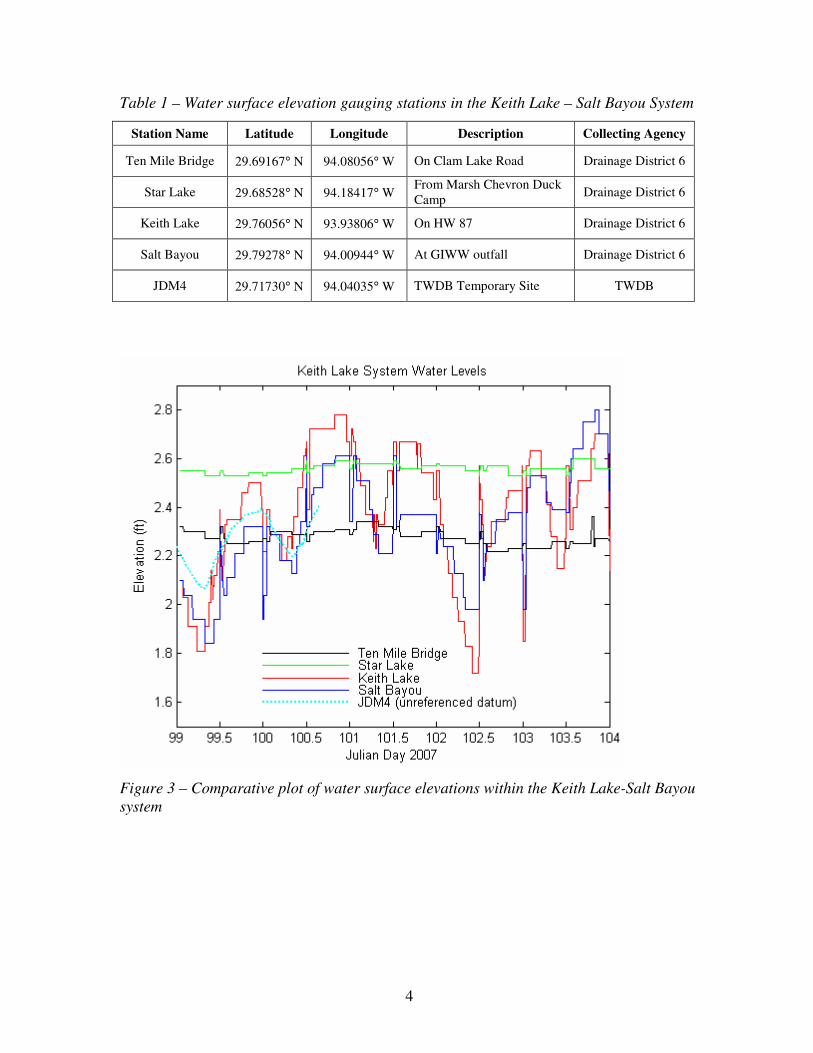
determine the approximate water surface elevation at the location of each TWDB
sounding point, a simple division of the system areas was used. All sounding points were
grouped by proximity to the Star Lake, Ten Mile Bridge, or Salt Bayou gauging stations
(Figure 4). Elevations measured at each gauging station were then assumed to be equal to
the water surface elevation at each sounding location within the designated grouping.
4
Table 1 – Water surface elevation gauging stations in the Keith Lake – Salt Bayou System
Station Name Latitude Longitude Description Collecting Agency
Ten Mile Bridge 29.69167° N 94.08056° W On Clam Lake Road Drainage District 6
Star Lake 29.68528° N 94.18417° W From Marsh Chevron Duck Camp Drainage District 6
Keith Lake 29.76056° N 93.93806° W On HW 87 Drainage District 6
Salt Bayou 29.79278° N 94.00944° W At GIWW outfall Drainage District 6
JDM4 29.71730° N 94.04035° W TWDB Temporary Site TWDB
Figure 3 – Comparative plot of water surface elevations within the Keith Lake-Salt Bayou system
5
Figure 4 – Assigning water surface elevations based on proximity to referenced gauging stations. TWDB soundings were divided into 3 groups and assigned water surface elevations as recorded at the gauge (red X) within each grouping.
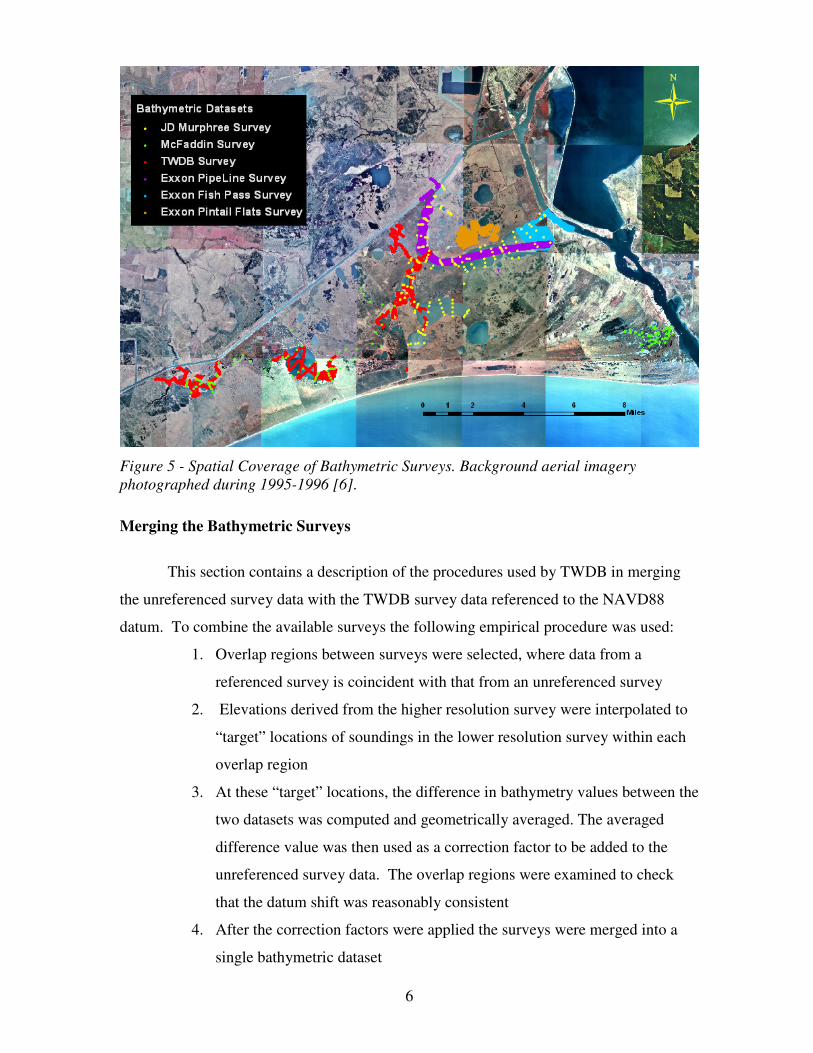
Generating Bathymetric Coverage for the Entire System Description of Bathymetric Datasets
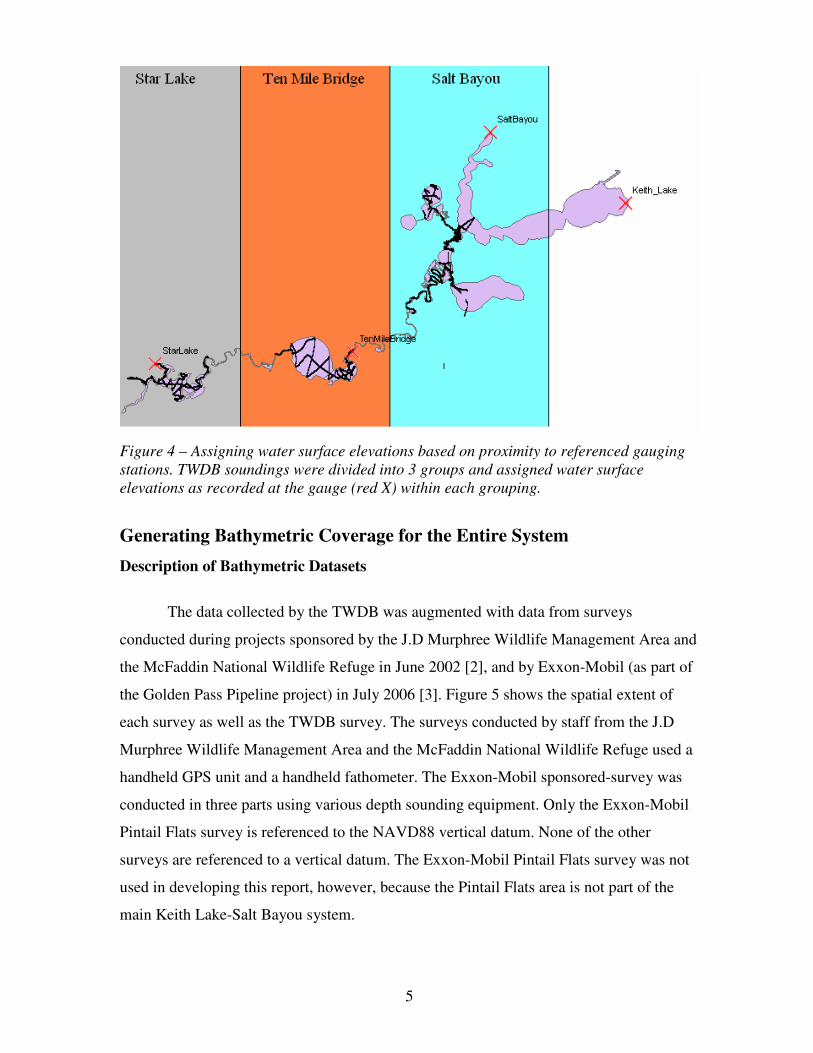
The data collected by the TWDB was augmented with data from surveys
conducted during projects sponsored by the J.D Murphree Wildlife Management Area and
the McFaddin National Wildlife Refuge in June 2002 [2], and by Exxon-Mobil (as part of
the Golden Pass Pipeline project) in July 2006 [3]. Figure 5 shows the spatial extent of
each survey as well as the TWDB survey. The surveys conducted by staff from the J.D
Murphree Wildlife Management Area and the McFaddin National Wildlife Refuge used a
handheld GPS unit and a handheld fathometer. The Exxon-Mobil sponsored-survey was
conducted in three parts using various depth sounding equipment. Only the Exxon-Mobil
Pintail Flats survey is referenced to the NAVD88 vertical datum. None of the other
surveys are referenced to a vertical datum. The Exxon-Mobil Pintail Flats survey was not
used in developing this report, however, because the Pintail Flats area is not part of the
main Keith Lake-Salt Bayou system.
6
Figure 5 - Spatial Coverage of Bathymetric Surveys. Background aerial imagery photographed during 1995-1996 [6].
Merging the Bathymetric Surveys
This section contains a description of the procedures used by TWDB in merging
the unreferenced survey data with the TWDB survey data referenced to the NAVD88
datum. To combine the available surveys the following empirical procedure was used:
1. Overlap regions between surveys were selected, where data from a
referenced survey is coincident with that from an unreferenced survey
2. Elevations derived from the higher resolution survey were interpolated to
“target” locations of soundings in the lower resolution survey within each
overlap region
3. At these “target” locations, the difference in bathymetry values between the
two datasets was computed and geometrically averaged. The averaged
difference value was then used as a correction factor to be added to the
unreferenced survey data. The overlap regions were examined to check
that the datum shift was reasonably consistent
4. After the correction factors were applied the surveys were merged into a
single bathymetric dataset
7
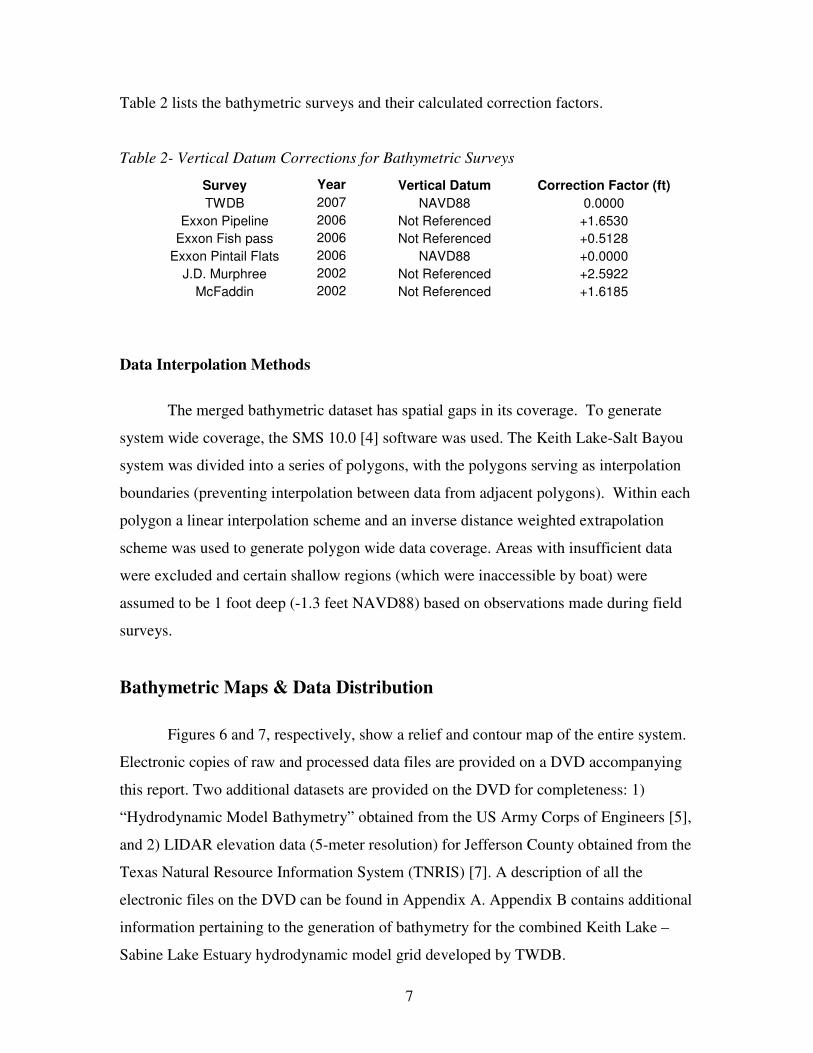
Table 2 lists the bathymetric surveys and their calculated correction factors.
Table 2- Vertical Datum Corrections for Bathymetric Surveys
Survey Year Vertical Datum Correction Factor (ft) TWDB 2007 NAVD88 0.0000
Exxon Pipeline 2006 Not Referenced +1.6530 Exxon Fish pass 2006 Not Referenced +0.5128
Exxon Pintail Flats 2006 NAVD88 +0.0000 J.D. Murphree 2002 Not Referenced +2.5922
McFaddin 2002 Not Referenced +1.6185
Data Interpolation Methods
The merged bathymetric dataset has spatial gaps in its coverage. To generate
system wide coverage, the SMS 10.0 [4] software was used. The Keith Lake-Salt Bayou
system was divided into a series of polygons, with the polygons serving as interpolation
boundaries (preventing interpolation between data from adjacent polygons). Within each
polygon a linear interpolation scheme and an inverse distance weighted extrapolation
scheme was used to generate polygon wide data coverage. Areas with insufficient data
were excluded and certain shallow regions (which were inaccessible by boat) were
assumed to be 1 foot deep (-1.3 feet NAVD88) based on observations made during field
surveys.
Bathymetric Maps & Data Distribution
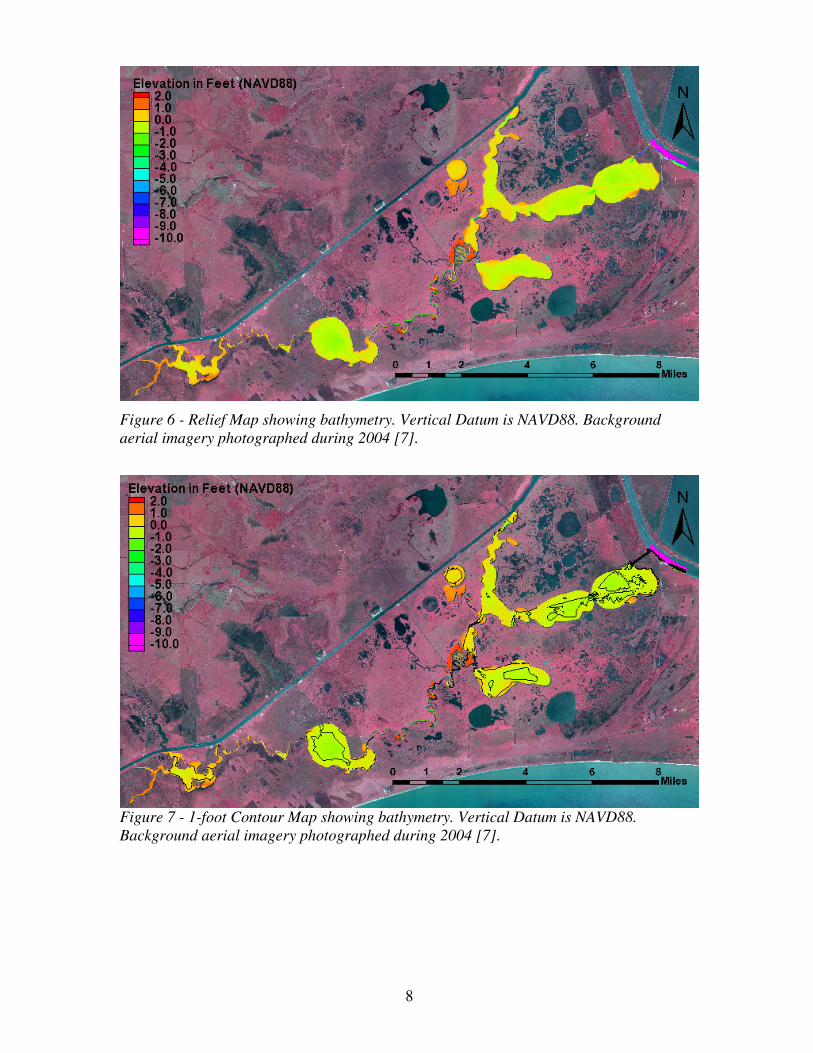
Figures 6 and 7, respectively, show a relief and contour map of the entire system.
Electronic copies of raw and processed data files are provided on a DVD accompanying
this report. Two additional datasets are provided on the DVD for completeness: 1)
“Hydrodynamic Model Bathymetry” obtained from the US Army Corps of Engineers [5],
and 2) LIDAR elevation data (5-meter resolution) for Jefferson County obtained from the
Texas Natural Resource Information System (TNRIS) [7]. A description of all the
electronic files on the DVD can be found in Appendix A. Appendix B contains additional
information pertaining to the generation of bathymetry for the combined Keith Lake –
Sabine Lake Estuary hydrodynamic model grid developed by TWDB.
8
Figure 6 - Relief Map showing bathymetry. Vertical Datum is NAVD88. Background aerial imagery photographed during 2004 [7].
Figure 7 - 1-foot Contour Map showing bathymetry. Vertical Datum is NAVD88. Background aerial imagery photographed during 2004 [7].

9
References
1. Furnans, Jordan. Texas Water Development Board. 2006. “HydroEdit User’s
Manual.”
2. Rezsutek, Michael. Texas Parks and Wildlife Department. Email communication
3/15/2005, [email protected]
3. Trimm, Bryan. Golden Pass LNG Terminal c/o ExxonMobil Development
Company. Email communication 2/21/2007, [email protected]
4. Environmental Modeling Systems Inc., 2008, “Surface Modeling System (SMS)
10.0 Users Manual”
5. Brown, Gary. Engineer Research and Development Center, US Army Corps of
Engineers. Email communication 11/2/2006, [email protected]
6. Texas Natural Resources Information System, Website
http://www.tnris.state.tx.us/, 12/10/2007.
7. U.S Department of Agriculture, Farm Service Agency, Aerial Photography Field
Office, National Agriculture Imagery Program,
http://www.apfo.usda.gov/NAIP.html, 12/10/2007.
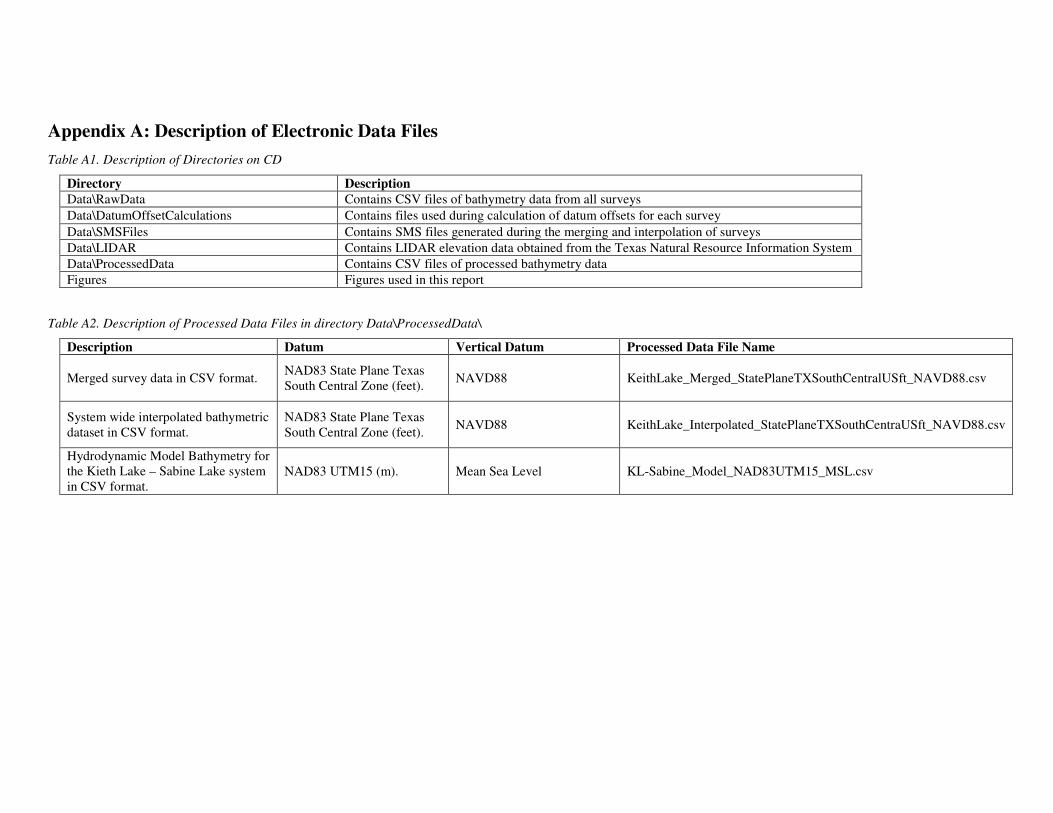
Appendix A: Description of Electronic Data Files Table A1. Description of Directories on CD
Directory Description Data\RawData Contains CSV files of bathymetry data from all surveys Data\DatumOffsetCalculations Contains files used during calculation of datum offsets for each survey Data\SMSFiles Contains SMS files generated during the merging and interpolation of surveys Data\LIDAR Contains LIDAR elevation data obtained from the Texas Natural Resource Information System Data\ProcessedData Contains CSV files of processed bathymetry data Figures Figures used in this report
Table A2. Description of Processed Data Files in directory Data\ProcessedData\
Description Datum Vertical Datum Processed Data File Name
Merged survey data in CSV format. NAD83 State Plane Texas South Central Zone (feet). NAVD88 KeithLake_Merged_StatePlaneTXSouthCentralUSft_NAVD88.csv
System wide interpolated bathymetric dataset in CSV format.
NAD83 State Plane Texas South Central Zone (feet). NAVD88 KeithLake_Interpolated_StatePlaneTXSouthCentraUSft_NAVD88.csv
Hydrodynamic Model Bathymetry for the Kieth Lake – Sabine Lake system in CSV format.
NAD83 UTM15 (m). Mean Sea Level KL-Sabine_Model_NAD83UTM15_MSL.csv
2
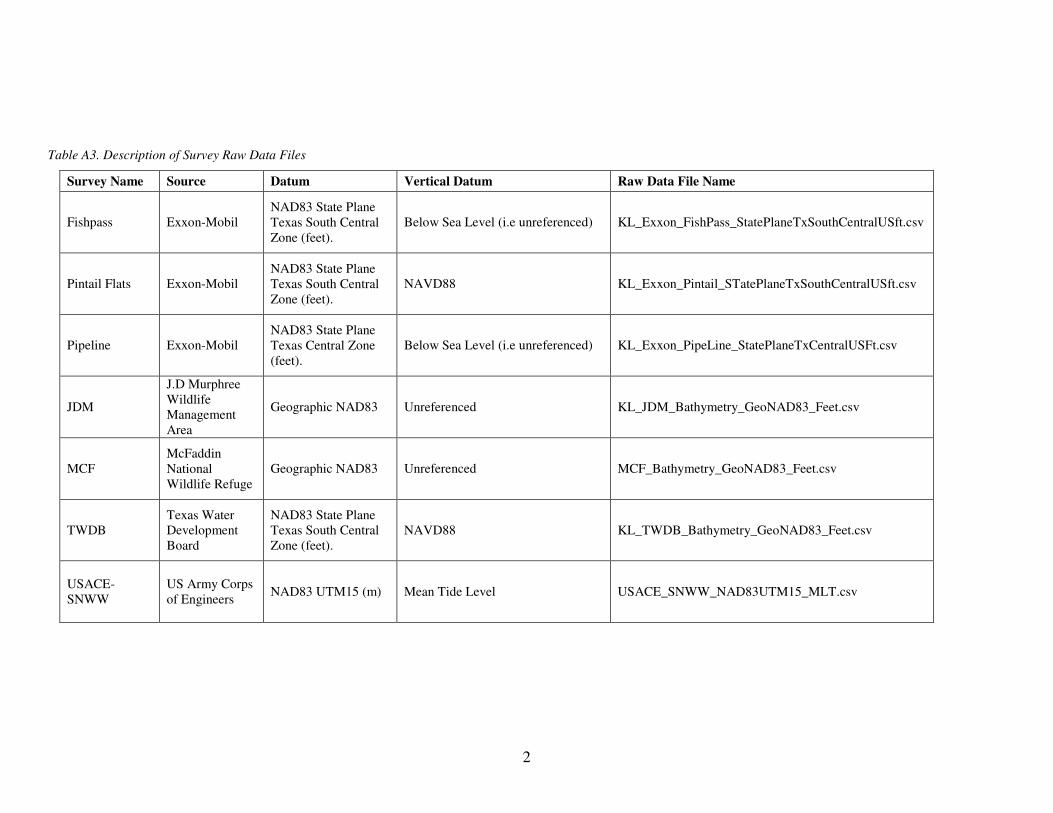
Table A3. Description of Survey Raw Data Files
Survey Name Source Datum Vertical Datum Raw Data File Name
Fishpass Exxon-Mobil NAD83 State Plane Texas South Central Zone (feet).
Below Sea Level (i.e unreferenced) KL_Exxon_FishPass_StatePlaneTxSouthCentralUSft.csv
Pintail Flats Exxon-Mobil NAD83 State Plane Texas South Central Zone (feet).
NAVD88 KL_Exxon_Pintail_STatePlaneTxSouthCentralUSft.csv
Pipeline Exxon-Mobil NAD83 State Plane Texas Central Zone (feet).
Below Sea Level (i.e unreferenced) KL_Exxon_PipeLine_StatePlaneTxCentralUSFt.csv
JDM
J.D Murphree Wildlife Management Area
Geographic NAD83 Unreferenced KL_JDM_Bathymetry_GeoNAD83_Feet.csv
MCF McFaddin National Wildlife Refuge
Geographic NAD83 Unreferenced MCF_Bathymetry_GeoNAD83_Feet.csv
TWDB Texas Water Development Board
NAD83 State Plane Texas South Central Zone (feet).
NAVD88 KL_TWDB_Bathymetry_GeoNAD83_Feet.csv
USACE-SNWW
US Army Corps of Engineers NAD83 UTM15 (m) Mean Tide Level USACE_SNWW_NAD83UTM15_MLT.csv
Appendix B: Hydrodynamic Model Bathymetry
To generate bathymetry for the TWDB hydrodynamic model the merged and
extrapolated bathymetry dataset was converted from NAVD88 to Mean Sea Level (MSL).
Since there exists no established datum conversion from the NAVD88 vertical datum to
tidal MSL datum, we chose to approximate a conversion by subtracting 2.32 feet. This
2.32 feet value is the average correction that was used in converting sounding depths to
bathymetric elevations based on field level measurements in the TWDB survey. Shallow
pools of water that the survey boats were unable to traverse were set to be 1.3 feet NAVD
(or approximately -1 foot MSL).
Another model bathymetric dataset developed for a modeling project of the
Sabine-Neches Waterway was obtained from the U.S. Army Corps of Engineers (USACE)
[5]. This data was referenced to the Mean Low Tide (MLT) tidal datum. The USACE
dataset was clipped to exclude areas covered by the merged bathymetric dataset described
in this report. The USACE data was then referenced to the same MSL data of the TWDB
hydrodynamic model bathymetry by subtracting 1 foot. This shift was calculated from a
comparison of an overlapping region in the Sabine-Neches Ship Channel.