Embed Size (px)
Citation preview
U.S. Department of the Interior Bureau of Reclamation Technical Service Center Water Resources Research Laboratory Denver, Colorado August 2004
Alt. PP no. 2
Hydraulic Laboratory Report - PAP 0924
Hydrographic Survey Data Collected at Three Proposed Pumping Plant Sites on the Williamson River near Chiloquin, Oregon April 20-21, 2004 and July 22, 2004

This page was intentionally left blank.

U.S. Department of the Interior Bureau of Reclamation Technical Service Center Water Resources Research Laboratory Denver, Colorado August 2004
Hydraulic Laboratory Report - PAP 0924
Hydrographic Survey Data Collected at Three Proposed Pumping Plant Sites on the Williamson River near Chiloquin, Oregon April 20-21, 2004 and July 22, 2004 Tracy B. Vermeyen, P.E.

Acknowledgments Brent Mefford, Technical Specialist, peer reviewed this report. Technical comments were also provided by Chuck Korson and Bud Cook from Reclamation’s Klamath Basin Area Office. Michael Berg, Hydrologic Technician, was instrumental in the collection of this field data.
Hydraulic Laboratory Reports This Hydraulic Laboratory Report was produced by the Bureau of Reclamation’s Water Resources Research Laboratory (Mail Code 86-68560), PO Box 25007, Denver, Colorado 80225-0007.
Disclaimer No warranty is expressed or implied regarding the usefulness or completeness of the information contained in this report. References to commercial products do not imply endorsement by the Bureau of Reclamation and may not be used for advertising or promotional purposes.
Mission Statements
The mission of the Department of the Interior is to protect and provide access to our Nation's natural and cultural heritage and honor our trust responsibilities to Indian Tribes and our commitments to island communities.
___________________________ The mission of the Bureau of Reclamation is to manage, develop, and protect water and related resources in an environmentally and economically sound manner in the interest of the American public.
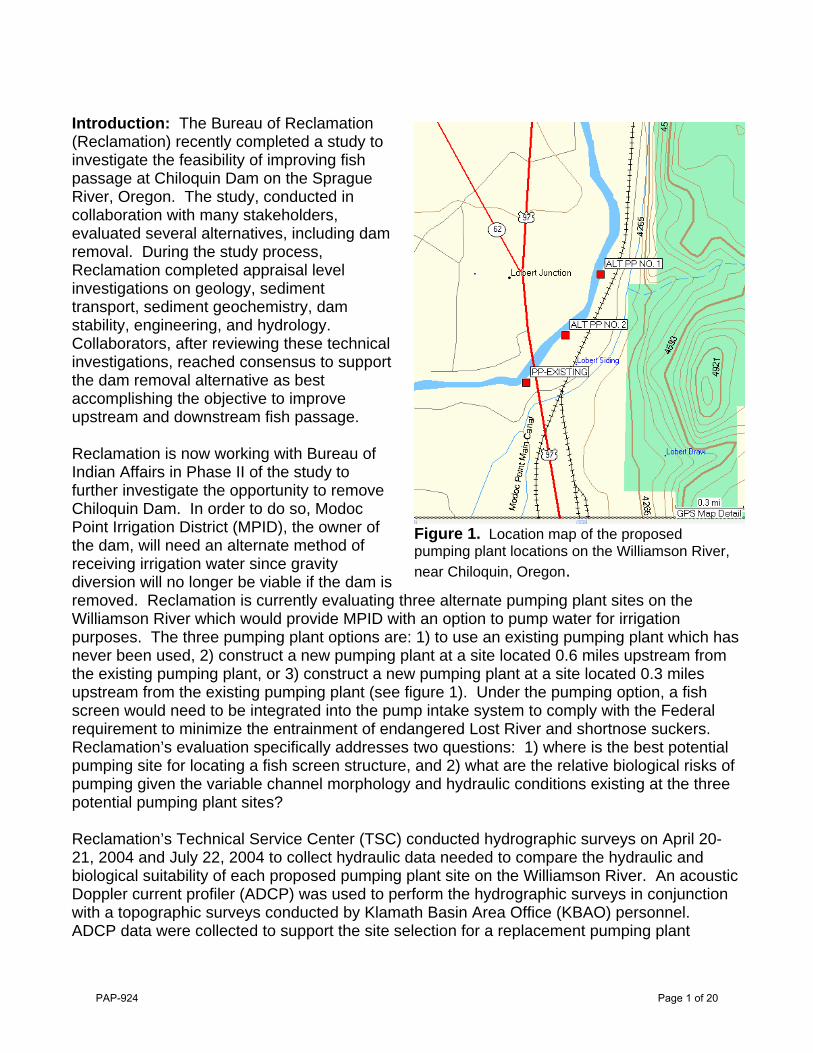
Introduction: The Bureau of Reclamation (Reclamation) recently completed a study to investigate the feasibility of improving fish passage at Chiloquin Dam on the Sprague River, Oregon. The study, conducted in collaboration with many stakeholders, evaluated several alternatives, including dam removal. During the study process, Reclamation completed appraisal level investigations on geology, sediment transport, sediment geochemistry, dam stability, engineering, and hydrology. Collaborators, after reviewing these technical investigations, reached consensus to support the dam removal alternative as best accomplishing the objective to improve upstream and downstream fish passage. Reclamation is now working with Bureau of Indian Affairs in Phase II of the study to further investigate the opportunity to remove Chiloquin Dam. In order to do so, Modoc Point Irrigation District (MPID), the owner of the dam, will need an alternate method of receiving irrigation water since gravity diversion will no longer be viable if the dam is removed. Reclamation is currently evaluating three alternate pumping plant sites on the Williamson River which would provide MPID with an option to pump water for irrigation purposes. The three pumping plant options are: 1) to use an existing pumping plant which has never been used, 2) construct a new pumping plant at a site located 0.6 miles upstream from the existing pumping plant, or 3) construct a new pumping plant at a site located 0.3 miles upstream from the existing pumping plant (see figure 1). Under the pumping option, a fish screen would need to be integrated into the pump intake system to comply with the Federal requirement to minimize the entrainment of endangered Lost River and shortnose suckers. Reclamation’s evaluation specifically addresses two questions: 1) where is the best potential pumping site for locating a fish screen structure, and 2) what are the relative biological risks of pumping given the variable channel morphology and hydraulic conditions existing at the three potential pumping plant sites? Reclamation’s Technical Service Center (TSC) conducted hydrographic surveys on April 20-21, 2004 and July 22, 2004 to collect hydraulic data needed to compare the hydraulic and biological suitability of each proposed pumping plant site on the Williamson River. An acoustic Doppler current profiler (ADCP) was used to perform the hydrographic surveys in conjunction with a topographic surveys conducted by Klamath Basin Area Office (KBAO) personnel. ADCP data were collected to support the site selection for a replacement pumping plant
Figure 1. Location map of the proposed pumping plant locations on the Williamson River, near Chiloquin, Oregon.
PAP-924 Page 1 of 20

associated with the decommissioning of Chiloquin Dam on the Sprague River. The purpose of these surveys was to document the velocity fields, river discharge, and bathymetry for a river reach encompassing the existing pumping plant site during high and low flow conditions. Likewise, similar hydrographic surveys were made at two alternate pumping plant sites. Hydrographic Instrumentation and Software: A RD Instruments 1200 kHz Zedhed ADCP was used for this project. A Garmin GPSMap76 receiver (with WAAS differential correction) was used to collect supplemental horizontal position data during the hydrographic survey. GPS was used to store positions at the start and end of ADCP transects. A 200 kHz digital echosounder was used to collect water depths concurrently with ADCP data. A laptop computer was used for data collection. A software package called WinRiver (v1.05) was used to collect ADCP, Garmin GPS data, and echosounder data. A U.S. Army Corps of Engineers program called CORPSCON was used to convert the Garmin GPS position data (latitude and longitude) to northings and eastings in the Oregon State plane coordinate system (Oregon Zone - South 3602). The CORPSCON setup information used in the coordinate transformation was as follows:
SOFTWARE: Corpscon for Windows 5.11.08 Horizontal Datum: State Plane, NAD83 Horizontal Zone: Oregon South – 3602 Horizontal Units: U.S. Survey Feet Vertical Datum: NAVD88 Vertical Units: U.S. Survey Feet
Boat: KBAO provided a 12-ft drift boat with a 10-HP outboard motor to carry the personnel and equipment during the hydrographic survey. A boat operator and hydraulic engineer were on the boat during the hydrographic surveys. Surveying: For the high flow survey conducted on April 20-21, 2004, KBAO provided a total station survey instrument to collect survey points at the start of each ADCP transect. A few days earlier, KBAO surveyors established cross sections in the vicinity of the proposed pumping plant sites. For the alternate pumping plant site No. 1, KBAO surveyors surveyed 5 cross sections upstream and downstream from the proposed site. The spacing between cross sections was 50 ft. A 500-ft-long river reach was included in this hydrographic survey. At the existing pumping plant site, 4 cross sections were established upstream and downstream of the plant. The spacing between cross sections was 50 ft. A 400-ft-long river reach was included in the hydrographic survey at the existing pumping plant site. During the April 2004 hydrographic surveys, a KBAO surveyor used a total station to survey the starting position and water surface elevation for each ADCP transect using a prism attached to the ADCP mount. This method of establishing the starting and ending position for each transect worked well at alternate pumping plant site No. 1. At the existing pumping plant site, rapid currents and shallow depths created large offsets in the ADCP computed positions because bottoming tracking data were periodically interrupted. Consequently, GPS data were used for establishing the position of ADCP velocity and depth data. CORPSCON software was used to convert the GPS latitude/longitude data into Oregon State plane coordinates
PAP-924 Page 2 of 20

(Oregon Zone -South 3602). The KBAO surveyor collected all total station survey points in the Oregon Zone - South 3602 zone. Alternate pumping plant site No.2 was identified as a viable site in June 2004 and a bathymetric survey was performed by KBAO surveyors on June 30, 2004. KBAO Surveyors were not involved with the hydrographic surveys made on July 22, 2004. Williamson River Conditions: On April 20, 2004, the Williamson River gage below the confluence with the Sprague River (USGS Gage 11502500) recorded an average flow and stage of 1163 ft3/sec and 4.37 ft, respectively (see figure 2). On April 21, 2004, the Williamson River gage recorded an average flow and stage of 1160 ft3/sec and 4.36 ft, respectively. On July 22, 2004, the Williamson River gage recorded an average flow and stage of 387 ft3/sec and 3.20 ft, respectively. Note: Data provided by the USGS in Oregon -- including stream discharge and water levels from water-quality monitors--are considered preliminary and have not received final approval.
Williamson River, Near Chiloquin, OR (USGS Gage 11502500)
1,1451,1501,1551,1601,1651,1701,1751,1801,1851,1901,195
4/20/20040:00
4/20/20044:48
4/20/20049:36
4/20/200414:24
4/20/200419:12
4/21/20040:00
4/21/20044:48
4/21/20049:36
4/21/200414:24
4/21/200419:12
4/22/20040:00
Flow
(CFS
)
4.34
4.36
4.38
4.4
Stag
e (ft
)
Stage (ft)Flow (ft³/s)
Figure 2. Williamson River flow and stage data for April 20-21, 2004. The gage is located at latitude 42° 33' 54" and longitude 121° 52' 42” and is approximately 2.6 miles upstream from alternate pumping plant site No. 1. From USGS website http://waterdata.usgs.gov/or/nwis/uv/?site_no=11502500 .
ADCP Transects: At alternate pumping plant site No. 1, ADCP and hydrographic survey data were collected between surveyed cross sections that were spaced 50-ft upstream and downstream from the two pumping plant locations. Water surface elevations and ADCP starting and ending locations were surveyed using a total station. At the existing pumping plant site, ADCP transects could not be made along river cross sections because of the swift currents and very shallow depths. As a result, ADCP data were collected in the deeper water near the existing pumping plant and along the left bank (looking downstream). At alternate pumping plant site No. 2, ADCP data were collected at survey stations provided by KBAO surveyors that were spaced 200-ft apart. ADCP transects were collected at stations: 0+00, 2+00, 4+00, 5+00, 6+00, 7+00, 8+00, 10+00, 12+00, and 14+00. Station 7+00 was selected
PAP-924 Page 3 of 20

by the pumping plant designer as the preferred site, so ADCP data collection was concentrated around that location. Data Quality: To insure that good quality data a compass calibration was performed prior to collecting ADCP data. Likewise, repeatable hydraulic measurements for the same cross section were used to verify the transect data quality. Comparing ADCP data to independent discharge measurements is another method used to estimate data quality. Close agreement between independent discharge measurements (e.g. USGS gage readings) signifies that the ADCP data accuracy is reasonable. Typically, ADCP discharge measurements have a reported uncertainty of ±3 to 5 percent. Data Processing: All ADCP data presented in this report were extracted from ADCP data files using several quality assurance criteria. On April 20, 2004, ADCP data were processed to generate cross sectional velocity profiles at nine cross sections (U5, U3, U2, U1, PP0, D1, D2, D3, and D4) at alternate pumping plant site No. 1. Velocity profile positions were computed using survey data collected with the total station. The positional accuracy of the velocity profiles measured in the vicinity of the alternate pumping plant is probably on the order of ±2 ft. Likewise, bed elevations at the velocity profile locations are probably on the order of ±1.0 ft. ADCP data at cross sections U4 and D5 were not presented because of problems encountered during data collection. For the existing pumping plant site, ADCP data were more difficult to process because the ADCP lost bottom-tracking in areas with rapid flows and/or shallow depths. As a result, velocity profile positions had to be estimated using GPS data instead of total station points. Consequently, the positional accuracy of the velocity profiles measured in the vicinity of the existing pumping plant is probably on the order of ±15 ft. Another complicating factor was that GPS data were only intermittently available in the ADCP data files because the communication between the GPS and the WinRiver software was intermittent. The bed elevation at velocity profile locations was difficult to estimate because transects were made longitudinally. Consequently, elevations were computed by subtracting the measured depth from the water surface elevation measured at cross section U2 (El. 4145.3 ft). The water surface elevation at cross section U2 was selected because it was the maximum elevation measured by the total station. An estimate of the error in bed elevation measurements at this site is ±1.7 ft. To aid in data visualization, measured velocities were interpolated onto a rectangular grid for data presentation in this report. The resulting data set provides a good representation of the velocity field close to the existing pumping plant, but has the same limitations in the positional accuracy and elevations as the raw velocity profile data. On July 22, 2004, ADCP data were processed to generate cross sectional velocity profiles at sixteen cross sections (U4, U2, PP0, D1, D2, D5, and Stations 0+00, 2+00, 4+00, 5+00, 6+00, 7+00, 8+00, 10+00, 12+00, and 14+00) at alternate pumping plant sites No. 1 and No. 2, respectively. Station 0+00 was the most downstream ADCP transect and was located near the Highway 97 Bridge over the Williamson River. For the low flow conditions, cross sections 0+00 and 2+00 were too shallow to collect ADCP velocities. Velocity profile positions were
PAP-924 Page 4 of 20

computed using GPS data. The positional accuracy of the velocity profiles measured in the vicinity of the alternate pumping plant is probably on the order of ±10 ft. Bed elevations at the velocity profile locations were not computed because there were no water surface elevations available. Results from April 20-21, 2004 Hydrographic Surveys: On April 20, 2004, the ADCP was used to measure river discharges at 9 transects near the alternate pumping plant site No. 1. The average ADCP measured discharge was 1287 ft3/sec with a standard error (standard deviation of the mean) of ±19 ft3/sec. The USGS gage reported an average flow of about 1160 ft3/sec. The discrepancy between the USGS and the ADCP average discharge readings was +12.2 percent. The reason for this discrepancy is unknown, but may be related to a shift in the rating at the gaging station. Based on experience on other rivers, ADCP discharge measurements typically agree within ±5 percent of a USGS gage readings. In order to determine the source of this discrepancy the USGS would have to be contacted to discuss their gage accuracy. Table 1 contains a summary of the hydrographic data collected in the vicinity of the alternate pumping plant site No. 1. The average reach properties for the nine transects listed in table 1 are as follows:
• Channel width was 163 ft, channel depth was 5.0 ft • Cross sectional area was 825 ft2 • Depth-averaged channel velocity was 1.6 ft/sec
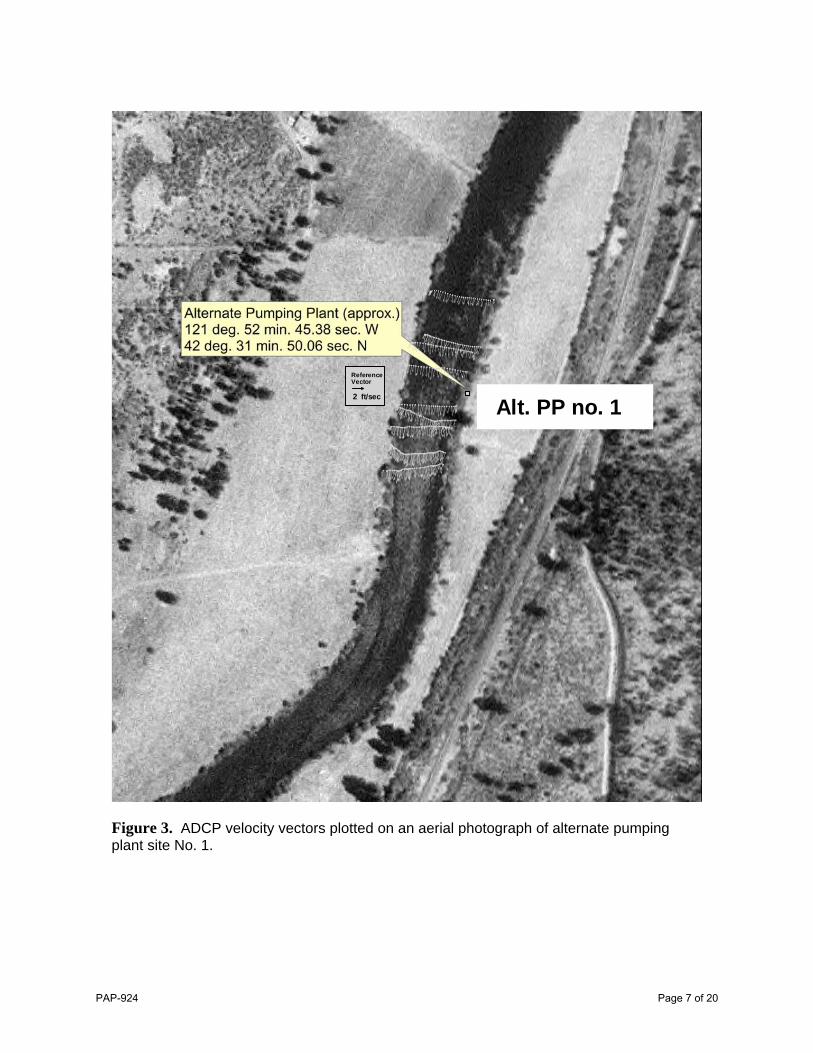
Figure 3 shows the ADCP velocity vectors plotted on an aerial photograph of the alternate pumping plant No. 1 location. Figures 4 and 5 show the bathymetric contours and depth-averaged velocity vectors, respectively, for alternate pumping plant site No. 1. The bathymetric data shows an area of scour on the right bank beginning at cross section U3 and extending upstream to U5. At the pumping plant cross section, the average depth and channel velocity were 5.0 ft and 1.7 ft/sec, respectively.
PAP-924 Page 5 of 20

Table 1. Hydraulic data for Williamson River cross sections collected near alternate pumping plant site No. 1 for high flows - April 20, 2004.
Transect
River Flow
(ft3/sec)
Average Channel Velocity (ft/sec)
Cross-SectionalArea (ft2)
Average Depth
(ft) Width (ft) U5 1307 1.3 1036 6.2 168
U3 1261 1.5 872 5.6 155
U2 1310 1.5 906 5.2 175
U1 1248 1.5 832 5.0 167
PP0 1408 1.7 838 5.0 169
D1 1216 1.6 750 4.7 158
D2 1308 1.7 765 4.7 163
D3 1252 1.8 694 4.6 150
D4 1272 1.8 729 4.4 164
PAP-924 Page 6 of 20
Alt. PP no. 12 ft/sec
ReferenceVector
Figure 3. ADCP velocity vectors plotted on an aerial photograph of alternate pumping plant site No. 1.
PAP-924 Page 7 of 20

Easting(ft)
Nor
thin
g(ft)
4549300 4549400 4549500
317700
317750
317800
317850
317900
317950
318000
318050
318100
318150
318200
AvgDepth(ft)
7654321
AlternatePP Site
Williamson River Bathymetric Survey Near TheAlternate Pumping Plant Site
XSEC U5
XSEC U3
XSEC U1
XSEC @ PP
D4
XSEC D2
XSEC D3
XSEC D4
Date: April 20, 2004Discharge: 1200 CFSApprox. WSEL: 4149.5
U1
U3
U5
D1
D2
D3
Figure 4. Plot of ADCP transect paths and water depth contours at alternate pumping plant No. 1 site. The boxes along the left bank are the survey stake locations which defined the river cross sections.
Figure 5 shows that velocity vectors have a very uniform magnitude throughout the study reach. In contrast, the velocity directions are somewhat variable. These localized variations in velocity direction are normal in rivers with a rocky bottom. A comparison of near surface and depth-averaged velocities showed no significant difference in velocity magnitude or direction. This result was expected because of the shallow depths in this river reach.
PAP-924 Page 8 of 20

Easting(ft)
Nor
thin
g(ft)
4549200 4549400 4549600 4549800 4550000317600
317800
318000
318200Bed Elev. (ft)
41464145414441434142
2
Williamson River Velocity Vector Field Collected Near theAlternate Pumping Plant Site No. 1
ft/sec
ReferenceVector
XSEC U5
XSEC U3
XSEC U1
XSEC @ ALT. PP NO.1
XSEC D1XSEC D2
XSEC D3XSEC D4
Date: April 20, 2004Discharge: 1200 CFSAprrox. WSEL: 4149
Coordinate System: US State Plane 1983Project Datum: NAD 1983 (Conus)Zone: Oregon South 3602
Figure 5. Plot of depth-averaged velocity vectors and river bed elevation contours at alternate pumping plant site No. 1. The velocity vectors show a uniform velocity distribution, in both magnitude and direction, throughout the study reach. Note: Localized variations in velocity direction are typical of rivers with a rocky bottom.
Figure 6 shows the bathymetric contours and ADCP measurement locations near the existing pumping plant site. Figure 6 illustrates the irregular paths taken by the boat during data collection. Bathymetric data shows several areas of local scour just below the riffle entering the study reach (near cross section U2). At the pumping plant cross section, the average depth and velocity were 11.5 ft and 1.6 ft/sec, respectively. With the exception of average depths and depth-averaged velocities shown in table 2, river conditions did not allow the measurement of average hydrographic data for the cross sections in this study reach. Note: Data in table 2 were estimated using interpolated values.
PAP-924 Page 9 of 20

Table 2. Average depths and velocities for river cross sections
near the existing pumping plant
Cross Section Estimated Average Depth (ft)
Estimated Average Velocity(ft/sec)
U2 9.4 1.9
U1 11.4 1.7
EXISTING PP 11.5 1.6
D1 6.1 1.9
D2 3.8 2.7
D3 2.0 n/a
Easting(ft)
Nor
thin
g(ft)
4547500 4547550 4547600 4547650 4547700 4547750
315350
315400
315450
315500
315550
AvgDepth(ft)
15131197531
Williamson River Bathymetric Survey Near theExisting Pumping Plant Site
Date: April 21, 2004Discharge: ~1200 CFSApprox. WSEL: 4145.0
Coordinate System: US State Plane 1983Project Datum: NAD 1983 (Conus)Zone: Oregon South 3602
Approx. ExistingPumping PlantLocation
U2
D3
D1
D2
U1
Figure 6. Plot of ADCP transects and water depth contours at the existing pumping plant site. The box icons along the left bank are survey stake positions which defined the measurement cross sections.
PAP-924 Page 10 of 20

Approx. Existing
Pumping Plant
Location
ReferenceVector
eddyzone
Easting(ft)
Nor
thin
g(ft)
4547600 4547650 4547700 4547750 4547800
315400
315450
315500
315550
AvgBedElev(ft)
41414139413741354133413141294127
3 ft/sec
Williamson River Depth-Averaged Velocity Vector FieldNear the Existing Pumping Plant Site
Date: April 21, 2004Discharge: ~1200 CFSApprox. WSEL: 4145.0
Coordinate System: US State Plane 1983Project Datum: NAD 1983 (Conus)Zone: Oregon South 3602
Figure 7. Plot of bed elevation contours and velocity vectors measured near the existing pumping plant site. Note: ADCP velocity data were used to interpolate the cross sectional velocity vectors used for this plot.
Figure 7 shows the bed elevation contours overlaid by depth-averaged velocity vectors. Data used to create the plot in figure 7 were extracted from the ADCP data shown in figure 6. The ADCP data were interpolated using a Kriging algorithm to generate the cross sectional velocity vectors shown in the plot. Interpolated data are smoothed because eight nearby data points were used to compute velocities at 20 to 30 evenly spaced points along each cross section. Figure 7 illustrates how the scour holes upstream from the existing pumping plant direct the flow toward the pumping plant. An eddy zone upstream from the pumping plant is also shown in figure 7. Figure 8 shows a comparison of depth-averaged and near surface velocity vectors at the existing pumping plant site. Near surface velocities were computed as the average of ADCP velocities measured at 2.6 and 3.5 ft below the water surface.
PAP-924 Page 11 of 20

Easting(ft)
Nor
thin
g(ft)
4547650 4547700
315440
315460
315480
315500
315520
Depth-Averaged VelocitySurface Velocity
Reference Vector3 ft/sec
Approx. Existing
Pumping Plant
Location
(not to scale)
Comparison of Depth-averaged and Near Surface Velocity VectorsAt the Existing Pumpinp Plant Site
Figure 8. Comparison plot of depth-averaged and surface velocity vectors. The only location where surface velocity vectors differ significantly was just upstream of the existing pumping plant - where surface velocity vectors are directed toward the middle of the channel, and depth-averaged velocity vectors are directed toward the existing pumping plant trashracks.
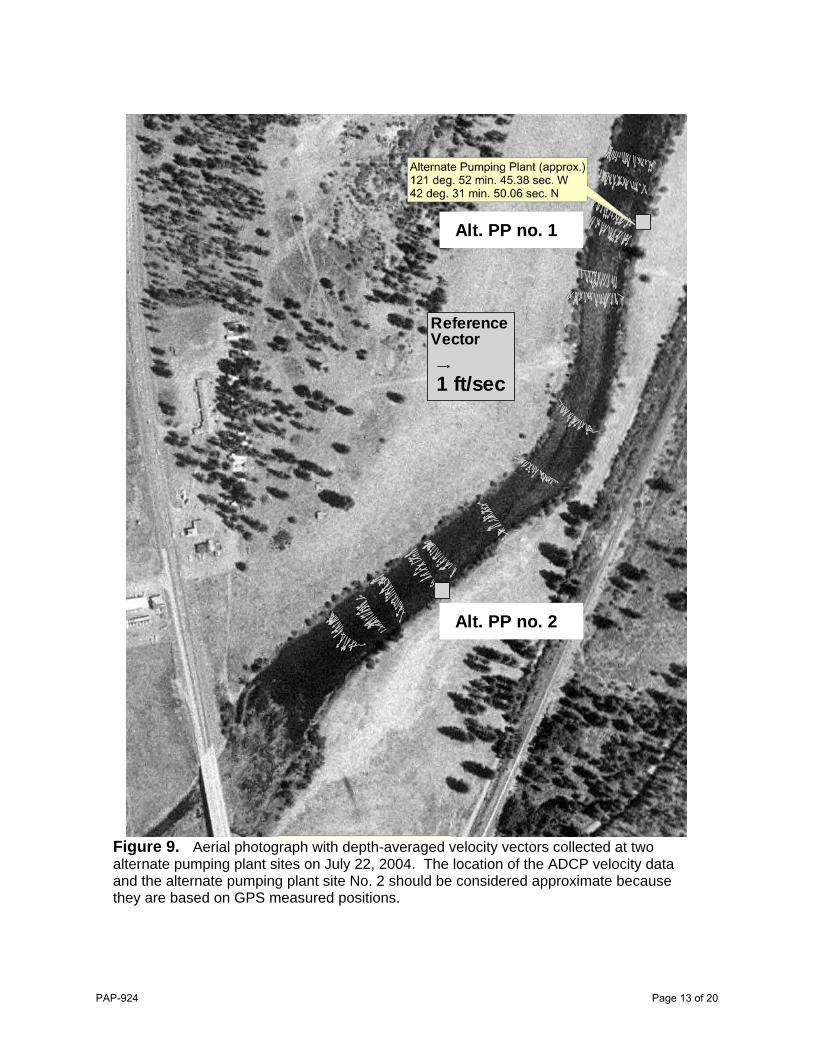
Results from July 22, 2004 Hydrographic Surveys: On July 22, 2004, an ADCP was used to measure river discharges at 16 transects near alternate pumping plant sites No. 1 and No. 2. Figure 9 shows ADCP transect locations and velocity vectors on an aerial photo of the Williamson River. The average ADCP-measured discharge was 414 ft3/sec with a standard error (standard deviation of the mean) equal to ±8 ft3/sec. The USGS gage reported an average flow equal to 387 ft3/sec. The discrepancy between the USGS and the ADCP average discharge readings was 7.1 percent. Again, the reason for this discrepancy is unknown, but may be related to a shift in the rating at the gaging station. Table 3 contains a summary of the hydraulic data collected in the vicinity of alternate pumping plant site No. 1. The average reach properties for the six transects listed in table 3 are as follows:
• Channel width was 163 ft, channel depth was 3.7 ft • Cross sectional area was 599 ft2 • Depth-averaged channel velocity was 0.69 ft/sec
PAP-924 Page 12 of 20
1 ft/sec
ReferenceVector
Alt. PP no. 2
Alt. PP no. 1
Figure 9. Aerial photograph with depth-averaged velocity vectors collected at two alternate pumping plant sites on July 22, 2004. The location of the ADCP velocity data and the alternate pumping plant site No. 2 should be considered approximate because they are based on GPS measured positions.
PAP-924 Page 13 of 20

Easting(ft)
Nor
thin
g(ft)
4549200 4549400 4549600 4549800 4550000317600
317800
318000
318200Bed Elev. (ft)
41464145414441434142
2
Williamson River Velocity Vector Field Collected Near theAlternate Pumping Plant Site No. 1
ft/sec
ReferenceVector
XSEC U4
XSEC U2
XSEC D1
XSEC D5
XSEC D4
Date: July 22, 2004Discharge: 414 CFSAprrox. WSEL: Unknown
Coordinate System: US State Plane 1983Project Datum: NAD 1983 (Conus)Zone: Oregon South 3602
ALT. PP NO. 1
Figure 10. Plot of near-surface velocity vectors and water depth contours at alternate pumping plant site No. 1. The velocity vectors show uniform velocity magnitudes, while local variations in flow direction occur throughout the study reach.
Table 3. Hydraulic data for Williamson River cross sections collected near the alternate pumping plant site No. 1 for low flow conditions (July 22, 2004).
Transect Flow
(ft3/sec)
Mean Channel Velocity (ft/sec)
Cross-Sectional
Area (ft2)
Average
Depth (ft)
Channel Width
(ft) U4 431 0.53 810 4.7 174 U2 411 0.62 659 4.0 165
PP0 414 0.73 571 3.3 171 D1 415 0.78 534 3.5 152 D4 415 0.84 492 3.2 154 D5 400 0.76 527 3.3 159
PAP-924 Page 14 of 20
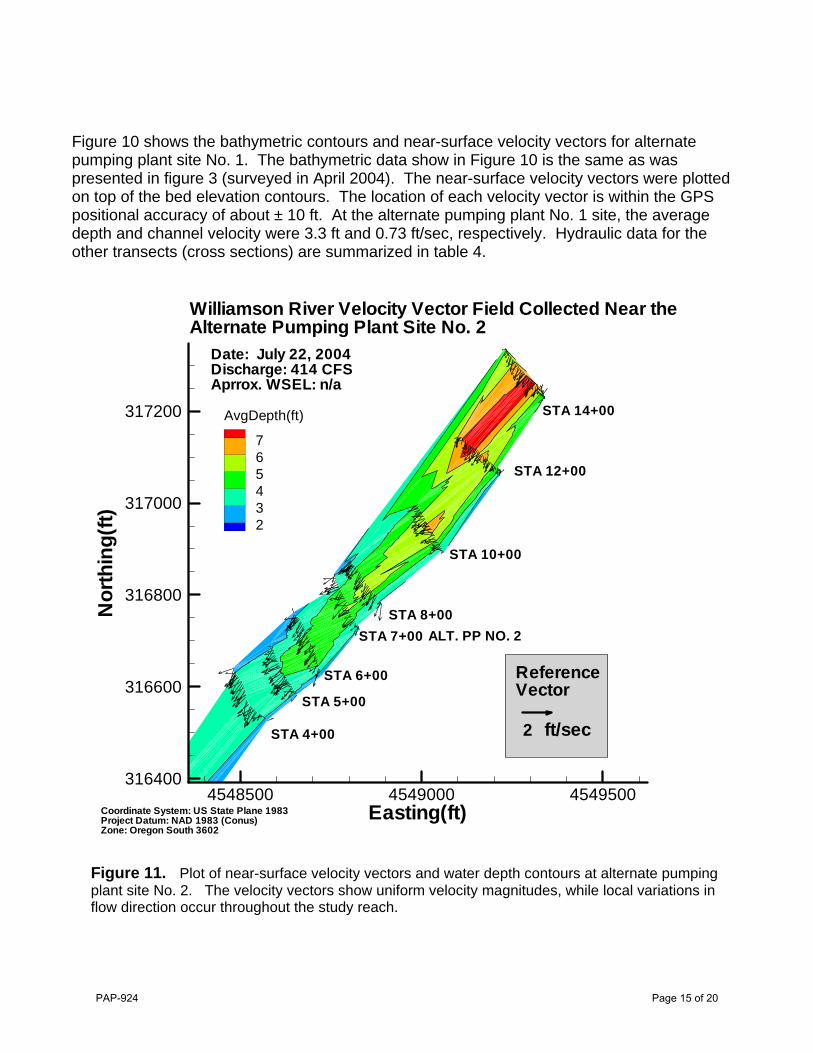
Figure 10 shows the bathymetric contours and near-surface velocity vectors for alternate pumping plant site No. 1. The bathymetric data show in Figure 10 is the same as was presented in figure 3 (surveyed in April 2004). The near-surface velocity vectors were plotted on top of the bed elevation contours. The location of each velocity vector is within the GPS positional accuracy of about ± 10 ft. At the alternate pumping plant No. 1 site, the average depth and channel velocity were 3.3 ft and 0.73 ft/sec, respectively. Hydraulic data for the other transects (cross sections) are summarized in table 4.
ALT. PP NO. 2
STA 14+00
STA 12+00
STA 10+00
STA 8+00STA 7+00
STA 6+00
STA 5+00
STA 4+00
Easting(ft)
Nor
thin
g(ft)
4548500 4549000 4549500316400
316600
316800
317000
317200 AvgDepth(ft)
765432
2 ft/sec
Coordinate System: US State Plane 1983Project Datum: NAD 1983 (Conus)Zone: Oregon South 3602
ReferenceVector
Williamson River Velocity Vector Field Collected Near theAlternate Pumping Plant Site No. 2
Date: July 22, 2004Discharge: 414 CFSAprrox. WSEL: n/a
Figure 11. Plot of near-surface velocity vectors and water depth contours at alternate pumping plant site No. 2. The velocity vectors show uniform velocity magnitudes, while local variations in flow direction occur throughout the study reach.
PAP-924 Page 15 of 20

Table 4. Hydraulic data for Williamson River cross sections collected near the alternate pumping plant site No. 2 for low flow conditions (July 22, 2004). Stations 0+00 and 2+00 were too shallow to collect ADCP velocity data.
Transect Flow
(ft3/sec)
Average Channel Velocity (ft/sec)
Cross-Sectional
Area (ft2)
Average
Depth (ft)
Width (ft)
STA 14+00 447 0.45 988 6.3 157 STA 12+00 399 0.45 884 6.2 142 STA 10+00 402 0.59 687 4.9 140 STA 8+00 425 0.74 576 4.2 137 STA 7+00 410 0.66 621 3.9 159 STA 6+00 436 0.66 660 3.9 169 STA 5+00 421 0.74 570 3.5 165 STA 4+00 375 0.77 489 3.3 149 STA 2+00 n/a n/a n/a n/a 189 STA 0+00 n/a n/a 486 2.5 191
The average reach properties for the ten transects listed in table 4 are as follows:
• Channel width was 153 ft, channel depth was 4.3 ft • Cross sectional area was 654 ft2 • Depth-averaged channel velocity was 0.63 ft/sec
Figure 11 shows the ADCP velocity vectors and water depth contours for alternate pumping plant site No. 2. The location of each velocity vector is within the GPS positional accuracy of ± 10 ft. At the pumping plant No. 2 cross section (STA 7+00), the average depth and channel velocity were 3.9 ft and 0.66 ft/sec, respectively. On figure 11, the velocity vectors have a very uniform magnitude throughout the study reach. Conversely, the velocity directions are somewhat variable. These localized variations in velocity direction are normal for rivers with a rocky bottom. A comparison of near surface and depth-averaged velocities was not possible because the shallow depths resulted in only near-surface velocity measurements. Hydraulic data for the other transects (cross sections) collected at alternate pumping plant No. 2 are summarized in table 4. Figure 12 shows a comparison of near-surface ADCP velocities collected at cross sections through alternate pumping plants sites No. 1 and No. 2. The velocity vector plots show that velocity magnitudes are very similar, except at the left bank near site No. 2 that had lower velocities. For example, near-surface velocities with 20 ft of the left bank for sites No. 1 and No. 2 were 0.64 and 0.44 ft/sec, respectively. Likewise, the average water depths within 20 ft of the left bank for sites No. 1 and No. 2 were 3.1 and 2.9 ft, respectively. Based on the similarity of the low-flow hydraulics and geomorphology of the two alternate pumping plant
PAP-924 Page 16 of 20

sites, it is reasonable to expect the two sites would have similar hydraulic properties for high-flow conditions.
XSEC @ ALT. PP NO.1
XSEC @ ALT. PP NO.2
1 FT/SEC
REFERENCEVECTOR
Comparison of near-surface velocity vectors for the two alternatepumping plant sites measured on July 22, 2004
LeftBank
RightBank Right
Bank
LeftBank
Figure 12. Plot of near-surface velocity vectors for both alternate pumping plant sites. Velocities at alternate pumping plant No. 2 are lower than at alternate pumping plant No. 1 because the cross sectional area is greater. Also, velocities near the left bank are lower at alternate pumping plant No. 2.
Surface Velocity Measurements, July 22, 2004: Low flow conditions and shallow depths were not conducive to making surface velocity measurements with an ADCP. Consequently, surface velocities were measured using a Sontek Flowtracker mounted on a wading rod. The Flowtracker is a hand-held acoustic Doppler velocimeter that collects 2-dimensional velocity measurements. The 2-D velocities are oriented in a horizontal (x,y) plane, where Vx is in the stream-wise direction and Vy is in the cross-stream direction. After ADCP measurements were made at alternate pumping plant site No. 2, the Flowtracker and GPS were used to collect surface velocities at two points near the left bank at several stations near the proposed pumping plant site. A GPS receiver was used to locate the survey stations and velocities were measured an estimated 10 and 25 ft from the left bank, except at stations 12+00, 13+00, and 14+00 which were too deep to wade beyond 10 ft from shore. The Flowtracker surface
PAP-924 Page 17 of 20

velocity data are presented in Table 5, where negative y-velocities are directed toward the left bank and negative x-velocities are directed upstream. A comparison of ADCP near-surface velocities and Flowtracker velocities showed close agreement throughout the river reach. For example, at Sta 7+00 the average ADCP and Flowtracker velocities measured between 10 and 25 ft from the left bank were 0.44 and 0.47 ft/sec, respectively. Similarly, at Sta 8+00 the average ADCP and Flowtracker velocities measured between 10 and 25 ft from the left bank were 0.76 and 0.67 ft/sec, respectively.
Table 5. Surface velocity data for Williamson River cross sections collected along the left bank at alternate pumping plant site No. 2 (July 22, 2004).
Time Station # Dist. From Left Bank
Water Depth
MeasurementDepth Vx Vy
(ft) (ft) (ft) (ft) (ft/s) (ft/s) 15:15 4+00 10 2.1 2.0 0.31 -0.10 15:15 4+00 25 2.5 2.4 0.52 -0.05 15:19 5+00 10 2.9 2.8 0.45 0.05 15:21 5+00 25 3.6 3.5 0.47 -0.05 15:24 6+00 10 2.8 2.7 0.54 -0.04 15:26 6+00 25 3.4 3.3 0.63 0.00 15:28 7+00 10 2.8 2.7 0.37 0.06 15:30 7+00 25 3.5 3.4 0.56 0.04 15:33 8+00 10 3.1 3.0 0.61 0.04 15:34 8+00 25 3.3 3.2 0.72 0.01 15:36 9+00 10 3.0 2.9 0.47 0.05 15:38 9+00 25 3.6 3.5 0.55 -0.13 15:41 10+00 10 2.8 2.7 0.55 0.01 15:42 10+00 25 3.4 3.3 0.58 -0.14 15:45 11+00 10 3.0 2.9 0.42 0.00 15:46 11+00 25 3.5 3.4 0.46 -0.04 15:50 12+00 10 3.9 3.8 0.06 0.03 15:53 13+00 10 3.0 2.9 -0.02 0.02 15:56 14+00 10 3.7 3.6 -0.10 0.00
Note: Negative Vy velocities are directed toward the left bank (when looking downstream). Table 6 contains estimated surface velocity data for Williamson River cross sections collected along the left bank at alternate pumping plant site No. 2 for flow conditions on April 20, 2004. The surface velocities were estimated by multiplying velocities in table 5 by the ratio of average channel velocities collected at alternate pumping plant No. 1 in April and July 2004. The ratio was computed using data from cross sections U2, PP0, D1, and D4 and was equal to 2.24. These velocity estimates do assume a similar stage versus cross sectional area relationship for both river reaches, which is reasonable considering the close proximity of the two alternate pumping plant sites. These estimates of surface velocity are needed to determine fish screen exposure times for larval fish times during periods of high flow.
PAP-924 Page 18 of 20

Table 6. Estimated surface velocity data for Williamson River cross sections collected along the left bank at alternate pumping plant site No. 2 for high flow conditions on April 20, 2004.
Time Station # Dist. From Left Bank
Water Depth
MeasurementDepth
Estimated Vx
Estimated Vy
(ft) (ft) (ft) (ft) (ft/s) (ft/s) 4+00 10 0.70 -0.23 4+00 25 1.16 -0.10 5+00 10 1.01 0.11 5+00 25 1.05 -0.12 6+00 10 1.20 -0.08 6+00 25 1.41 0.00 7+00 10 0.84 0.13 7+00 25 1.26 0.10 8+00 10 1.37 0.09 8+00 25 1.62 0.03 9+00 10 1.06 0.11 9+00 25 1.23 -0.28 10+00 10 1.23 0.02 10+00 25 1.29 -0.32 11+00 10 0.93 0.00 11+00 25 1.03 -0.08 12+00 10 0.13 0.06 13+00 10 -0.05 0.05 14+00 10 -0.22 0.01
Note: Negative Vy velocities are directed toward the left bank (when looking downstream). Miscellaneous Observations Stream bed conditions at alternate pumping plant sites No. 1 and No. 2 consisted of armored cobbles with fine sediments filling in the interstitial area between cobbles. Stream bed conditions at the existing pumping plant were not easily observed because of deep water. Conclusions
• An acoustic Doppler current profiler was successfully used to perform hydrographic surveys at two proposed pumping plant sites on the Williamson River for a flow of about 1287 ft3/sec. A second set of data were successfully collected for a flow of about 414 ft3/sec at alternate pumping plant sites No. 1 and No. 2.
• The ADCP data collected at alternate pumping plant sites No. 1 and No. 2 were of high
quality because river flow conditions allowed the boat to be easily maneuvered across the channel.
• The ADCP data collected at the existing pumping plant site were of lesser quality because shallow depths and rapid flow prevented the boat from being maneuvered
PAP-924 Page 19 of 20

along a channel cross section. Furthermore, the ADCP periodically lost bottom- tracking data because of shallow depths and/or high water velocities. As a result, surveying data could not be used to compute accurate positions for each velocity profile or depth measurement. To produce a usable data set, GPS positions were used to compute the position of ADCP data.
• Navigational problems at the existing pumping plant site did not affect the quality of the
velocities measured by the ADCP; they only affected the accuracy of the position and bed elevation data.
• For high flow conditions, depth-averaged velocities agree closely to near-surface
velocities at both sites, except just upstream of the existing pumping plant site, where surface velocities were directed downstream and depth-averaged velocities were directed toward the pumping plant trashracks.
• For low flow conditions, shallow depths did not allow a comparison of depth-averaged
velocities and near-surface velocities at alternate pumping plant sites No. 1 and No. 2.
• Comparisons between ADCP near-surface velocities and Flowtracker surface velocities showed very similar velocity magnitudes near the left bank at alternate pumping plant site No. 2.
• Based on the similarity of the low-flow hydraulics and geomorphology of the two
alternate pumping plant sites, it is reasonable to expect the two sites would have similar hydraulic properties for high-flow conditions.
Peer Review - Brent Mefford, Technical Specialist, with Reclamation’s Water Resources Research Laboratory peer reviewed this report. Technical comments were also provided by Chuck Korson and Bud Cook from KBAO.
PAP-924 Page 20 of 20