Embed Size (px)
Citation preview
HYDROGEOLOGY OF WESTERN NEWFOUNDLAND
Submitted to:
Water Resources Management Division Department of Environment and Conservation Government of Newfoundland and Labrador
Submitted by:
AMEC Earth and Environmental A Division of AMEC Americas Limited
133 Crosbie Road P.O. Box 13216
St. John’s, NL A1B 4A5
May, 2008
TF8312717
Hydrogeology of Western Newfoundland TF8312717 May, 2008
Page i
ABSTRACT AMEC Earth and Environmental, a Division of AMEC Americas Limited (AMEC), was retained by the Government of Newfoundland and Labrador, Department of Environment and Conservation, Water Resources Management Division (the Department) to conduct and report on a desktop study relating to key aspects of groundwater resources for the western zone of Newfoundland. This is the first of four new hydrogeology reports that will cover all areas of the province. The main objective of this study is to determine the physical characteristics of the major geological units in relation to the occurrence, availability, and quality of the constituent groundwater and to define in latter terms the aquifer potential. This study is based entirely on available data sources for the groundwater resources of the Western Newfoundland region. Three accompanying maps outline the hydrogeological resources.
Provincial water well records were used to subdivide the surficial deposits into two hydrostratigraphic units and to identify six bedrock hydrostratigraphic units. Groundwater yields vary from low (<1 L/min) to high (>1500 L/min). The variance in yields shows correlation with the various surficial deposits and bedrock types encountered. The highest well yields within the study area are associated with unconsolidated surficial deposits of outwash sands and gravels.
The natural surface water chemistry within the study area reflects the composition of the soils and bedrock. Much of the study area is underlain by limestone; therefore the water chemistry differs from other parts of the island. The water is more alkaline in these areas, with higher concentrations of dissolved constituents. The quality of the groundwater is generally quite acceptable, and in most cases falls within the criteria established for drinking water purposes. For the most part, the chemical composition of the groundwater reflects the geochemistry of the adjacent bedrock or unconsolidated sediments and is similar to the surface water chemistry. However, because the groundwater is less dilute, the concentrations of dissolved constituents tend to be higher than the corresponding surface water. Three groundwater quality types were identified from the groundwater chemistry data. These include calcium bicarbonate, sodium bicarbonate, and sodium chloride types. Streamflow data were analyzed to determine the groundwater discharge as reflected in the baseflow component of total streamflow for given drainage divisions. Based on the correlation between groundwater stage and stream discharge, it was estimated that groundwater contribution to streamflow ranged from 12 to 37%.
Groundwater is utilized within the study area to supply portions of the domestic, industrial and municipal requirements. The groundwater is obtained from wells developed in both the surficial, unconsolidated deposits and in the underlying bedrock.
Hydrogeology of Western Newfoundland TF8312717 May, 2008
Page ii
TABLE OF CONTENTS
1.0 INTRODUCTION.......................................................................................................1 1.1 SCOPE OF STUDY...................................................................................................1 1.2 STUDY AREA ...........................................................................................................1 1.3 SOURCES OF DATA ................................................................................................3 1.4 CLIMATE...................................................................................................................3
1.4.1 Temperature ..................................................................................................3 1.4.2 Precipitation ...................................................................................................5 1.4.3 Evapotranspiration .........................................................................................5
1.5 POPULATION ...........................................................................................................9
2.0 PHYSIOGRAPHY .....................................................................................................9 2.1 TOPOGRAPHY AND TERRAIN ................................................................................9
2.1.1 Great Northern Highlands ..............................................................................9 2.1.2 West Newfoundland Coastal Lowland............................................................9 2.1.3 Newfoundland Central Lowland ...................................................................11 2.1.4 Grand Lake Lowlands ..................................................................................11 2.1.5 Blow-Me-Down Highlands............................................................................11 2.1.6 Uplands of Newfoundland ............................................................................11 2.1.7 Stephenville Lowlands .................................................................................11 2.1.8 Anguille Mountains.......................................................................................11
3.0 GEOLOGY ..............................................................................................................12 3.1 SURFICIAL GEOLOGY...........................................................................................12
3.1.1 Bedrock .......................................................................................................14 3.1.2 Till ................................................................................................................14 3.1.3 Sand and Gravel ..........................................................................................14 3.1.4 Marine Diamicton, Gravel, Sand and Silt......................................................14 3.1.5 Organic Deposits .........................................................................................15
3.2 BEDROCK GEOLOGY............................................................................................15 3.2.1 Introduction..................................................................................................15 3.2.2 Grenville Basement Rocks...........................................................................16 3.2.3 Rift Rocks ....................................................................................................16 3.2.4 Cambro-Ordovician Autochthonous Shelf Rocks .........................................18 3.2.5 Cambro-Ordovician Allochthonous Rocks....................................................18
3.2.5.1 Ophiolitic Rocks .......................................................................................19 3.2.6 Carboniferous Sedimentary Rocks...............................................................19 3.2.7 Intrusive Rocks ............................................................................................20 3.2.8 Metamorphic rocks.......................................................................................21
4.0 HYDROGEOLOGY .................................................................................................21 4.1 HYDROSTRATIGRAPHIC UNITS...........................................................................21
4.1.1 Surficial Hydrostratigraphic Units .................................................................22 4.1.1.1 Unit A – Till Deposits................................................................................22 4.1.1.2 Unit B – Sand and Gravel Deposits..........................................................22
4.1.2 Bedrock Hydrostratigraphic Units.................................................................23 4.1.2.1 Unit 1 - Granitic and Gneissic Rock..........................................................23 4.1.2.2 Unit 2 – Clastic Sedimentary Rocks .........................................................29 4.1.2.3 Unit 3 – Carbonate Sedimentary Rocks ...................................................29 4.1.2.4 Unit 4 – Carboniferous Sedimentary Rocks..............................................30

Hydrogeology of Western Newfoundland TF8312717 May, 2008
Page iii
4.1.2.5 Unit 5 – Ophiolite Complexes...................................................................30 4.1.2.6 Unit 6 – Metavolcanic and Metasedimentary Rocks .................................30
4.2 AQUIFER TESTS....................................................................................................31 4.3 GROUNDWATER USAGE ......................................................................................33
4.3.1 Municipal Uses ............................................................................................33 4.3.2 Industrial Uses .............................................................................................34
5.0 HYDROLOGY .........................................................................................................34 5.1 HYDROLOGICAL CYCLE .......................................................................................34 5.2 DIVISION OF HYDROLOGICAL REGIONS ............................................................34 5.3 CLIMATIC CONDITIONS ........................................................................................37 5.4 TOTAL RUNOFF.....................................................................................................39 5.5 BASE FLOW ...........................................................................................................42 5.6 HYDROLOGICAL BUDGET ....................................................................................42
6.0 WATER QUALITY...................................................................................................46 6.1 SURFACE WATER .................................................................................................47 6.2 GROUNDWATER....................................................................................................48
6.2.1 Trilinear Diagrams........................................................................................48 6.3 POTENTIAL AND EXISTING GROUNDWATER QUALITY CONCERNS................57
6.3.1 Sewage Effluent...........................................................................................57 6.3.2 Salt Water Intrusion .....................................................................................57 6.3.3 Petroleum Products .....................................................................................57 6.3.4 Solid Waste Disposal Leachate....................................................................58 6.3.5 Road Salt .....................................................................................................58 6.3.6 Pulp and Paper Industry...............................................................................58 6.3.7 Mine Waste..................................................................................................58
7.0 SPRING USAGE.....................................................................................................58
8.0 CONCLUSIONS......................................................................................................59
9.0 REFERENCES........................................................................................................61
List of Tables
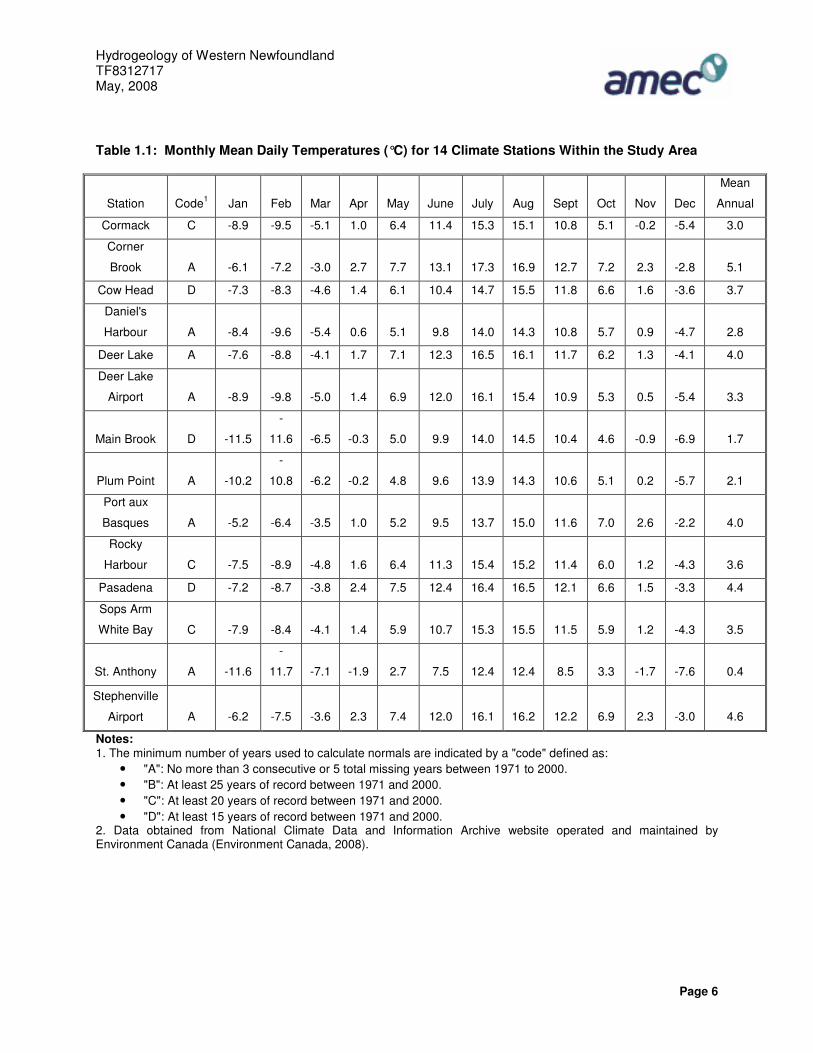
Table 1.1: Monthly Mean Daily Temperatures (°C) for 14 Climate Stations Within the
Study Area.......................................................................................................... 6
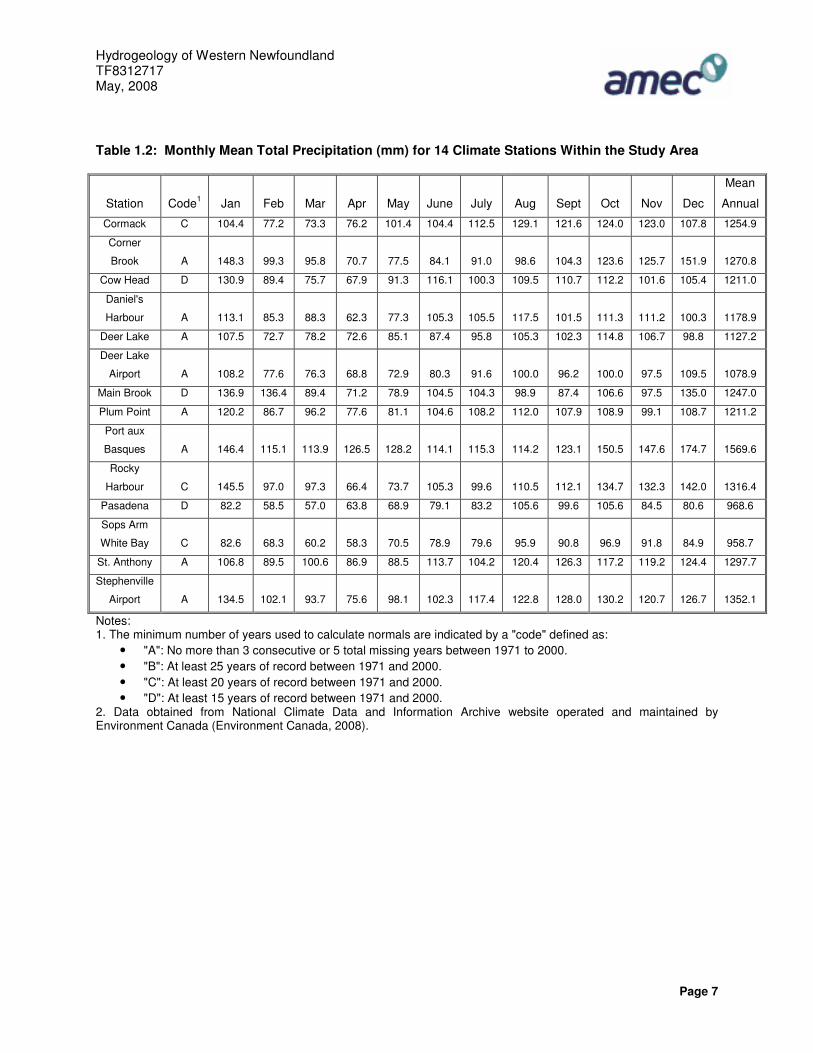
Table 1.2: Monthly Mean Total Precipitation (mm) for 14 Climate Stations Within the
Study Area.......................................................................................................... 7
Table 1.3: Mean Monthly Evapotranspiration (mm) for Stephenville Airport ......................... 8
Table 4.1: Surficial Hydrostratigraphic Units, Western Newfoundland.................................24
Table 4.2: Bedrock Hydrostratigraphic Units, Western Newfoundland ................................25
Table 4.3: Comparison of Aquifer Test and Water Well Record Safe Yield Estimates ........32
Table 5.1: Climatic Stations Grouped into Sub-regions.......................................................37
Table 5.2: Hydrologic Budget for Western Newfoundland...................................................38
Hydrogeology of Western Newfoundland TF8312717 May, 2008
Page iv
Table 5.3: A Summary of the Hydrometric Stations and their Locations in the Identified
Sub-Regions ......................................................................................................41
List of Figures
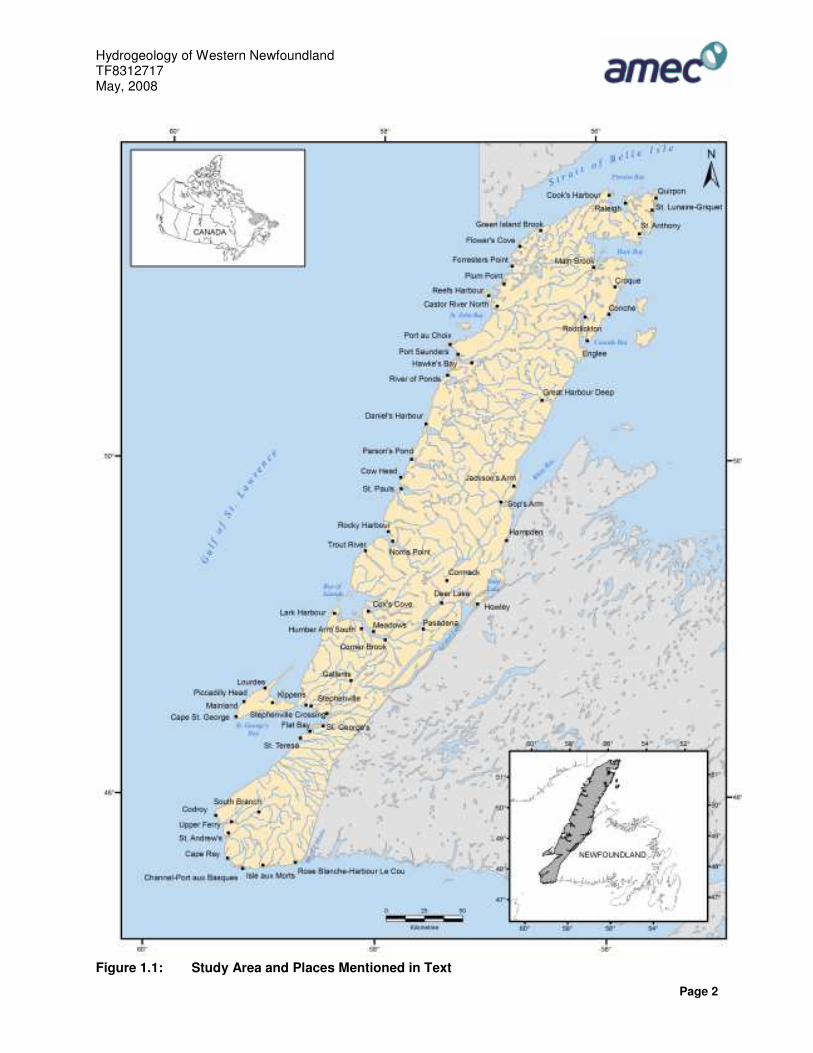
Figure 1.1: Study Area and Places Mentioned in Text .......................................................... 2
Figure 1.2: Locations of Climatic Stations within the Study Area........................................... 4
Figure 2.1: Relief and Physiographic Divisions ....................................................................10
Figure 3.1: Generalized Surficial Geology of the Study Area ...............................................13
Figure 3.2: Generalized Bedrock Geology of the Study Area ...............................................17
Figure 4.1: Well Yield and Depth Relationships, Surficial Hydrostratigraphic Units A and
B, Western Newfoundland (data from Department of Environment and
Conservation, Water Well Records, 2005). ........................................................26
Figure: 4.2: Well Yield and Depth Relationships, Bedrock Hydrostratigraphic Units 1 and
2, Western Newfoundland (data from DOEC, Water Well Records, 2005) .........27
Figure 4.3: Well Yield and Depth Relationships, Bedrock Hydrostratigraphic Units 3 and
4, Western Newfoundland (data from DOEC, Water Well Records, 2005). ........28
Figure 4.4: Well Yield and Depth Relationships, Bedrock Hydrostratigraphic Unit 5,
Western Newfoundland (data from DOEC, Water Well Records, 2005). ............29
Figure 5.1: Drainage Divisions Covering the Study Area......................................................36
Figure 5.2: Average Monthly Total Precipitation for the Five Sub-Divisions within the
Study Area.........................................................................................................39
Figure 5.3: Average Monthly Runoff Distributions for the Five Sub-Divisions within the
Study Area.........................................................................................................40
Figure 5.4: Average Monthly Runoff Distributions for the Study Area...................................43
Figure 5.5: Baseflow Separation for Hydrometric Station 02YC001 .....................................44
Figure 5.6: Baseflow Separation for Hydrometric Station 02YD002 .....................................44
Figure 5.7: Baseflow Separation for Hydrometric Station 02YL001......................................45
Figure 5.8: Baseflow Separation for Hydrometric Station 02YJ001 ......................................45
Figure 5.9: Baseflow Separation for Hydrometric Station 02ZB001......................................46
Figure 6.1: Trilinear diagram of the type used to display the results of water-chemistry
studies (Piper, 1944). Diagram taken from Freeze and Cherry (1979). .............49
Hydrogeology of Western Newfoundland TF8312717 May, 2008
Page v
Figure 6.2: Hydrogoechemical classification system for natural waters using the trilinear
diagram (Back, 1966). Diagram taken from Fetter (1994). ................................50
Figure 6.3: Major Ion Chemistry Represented by a Trilinear Diagram for Samples within
Unit B.................................................................................................................52
Figure 6.4: Major Ion Chemistry Represented by a Trilinear Diagram for Samples within
Unit 1 .................................................................................................................53
Figure 6.5: Major Ion Chemistry Represented by a Trilinear Diagram for Wells within Unit
2 ........................................................................................................................54
Figure 6.6: Major Ion Chemistry Represented by a Trilinear Diagram for Wells within Unit
3 ........................................................................................................................55
Figure 6.7: Major Ion Chemistry Represented by a Trilinear Diagram for Wells within Unit
4 ........................................................................................................................56
List of Appendices (Appendices Provided on Accompanying CD)
APPENDIX I CENSUS DATA FOR COMMUNITIES WITHIN THE STUDY AREA
APPENDIX II WATER WELL RECORDS FOR WESTERN NEWFOUNDLAND
APPENDIX III AQUIFER TEST DATA FOR WESTERN NEWFOUNDLAND
APPENDIX IV WATER QUALITY DATA
APPENDIX V WATER QUALITY INDEX CALCULATION
Hydrogeology of Western Newfoundland TF8312717 May, 2008
Page 1
1.0 INTRODUCTION AMEC Earth and Environmental, a Division of AMEC Americas Limited (AMEC), was retained by the Government of Newfoundland and Labrador, and the Department of Environment and Conservation (DOEC), Water Resources Management Division (the Department) to conduct and report on a desktop study relating to key aspects of groundwater resources for the western zone of Newfoundland. This is the first of four new hydrogeology reports that will cover all areas of the province. A map showing the study area is shown in Figure 1.1. The main objective of this study is to determine the physical characteristics of the major geological units in relation to the occurrence, availability, and quality of the constituent groundwater and to define the latter in terms of aquifer potential. Findings of the study will be used as a future reference for consultants, town officials, government, and the general public when making decisions concerning the development and use of groundwater in the region of Western Newfoundland.
1.1 SCOPE OF STUDY Based on a review of the Request for Proposal (RFP) and consultation with the DOEC (Water Resources Division), and the Department of Natural Resources (Geological Survey), the scope of work developed for the Hydrogeology of Western Newfoundland study included the following activities:
• Describe the physiography, the surficial and bedrock geology, and the hydrogeological properties of the surficial deposits and bedrock lithofacies present within the study area.
• Prepare three sets of maps at a scale of 1:250,000. These maps display bedrock
geology, surficial geology, and hydrogeology with accompanying notations and unit descriptions.
• Compile existing water well data and include, in so far as possible, depth, production,
chemistry, static water level, and available quantitative data based on pump test, observation well, and field investigations.
• Describe the physiography and the interrelationships between surface water and
groundwater of the area. This includes recharge and discharge characteristics, groundwater contribution to surface runoff, general direction of groundwater movement, seasonal fluctuations of groundwater and hydrologic budget; and,
• Compile and evaluate water quality data and discuss existing and potential pollution
problems, salt water intrusion and spring usage.
1.2 STUDY AREA The location of the study area is shown in Figure 1.1. It covers the west coast of Newfoundland and the Great Northern Peninsula. The boundary extends from west of the White Bay apex along the south banks of Sandy and Grand Lakes. The boundary then extends south to Bay le Moine.
Hydrogeology of Western Newfoundland TF8312717 May, 2008
Page 2
Figure 1.1: Study Area and Places Mentioned in Text
Hydrogeology of Western Newfoundland TF8312717 May, 2008
Page 3
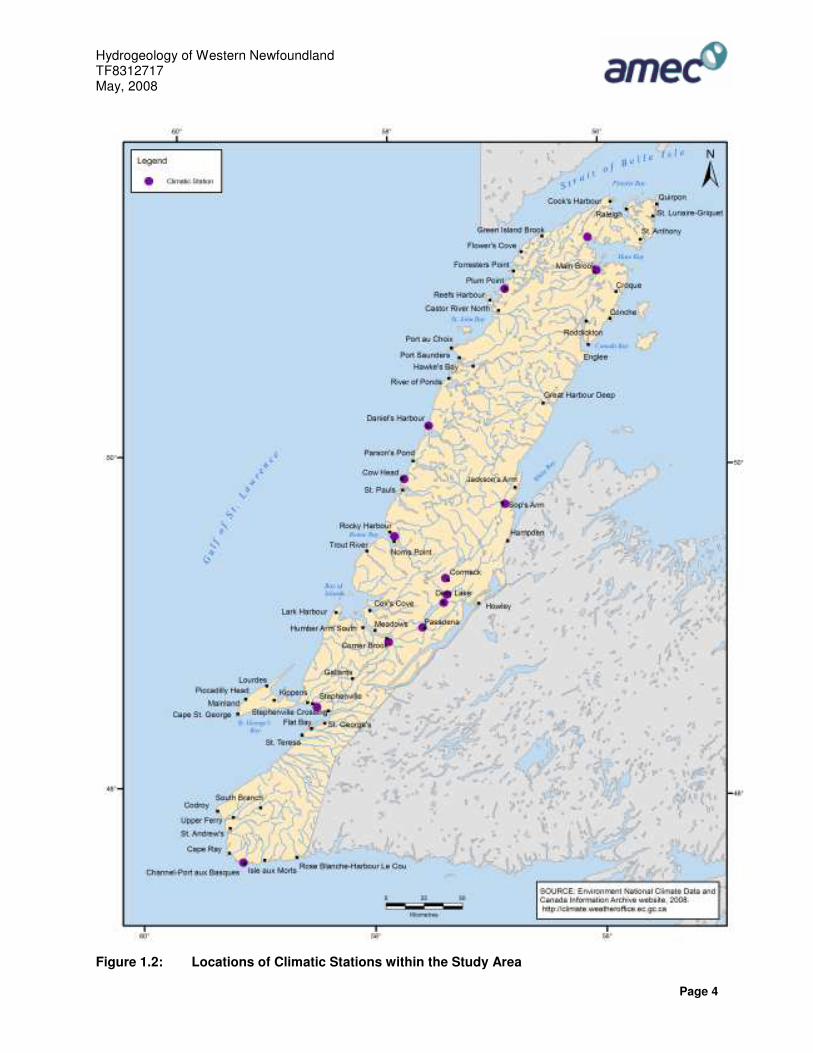
1.3 SOURCES OF DATA The prime source of hydrogeological data for the study area is contained in “Water Well Data for Newfoundland and Labrador 1950-2001”. This is an extensive database containing information on 17,000 drilled wells in the province, pump tests, and some material on previous well simulations provided by the Groundwater Section of Water Resources Management Division. However, regulations regarding the submission of detailed data by drilling contractors did not exist until 1983; therefore these data are commonly incomplete. Available data since 2001 were obtained from open file records at the DOEC. A number of geological, environmental and geotechnical studies have been conducted by consulting engineers for government and private agencies. These reports provided background information on bedrock geology, surficial geology, hydrogeology, physiography, hydrology, water quality, and spring usage throughout the study area. Climate normals or averages were used to summarize the average climatic conditions of the study area. They were obtained from the National Climate Data and Information Archive website (http://climate.weatheroffice.ec.gc.ca, 2008) operated and maintained by Environment Canada. At the completion of each decade, Environment Canada updates its climate normals for as many locations and as many climate characteristics as possible. The climate normals used in this study are based on climate stations with at least 15 years of data between 1971 and 2000. Streamflow records were obtained from the National Water Data Archive provided by Environment Canada, Water Survey Branch. The data from existing gauging stations in the study area were used to assist in interpreting the groundwater contribution to streamflow and the annual rate of groundwater recharge from precipitation. Existing water quality data used for assessing the chemical character of groundwater resources were extracted from public water supply testing results provided by the DOEC. These data were also used to help identify areas that are potentially prone to salt water intrusion and other potential pollution problems throughout the study area. All referenced reports and other sources of data used in this study are documented in the List of References in Section 9.0 of this report. 1.4 CLIMATE Data on climatic normals including temperature and precipitation were obtained from Environment Canada (Environment Canada, 2008). There are 14 active climate station locations within the study area which are shown in Figure 1.2. 1.4.1 Temperature Air temperature varies across the study area and is influenced by latitude, distance from the ocean, prevailing winds, and season. The monthly and annual mean daily temperatures for the 14 climate stations in the study area are provided in Table 1.1.
Hydrogeology of Western Newfoundland TF8312717 May, 2008
Page 4
Figure 1.2: Locations of Climatic Stations within the Study Area
Hydrogeology of Western Newfoundland TF8312717 May, 2008
Page 5
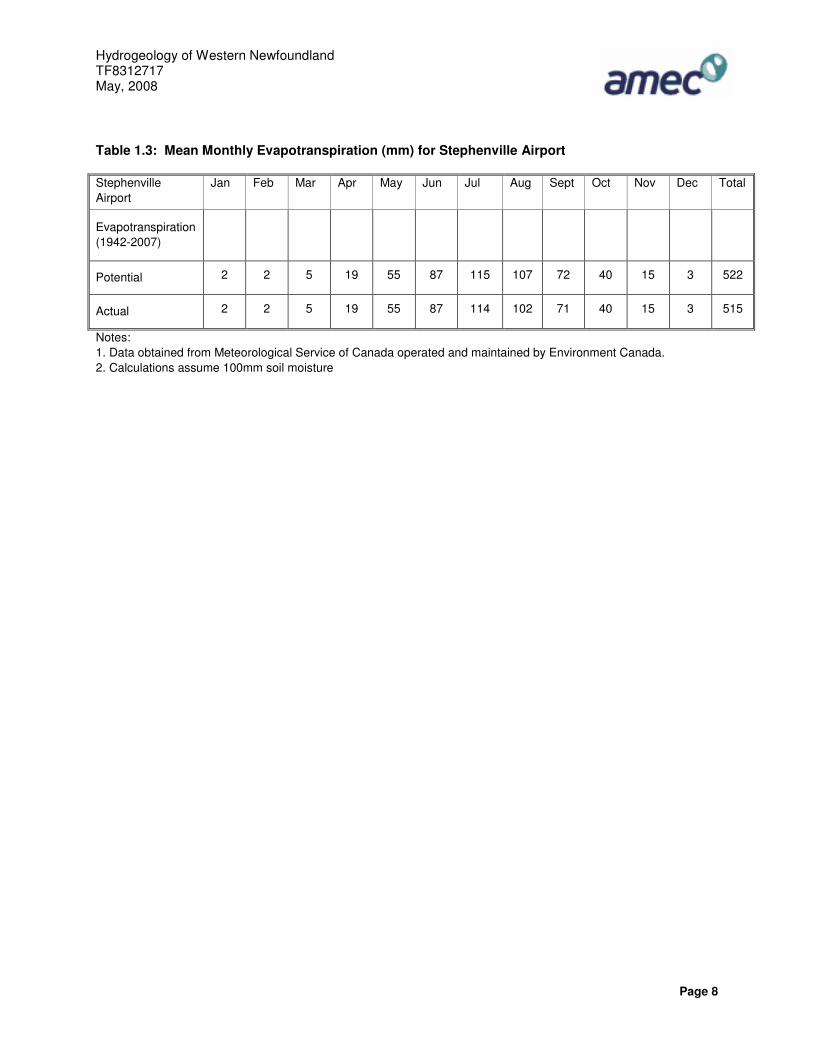
In general, mean annual temperatures in the study area decrease to the north with St. Anthony station reporting the lowest mean annual temperature at 0.4°C and the lowest monthly average temperature of -11.7°C in February. The cold temperatures on the Northern Peninsula are intensified by the northerly Labrador Current, a near-freezing stream of polar water. Pack ice typically persists in the North Peninsula until July and iceberg drift occurs throughout the summer. The warmest mean annual and monthly temperatures in the study area are reported from the Corner Brook station at 5.1°C, and 17.3°C for July, respectively. Marine influence from the Gulf of St. Lawrence helps to moderate temperature extremes. 1.4.2 Precipitation The monthly mean precipitation normals for the 14 climatic stations in the study area are provided in Table 1.2. The area receives an annual precipitation ranging from approximately 958.7 mm in Sop’s Arm to 1569.9 mm in Port aux Basques. Precipitation is generally greatest during the fall and early winter months and lowest in the spring or early summer months. A reduced precipitation trend occurs over the Northern Peninsula. Moisture arrives on southerly winds and the area that lies in the lee of the Long Range Mountains receives relatively lower amounts of precipitation. The high precipitation recorded for Port aux Basques (1569.6 mm) is in response to the marine climatic conditions which prevail along the south coast. Pasadena, which is somewhat sheltered and removed from the threat of coastal sea fogs and low cloud, receives a relatively lower mean annual precipitation of 968.6 mm. Precipitation is discussed in further detail in Section 5.2. 1.4.3 Evapotranspiration Evaporation is broadly divided into two main categories: evaporation and evapotranspiration. Evaporation, or lake evaporation, is the water that evaporates due to solar radiation, mild to hot temperatures, and wind. Evapotranspiration is the combination of evaporation and the transpiration that occurs from trees and plants. The proportion of precipitation that is available for direct runoff or recharge is dependant on the amount of evapotranspiration. Calculations have been made by Environment Canada for the Stephenville Airport climate station to evaluate potential and actual evapotranspiration. Potential evapotranspiration is the amount of water that would evaporate and transpire with optimum water availability, whereas actual evapostranspiration is the amount of water that evaporated and transpired, which is dependent on the seasonal availability of precipitation and soil moisture. Monthly potential and actual evapotranspiration for Stephenville Airport is shown in Table 1.3. The calculations assume 100 mm of soil moisture, which is defined as the amount of water held in place after excess gravitational water has drained. These data illustrate the abundant seasonal availability of water, with soil moisture depletion occurring only during the period extending from July to September. In total, an average of 515 mm of precipitation is lost to evapotranspiration at the Stephenville Airport per year.
Hydrogeology of Western Newfoundland TF8312717 May, 2008
Page 6
Table 1.1: Monthly Mean Daily Temperatures (°C) for 14 Climate Stations Within the Study Area
Station Code1 Jan Feb Mar Apr May June July Aug Sept Oct Nov Dec
Mean
Annual
Cormack C -8.9 -9.5 -5.1 1.0 6.4 11.4 15.3 15.1 10.8 5.1 -0.2 -5.4 3.0
Corner
Brook A -6.1 -7.2 -3.0 2.7 7.7 13.1 17.3 16.9 12.7 7.2 2.3 -2.8 5.1
Cow Head D -7.3 -8.3 -4.6 1.4 6.1 10.4 14.7 15.5 11.8 6.6 1.6 -3.6 3.7
Daniel's
Harbour A -8.4 -9.6 -5.4 0.6 5.1 9.8 14.0 14.3 10.8 5.7 0.9 -4.7 2.8
Deer Lake A -7.6 -8.8 -4.1 1.7 7.1 12.3 16.5 16.1 11.7 6.2 1.3 -4.1 4.0
Deer Lake
Airport A -8.9 -9.8 -5.0 1.4 6.9 12.0 16.1 15.4 10.9 5.3 0.5 -5.4 3.3
Main Brook D -11.5
-
11.6 -6.5 -0.3 5.0 9.9 14.0 14.5 10.4 4.6 -0.9 -6.9 1.7
Plum Point A -10.2
-
10.8 -6.2 -0.2 4.8 9.6 13.9 14.3 10.6 5.1 0.2 -5.7 2.1
Port aux
Basques A -5.2 -6.4 -3.5 1.0 5.2 9.5 13.7 15.0 11.6 7.0 2.6 -2.2 4.0
Rocky
Harbour C -7.5 -8.9 -4.8 1.6 6.4 11.3 15.4 15.2 11.4 6.0 1.2 -4.3 3.6
Pasadena D -7.2 -8.7 -3.8 2.4 7.5 12.4 16.4 16.5 12.1 6.6 1.5 -3.3 4.4
Sops Arm
White Bay C -7.9 -8.4 -4.1 1.4 5.9 10.7 15.3 15.5 11.5 5.9 1.2 -4.3 3.5
St. Anthony A -11.6
-
11.7 -7.1 -1.9 2.7 7.5 12.4 12.4 8.5 3.3 -1.7 -7.6 0.4
Stephenville
Airport A -6.2 -7.5 -3.6 2.3 7.4 12.0 16.1 16.2 12.2 6.9 2.3 -3.0 4.6
Notes: 1. The minimum number of years used to calculate normals are indicated by a "code" defined as:
• "A": No more than 3 consecutive or 5 total missing years between 1971 to 2000. • "B": At least 25 years of record between 1971 and 2000. • "C": At least 20 years of record between 1971 and 2000. • "D": At least 15 years of record between 1971 and 2000.
2. Data obtained from National Climate Data and Information Archive website operated and maintained by Environment Canada (Environment Canada, 2008).
Hydrogeology of Western Newfoundland TF8312717 May, 2008
Page 7
Table 1.2: Monthly Mean Total Precipitation (mm) for 14 Climate Stations Within the Study Area
Station Code1 Jan Feb Mar Apr May June July Aug Sept Oct Nov Dec
Mean
Annual
Cormack C 104.4 77.2 73.3 76.2 101.4 104.4 112.5 129.1 121.6 124.0 123.0 107.8 1254.9
Corner
Brook A 148.3 99.3 95.8 70.7 77.5 84.1 91.0 98.6 104.3 123.6 125.7 151.9 1270.8
Cow Head D 130.9 89.4 75.7 67.9 91.3 116.1 100.3 109.5 110.7 112.2 101.6 105.4 1211.0
Daniel's
Harbour A 113.1 85.3 88.3 62.3 77.3 105.3 105.5 117.5 101.5 111.3 111.2 100.3 1178.9
Deer Lake A 107.5 72.7 78.2 72.6 85.1 87.4 95.8 105.3 102.3 114.8 106.7 98.8 1127.2
Deer Lake
Airport A 108.2 77.6 76.3 68.8 72.9 80.3 91.6 100.0 96.2 100.0 97.5 109.5 1078.9
Main Brook D 136.9 136.4 89.4 71.2 78.9 104.5 104.3 98.9 87.4 106.6 97.5 135.0 1247.0
Plum Point A 120.2 86.7 96.2 77.6 81.1 104.6 108.2 112.0 107.9 108.9 99.1 108.7 1211.2
Port aux
Basques A 146.4 115.1 113.9 126.5 128.2 114.1 115.3 114.2 123.1 150.5 147.6 174.7 1569.6
Rocky
Harbour C 145.5 97.0 97.3 66.4 73.7 105.3 99.6 110.5 112.1 134.7 132.3 142.0 1316.4
Pasadena D 82.2 58.5 57.0 63.8 68.9 79.1 83.2 105.6 99.6 105.6 84.5 80.6 968.6
Sops Arm
White Bay C 82.6 68.3 60.2 58.3 70.5 78.9 79.6 95.9 90.8 96.9 91.8 84.9 958.7
St. Anthony A 106.8 89.5 100.6 86.9 88.5 113.7 104.2 120.4 126.3 117.2 119.2 124.4 1297.7
Stephenville
Airport A 134.5 102.1 93.7 75.6 98.1 102.3 117.4 122.8 128.0 130.2 120.7 126.7 1352.1
Notes: 1. The minimum number of years used to calculate normals are indicated by a "code" defined as:
• "A": No more than 3 consecutive or 5 total missing years between 1971 to 2000. • "B": At least 25 years of record between 1971 and 2000. • "C": At least 20 years of record between 1971 and 2000. • "D": At least 15 years of record between 1971 and 2000.
2. Data obtained from National Climate Data and Information Archive website operated and maintained by Environment Canada (Environment Canada, 2008).
Hydrogeology of Western Newfoundland TF8312717 May, 2008
Page 8
Table 1.3: Mean Monthly Evapotranspiration (mm) for Stephenville Airport
Stephenville Airport
Jan Feb Mar Apr May Jun Jul Aug Sept Oct Nov Dec Total
Evapotranspiration (1942-2007)
Potential 2 2 5 19 55 87 115 107 72 40 15 3 522
Actual 2 2 5 19 55 87 114 102 71 40 15 3 515
Notes: 1. Data obtained from Meteorological Service of Canada operated and maintained by Environment Canada. 2. Calculations assume 100mm soil moisture

Hydrogeology of Western Newfoundland TF8312717 May, 2008
Page 9
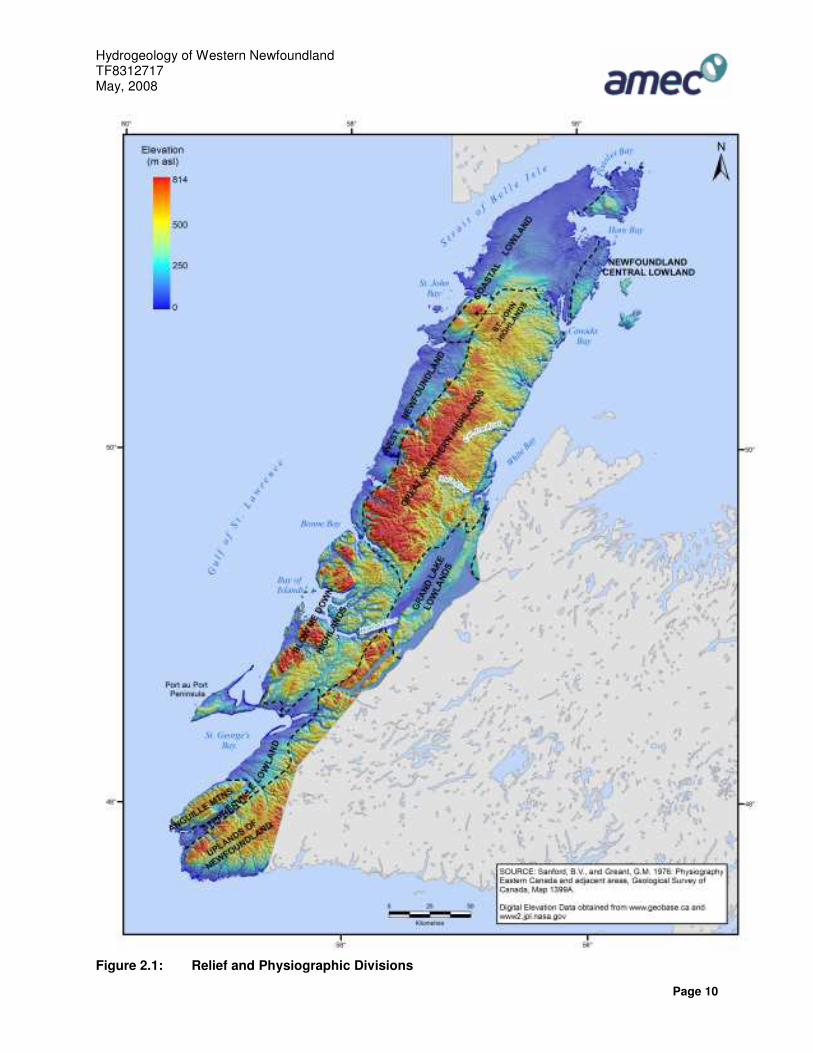
1.5 POPULATION Census data for 2001 and 2006 (Statistics Canada, 2008) are included in Appendix I for those communities within the study area. The data indicate a population of approximately 72,654 located in 59 communities compared to a population of 75,163 in 2001. The majority of the population is distributed in the centers of Corner Brook (20,083), Stephenville (6,588), Deer Lake (4,827), Channel/Port aux Basques (4,319), Pasadena (3,180), and St. Anthony (2,467). The remainder of the population is distributed in smaller communities which range in population from 54 (Gallants) to 1,960 (Stephenville Crossing). Most communities exhibited a decrease in population during the period of 2001 to 2006 which ranges from -0.1% (Corner Brook) to -50% (Bird Cove). However, the communities of Deer Lake, Hughes Brook, Irishtown-Summerside, Massey Drive, Mount Moriah, Pasadena, Reidville, Sally’s Cove and Steady Brook show a growth in population of 1.2%, 4.8%, 3%, 51.9%, 7.4%, 1.5%, 3.2%, 70.3% and 10.4%, respectively. 2.0 PHYSIOGRAPHY 2.1 TOPOGRAPHY AND TERRAIN Western Newfoundland belongs to the Appalachian Physiographic Region and is an assortment of 8 differentiated areas of highlands, uplands and lowlands. Figure 2.1 presents the physiographic divisions and the shaded relief of the study area. Names of the major divisions are according to Sanford and Grant (1976). 2.1.1 Great Northern Highlands The Great Northern Highlands form the bulk of the Great Northern Peninsula. They include the Long Range Mountains and a small appendage, Highlands of St. John (Grant, 1992). The mountains form a roughly rectangular high-standing block, which rises westward from 300 m above sea level (asl) to 500 m asl (Grant, 1992). The coastline is generally very rugged and highly indented with deep harbors, while the interior consists of an elevated, undulating plateau which generally tilts towards the northeast (Acres, 1990). The plateau has a rolling relief of 100 m on Precambrian rocks, mainly granitic gneisses. The surface is glacially scoured. Inland, the surface of the highlands slopes gently southeastward towards White Bay and the Humber River Valley. The poorly developed drainage courses formed by the Upper Humber River, Cat Arm River and Main River also tend to follow this slope, flowing southeastward. 2.1.2 West Newfoundland Coastal Lowland The West Newfoundland Coastal Lowland, from Canada Bay to Bonne Bay, generally lies below 50 - 70 m elevation and has a local relief of less than 10 m (Grant, 1994). The lowland is underlain by gently inclined dolomite and limestone of the St. George and Table Head groups, and sandstone and quartzite of the Bradore and Hawke Bay formations. The carbonate rocks form a variety of solution features, including extensive karst depressions and disappearing lakes. Bedrock is thickly buried beneath marine and glacial deposits. The drainage patterns are poorly developed and vegetation is scrubby and sparse, except in lowland sheltered areas.
Hydrogeology of Western Newfoundland TF8312717 May, 2008
Page 10
Figure 2.1: Relief and Physiographic Divisions
Hydrogeology of Western Newfoundland TF8312717 May, 2008
Page 11
2.1.3 Newfoundland Central Lowland The Newfoundland Central Lowland in the study area is situated in the northeast coast of the Northern Peninsula. This region is flat or gently rolling, with almost all elevations less than 150 m (Grant, 1994). The terrain consists of glacially smoothed bedrock covered with bouldery till and irregular lakes, and drainage is poorly developed. 2.1.4 Grand Lake Lowlands The Grand Lake Lowlands, situated in the eastern portion of the study area, includes the Humber Valley area consisting largely of a northeast-southwest trending trough, in which lie Deer Lake, Grand Lake and Sandy Lake. The Humber River drains most of the area. The region supports extensive forest stands, particularly on the gentle slopes of the major watersheds, and thick overburden is found in many areas (Batterson, 2003). 2.1.5 Blow-Me-Down Highlands The Blow-Me-Down Highlands include the northwest trending Indian Head Range and Table Mountains, with elevations varying from 345 m asl to 555 m asl, respectively (Acres, 1990). The maximum elevation of 814 m asl in the Lewis Hills with elevations decreasing to the north and south (Batterson, 2003). The Lewis Hills are bordered in places by a narrow, well-forested coastal plain and are commonly penetrated by glacially deepened valleys and by several large fjords, the largest of which are the Bay of Islands and Bonne Bay. Drainage from the highlands is poorly developed and flows westward to the Gulf of St. Lawrence via numerous small brooks. 2.1.6 Uplands of Newfoundland The south-eastern portion of the study area is comprised of the remote regions of the Uplands of Newfoundland, comprised of the Long Range Mountains and the Cabot Fault Escarpment. The mountains rise from 450 m asl to 650 m asl and are harsh, uninhabited barrens consisting predominantly of exposed bedrock, bog and tundra vegetation. The western slopes of the Long Range Mountains are steeply dissected by glacial valleys that form the headwaters of several rivers (Acres, 1994). 2.1.7 Stephenville Lowlands The Stephenville Lowlands consist of the coastal plain west of the Long Range Mountains. This physiographic unit includes the Port au Port Peninsula, Stephenville area, St. George’s Bay Lowland and Codroy Lowlands. The Port au Port Peninsula protrudes 40 km into the Gulf of St. Lawerence (Acres, 1994). The undulating terrain varies from 50 m asl to 150 m asl throughout much of the area. The limestone ridges to the south rise to 350 m asl. The Stephenville area is largely a sand and gravel plain while the St. George’s Lowlands form an undulating till plain (Acres, 1994). The Codroy Lowlands form a relatively level plain extending 40 km northeastward from the coast. The Grand Codroy River is the major drainage feature in the area. 2.1.8 Anguille Mountains The southwest coastal portion of the study area is comprised of the Anguille Mountains. The mountains form a range approximately 50 km long and 8 km to 15 km inland from the gulf of St. Lawerence. The mountains strike northeast to southwest, parallel to the coastline, and form
Hydrogeology of Western Newfoundland TF8312717 May, 2008
Page 12
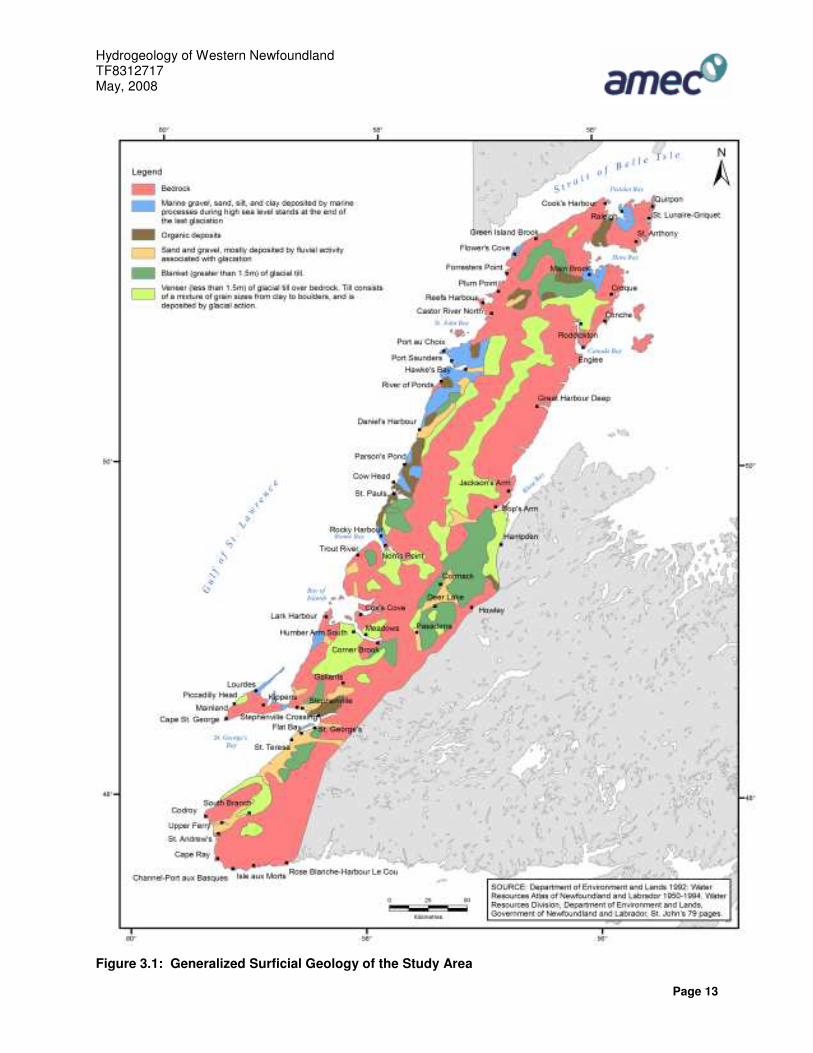
rugged barren plateaus with level crests, varying in elevation from 400 m asl to 536 m asl (Acres, 1994). Drainage patterns are poorly developed. 3.0 GEOLOGY 3.1 SURFICIAL GEOLOGY The surficial geology of Western Newfoundland was obtained from Liverman and Taylor (1990) and has been compiled at a scale of 1:250,000 on Map 1 accompanying this report. Figure 3.1 presents the generalized surficial geology of the study area at a scale of 1:1,000,000 (DOEL, 1992). The surficial geology is dominated by the effects of the last glaciation, the late Wisconsnian, which occurred between 25,000 and 10,000 years ago. For the purposes of this study, the surficial geology units represented have been simplified into five subdivisions. These subdivisions include;
• bedrock, • till, • sand and gravel, • marine diamicton, gravel, sand and silt, and; • organic deposits.
Hydrogeology of Western Newfoundland TF8312717 May, 2008
Page 13
Figure 3.1: Generalized Surficial Geology of the Study Area
Hydrogeology of Western Newfoundland TF8312717 May, 2008
Page 14
3.1.1 Bedrock Bedrock is the most common surficial unit across the study area. The bedrock may be exposed or partially concealed in places by vegetation including scrub or peat bog. It is characterized by a glacially scoured surface with deranged drainage systems, numerous lakes and ponds, rugged hummocky to hilly topography with numerous cliffs and glacial erosional forms (Grant, 1994). Areas of exposed bedrock form extensive rock plains, knobs and ridges throughout much of the study area. Much of the area of the highlands of the Long Range Mountains and the Anguille Mountains are comprised largely of exposed bedrock with rock talus or colluvium occurring on the mountain slopes. 3.1.2 Till The most common depositional product of retreating glaciers was till, a poorly sorted generally well compacted sediment containing a mixture of grain sizes ranging from clays to boulders. Till deposits are found throughout the study area as both a thin surficial veneer (<1.5m) cover over bedrock, and as more extensive deposits commonly in the lowland areas (Batterson, 2003). The composition of the tills closely reflects the lithology of the underlying bedrock. Consequently, the tills within the Long Range Mountains are comprised of grey, silty sand or sandy silt derived from the underlying granitic and metamorphic terrain. Tills within the Humber River Valley are comprised of red clayey silt derived from the underlying red siltstones of the Carboniferous strata. Tills overlying areas of limestone and shale, such as on the Port au Port Peninsula and the western portion of the Great Northern Peninsula, tend to be finer grained having a silty composition with higher proportions of clay. The most extensive deposits of till within the study area occur within the Upper Humber River Valley north of Deer Lake and on the tip of the Northern Peninsula. 3.1.3 Sand and Gravel Within the study area, sand and gravel deposits of glacial outwash and fluvial origin are generally confined to stream and river valleys. They are composed of varying proportions of sand and gravel (~30 to 70% gravel, Batterson, 2003), with less than 5% silt or clay. They consist of poorly to well-sorted gravel, containing subrounded to rounded clasts up to boulder size in a medium to coarse-sand matrix (Batterson, 2003). Although not extensive, these deposits are fairly widespread and in many instances occur in the vicinity of established communities. Major areas of sand and gravel deposits are located in the Deer Lake and Upper Humber River Valley, the Codroy Valley and around St. George’s Bay. 3.1.4 Marine Diamicton, Gravel, Sand and Silt This unit varies in composition, and is recognized by its topographic position relative to the modern sea level (Liverman et al., 1990). The distribution of this unit is controlled by the amount of isostatic rebound (postglacial uplift of land depressed by the weight of overlying ice) and is found adjacent to the present coastline at elevations up to 75 m asl (Liverman et al., 1990). The most common surficial sediment within this unit is moderate to well sorted gravel and sand found in marine terraces.

Hydrogeology of Western Newfoundland TF8312717 May, 2008
Page 15
The most extensive deposits of marine diamicton, gravel, sand and silt within the study area occur along the western coastline of the Northern Peninsula. 3.1.5 Organic Deposits This unit consists of aggraded and degraded organic matter. It is 1 to 10 m thick, and preserved in low-lying, water-saturated, poorly drained areas (Liverman et al., 1990). It forms either by growth of wetland vegetation in place, or by progressive filling of lakes and ponds. As one progresses from northern Newfoundland to the more southerly regions of western Newfoundland the characteristics of bogs change significantly. Numerous large freshwater pools characterize the bogs of the Northern Peninsula. In the southern region, pools become smaller and fewer (South, 1983). On flat, coastal areas, such as the coastal lowlands, extensive plateau bogs occur and are commonly underlain by marine sediments (South, 1983). Organic deposits are quite common throughout the study area but occur to a lesser extent in the highland plateau areas of the Long Range Mountains. 3.2 BEDROCK GEOLOGY For the purposes of this study, the geology is discussed mainly in terms of the lithology and distribution of the various rock strata. The bedrock geology of western Newfoundland was obtained from Colman-Sadd and Crisby-Whittle (2005) and has been compiled at a scale of 1:250,000, as illustrated on Map 2 accompanying this report. Figure 3.2 presents the generalized bedrock geology at a scale of 1:1,000,000. 3.2.1 Introduction The island of Newfoundland is the northeast extremity of a chain of deformed and elevated rocks called the Appalachian Orogen. The Appalachian Orogen evolved through a cycle of ocean opening, beginning 600 million years ago (Ma), then ocean closing ending with continental collision at 300 Ma. The geologic divisions of Newfoundland record the development of the margins and oceanic tract of this ocean, called Iapetus. From west to east, these divisions are called the Humber Zone, Dunnage Zone, Gander Zone, and Avalon Zone (Williams, 1979). The Humber Zone represents the ancient continental margin of eastern North America or the western margin of Iapetus. The Dunnage Zone represents remnants of Iapetus, the Gander Zone represents the eastern margin of Iapetus, and the Avalon Zone originated somewhere east of Iapetus and is of African affinity (Williams, 1979). The study area consists primarily of the Humber Zone, but also contains small sections of the Dunnage and Gander Zones in the southwest portion of the study area. The study area consists mainly of Grenvillian age (~ 1000 Ma) basement rocks overlain by platformal sequences of clastic and carbonate rocks, as well as allochthonous sedimentary and ophiolitic rocks (Howse, 2004). Major linear fault systems traverse the study area in a southwest northeast direction.
Hydrogeology of Western Newfoundland TF8312717 May, 2008
Page 16
3.2.2 Grenville Basement Rocks The oldest units in the Humber Zone are Grenvillian age crystalline rocks associated with the Long Range Inlier (Great Northern Peninsula) and the much smaller Indian Head Range near Stephenville (Map 1). These units form the basement upon which unconformable Paleozoic sediments lie (Waldron et al., 1994). Strata within this subdivision comprise Late Precambrian, granitic and metasedimentary gneisses, plus anorthositic and gabbroic intrusions of the Long Range Complex. Due to the resistant nature of the Long Range Complex, it still forms much of the highland area of the Long Range Mountains. 3.2.3 Rift Rocks The rocks and structures of the Humber Zone fit the model of an evolving continental margin and spreading Iapetus Ocean. This began with rifting of existing continental crust dated at 600 to 550 Ma. The rifting is evidenced by liquid injections that filled cracks in the older crust and fed volcanic eruptions. It also led to deposition of coarse fragmental sedimentary rocks. This rifting episode is represented in the study area by the Labrador Group and the Fleur de Lys Supergroup. They are found on the highlands of the Northern Peninsula, between Grand Lake and the Lower Humber River, and east of the Anguille Mountains. The Labrador Group unconformably overlies the gneissic rocks of the Long Range Complex, represented by the St. George unconformity (Knight et al., 1991). The group is composed of one volcanic unit (Lighthouse Cove Formation), and three sedimentary units (Bradore, Forteau and Hawke Bay formations). It is comprised of slate, phyllite, quartzite, sandstone, and thin bedded carbonates of Cambrian age. The Fleur de Lys Supergroup is comprised of Late Precambrain to Cambrain age pelitic and psammitic schists, plus minor marble. The Fleur de Lys rocks represent an eastward facing, clastic wedge that developed on the Late Precambrian continental margin of western Newfoundland.

Hydrogeology of Western Newfoundland TF8312717 May, 2008
Page 17
Figure 3.2: Generalized Bedrock Geology of the Study Area

Hydrogeology of Western Newfoundland TF8312717 May, 2008
Page 18
3.2.4 Cambro-Ordovician Autochthonous Shelf Rocks The rifting of continental crust was followed by the development of a passive continental shelf with mainly limestone deposition and continental slope/rise deposits. This lasted for about 100 million years. Autochthonous Cambro-Ordovician platformal rocks of western Newfoundland can be traced for over 400 km, i.e., from the Port au Port Peninsula, north to the tip of the Great Northern Peninsula. The Middle Cambrian to Middle Ordovician carbonate dominated shelf succession is dominated by the Port au Port Group, St. George Group, Table Head Group, and the Goose Tickle Group. The Port au Port Group consists of Middle to Upper Cambrian carbonate of the March Point, Petit Jardin and Berry Head formations. The March Point Formation rests conformably upon the Hawke Bay Formation (of the Labrador Group). The formation consists of thinly bedded limestone and dolostone and represents a transgressive phase that terminated sand deposition (Cooper et al., 2001). The Petit Jardin Formation is dominated by dolomites with intercalated carbonates. The St. George Group is a complex succession of Lower Ordovician limestone and dolostone. The sequence is bounded by the Boat Harbour disconformity at its base and by the St. George Unconformity at the top of the sequence. It comprises the Watts Bight, Boat Harbour, Catoche and Aquathuna formations (Knight, 2007). The Watts Bight Formation comprises dark gray to black crystalline limestone. The Boat Harbour Formation is a weathered, poorly exposed unit of fine grained limestone and dolostone. The Catoche Formation comprises limestone and is well exposed along the western shore of the Port au Choix Peninsula. The Aguathuna Formation is a unit of carbonate that is mapped throughout the autochthon portion of western Newfoundland (Knight, 2007). The development of karst topography is significant within this group, as noted by the presence various small lakes and ponds, with internal drainage, and the occurrence of disappearing watercourses (Batterson, 2001). The St. George unconformity (Knight et al., 1991) was followed by rapid subsidence recorded in the deposition of Middle Ordovician carbonates and shales of the Table Head Group (Waldron et al., 1994). The Table Head Group comprises the Table Point, Table Cove, Black Cove and Cape Cormorant formations. The Table Head Group is disconformably to locally conformably overlain by basinal shale and flysch of the Goose Tickle Group (Knight et al., 2007). The Goose Tickle Group completes the autochthonous succession in the study area. It is a Taconic flysch unit dominated by black shale of the Black Cove Formation, and overlying green grey, turbiditic sandstones and dark grey shales of the American Tickle Formation (Knight et al., 2007). Flysch deposition ceased with the emplacement of rocks of the Cow Head Group and its equivalents during the Middle Ordovician. 3.2.5 Cambro-Ordovician Allochthonous Rocks The next phase of platformal succession involved the abduction of oceanic sediment and lithosphere onto the platform during the Taconic orogeny. These tectonically transported rocks occur in a series of stacked thrust sheets within the Humber Arm Allocthon (to the south) and the Hare Bay and Southern Arm Allochthons (to the north). These transported rocks are, in turn, structurally overlain by slabs of oceanic crust and mantle (ophiolites).

Hydrogeology of Western Newfoundland TF8312717 May, 2008
Page 19
The Humber Arm Allochthon (Humber Arm Supergroup) contains deepwater facies of the Cow Head Succession, Curling and Northern Head groups, Old Man’s Pond Group and Maiden Point Formation (Cooper et al., 2001). Lithologically, these groups contain limestone, limestone conglomerate, limestone breccia and shale with minor sandstone and conglomerate horizons. The deformed sedimentary rocks of the Humber Arm Allocthon are tectonically overlain by ophiolitic rocks and are in tectonic contact above Middle Ordovician foreland basinal sediments of the Goose Tickle and Table Head groups. The Southern Bay Allochthon is located west of White Bay and is interpreted as a composite Taconic allochthon similar to those of the Humber Arm - Bonne Bay region. The Southern White Bay allochthon is comprised of a tract of sedimentary and igneous rocks of Cambrian and Ordovician age, which include graphitic schists and mélanges (Kerr et al., 2004). This package of rocks is interpreted to have once overlain the autochthonous Cambrian and Ordovician sedimentary rocks. The allochthon comprises several fault bounded slices, separated by mélanges (Kerr et al., 2004). The Hare Bay allocthon, located on the northern tip of the Great Northern Peninsula, consists of deep to shallow water sediments of the Maiden Point Formation, volcanics of the Cape Onion Formation and an ophiolite suite known as the St. Anthony Complex (Grant, 1992). The resistant sandstone and volcanic rocks rise to 160 to 200 m asl along a meandering fault scarp east of the platformal terrane.
3.2.5.1 Ophiolitic Rocks The ophiolite complexes of Western Newfoundland represent slabs of ancient Cambrian age ocean crust composed of a basal ultramafic sequence of peridototes, dunites and pyroxenites overlain by a mafic sequence of gabbro and diabase. Pillow basalts form the top layer of the ophiolite complexes and represent ocean floor volcanics. The ultramafic rocks within these complexes tend to be serpentinized, and asbestos mineralization is common locally (Cooper et al., 2001) The Bay of Islands ophiolite complex forms the large barren mountains located along the west coast from Table Mountain near Bonne Bay, south to Blow me Down Mountain and the Lewis Hills. The ophiolite complex is a klippe, which was structurally emplaced onto the continental platform by westward faulting. The St. Anthony Complex is an ophiolite suite that is located north of Hare Bay. 3.2.6 Carboniferous Sedimentary Rocks The youngest preserved sediments in the study area are the Carboniferous strata of the Anguille, Deer Lake, Codroy and Barachois groups. The culmination of mountain building in Western Newfoundland during the Devonian period and subsequent erosion resulted in the deposition of sedimentary strata within the Deer Lake Basin. This basin underlies Deer Lake, Grand Lake, Sandy Lake and the Upper Humber River Valley. The strata within the Deer Lake Basin have been gently folded and faulted and have been stratigraphically subdivided into two groups: the Anguille Group and the unconformably overlying Deer Lake Group (Batterson, 2003). The Anguille Group is comprised of well
Hydrogeology of Western Newfoundland TF8312717 May, 2008
Page 20
cemented, grey coloured conglomerate, sandstone, siltstone and mudstone. The overlying Deer Lake Group is comprised of red and grey coloured conglomerate, sandstone, siltstone, mudstone, shale and minor coal beds. The Codroy Group consists of finer grained siltstones and sandstones, which are less resistant to weathering than the sandstones of the underlying Anguille Group. Consequently, rocks of the Codroy group underlie much of the lowland areas, including the St. George’s Lowlands north of the Anguille Mountains, the Codroy Lowlands to the southeast and several smaller areas within the Port au Port and Stephenville areas. The total thickness of the strata is in the order of 4,000 m to 6,000 m, including both marine and non-marine clastic, evaporitic and calcareous rocks (Golder, 1985) Some of the evaporite sequences near the ground surface have undergone significant dissolution creating karst topography (Batterson, 2003). The Barachois Group is the youngest sequence in the St. George’s sub-basin and consists primarily of a thick succession of grey sandstone, red siltstone, grey to black mudstone, shale and some coal. The strata range in thickness from 1500 m to 2500 m (Golder, 1985). The major areas of occurrence are in the Codroy Lowlands adjacent to the coast and the areas underlying Stephenville. 3.2.7 Intrusive Rocks Most of the intrusive rocks in the study area are granite, but there are also gabbro, diorite and anorthosite plutons. They vary in age from Grenvillian to Carboniferous and occur throughout the study area. The following section describes some of the more major intrusions within the study area. The Ordovician Cape Ray and Red Rocks Granites occur northwest of the Cape Ray Fault where they intrude Precambrian gneisses of the Long Range Complex. Their composition ranges from granite to monzonite. (Golder, 1985) The Port aux Basques Granite, Silurian in age, occurs in a narrow northeast trending belt extending from Port aux Basques to the Cape Ray Fault. Deformation has resulted in the development of two distinct foliations associated with the fold structures (Golder, 1985). Rose Blanche Granite is a Silurian complex occurring largely in sheets within the Long Range gneissic complex and the Bay du Nord Group. It is recognized at Rose Blanche on the south coast and extends northward where it is truncated by the Cape Ray Fault. Its composition ranges from tonalite to granite. A moderate, well developed schistosity is characteristic of the rocks texture (Golder, 1985). The Strawberry Hill and Isle aux Morts Brook Granites occur as a linear northeast trending structure west of the Cape Ray fault and a small intrusion on the coast near Isle aux Morts, respectively. These Carboniferous units are predominantly porphyritic granites. The Lady Slipper pluton is in the internal domain of the Humber Zone. It is associated with Mesoproterozoic basement gneisses and an unconformable cover succession of quartz rich
Hydrogeology of Western Newfoundland TF8312717 May, 2008
Page 21
siliclastic rocks and pelites. It outcrops at the base of a thrust slice at the southern end of Corner Brook Lake, where it can be traced for about 1 km (Cawood et al., 2001). 3.2.8 Metamorphic rocks The Port aux Basques gneisses are located in the southern part of the study area, surrounding Port aux Basques (Figure 3.2). They comprise three lithostratigraphic units separated by major fault zones: the Grand Bay Complex; the Port aux Basques Complex; and the Harbor le Cou Group. They are intruded by large volumes of Middle Ordovician granitoids, e.g., the Margaree and Kelby Cove orthogneisses. 4.0 HYDROGEOLOGY The available water well records for the Western Newfoundland study area are summarized in tabular form in Appendix II. A total of 2,295 individual records of drilled wells were obtained for the study area from published (Department of Environment, 1950-2001) and unpublished DOEC water well records. Yield and depth data recorded by the drilling companies were not always consistent, resulting in information gaps (e.g., missing well depth, well yield, and/or lithology). Data on 439 surficial wells were reported, of which 416 provided well yield estimates, and 428 provided depths. Data on 1715 bedrock wells were reported, of which 1705 have well yield estimates, and 1677 provided depths. There were 141 water well records that could not be placed into a bedrock or surficial well category due to incomplete data (e.g., missing lithology, well depth, etc.). There are also numerous drilled or dug wells in the study area for which no records exists (Acres, 1992). 4.1 HYDROSTRATIGRAPHIC UNITS The starting point for any regional hydrogeological characterization study is to establish the hydrostratigraphy by identifying hydrostratigraphic units. The term hydrostratigraphic unit was first proposed by Maxey (1964) for “bodies of rock with considerable lateral extent that compose a geologic framework for a reasonably distinct hydrologic system”. Maxey (1964) identified the need to define the groundwater units that are based not solely on specific lithological characteristics but also included parameters “that apply especially to water movement, occurrence and storage.” An assessment of the potential groundwater yield of the geological strata within the study area was made by subdividing the unconsolidated surficial deposits and bedrock into hydrostratigraphic units. Each hydrostratigraphic unit was defined by considering strata with similar water bearing capabilities, which may include one formation or a group of formations. The water bearing potential was then quantified by assessing the reported well yields and depths from the records of wells completed within each unit. The yield and depth characteristics of surficial and bedrock hydrostratigraphic units are summarized in Tables 4.1 and 4.2, respectively. Mean and median values within these tables are probably slightly higher than recorded values due to 372 water well records that recorded 0.0 litres per minute (L/min) yields in the data, which are suspect. Well yields are generally classified as low, moderate or high for well potential classification. A low yield well will provide between 5 L/min to 25 L/min for usage. This is suitable for a single dwelling home (Acres, 1992). A moderate yield will provide between 25 L/min and 125 L/min for
Hydrogeology of Western Newfoundland TF8312717 May, 2008
Page 22
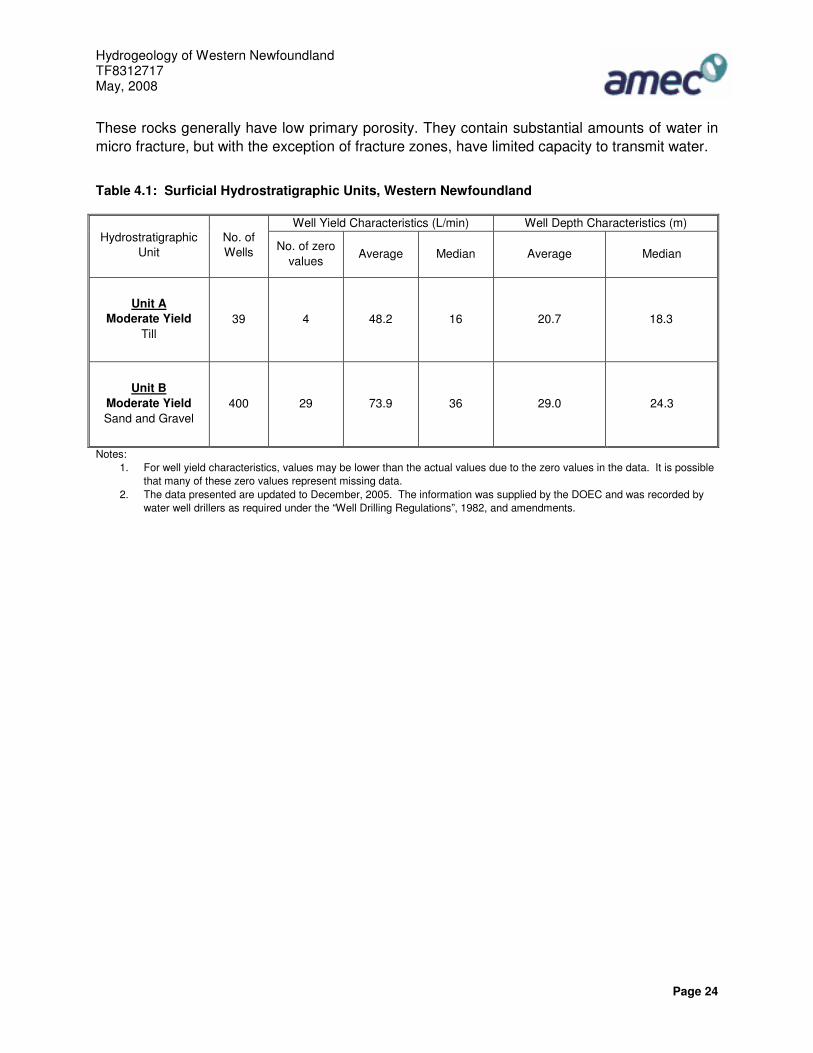
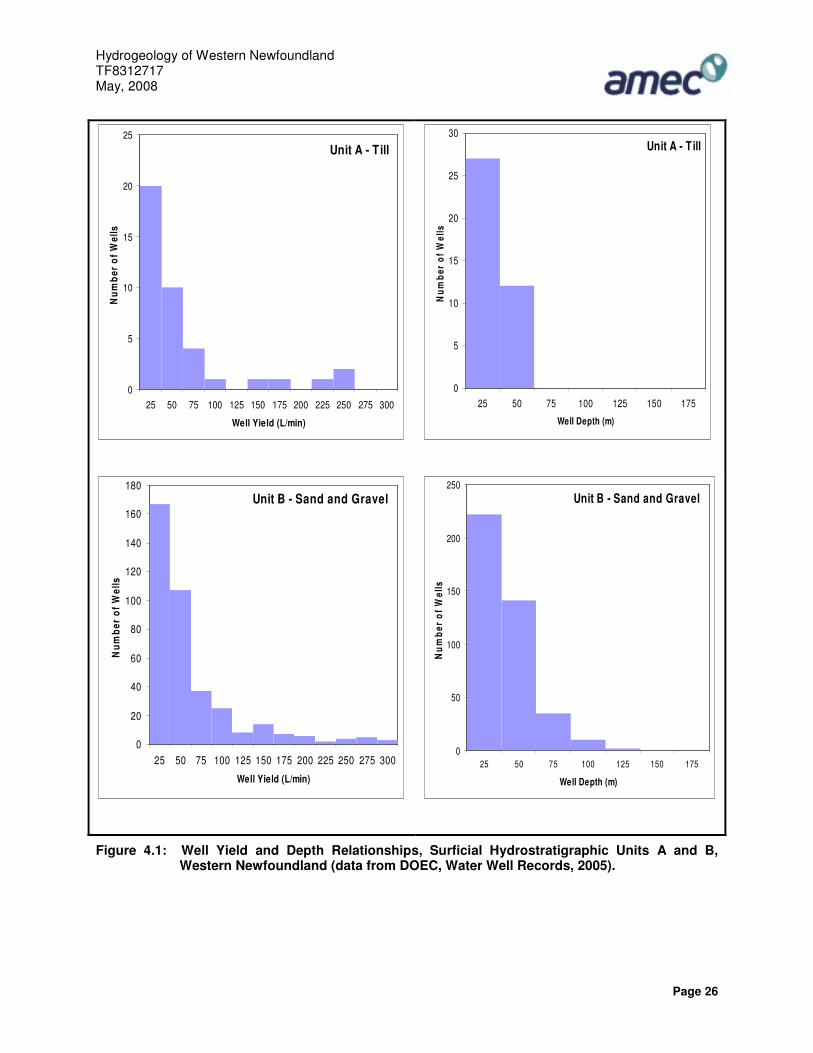
usage. This is suitable for all domestic uses and some commercial uses. A high yield well will provide greater than 125 L/min for usage (Acres, 1992) and can be used for domestic, industrial, commercial, or municipal needs. 4.1.1 Surficial Hydrostratigraphic Units Materials ranging in texture from fine sand to coarse gravel are capable of being developed into a water-supply well (Fetter, 1994). Material that is well sorted and free from silt and clay is best. The permeabilities of some deposits of unconsolidated sands and gravels are among the highest of any earth materials. Generally, till will have a low permeability (Fetter, 1994). A total of 439 water wells within the study area were drilled in surficial aquifers. The surficial deposits previously described in Section 3.1 were subdivided into two broad hydrostratigraphic units: Unit A consisting of till, and Unit B consisting of glacial outwash sands and gravels together with marine terraces. Identification of data for each unit was done by locating the community name and where the well is located on Map 1. The yield and depth characteristics of these units are summarized on Table 4.1. Histograms of yield and depth of wells completed in surficial hydrostratigraphic units are illustrated in Figure 4.1. The well yield characteristics were generally determined by either bailing or air blowing for a period of time considered sufficient by the driller (usually less than 2 hours). As such the reported yields for the various units within the study area do not represent precise pump test well yield characteristics.
4.1.1.1 Unit A – Till Deposits The till deposits form a thin veneer over much of the study area within stream valleys and on the flanks of bedrock hills. However, the thicker till deposits within the lowlands west of the Long Range Mountains are more frequently used as water sources (Acres, 1992). The composition of the tills varies from silty sand to clayey silt, generally representing materials of moderate to low permeability. However, the till deposits may be interbedded with sand and gravel, which produce greater groundwater yields. A total of 39 well records are available for Unit A. Well yields ranged from 0 L/min to 231.8 L/min and averaged 48.2 L/min. Well depth ranged from 9.1 meters (m) to 39.6 m and averaged 20.7 m. The available data indicate that, on average, wells drilled within Unit A have a moderate potential yield.
4.1.1.2 Unit B – Sand and Gravel Deposits This hydrostratigraphic unit is believed to have the greatest groundwater potential of any of the hydrostratigraphic units in the study area (Acres, 1992). It consists of deposits of gravel, sand and silt representing primarily outwash plain deposits. These deposits occur extensively around Stephenville and Pasadena and within the major river valleys. A total of 400 well records are available for Unit B. Well yields ranged from 0 L/min to 1793 L/min and averaged 73.9 L/min. Well depth ranged from 4.6 m to 121.2 m and averaged 29.0 m. The available data indicates that wells drilled within Unit B have a moderate potential yield.
Hydrogeology of Western Newfoundland TF8312717 May, 2008
Page 23
4.1.2 Bedrock Hydrostratigraphic Units The bedrock underlying the study area was subdivided into six hydrostratigraphic units based on lithology, well depth and yield. These units are summarized in Table 4.2 and are shown on Map 3. Histograms of yield and depth of wells completed in bedrock hydrostratigraphic units within the study area are illustrated in Figure 4.2. Wells were assigned to the various hydrostratigraphic units by first locating the wells by community then assigning those wells to the appropriate hydrostratigraphic unit that underlies that community. The well driller’s descriptions of rock types were also considered for this purpose, but they were sometimes vague and of limited value in this regard. Groundwater can be found in rocks in the pores between grains (primary permeability) as well as in fractures (secondary permeability). The occurrence of groundwater within the bedrock hydrostratigraphic units is almost entirely controlled by features of secondary permeability. The primary permeability of clastic sedimentary rocks is a function of the grain size, shape, and sorting of the original sediment. Cementation, in which parts of the voids are filled with precipitated material such as silica, calcite, or iron oxide can reduce the primary porosity. The primary porosity of carbonate rocks is variable. Chemically precipitated rocks can have a very low primary permeability if they are crystalline. Bedding planes can be zones of high primary porosity and permeability. Massive, chemically precipitated limestones can have very low primary porosity and permeability. Secondary permeability in carbonate aquifers is due to the solution enlargement of bedding planes, fractures and faults (Freeze and Cherry, 1979). Intrusive igneous and highly metamorphosed crystalline rocks generally have very little, if any, primary porosity. In order for groundwater to occur, there must be openings developed through fracturing, faulting, or weathering. In general, the amount of fracturing in crystalline rocks decreases with depth (Freeze and Cherry, 1979). The major linear fault systems that traverse the study area in a southwest northeast direction (See Map 2) may be associated with zones of extensive fracturing with potentially high water yield. These features are not included in the hydrostratigraphic unit subdivisions but should be regarded as areas of potentially good groundwater sources.
4.1.2.1 Unit 1 - Granitic and Gneissic Rock This unit is comprised of granitic and gneissic rock of Precambrian to Carboniferous age; these are generally coarse, crystalline rocks of varying structural deformation and are hard and resistant to weathering. This unit occurs extensively along the south coast and throughout the Long Range Mountains, underlying about 30% of the study area, but is largely uninhabited. A total of 70 well records are available for Unit 1. Most of these wells are located in the southern portion of the study area near Port aux Basques, Cape Ray and Burnt Islands. Well yields ranged from 0 L/min to 227 L/min and averaged 27 L/min. Well depth ranged from 6 m to 129 m and averaged 45 m. The available data indicate that wells drilled within Unit 1 have a low to moderate potential yield.
Hydrogeology of Western Newfoundland TF8312717 May, 2008
Page 24
These rocks generally have low primary porosity. They contain substantial amounts of water in micro fracture, but with the exception of fracture zones, have limited capacity to transmit water.
Table 4.1: Surficial Hydrostratigraphic Units, Western Newfoundland
Well Yield Characteristics (L/min) Well Depth Characteristics (m) Hydrostratigraphic
Unit No. of Wells No. of zero
values Average
Median
Average Median
Unit A
Moderate Yield Till
39 4 48.2 16 20.7 18.3
Unit B
Moderate Yield Sand and Gravel
400 29 73.9 36 29.0 24.3
Notes: 1. For well yield characteristics, values may be lower than the actual values due to the zero values in the data. It is possible
that many of these zero values represent missing data. 2. The data presented are updated to December, 2005. The information was supplied by the DOEC and was recorded by
water well drillers as required under the “Well Drilling Regulations”, 1982, and amendments.
Hydrogeology of Western Newfoundland TF8312717 May, 2008
Page 25
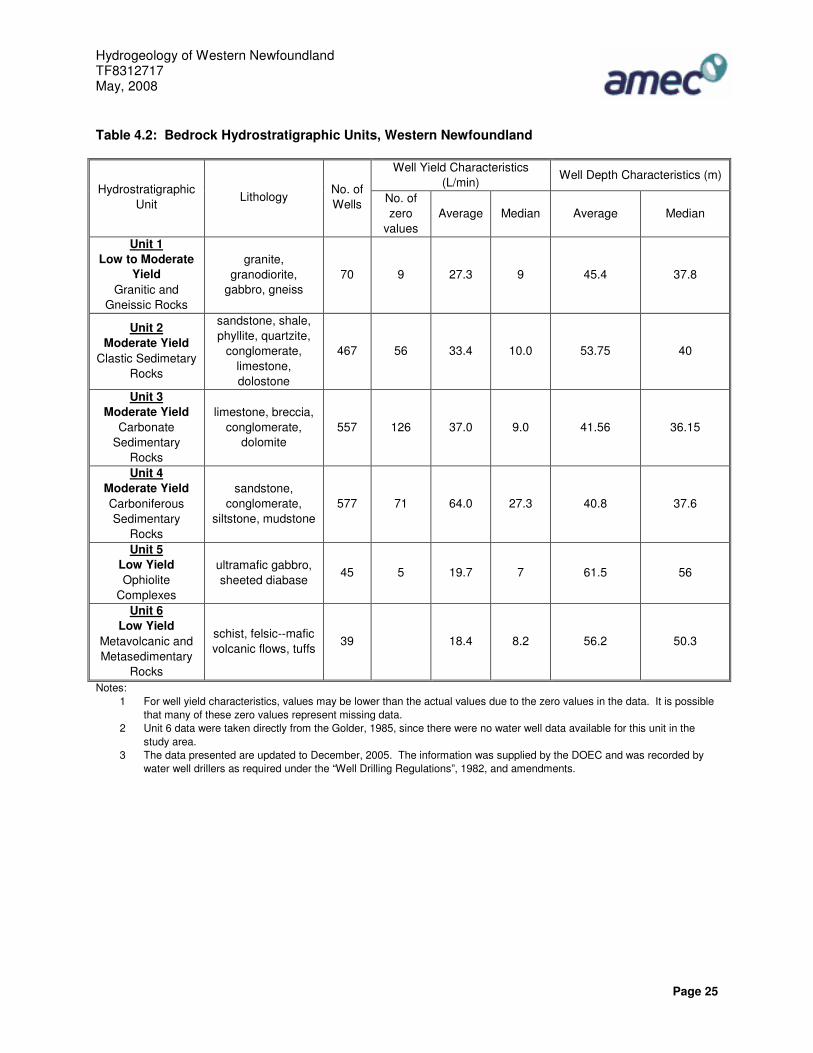
Table 4.2: Bedrock Hydrostratigraphic Units, Western Newfoundland
Well Yield Characteristics (L/min)
Well Depth Characteristics (m) Hydrostratigraphic
Unit Lithology
No. of Wells No. of
zero values
Average
Median
Average Median
Unit 1 Low to Moderate
Yield Granitic and
Gneissic Rocks
granite, granodiorite,
gabbro, gneiss 70 9 27.3 9 45.4 37.8
Unit 2 Moderate Yield
Clastic Sedimetary Rocks
sandstone, shale, phyllite, quartzite,
conglomerate, limestone, dolostone
467 56 33.4 10.0 53.75 40
Unit 3 Moderate Yield
Carbonate Sedimentary
Rocks
limestone, breccia, conglomerate,
dolomite 557 126 37.0 9.0 41.56 36.15
Unit 4 Moderate Yield Carboniferous Sedimentary
Rocks
sandstone, conglomerate,
siltstone, mudstone 577 71 64.0 27.3 40.8 37.6
Unit 5 Low Yield Ophiolite
Complexes
ultramafic gabbro, sheeted diabase
45 5 19.7 7 61.5 56
Unit 6 Low Yield
Metavolcanic and Metasedimentary
Rocks
schist, felsic--mafic volcanic flows, tuffs
39 18.4 8.2 56.2 50.3
Notes: 1 For well yield characteristics, values may be lower than the actual values due to the zero values in the data. It is possible
that many of these zero values represent missing data. 2 Unit 6 data were taken directly from the Golder, 1985, since there were no water well data available for this unit in the
study area. 3 The data presented are updated to December, 2005. The information was supplied by the DOEC and was recorded by
water well drillers as required under the “Well Drilling Regulations”, 1982, and amendments.
Hydrogeology of Western Newfoundland TF8312717 May, 2008
Page 26
Unit A - T ill
0
5
10
15
20
25
25 50 75 100 125 150 175 200 225 250 275 300
Well Yield (L/min)
Num
ber
of W
ells
Unit A - T ill
0
5
10
15
20
25
30
25 50 75 100 125 150 175
Well Depth (m)
Num
ber
of W
ells
Unit B - Sand and Gravel
0
20
40
60
80
100
120
140
160
180
25 50 75 100 125 150 175 200 225 250 275 300
Well Yield (L/min)
Num
ber
of W
ells
Unit B - Sand and Gravel
0
50
100
150
200
250
25 50 75 100 125 150 175
Well Depth (m)
Num
ber
of W
ells
Figure 4.1: Well Yield and Depth Relationships, Surficial Hydrostratigraphic Units A and B, Western Newfoundland (data from DOEC, Water Well Records, 2005).

Hydrogeology of Western Newfoundland TF8312717 May, 2008
Page 27
Unit 1 - Granitic and Gneissic Rocks
0
10
20
30
40
50
60
25 50 75 100 125 150 175 200 225 250 275 300Well Yield (L/min)
Num
ber
of W
ells
Unit 1 - Granitic and Gneissic Rocks
0
5
10
15
20
25
30
35
40
25 50 75 100 125 150 175Well Depth (m)
Num
ber
of W
ells
Unit 2 - Clastic Sedimentary Rocks
0
50
100
150
200
250
300
350
25 50 75 100 125 150 175 200 225 250 275 300 325 350 375Well Yie ld (L/min)
Nu
mb
er o
f W
ells
Unit 2 - Clastic Sedimentary Rocks
0
50
100
150
200
250
25 50 75 100 125 150 175
Well Depth (m)
Nu
mb
er o
f W
ells
Figure: 4.2: Well Yield and Depth Relationships, Bedrock Hydrostratigraphic Units 1 and 2, Western Newfoundland (data from DOEC, 2005)
Hydrogeology of Western Newfoundland TF8312717 May, 2008
Page 28
Unit 3 - Carbonate Sedimentary Rocks
0
50
100
150
200
250
300
350
400
25 50 75 100 125 150 175 200 225 250 275 300Well Yie ld (L/min)
Nu
mb
er o
f W
ells
Unit 3 - Carbonate Sedimentary Rocks
0
50
100
150
200
250
25 50 75 100 125 150 175Well Depth (m)
Num
ber
of W
ells
Unit 4 - Carboniferous Sedimentary Rocks
0
50
100
150
200
250
25 75125
175225
275325
375425
Well Yield (L/min)
Num
ber
of W
ells
Unit 4 - Carboniferous Sedimentary Rocks
0
50
100
150
200
250
300
25 50 75 100 125 150 175
Well Depth (m)
Num
ber
of W
ells
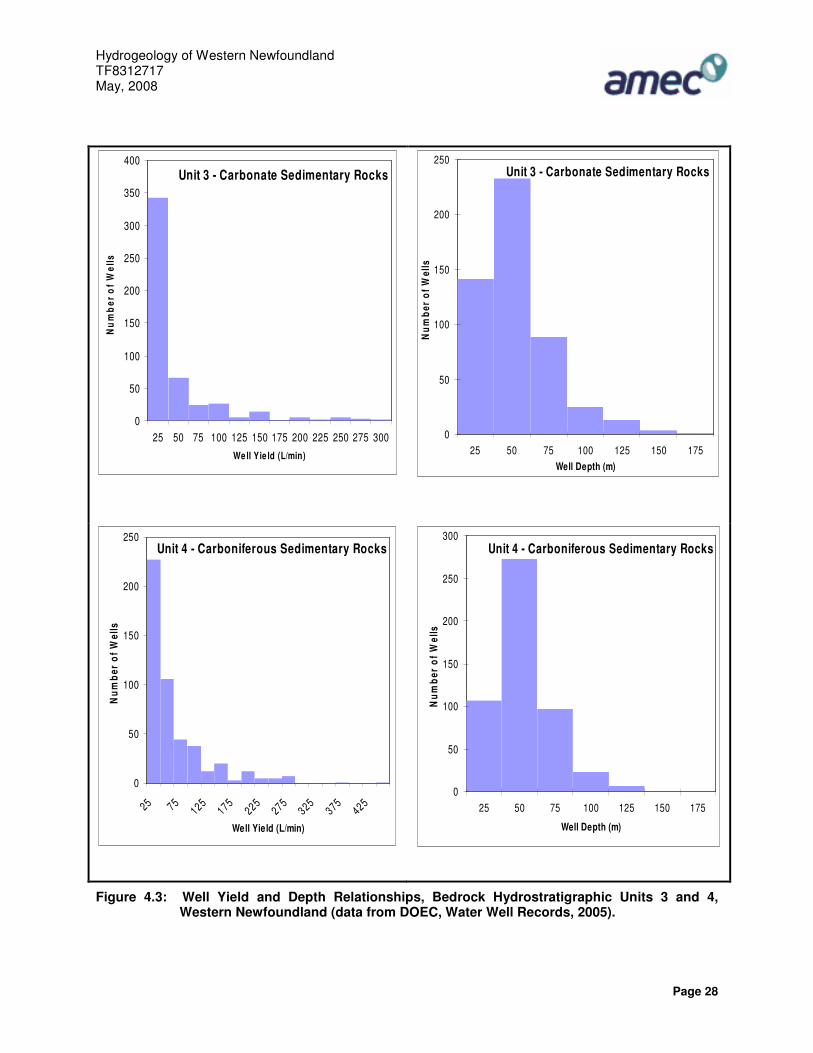
Figure 4.3: Well Yield and Depth Relationships, Bedrock Hydrostratigraphic Units 3 and 4, Western Newfoundland (data from DOEC, Water Well Records, 2005).

Hydrogeology of Western Newfoundland TF8312717 May, 2008
Page 29
Unit 5 - Ophiolite Complexes
0
5
10
15
20
25
30
25 50 75 100 125 150 175 200 225 250 275 300
Well Yield (L/min)
Num
ber
of W
ells
Unit 5 - Ophiolite Complexes
0
2
4
6
8
10
12
14
16
18
20
25 50 75 100 125 150 175
Well Depth (m)N
umbe
r of
Wel
ls
Figure 4.4: Well Yield and Depth Relationships, Bedrock Hydrostratigraphic Unit 5, Western Newfoundland (data from DOEC, Water Well Records, 2005).
4.1.2.2 Unit 2 – Clastic Sedimentary Rocks
Unit 2 includes the strata of the Labrador Group, Goose Tickle Group, Humber Arm Allochthon, Southern White Bay Allochthon, and Hare Bay Allochthon. These rocks are predominantly of clastic sedimentary origin and include shale, greywacke, sandstone and quartzite plus minor limestone and dolostone. The strata of Unit 2 collectively underlie about 20% of the study area. A total of 467 well records are available for Unit 2. Most of these wells underlie portions of the north and northwest areas of the Port au Port Peninsula, southwestern section of the Great Northern Peninsula and Corner Brook area. Well yields ranged from 0 L/min to 370 L/min and averaged 33 L/min. Well depth ranged from 6 m to 335 m and averaged 54 m. The available data indicate that wells drilled within Unit 2 have a moderate potential yield. The permeability of these rocks depends on the degree of cementation of individual grains and the extent of fracturing. Generally, slates and shales have low primary porosity since they are normally fine-grained and compact, but fractures have created secondary porosity.
4.1.2.3 Unit 3 – Carbonate Sedimentary Rocks Unit 3 is comprised of limestone and dolostone from the Port au Port, St. George, and Table Head groups. The strata of Unit 3 collectively underlie about 25% of the study area.
Hydrogeology of Western Newfoundland TF8312717 May, 2008
Page 30
A total of 457 well records are available for Unit 3. Most of these wells underlie the Port au Port peninsula, and the western portion and northern tip of the Great Northern Peninsula. Well yields ranged from 0 L/min to 789 L/min and averaged 37 L/min. Well depth ranged from 7.3 m to 154 m and averaged 36 m. The available data indicate that wells drilled within Unit 3 have a moderate potential yield. Disappearing streams and lakes with internal drainage suggest that bedrock permeability in the carbonate rocks of Unit 3 can be quite high (Acres, 1994). Solution weathering, joints and fracturing are important sources of permeability.
4.1.2.4 Unit 4 – Carboniferous Sedimentary Rocks The Carboniferous age sedimentary strata of the Anguille, Deer Lake, Codroy and Barachois groups comprise Unit 4. These rocks are easily eroded and tend to form in lowlying areas. They consist mainly of sandstone, conglomerate and shale, but also contain limestone, salt, gypsum and coal. The strata of Unit 4 collectively underlie approximately 15% of the study area. A total of 582 well records were located for Unit 4. Most of these wells are located in the Deer Lake, St. George’s and Robinsons areas and in the Codroy valley. Well yields range from 0 L/min to 789 L/min and averaged 64 L/min. Well depths range from 6 m to 154 m and averaged 38 m. The available data indicate that wells drilled within Unit 4 have a moderate potential yield. The sandstones and conglomerates of Unit 4 have higher primary porosity than other units within the study area because they are less consolidated (Acres, 1994).
4.1.2.5 Unit 5 – Ophiolite Complexes Unit 5 comprises the mafic and ultramafic intrusive suites of the ophiolite complexes within the Bay of Islands and St. Anthony areas. The complexes form barren, uninhabited mountains for which there is limited hydrogeological data available. The strata of Unit 5 collectively underlie approximately 5% of the study area. A total of 45 well records were located for Unit 5. Most of these wells are located in the Bay of Islands area. Well yields range from 0 L/min to 227 L/min and averaged 19.7 L/min. Well depths range from 10.1 m to 164.6 m and averaged 61.5 m. The available data indicate that wells drilled within Unit 5 have a low potential yield.
4.1.2.6 Unit 6 – Metavolcanic and Metasedimentary Rocks Unit 6 includes the Late Precambrian to Cambrian age metamorphic strata of the Fleur de Lys Supergroup and the Southwest Brook Complex. The strata of Unit 6 collectively underlie approximately 5% of the study area. No well information is available for the metavolcanic and metasedimentary terrain of Unit 6 in western Newfoundland. This is largely due to the remoteness of the areas underlain by these strata. However, similar terrain occurs just east of the study area, and data were taken from an earlier regional hydrogeological study carried out in the St. George’s Bay area (Golder, 1985). The data are summarized in Table 4.2. Well yields range from 1 L/min to 136 L/min and

Hydrogeology of Western Newfoundland TF8312717 May, 2008
Page 31
averaged 18 L/min. Well depths range from 4 m to 152 m and averaged 56 m. The available data indicate that wells drilled within Unit 6 have a low potential yield. 4.2 AQUIFER TESTS An additional source of data for both overburden and bedrock hydrogeological characteristics is provided by aquifer tests that have been completed as part of an evaluation of community water supplies or as part of a specific engineering activity. A total of 274 aquifer tests have been conducted in the study area. Appendix III lists all the aquifer tests completed in the study area according to community and hydrostratigraphic unit. Table 4.3 presents a comparison of well supply aquifer tests with the results of the yield tests for mainly single domestic well yields as determined by water well drillers. Problems associated with the aquifer tests conducted in Western Newfoundland include their short duration and the absence of step-drawdown tests. To establish a reliable long-term safe yield of a well, a step-drawdown test must precede the aquifer test (Fetter, 1994). As shown in Appendix III there were 274 pump tests that took place and only 2 of these were 72 hours or more (well IDs 19128 and 22568). Step-drawdown tests were not conducted as part of the procedure for any of the tests. Four aquifer tests were conducted on wells completed in Unit A. The average estimated safe yield was reported to be 42 L/min with a range of 30 to 50 L/min. This is greater than the 21 L/min yield from the water well records. However, due to the limited number of tests, this is of no significance. Unit A offers potential to meet all domestic needs. Seventy-seven aquifer tests were conducted on wells completed in Unit B. The average estimated safe yield was reported to be 29 L/min with a range of 5 to 1793 L/min. However, the results of the aquifer tests indicate an average yield of 131 L/min. Based on the aquifer test data, Unit B offers excellent potential to meet single well domestic, industrial, commercial, or municipal needs. Twelve aquifer tests were conducted on wells completed in Unit 1. The average estimated safe yield was reported to be 35 L/min with a range of 2 to 225 L/min. This average yield value compares to the 27 L/min average yield obtained from the water well records (See Table 4.3). Based on these data, Unit 1 offers potential to meet single dwelling domestic needs. Fifty-two of the aquifer tests were conducted on wells within Unit 2. The average estimated safe yield was reported to be 45 L/min with a range of 1 to 600 L/min. This value compares to the 33 L/min average yield obtained from the water well records. Based on these data, Unit 2 offers potential to meet all domestic needs and limited commercial needs. Thirty-seven aquifer tests were conducted on wells completed in Unit 3. The average estimated safe yield was reported to be 54 L/min with a range of 1 to 250 L/min. This value compares to the 37 L/min average yield obtained from the water well records. Like Unit 2, Unit 3 offers potential to meet all domestic needs and limited commercial and municipal needs.
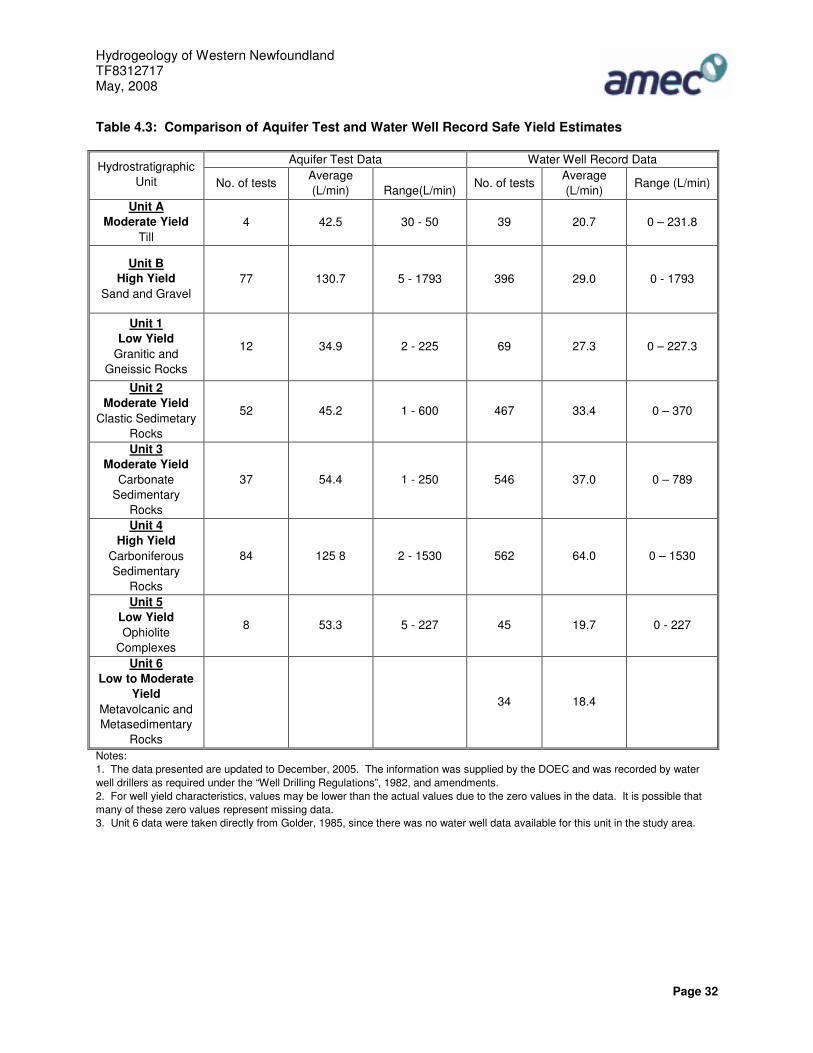
Hydrogeology of Western Newfoundland TF8312717 May, 2008
Page 32
Table 4.3: Comparison of Aquifer Test and Water Well Record Safe Yield Estimates
Aquifer Test Data Water Well Record Data Hydrostratigraphic Unit No. of tests
Average (L/min)
Range(L/min)
No. of tests Average (L/min)
Range (L/min)
Unit A Moderate Yield
Till 4 42.5 30 - 50 39 20.7 0 – 231.8
Unit B High Yield
Sand and Gravel 77 130.7 5 - 1793 396 29.0 0 - 1793
Unit 1 Low Yield
Granitic and Gneissic Rocks
12 34.9 2 - 225 69 27.3 0 – 227.3
Unit 2 Moderate Yield
Clastic Sedimetary Rocks
52 45.2 1 - 600 467 33.4 0 – 370
Unit 3 Moderate Yield
Carbonate Sedimentary
Rocks
37 54.4 1 - 250 546 37.0 0 – 789
Unit 4 High Yield
Carboniferous Sedimentary
Rocks
84 125 8 2 - 1530 562 64.0 0 – 1530
Unit 5 Low Yield Ophiolite
Complexes
8 53.3 5 - 227 45 19.7 0 - 227
Unit 6 Low to Moderate
Yield Metavolcanic and Metasedimentary
Rocks
34 18.4
Notes: 1. The data presented are updated to December, 2005. The information was supplied by the DOEC and was recorded by water well drillers as required under the “Well Drilling Regulations”, 1982, and amendments. 2. For well yield characteristics, values may be lower than the actual values due to the zero values in the data. It is possible that many of these zero values represent missing data. 3. Unit 6 data were taken directly from Golder, 1985, since there was no water well data available for this unit in the study area.
Hydrogeology of Western Newfoundland TF8312717 May, 2008
Page 33
Eighty-four aquifer tests were conducted on wells completed in Unit 4. The average estimated safe yield was reported to be 125.8 L/min with a range of 2 to 1530 L/min. The results of aquifer tests completed in Unit 4 suggest that the average yield is 126 L/min. Unit 4 offers high potential to meet any domestic groundwater needs and limited industrial, commercial or industrial needs. Only eight aquifer tests were conducted on wells completed in Unit 5. The average estimated safe yield was reported to be 53 L/min with a range of 5 to 227 L/min. The value is greater than the average well yield obtained from the water well records of 20 L/min. However, due to the limited number of tests completed, this is of no significance. Unit 5 has the potential to meet all domestic needs. No available data exists for aquifer tests within Unit 6. Based on average yield estimates obtained from Golder (1985), Unit 6 has the potential to meet single dwelling domestic needs. 4.3 GROUNDWATER USAGE Of the 2,295 water well records for the study area, 1,387 were for domestic use, 68 were for commercial use, 88 were for public supply, 70 were for industrial use, 153 were for municipal use, 35 were for heat pumps and 494 were unknown. 4.3.1 Municipal Uses There is a significant reliance on groundwater in western Newfoundland for domestic water supplies. Many of these supplies are for one or two households and consist of either a dug well or a drilled well (Acres, 1992). There are, however, several communities in the study area which use groundwater as a municipal source. Appendix II provides a list of communities and water well data for all communities in the study area. Map No. 3 shows the location of areas of concentrated groundwater use. There are 3 major population areas which rely on groundwater. The municipalities of Barachois Brook, Kippens, Stephenville and Stephenville Crossing are entirely dependent on groundwater for its water supply. The unconfined aquifer of surficial hydrostratigraphic Unit B underlying these communities is comprised of glaciofluvial deposits consisting of compact sands with interbedded sand and gravel units (Acres, 1992). The Local Service District (LSD) of Bay St. George South comprises about ten communities, with a combined population of over 1800, which are dependent on groundwater as a water source (Acres, 1992). Wells in the area are drilled in surficial hydrostratigraphic Unit B and bedrock hydrostratigraphic Unit 4. The Codroy Region is comprised of thirteen communities with a population of approximately 2,000 which are dependent on groundwater. Like the LSD of Bay St. George South, wells in the area are drilled in surficial hydrostratigraphic Unit B and bedrock hydrostratigraphic Unit 4.
Hydrogeology of Western Newfoundland TF8312717 May, 2008
Page 34
Municipal water wells in Meadows, Parsons Pond, Rocky Harbour, New Ferolle and Jerry’s Nose were reported as having insufficient supplies. Wells in Parsons Pond and Cook’s Harbour reported poor quality and were abandoned. 4.3.2 Industrial Uses The industrial use of groundwater is generally limited to areas where yield is high. The main industrial uses for groundwater within western Newfoundland are fish processing plants, pulp and paper, mining, forestry, and agriculture. Only the fish plant in Piccadilly relies entirely on groundwater (Acres, 1994). 5.0 HYDROLOGY 5.1 HYDROLOGICAL CYCLE
The hydrologic cycle for a region typically starts with precipitation in the form of rainfall or snowfall. A portion of the rainfall is returned back into the atmosphere in the forms of evaporation or transpiration by the vegetation cover on the ground surface. Depending on the ground moisture conditions at the time of the precipitation event, a portion of the remaining rainfall may generate surface runoff, which feeds into the streams and causes a rise in stream flow. The remainder of the rainfall will percolate down to the groundwater table; from there it will migrate slowly toward and feed into the receiving stream in the form of base flow. Base flow input into a stream may continue long after the surface runoff ceases. The hydrological cycle for snowfall is similar to that for rainfall. However, snowfall generally becomes accumulated through the winter and generates runoff in the spring when the temperature rises above freezing. A much lower proportion of the snowfall will be lost to evaporation and transpiration than rainfall due to lower temperature and significantly reduced consumption by the ground vegetation cover. Many factors govern the hydrological cycle, and proportioning of the total precipitation into various hydrological components. The most significant factors include temperature, topography, vegetation cover, soil conditions, and significant drainage features of the watershed (e.g., large lakes). Many of these factors vary seasonally and from watershed to watershed. This section provides a generalized hydrological condition for the study region. It is understood that the presented hydrological condition may not be representative due to locally dissimilar hydrologic characteristics that vary from average conditions of the study region. 5.2 DIVISION OF HYDROLOGICAL REGIONS Environment Canada divides all the watersheds across Canada into main divisions, sub-divisions, and sub-sub divisions for the purpose of planning their hydrometric station network. The hydrologic condition in the same drainage sub-sub division is considered more comparable than with other sub-sub divisions. Figure 5.1 shows the drainage divisions of the Study Area identified by Environment Canada. There are a total of 13 sub-sub divisions (divided by the dash line) belonging to two sub-divisions (divided by the solid line) within the study area. The two southern sub-sub divisions (2ZA and 2ZB) belong to the same drainage sub-division. The remaining 11 sub-sub divisions belong to another drainage sub-division.
Hydrogeology of Western Newfoundland TF8312717 May, 2008
Page 35
Not all the drainage sub-sub divisions have stream flow gauging stations, either historically or at the present time, that can be used for evaluating runoff characteristics representative of that sub-sub division. For the sub-sub divisions with hydrometric stations, the period of data available varies significantly and, on this basis it can be difficult to compare the stream flow for one sub-sub division with another. Considering the drainage divisions developed by Environment Canada, and the availability of stream flow data, the study area is divided into five sub-regions for the purpose of this study, as follows:
• Sub-region 1: Great Northern Peninsula North and West, which encompasses drainage sub-sub divisions of 2YA, 2YB, 2YC, 2YE, and 2YH;
• Sub-region 2: Great Northern Peninsula East, which encompasses drainage sub-sub divisions of 2YD, 2YF, and 2YG;
• Sub-region 3: Harry’s River, which encompasses drainage sub-sub division of 2YJ; • Sub-region 4: Grand Lake-Deer Lake, which encompasses sub-sub divisions of 2YL
and 2YK; and • Sub-region 5: South Coast, which encompasses sub-sub drainage divisions of 2ZA and
2ZB.

Hydrogeology of Western Newfoundland TF8312717 May, 2008
Page 36
Figure 5.1: Drainage Divisions Covering the Study Area
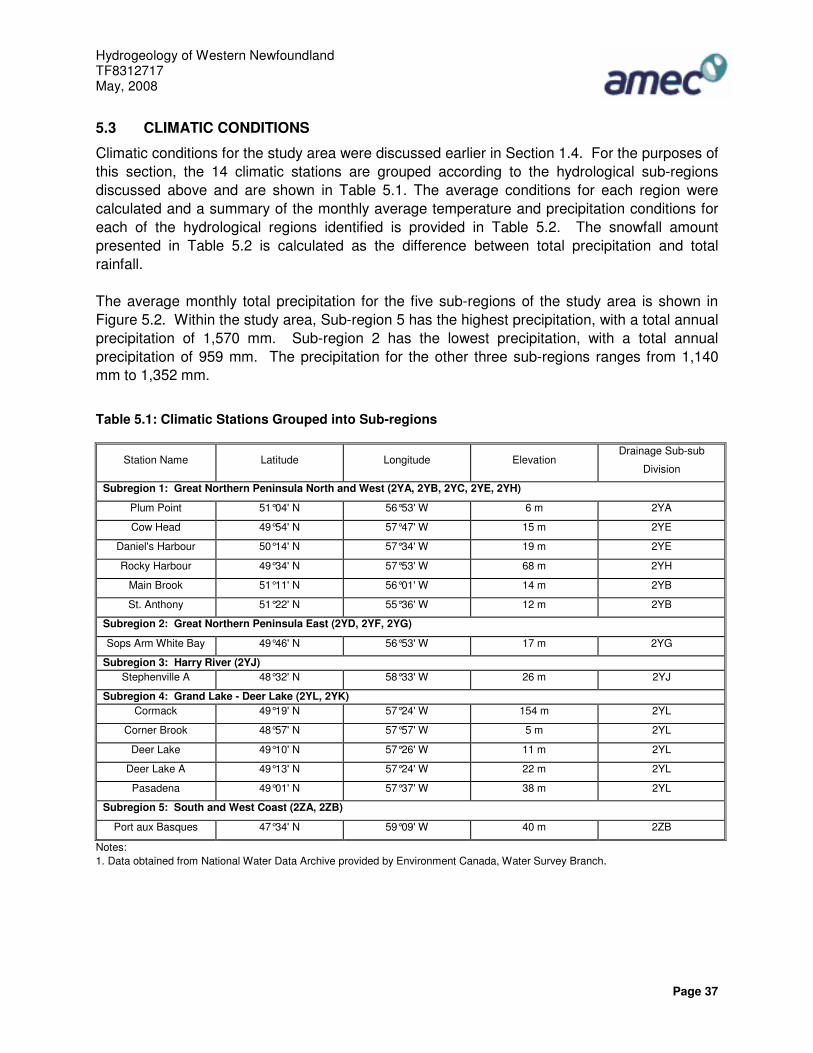
Hydrogeology of Western Newfoundland TF8312717 May, 2008
Page 37
5.3 CLIMATIC CONDITIONS
Climatic conditions for the study area were discussed earlier in Section 1.4. For the purposes of this section, the 14 climatic stations are grouped according to the hydrological sub-regions discussed above and are shown in Table 5.1. The average conditions for each region were calculated and a summary of the monthly average temperature and precipitation conditions for each of the hydrological regions identified is provided in Table 5.2. The snowfall amount presented in Table 5.2 is calculated as the difference between total precipitation and total rainfall. The average monthly total precipitation for the five sub-regions of the study area is shown in Figure 5.2. Within the study area, Sub-region 5 has the highest precipitation, with a total annual precipitation of 1,570 mm. Sub-region 2 has the lowest precipitation, with a total annual precipitation of 959 mm. The precipitation for the other three sub-regions ranges from 1,140 mm to 1,352 mm.
Table 5.1: Climatic Stations Grouped into Sub-regions
Station Name Latitude Longitude Elevation Drainage Sub-sub
Division
Subregion 1: Great Northern Peninsula North and West (2YA, 2YB, 2YC, 2YE, 2YH)
Plum Point 51°04' N 56°53' W 6 m 2YA
Cow Head 49°54' N 57°47' W 15 m 2YE
Daniel's Harbour 50°14' N 57°34' W 19 m 2YE
Rocky Harbour 49°34' N 57°53' W 68 m 2YH
Main Brook 51°11' N 56°01' W 14 m 2YB
St. Anthony 51°22' N 55°36' W 12 m 2YB
Subregion 2: Great Northern Peninsula East (2YD, 2YF, 2YG)
Sops Arm White Bay 49°46' N 56°53' W 17 m 2YG
Subregion 3: Harry River (2YJ) Stephenville A 48°32' N 58°33' W 26 m 2YJ
Subregion 4: Grand Lake - Deer Lake (2YL, 2YK) Cormack 49°19' N 57°24' W 154 m 2YL
Corner Brook 48°57' N 57°57' W 5 m 2YL
Deer Lake 49°10' N 57°26' W 11 m 2YL
Deer Lake A 49°13' N 57°24' W 22 m 2YL
Pasadena 49°01' N 57°37' W 38 m 2YL
Subregion 5: South and West Coast (2ZA, 2ZB)
Port aux Basques 47°34' N 59°09' W 40 m 2ZB
Notes: 1. Data obtained from National Water Data Archive provided by Environment Canada, Water Survey Branch.
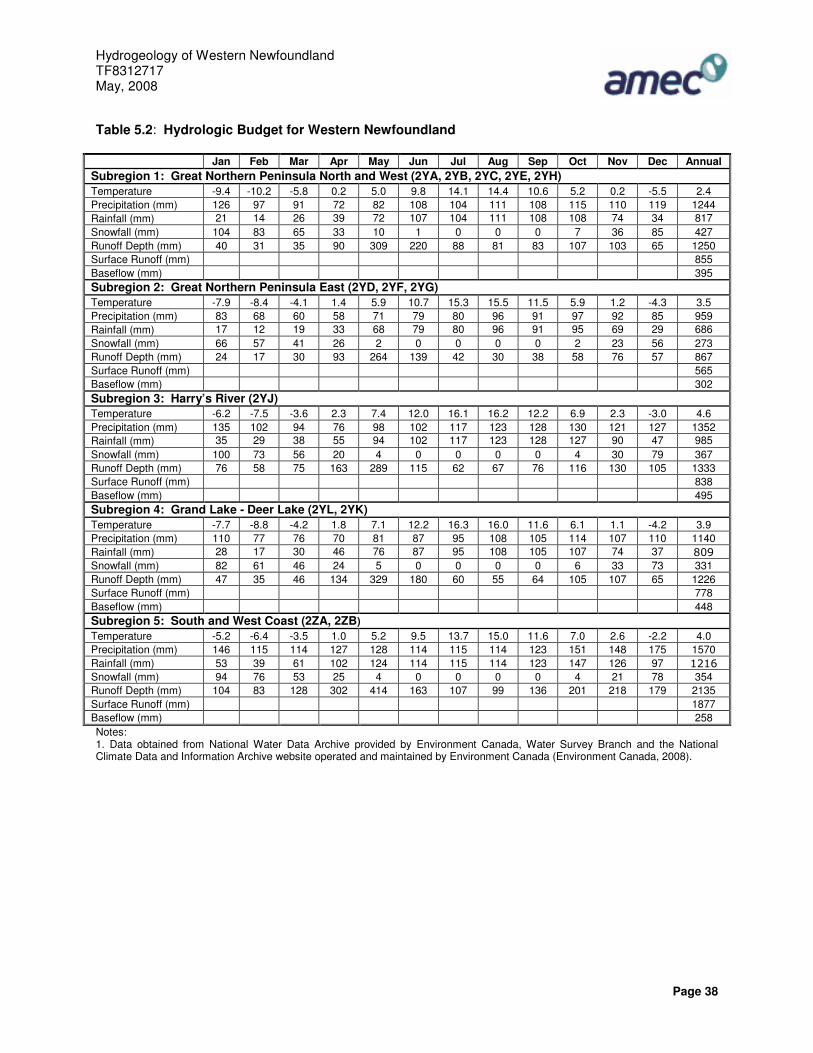
Hydrogeology of Western Newfoundland TF8312717 May, 2008
Page 38
Table 5.2: Hydrologic Budget for Western Newfoundland
Jan Feb Mar Apr May Jun Jul Aug Sep Oct Nov Dec Annual Subregion 1: Great Northern Peninsula North and West (2YA, 2YB, 2YC, 2YE, 2YH) Temperature -9.4 -10.2 -5.8 0.2 5.0 9.8 14.1 14.4 10.6 5.2 0.2 -5.5 2.4 Precipitation (mm) 126 97 91 72 82 108 104 111 108 115 110 119 1244 Rainfall (mm) 21 14 26 39 72 107 104 111 108 108 74 34 817 Snowfall (mm) 104 83 65 33 10 1 0 0 0 7 36 85 427 Runoff Depth (mm) 40 31 35 90 309 220 88 81 83 107 103 65 1250 Surface Runoff (mm) 855 Baseflow (mm) 395 Subregion 2: Great Northern Peninsula East (2YD, 2YF, 2YG) Temperature -7.9 -8.4 -4.1 1.4 5.9 10.7 15.3 15.5 11.5 5.9 1.2 -4.3 3.5 Precipitation (mm) 83 68 60 58 71 79 80 96 91 97 92 85 959 Rainfall (mm) 17 12 19 33 68 79 80 96 91 95 69 29 686 Snowfall (mm) 66 57 41 26 2 0 0 0 0 2 23 56 273 Runoff Depth (mm) 24 17 30 93 264 139 42 30 38 58 76 57 867 Surface Runoff (mm) 565 Baseflow (mm) 302 Subregion 3: Harry’s River (2YJ) Temperature -6.2 -7.5 -3.6 2.3 7.4 12.0 16.1 16.2 12.2 6.9 2.3 -3.0 4.6 Precipitation (mm) 135 102 94 76 98 102 117 123 128 130 121 127 1352 Rainfall (mm) 35 29 38 55 94 102 117 123 128 127 90 47 985 Snowfall (mm) 100 73 56 20 4 0 0 0 0 4 30 79 367 Runoff Depth (mm) 76 58 75 163 289 115 62 67 76 116 130 105 1333 Surface Runoff (mm) 838 Baseflow (mm) 495 Subregion 4: Grand Lake - Deer Lake (2YL, 2YK) Temperature -7.7 -8.8 -4.2 1.8 7.1 12.2 16.3 16.0 11.6 6.1 1.1 -4.2 3.9 Precipitation (mm) 110 77 76 70 81 87 95 108 105 114 107 110 1140 Rainfall (mm) 28 17 30 46 76 87 95 108 105 107 74 37 ����
Snowfall (mm) 82 61 46 24 5 0 0 0 0 6 33 73 331 Runoff Depth (mm) 47 35 46 134 329 180 60 55 64 105 107 65 1226 Surface Runoff (mm) 778 Baseflow (mm) 448 Subregion 5: South and West Coast (2ZA, 2ZB) Temperature -5.2 -6.4 -3.5 1.0 5.2 9.5 13.7 15.0 11.6 7.0 2.6 -2.2 4.0 Precipitation (mm) 146 115 114 127 128 114 115 114 123 151 148 175 1570 Rainfall (mm) 53 39 61 102 124 114 115 114 123 147 126 97 �����
Snowfall (mm) 94 76 53 25 4 0 0 0 0 4 21 78 354 Runoff Depth (mm) 104 83 128 302 414 163 107 99 136 201 218 179 2135 Surface Runoff (mm) 1877 Baseflow (mm) 258 Notes: 1. Data obtained from National Water Data Archive provided by Environment Canada, Water Survey Branch and the National Climate Data and Information Archive website operated and maintained by Environment Canada (Environment Canada, 2008).
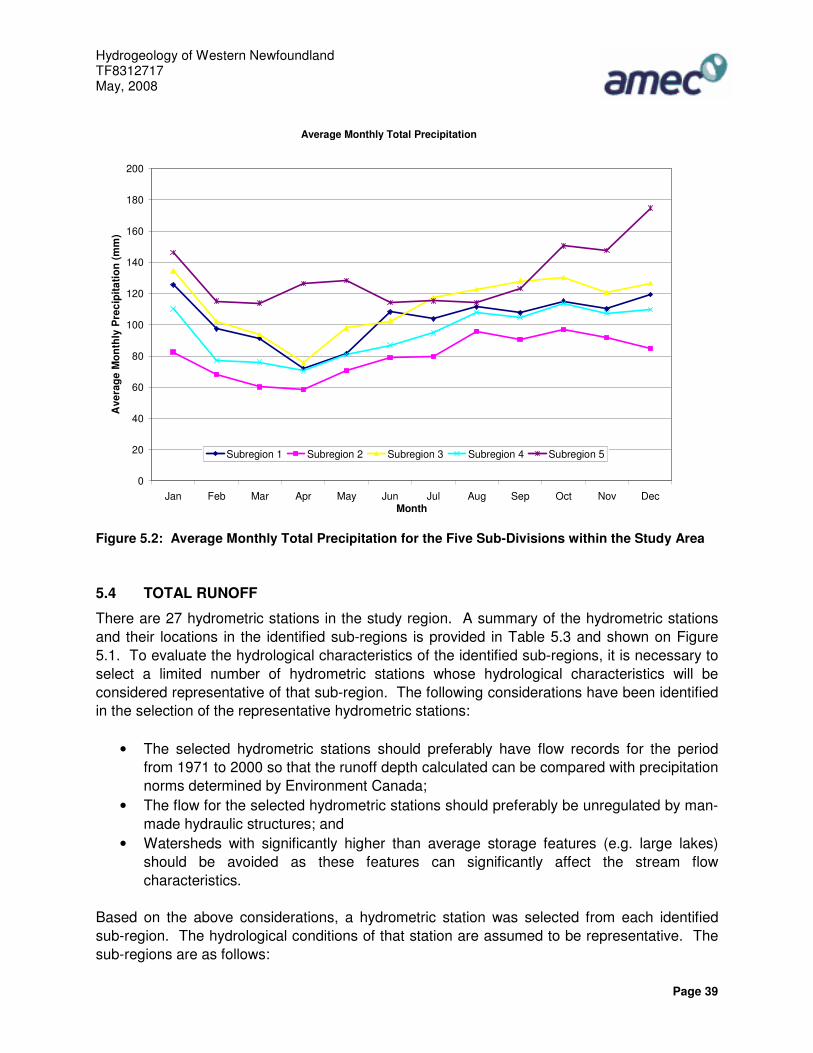
Hydrogeology of Western Newfoundland TF8312717 May, 2008
Page 39
Average Monthly Total Precipitation
0
20
40
60
80
100
120
140
160
180
200
Jan Feb Mar Apr May Jun Jul Aug Sep Oct Nov DecMonth
Ave
rage
Mon
thly
Pre
cipi
tatio
n (m
m)
Subregion 1 Subregion 2 Subregion 3 Subregion 4 Subregion 5
Figure 5.2: Average Monthly Total Precipitation for the Five Sub-Divisions within the Study Area
5.4 TOTAL RUNOFF
There are 27 hydrometric stations in the study region. A summary of the hydrometric stations and their locations in the identified sub-regions is provided in Table 5.3 and shown on Figure 5.1. To evaluate the hydrological characteristics of the identified sub-regions, it is necessary to select a limited number of hydrometric stations whose hydrological characteristics will be considered representative of that sub-region. The following considerations have been identified in the selection of the representative hydrometric stations:
• The selected hydrometric stations should preferably have flow records for the period from 1971 to 2000 so that the runoff depth calculated can be compared with precipitation norms determined by Environment Canada;
• The flow for the selected hydrometric stations should preferably be unregulated by man-made hydraulic structures; and
• Watersheds with significantly higher than average storage features (e.g. large lakes) should be avoided as these features can significantly affect the stream flow characteristics.
Based on the above considerations, a hydrometric station was selected from each identified sub-region. The hydrological conditions of that station are assumed to be representative. The sub-regions are as follows:

Hydrogeology of Western Newfoundland TF8312717 May, 2008
Page 40
• Sub-region1: Torrent River at Bristol's Pool (02YC001) • Sub-region2: Northeast Brook near Roddickton (02YD002) • Sub-region3: Upper Humber River near Reidville (02YL001) • Sub-region4: Harry's River below Highway Bridge (02YJ001) • Sub-region5: Isle Aux Morts River below Highway Bridge (02ZB001)
The monthly and total annual runoff estimated from the identified representative hydrometric stations is provided in Table 5.2. The monthly runoff distributions for the study area are shown in Figure 5.3. It is seen that runoff exhibits significantly higher seasonal variation than precipitation. The highest runoff generally occurs in the spring, when snow accumulation through the winter month melts. The lowest runoff generally occurs in the summer when evaporation, and transpiration by the ground vegetation cover, is the highest. The runoff depth increases again in the fall when precipitation increases, and evaporation and transpiration decreases.
Average Monthly Total Runoff Depth
0
50
100
150
200
250
300
350
400
450
Jan Feb Mar Apr May Jun Jul Aug Sep Oct Nov DecMonth
Ave
rage
Mon
thly
Tot
al R
unof
f Dep
th (m
m)
Subregion 1
Subregion 2
Subregion 3
Subregion 4
Subregion 5
Figure 5.3: Average Monthly Runoff Distributions for the Five Sub-Divisions within the Study Area
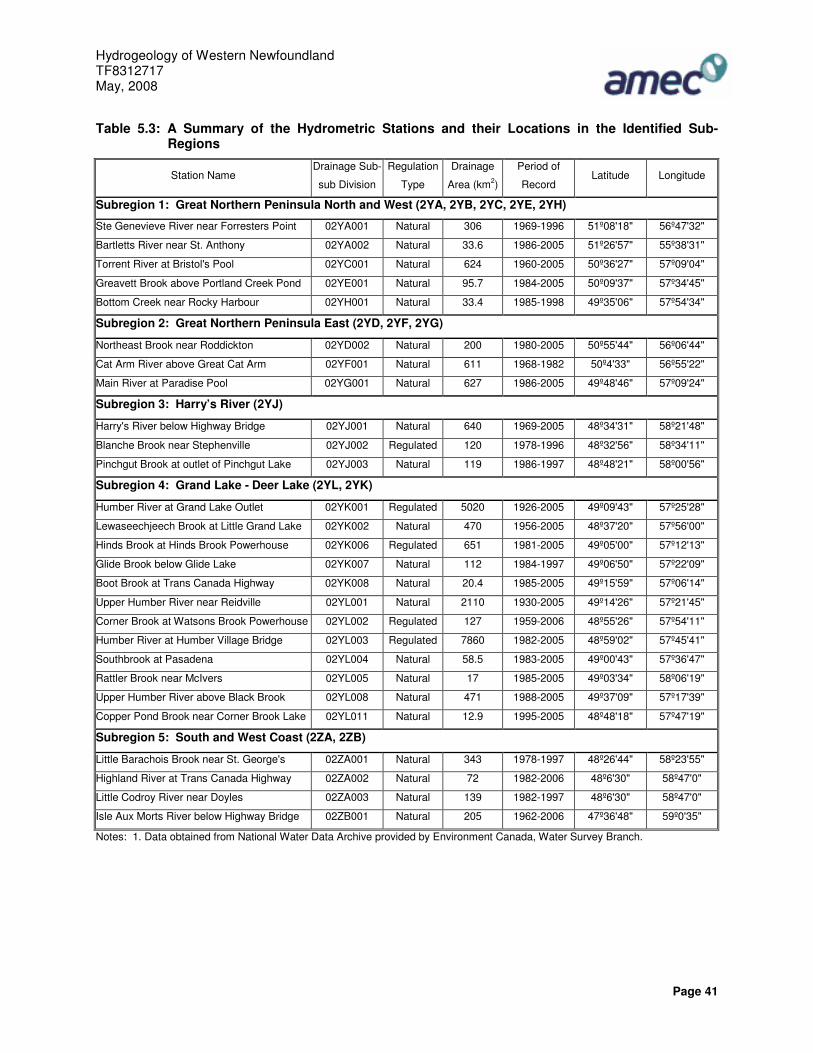
Hydrogeology of Western Newfoundland TF8312717 May, 2008
Page 41
Table 5.3: A Summary of the Hydrometric Stations and their Locations in the Identified Sub-Regions
Station Name Drainage Sub-
sub Division
Regulation
Type
Drainage
Area (km2)
Period of
Record Latitude Longitude
Subregion 1: Great Northern Peninsula North and West (2YA, 2YB, 2YC, 2YE, 2YH)
Ste Genevieve River near Forresters Point 02YA001 Natural 306 1969-1996 51º08'18" 56º47'32"
Bartletts River near St. Anthony 02YA002 Natural 33.6 1986-2005 51º26'57" 55º38'31"
Torrent River at Bristol's Pool 02YC001 Natural 624 1960-2005 50º36'27" 57º09'04"
Greavett Brook above Portland Creek Pond 02YE001 Natural 95.7 1984-2005 50º09'37" 57º34'45"
Bottom Creek near Rocky Harbour 02YH001 Natural 33.4 1985-1998 49º35'06" 57º54'34"
Subregion 2: Great Northern Peninsula East (2YD, 2YF, 2YG)
Northeast Brook near Roddickton 02YD002 Natural 200 1980-2005 50º55'44" 56º06'44"
Cat Arm River above Great Cat Arm 02YF001 Natural 611 1968-1982 50º4'33" 56º55'22"
Main River at Paradise Pool 02YG001 Natural 627 1986-2005 49º48'46" 57º09'24"
Subregion 3: Harry’s River (2YJ)
Harry's River below Highway Bridge 02YJ001 Natural 640 1969-2005 48º34'31" 58º21'48"
Blanche Brook near Stephenville 02YJ002 Regulated 120 1978-1996 48º32'56" 58º34'11"
Pinchgut Brook at outlet of Pinchgut Lake 02YJ003 Natural 119 1986-1997 48º48'21" 58º00'56"
Subregion 4: Grand Lake - Deer Lake (2YL, 2YK)
Humber River at Grand Lake Outlet 02YK001 Regulated 5020 1926-2005 49º09'43" 57º25'28"
Lewaseechjeech Brook at Little Grand Lake 02YK002 Natural 470 1956-2005 48º37'20" 57º56'00"
Hinds Brook at Hinds Brook Powerhouse 02YK006 Regulated 651 1981-2005 49º05'00" 57º12'13"
Glide Brook below Glide Lake 02YK007 Natural 112 1984-1997 49º06'50" 57º22'09"
Boot Brook at Trans Canada Highway 02YK008 Natural 20.4 1985-2005 49º15'59" 57º06'14"
Upper Humber River near Reidville 02YL001 Natural 2110 1930-2005 49º14'26" 57º21'45"
Corner Brook at Watsons Brook Powerhouse 02YL002 Regulated 127 1959-2006 48º55'26" 57º54'11"
Humber River at Humber Village Bridge 02YL003 Regulated 7860 1982-2005 48º59'02" 57º45'41"
Southbrook at Pasadena 02YL004 Natural 58.5 1983-2005 49º00'43" 57º36'47"
Rattler Brook near McIvers 02YL005 Natural 17 1985-2005 49º03'34" 58º06'19"
Upper Humber River above Black Brook 02YL008 Natural 471 1988-2005 49º37'09" 57º17'39"
Copper Pond Brook near Corner Brook Lake 02YL011 Natural 12.9 1995-2005 48º48'18" 57º47'19"
Subregion 5: South and West Coast (2ZA, 2ZB)
Little Barachois Brook near St. George's 02ZA001 Natural 343 1978-1997 48º26'44" 58º23'55"
Highland River at Trans Canada Highway 02ZA002 Natural 72 1982-2006 48º6'30" 58º47'0"
Little Codroy River near Doyles 02ZA003 Natural 139 1982-1997 48º6'30" 58º47'0"
Isle Aux Morts River below Highway Bridge 02ZB001 Natural 205 1962-2006 47º36'48" 59º0'35"
Notes: 1. Data obtained from National Water Data Archive provided by Environment Canada, Water Survey Branch.

Hydrogeology of Western Newfoundland TF8312717 May, 2008
Page 42
5.5 BASE FLOW
Water flowing into a stream can come from overland flow or from groundwater that has seeped into the stream bed. The groundwater contribution to a stream is termed baseflow. To determine the baseflow portion of the total runoff, it is necessary to analyze the daily runoff records for an average year. The annual flows, as a ratio of the average for the period from 1971 to 2000 for the identified representative hydrometric stations, are shown in Figure 5.4. For any given year, if the ratio is above one, it is a relatively wet year. If the ratio is below one, it is a relatively dry year. When the ratio is close to one, the flow condition for that year is near average. It is seen that for 1995, the flows for four of the five representative hydrometric stations are close to average conditions, and the daily flow records for these four hydrometric stations for 1995 are used to represent an average year condition. The flows for the hydrometric station 02YD002 for 1995 is over 20 percent wetter than average condition. For this hydrometric station, the daily flow records for 2000 are used to represent an average year condition. It is understood that the runoff distribution for the selected average years may not necessarily be representative of the average conditions. Never the less, it is assessed that the annual baseflow determined using the daily flow records for these years is representative of the average year conditions
The baseflow contributions to total stream flow for the representative hydrometric stations are shown in Figures 5.5 - 5.9. The total annual baseflow contributions to stream flow expressed as a depth over the watershed area are also summarized in Table 5.2. The total annual baseflow contribution to stream flow for the Hydrometric Station 02ZB001 is estimated to be approximately 12 percent. The total annual baseflow contribution for the other hydrometric stations ranges from 32 percent (02YC001) to 37 percent (02YL001). The baseflow contribution for 02ZB001 is significantly lower than that for the other hydrometric stations. This region receives the highest precipitation in the study area, and the ground moisture content on average is much higher than in other regions, resulting in a higher proportion of surface runoff. 5.6 HYDROLOGICAL BUDGET
The hydrological budget represents the water inputs and outputs from a watershed over a specific period of time. In theory, the natural inputs and outputs should equate in the form Input = Output + Change in storage, and when in a state of balance, may be expressed in the equation; P = I + E + R where P = Precipitation, I = Infiltation, E = Evaporation and R = surface runoff. Table 5.2 summarizes the major hydrological components for the five sub-regions identified for the study area. It is seen that for all the hydrometric stations, the total annual runoff is close to or higher than the total annual precipitation, which is not possible. The hydrological Atlas of Canada prepared by Environment Canada explained that this inconsistency “seems to be inadequate areal estimates of precipitation, for which three specific causes can be isolated. First, the precipitation network provides inadequate representative measurements. This is
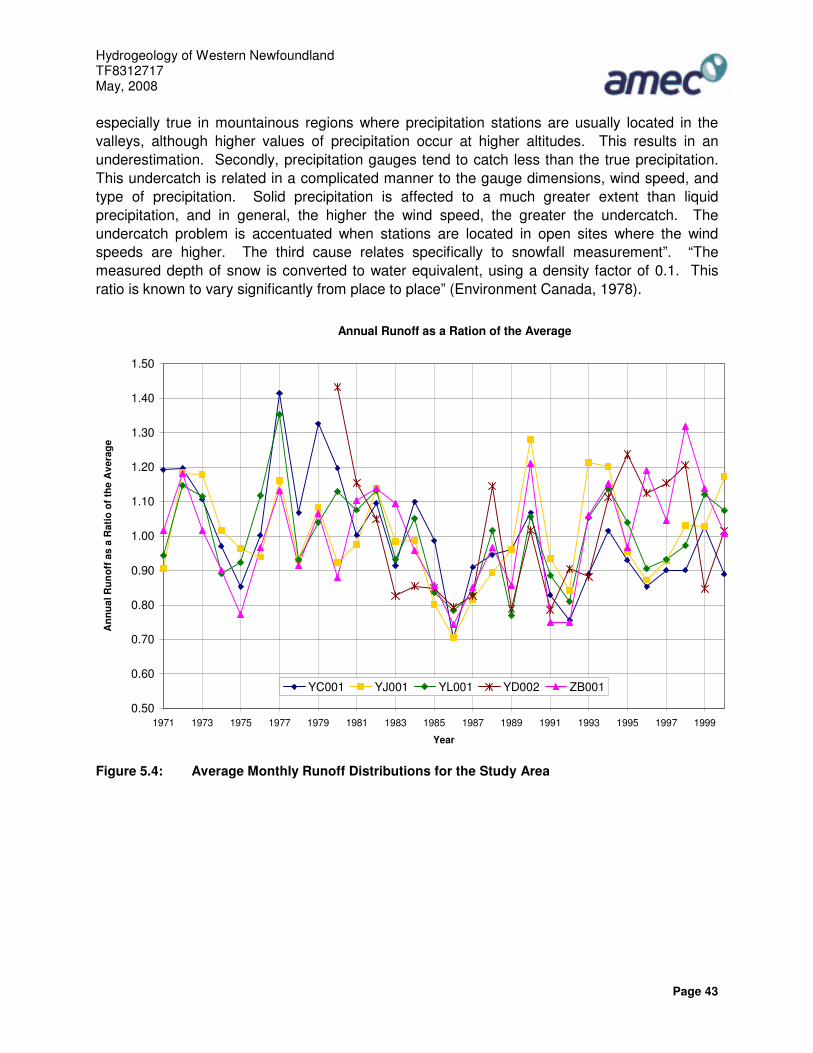
Hydrogeology of Western Newfoundland TF8312717 May, 2008
Page 43
especially true in mountainous regions where precipitation stations are usually located in the valleys, although higher values of precipitation occur at higher altitudes. This results in an underestimation. Secondly, precipitation gauges tend to catch less than the true precipitation. This undercatch is related in a complicated manner to the gauge dimensions, wind speed, and type of precipitation. Solid precipitation is affected to a much greater extent than liquid precipitation, and in general, the higher the wind speed, the greater the undercatch. The undercatch problem is accentuated when stations are located in open sites where the wind speeds are higher. The third cause relates specifically to snowfall measurement”. “The measured depth of snow is converted to water equivalent, using a density factor of 0.1. This ratio is known to vary significantly from place to place” (Environment Canada, 1978).
Annual Runoff as a Ration of the Average
0.50
0.60
0.70
0.80
0.90
1.00
1.10
1.20
1.30
1.40
1.50
1971 1973 1975 1977 1979 1981 1983 1985 1987 1989 1991 1993 1995 1997 1999
Year
Ann
ual R
unof
f as
a R
atio
of t
he A
vera
ge
YC001 YJ001 YL001 YD002 ZB001
Figure 5.4: Average Monthly Runoff Distributions for the Study Area

Hydrogeology of Western Newfoundland TF8312717 May, 2008
Page 44
Baseflow Separation - 02YC001
0
5
10
15
20
25
30
1/1 1/21 2/10 3/2 3/22 4/11 5/1 5/21 6/10 6/30 7/20 8/9 8/29 9/18 10/8 10/28 11/17 12/7 12/27
Day
Dai
ly A
vera
ge F
low
(m3/
s)
Figure 5.5: Baseflow Separation for Hydrometric Station 02YC001
Baseflow Separation - 02YD002
0
1
2
3
4
5
6
7
8
9
10
1/1 1/21 2/10 3/1 3/21 4/10 4/30 5/20 6/9 6/29 7/19 8/8 8/28 9/17 10/7 10/27 11/16 12/6 12/26
Day
Dai
ly A
vera
ge F
low
(m3/
s)
Figure 5.6: Baseflow Separation for Hydrometric Station 02YD002
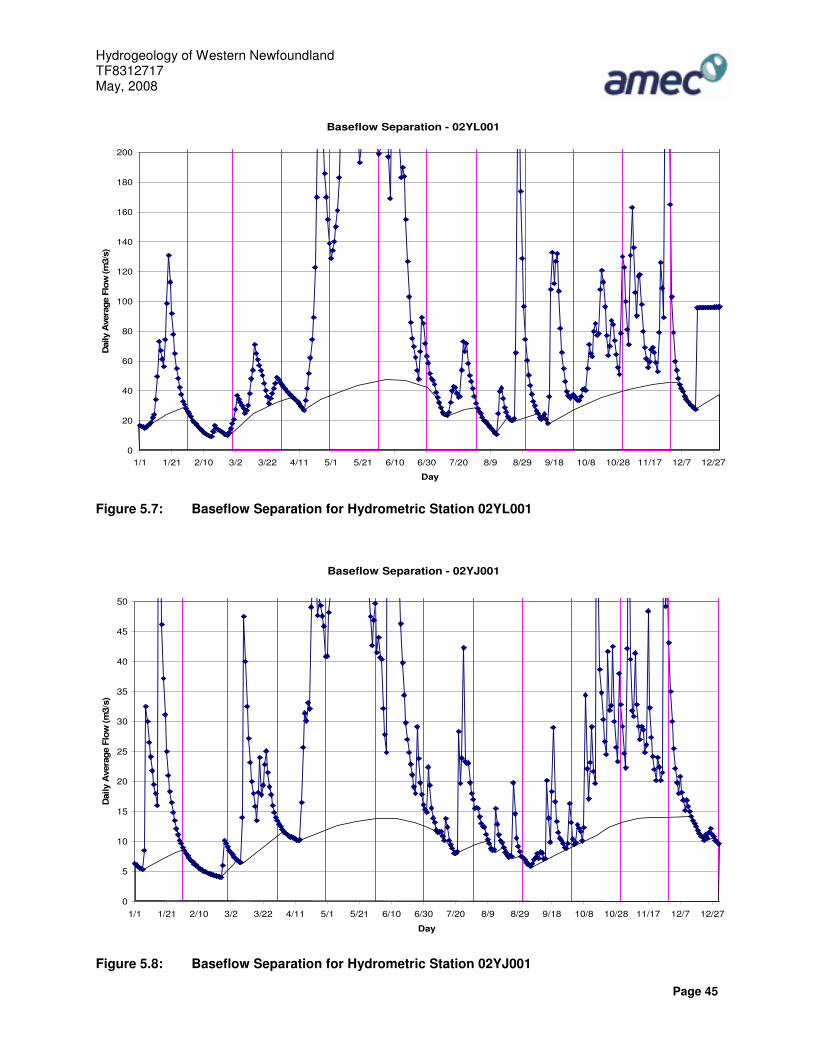
Hydrogeology of Western Newfoundland TF8312717 May, 2008
Page 45
Baseflow Separation - 02YL001
0
20
40
60
80
100
120
140
160
180
200
1/1 1/21 2/10 3/2 3/22 4/11 5/1 5/21 6/10 6/30 7/20 8/9 8/29 9/18 10/8 10/28 11/17 12/7 12/27
Day
Dai
ly A
vera
ge F
low
(m3/
s)
Figure 5.7: Baseflow Separation for Hydrometric Station 02YL001
Baseflow Separation - 02YJ001
0
5
10
15
20
25
30
35
40
45
50
1/1 1/21 2/10 3/2 3/22 4/11 5/1 5/21 6/10 6/30 7/20 8/9 8/29 9/18 10/8 10/28 11/17 12/7 12/27
Day
Dai
ly A
vera
ge F
low
(m3/
s)
Figure 5.8: Baseflow Separation for Hydrometric Station 02YJ001
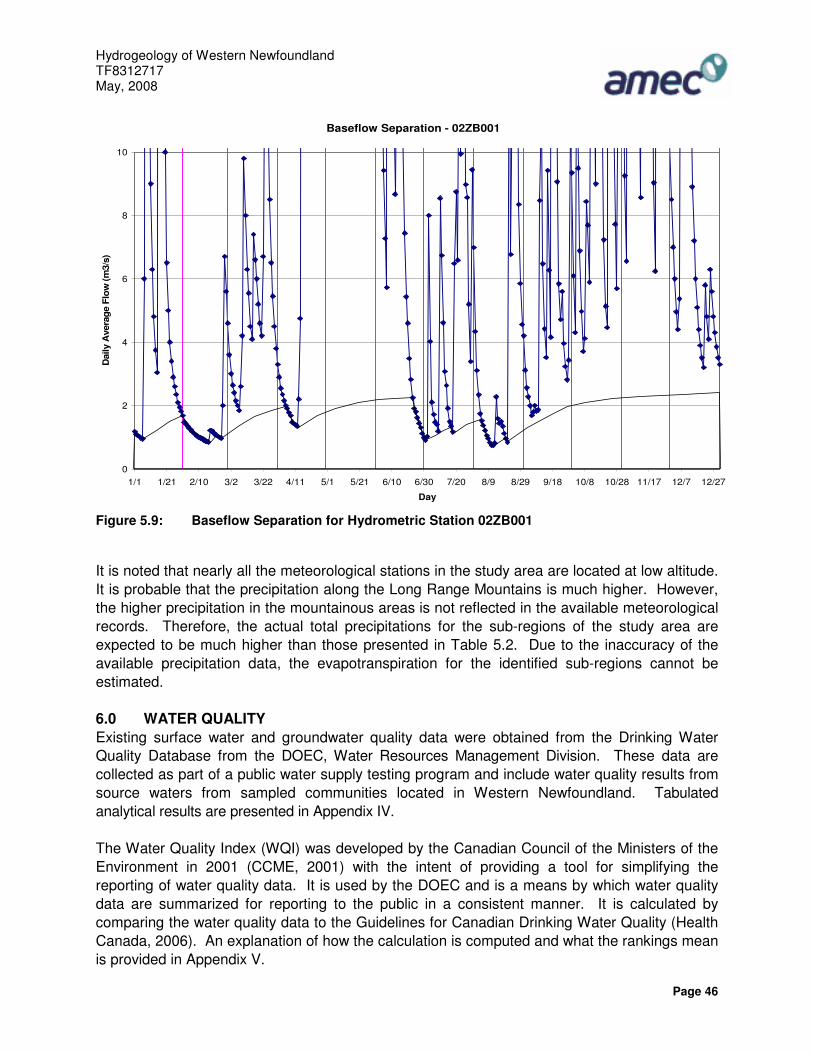
Hydrogeology of Western Newfoundland TF8312717 May, 2008
Page 46
Baseflow Separation - 02ZB001
0
2
4
6
8
10
1/1 1/21 2/10 3/2 3/22 4/11 5/1 5/21 6/10 6/30 7/20 8/9 8/29 9/18 10/8 10/28 11/17 12/7 12/27
Day
Dai
ly A
vera
ge F
low
(m3/
s)
Figure 5.9: Baseflow Separation for Hydrometric Station 02ZB001
It is noted that nearly all the meteorological stations in the study area are located at low altitude. It is probable that the precipitation along the Long Range Mountains is much higher. However, the higher precipitation in the mountainous areas is not reflected in the available meteorological records. Therefore, the actual total precipitations for the sub-regions of the study area are expected to be much higher than those presented in Table 5.2. Due to the inaccuracy of the available precipitation data, the evapotranspiration for the identified sub-regions cannot be estimated. 6.0 WATER QUALITY Existing surface water and groundwater quality data were obtained from the Drinking Water Quality Database from the DOEC, Water Resources Management Division. These data are collected as part of a public water supply testing program and include water quality results from source waters from sampled communities located in Western Newfoundland. Tabulated analytical results are presented in Appendix IV. The Water Quality Index (WQI) was developed by the Canadian Council of the Ministers of the Environment in 2001 (CCME, 2001) with the intent of providing a tool for simplifying the reporting of water quality data. It is used by the DOEC and is a means by which water quality data are summarized for reporting to the public in a consistent manner. It is calculated by comparing the water quality data to the Guidelines for Canadian Drinking Water Quality (Health Canada, 2006). An explanation of how the calculation is computed and what the rankings mean is provided in Appendix V.
Hydrogeology of Western Newfoundland TF8312717 May, 2008
Page 47
The water quality data from the study area was compared to the Guidelines for Canadian Drinking Water Quality (GCDWQ) (Health Canada, 2006) to assess the acceptability of the various water supplies. 6.1 SURFACE WATER There are 721 surface water quality records from 68 source waters within the study area. Parameters that exceed the GCDWQ include color, pH, turbidity, total dissolved solids (TDS), iron, lead and manganese. The WQI ratings vary from fair to excellent. The public water supply located in St. Anthony Bight has the lowest rating (fair) in the study area. The natural water chemistry within the study area reflects the composition of the soils and bedrock. Much of the study area is underlain by limestone; therefore, the water chemistry differs from other parts of the island. The water is more alkaline in these areas, with higher concentrations of dissolved constituents (Acres, 1994). The water in the southern portion of the study area, the Humber Valley and the eastern portion of the Northern Peninsula is softer, slightly acidic, and colored. Typical results for some of the major parameters are described below. The physical quality of the water is generally acceptable throughout the study area with the exception of color. 583 samples exceeded the GCDWQ of 15 true color units (TCU) (Health Canada, 2006). The average color value recorded for all surface water samples is 38.7 TCU, with minimum and maximum values of 1 TCU and 360 TCU. High color values are typical of surface waters near wetlands in Newfoundland and Labrador. Wetland drainage contributes high levels of color to surface runoff; whereas less organic soils or exposed bedrock in a basin contribute little to no color. The average turbidity recorded for all surface water samples is 0.83 nephelometric turbidity units (NTU) with minimum and maximum values of 0 NTU and 33.5 NTU, respectively. Approximately 10% of samples exceeded the GCDWQ of 1 NTU (Health Canada, 2006). Turbidity is a measure of how cloudy water appears and results from suspended solids and materials, such as clay and silt or microorganisms in the water. It may also be caused by naturally occurring silt and sediment runoff from watersheds. Disturbed areas, such as those with road construction, tend to have higher levels of turbidity than undisturbed areas because of increased sediment input. Approximately 20% of surface water samples had average values below the guideline for drinking water of 6.5–8.5 pH units (Health Canada, 2006). The average pH value recorded for all water supplies is 7.3 pH units, with minimum and maximum values of 5.1 and 8.8 respectively. Low pH values are typical of surface waters in Newfoundland and Labrador, due to large amounts of organic materials produced by bogs, swamps and boreal forest. Water tends to be slightly more acidic in the southern portion of the study area where the underlying geology is primarily granitic and gneissic rocks. The water is neutral to slightly basic on the west coast, where the underlying geology is primarily carbonate and other sedimentary rocks.
Hydrogeology of Western Newfoundland TF8312717 May, 2008
Page 48
Approximately 5% of samples exceeded the 0.3 mg/L drinking water guideline for iron, whereas about 2.5% of samples exceeded the 0.05 mg/L drinking water guideline for manganese. Iron and manganese concentrations are primarily an aesthetic objective and do not present a health concern unless in excessive concentrations (Acres, 1994). The ions enter the water system through geochemical weathering and from native soils and bedrock. 6.2 GROUNDWATER Groundwater is subject to the chemical properties of bedrock and overlying unconsolidated sediments. There are 606 groundwater quality records from 56 source waters located in the study area. These source waters are from municipal wells that are collected as part of a public water supply testing program. For the most part, the chemical composition of the groundwater reflects the geochemistry of the adjacent bedrock or unconsolidated sediments and is similar to the surface water chemistry. However, because the groundwater is less dilute, the concentrations of dissolved constituents tend to be higher than the corresponding surface water. No information regarding well type, well depth or lithology is provided. Assignment of the water chemistry data to various hydrostratigraphic units is based entirely upon the geologic units underlying the various communities. Unfortunately, only 5 of the 8 units within Western Newfoundland have groundwater chemistry information (Surficial Unit B and Bedrock Units 1, 2, 3, and 4). Where it existed, the groundwater chemistry was discussed in relation to the hydrostratigraphic unit based on major ion chemistry represented by trilinear diagrams (explained in Section 6.2.1) and the WQI. Parameters that exceed the GCDWQ include color, pH, turbidity, TDS, iron, lead and manganese, arsenic, sodium and chloride. The WQI ratings vary from good to excellent. 6.2.1 Trilinear Diagrams The major ionic species in most natural waters are Na+, K+, Ca+, Mg+, Cl-, CO3
2-, HCO3, and SO4 (Fetter, 1994). A trilinear diagram shows the percentage composition of three ions. By grouping Na+ and K+ together, the major cations can be displayed on one trilinear diagram. Likewise, if CO3
2- and HCO3 are grouped, there are also three groups of the major anions. Figure 6.1 shows the form of a trilinear diagram that is commonly used in water-chemistry studies (Piper, 1944). Analyses are plotted on the basis of the percent of each cation (or anion). The diamond-shaped field between the two triangles is used to represent the composition of water with respect to both cations and anions. The diagram presented in Figure 6.1 is useful for visually describing differences in major-ion chemistry in groundwater flow systems. However, there is also a need to be able to refer to water compositions by identifiable groups or categories. For this purpose, the concept of hydrochemical facies was developed by Back (1966). The term hydrochemical facies is used to describe the bodies of groundwater, in an aquifer, that differ in their chemical composition. The facies are a function of the lithology, solution kinetics, and flow patterns of the aquifer (Back, 1966). As shown in Figure 6.2, hydrochemical facies can be classified on the basis of the dominant ions by means of a trilinear diagram.
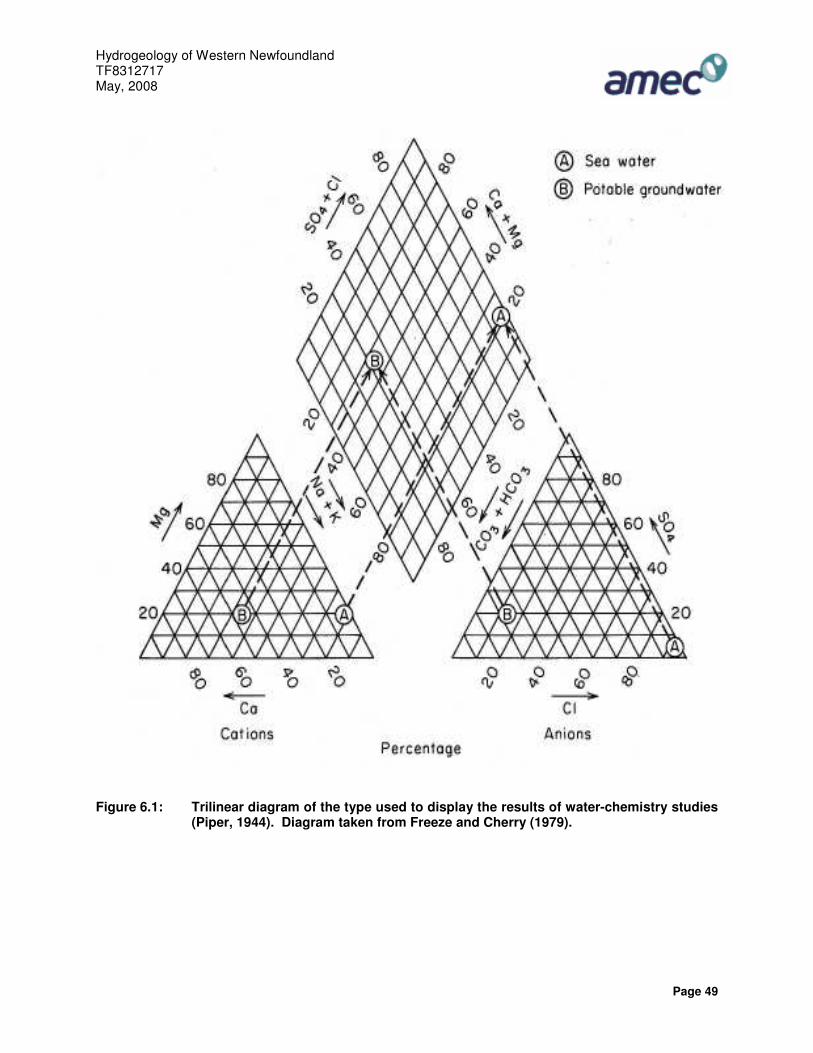
Hydrogeology of Western Newfoundland TF8312717 May, 2008
Page 49
Figure 6.1: Trilinear diagram of the type used to display the results of water-chemistry studies (Piper, 1944). Diagram taken from Freeze and Cherry (1979).
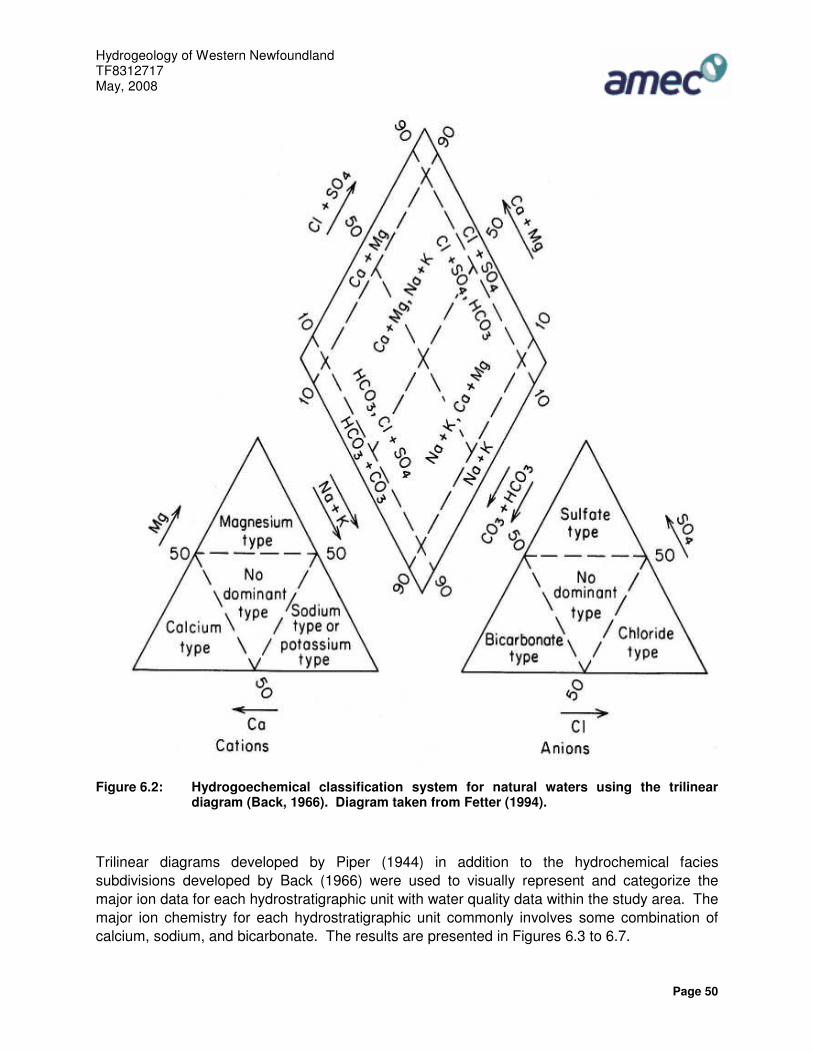
Hydrogeology of Western Newfoundland TF8312717 May, 2008
Page 50
Figure 6.2: Hydrogoechemical classification system for natural waters using the trilinear diagram (Back, 1966). Diagram taken from Fetter (1994).
Trilinear diagrams developed by Piper (1944) in addition to the hydrochemical facies subdivisions developed by Back (1966) were used to visually represent and categorize the major ion data for each hydrostratigraphic unit with water quality data within the study area. The major ion chemistry for each hydrostratigraphic unit commonly involves some combination of calcium, sodium, and bicarbonate. The results are presented in Figures 6.3 to 6.7.
Hydrogeology of Western Newfoundland TF8312717 May, 2008
Page 51
Unit B: 105 samples from 8 source waters were identified for surficial Unit B. Communities with source waters in Unit B include Flat Bay, Flat Bay West, Barachois Brook, Mattis Point and Stephenville Crossing. Based on the trilinear diagram represented in Figure 6.3, the groundwater from Unit B can generally be described as one of three types. The cation base triangle demonstrates a trend from calcium to sodium-potassium dominated water. The anion base triangle demonstrates domination of bicarbonate (HCO3) anions relative to chloride (Cl) with the exception of #1 Well Flat Bay and #3 Well Flat Bay, which are both chloride dominant. Na-Cl waters, which can be indicative of contamination by brines, were encountered in all samples from #1 Well Flat Bay. All waters within Unit B are classified by the WQI as excellent, with the exception of waters from Flat Bay which were classified as good to excellent. Parameters that exceeded the GDCWQ in the Flat Bay area were pH, arsenic, sodium, chloride and TDS.
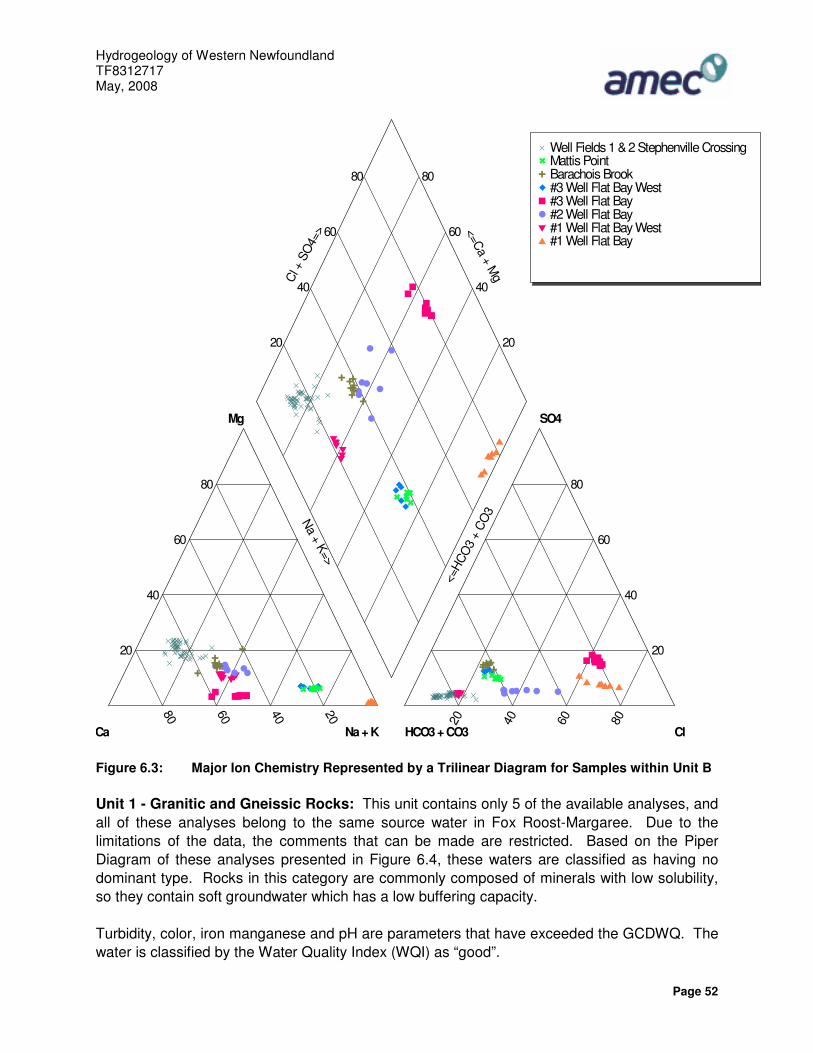
Hydrogeology of Western Newfoundland TF8312717 May, 2008
Page 52
80 60 40 20 20 40 60 80
20
40
60
80
20
40
60
80
20
40
60
80
20
40
60
80
Ca Na + K HCO3 + CO3 Cl
Mg SO4
<=HC
O3
+ CO
3Na + K=>
<=Ca + MgCl
+ S
O4=
>
�
�
�
�
�
�
�
�
�
�
�
�
�
�
�
�
�
�
�
�
�
�
�
�
�
�
�
�
�
�
�
�
�
�
�
�
�
�
�
�
�
�
�
�
�
�
�
�
�
�
�
�
�
�
�
�
�
�
�
�
�
�
�
�
�
�
�
�
�
�
�
�
�
�
�
�
�
�
�
�
�
�
�
�
�
�
�
�
�
�
�
�
�
�
�
�
�
�
�
�
�
�
�
�
�
�
�
�
�
�
�
�
�
�
� �
�
��
�
��
�
� �
�
� �
�
� �
�
� �
�
� �
�
� �
�
�
�
�
�
�
�
��
�
��
�
�
�
�
��
�
�
�
�
�
�
�
�
�
�
�
�
�
�
�
�
�
�
�
�
�
�
�
�
�
�
�
�
�
�
�
�
�
�
�
�
�
�
�
�
�
�
�
�
�
�
�
�
�
�
�
�
�
�
�
�
�
�
�
�
�
�
�
�
�
�
�
�
�
�
�
�
�
�
�
�
�
�
�
�
�
�
�
�
�
�
�
�
�
�
�
�
�
�
�
�
�
�
�
�
�
�
�
�
�
�
�
�
�
�
�
�
�
�
�
�
�
�
�
�
�
�
�
�
�
�
�
�
�
�
�
�
�
�
�
�
�
�
�
�
�
�
�
�
�
�
�
�
�
�
�
�
�
�
� Well Fields 1 & 2 Stephenville Crossing� Mattis Point� Barachois Brook� #3 Well Flat Bay West� #3 Well Flat Bay� #2 Well Flat Bay� #1 Well Flat Bay West� #1 Well Flat Bay
Figure 6.3: Major Ion Chemistry Represented by a Trilinear Diagram for Samples within Unit B Unit 1 - Granitic and Gneissic Rocks: This unit contains only 5 of the available analyses, and all of these analyses belong to the same source water in Fox Roost-Margaree. Due to the limitations of the data, the comments that can be made are restricted. Based on the Piper Diagram of these analyses presented in Figure 6.4, these waters are classified as having no dominant type. Rocks in this category are commonly composed of minerals with low solubility, so they contain soft groundwater which has a low buffering capacity. Turbidity, color, iron manganese and pH are parameters that have exceeded the GCDWQ. The water is classified by the Water Quality Index (WQI) as “good”.
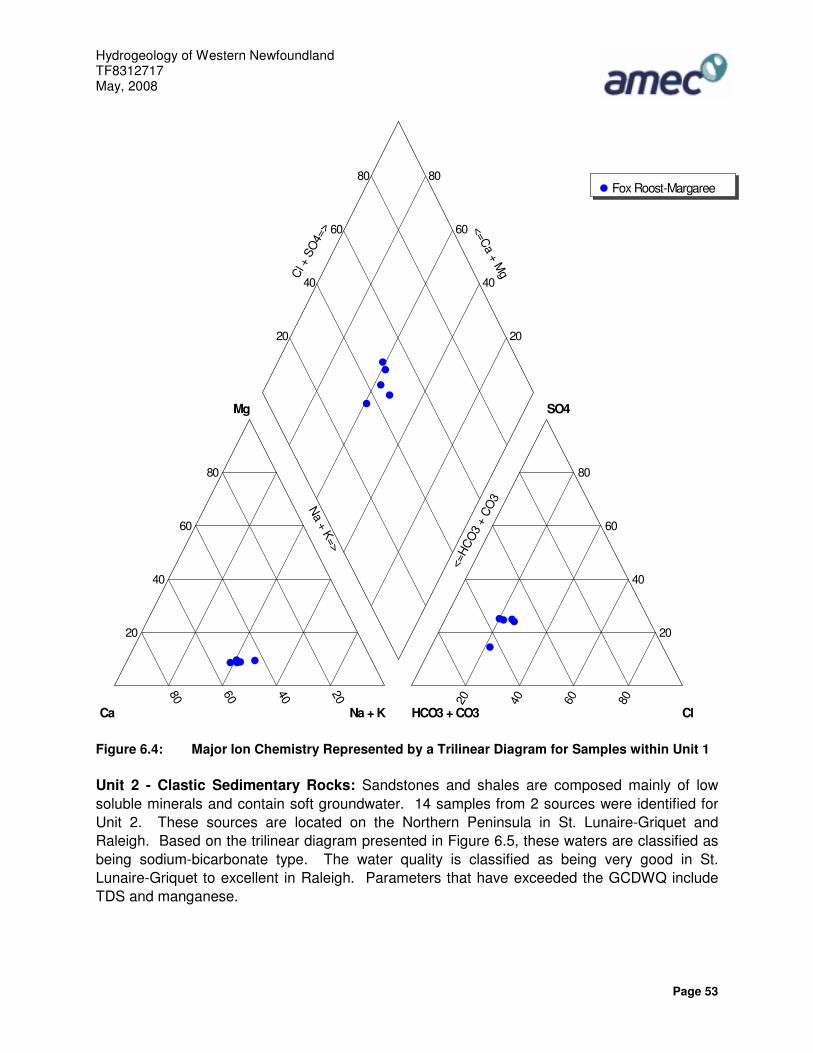
Hydrogeology of Western Newfoundland TF8312717 May, 2008
Page 53
80 60 40 20 20 40 60 8020
40
60
80
20
40
60
80
20
40
60
80
20
40
60
80
Ca Na + K HCO3 + CO3 Cl
Mg SO4
<=HC
O3
+ CO
3Na + K=>
<=Ca + MgCl
+ S
O4=
>
�
�
�
�
�
�
�
�
�
�
�
�
�
�
�
� Fox Roost-Margaree
Figure 6.4: Major Ion Chemistry Represented by a Trilinear Diagram for Samples within Unit 1 Unit 2 - Clastic Sedimentary Rocks: Sandstones and shales are composed mainly of low soluble minerals and contain soft groundwater. 14 samples from 2 sources were identified for Unit 2. These sources are located on the Northern Peninsula in St. Lunaire-Griquet and Raleigh. Based on the trilinear diagram presented in Figure 6.5, these waters are classified as being sodium-bicarbonate type. The water quality is classified as being very good in St. Lunaire-Griquet to excellent in Raleigh. Parameters that have exceeded the GCDWQ include TDS and manganese.
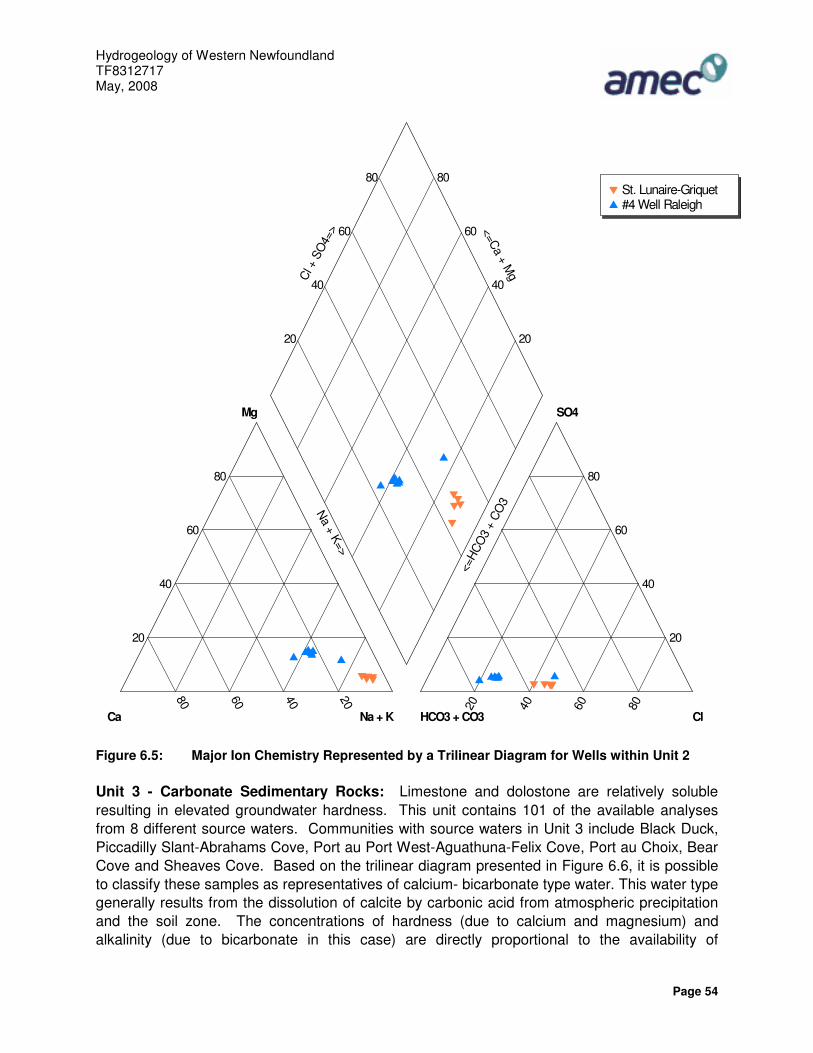
Hydrogeology of Western Newfoundland TF8312717 May, 2008
Page 54
80 60 40 20 20 40 60 8020
40
60
80
20
40
60
80
20
40
60
80
20
40
60
80
Ca Na + K HCO3 + CO3 Cl
Mg SO4
<=HC
O3
+ CO
3Na + K=>
<=Ca + MgCl
+ S
O4=
>
�
�
�
�
�
�
�
�
�
�
�
�
�
�
�
�
�
�
�
�
�
�
�
�
� �
�
��
�
��
�
��
�
��
�
� St. Lunaire-Griquet� #4 Well Raleigh
Figure 6.5: Major Ion Chemistry Represented by a Trilinear Diagram for Wells within Unit 2 Unit 3 - Carbonate Sedimentary Rocks: Limestone and dolostone are relatively soluble resulting in elevated groundwater hardness. This unit contains 101 of the available analyses from 8 different source waters. Communities with source waters in Unit 3 include Black Duck, Piccadilly Slant-Abrahams Cove, Port au Port West-Aguathuna-Felix Cove, Port au Choix, Bear Cove and Sheaves Cove. Based on the trilinear diagram presented in Figure 6.6, it is possible to classify these samples as representatives of calcium- bicarbonate type water. This water type generally results from the dissolution of calcite by carbonic acid from atmospheric precipitation and the soil zone. The concentrations of hardness (due to calcium and magnesium) and alkalinity (due to bicarbonate in this case) are directly proportional to the availability of

Hydrogeology of Western Newfoundland TF8312717 May, 2008
Page 55
carbonate minerals in the overburden or in the bedrock of the flow system, up to the point of carbonate mineral saturation. Based on the WQI, waters from Unit 3 are classified as very good to excellent. Color regularly exceeded the GCDWQ, whereas turbidity and TDS exceeded the GCDWQ once and twice, respectively. Petroleum and natural gas in some of the Unit 3 formations have associated hydrogen sulfide, which gives groundwater an offensive odor (Water Resources Atlas, 1992).
80 60 40 20 20 40 60 80
20
40
60
80
20
40
60
80
20
40
60
80
20
40
60
80
Ca Na + K HCO3 + CO3 Cl
Mg SO4
<=HC
O3
+ CO
3Na + K=>
<=Ca + MgCl
+ S
O4=
>
�
�
�
�
�
�
�
�
�
�
�
�
�
�
�
�
�
�
�
�
�
�
�
�
�
�
�
�
�
�
�
�
�
�
�
�
�
�
�
�
�
�
�
�
�
�
�
�
�
�
�
�
�
�
�
�
�
�
�
�
�
�
�
�
�
�
�
�
�
�
�
�
�
�
�
�
�
�
�
�
�
�
�
�
�
�
�
�
�
�
�
�
�
�
�
�
�
�
�
�
�
�
�
�
�
�
�
�
�
�
�
�
�
�
�
�
�
� �
�
�
�
�
��
�
��
�
�
�
�
�
�
�
�
�
�
�
�
�
�
�
�
�
�
�
�
�
�
Well Field Port au Choix� Upper Bear Cove� Sheaves Cove� Lower Bear Cove� #2 Well Black Duck� #1 Well Black Duck #1 Well - Piccadilly Slant� #1 & #3 Port au Port West-Aguathuna-Felix Cove
Figure 6.6: Major Ion Chemistry Represented by a Trilinear Diagram for Wells within Unit 3
Unit 4 - Carboniferous Sedimentary Rocks: Water quality considerations related to high salinity is an issue in Unit 4. Limestone, gypsum and salt tend to dissolve along flow paths, causing greater flow capacity and increase mineral content. This unit contains 252 of the
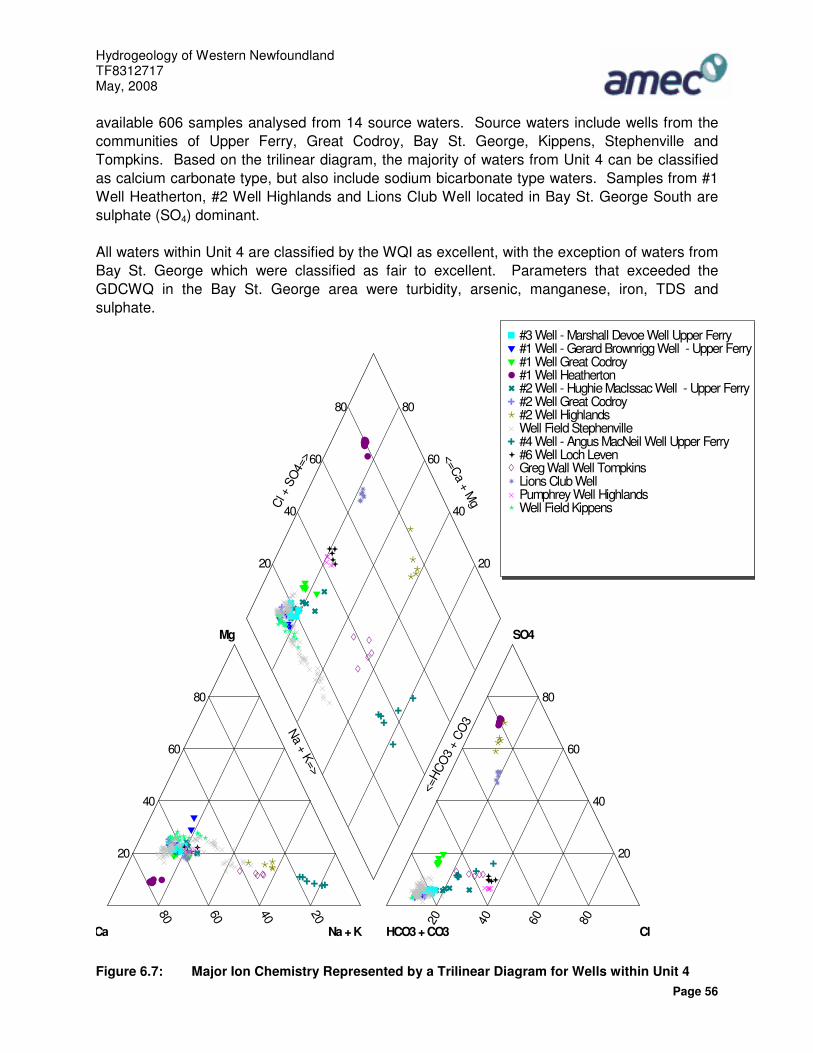
Hydrogeology of Western Newfoundland TF8312717 May, 2008
Page 56
available 606 samples analysed from 14 source waters. Source waters include wells from the communities of Upper Ferry, Great Codroy, Bay St. George, Kippens, Stephenville and Tompkins. Based on the trilinear diagram, the majority of waters from Unit 4 can be classified as calcium carbonate type, but also include sodium bicarbonate type waters. Samples from #1 Well Heatherton, #2 Well Highlands and Lions Club Well located in Bay St. George South are sulphate (SO4) dominant. All waters within Unit 4 are classified by the WQI as excellent, with the exception of waters from Bay St. George which were classified as fair to excellent. Parameters that exceeded the GDCWQ in the Bay St. George area were turbidity, arsenic, manganese, iron, TDS and sulphate.
80 60 40 20 20 40 60 80
20
40
60
80
20
40
60
80
20
40
60
80
20
40
60
80
Ca Na + K HCO3 + CO3 Cl
Mg SO4
<=HC
O3
+ CO
3Na + K=>
<=Ca + MgCl
+ S
O4=
>
�
�
�
�
�
�
�
�
�
�
�
�
�
�
�
��
�
� �
�
��
�
�
�
�
��
�
�
�
�
�
�
�
�
�
�
�
�
�
�
�
�
�
�
�
�
�
�
�
�
�
�
�
�
�
�
�
�
�
�
�
�
�
�
�
�
�
�
�
�
�
�
�
�
�
�
�
�
�
�
�
�
�
�
�
�
�
�
�
�
�
�
�
�
�
�
�
�
�
�
�
�
�
�
�
�
�
�
�
�
�
�
�
�
�
�
�
�
�
�
� �
�
�
�
�
��
�
��
�
�
�
�
� �
�
�
�
�
�
�
�
�
�
�
�
�
�
�
�
�
�
�
�
�
�
�
�
�
�
�
�
�
�
�
�
�
�
�
�
�
�
�
�
�
�
�
�
�
�
�
�
�
�
�
�
�
�
�
�
�
�
�
�
�
�
�
�
�
�
�
�
�
�
�
�
�
�
�
�
�
�
�
�
�
�
�
�
�
�
�
�
�
�
�
�
�
�
�
�
�
�
�
�
�
�
�
�
�
�
�
�
�
�
�
�
�
�
�
�
�
�
�
�
�
�
�
�
�
�
�
�
�
�
�
�
�
�
�
�
�
�
�
�
�
�
�
�
�
�
�
�
�
�
�
�
�
�
�
�
�
�
�
�
�
�
�
�
�
�
�
�
�
�
�
�
�
�
�
�
�
�
�
�
�
�
�
�
�
�
�
�
�
�
�
�
�
�
�
�
�
�
�
�
�
�
�
�
�
�
�
�
�
�
�
�
�
�
�
�
�
�
�
�
�
�
�
�
�
�
�
�
�
�
�
�
�
�
�
�
�
�
�
�
�
�
�
�
�
�
�
�
�
�
�
�
�
�
�
�
�
�
�
�
�
�
�
�
�
�
�
�
�
�
�
�
�
�
�
�
�
�
�
�
�
�
�
�
�
�
�
�
�
�
�
�
�
�
�
�
�
�
�
�
�
�
�
�
�
�
�
�
�
�
�
�
�
�
�
�
�
�
�
�
�
�
�
�
�
�
�
�
�
�
�
�
�
�
�
�
�
�
�
�
�
�
�
�
�
�
�
�
�
�
�
�
�
�
�
�
�
�
�
�
�
�
�
�
�
�
�
�
�
�
�
�
�
�
�
�
�
�
�
�
�
�
�
�
�
�
�
�
�
�
�
�
�
�
�
�
�
�
�
�
�
�
�
�
�
�
�
�
�
�
�
�
�
�
�
�
�
�
�
� #3 Well - Marshall Devoe Well Upper Ferry� #1 Well - Gerard Brownrigg Well - Upper Ferry� #1 Well Great Codroy� #1 Well Heatherton� #2 Well - Hughie MacIssac Well - Upper Ferry� #2 Well Great Codroy� #2 Well Highlands� Well Field Stephenville� #4 Well - Angus MacNeil Well Upper Ferry� #6 Well Loch Leven Greg Wall Well Tompkins Lions Club Well� Pumphrey Well Highlands� Well Field Kippens
Figure 6.7: Major Ion Chemistry Represented by a Trilinear Diagram for Wells within Unit 4
Hydrogeology of Western Newfoundland TF8312717 May, 2008
Page 57
6.3 POTENTIAL AND EXISTING GROUNDWATER QUALITY CONCERNS In addition to naturally occurring mineralized sources, anthropogenic sources often lead to groundwater quality degradation. The potential groundwater quality degradation within the study area may occur due to sewage effluent, salt water intrusion, petroleum products, solid waste disposal leachate, road salt, pulp and paper, and mine wastes. Shallow aquifers or aquifers located in highly permeable units (e.g., sand and gravel) are most susceptible to contaminants originating from surface water conditions due to high permeabilites. 6.3.1 Sewage Effluent Contamination problems related to sewage effluent from septic systems can potentially affect shallow, dug wells and poorly cased drilled wells. Contamination by sewage is a major area of concern with respect to groundwater quality within the study area. Dug wells and poorly constructed drilled wells are common in many small, rural communities (Golder Associates, 1983). Bacterial generation from human waste in septic systems and outhouses, as well as animal waste, can be introduced into a shallow well either through surface runoff or direct infiltration. Infiltration of bacteria into a well is commonly encountered where the shallow well is located in close proximity to the contaminant source (Golder Associates, 1985). Groundwater contamination problems that arise are commonly related to the presence of nitrogen, ammonia, phosphate, chloride and bacteria. Problems encountered with surface runoff tend to be related to poor well construction which allows direct introduction of surface water into the well system. This problem can usually be eliminated by ensuring the casing is grouted, completely isolating the well from surface water. 6.3.2 Salt Water Intrusion Pumping of groundwater from coastal aquifers may lower the water table and induce saline groundwater to move into the formerly freshwater aquifers. The likelihood of a well encountering this problem is usually dependent upon the well’s proximity to the coast, the depth of the well, the dip of the geological formation, the orientation/permeability of fracture zones within the well and/or the pumping rate. Salt water intrusion can often be controlled in a limited fashion by reduced pumping of the well. Each case, however, must be assessed on an individual basis due to variations of the geological and hydraulic characteristics of the flow system. Areas of potential risk for salt water intrusion due to low coastal topography are considered to occur in the York Harbour area of the Bay of Islands and the Norris Point-Rocky Harbour areas of Bonne Bay (Golder Associates, 1983). 6.3.3 Petroleum Products Contamination of well water supplies by petroleum products can occur from a variety of sources. The most common sources are from above ground storage tanks (ASTs) and underground storage tanks (USTs). Ruptures or leaks in the tanks can release chemicals, which then seep into the ground. The recent activity of drilling for oil within the study area is also a potential
Hydrogeology of Western Newfoundland TF8312717 May, 2008
Page 58
groundwater quality concern. Trace concentrations of petroleum chemicals can contaminate water in both shallow and deep wells for long periods of time. 6.3.4 Solid Waste Disposal Leachate All solid waste disposal facilities produce a fluid by-product referred to as leachate. This fluid is produced by precipitation that migrates downward, through the surficial materials, dissolving soluble organic and inorganic components of the waste material and the evolution of dissolved gases. This leachate eventually enters the water table. Proper site selection, design, and maintenance of such facilities will minimize the effect on groundwater supplies. Waste disposal sites should be located in areas where there are no down-gradient wells and where there are sufficient quantities of overburden material for adequate burial which will allow for downward infiltration to avoid the formation of surface leachate springs. For this reason, areas of thick till are desirable. Sand and gravel deposits are undesirable due to their potential as aquifers (Golder Associates, 1985). 6.3.5 Road Salt The use of road salt for winter de-icing purposes can result in chloride and/or sodium groundwater contamination. This is a problem that may affect shallow, dug wells that are in close proximity to roads. The salt is carried from the roadway as runoff and may wash into surface streams or seep into the groundwater. Depending on the nature of the flow system, down-gradient contamination of wells may not occur for months after road salt applications have stopped, as contaminants are flushed through the system. Chemically, it is difficult to distinguish between chloride and sodium produced by road salt, salt water intrusion, marine aerosols, or natural groundwaters from salt bearing geological formations. 6.3.6 Pulp and Paper Industry Pulp and paper mills produce bark waste which can present a groundwater quality problem. Wastes of this type are capable of generating a leachate containing tannic acids and dissolved organic constituents with high biological oxygen demand. Care should be taken when placing a well near such a facility. 6.3.7 Mine Waste In the study area both mine tailings and mine waste rock are stored at the surface. The leaching action of rainwater on mine waste contributes to acidic groundwater and metal leaching conditions. To date, these operations are in remote areas and do not pose any immediate threats to groundwater quality. However, consideration must be given at the development stages of mining operations to prevent problems related to acid generation and drainage which are generally associated with water containing high concentrations of dissolved heavy metals (Golder, 1985). 7.0 SPRING USAGE Springs are locations where the piezometric surface intersects the ground level. They are vulnerable to pollution and contaminants just like groundwater. Springs may form because of cracks or fractures in the rock or due to impermeable rock layers forcing water to flow out of the ground. In western Newfoundland, springs may occur where underground drainage patterns are associated with limestone cave systems. According to Nicol (2008), roughly 12 percent of

Hydrogeology of Western Newfoundland TF8312717 May, 2008
Page 59
residents in Corner Brook use springs as their main source of drinking water. This jumps to 40% in Steady Brook, 50% in Baie Verte and 70% in Stephenville (based on telephone surveys). 20 communities in western Newfoundland were surveyed and the rate of spring usage was 20 to 30%. Consistently high levels of contamination are present in three springs near the community of Cox’s Cove in the Bay of Islands and in the Robinsons-Jeffries- St. David’s area of western Newfoundland (Nicol, 2008). 8.0 CONCLUSIONS The overburden and bedrock strata within Western Newfoundland are capable of producing low to high potential well yields. Accordingly, groundwater has been utilized in populated areas for domestic, municipal, commercial and industrial supplies. The sand and gravel deposits of surficial hydrostratigraphic Unit B have the greatest groundwater potential of any of the hydrostratigraphic units in the study area. The average yield is 74 L/min from an average depth of 29.0 m. However, the results of 77 aquifer tests indicate an average yield of 131 L/min. Based on the aquifer test data, Unit B offers excellent potential to meet any domestic, industrial, commercial or industrial needs. Sand and gravel deposits are also most susceptible to contaminants originating from surface water conditions due to high permeabilites. The well records indicate that the sedimentary, volcanic and metamorphic strata underlying the study area are capable of producing a broad range of well yields. In general, granitic rocks, metamorphic rocks and ophiolite complexes are considered to provide low well yields averaging 27 L/min, 18 L/min and 20 L/min, respectively. Sedimentary strata of Units 2, 3 and 4 offer the highest yields in the bedrock strata within the study area averaging 33 L/min, 37 L/min and 64 L/min, respectively. Hydrostratigraphic Unit 4 is the most productive and widely utilized aquifer unit. This unit is comprised of Carboniferous age sedimentary strata of the Anguille, Deer Lake, Codroy and Barachois Groups. They consist mainly of sandstone, conglomerate and shale, but also contain limestone, salt, gypsum and coal. The average yield is 64 L/min from an average depth of 38 m. The results of the 88 aquifer tests completed in Unit 4 suggest that the average yield is 126 L/min. Unit 4 offers excellent potential to meet any domestic groundwater needs and limited industrial, commercial or industrial needs. The natural surface water chemistry within the study area reflects the composition of the soils and bedrock. Much of the study area is underlain by limestone; therefore the water chemistry differs from other parts of the island. The water is more alkaline in these areas, with higher concentrations of dissolved constituents. The water in the southern portion of the study area, the Humber Valley and the eastern portion of the Northern Peninsula is softer, slightly acidic, and colored. Groundwater quality data within the study area are limited to public water supply testing carried out by the DOEC. This chemical data are not entirely representative of the groundwater quality
Hydrogeology of Western Newfoundland TF8312717 May, 2008
Page 60
within the study area. However, based on the public water supply data, the quality of the groundwater is generally quite acceptable, and in most cases falls within the criteria established for drinking water purposes. Groundwater quality within the study area tends to be of calcium bicarbonate to sodium bicarbonate type that locally varies from soft to hard. Concentrations of iron and manganese are locally encountered. Soft water can be anticipated from the granitic terrain whereas hard water can be anticipated from the sedimentary strata containing limestone and dolostones. Streamflow data were analyzed to determine the groundwater discharge as reflected in the baseflow component of total streamflow for given drainage divisions. Based on the correlation between groundwater stage and stream discharge, it was estimated that groundwater contribution to streamflow ranged from 12 to 37%.
Hydrogeology of Western Newfoundland TF8312717 May, 2008
Page 61
9.0 REFERENCES
Acres International Limited. 1990. Regional Water Resources Study of the Northern Peninsula and Humber Valley. Government of Newfoundland and Labrador, Department of Environment and Lands, Water Resources Division, Report WRD-SW-1-4.
Acres International Limited. 1994. Water Resources Study of the Southwestern Newfoundland Region. Government of Newfoundland and Labrador, Department of Environment, Water Resources Division and Environment Canada, Environment Conservation Branch, Strategies Division.
Back, W. 1966. Hydrochemical facies and groundwater flow patterns in northern part of Atlantic coastal plain. U.S. Geological Survey Professional Paper 498-A.
Batterson, M.J., Catto, N.R. 2001. Topographically-controlled deglacial history of the Humber River Basin, western Newfoundland. In Geographie physique et Quaternaire, v. 55, no. 3, p. 213-228.
Batterson, M.J. 2003. Quaternary Geography and Sedimentology of the Humber River Basin and Adjacent Areas. Newfoundland and Labrador Department of Mines and Energy. Geological Survey. Report 03-02. 194 pages.
Cawood, P.A., McCausland, P., Dunning, G. 2001. Opening Iapetus: Constraints from the Laurentian Margin in Newfoundland. GSA Bulletin, April 2001; v.113; no.4; p. 442-453.
CCME. 2001. Canadian water quality guidelines for the protection of aquatic life: CCME Water Quality Index 1.0 Technical Report. In: Canadian environmental quality guidelines, Winnipeg, Manitoba.
Colman-Sadd, S. P., Crisby-Whittle, L. V. J. (compilers). 2005. Partial bedrock geology dataset for the Island of Newfoundland (NTS 02E, 02F, 02L, 02M, 11O, 11P, 12A, 12B, 12G, 12H, 12I, 12P and parts of 01M, 02D). Newfoundland and Labrador Department of Natural Resources Geological Survey, Open File NFLD/2616 version 6.0.
Cooper, M., Weissenberger, J., Knight, I., Hostad, D., Gillepsie, D., Williams, H., Burden, E., Porter-Dhaudry, J., Rae, D., Clark, E. 2001. Basin Evolution in western Newfoundland: New Insights from hydrocarbon exploration. AAPG Bulletin, v. 85, No. 3 (March 2001), pp. 393-418.
Department of Environment and Lands. 1992. Water Resources Atlas of Newfoundland and Labrador 1950-1994. Water Resources Division, Department of Environment and Lands, Government of Newfoundland and Labrador, St. John’s 79 pages.
Environment Canada. 1978. Hydrological Atlas of Canada. Canadian National Committee for the International Hydrological Decade. Ottawa. 6 pages, 68 leaves.
Environment Canada. 1987. Reference Index, Hydrometric Map Supplement, Atlantic Provinces. Inland Water Directorate, Water Resources Branch, Water Survey of Canada, Ottawa.
Environment Canada. 2008. http://climate.weatheroffice.ec.gc.ca
Hydrogeology of Western Newfoundland TF8312717 May, 2008
Page 62
Fetter, C.W., 1994. Applied Hydrogeology 3rd Edition. Upper Saddle River, N.J. Prentice Hall.
Freeze, R. A., Cherry, J A. 1979. Groundwater. Englewood Cliffs, N.J. Prentice Hall.
Golder Associates. 1983. Hydrogeology of the Humber Valley Area. Government of Newfoundland and Labrador, Department of Environment, Water Resources Division, Groundwater Branch, Report 2-5.
Golder Associates. 1985. Hydrogeology of the St. George’s Bay Area. Government of Newfoundland and Labrador, Department of Environment, Water Resources Division, Groundwater Branch, Report 2-8.
Government of Newfoundland and Labrador, Department of Environment, Water Resources Division, Water Resources Management Division. 2005. Water Well Data for Newfoundland and Labrador, unpublished.
Grant, D.R. 1992. Quaternary geology of St. Anthony-Blanc Sablon area, Newfoundland and Quebec. Geological Survey of Canada, Memoir 42, 60 pages.
Grant, D.R. 1994. Quaternary geology of Port Saunders map area, Newfoundland. Geological Survey of Canada, Paper 91-20, 59 pages.
Hayes, J.P. 1987, modified by Williams, H. 2004. Generalized Interpretive Map-Newfouindland Appalachians. Geological Survey, Department of Natural Resources, Government of Newfoundland and Labrador, St. John’s.
Health Canada. 2006. Summary of Guidelines for Canadian Drinking Water Quality. Prepared by the Federal-Provincial-Territorial Committee on Drinking Water of the Federal-Provincial-Territorial Committee on Environment and Occupational Health, April 2006.
Howse, A.F. 2004. Industrial mineral potential of the Lower Paleozoic carbonate rocks of western Newfoundland. Newfoundland and Labrador Department of Mines and Energy, Geological Survey, Open File NFLD/2853, 61 pages.
Kerr, A. 2006. Silurian Rocks of the Sops Arm Group, Western Newfoundland: Some New Food for Future Digestion. In Current Research Newfoundland and Labrador Department of Natural Resources, Geological Survey, Report 06-1, pages 91-117.
Knight, I., Cawood, P.A. 1991. Paleozoic geology of western Newfoundland: an exploration of a deformed Cambro-Ordovician passive margin and foreland basin, and Carboniferous successor basin: St. John’s, Newfoundland, Center for Earth Resources Research, 403 p.
Knight, I., James, N.P., Lane, T.E. 1991. The Ordovician St. George unconformity, northern Appalachians: The relationship of plate convergence at the St. Lawrence Promontory to the Sauk/Tippecane sequence boundary. Geological Society of America Bulletin, v. 103, p. 1200-1255.
Knight, I., Azmy, K., Greene, M.G., Lavoie, D. 2007. Lithostratigraphic setting of diagenetic, isotopic, and geochemistry of Ibexian and Whiterockian carbonate rocks of the St. George and Table Head groups, western Newfoundland. In Current Research
Hydrogeology of Western Newfoundland TF8312717 May, 2008
Page 63
Newfoundland and Labrador Department of Natural Resources, Geological Survey, Report 07-1, pages 55-84.
Liverman, D.G.E., Taylor, D.M. 1990. Surficial geology of insular Newfoundland; preliminary version: Newfoundland Department of Mines and Energy, Geological Survey Branch Map 90-08.
Maxey, G.B. 1964. Hydrostratigraphic Units. Journal of Hydrology 2, 124–129.
Nicol, K., Nicol, H. 2008. Fit to drink? Researchers tapping into locals’ passion for spring water. The Telegram, St. John’s, NL.
Nolan, White and Associates. 1979. Hydrogeology of the Great Northern Peninsula. Government of Newfoundland and Labrador, Department of Environment, Water Resources Division, Groundwater Branch, Report 2-1.
Piper, A.M. 1944. A graphical procedure in the geochemical interpretation of water analyses. Transactions, American Geophysical Union 25:914 – 23.
Sanford, B.V., Grant, G.M. 1976. Physiography, eastern Canada and adjacent areas, Geological Survey of Canada, Map 1399A. Geological Survey of Canada, scale: 1:2 000 000.
Statistics Canada. 2008. www.statcan.ca
South, G. 1983. Biogeography and Ecology of the Island of Newfoundland. Springer, 740 pgs.
Waldron, J., Stockmal, G. 1994. Structural and tectonic evolution of the Humber Zone, western Newfoundland. Tectonics, American Geophysical Union v. 13, No.6, p. 1498-1513.
Williams, H., 1979. Appalachian Orogen in Canada: Canadian Journal of Earth Sciences, v. 16, p. 792-807.

Appendices Provided on
Accompanying CD