Embed Size (px)
Citation preview

Portland State University Portland State University
PDXScholar PDXScholar
Dissertations and Theses Dissertations and Theses
1-1-2011
Hydrogeology of the McKinney Butte Area: Sisters, Hydrogeology of the McKinney Butte Area: Sisters,
Oregon Oregon
Joshua Andrew Hackett Portland State University
Follow this and additional works at: https://pdxscholar.library.pdx.edu/open_access_etds
Let us know how access to this document benefits you.
Recommended Citation Recommended Citation Hackett, Joshua Andrew, "Hydrogeology of the McKinney Butte Area: Sisters, Oregon" (2011). Dissertations and Theses. Paper 371. https://doi.org/10.15760/etd.371
This Thesis is brought to you for free and open access. It has been accepted for inclusion in Dissertations and Theses by an authorized administrator of PDXScholar. Please contact us if we can make this document more accessible: [email protected].

Hydrogeology of the McKinney Butte Area: Sisters, Oregon
by
Joshua Andrew Hackett
A thesis submitted in partial fulfillment of the requirements for the degree of
Master of Science in
Geology: Geohydrology
Thesis Committee: Robert B. Perkins, Chair
Michael Cummings Kenneth Lite, Jr.
Portland State University ©2011

i
Abstract
McKinney Butte, a late Tertiary andesite vent and flow complex, is located
near the town of Sisters, Oregon, in the upper Deschutes Basin, and is situated along
the structural trend that forms the eastern margin of the High Cascades graben (Sisters
fault zone and Green Ridge). Rapid development and over appropriated surface water
resources in this area have led to an increased dependence upon groundwater
resources. A primary concern of resource managers is the potential impact of
expanding groundwater use on stream flows and spring discharge. Two sets of springs
(McKinney Butte Springs and Camp Polk Springs) discharge to Whychus Creek along
the east flank of McKinney Butte, and during low-flow conditions supply a substantial
component of the total flow in the creek. Despite their contribution to Whychus Creek,
the springs along McKinney Butte are small-scale features and have received less
attention than larger volume (> 2 m3/s) springs that occur in the basin (i.e., Metolius
Spring and Lower Opal Springs).
This study used discharge measurements in Whychus Creek upstream and
downstream of the springs, and mixing models using measurements of electrical
conductivity and temperature in the springs and Whychus Creek to determine the
contribution of the springs to the creek. Isotopic, thermal, and geochemical signatures
for the McKinney Butte and Camp Polk Springs, and local streams (Whychus Creek
and Indian Ford Creek) and springs (Metolius Spring, Paulina Spring, Alder Springs,
and Lower Opal Spring) were assessed to determine the source(s) of the McKinney

ii
Butte and Camp Polk Springs. The discharge and hydrochemical data along with
hydraulic head data from local wells were used in the development of a conceptual
model of groundwater flow for the McKinney Butte area.
Discharge from the McKinney Butte Springs supplies the majority of water to
Whychus Creek on the east flank of McKinney Butte (~0.20 m3/s), provides up to
46% of the flow in the creek, and is relatively stable throughout the year. Discharge
from the Camp Polk Springs is less than 0.05 m3/s.
Isotopic, thermal, and geochemical signatures indicate distinct sources for the
McKinney Butte and Camp Polk Springs. Groundwater discharged at the McKinney
Butte Springs is depleted in heavy stable isotopes (δD and δ18O) relative to the Camp
Polk Springs. Recharge elevations inferred from stable isotope concentrations are
1800-1900 m for the McKinney Butte Springs and 950-1300 m for the Camp Polk
Springs. Elevated water temperature in the McKinney Butte Springs relative to the
average air temperature at the inferred recharge elevation indicates the presence of
geothermal heat and implies deep circulation in the flow system. The temperature in
the Camp Polk Springs is not elevated. The Camp Polk Springs, though not the
McKinney Butte Springs, contain elevated concentrations of ions Cl, SO4, and NO3
that are indicative of contamination.
The study results indicate the source of the Camp Polk Springs is shallow
groundwater whereas the McKinney Butte Springs discharge water that has circulated
deep in the groundwater flow system. Additionally, the hydrochemical traits of the
McKinney Butte Springs are similar to Metolius Spring, suggesting discharge from the

iii
McKinney Butte Springs is controlled by the structural trend that forms the eastern
margin of the High Cascades graben. The significant difference in discharge between
the McKinney Butte Springs and Metolius spring may be related to the size of faults
that occur locally.

iv
Acknowledgements
Faculty, colleagues, farmers, friends, and family have helped me to complete
this thesis. I would like to express my gratitude to these individuals for their support
and assistance.
I would like to begin by thanking my thesis committee; Ben Perkins, Michael
Cummings, and Ken Lite for their guidance and encouragement throughout this
process. Ben greatly improved my scientific writing and my understanding of
geochemistry. His endless patience and understanding will not be forgotten. Michael
introduced me to field work and geologic mapping and guided me through an
undergraduate thesis, a great preparation for this project. His commitment to education
is unmatched. Finally, Ken provided thoughtful editorial comments and always
encouraged me to think bigger. He is also responsible for my current employment with
the Oregon Water Resources Department. Thank you, Ken.
Next, I would like to thank my colleagues at the Oregon Water Resources
Department. Jonathan LaMarche conducted seepage runs for this study, several times
under less than desirable conditions. Doug Woodcock allowed ample time to complete
this thesis. Marc Norton introduced me to the joys of field work in the Umatilla Basin.
I owe a great debt of gratitude to Karl Wozniak for the countless hours he spent during
the past three years mentoring me on the subjects of groundwater hydrology and
database management. I am truly grateful for the opportunity to have learned from
such a gifted thinker. I am also appreciative of his eternal optimism.

v
I would like to thank Chester Bradley, a farmer and rancher in Sisters, Oregon,
for allowing unrestricted access to the springs on his property. This project would
have been dead in the water without him.
I would like to thank my friends and family for their constant support and
encouragement. My friends and brothers provided welcome diversions during the
writing process. I owe a special debt to my in-laws for watching Basil on numerous
occasions while I was completing this project. My parents have supported me in all
my endeavors. I thank my dad for always pushing me to be better. I especially thank
my mom for her incredible commitment to our family.
I most want to thank my wife, Amy, and my girls, Faith and Basil, for their
love and sacrifice. I am forever indebted to Amy and Faith for helping me to find my
way; I would not be here without them. I am extremely grateful to Amy for picking up
the slack at home during the last several months of this project as I frantically finished
writing. Finally, I thank Faith and Basil for inspiring and amazing me every day.
vi
Table of Contents
Abstract............................................................................................................................ i
Acknowledgements ....................................................................................................... iv
List of Tables..................................................................................................................x
List of Figures..............................................................................................................xiii
Chapter 1 – Introduction.................................................................................................1
Background.............................................................................................................5
Location and Geography of Study Area.............................................................5
Significance of Study .........................................................................................6
Previous Work ..................................................................................................12
Chapter 2 – Hydrogeologic Framework .......................................................................15
Regional Setting ...................................................................................................15
Stratigraphic Units and Hydrogeologic Characteristics .......................................16
John Day Formation .........................................................................................16
Deschutes Formation ........................................................................................17
Cascade Range Volcanics.................................................................................18
Quaternary Glacial Outwash ............................................................................19
Tectonic Structures ...............................................................................................20
Geologic Controls on the Occurrence of Springs.................................................21
Study Area Geology .............................................................................................23
Chapter 3 – Study Design and Methods .......................................................................26

vii
Study Design.........................................................................................................26
Well, Spring, and Stream Data .........................................................................26
Sample Site Background ..................................................................................27
Sample Site Selection .......................................................................................28
Methods ................................................................................................................33
Discharge Measurements..................................................................................33
Spring- and Surface-water Sampling................................................................34
Cation, Anion, and Silica Analysis...................................................................35
Isotope Analysis ...............................................................................................36
Temperature Measurements .............................................................................37
Groundwater Level Measurements...................................................................38
Groundwater Level Data ..................................................................................39
Errors and Uncertainties ...............................................................................40
Water Level Elevation Contour Maps..........................................................40
Chapter 4 – Physical Hydrogeology.............................................................................46
Results from Previous Work.................................................................................46
Stream Discharge Measurements .....................................................................46
Discharge Measurements of Other Significant Springs in the Region.............52
Potentiometric Surface Mapping......................................................................52
Results from Current Study ..................................................................................55
Stream Discharge..............................................................................................55
Discharge from the McKinney Butte Springs ..................................................63

viii
Groundwater Level Measurements...................................................................66
Hydrographs .....................................................................................................73
Water Level Contour Mapping.........................................................................76
Chapter 5 – Chemical Hydrogeology ...........................................................................79
Results ..................................................................................................................79
General Chemistry............................................................................................79
Stable Isotopes..................................................................................................95
Temperature......................................................................................................99
Chapter 6 – Discussion...............................................................................................104
Camp Polk Springs Discharge............................................................................104
McKinney Butte Springs Discharge ...................................................................104
Discharge Contribution to Whychus Creek....................................................116
Thermal Contribution to Whychus Creek ......................................................120
Source of McKinney Butte and Camp Polk Springs ..........................................122
Major Ions ......................................................................................................123
Stable Isotopes................................................................................................130
Temperature....................................................................................................142
Conceptual Model of Groundwater Flow...........................................................149
Horizontal Groundwater Flow........................................................................150
Vertical Groundwater Flow............................................................................152
Groundwater Flow to Camp Polk Springs......................................................152
Groundwater Flow to the McKinney Butte Springs.......................................153

ix
Conceptual Groundwater Flow Model ...........................................................156
Chapter 7 – Summary and Conclusions .....................................................................159
References Cited.........................................................................................................163
Appendix A: Discharge Errors Discussion.................................................................172
Random Errors....................................................................................................172
Systematic Errors .......................................................................................179
Stream Discharge Variation Errors.....................................................................183
Appendix B: General Chemistry Error Discussion ....................................................186
Appendix C: Stable Isotope Data ...............................................................................192

x
List of Tables
Table 1. Calibration standard and procedures. .............................................................34
Table 2. Atomic Absorption parameters used for cation analysis................................36
Table 3. Mean water level elevations used to generate the water level elevation
contour map for the shallow part of the groundwater flow system. Wells with
more water level measurements were considered to be better representations of
the hydraulic head.............................................................................................43
Table 4. Mean water level elevations used to generate the water level elevation
contour map for the deep part of the groundwater flow system. Wells with
more water level measurements were considered to be better representations of
the hydraulic head.............................................................................................45
Table 5. Instantaneous discharge measurements for Whychus Creek (La Marche,
personal communication 2007). .......................................................................49
Table 6. Instantaneous discharge measurements for Indian Ford Creek (La Marche,
personal communication 2007). .......................................................................49
Table 7. Discharge values for local springs..................................................................52
Table 8. Discharge measurements and calculated errors for Whychus Creek. ............56
Table 9. Discharge measurements and calculated errors for Indian Ford Creek..........56
Table 10. Measured discharge along Reach 2 of Whychus Creek. ..............................66
Table 11. Location information and summary of field parameters collected sampling
locations during the current study and previous studies. Blank records indicate
the parameter was not measured.......................................................................81

xi
Table 12. Water Chemistry data for samples analyzed during the current study and
previous studies. Major ion and silica concentrations are reported in mg/L.
δ18O and δ2H values are in standard ‰ notation. Major ion and silica errors are
< 15% unless otherwise indicated, δ18O and δ2H errors are ±0.1‰ and ±1.0‰,
respectively. Blank records indicate the parameter was not measured. A
complete treatment of errors and uncertainties associated with the
determination of major ion concentrations is presented in Appendix B. .........83
Table 13. Total ionic concentration for various site types (mg/L). ..............................87
Table 14. Temperature measurements (°C) collected during water sampling events for
study area streams and springs. Average monthly temperatures in the Lamb
Well (DESC 54659) are also included. ..........................................................101
Table 15. Estimates of Discharge from the McKinney Butte Springs. ECAC and ECBF
are electrical conductivities measured in Whychus Creek above Chester
Springs and below Frank Springs. ECMS is the electrical conductivity measured
in Frank Springs and represents electrical conductivity in the McKinney Butte
Springs complex. fECMS is the fraction of EC in Whychus Creek provided by
the McKinney Butte Springs as calculated in equation 1; and QWCBF is the
discharge in Whychus Creek below Frank Springs measured during seepage
runs. QMS is the estimated discharge from the McKinney Butte Springs
calculated from electrical conductivity data using equation 2. ......................107
Table 16. Sum of Squares (SS) of differences between observed and predicted
temperature values at Whychus Creek below Frank Springs for selected
estimates of discharge from the McKinney Butte Springs (QMS). A discharge of
0.185 m3/s is the best fit to the data, and represents the estimated discharge
from the McKinney Butte Springs for the period between 08/30/2007 and
10/15/2007......................................................................................................111

xii
Table 17. Estimates of discharge from the McKinney Butte Springs (QMS). Discharge
was estimated via seepage runs on Whychus Creek and through the use of
electrical conductivity and temperature data collected in the McKinney Butte
Springs and at locations in Whychus Creek. Measured or calculated discharge
estimates are presented along with minimum and maximum discharge values
calculated from associated uncertainties. .......................................................114
Table 18. Total acreage covered by irrigation water rights in sections bordering the
west side of McKinney Butte and sections on McKinney Butte. Data from
Oregon Water Resources Department Water Rights Information System
(WRIS) database.............................................................................................128
Table 19. Gradients of δ18O with elevation (After Clark and Fritz, 1997).................134
Table 20. Spring recharge elevations estimated from the relationship between δ18O in
precipitation and elevation on the east flank of the central Oregon Cascades.
........................................................................................................................137
Table 21. Temperatures of study area springs corrected for gravitational potential
energy dissipation (GPE)................................................................................144
Table 22. Mean annual surface temperatures at climate stations in the region for the
period from 1961-1990...................................................................................145

xiii
List of Figures
Figure 1. Location of study area and large spring complexes along the eastern flank of
the Cascade Range..............................................................................................3
Figure 2. Digital Ortho Photo of McKinney Butte area. Sisters city limits are shown in
pink. Sampling sites are also shown. Indian Ford Creek flows south along the
west side of McKinney Butte and Whychus Creek flows north along the east
side. The McKinney Butte Springs are Frank and Chester springs. The Camp
Polk Springs are Camp Polk Springhouse and Anderson Springs. ....................4
Figure 3. Additional sampling sites and tectonic structures. Sampling locations for
springs (circles) and streams (squares) are shown. Precipitation data from the
Three Creeks Meadow SNOTEL site (white cross) is presented in the Results
Chapter. Fault locations (white lines), with the exception of the fault bounding
the east side of McKinney Butte, are from Sherrod et al. (2004). The fault on
the east side of McKinney Butte is from Wellik (2008). Faults are dashed
where approximately located and dotted where concealed, ball and bar are on
the downthrown side.........................................................................................10
Figure 4. 1971-2000 average annual precipitation in the study area (cm/year) (data
from Oregon Climate Service, 2008). ..............................................................11
Figure 5. Study area geologic map. Modified from Lite and Gannett (2002)..............25
Figure 6. Sisters USGS 7.5 minute quadrangle topographic map. Spring (triangles),
stream (circles), and well (square) sampling sites are shown. .........................29
Figure 7. West facing view of Chester Springs. The springs discharge to the bottom of
this pond at the base of McKinney Butte (shown in background). ..................30

xiv
Figure 8. North facing view of Frank Springs outlet channel. The springs discharge
from the base of McKinney Butte (not visible, but immediately to the right of
the image). The confluence of the outflow channel and Whychus Creek is
immediately below the visible area of the image. ............................................32
Figure 9. Previous OWRD discharge measurement locations. ....................................48
Figure 10. OWRD synoptic discharge measurement results along Whychus Creek
between Three Sisters Diversion Canal and Henkle Butte...............................50
Figure 11. OWRD synoptic discharge measurement results along Indian Ford Creek
between Camp Polk Rd. and the confluence with Whychus Creek. ................51
Figure 12. Generalized lines of equal hydraulic head in the vicinity of the current
study area (from Gannett and Lite, 2004). Contour intervals are 200 feet.......54
Figure 13. Seasonal discharge measurements along Whychus Creek between river
miles 21.0 and 15.7. Measurement locations are shown on Figure 3...............58
Figure 14. Seasonal discharge measurements along Indian Ford Creek between river
miles 2.1 and 0.8. The creek was dry at Camp Polk Rd. on 06/25/2007 and
09/21/2007 and at Barclay Dr. on all dates. .....................................................59
Figure 15. Measured discharge in Whychus Creek along Reach 1 (between Sisters and
above Chester springs, see Figure 2 for measurement locations). Error bars are
provided for each measurement........................................................................60
Figure 16. Measured discharge along Reach 3 of Whychus Creek (below Frank
springs to Camp Polk Rd). Error bars are provided for each measurement. ....61
Figure 17. Measured discharge along Reach 4 of Whychus Creek (Camp Polk Rd. to
DRC gage). Error bars are provided for each measurement. ...........................62

xv
Figure 18. Measured discharge in Whychus Creek along Reach 2 (above Chester
springs to below Frank springs). Error bars are provided for each measurement.
..........................................................................................................................65
Figure 19. Automated groundwater elevations recorded every 2 hours in the Lamb
Well (DESC 54659). Data collection period ranged from 01/11/2007 to
10/31/2007. Manual water levels were collected periodically between
11/15/2006 and 03/06/2008. .............................................................................68
Figure 20. Automated groundwater elevations recorded every 15 minutes in the Lamb
Well (DESC 54659). Data collection period ranged from 09/10/2007 to
10/31/2007. Manual water levels were collected periodically during this
period................................................................................................................69
Figure 21. Water level elevations recorded every 2 hours in the Lamb Well (DESC
54659) during July 2007. Water levels fluctuate diurnally by approximately 0.3
m. Maximum water level elevations occur between 16:00 and 20:00, and
minimum elevations occur at 06:00. ................................................................70
Figure 22. Accumulated precipitation at Three Creeks Meadow SNOTEL site and
water level elevations at the Lamb Well. Water levels in the well appear to rise
during periods of higher precipitation. .............................................................71
Figure 23. Water level elevations in the Lamb Well (DESC 54659) and mean daily
discharge at the OWRD Gage in Sisters. Water level and discharge trends are
similar. ..............................................................................................................72
Figure 24. Locations of selected wells with long-term water level data. DESC 3016 is
located west of McKinney Butte and DESC 2929 is located east....................74
Figure 25. Long term water level records for two OWRD State Observation Wells in
the vicinity of McKinney Butte. The Lamb Well is also shown. Water levels in
xvi
both State Observation Wells have historically responded to decadal climate
cycles. However, DESC 2929 has not responded to the most recent period of
increased precipitation that began in 2006, while the water level in DESC 3016
has risen by about 3 m. .....................................................................................75
Figure 26. Water level elevation contour map for the shallow part of the groundwater
flow system in the study area. Well log-id and mean water level elevations are
shown for wells used to generate the map. The elevations of springs that
discharge shallow groundwater are also shown. Contour intervals are 15 m.
Faults (white lines) are dashed where approximately located and dotted where
concealed, ball and bar are on the downthrown side. Fault locations are from
Sherrod et al. (2004) and Wellik (2008). The groundwater level gradient on the
east side of McKinney Butte is steeper than on the west side..........................77
Figure 27. Water level elevation contour map for the deep part of the groundwater
flow system in the study area. Well log-id and mean water level elevations are
shown for wells used to generate the map. The elevations of springs that
discharge regional groundwater are also shown. Contour intervals are 15 m.
Faults (white lines) are dashed where approximately located and dotted where
concealed, ball and bar are on the downthrown side. Fault locations are from
Sherrod et al. (2004) and Wellik (2008). The groundwater level gradient on the
west side of McKinney Butte is extremely flat, while the gradient on the east
side exceptionally steep....................................................................................78
Figure 28. Piper diagram for all spring and stream sampling locations. Water samples
are classified on the basis of dominant cationic and anionic species. Most
samples plot as mixed cation – bicarbonate waters, but several samples are
magnesium – bicarbonate or sodium – bicarbonate waters..............................86
Figure 29. Ionic concentrations for all samples. Samples from all sites on Whychus
Creek above Chester Springs are included in the group "Whychus Creek above

xvii
McKinney Butte Springs", samples from all sites on Whychus Creek below
Frank Springs comprise the group "Whychus Creek below McKinney Butte
Springs", and samples from all sites on Indian Ford Creek form the group
"Indian Ford Creek.".........................................................................................90
Figure 30. Average ionic concentrations for springs samples, n = # of samples. Paulina
Spring, Alder Springs, and Metolius Spring were only sampled once each, but
are shown for comparison. ...............................................................................91
Figure 31. Plot of Cl vs NO3. Concentrations of both ions are elevated in Camp Polk
Springhouse relative to other springs and streams, and the NO3 concentration
in the Metolius Spring sample from the current study is much greater than in
any other sample. The Metolius Spring sample from Evans et al. (2004)
contained very little NO3 as did Paulina Spring samples. Several samples from
Whychus and Indian Ford creeks did not contain measureable amounts of NO3.
..........................................................................................................................92
Figure 32. Plot of Cl vs SO4. Concentrations of both ions are elevated in Camp Polk
Springhouse relative to other sampled springs and streams. The McKinney
Butte Springs and Anderson Springs plot near Metolius Spring, Alder Springs,
and Lower Opal Springs. Cl and SO4 concentrations vary the most in Indian
Ford Creek. Concentrations of both ions in Whychus Creek increase
downstream of the McKinney Butte and Camp Polk Springs..........................93
Figure 33. Plot of Cl vs Na. Samples from Camp Polk Springhouse (CPSH) display a
Cl "shift" where Na concentrations in CPSH are similar to or slightly lower
than concentrations in other sampled springs, but Cl concentrations are
extremely elevated. Na concentrations in the McKinney Butte Springs are
slightly higher than in Anderson Springs, are similar to the Na concentration in
the Metolius Spring sample from the current study, are lower than
concentrations in Alder Springs from the current and previous studies, and are

xviii
lower than concentrations in Metolius Spring and Lower Opal Springs from
other studies......................................................................................................94
Figure 34. δ2H and δ18O delta values for all samples. Data from this study plot on a
line given by δ2H = 6.3 δ18O – 14.0. The Global Meteoric Water Line
(GMWL) defined as δ2H = 8 δ18O + 10 by Craig (1961) is also shown. .........97
Figure 35. δ2H and δ18O delta values for samples from previous studies. Samples from
the current study are shown for comparison. GMWL and LMWLs for each
study are also shown. LMWL slopes are similar for all studies and are
generally less than the GMWL slope, with the exception of Caldwell (1998),
which has the same slope as the GMWL..........................................................98
Figure 36. Temperature measurements in Whychus Creek and the McKinney Butte
Springs from 08/30/2007 to 10/15/2007. Temperature in Whychus Creek
generally follows local air temperatures. The constant temperature in the
McKinney Butte Springs attenuates temperature fluctuations in Whychus
Creek below the springs. ................................................................................102
Figure 37. Water temperatures in the McKinney Butte Springs and the Lamb Well
(DESC 54659) for the period from 08/30/2007 to 10/15/2007. Temperatures
are stable in the springs, and are extremely stable in the well. The “angularity”
of the temperature data for the McKinney Butte Springs is caused by resolution
limitations (0.15 °C) of the temperature probe...............................................103
Figure 38. Measured and predicted temperature values at Whychus Creek below Frank
springs. Blue and red series are predicted temperature values calculated from
low (0.10 m3/s) and high (0.20 m3/s) estimates of discharge from the
McKinney Butte Springs. Teal series (0.185 m3/s) is the best fit (lowest SS) to
the observed data. ...........................................................................................112

xix
Figure 39. McKinney Butte Springs discharge estimated through the use of seepage
runs on Whychus Creek, and temperature and electrical conductivity data
collected in the McKinney Butte Springs and Whychus Creek. Error bars are
provided for each method. ..............................................................................116
Figure 40. Mean monthly discharge in Whychus Creek from 1970 to 1990 measured at
OWRD gaging station #14075000 near Sisters, Oregon. Peak discharge
typically occurred after spring snowmelt and was as much as ten times larger
than low-flow conditions. ...............................................................................117
Figure 41. Daily and monthly mean discharge from January 2006 to April 2008
measured at OWRD gaging station #14076050 in Sisters, Oregon. Peak
monthly mean discharge occurred during June in 2006 and during November
in 2007. Peak monthly discharge usually occurs during months of high
precipitation; however, in 2007 peak discharge occurred in June as a result of
late spring snowmelt.......................................................................................118
Figure 42. Estimated contribution (% of total flow in Whychus Creek) from the
McKinney Butte Springs to Whychus Creek. Values are shown as percent of
mean daily (open circles) and mean monthly (solid circles, dashed lines)
discharge in Whychus Creek. The blue, black, and red series use estimated
spring discharges of 0.10, 0.20, and 0.30 m3/s respectively...........................119
Figure 43. Temperature measurements in Whychus Creek and the McKinney Butte
Springs from 08/30/2007 to 10/15/2007. Temperature variations in Whychus
Creek below the McKinney Butte Springs are attenuated by constant
temperature discharge from the springs. ........................................................121
Figure 44. Relationship between δ18O in precipitation and elevation in the central
Oregon Cascades (from James, 1999). ...........................................................135

xx
Figure 45. Relationship between spring elevation and oxygen isotope composition.
The solid line shows the relationship between elevation and δ18O of
precipitation as defined by snow core samples. The mean recharge elevation of
the water can be estimated by tracing horizontal lines from the points
representing spring samples to the elevations at which precipitation is
comparable. The data used for the linear regression are from James (1999) and
are shown in Figure 46 and are presented in Appendix C..............................138
Figure 46. Relationship between elevation and water temperature in study area
springs. The plus signs show the mean annual surface temperature at climate
stations in the region and the dashed lines show the upper and lower bounds of
the relationship between elevation and surface temperature (data from Oregon
Climate Service). (a) Spring temperature as a function of discharge elevation.
(b) Spring temperature as a function of the mean recharge elevation inferred
from oxygen isotope content of the spring water. Spring temperatures in (b) are
corrected for the expected 2.3 ºC/km increase in water temperature as the water
flows to lower elevations. The temperature difference ∆T indicates the amount
of geothermal warming of the water. The Regional Springs (Lower Opal
Springs, Alder Springs, and Metolius Spring) show a linear relationship
between temperature and inferred recharge elevation....................................148
Figure 47. Proposed conceptual model for groundwater flow through the study area.
The faults bounding McKinney Butte not only juxtapose material of
contrasting permeability, they also provide a preferential pathway to the
surface for a small amount of deep groundwater flow. Much of the
groundwater discharged at the McKinney Butte Springs has circulated deep in
the flow system...............................................................................................158

1
Chapter 1 – Introduction
The Deschutes River is a major river draining 27,000 km2 of north-central
Oregon (O’Connor et al., 2003) on the eastern, leeward side of the Oregon Cascade
Range, a water-resource limited environment in which competitive demands for
municipal, domestic, and irrigation water and adequate stream flows for aquatic
habitats and recreation are severe. The Deschutes River on whole displays a
remarkably consistent flow thanks to substantial input from large, regional spring
systems (Gannett et al., 2003). However, local tributaries may be severely impacted by
water diversions. Whychus Creek is one such stream that originates on the flanks of
the Broken Top and Three Sisters volcanoes, flows northeast through the town of
Sisters, and ultimately discharges into the Deschutes River (Figure 1). Although a
significant tributary of the Deschutes River, a large percentage (historically, up to
100%) of Whychus Creek’s flow is diverted for irrigation 5 to 9 km upstream of
Sisters (Gannett et al., 2001). Because Whychus Creek is severely impacted by
irrigation withdrawals, spring discharge downstream from diversions becomes critical
for maintaining streamflow and aquatic habitat.
One set of springs in particular, the McKinney Butte Springs (Frank Springs
and Chester Springs on Figure 2), discharge to Whychus Creek approximately 10 km
downstream from irrigation diversions. These springs may contribute a significant
portion of total flow in Whychus Creek from Sisters to Alder Springs, 24 km
downstream and provide important thermal refuge for anadromous fish during periods

2
of severe thermal stress (Brown et al., 2007; Friedrichsen, 1996). McKinney Butte is
bounded by the Tumalo fault (Sherrod et al., 2004; Wellik, 2008), part of the Sisters
fault zone, a southern extension of the Green Ridge fault zone, which has been
associated with discharge of regional groundwater to Metolius Spring (James, 1999;
Gannett et al., 2001), the source of the Metolius River on the north side of Black
Butte. Understanding how the McKinney Butte Springs fit into the larger
hydrogeologic framework, specifically their overall impact on Whychus Creek flow
and whether the springs originate from local or regional groundwater flow systems, is
critical in evaluating their importance, long-term stability, and susceptibility to
increasing groundwater withdrawals.
The objectives of this study are to: 1) quantify the magnitude and seasonal
variation of flow from the McKinney Butte Springs; 2) quantify the relative
contribution of the spring flow to the total flow of Whychus Creek on a seasonal basis;
3) determine the thermal impact of spring flow on Whychus Creek; 4) identify the
source(s) of spring water via the hydrochemistry of the McKinney Butte Springs and
local surface waters; and 5) develop a conceptual groundwater-flow model that
accounts for the spatial and temporal distribution of discharge, hydraulic head,
chemistry, and temperature within the geologic framework of the area.

Figure 1. Location of study area and large spring complexes along the eastern flank of the Cascade Range.
3

Figure 2. Digital Ortho Photo of McKinney Butte area. Sisters city limits are shown in pink. Sampling sites are also shown. Indian Ford Creek flows south along the west side of McKinney Butte and Whychus Creek flows north along the east side. The McKinney Butte Springs are Frank and Chester springs. The Camp Polk Springs are Camp Polk Springhouse and Anderson Springs.
4

5
Background
Location and Geography of Study Area
The McKinney Butte study area encompasses approximately 275 km2 (square
kilometers) in the Deschutes River drainage basin in central Oregon (Figure 1).
Whychus Creek, which originates on the slopes of Broken Top and the Three Sisters
volcanoes on the east side of the central Oregon Cascade Range, is the largest stream
in the rapidly developing area around the town of Sisters. Indian Ford Creek flows
south from its headwaters (Paulina Spring near Black Butte) along the west side of
McKinney Butte until its confluence with Whychus Creek at the south end of the butte
(Figure 3). Land surface elevations range from 1220 m (meters) above sea level in the
southwest corner of the study area to 880 m in the northeast corner. The town of
Sisters is the major population center in the study area. Principal industries include
agriculture, forest products, tourism, and service industries.
Study area boundaries were positioned several kilometers from McKinney
Butte to provide a larger area from which hydrologic and geologic data could be
collected. The following sections comprise the study area: T14S/R09E sec. 13,14, 23-
26; T14S/R10E sec. 13-36; T14S/R11E sec 15-22, 27-34; T15S/R09E sec. 1,2, 11-14,
23-26; T15S/R10E sec. 1-30; T15S/R11E sec. 3-10, 15-22, 27-30. USGS 7.5 minute
quadrangle topographic maps in the study area include Sisters, Henkle Butte, and parts
of Three Creek Butte, Tumalo Dam, and Black Crater.

6
The climate in the area is controlled by air masses that move eastward from the
Pacific Ocean, across western Oregon and into central Oregon (Lite and Gannett,
2002). Orographic processes result in large amounts of precipitation in the Cascades
Range (located less than 10 km west of the study area), with precipitation locally
exceeding 508 cm/yr, mostly as snow during the winter (Taylor, 1993). Rates of
precipitation diminish rapidly toward the east to less than 30 cm/yr at the eastern
margin of the study area (Figure 4). Temperatures also vary across the study area.
Records from the Oregon Climate Service show that mean monthly minimum and
maximum temperatures at Santiam Pass in the Cascade Range (period of record 1963
to 1985) range from -7 and 1 °C (degrees Celsius) in January to 6 and 23 °C in July
(Oregon Climate Service, 2008). Temperatures are warmer at lower elevations within
the study area. The mean monthly minimum and maximum temperatures in Sisters
(period of record 1961 to 2007) range from -6 and 5 °C in January to 6 and 29 °C in
July (Oregon Climate Service, 2008).
Significance of Study
The origin of springs along McKinney Butte has been the subject of
speculation by area water managers for many years (Lite, personal communication,
2011). A commonly held, yet unconfirmed view is that the springs receive water from
losing reaches of Indian Ford Creek on the west side of the butte. While the source of
the springs was unknown, their contribution to an over appropriated Whychus Creek
has long been recognized. In 1994, springs along McKinney Butte provided the only

7
flow to a 20 km reach of Whychus Creek below Indian Ford Creek and above Alder
Springs (OWRD seepage run data in Gannett et al., 2001). Despite the fact that these
springs at times provide a significant amount of the flow in Whychus Creek, very little
is known about the physical and chemical characteristics of the water they discharge.
This study examines the discharge rates and hydrochemistry of groundwater
discharged at springs along McKinney Butte in an attempt to discern their source(s)
and quantify their discharge and thermal contributions to Whychus Creek.
The thermal contribution of the McKinney Butte Springs may provide an
important refuge for steelhead, red band trout, bull trout and Chinook salmon during
periods of severe thermal stress (Friedrichsen, 1996; Brown et al., 2007). Recent re-
licensing of the Pelton and Round Butte dams on the Deschutes River allowed for the
construction of a new fish passage, which will enable anadromous fish to migrate
upstream to Whychus and other creeks in the upper Deschutes Basin that were
historically important for fish rearing and spawning (Cramer and Beamesderfer,
2006). Thirty-four km of Whychus Creek (including the reach examined in this study)
are on the Oregon Department of Environmental Quality (ODEQ) 303(d) list
(identifies water bodies not meeting water quality standards) for exceeding the
maximum allowable temperature for salmon rearing and spawning (ODEQ, 2007). If
the McKinney Butte Springs discharge low temperature water, they could offer
aquatic species thermal refuge during hot summer months.
Another important aspect of this study is the potential impact of recent
development in the Sisters area on groundwater resources, including the springs along

8
McKinney Butte. The degree to which a spring may be affected by groundwater
withdrawals and contamination depends on the spatial scale of groundwater flow. A
groundwater flow system can be divided into “local”, “intermediate”, and “regional”
flow (e.g. Tóth, 1963). Local groundwater flow circulates to shallow depths and
discharges close to the recharge area, while intermediate and regional groundwater
flow generally circulate to much greater depths and discharge far from the inferred
recharge area (Tóth, 1963). Intermediate- and regional-scale groundwater flow result
in springs with little seasonal variation in discharge and temperature, while springs
discharging local-scale groundwater often exhibit seasonal variations in both discharge
and temperature. Additionally, springs discharging local-scale groundwater are more
likely to be influenced by short-term variations in recharge and are more susceptible to
contamination from shallow anthropogenic sources (e.g. septic systems and irrigation
chemicals).
The scale of groundwater flow discharged at the springs has implications for
the role of local geologic structures in the groundwater flow system. The springs along
McKinney Butte occur at the westernmost edge of the Sisters fault zone, the southern
extension of the Green Ridge fault zone (Sherrod et al., 2004). The Green Ridge fault
(the major fault in the Green Ridge fault zone) marks the eastern boundary of the High
Cascades axial graben (Allen, 1966; Priest, 1990) and is responsible for the
tremendous amount of groundwater discharging to Metolius Spring at the headwaters
of the Metolius River (Gannett et al., 2003). Chemical analysis suggests that the water
discharged from Metolius Spring includes a large component of deep regional

9
groundwater, implying vertical permeability along the Green Ridge escarpment
(Gannett et al., 2003). Hydrochemical data collected from springs along McKinney
Butte will provide new insights into the groundwater flow system in the vicinity of
McKinney Butte and will help refine existing regional groundwater flow models.

F
igu
re 3
. Ad
diti
onal
sam
plin
g si
tes
and
tect
onic
str
uct
ures
. Sam
pli
ng
loca
tion
s fo
r sp
rin
gs (
circ
les)
an
d s
trea
ms
(sq
uar
es)
are
show
n. P
reci
pit
atio
n
dat
a fr
om t
he
Th
ree
Cre
eks
Mea
dow
SN
OT
EL
sit
e (w
hit
e cr
oss)
is p
rese
nte
d in
th
e R
esu
lts
Ch
apte
r. F
ault
loca
tion
s (w
hit
e li
nes
), w
ith
the
exce
pti
on o
f th
e fa
ult
bou
ndin
g th
e ea
st s
ide
of M
cKin
ney
Bu
tte,
are
fro
m S
her
rod
et
al. (
2004
). T
he
fau
lt o
n t
he
east
sid
e of
McK
inn
ey B
utt
e is
fr
om W
elli
k (
2008
). F
ault
s ar
e d
ash
ed w
her
e ap
pro
xim
atel
y lo
cate
d a
nd
dot
ted
wh
ere
con
ceal
ed, b
all a
nd
bar
are
on
th
e d
own
thro
wn
sid
e.
10

Figure 4. 1971-2000 average annual precipitation in the study area (cm/year) (data from Oregon Climate Service, 2008).
11

12
Previous Work
The hydrology and chemistry of surface and groundwaters in the central
Oregon Cascades are reported by Russell (1905), Henshaw et al. (1914), Meinzer
(1927), Ingebritsen et al. (1988, 1992, 1994), Manga (1996, 1997, 1998, 2001), James
(1999), James et al. (1999, 2000), Evans et al. (2002, 2004), and Gannett et al. (2003).
Several studies conducted by the United States Geological Survey (USGS) in
cooperation with the Oregon Water Resources Department (OWRD) have examined
the hydrogeology of the upper Deschutes Basin (Caldwell and Truini, 1997; Caldwell,
1998; Gannett et al., 2001; Lite and Gannett, 2002; Sherrod et al., 2002; Gannett and
Lite, 2004). Additionally, OWRD has conducted synoptic measurements of discharge
(also referred to as seepage runs) in Whychus and Indian Ford creeks. These studies
provide the framework for my research. Of particular interest for the current study are
the chemistry, hydrology, and isotopic variations in cold springs and streams as well
as the impact of geology and geologic structures on groundwater flow.
James (1999) and James et al. (1999, 2000) examined the temperature and
isotopes of O, H, C, and noble gases of several large volume cold springs in the central
Oregon Cascade Range. Hydrogen and oxygen isotope analyses were integrated with
temperature measurements in an attempt to provide a conceptual model of
groundwater flow for the region. Temperatures well above the average annual surface
temperature of the inferred recharge elevation in several springs were attributed to

13
geothermal warming. Additionally, the relationship between 18O and elevation in local
precipitation was used to estimate the recharge elevation of cold springs.
Manga (2001) examined the chemical and physical characteristics of several
springs in the central Oregon Cascades. He used isotopic, chemical, and temperature
data to determine the mean residence time of groundwater, infer the spatial pattern and
extent of groundwater flow, estimate basin-scale hydraulic properties, calculate
regional heat flow, and quantify the rate of magmatic intrusion beneath the volcanic
arc.
Evans et al. (2002, 2004) examined the geochemistry and temperature of
streams and springs in the Separation Creek drainage of the Three Sisters area. They
attributed anomalously high chloride concentrations in Separation Creek to the input
of thermal fluid.
The groundwater resources and hydrogeologic characteristics of the upper
Deschutes basin have been reported in U.S. Geological Survey Water-Resources
Investigations Reports and Open-File Reports (Caldwell and Truini, 1997; Caldwell,
1998; Gannett et al., 2001; Lite and Gannett, 2002; Gannett and Lite, 2004). These
reports contain information concerning the hydrogeologic characteristics of specific
hydrogeologic units (hydraulic conductivity, yield, specific capacity, coefficient of
storage, and recharge), groundwater levels, hydrographs of water level fluctuations in
specific wells, water chemistry, well log information from driller’s reports, and water
well and spring locations.

14
OWRD staff conducted seepage runs on Whychus Creek in April 1994, August
2005, March 2006, and September 2006 and on Indian Ford Creek in February 1992,
March 2006, and September 2006. Measurement locations in Whychus Creek included
the Sisters gage station and Camp Polk Road (Figure 2). Gains of 0.17 m3/s (April
1994), 0.06 m3/s (August 2005), 0.17 m3/s (March 2006), and 0.10 m3/s (September
2006) were measured along the reach between Sisters and Camp Polk Road. Indian
Ford Creek discharge decreased from 0.19 m3/s at Camp Polk Road to 0.0 m3/s at
Barclay Dr. in March 2006; the creek was dry at Camp Polk Road in February 1992
and September 2006.

15
Chapter 2 – Hydrogeologic Framework
Regional Setting
Most of the upper Deschutes Basin lies within two major geologic provinces
(Figure 1), the Cascade Range and the Basin and Range Province (Baldwin, 1981).
The Cascade Range is a north-south trending zone of compositionally diverse volcanic
centers with deposits extending from southern British Columbia to northern California
(Baldwin, 1981; Sherrod and Smith, 2000). Although the Cascades Range primarily
represents a constructional feature, growth of the range has been accompanied, in
places, by the development of a north-south trending graben (Allen, 1966; Smith et al.,
1987).
The central Oregon part of the Cascade Range is divided into two provinces,
the Western Cascades and the High Cascade Range (Smith et al., 1987). The Western
Cascades are composed of late Eocene to late Miocene tholeiitic and calc-alkaline
basaltic lava flows, tephras, and basaltic to rhyolitic intrusions and are located west of
the current Cascades crest (Smith et al., 1987; Ingebritsen et al., 1994). In central
Oregon, the crest of the High Cascades is composed of coalesced basalt and basaltic
andesite lava flows erupted by primarily early Pleistocene shield volcanoes and cinder
cones (Smith et al., 1987).
The Basin and Range province is a region of crustal extension and is
characterized by subparallel fault-bounded down-dropped basins separated by fault-
block ranges. Individual basins and intervening ranges are typically 15 to 30 km

16
across. The Basin and Range province covers much of the interior of the Western
United States encompassing parts of Oregon, Nevada, Utah, California, Arizona and
New Mexico (Baldwin, 1981). Extension and subsequent faulting in the Basin and
Range province has been accompanied by widespread mafic volcanism (Draper, 1991;
Camp and Ross, 2004).
Stratigraphic Units and Hydrogeologic Characteristics
John Day Formation
The John Day Formation is the oldest rock unit within the upper Deschutes
basin. Rocks of this formation range in age from 20 to 40 million years. The John Day
Formation is composed of several hundred meters of diagenetically altered volcanic
and volcaniclastic sedimentary deposits (Robinson et al., 1984). Deposits of the John
Day Formation thicken and coarsen from east to west and are similar in age to deposits
associated with early Western Cascade volcanism. These factors led investigators to
conclude that the John Day Formation is composed of distal deposits derived from
vents in the Western Cascades (Waters, 1954; Peck, 1964; Robinson, 1975; Robinson
et al., 1984). While Western Cascade volcanoes are probably the source of some John
Day Formation deposits, recent work by the Oregon Department of Geology and
Mineral Industries (e.g., McClaughry et al., 2009a, 2009b) have identified large
Paleogene calderas located well east of previously postulated sources, suggesting a
local origin for much of the John Day Formation.
17
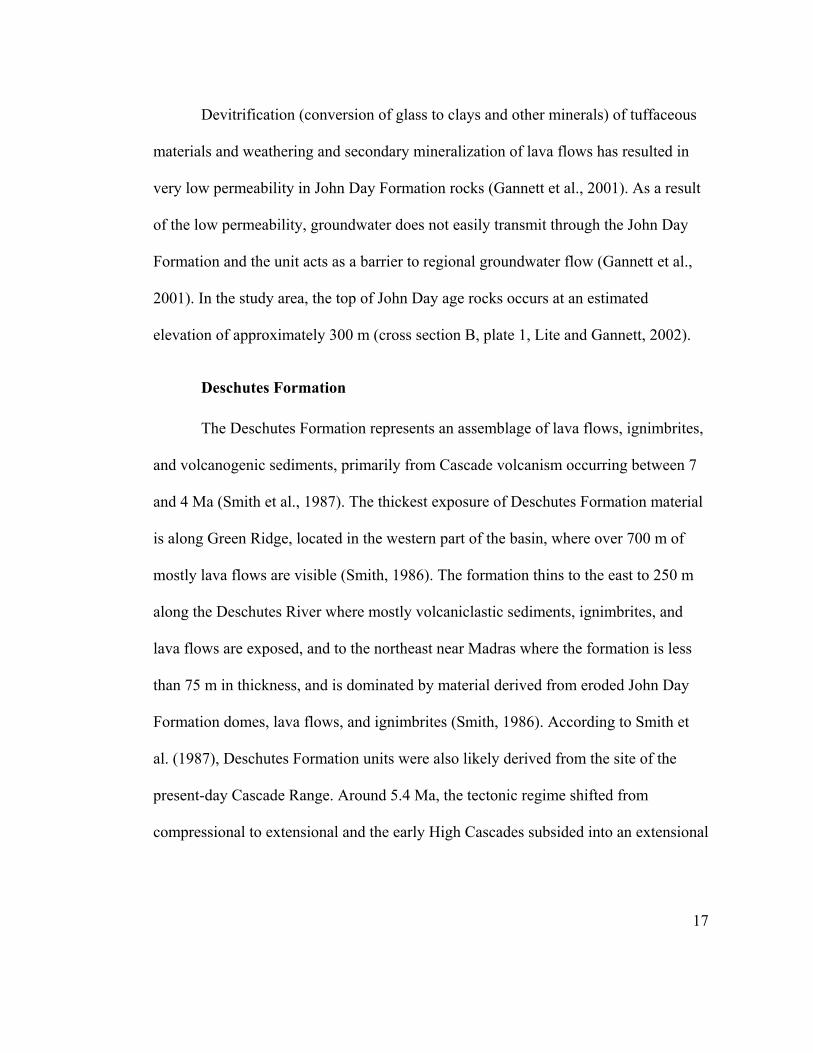
Devitrification (conversion of glass to clays and other minerals) of tuffaceous
materials and weathering and secondary mineralization of lava flows has resulted in
very low permeability in John Day Formation rocks (Gannett et al., 2001). As a result
of the low permeability, groundwater does not easily transmit through the John Day
Formation and the unit acts as a barrier to regional groundwater flow (Gannett et al.,
2001). In the study area, the top of John Day age rocks occurs at an estimated
elevation of approximately 300 m (cross section B, plate 1, Lite and Gannett, 2002).
Deschutes Formation
The Deschutes Formation represents an assemblage of lava flows, ignimbrites,
and volcanogenic sediments, primarily from Cascade volcanism occurring between 7
and 4 Ma (Smith et al., 1987). The thickest exposure of Deschutes Formation material
is along Green Ridge, located in the western part of the basin, where over 700 m of
mostly lava flows are visible (Smith, 1986). The formation thins to the east to 250 m
along the Deschutes River where mostly volcaniclastic sediments, ignimbrites, and
lava flows are exposed, and to the northeast near Madras where the formation is less
than 75 m in thickness, and is dominated by material derived from eroded John Day
Formation domes, lava flows, and ignimbrites (Smith, 1986). According to Smith et
al. (1987), Deschutes Formation units were also likely derived from the site of the
present-day Cascade Range. Around 5.4 Ma, the tectonic regime shifted from
compressional to extensional and the early High Cascades subsided into an extensional

18
basin (Smith, 1991). The western escarpment of Green Ridge was formed by one of
the faults bounding the basin (Smith et al., 1987).
Deschutes Formation deposits are the major groundwater-bearing units in the
upper Deschutes basin (Lite and Gannett, 2002). The permeability of the Deschutes
Formation ranges from relatively low in fine-grained sedimentary deposits, dense lava
flows, and pyroclastic flows, to high in coarse-grained unconsolidated sediments and
vesicular and brecciated lava flows (Lite and Gannett, 2002). East of the Tumalo fault,
the deposits occur at land surface or at shallow depth in the subsurface.
Cascade Range Volcanics
Several hundred meters of down-to-the-west displacement confined Pliocene
to Holocene volcanic deposits to an intra-arc graben (Smith et al., 1987). Volcanic
activity in the High Cascades since the late Pliocene (about 3 Ma) has subsequently
buried volcanic centers that produced the Deschutes Formation. The present day High
Cascades Range in central Oregon is composed of coalesced basalt and basaltic
andesite shield volcanoes and cinder cones that are locally overlain by larger glaciated
late Pleistocene to Quaternary stratovolcanoes (Hughes and Taylor, 1986; Hildreth,
2007).
Cascade Range volcanic deposits are highly permeable at shallow depths. The
near-surface deposits are often highly fractured or otherwise porous and generally lack
secondary mineralization (Gannett et al., 2001). The Cascade Range is the major
recharge area for the upper Deschutes basin and these deposits provide the primary

19
pathway for groundwater movement from the recharge area to the basin (Gannett et
al., 2001, 2003; Ingebritsen et al., 1992, James et al., 2000; Lite and Gannett, 2002;
Manga, 1996, 1997, 1998). Cascade Range volcanics are an important source of
groundwater west of the Tumalo fault.
Quaternary Glacial Outwash
Several Quaternary-age sedimentary deposits are found within the upper
Deschutes Basin (Lite and Gannett, 2002). Two major periods of glaciation during
Pleistocene time left deposits in the upper Deschutes Basin, the older Jack Creek and
the younger Cabot Creek (Sherrod and Smith, 2000). The Cabot Creek glaciation is
divided into Suttle Lake and Canyon Creek advances (Sherrod and Smith, 2000).
Deposits of Jack Creek are limited to an area east of Three Fingered Jack. Easterbrook
(1986) correlated Jack Creek glaciation to Hayden Creek glaciation in Washington,
which is thought to be 140,000 years in age. The Suttle Lake advance was the last
major glacial advance in central Oregon, occurring about 25,000 years ago (Sherrod
and Smith, 2000). Outwash of the Suttle Lake advance covers much of the Metolius
River valley and is up to 40-m thick in the vicinity of Sisters (Sherrod and Smith,
2000; Lite and Gannett, 2002). Holocene deposits were formed by mass wasting of
upland deposits, deposition of alluvium by both low- and high-energy streams, and
deposition into lakes. These deposits can be locally up to 60 meters thick (Lite and
Gannett, 2002).

20
Glacial outwash and intercalated High Cascades lavas deposited on the west
side of the Tumalo fault form the principal aquifer in the town of Sisters (Lite and
Gannett, 2002). Well reports for wells penetrating the outwash indicate it is comprised
mostly of sand and gravel. These unconsolidated coarse-grained sediments and lavas
have very high permeability. Hydraulic conductivity estimates are on the order of 50
m/d (Gannett et al., 2001).
Tectonic Structures
The fault zone in the area between Bend and Sisters has been previously
referred to as the Tumalo fault zone (Priest, 1990) and the Sisters fault zone (Sherrod
et al., 2004). Wellik (2008) referred to the western part of the fault zone as the Tumalo
fault zone, and the eastern part as the Sisters fault zone. The current study follows the
nomenclature of Sherrod et al. (2004); faults around the city of Sisters are referred to
as the Sisters fault zone, and faults in the vicinity of Green Ridge are part of the Green
Ridge fault zone (Figure 3).
The Sisters fault zone trends north-northwest from Newberry Volcano to Black
Butte (Lite and Gannett, 2002). The sense of movement along the most prominent
fault, (the Tumalo fault) which extends through the study area along the west side of
McKinney Butte, is down-to-the-west (Taylor, in preparation, fide Sherrod et al.,
2004). Other faults exhibit down-to-the-east or down-to-the-west displacement. As
much as 55 to 60 m of dip separation along the Tumalo fault has occurred near upper
Tumalo Reservoir (10 km south of the study area) (Lite and Gannett, 2002). The

21
westernmost fault strands of the Sisters fault zone that exhibit down-to-the-west
displacement (particularly the Tumalo fault) were partial barriers to streams flowing
eastward from the Cascade Range and, thus, formed depositional centers for
Pleistocene volcanic and glacial outwash deposits (Lite and Gannett, 2002). The
Tumalo fault escarpment along the west side of McKinney Butte has provided a
depositional center for up to 40 m of glacial outwash in the Sisters area (Lite and
Gannett, 2002).
The escarpment of Green Ridge represents the east margin of an intra-arc
graben within the Cascade Range (Taylor, 1981, Smith et al., 1987). The Green Ridge
fault zone is comprised of many parallel north-south normal faults with down-to-the-
west net displacement in excess of 600 m (Conrey, 1985). Displacement on the Green
Ridge fault zone took place during late Miocene and early Pliocene (Conrey, 1985).
Geologic Controls on the Occurrence of Springs
Much of the groundwater discharge in the upper Deschutes Basin occurs as
springs in two principal settings: 1) near the confluence of the Deschutes and Crooked
Rivers; and 2) in and adjacent to the Cascade Range (Gannett et al., 2003). The
distribution and rates of groundwater discharge in these settings is controlled by
complex structural and stratigraphic interactions.
Groundwater discharge near the confluence of the Deschutes and Crooked
Rivers is the result of deep incision by the rivers (Gannett et al., 2003). Locally, the
Deschutes and Crooked Rivers have incised canyons exposing much of the Deschutes

22
Formation section, intercepting the regional groundwater surface and resulting in large
spring complexes in the canyon walls (Gannett et al., 2003). Additionally,
approximately 15 kilometers north of the confluence area, near Pelton Dam the
Deschutes River has cut entirely through the highly permeable Deschutes Formation to
the much less permeable John Day Formation, diverting all groundwater flow to the
surface (Gannett et al., 2003). Lower Opal Springs, found in the canyon wall of the
Crooked River, discharges groundwater that contains geothermal heat and magmatic
gasses, both indications of deep regional-scale groundwater flow (James, 1999).
Groundwater discharged at Lower Opal Springs has travelled over 50 km in the
subsurface.
Large spring systems such as the headwaters of Brown’s Creek and the Quinn
and Cultus Rivers are found on the east flanks of the central Oregon Cascade Range
(Figure 1). These springs issue from the edges or ends of highly permeable Quaternary
lava flows at the contact with less permeable fine-grained sediments that have filled
the Shukash structural basin (Gannett et al., 2003). Groundwater discharged from the
springs has followed shallow local-scale groundwater flow paths (Manga, 1998; James
et al., 2000; Gannett et al., 2003).
Large-volume springs such as Spring River and Metolius Spring are found at
the eastern margin of the Cascade Range (Gannett et al., 2003). Spring River is located
at the western edge of the Shukash structural basin in the southern part of the upper
Deschutes Basin. Metolius Spring, the headwaters of the Metolius River, occurs along
the Green Ridge fault, which marks the eastern edge of the High Cascades graben

23
(Allen, 1966; Priest, 1990). Vertical movement along the Green Ridge fault system is
estimated to be over 600 m (Conrey, 1985). According to Gannett et al. (2001), the
impediment to eastward groundwater flow at the base of Green Ridge could be due to
a low- permeability gouge zone along the fault planes or the juxtaposition of
permeable strata on the west side of the fault system against low-permeability material
on the east. Groundwater discharged at Metolius Spring contains geothermal heat and
magmatically derived carbon and helium-3 (James, 1999). The presence of elevated
temperature and magmatic gasses indicates that Metolius Spring discharges water that
has circulated deep in the groundwater flow system and suggests there is vertical
permeability along the Green Ridge escarpment (Gannett et al., 2003).
Study Area Geology
Geologic maps of the majority of the study area have been generated by
Oregon State University Emeritus Professor Dr. Ed Taylor. His maps of the Sisters
(Taylor, in preparation), Henkle Butte (Taylor, 1998), Tumalo Dam (Taylor and Ferns,
1994) and Three Creek Butte (Taylor and Ferns, 1995) 7.5 minute quadrangles have
been incorporated into a geologic compilation map of the Bend 30- x 60-minute
quadrangle (Sherrod et al., 2004). Lite and Gannett (2002) included a generalized
version of the map later published by Sherrod et al., (2004). In this study, I present an
ArcGIS coverage of the study area based on the geologic map generated by Lite and
Gannett (2002) (Figure 5).

24
The oldest rocks exposed in the study area are basalt flows, sedimentary
deposits, and pyroclastic flows of the Deschutes Formation (Tb, Ts, and Tp in Figure
5). These rocks are present mostly east of the Sisters fault zone, although a few
isolated dome remnants and cinder cones are found west of McKinney Butte.
Deschutes Formation sedimentary deposits (Ts) underlie Deschutes Formation basalt
flows (Tb) in the study area, and are only exposed where modern drainages have
incised through the basalt. A Deschutes Formation partially to moderately welded
pyroclastic flow deposit (Tp) is exposed along, and underlies, the east side of
McKinney Butte (Taylor, written communication, February 6, 2008).
McKinney Butte is composed of late Pliocene high-Fe andesite lavas erupted
from cinder cones on the ridge crest (Taylor, written communication, February 6,
2008). Lava on the north side of the butte has an age of 3.3±0.2 Ma (K-Ar, whole
rock; Armstrong et al., 1975).
The west margin of the Sisters fault zone generally marks the basinward limit
of Quaternary Cascade Range deposits in the study area. However, several basalt
flows (Qb) have erupted from vents located east of the Tumalo fault (e.g. Henkle
Butte). Glacial outwash of the Suttle Lake advance (Qs) has been deposited in the
Sisters area west of the Tumalo fault. Quaternary sedimentary deposits exposed east of
the fault are generally of late Pleistocene age and are thought to be products of glacial
outburst floods originating in the Cascades (Sherrod et al., 2004).

Figure 5. Study area geologic map. Modified from Lite and Gannett (2002).
25
26
Chapter 3 – Study Design and Methods
Study Design
This section describes the naming system used in identifying sites visited
during this study and previous studies and gives a brief background of the McKinney
Butte area and local springs. The rationale behind the selection of this study’s sample
sites is also provided.
Well, Spring, and Stream Data
Six springs and a total of twelve stream locations, nine along Whychus Creek
and three along Indian Ford Creek were sampled during this study (see Figures 2 and 3
for site locations). Additionally, hydrologic and geologic data (from previous studies)
from 111 wells, 44 springs, 39 snow core sites, and 7 surface water sites were
examined.
Sampling sites visited during this study were assigned names unless they had
been named during previous studies or were named on a USGS topographic map.
Previously unnamed surface water sites on Whychus and Indian Ford creeks were
assigned names according to location (e.g., Indian Ford Creek at Barclay Dr.,
Whychus Creek at Sisters gage). Five of the seven springs visited during this study
were identified on USGS topographic maps. Of these, three were named in prior
studies (Metolious Spring, Paulina Spring, and Alder Springs). The two unnamed
springs that were identified on USGS topographic maps were assigned names based

27
on property ownership (Anderson Springs) or location (Camp Polk Springhouse). The
two springs that were not identified on USGS topographic maps were assigned names
based on property ownership (Frank Springs and Chester Springs). The well visited
during this study was also named according to property ownership and OWRD well
log-id (Lamb well, DESC 54659).
Wells not visited during this study are identified by their OWRD well log-id.
The OWRD well log-id is a combination of a four-letter county code and a well-log
number with up to 6 digits (e.g. DESC 1294) which uniquely identifies each water
well report in Ground Water Resource Information Distribution (GRID), a statewide
computer database maintained by OWRD.
Sample Site Background
OWRD seepage runs in 1994, 2005, and 2006 indicated Whychus Creek was
gaining streamflow between the Sisters Gage station and Camp Polk Rd. (see Previous
Work section; site locations on Figure 2). The bulk of the increased flow had been
attributed to springs in the vicinity of Camp Polk Rd. (Anderson Springs and Camp
Polk Springhouse, Figure 6), but never verified (throughout this paper, Anderson
Springs and Camp Polk Springhouse will also be referred to as the Camp Polk Springs
when the topic applies to both springs). Visual inspection of these springs in
September 2006 suggested it was unlikely they were supplying the majority of the
gain in streamflow to Whychus Creek; their combined discharge was estimated to be
much less than the 0.06-0.17 m3/s gain measured along this reach. Consequently, the
28
reach of Whychus Creek on the east side of McKinney Butte was searched for other
possible sources. Frank Springs and Chester Springs were observed approximately 2.0
and 2.5 km upstream from Camp Polk Rd. These springs (specifically Frank Springs)
appeared to be discharging a much greater volume of water than the Camp Polk
Springs (Frank Springs and Chester Springs will be referred to as the McKinney Butte
Springs when the subject matter applies to both).
The morphologies of Frank and Chester Springs are considerably different.
Chester Springs is a point source that surfaces in the bottom of a pond located
approximately 70 m west of Whychus Creek (Figure 7). The pond is connected to
Whychus Creek via a narrow channel extending from its east side to the creek.
Conversely, Frank Springs materializes from the base of McKinney Butte, not at a
single point, but along an approximately 25- to 50-m linear section. Near the end of
this section, Frank Springs discharges via a short (<10 m) channel into the creek
(Figure 8). Although the morphologies of Frank and Chester Springs are quite
different, the physical characteristics of their outflow channels are surprisingly similar.
Both springs have shallow and narrow outflow channels. These traits precluded direct
measurement of their discharge. It is also likely that some groundwater bypasses the
springs outflow channels and discharges directly to Whychus Creek.
Sample Site Selection
Sample sites were selected to address the following questions: 1) What is the
magnitude and seasonal variation of flow from the McKinney Butte Springs? 2) What

is the relative contribution of the springs to the total flow of Whychus Creek on a
seasonal basis? 3) What is the thermal impact of spring flow on Whychus Creek? and
4) What is the source(s) of the McKinney Butte Springs? Additionally, sites were
selected to assist in developing a local conceptual groundwater flow model.
Figure 6. Sisters USGS 7.5 minute quadrangle topographic map. Spring (triangles), stream (circles), and well (square) sampling sites are shown.
29

Given the geologic framework of the study area, initial plausible sources for
the McKinney Butte Springs included: 1) the reappearance of Whychus Creek and or
Indian Ford Creek surface water that was intermittently lost to high-permeability
gravel deposits up gradient from the springs; 2) preferential movement of shallow
groundwater through McKinney Butte (~west to east) via faults or fractures; 3) deep
regional groundwater flow that is migrating through faults bounding the west side of
McKinney Butte; 4) return water from irrigation uses; or 5) seasonal precipitation on
McKinney Butte.
Figure 7. West facing view of Chester Springs. The springs discharge to the bottom of this pond at the base of McKinney Butte (shown in background).
The magnitude and seasonal variation of flow from the McKinney Butte
Springs (question 1) and their relative contribution to Whychus Creek (question 2)
were examined via seepage runs on Whychus Creek and simple mixing models that
compared temperature, and electrical conductivity in Whychus Creek and the springs.
30

31
The morphology of the McKinney Butte Springs outflow channels precluded direct
measurement of discharge; consequently, spring discharge was calculated from the
difference in Whychus Creek discharge directly upstream (Whychus Creek above
Chester Springs) and downstream (Whychus Creek below Frank Springs) from the
springs. Likewise, mixing models using temperature and electrical conductivity data
collected at the same locations on Whychus Creek and at the McKinney Butte Springs
were also used to estimate discharge from the McKinney Butte Springs. In the mixing
models, temperature and conductivity data were considered a proxy for discharge
where a change of some amount in discharge is proportional to a change in
temperature or conductivity. Discharge was also measured on one occasion at
Whychus Creek below Chester Springs to determine the individual discharges of
Chester Springs and Frank Springs. The Whychus Creek at Sisters gage site was used
to examine the change in discharge between Sisters and the McKinney Butte springs.
Sites below the McKinney Butte springs were used to examine the discharge of the
Camp Polk Springs (Whychus Creek at Camp Polk Rd.) and to examine the change in
discharge from McKinney Butte to Camp Polk meadow (Whychus Creek at DRC
gage). Seepage runs were conducted in Indian Ford Creek to quantify the flow in the
creek and the amount of seepage occurring along the west side of McKinney Butte.
Temperature data collected at the McKinney Butte springs and at locations on
Whychus Creek above and below the springs was used to assess the thermal impact of
the springs on Whychus Creek (question 3). Additional sites on Whychus Creek
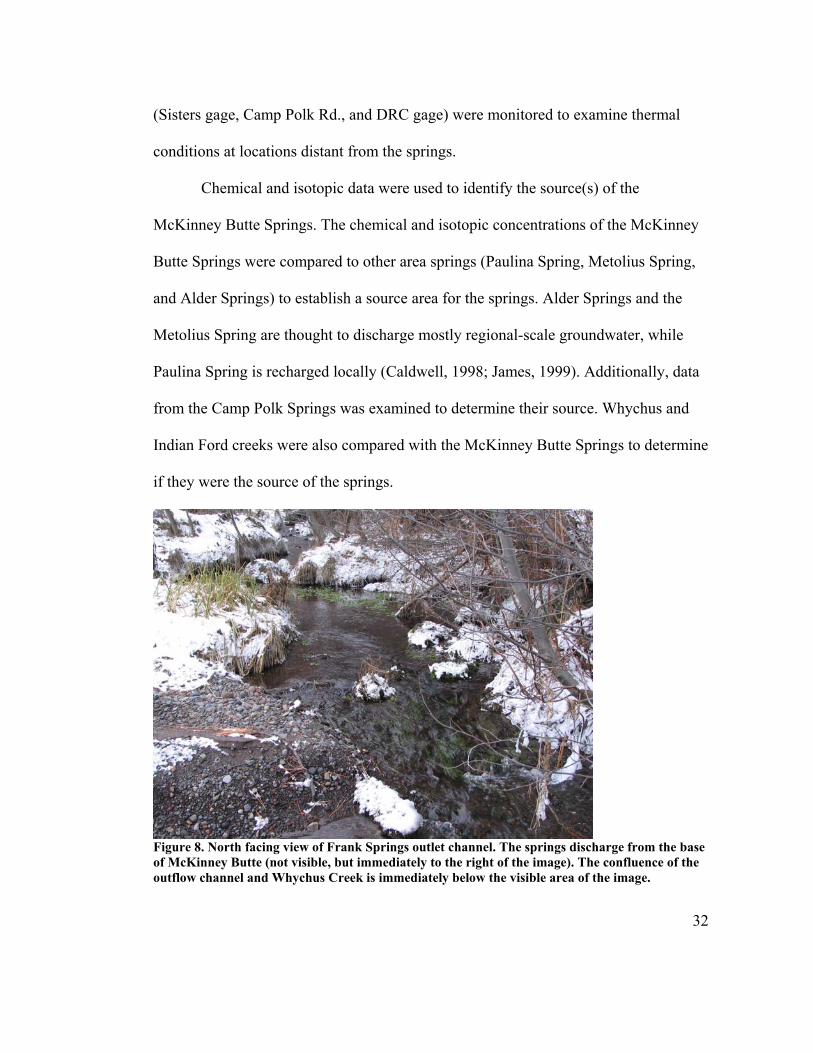
(Sisters gage, Camp Polk Rd., and DRC gage) were monitored to examine thermal
conditions at locations distant from the springs.
Chemical and isotopic data were used to identify the source(s) of the
McKinney Butte Springs. The chemical and isotopic concentrations of the McKinney
Butte Springs were compared to other area springs (Paulina Spring, Metolius Spring,
and Alder Springs) to establish a source area for the springs. Alder Springs and the
Metolius Spring are thought to discharge mostly regional-scale groundwater, while
Paulina Spring is recharged locally (Caldwell, 1998; James, 1999). Additionally, data
from the Camp Polk Springs was examined to determine their source. Whychus and
Indian Ford creeks were also compared with the McKinney Butte Springs to determine
if they were the source of the springs.
Figure 8. North facing view of Frank Springs outlet channel. The springs discharge from the base of McKinney Butte (not visible, but immediately to the right of the image). The confluence of the outflow channel and Whychus Creek is immediately below the visible area of the image.
32
33
Methods
Discharge Measurements
Surface-water discharge measurements were made on a seasonal basis between
April 2007 and January 2008 (measurement locations shown on Figure 2).
Groundwater flow to or from streams was estimated using sets of streamflow
measurements known as seepage runs. A seepage run consists of a series of
streamflow measurements taken a few hundred feet to several miles apart along a
stream over a short enough period that temporal variations in streamflow are minimal
(Gannett et al., 2001). Tributary inflow and diversions are measured as well. Any
temporal changes in streamflow occurring during the measurement period are also
measured or otherwise accounted for.
Sources of errors and uncertainties in determining stream discharge via
seepage runs include 1) random errors related to the method of measurement (e.g.
errors in the measurement of stream channel dimensions), 2) systematic errors caused
by improperly calibrated equipment and other factors, and 3) variation in streamflow
during the seepage run. These errors are discussed in Appendix A. The total
uncertainty for each measurement site and for calculated spring discharge is presented
in the Results section of Chapter 4.

Spring- and Surface-water Sampling
Spring- and surface-water samples were collected from locations identified in
the McKinney Butte area between September 2006 and January 2008 (sampling
locations shown on Figure 2). Additional samples were collected from Paulina Spring,
Indian Ford Creek at Hwy 20, and Metolius Spring, near Black Butte; and Alder
Springs, near the confluence of Whychus Creek and the Deschutes River (sampling
locations shown on Figure 3). The reader is referred to the Sample Site Selection
section in this chapter for explanations behind the selection of sampling sites. The
samples were filtered at each location using dedicated 0.45-μm nylon membrane
syringe filters. Cation samples were acidified using 2% by volume nitric acid. All
samples were stored in polyethylene bottles and placed in an ice chest in the field and
were immediately refrigerated upon return to the lab. One field-equipment blank was
collected during each sampling campaign as a check for potential contamination.
Specific electrical conductance, pH, and temperature measurements were made
in the field using a YSI 556 MPS multi-meter with appropriate probes. The YSI meter
was calibrated in the field the day of sampling to ensure accurate and consistent
measurements. Calibration procedures are outlined in Table 1.
Table 1. Calibration standard and procedures.
Parameter Standard MethodpH 4, 7, 10 3 point calibration
SpecificConductance 147.0, 1407 (µS/cm) calibration in lab and field checkTemperature na no calibration
34

35
Cation, Anion, and Silica Analysis
Anion concentrations were determined with a Dionex Model 2500 ion
chromatograph equipped with an IonPac AS14A column and using an 8.0-mM
carbonate-1.0-mM bicarbonate eluent at a pumping rate of 1.0 ml min-1. Typically,
four external standards prepared from commercial stock solutions were used to
calibrate the instrument prior to each sample batch. Quality control samples –
laboratory blanks and check standards – were analyzed prior to analyzing samples and
repeated after every 10 samples to monitor accuracy and precision.
Alkalinity as HCO3 was determined in the lab using the Gran Plot Method.
Samples were titrated to pH < 4.0 with a 0.009741 N solution of Na2CO3 in HCl. The
amount of titrant added to reach the inflection point was determined by extrapolating
the straight-line portion of the curve of pH versus Gran Function.
Major cation concentrations were measured with a Perkin Elmer AAnalyst 300
atomic absorption spectrometer. All cations were analyzed using an air-acetylene
flame with the wavelengths and slit widths presented in Table 2 (Perkin Elmer, 1994).
Instrument calibration was performed using three external standards, prepared by
dilution from commercially available standard solutions, prior to each analytical run.
Dilutions were made when initial sample concentrations were significantly (>10%)
greater than the highest standard. A discussion of analytical error for anion, cation,
and silica analysis is presented in Appendix B.
Silica analysis was performed on a Beckman Coulter DU 730 ultraviolet
visible spectrophotometer (UV-Vis) using the molybdate yellow method. Silica

concentrations were determined from a calibration curve created from seven standards
of known concentration. All samples were diluted to bring silica concentrations under
the highest standard (10 ppm).
Table 2. Atomic Absorption parameters used for cation analysis. Ion Optimal Range (ppm) Wavelength (nm) Slit Width (mm) Fuel Mix
Ca2+ 0.2 - 20 422.7 0.70 air-acetyleneK+ 0.1 - 2 766.5 0.70 air-acetyleneNa+ 0.03 - 1 589 0.20 air-acetyleneMg2+ 0.02 - 2 285.2 0.70 air-acetylene
Isotope Analysis
Isotopic samples collected in September 2006 and April 2007 were sent to
Geochron Laboratories in Cambridge, Massachusetts and samples collected in June,
August, and September 2007 and January 2008 were sent to the Colorado Plateau
Isotope Laboratory (CPIL) at Northern Arizona University for stable oxygen and
hydrogen isotope analysis. Isotopic sample preparation was by the water-CO2
equilibration method (Epstein and Mayeda, 1953) for oxygen isotopes, and by the zinc
reduction method for deuterium (Coleman et al., 1982). Samples sent to Geochron
Laboratories were analyzed on a VG Micromass gas source stable isotope ratio mass
spectrometer (IRMS), while samples sent to CPIL were analyzed on a Thermo
Finnigan DeltaPLUS XL IRMS configured with a GasBenchII gas preparation and
introduction system. At each lab, one duplicate analysis on separate aliquots of the
original sample was performed during each batch. Isotopic values are reported in the
standard δ-notation as per mil (‰) deviations from the VSMOW (Vienna Standard
36

37
Mean Ocean Water) reference standard. Analytical precision is ±0.1‰ and ±1.0‰ for
oxygen and deuterium, respectively.
Temperature Measurements
Onset StowAway Tidbit Temperature Loggers with ±0.2°C accuracy were
deployed at discharge measurement locations along Whychus and Indian Ford creeks
and the McKinney Butte springs in late August 2007. The loggers were set using
BoxCar 3.7 software to record temperature measurements every ten minutes. Data
from three locations was downloaded in early September 2007 to confirm the loggers
were operating properly. Loggers were removed in January 2008.
All loggers were placed in as much shade as possible to reduce temperature
effects from exposure to direct sunlight. The loggers were tied to heavy-duty string
and either attached to a tree on the stream bank, or secured to a stake and hammered
into the channel bottom. At some point during the course of their deployment, it
appears that loggers at Whychus Creek – Sisters Gage, Whychus Creek – above
Chester Springs, Whychus Creek – below Frank Springs, and Indian Ford Creek –
Camp Polk Rd were removed from the stream. Two loggers on Whychus Creek, at
Sisters Gage and below Frank Springs, were found on the bank, apparently moved
during a high discharge event. The string attached to the logger on Indian Ford Creek
was found cut. The logger at Whychus Creek – above Chester Springs was found in a
block of ice that had formed during the course of the winter. Upon examination of the
data, it was apparent that the logger at Whychus Creek – below Frank Springs was the

38
first to be removed from the stream. On approximately 10/20/2007, the temperature
began displaying much greater diurnal fluctuations than it had been up until then (high
temperatures near 30°C and low temperatures below 0°C). As a precaution, only data
collected before 10/16/2007 has been analyzed in this study.
Groundwater temperature was measured in the Lamb Well (DESC 54659)
every two hours from 01/11/2007 to 10/31/2007 via an internal sensor on a Unidata
WDP 8007 20 psi transducer. The temperature sensor is accurate to ±0.5ºC.
Groundwater Level Measurements
Continuous water-level measurements were monitored at the Lamb well using
a battery operated electronic data recorder. The water level in the well was measured
with a submersible pressure transducer. The water level was measured every two
hours using a Unidata WDP 8007 20 psi transducer for the period between January 11,
2007 and October 31, 2007. A Druck 1830 20 psi transducer was used to measure the
water level every 15 minutes during the period from September 10, 2007 to October
31, 2007. Both models of transducers are accurate to 0.1% of full scale (0.015 m).
Additionally, both transducers were vented to land surface in order to compensate for
barometric effects on water levels in the well bore. The transducers measured the
pressure due to the weight of the overlying water column and converted it to the height
above the transducer (1 psi = 0.704 m). The height of the water column was then
subtracted from the depth of the transducer below land surface to obtain the water
level below land surface. Water levels measured by the transducers were recorded by a
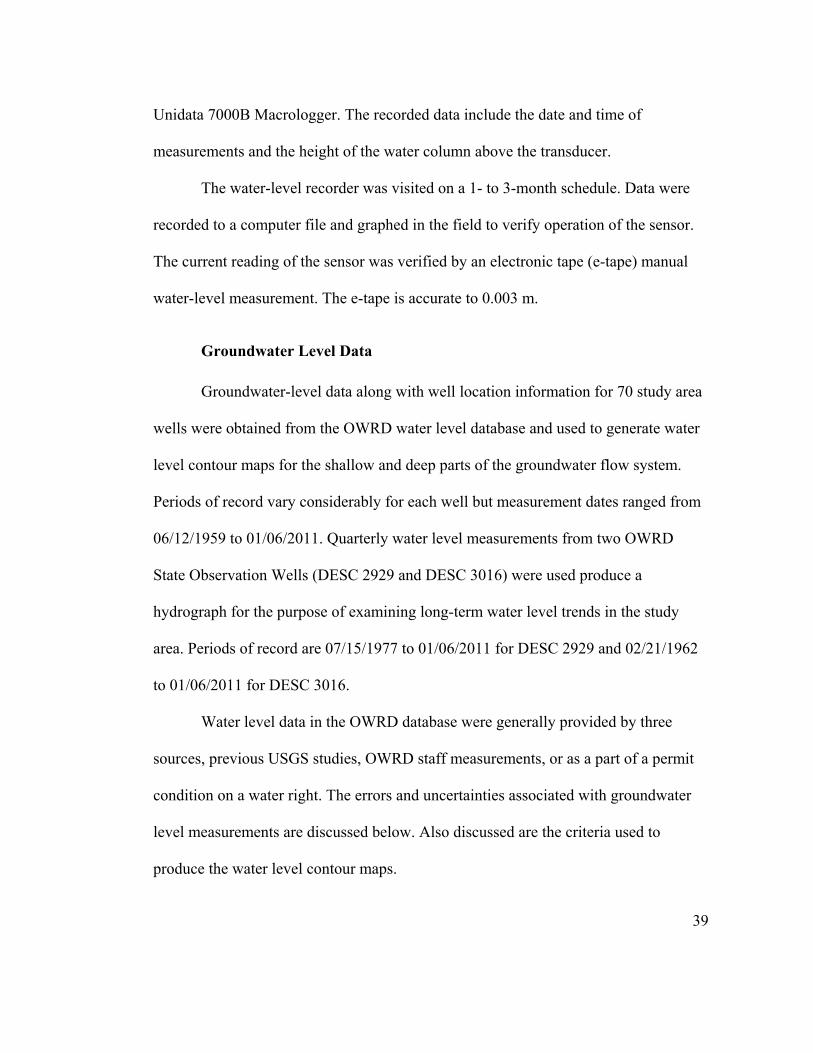
39
Unidata 7000B Macrologger. The recorded data include the date and time of
measurements and the height of the water column above the transducer.
The water-level recorder was visited on a 1- to 3-month schedule. Data were
recorded to a computer file and graphed in the field to verify operation of the sensor.
The current reading of the sensor was verified by an electronic tape (e-tape) manual
water-level measurement. The e-tape is accurate to 0.003 m.
Groundwater Level Data
Groundwater-level data along with well location information for 70 study area
wells were obtained from the OWRD water level database and used to generate water
level contour maps for the shallow and deep parts of the groundwater flow system.
Periods of record vary considerably for each well but measurement dates ranged from
06/12/1959 to 01/06/2011. Quarterly water level measurements from two OWRD
State Observation Wells (DESC 2929 and DESC 3016) were used produce a
hydrograph for the purpose of examining long-term water level trends in the study
area. Periods of record are 07/15/1977 to 01/06/2011 for DESC 2929 and 02/21/1962
to 01/06/2011 for DESC 3016.
Water level data in the OWRD database were generally provided by three
sources, previous USGS studies, OWRD staff measurements, or as a part of a permit
condition on a water right. The errors and uncertainties associated with groundwater
level measurements are discussed below. Also discussed are the criteria used to
produce the water level contour maps.

40
Errors and Uncertainties
Errors and uncertainties associated with groundwater-level measurements stem
from two major sources. The first source is measurement error or instrument error.
This error is generally small, but differences in measurement or calibration techniques
or the use of different equipment can produce errors on the order of ± 0.15 m. The
second source comes from the conversion from water level below land surface to
water level elevation above mean sea level. Converting to an elevation normalizes the
data and allows production of water level contour maps. The water level below land
surface is converted to water level elevation by subtracting the water level below land
surface from land surface elevation at the well head. The major source of error in this
process is the well head elevation, which is interpolated from USGS 7.5 minute
topographic maps. At best, the error associated with interpolation from topographic
maps is ± ½ of the contour interval. In the study area, contour intervals are 20 feet (6
m), accordingly, well elevation errors are ± 3 m.
Water Level Elevation Contour Maps
The following criteria were used to generate separate sets of water-level
elevation contours for the shallow and deep parts of groundwater flow system in the
study area: 1) the total depth of wells used to generate contours for the shallow part of
the groundwater system was typically < 100 m. The exception is DESC 50481, which
is the westernmost and highest elevation well. DESC 50481 was originally drilled to a
depth of 122 m and had a static water level elevation of 1052 m (approximately 30 m

41
below land surface). Although the well is relatively deep compared to other wells used
in the analysis, the water level is interpreted to represent the shallow part of the
groundwater system because it is located close to the regional groundwater recharge
area where vertical hydraulic gradients are large. This interpretation is supported by
the deepening well log for DESC 50481 (DESC 51803). After the well was deepened
to 181 m, the water level elevation was 953 m, a drop of 99 m; 2) the total depth of
most wells used to generate contours for the deep part of the groundwater system were
>100 m, and were commonly >150 m; 3) land surface elevations of springs that were
determined to discharge local-scale groundwater were used in the generation of
shallow water level contours and elevations of springs interpreted to discharge
regional-scale groundwater were used to generate deep water level contours.
Interpretations of the scale of groundwater discharged at study area springs are
presented in Chapter 6; 4) rising or pumping water level measurements were not
included in the analysis; 5) water levels from the driller’s well report were excluded
from analysis unless they represented the only available information in a given area; 6)
the mean water level for each well was calculated for the entire period of record, and
7) the importance of each well was determined by the number of water level
measurements (i.e. wells with more water level measurements were weighted more
heavily). Due to the lack of a highly permeable, shallow aquifer east of McKinney
Butte, the water table depth increases eastward and wells with total depths <100 m are
uncommon. As a result, contour mapping for the shallow aquifer stopped
approximately 0.5 km east of the butte.

42
The preceding information is summarized in Table 3 (shallow water level
contours) and Table 4 (deep water level contours). Water level elevations were plotted
and contoured by hand prior to digitizing using ArcMap 9.3 geographical information
system software.
Errors and Uncertainties
Uncertainties associated with using this method to produce water level contour
maps result from the fact that groundwater level fluctuations in the upper Deschutes
Basin are driven primarily by decadal climate cycles. Decadal water-level fluctuations
of 6 m have been observed in wells near the margin of the Cascade Range. The
magnitude of these fluctuations diminishes toward the east with increasing distance
from the Cascade Range (Gannett et al., 2001). The calculated mean water level in
wells whose period of record does not span an entire decadal climate cycle may under
estimate or over estimate the “true” mean water level depending on the timing of
water-level measurements relative to climate induced fluctuations. This indicates that
uncertainty in water level elevations due to decadal climate cycles could be as large as
± 6 m in the western part of the study area. This error coupled with the uncertainty in
land surface elevations of wells and springs (± 3 m) could result in uncertainty on the
order of ± 9 m.

Tab
le 3
. Mea
n w
ater
leve
l ele
vati
ons
use
d t
o ge
ner
ate
the
wat
er le
vel e
leva
tion
con
tou
r m
ap f
or t
he
shal
low
par
t of
th
e gr
oun
dw
ater
flo
w s
yste
m.
Wel
ls w
ith
mor
e w
ater
leve
l mea
sure
men
ts w
ere
con
sid
ered
to
be
bet
ter
rep
rese
nta
tion
s of
th
e h
ydra
uli
c h
ead
.
Sit
e N
ame
Lan
dS
urf
ace
Ele
vati
on(m
)
Mea
nW
ater
Lev
elE
leva
tion
(m)
Sta
nd
ard
Dev
iati
on(m
)
Nu
mb
er
ofW
ater
L
evel
Mea
sure
-m
ents
Max
imu
m
Wat
erL
evel
E
leva
tion
(m)
Min
imu
m
Wat
erL
evel
E
leva
tion
(m)
Dat
e of
Fir
stM
easu
re-
men
t
Dat
e of
Las
tM
easu
re-
men
t
Max
imu
mW
ell
Dep
th(m
)
Dri
ller
Mea
sure
-m
ent
Com
men
ts
DE
SC
504
8110
8210
521
08/0
6/19
9612
2Y
Ori
gina
l wel
l. W
ater
le
vel e
leva
tion
on
deep
enin
g lo
g (D
ES
C
5180
3) is
953
m a
msl
.D
ES
C 2
6210
3510
261.
3115
1029
1025
07/1
0/19
7004
/07/
2010
32P
auli
na S
prin
g10
2410
24D
ES
C 5
0859
1033
997
1.01
1599
799
308
/31/
1983
09/1
7/19
9762
DE
SC
166
310
0999
21.
453
994
991
03/0
4/19
9302
/28/
1994
35D
ES
C 1
224
1006
989
2.92
299
198
701
/08/
1992
08/0
3/19
9337
DE
SC
183
298
195
91
08/1
6/19
9337
DE
SC
299
597
694
72.
7516
953
945
09/0
4/19
8509
/17/
1997
35D
ES
C 1
410
962
943
0.65
294
394
206
/30/
1992
09/1
5/20
0834
DE
SC
862
596
394
32.
0616
947
941
10/0
7/19
9309
/17/
1997
34D
ES
C 5
4659
970
940
0.64
1594
193
904
/16/
2002
03/0
6/20
0858
And
erso
n S
prin
gs94
593
5
Eph
emer
al s
prin
g.
Ave
rage
wat
er le
vel
elev
atio
n is
ass
umed
to
be
slig
htly
low
er
than
the
elev
atio
n of
th
e sp
ring
.
43

Tab
le 3
. – c
onti
nu
ed. M
ean
wat
er le
vel e
leva
tion
s u
sed
to
gen
erat
e th
e w
ater
leve
l ele
vati
on c
onto
ur
map
for
th
e sh
allo
w p
art
of t
he
grou
nd
wat
er
flow
sys
tem
. Wel
ls w
ith
mor
e w
ater
leve
l mea
sure
men
ts w
ere
con
sid
ered
to
be
bet
ter
rep
rese
nta
tion
s of
th
e h
ydra
uli
c h
ead
.
Sit
e N
ame
Lan
dS
urf
ace
Ele
vati
on(m
)
Mea
nW
ater
Lev
elE
leva
tion
(m)
Sta
nd
ard
Dev
iati
on(m
)
Nu
mb
er
ofW
ater
L
evel
Mea
sure
-m
ents
Max
imu
m
Wat
erL
evel
E
leva
tion
(m)
Min
imu
m
Wat
erL
evel
E
leva
tion
(m)
Dat
e of
Fir
stM
easu
re-
men
t
Dat
e of
Las
tM
easu
re-
men
t
Max
imu
mW
ell
Dep
th(m
)
Dri
ller
Mea
sure
-m
ent
Com
men
ts
Cam
p P
olk
Spr
ingh
ouse
942
935
Eph
emer
al s
prin
g.
Ave
rage
wat
er le
vel
elev
atio
n is
ass
umed
to
be
slig
htly
low
er
than
the
elev
atio
n of
th
e sp
ring
.D
ES
C 2
929
953
907
1.73
7390
990
407
/15/
1977
10/0
8/20
0959
DE
SC
308
696
090
64.
953
911
902
02/0
2/19
7509
/08/
1993
76D
ES
C 3
081
953
904
2.83
290
690
203
/14/
1979
06/0
9/19
9755
DE
SC
308
896
090
35.
2030
930
900
07/0
2/19
7703
/03/
2000
77D
ES
C 1
952
900
2.09
2090
489
609
/08/
1989
03/0
9/20
0387
DE
SC
186
789
388
81.
072
889
887
09/1
5/19
6703
/22/
1979
11
44

Sit
e N
ame
Lan
dS
urf
ace
Ele
vati
on(m
)
Mea
nW
ater
Lev
elE
leva
tion
(m)
Sta
nd
ard
Dev
iati
on(m
)m
ents
DE
SC
504
8110
8295
3ev
el is
fro
m
ng w
ell l
og
C 5
1803
)D
ES
C 1
810
1023
948
2.94
DE
SC
180
010
2494
72.
46D
ES
C 9
719
1036
947
3.73
DE
SC
312
610
4994
55.
60D
ES
C 1
804
1030
941
2.00
Che
ster
Spr
ings
930
930
Fran
k S
prin
gs92
992
9M
etol
ius
Spr
ing
915
915
DE
SC
584
5296
689
60.
00D
ES
C 1
495
988
37.
54D
ES
C 4
105
1013
841
DE
SC
11
946
841
DE
SC
323
693
781
20.
00D
ES
C 7
8194
880
5D
ES
C 1
862
887
803
31.9
0D
ES
C 1
002
958
797
DE
SC
200
294
679
5D
ES
C 8
590
1009
791
0.00
DE
SC
518
3094
577
7D
ES
C 1
510
946
771
Tab
le 4
. Mea
n w
ater
leve
l ele
vati
ons
use
d t
o ge
ner
ate
the
wat
er le
vel e
leva
tion
con
tou
r m
ap f
or t
he d
eep
par
t of
th
e gr
oun
dw
ater
flo
w s
yste
m.
Wel
ls w
ith
mor
e w
ater
leve
l mea
sure
men
ts w
ere
con
sid
ered
to
be
bet
ter
rep
rese
nta
tion
s of
th
e h
ydra
uli
c h
ead
. N
um
ber
ofW
ater
Lev
elM
easu
re-
men
ts
Max
imu
m
Wat
erL
evel
E
leva
tion
(m)
Min
imu
m
Wat
erL
evel
E
leva
tion
(m)
Dat
e of
Fir
stM
easu
re-
men
t
Dat
e of
Las
tM
easu
re-
men
t
Max
imu
mW
ell
Dep
th(m
)
Dri
ller
Mea
sure
-m
ent
Com
108
/05/
1998
181
YW
ater
lde
epen
i(D
ES
1495
494
309
/06/
1977
04/0
7/20
1094
1895
194
302
/28/
1973
04/0
9/20
1011
316
959
944
01/1
6/19
9504
/07/
2010
128
294
994
207
/22/
1983
08/2
1/20
0812
675
944
938
05/0
9/19
8510
/05/
2007
123
289
689
605
/22/
2008
07/0
2/20
0824
12
888
878
03/1
9/19
9006
/16/
1993
183
107
/29/
1976
189
104
/11/
1990
140
Y2
812
812
10/2
7/19
8910
/27/
1993
126
109
/15/
1993
160
Y2
826
781
05/2
0/19
6803
/22/
1979
174
108
/20/
1991
187
Y1
08/1
7/19
7816
5Y
279
179
110
/03/
1993
10/1
3/19
9325
61
08/1
1/19
9820
1Y
109
/30/
1992
202
Y
45

46
Chapter 4 – Physical Hydrogeology
Results from Previous Work
Previous studies by OWRD and the USGS have examined physical
hydrogeologic characteristics of the study area. OWRD has examined groundwater
flow from and to streams via synoptic discharge measurements along Whychus and
Indian Ford creeks, and, as part of their Upper Deschutes Basin study, the USGS
measured the discharge of springs, groundwater levels in wells, and generated a basin-
scale potentiometric surface map. Some results of these studies are presented below.
Stream Discharge Measurements
OWRD staff conducted seepage runs on Whychus Creek in April 1994, August
2005, March 2006, and September 2006. Seepage runs were conducted on Indian Ford
Creek in February 1992, March 2006, and September 2006. Measurement locations
are shown on Figure 9 and results are presented in Tables 5 and 6. Discharge errors
were assigned by OWRD staff and were based on field conditions. Error values are
5%, 10%, or 15% of the measured discharge. Discharge in relation to river mile is
shown in Figure 10 for Whychus Creek and in Figure 11 for Indian Ford Creek.
In general, Whychus Creek loses discharge in the reaches upstream of Sisters,
from Three Sisters Diversion Canal to Sisters (RM 24 to 21), although in March 2006
it gained streamflow from B-S Log Road to Sisters (RM 22.4 to 21). The creek also
loses discharge in the reach from Sisters to Willow Lane (RM 21 to 19.4). Whychus

47
Creek gains streamflow along the reaches from Willow Lane to Camp Polk Road (RM
194 to 16.6) and Camp Polk Road to Henkle Butte (RM 16.6 to 14.6). Irrigation return
flows from Sokol Ditch and Reed Ditch were measured in September 2006. Both
sources contribute minor amounts of streamflow, 0.019 m3/s and 0.014 m3/s,
respectively.
Indian Ford Creek loses discharge along the reach from Camp Polk Road to the
confluence with Whychus Creek (RM 2.1 to 0.0). The creek was dry at Barclay Drive
(RM 0.8) in February 1992 and March 2006, and was dry at Camp Polk Road in
September 2006. OWRD staff has never observed flow in Indian Ford Creek at the
confluence with Whychus Creek (LaMarche personal communication, 2007).

Figure 9. Previous OWRD discharge measurement locations.
48

49
Table 5. Instantaneous discharge measurements for Whychus Creek (La Marche, personal communication 2007).
Location River Mile Date
Discharge
(m3/s)
Error
(m3/s)
Whychus Cr at Sisters 21.0 04/13/1994 0.000 0.000Whychus Cr at Willow Ln. 19.4 04/13/1994 0.000 0.000Whychus Cr at Camp Polk Rd. 16.6 04/13/1994 0.187 0.019Whychus Cr at Henkle Butte 14.6 04/13/1994 0.207 0.021Whychus Cr at Sisters 21.0 08/03/2005 0.147 0.015Whychus Cr at Henkle Butte 14.6 08/03/2005 0.198 0.020Whychus Cr below Three Sisters Diversion Canal 24.0 03/30/2006 0.382 0.019Whychus Cr at B-S Log Rd. 22.4 03/30/2006 0.250 0.013Whychus Cr at Sisters 21.0 03/30/2006 0.351 0.018Whychus Cr at Willow Ln. 19.4 03/30/2006 0.314 0.016Whychus Cr at Camp Polk Rd. 16.6 03/30/2006 0.518 0.026Whychus Cr at DRC gage 15.7 03/30/2006 0.547 0.027Whychus Cr at Henkle Butte 14.6 03/30/2006 0.558 0.028Whychus Cr below Three Sisters Diversion Canal 24.0 09/07/2006 0.538 0.027Whychus Cr below Sokol Diversion 22.8 09/07/2006 0.430 0.022Whychus Cr at B-S Log Rd. 22.4 09/07/2006 0.388 0.019Sokol Ditch Return Flows 21.9 09/07/2006 0.019 0.001Whychus Cr at Sisters 21.0 09/07/2006 0.329 0.016Whychus Cr at Willow Ln. 19.4 09/07/2006 0.309 0.015Mouth of Reed Ditch Return Flows 19.2 09/07/2006 0.014 0.002Whychus Cr near Borrow Pit, below Reed Ditch 19.1 09/07/2006 0.326 0.016Whychus Cr at Camp Polk Rd. 16.6 09/07/2006 0.428 0.021Whychus Cr at DRC gage 15.7 09/07/2006 0.442 0.022 Table 6. Instantaneous discharge measurements for Indian Ford Creek (La Marche, personal communication 2007).
Location River Mile Date
Discharge
(m3/s)
Error
(m3/s)
Indian Ford Cr at Camp Polk Rd. 2.1 02/05/1992 0.086 0.009Indian Ford Cr at Barclay Dr. 0.8 02/05/1992 0.000 0.000Indian Ford Cr at Whychus Cr 0.0 02/05/1992 0.000 0.000Indian Ford Cr at Camp Polk Rd. 2.1 03/30/2006 0.188 0.028Indian Ford Cr at Barclay Dr. 0.8 03/30/2006 0.000 0.000Indian Ford Cr at Camp Polk Rd. 2.1 09/07/2006 0.000 0.000

0.00
0.10
0.20
0.30
0.40
0.50
0.60
0.70
0.80
1415
1617
1819
2021
2223
2425
RIV
ER
MIL
E
DISCHARGE (m3/s)
04/1
3/19
94
08/0
3/20
05
03/3
0/20
06
09/0
7/20
06
Bel
owT
hree
Sis
ters
Div
ersi
onC
anal
Bel
owS
okol
Div
er-
sion
B-S
Log
Rd
.
Sis
ters
Wil
low
Ln
.C
amp
Pol
kR
d.
DR
CG
age
Hen
kle
Bu
tte
F
igu
re 1
0. O
WR
D s
ynop
tic
dis
char
ge m
easu
rem
ent
resu
lts
alon
g W
hyc
hu
s C
reek
bet
wee
n T
hre
e S
iste
rs D
iver
sion
Can
al a
nd
Hen
kle
Bu
tte.
50

0.00
0.05
0.10
0.15
0.20
0.25
2.0
2.5
Discharge (m3/s)
0.0
0.5
1.0
1.5
Riv
er M
ile
02/0
5/19
92
03/3
0/20
06
09/0
7/20
06
Bar
clay
Dr.
W
hyc
hu
s C
rC
onfl
uen
ceC
amp
Pol
kR
d.
F
igu
re 1
1. O
WR
D s
ynop
tic
dis
char
ge m
easu
rem
ent
resu
lts
alon
g In
dia
n F
ord
Cre
ek b
etw
een
Cam
p P
olk
Rd
. an
d t
he
con
flu
ence
wit
h W
hyc
hu
s C
reek
.
51

Discharge Measurements of Other Significant Springs in the Region
Spring discharge values were obtained from measurements by OWRD staff
and a USGS publication, Caldwell (1998), and are presented in Table 7. Discharge
from Lower Opal Springs and Alder Springs were estimated, the former by an
employee of Deschutes Valley Water, and the latter by Caldwell (1998). The estimate
for Lower Opal Springs is an average discharge while the estimate for Alder Springs is
instantaneous. Discharge from Metolius Spring was measured by OWRD staff 16
times between 06/25/2007 and 03/03/2011 (OWRD, 2011a), and Paulina Spring was
measured by OWRD staff on 07/12/1995 (Caldwell, 1998). The accuracy or
uncertainty of each discharge was not provided, but measurements are assumed to be
within 10% of the true discharge and estimates are assumed to be within one order of
magnitude (± 100%). Discharge from Alder Springs and Paulina Spring is much lower
than Lower Opal Springs and Metolius Spring (locations shown in Figure 3).
Table 7. Discharge values for local springs. Location Date Discharge (m3/s) RemarksLower Opal Springs 1996 6.8 estimated average flow rate*Alder Springs 01/18/1996 0.11-0.14 estimated flow rate*Paulina Spring 07/12/1995 0.176 measured by OWRD staff*Metolius Spring 06/25/2007 - 03/03/2011 1.92-2.83 measured by OWRD staff * From Caldwell (1998)
Potentiometric Surface Mapping
52
A potentiometric surface map of the Upper Deschutes basin was produced by
Gannett and Lite (2004). Figure 12 shows their contours in the vicinity of the current
study area. Their work demonstrated that groundwater flows from high-elevation
recharge areas in the Cascade Range toward low-elevation discharge areas near the

53
margins of the Cascade Range and near the confluence of the Deschutes, Crooked, and
Metolius Rivers. Their map also shows a steep groundwater flow gradient in the
Cascades that becomes increasingly flat toward the center of the basin near the town
of Sisters.

F
igu
re 1
2. G
ener
aliz
ed li
nes
of
equ
al h
ydra
uli
c h
ead
in t
he
vici
nit
y of
th
e cu
rren
t st
ud
y ar
ea (
from
Gan
net
t an
d L
ite,
200
4). C
onto
ur
inte
rval
s ar
e 20
0 fe
et.
54

55
Results from Current Study
Stream Discharge
Instantaneous stream discharge was measured on a seasonal basis between
April 2007 and January 2008 and the results are presented in Tables 8 and 9
(measurement locations shown on Figure 2) Discharge in relation to river mile is
shown in Figure 13 for Whychus Creek and in Figure 14 for Indian Ford Creek.
In both Whychus and Indian Ford creeks, discharge increased during the
winter and decreased during the summer (Tables 8 and 9, Figures 13 and 14).
Discharge in Indian Ford Creek decreased downstream indicating it is losing water to
the groundwater system. On 06/25/2007 and 09/21/2007 Indian Ford Creek went dry
upstream from Camp Polk Road, and on 04/16/2007 and 01/30/2008 the creek went
dry between Camp Polk Road and Barclay Drive. No water was observed in Indian
Ford Creek at its confluence with Whychus Creek. Discharge in Whychus Creek
typically increased downstream (Table 8 and Figure 13), but occasional downstream
decreases in discharge were observed.
Measurement sites on Whychus Creek have been divided into four reaches
based on location to better facilitate analysis and discussion (Figure 13). Reach 1
extends from Sisters to above Chester Springs (RM 21 to RM 18.4), Reach 2 begins at
the above Chester Springs site and extends to below Frank Springs (RM 18.4 to RM
17.5), Reach 3 begins at the below Frank Springs site and ends at Camp Polk Road

(RM 17.5 to RM 16.6), and Reach 4 starts at Camp Polk Road and ends at DRC gage
(RM 16.6 to RM 15.7).
Table 8. Discharge measurements and calculated errors for Whychus Creek.
Location River Mile Date
Discharge
(m3/s)
Sq
(%)
Esv
(m3/s)
Et
(m3/s)
Whychus Cr at Sisters 21.0 04/16/2007 0.552 4.40 0.009 0.033Whychus Cr at Willow Ln. 19.4 04/16/2007 0.581 4.28 0.009 0.034Mouth of Reed Ditch 19.2 04/16/2007 0.000 - - -Whychus Cr below Reed Ditch 19.1 04/16/2007 0.564 4.31 0.009 0.033Whychus Cr above Chester springs 18.4 04/16/2007 0.547 4.31 0.009 0.033Whychus Cr below Chester springs 17.9 04/16/2007 0.552 4.35 0.009 0.033Whychus Cr below Frank springs 17.5 04/16/2007 0.734 4.33 0.009 0.041Whychus Cr at Camp Polk Rd. 16.6 04/16/2007 0.745 4.34 0.009 0.041Whychus Cr at Sisters 21.0 06/25/2007 0.249 4.53 0.025 0.036Whychus Cr above Chester springs 18.4 06/25/2007 0.199 4.43 0.025 0.034Whychus Cr below Frank springs 17.5 06/25/2007 0.340 4.45 0.025 0.040Whychus Cr at Camp Polk Rd. 16.6 06/25/2007 0.379 4.43 0.025 0.042Whychus Cr at DRC gage 15.7 06/25/2007 0.368 4.43 0.025 0.041Whychus Cr at Sisters 21.0 09/21/2007 0.396 4.48 0.027 0.045Whychus Cr above Chester springs 18.4 09/21/2007 0.346 4.36 0.027 0.042Whychus Cr below Frank springs 17.5 09/21/2007 0.538 4.35 0.027 0.050Whychus Cr at Camp Polk Rd. 16.6 09/21/2007 0.513 4.38 0.027 0.049Whychus Cr at DRC gage 15.7 09/21/2007 0.501 4.35 0.027 0.049Whychus Cr at Sisters 21.0 01/30/2008 1.694 4.22 0.020 0.091Whychus Cr above Chester springs 18.4 01/30/2008 1.648 4.22 0.020 0.089Whychus Cr below Frank springs 17.5 01/30/2008 1.849 4.23 0.020 0.098Whychus Cr at Camp Polk Rd. 16.6 01/30/2008 1.878 4.24 0.020 0.100Whychus Cr at DRC gage 15.7 01/30/2008 1.994 4.22 0.020 0.104 Sq = standard error, Esv = error due variability in stream discharge, and Et = total error. Table 9. Discharge measurements and calculated errors for Indian Ford Creek.
Location River Mile Date
Discharge
(m3/s)
Error
(m3/s)
Indian Ford Cr at Camp Polk Rd. 2.1 04/16/2007 0.091 0.013Indian Ford Cr at Barclay Dr. 0.8 04/16/2007 0.000 0.000Indian Ford Cr at Camp Polk Rd. 2.1 06/25/2007 0.000 0.000Indian Ford Cr at Barclay Dr. 0.8 06/25/2007 0.000 0.000Indian Ford Cr at Camp Polk Rd. 2.1 09/21/2007 0.000 0.000Indian Ford Cr at Barclay Dr. 0.8 09/21/2007 0.000 0.000Indian Ford Cr at Camp Polk Rd. 2.1 01/30/2008 0.081 0.012Indian Ford Cr at Barclay Dr. 0.8 01/30/2008 0.000 0.000
56

57
As shown in Figure 15, measured discharge decreased along Reach 1.
However, the difference in discharge between Sisters and above Chester Springs was
within the margin of measurement error and may not represent actual losses. Within
Reach 1, measured discharge increased from Sisters to Willow Lane (RM 21 to 19.4,
04/16/2007 seepage run) and decreased from Willow Lane to below Reed Ditch (RM
19.4 to 19.1, 04/16/2007 seepage run). Once again, however, the calculated gains and
losses were within measurement error, and may not represent actual changes in
discharge.
Streamflow measurements along Reach 2 were used to estimate discharge from
the McKinney Butte Springs. Therefore, results for this reach will be presented in the
McKinney Butte Springs Discharge section later in this chapter.
Measured discharge along Reach 3 increased on 04/16/2007, 06/25/2007, and
01/30/2008, and decreased on 09/21/2007 (Figure 16). However, the gains and losses
were less than calculated errors and therefore may not represent actual gains or losses.
Similar to Reach 3, measured discharge along Reach 4 decreased during some
seepage runs (06/25/2007 and 09/21/2007) and increased during others (01/30/2008),
but once again, the magnitude of the gains or losses were less than the calculated
errors (Figure 17). Discharge was not measured at the DRC gage during the
04/16/2007 seepage run, thus no gain/loss value is presented.

0.0
0.2
0.4
0.6
0.8
1.0
1.2
1.4
1.6
1.8
2.0
2.2
1516
1718
1920
2122
23
Riv
er M
ile
Discharge (m3/s)
Sisters
above Chester Springs
below Chester Springs
below Frank Springs
Camp Polk Rd.
DRC Gage
REA
CH
1R
EAC
H2
REA
CH
3R
EAC
H4
below Reed Ditch
Willow Ln.
McKinne
yBu
tte
Spring
s
Camp
Polk
Spring
s
Janu
ary
2008
Apr
il 20
07
Sept
embe
r 20
07
June
200
7
Fig
ure
13.
Sea
son
al d
isch
arge
mea
sure
men
ts a
lon
g W
hyc
hu
s C
reek
bet
wee
n r
iver
mile
s 21
.0 a
nd
15.
7. M
easu
rem
ent
loca
tion
s ar
e sh
own
on
Fig
ure
3.
58

0.00
0.01
0.02
0.03
0.04
0.05
0.06
0.07
0.08
0.09
0.10
0.11
0.12
0.5
1.0
1.5
2.0
2.5
Riv
er M
ile
Discharge (m3/s)
4/16
/200
7
6/25
/200
7
9/21
/200
7
1/30
/200
8
Camp Polk Rd.
Barclay Dr.
Fig
ure
14.
Sea
son
al d
isch
arge
mea
sure
men
ts a
long
In
dia
n F
ord
Cre
ek b
etw
een
riv
er m
iles
2.1
an
d 0
.8. T
he
cree
k w
as d
ry a
t C
amp
Pol
k R
d. o
n
06/2
5/20
07 a
nd 0
9/21
/200
7 an
d a
t B
arcl
ay D
r. o
n al
l dat
es.
59

0.54
7
0.19
9
0.34
6
1.64
8
0.55
2
0.24
9
0.39
6
1.69
4
0.00
0.25
0.50
0.75
1.00
1.25
1.50
1.75
2.00
18.0
19.0
20.0
21.0
22.0
Riv
er M
ile
Discharge (m3/s)
04/1
6/20
07
06/2
5/20
07
09/2
1/20
07
01/3
0/20
08
Wh
ych
us C
reek
at S
iste
rsW
hyc
hu
s C
reek
abov
e C
hes
ter
spri
ngs
F
igu
re 1
5. M
easu
red
dis
char
ge in
Why
chu
s C
reek
alo
ng R
each
1 (
bet
wee
n S
iste
rs a
nd
ab
ove
Ch
este
r sp
rin
gs, s
ee F
igu
re 2
for
mea
sure
men
t lo
cati
ons)
. Err
or b
ars
are
pro
vid
ed f
or e
ach
mea
sure
men
t.
60

0.74
5
0.37
9
0.51
3
1.87
8
0.73
4
0.34
0
0.53
8
1.84
9
0.00
0.20
0.40
0.60
0.80
1.00
1.20
1.40
1.60
1.80
2.00
16.5
016
.75
17.0
017
.25
17.5
017
.75
Riv
er M
ile
Discharge (m3/s)
04/1
6/20
07
06/2
5/20
07
09/2
1/20
07
01/3
0/20
08
Wh
ych
us
Cre
ekat
Cam
p P
olk
Rd
.W
hyc
hu
s C
reek
bel
ow F
ran
k sp
rin
gs
Fig
ure
16.
Mea
sure
d d
isch
arge
alo
ng R
each
3 o
f W
hych
us
Cre
ek (
bel
ow F
ran
k sp
rin
gs t
o C
amp
Pol
k R
d). E
rror
bar
s ar
e p
rovi
ded
for
eac
h
mea
sure
men
t.
61

0.36
8
0.50
1
1.99
4
15.5
015
.75
16.0
016
.25
16.5
0
Riv
er M
ile
0.37
9
0.51
3
1.87
8
0.00
0.25
0.50
0.75
1.00
1.25
1.50
1.75
2.00
2.25
16.7
517
.00
Discharge (m3/s)
06/2
5/20
07
09/2
1/20
07
01/3
0/20
08
Wh
ych
us
at C
amp
Cre
ek P
olk
Rd
.W
hyc
hu
s C
reek
at D
RC
gag
e
Fig
ure
17.
Mea
sure
d d
isch
arge
alo
ng R
each
4 o
f W
hych
us
Cre
ek (
Cam
p P
olk
Rd
. to
DR
C g
age)
. Err
or b
ars
are
pro
vid
ed f
or e
ach
mea
sure
men
t.
62

63
Discharge from the McKinney Butte Springs
Discharge from the McKinney Butte Springs was determined by subtracting
the measured discharge in Whychus Creek above Chester Springs from the measured
discharge in Whychus Creek below Frank Springs. These two measurement sites,
along with the site below Chester Springs define flow along Reach 2 as described in
the previous section.
Seepage runs indicated Whychus Creek gained discharge along Reach 2
(Figure 18) and measured gains were sufficiently large with respect to measurement
error to be considered meaningful. Table 10 provides the calculated gain on each date
and the error associated with each gain. The calculated gain column in Table 10
represents the estimated discharge from the McKinney Butte Springs. Errors were
calculated using equation A13; a complete discussion of errors is presented in
Appendix A. Calculated discharge from the McKinney Butte Springs ranged from
0.141 ± 0.052 m3/s on 06/25/2007 to 0.201 ± 0.132 m3/s on 01/30/2008. Although the
discharge was largest on 01/30/2008, the associated error was also largest, and as a
result, the actual springs discharge could vary by up to 64% (true discharge could
range from 0.072 to 0.330 m3/s) from the calculated discharge (Table 10). In addition
to measurement sites above Chester Springs (RM 18.4) and below Frank Springs (RM
17.5), discharge was measured below Chester Springs (RM 17.9) on 04/16/2007.
From the above Chester Springs site to the below Chester Springs site, the measured
discharge in Whychus Creek increased from 0.547 m3/s to 0.552 m3/s. This gives an

64
estimate of 0.005 m3/s discharge from Chester Springs. However, the estimated
discharge is much less than the calculated error of 0.047 m3/s, so the true discharge
from Chester Springs is uncertain. On the same date, discharge in Whychus Creek
from below Chester Springs to below Frank Springs increased from 0.552 m3/s to
0.734 m3/s, providing an estimated discharge of 0.182 m3/s from Frank Springs. The
associated error is 0.053 m3/s (29% uncertainty), which indicates the true discharge
from Frank Springs on 04/16/2007 was between 0.129 m3/s and 0.235 m3/s.

0.73
4
0.34
0
0.53
8
1.84
9
0.54
7
0.19
9
0.34
6
1.64
8
0.00
0.20
0.40
0.60
0.80
1.00
1.20
1.40
1.60
1.80
2.00
17.2
517
.50
17.7
518
.00
18.2
518
.50
Riv
er M
ile
Discharge (m3/s)
04/1
6/20
07
06/2
5/20
07
09/2
1/20
07
01/3
0/20
08
Wh
ych
us
Cre
ekab
ove
Ch
este
r sp
rin
gsW
hych
us
Cre
ekbe
low
Fra
nk s
pri
ngs
F
igu
re 1
8. M
easu
red
dis
char
ge in
Why
chu
s C
reek
alo
ng R
each
2 (
abov
e C
hes
ter
spri
ngs
to
bel
ow F
ran
k sp
ring
s). E
rror
bar
s ar
e p
rovi
ded
for
ea
ch m
easu
rem
ent.
65

Table 10. Measured discharge along Reach 2 of Whychus Creek.
Date
Dischargebelow Frank
springs
(m3/s)
Dischargeabove Chester
springs
(m3/s)
CalculatedGain
(m3/s)% Variability
((error/gain)*100)
MinimumGain
(m3/s)
MaximumGain
(m3/s)
4/16/2007 0.734 ± 0.041 0.547 ± 0.033 0.187 28 0.134 0.2406/25/2007 0.340 ± 0.040 0.199 ± 0.034 0.141 37 0.089 0.1939/21/2007 0.538 ± 0.050 0.346 ± 0.042 0.192 34 0.127 0.2571/30/2008 1.849 ± 0.098 1.648 ± 0.089 0.201 66 0.069 0.333
Groundwater Level Measurements
66
Automated groundwater level measurements were collected at the Lamb Well
on McKinney Butte (DESC 54659, site location on Figure 2) from 01/11/2007 to
10/31/2007. Data were collected at 2-hour intervals from 01/11/2007 to 10/31/2007
(Figure 19), and at 15-minute and 2-hour intervals from 09/10/2007 to 10/31/2007
(Figure 20). Manual water level measurements were collected periodically between
11/15/2006 and 03/06/2008. Water level elevations fluctuate seasonally with the
highest elevations occurring in winter and spring, and the lowest levels in summer and
fall. The total amount of fluctuation during the continuous data collection period was
1.50 m; water level elevations ranged from 941.27 m above mean sea level (msl) on
01/11/2007 to 939.77 m above msl on 10/05/2007. The highest manually measured
water level elevation was 941.70 m above msl on 03/06/2008 (Figure 19). From April
2007 to October 2007 water levels in the well fluctuated diurnally by approximately
0.3 m (Figure 19). These diurnal fluctuations are more readily seen on Figure 21, a
plot showing water levels in the Lamb Well during July 2007. The maximum daily
water level typically occurred between 16:00 and 20:00 and the daily minimum
occurred at 06:00 (Figure 21). Diurnal fluctuations of this magnitude coincide with the

67
local irrigation season and were not observed before April 2007 or after October 2007
(Figure 19).
A comparison of water level trends in the Lamb Well with accumulated
precipitation at the Three Creeks Meadow SNOTEL site is presented in Figure 22. The
location of Three Creeks Meadow relative to Sisters and the Lamb Well is shown in
Figure 3. Water level trends in the Lamb Well appear to be influenced, at least during
some parts of the year, by precipitation. Water levels in the well rise during times of
higher precipitation and fall during periods of lower precipitation (Figure 22).
Water levels trends in the Lamb Well are also very similar to discharge trends
in Whychus Creek. Figure 23 is a plot of daily mean discharge at the OWRD gage in
Sisters and water level elevations in the Lamb Well. Peaks in discharge appear to
coincide with water level peaks.

939.
5
940.
0
940.
5
941.
0
941.
5
942.
0 10/2
006
01/2
007
04/2
007
07/2
007
10/2
007
01/2
008
04/2
008
Water Level Elevation (m above mean sea level)2
Hou
r T
rans
duce
r D
ata
Man
ual M
easu
rem
ents
Fig
ure
19.
Au
tom
ated
gro
un
dw
ater
ele
vati
ons
reco
rded
eve
ry 2
hou
rs in
th
e L
amb
Wel
l (D
ES
C 5
4659
). D
ata
coll
ecti
on p
erio
d r
ange
d fr
om
01/1
1/20
07 t
o 10
/31/
2007
. Man
ual
wat
er le
vels
wer
e co
llec
ted
per
iod
ical
ly b
etw
een
11/
15/2
006
and
03/
06/2
008.
68

939.
5
939.
6
939.
7
939.
8
939.
9
940.
0
940.
1
940.
2
940.
3
940.
4
940.
5
09/1
0/20
0709
/20/
2007
09/3
0/20
0710
/10/
2007
10/2
0/20
0710
/30/
2007
Water Level Elevation (m above mean sea level)
15 M
inut
e T
rans
duce
r D
ata
Man
ual M
easu
rem
ents
Fig
ure
20.
Au
tom
ated
gro
un
dw
ater
ele
vati
ons
reco
rded
eve
ry 1
5 m
inut
es in
th
e L
amb
Wel
l (D
ES
C 5
4659
). D
ata
coll
ecti
on p
erio
d r
ange
d f
rom
09
/10/
2007
to
10/3
1/20
07. M
anu
al w
ater
leve
ls w
ere
coll
ecte
d p
erio
dic
ally
du
rin
g th
is p
erio
d.
69

940.
00
940.
05
940.
10
940.
15
940.
20
940.
25
940.
30
940.
35
940.
40 07/0
1/20
0707
/06/
2007
07/1
1/20
0707
/16/
2007
07/2
1/20
0707
/26/
2007
07/3
1/20
07
Water Level above mean sea level (m)
F
igu
re 2
1. W
ater
leve
l ele
vati
ons
reco
rded
eve
ry 2
hou
rs in
th
e L
amb
Wel
l (D
ES
C 5
4659
) d
uri
ng
July
200
7. W
ater
leve
ls f
luct
uat
e d
iurn
ally
by
app
roxi
mat
ely
0.3
m. M
axim
um
wat
er le
vel e
leva
tion
s oc
cur
bet
wee
n 16
:00
and
20:0
0, a
nd
min
imu
m e
leva
tion
s oc
cur
at 0
6:00
.
70

939.
5
940.
0
940.
5
941.
0
941.
5
942.
0 10/2
006
01/2
007
04/2
007
07/2
007
10/2
007
01/2
008
04/2
008
Water Level Elevation (m above mean sea level)
050100
150
200
250
Accumulated Precipitation (cm)
2 H
our
Tra
nsd
uce
r D
ata
Man
ual
Mea
sure
men
ts
Acc
um
ula
ted
Dai
ly P
reci
pit
atio
n
Fig
ure
22.
Acc
um
ula
ted
pre
cip
itat
ion
at
Th
ree
Cre
eks
Mea
dow
SN
OT
EL
sit
e an
d w
ater
leve
l ele
vati
ons
at t
he
Lam
b W
ell.
Wat
er le
vels
in t
he
wel
l ap
pea
r to
ris
e d
uri
ng
per
iods
of
hig
her
pre
cip
itat
ion
.
71

939.
5
940.
0
940.
5
941.
0
941.
5
942.
0 01/2
007
03/2
007
05/2
0
Water Level Elevation (m above mean sea level)
0707
/200
709
/200
711
/200
7
024681012
Whychus Creek Discharge (m3/s)
2 H
our
Tra
nsd
uce
r D
ata
Man
ual
Mea
sure
men
ts
Wh
ych
us
Cre
ek M
ean
Dai
ly D
isch
arge
F
igu
re 2
3. W
ater
leve
l ele
vati
ons
in t
he
Lam
b W
ell (
DE
SC
546
59)
and
mea
n d
aily
dis
char
ge a
t th
e O
WR
D G
age
in S
iste
rs. W
ater
leve
l an
d
dis
char
ge t
ren
ds
are
sim
ilar
.
72

73
Hydrographs
Figure 25 is a plot of water levels in the Lamb Well (DESC 54659) and the
two state observation wells nearest to McKinney Butte. DESC 3016, located west of
McKinney Butte, is 70 m deep and is completed in Quaternary lavas of the Cascades
Range, while DESC 2929 is 59 m deep and is completed in the Deschutes Formation.
Well locations are shown on Figure 24. Long-term water level trends for these wells
show fluctuations in response to decadal climate cycles (Figure 25). The magnitude of
the response is greater in DESC 3016 because it is closer to the regional recharge area,
but historically, both wells responded to climatic cycles almost concurrently.
However, DESC 2929 has not responded to the current period of higher precipitation
that began in 2006, while the water level in DESC 3016 has risen almost 3 m (Figure
25). The period of record in the Lamb Well is not long enough to determine if it is
following decadal climate cycles.

F
igu
re 2
4. L
ocat
ion
s of
sel
ecte
d w
ells
wit
h lo
ng-t
erm
wat
er le
vel d
ata.
DE
SC 3
016
is lo
cate
d w
est
of M
cKin
ney
Bu
tte
and
DE
SC
292
9 is
loca
ted
ea
st.
74
900
910
920
930
940
950
960 19
7219
82
Water Level Elevation (m)
1992
2002
2012
DE
SC
546
59 (
Lam
b W
ell)
DE
SC
292
9 (E
ast)
DE
SC
301
6 (W
est)
F
igu
re 2
5. L
ong
term
wat
er le
vel r
ecor
ds
for
two
OW
RD
Sta
te O
bse
rvat
ion
Wel
ls in
th
e vi
cin
ity
of M
cKin
ney
Bu
tte.
Th
e L
amb
Wel
l is
also
sho
wn
. W
ater
leve
ls in
bot
h S
tate
Ob
serv
atio
n W
ells
hav
e h
isto
rica
lly
resp
ond
ed t
o d
ecad
al c
limat
e cy
cles
. How
ever
, DE
SC
292
9 ha
s no
t re
spon
ded
to
the
mos
t re
cen
t p
erio
d o
f in
crea
sed
pre
cip
itat
ion
th
at b
egan
in 2
006,
wh
ile t
he
wat
er le
vel i
n D
ES
C 3
016
has
ris
en b
y ab
out
3 m
.
75

76
Water Level Contour Mapping
Separate sets of water-level elevation contours were generated for the shallow
(Figure 26) and deep (Figure 27) parts of groundwater flow system in the study area.
Water level elevation contours in the shallow part of the system to the west of
McKinney Butte are more widely spaced than contours east of the butte, indicating
that the horizontal groundwater gradient increases across the butte (Figure 26). The
same can be said for contours in the deep part of the system; however, the gradient
west of McKinney Butte is extremely small (approximately 4 m/km) while the
gradient east of the butte is exceptionally large (approximately 60m/km) (Figure 27).
Vertical gradients between the shallow and deep parts of the system are highest in the
western part of the study area (60 m difference) and decrease to about 15 m on the east
edge of McKinney Butte.

F
igu
re 2
6. W
ater
leve
l ele
vati
on c
onto
ur
map
for
th
e sh
allo
w p
art
of t
he
grou
nd
wat
er f
low
sys
tem
in t
he
stu
dy a
rea.
Wel
l log
-id
and
mea
n w
ater
le
vel e
leva
tion
s ar
e sh
own
for
wel
ls u
sed
to
gen
erat
e th
e m
ap. T
he
elev
atio
ns
of s
pri
ngs
that
dis
char
ge s
hal
low
gro
und
wat
er a
re a
lso
show
n.
Con
tou
r in
terv
als
are
15 m
. Fau
lts
(wh
ite
lines
) ar
e d
ashe
d w
her
e ap
pro
xim
atel
y lo
cate
d a
nd
dot
ted
wh
ere
con
ceal
ed, b
all a
nd
bar
are
on
th
e d
own
thro
wn
sid
e. F
ault
loca
tion
s ar
e fr
om S
her
rod
et
al. (
2004
) an
d W
ellik
(20
08).
Th
e gr
oun
dw
ater
leve
l gra
die
nt
on t
he
east
sid
e of
McK
inn
ey
Bu
tte
is s
teep
er t
han
on
th
e w
est
sid
e.
77

Fig
ure
27.
Wat
er le
vel e
leva
tion
con
tou
r m
ap f
or t
he
dee
p p
art
of t
he
grou
nd
wat
er f
low
sys
tem
in t
he
stu
dy
area
. Wel
l log
-id
an
d m
ean
wat
er le
vel
elev
atio
ns
are
show
n f
or w
ells
use
d t
o ge
ner
ate
the
map
. Th
e el
evat
ion
s of
sp
ring
s th
at d
isch
arge
reg
iona
l gro
un
dwat
er a
re a
lso
show
n. C
onto
ur
inte
rval
s ar
e 15
m. F
ault
s (w
hit
e li
nes
) ar
e d
ash
ed w
her
e ap
pro
xim
atel
y lo
cate
d a
nd
dot
ted
wh
ere
con
ceal
ed, b
all a
nd
bar
are
on
th
e d
ownt
hrow
n
sid
e. F
ault
loca
tion
s ar
e fr
om S
her
rod
et
al. (
2004
) an
d W
elli
k (
2008
). T
he
grou
nd
wat
er le
vel g
rad
ien
t on
th
e w
est
sid
e of
McK
inn
ey B
utt
e is
ex
trem
ely
flat
, wh
ile
the
grad
ien
t on
th
e ea
st s
ide
exce
pti
onal
ly s
teep
.
78

79
Chapter 5 – Chemical Hydrogeology
The geochemistry of groundwater and surface water sources in and around the
study area are described in this section. Results from analysis of field parameters and
common ions are presented first, followed by stable isotopes and temperature. Data
from previous studies are presented for comparison purposes.
Results
General Chemistry
A total of 52 samples were collected from study area springs and streams.
Thirty-one samples were collected from Whychus and Indian Ford creeks, and 21
samples were collected from the McKinney Butte Springs, the Camp Polk Springs,
Paulina Spring, Alder Springs, and Metolius Spring. Site location information and
field parameters (temperature, pH, and electrical conductivity) are presented in Table
11; major-element chemistry and stable isotope data are listed in Table 12. Charge
balance errors (CBEs) were calculated using Visual Minteq and ranged from -18.04 to
to 8.39% (Table 11). The majority of samples (43 of 52) had CBEs < 10%, and only
three samples had CBEs > 15%. PO4 was detected in many samples, however,
measured concentrations were typically below the minimum reporting limit;
consequently, PO4 concentrations were excluded from further analysis. The reader is
referred to Appendix B for a discussion of the determination of the minimum reporting
limit.

80
Several graphs, designed to display similarities and differences among
samples, are presented later in this section. In order to reduce clutter and promote
clarity, in some instances Whychus Creek samples from sites upstream from any
spring inputs were plotted as one group called "Whychus Creek above the McKinney
Butte Springs". Sites included in this group are Whychus Creek at Sisters Gage,
Whychus Creek at Reed Ditch, and Whychus Creek above Chester Springs. Similarly,
samples from sites downstream from the McKinney Butte Springs were plotted as the
group "Whychus Creek below the McKinney Butte Springs". Sites in this group are
Whychus Creek below Frank Springs, Whychus Creek at Camp Polk Rd, and
Whychus Creek at DRC Gage. Samples from all sites on Indian Ford Creek were
grouped together and plotted as "Indian Ford Creek".
Water samples have traditionally been classified on the basis of dominant
cationic and anionic species (Hem, 1985). Waters in which more than 50 percent of
cations (expressed in milliequivalents per liter (meq/L)) are Mg, Na + K, or Ca are
described as Mg, Na or Ca waters, respectively. Similarly, waters in which more than
50 percent of anions are SO4, Cl, or CO3 + HCO3 are described as SO4, Cl, or HCO3
waters. If no ionic species comprises more than 50 percent of the total cationic or
anionic concentration, the water is classified as mixed-type. Thirty-four of the fifty-
two samples analyzed during this study are mixed cation-bicarbonate water. Sixteen
samples are sodium-bicarbonate water and two samples are magnesium-bicarbonate
water. Bicarbonate is the dominant anionic species in all samples, commonly
comprising up to 90% of total anion concentration (Figure 28).

Table 11. Location information and summary of field parameters collected sampling locations during the current study and previous studies. Blank records indicate the parameter was not measured.
Latitude Longitude Name Elev.(m)
Date(mo/d/yr)
Temp.(°C)
pH Cond.(μS/cm)
Whychus Creek44.288010 -121.543908 at Sisters Gage 963 09/22/2006 4.9 6.96
11/16/2006 2.3 6.76 20.404/07/2007 10.8 7.24 27.106/25/2007 6.1 6.54 14.009/21/2007 5.2 6.86 18.001/24/2008 0.0 7.49 18.0
44.287522 -121.514296 at Reed Ditch 945 09/22/2006 9.3 6.55
44.295307 -121.507243 above Chester Springs 932 04/07/2007 8.3 7.07 27.7932 06/25/2007 7.7 6.86 16.0
09/21/2007 5.5 6.81 19.001/24/2008 0.0 6.93 15.0
44.307020 -121.510378 below Frank Springs 925 11/16/2006 3.9 6.35 29.504/07/2007 8.5 7.13 35.806/25/2007 9.9 7.43 38.009/21/2007 7.8 7.43 33.001/24/2008 0.9 28.0
44.318463 -121.515250 at Camp Polk Rd. 908 11/16/2006 3.1 6.59 25.004/07/2007 9.5 7.15 36.906/25/2007 15.2 8.37 37.009/21/2007 10.1 7.96 33.001/24/2008 0.0 7.38 28.0
44.325805 -121.502531 at DRC Gage 895 09/22/2006 10.7 8.0006/25/2007 16.6 8.17 37.009/21/2007 12.1 8.03 33.001/24/2008 0.0 7.29 28.0
Indian Ford Creek44.320296 -121.538357 at Camp Polk Rd. 960 09/22/2006 10.3 6.86
11/16/2006 3.6 6.71 65.504/07/2007 13.2 7.24 55.401/22/2008 0.1 6.36 44.0
44.303556 -121.528976 at Barclay Dr. 956 11/16/2006 3.9 7.00 67.0
44.356582 -121.615107 at Hwy. 20 987 06/25/2007 12.9 7.59 34.0
81

82
Table 11. – Continued. Location information and summary of field parameters collected at sampling locations during the current study and previous studies. Blank records indicate the parameter was not measured.
Latitude Longitude Name Elev.(m)
Date(mo/d/yr)
Temp.(°C)
pH Cond.(μS/cm)
McKinney Butte Springs44.299501 -121.509843 Chester 930 11/16/2006 8.9 6.80 115.7
04/07/2007 11.0 7.46 106.306/25/2007 9.9 7.43 72.009/21/2007 9.6 6.93 65.001/24/2008 8.9 7.12 65.0
44.303469 -121.510194 Frank 929 11/16/2006 8.4 6.96 111.004/07/2007 9.6 7.43 103.906/25/2007 8.9 7.12 61.008/29/2007 8.9 7.07 63.009/21/2007 8.9 6.99 63.001/24/2008 8.9 62.0
Camp Polk Springs44.314701 -121.514641 Anderson 921* 09/22/2006 7.9 7.24
44.316128 -121.514667 Anderson at Whychus Creek 914* 09/22/2006 8.6 6.80
44.318916 -121.517512 Camp Polk Springhouse 924* 11/16/2006 8.6 6.26 125.004/07/2007 10.2 108.006/25/2007 9.2 7.53 66.009/21/2007 9.3 6.62 86.001/24/2008 9.0 6.70 74.0
Other Springs44.367103 -121.668697 Paulina 1024 08/29/2007 4.3 6.80 30.0
44.441551 -121.346522 Alder 695 09/20/2007 10.5 7.80 67.0
44.434348 -121.638067 Metolius 914 01/23/2008 8.9 7.70 63.0Previous Studies
44.441551 -121.346522 Alder Springs (Caldwell, 1998) 695 01/19/1995 10.5 8.00 136.0
44.491111 -121.296944 Lower Opal Springs (Caldwell, 1998) 597 01/09/1995 12.0 8.10 128.0
44.367103 -121.668697 Paulina Spring (Caldwell, 1998) 1024 01/11/1995 4.5 7.20 60.0Paulina Spring (Ingebritsen, 1988) 07/26/1987 30.0
44.434348 -121.638067 Metolius Spring (Evans, 2004) 914 08/05/2002 8.7 7.71 124.0Metolius Spring (Ingebritsen, 1988) 09/27/1986
Metolius Spring (James, 1999) 10/18/1997 8.3 7.60 120.211/01/1997 8.1 7.60 119.505/30/1998 8.3 7.50 119.506/25/1998 8.2 7.40 120.6
*Elevation of sampled location. Orifice elevations are 945 m for Anderson Springs and 942 m for Camp Polk Springhouse.

Tab
le 1
2. W
ater
Ch
emis
try
dat
a fo
r sa
mp
les
anal
yzed
du
rin
g th
e cu
rren
t st
ud
y an
d p
revi
ous
stu
die
s. M
ajor
ion
an
d s
ilica
con
cen
trat
ion
s ar
e re
por
ted
in m
g/L
. δ18
O a
nd
δ2 H
val
ues
are
in s
tand
ard
‰ n
otat
ion
. Maj
or io
n a
nd s
ilic
a er
rors
are
< 1
5% u
nle
ss o
ther
wis
e in
dic
ated
, δ18
O a
nd δ
2 H
erro
rs a
re ±
0.1‰
an
d ±
1.0‰
, res
pec
tive
ly. B
lan
k r
ecor
ds
ind
icat
e th
e p
aram
eter
was
not
mea
sure
d. A
com
ple
te t
reat
men
t of
err
ors
and
u
nce
rtai
nti
es a
ssoc
iate
d w
ith
th
e d
eter
min
atio
n o
f m
ajor
ion
con
cen
trat
ion
s is
pre
sen
ted
in A
pp
end
ix B
.
Nam
eD
ate
(mo/
d/y
r)C
alci
um
(Ca)
Mag
nes
ium
(Mg)
Sod
uim
(Na)
Pot
assi
um
(K)
Bic
ar-
bon
ate
(HC
O3)
Ch
lori
de
(Cl)
Su
lfat
e(S
O4)
Flu
orid
e(F
)N
itra
te(N
O3)
Sil
ica
(SiO
2)
CB
E(%
)δ18
Oδ2 H
Wh
ych
us
Cre
ekat
Sis
ters
Gag
e09
/22/
2006
1.12
0.52
1.84
0.62
11.9
0.29
0.50
0.07
nd28
.37
-5.5
3-1
4.2
-112
.011
/16/
2006
0.86
0.42
1.23
0.51
9.2
0.34
0.31
0.06
nd21
.05
8.28
04/0
7/20
070.
810.
602.
140.
5812
.20.
320.
360.
06nd
-5.2
606
/25/
2007
0.72
0.55
*1.
780.
6013
.20.
430.
440.
05*
nd-1
6.00
09/2
1/20
070.
660.
652.
280.
5913
.00.
330.
470.
060.
35-9
.12
-14.
6-1
05.1
01/2
4/20
081.
10**
0.13
*2.
620.
7111
.30.
390.
480.
07nd
-2.9
9
at R
eed
Dit
ch09
/22/
2006
1.22
0.68
1.91
0.69
14.0
0.36
0.55
0.07
#34
.85
-7.9
4-1
4.7
-100
.0
abov
e C
hest
er S
prin
gs04
/07/
2007
0.79
0.62
2.45
0.54
12.8
0.31
0.36
0.04
nd-3
.95
-14.
7-1
03.0
06/2
5/20
070.
770.
551.
780.
5112
.70.
270.
850.
05*
nd-1
5.11
-14.
4-1
04.0
09/2
1/20
070.
720.
852.
330.
6113
.40.
350.
600.
06nd
-4.7
801
/24/
2008
1.18
**0.
22*
2.72
0.72
11.9
0.44
0.54
0.07
nd-1
.98
-14.
7-1
06.1
belo
w F
rank
Spr
ings
11/1
6/20
061.
070.
731.
590.
6512
.30.
410.
380.
050.
1124
.85
-6.1
704
/07/
2007
0.99
1.07
3.04
0.65
16.9
0.39
0.45
0.05
0.04
-2.4
506
/25/
2007
1.48
2.63
4.08
1.30
33.4
0.85
1.03
0.09
0.20
-9.0
9-1
4.5
-105
.109
/21/
2007
1.18
2.21
3.85
0.96
28.6
0.73
0.81
0.08
0.25
-8.6
5-1
4.7
-105
.501
/24/
2008
1.61
*0.
563.
490.
9120
.40.
660.
650.
08#
-10.
59
at C
amp
Pol
k R
d.11
/16/
2006
0.95
0.58
1.42
0.59
12.1
0.36
0.34
0.05
0.15
21.7
8-1
2.37
04/0
7/20
071.
061.
193.
110.
6518
.50.
480.
470.
05nd
-4.1
9-1
4.5
-105
.006
/25/
2007
1.52
2.70
4.16
1.10
34.0
0.91
0.96
0.08
nd-9
.02
-14.
3-1
03.9
09/2
1/20
071.
132.
113.
960.
9928
.80.
740.
770.
08nd
-9.1
201
/24/
2008
1.83
*0.
774.
051.
0122
.10.
890.
760.
080.
22**
*-7
.08
at D
RC
Gag
e09
/22/
2006
1.65
1.85
2.96
1.10
21.6
0.76
0.82
0.08
0.04
39.4
0-0
.76
-15.
0-1
05.0
06/2
5/20
071.
472.
674.
181.
0633
.60.
900.
950.
08nd
-8.9
409
/21/
2007
1.04
2.16
4.00
1.01
28.9
0.81
0.76
0.08
0.12
*-9
.42
-14.
5-1
05.5
01/2
4/20
081.
88*
0.75
4.11
1.01
22.1
0.91
0.77
0.08
0.25
***
-6.7
5
*err
or >
15%
, *
*err
or >
30%
, *
**er
ror
>50
%,
# =
val
ue <
min
imum
rep
ortin
g lim
it,
nd =
not
det
ecte
d ^
Nitr
ate
conc
entr
atio
ns r
epor
ted
as m
g/L
NO
3-N
hav
e be
en c
onve
rted
to m
g/L
NO
3
83

Tab
le 1
2.–C
onti
nu
ed. W
ater
Ch
emis
try
dat
a fo
r sa
mp
les
anal
yzed
du
rin
g th
e cu
rren
t st
ud
y an
d p
revi
ous
stu
die
s. M
ajor
ion
an
d s
ilica
co
nce
ntr
atio
ns
are
rep
orte
d in
mg/
L. δ
18O
and
δ2 H
val
ues
are
in s
tan
dar
d ‰
not
atio
n. M
ajor
ion
an
d s
ilica
err
ors
are
< 1
5% u
nle
ss o
ther
wis
e in
dic
ated
, δ18
O a
nd
δ2 H
err
ors
are
±0.1
‰ a
nd
±1.
0‰, r
esp
ecti
vely
. Bla
nk
rec
ord
s in
dic
ate
the
par
amet
er w
as n
ot m
easu
red
. A c
omp
lete
tre
atm
ent
of e
rror
s an
d u
nce
rtai
nti
es a
ssoc
iate
d w
ith
th
e d
eter
min
atio
n o
f m
ajor
ion
con
cen
trat
ion
s is
pre
sen
ted
in A
pp
end
ix B
.
Nam
eD
ate
(mo/
d/y
r)C
alci
um
(Ca)
Mag
nes
ium
(Mg)
Sod
uim
(Na)
Pot
assi
um
(K)
Bic
ar-
bon
ate
(HC
O3)
Ch
lori
de
(Cl)
Su
lfat
e(S
O4)
Flu
orid
e(F
)N
itra
te(N
O3)
Sil
ica
(SiO
2)
CB
E(%
)δ18
Oδ2 H
Ind
ian
For
d C
reek
at C
amp
Pol
k R
d.09
/22/
2006
3.00
2.76
3.65
0.72
31.1
0.46
0.06
0.11
0.04
*41
.40
2.18
-11.
7-8
6.0
11/1
6/20
062.
191.
993.
343.
3732
.62.
060.
470.
080.
0535
.18
-9.2
504
/07/
2007
1.90
2.35
4.54
0.94
31.2
0.56
0.15
0.07
0.18
-2.6
0-1
2.7
-95.
001
/22/
2008
3.02
*1.
414.
531.
6432
.31.
900.
830.
08nd
-8.9
0-1
3.5
-95.
2
at B
arcl
ay D
r.11
/16/
2006
2.23
2.02
3.42
3.71
32.8
2.26
0.50
0.09
nd31
.85
8.39
at H
wy.
20
06/2
5/20
071.
902.
123.
920.
5232
.90.
190.
120.
08nd
-9.8
0-1
2.8
-92.
9M
cKin
ney
Bu
tte
Sp
rin
gsC
hest
er11
/16/
2006
2.50
4.04
5.82
2.14
50.0
1.96
1.19
0.13
1.26
45.9
7-9
.59
04/0
7/20
072.
245.
548.
471.
7060
.91.
991.
230.
131.
13-6
.05
-14.
3-1
04.0
06/2
5/20
072.
015.
337.
881.
7159
.31.
731.
180.
121.
02-7
.19
09/2
1/20
071.
714.
928.
061.
8056
.01.
771.
130.
110.
83-6
.54
01/2
4/20
082.
92*
2.79
7.96
1.94
52.6
1.75
1.20
0.13
1.18
*-1
1.06
Fran
k11
/16/
2006
2.56
3.82
5.56
2.09
48.3
1.81
1.12
0.13
1.29
45.0
8-9
.61
-14.
3-1
06.1
04/0
7/20
072.
235.
037.
751.
6556
.31.
801.
210.
111.
28-6
.32
-14.
2-1
08.0
06/2
5/20
072.
094.
977.
191.
7755
.41.
541.
130.
111.
13-6
.86
-14.
2-1
06.5
08/2
9/20
071.
984.
867.
341.
7856
.01.
591.
130.
111.
13-7
.86
-14.
2-1
05.9
09/2
1/20
071.
724.
947.
991.
7855
.21.
561.
140.
111.
12-5
.92
-14.
2-1
06.4
01/2
4/20
083.
02*
2.67
7.37
1.89
50.4
1.59
1.11
0.12
1.13
*-1
0.84
-14.
3-1
06.7
Cam
p P
olk
Sp
rin
gsA
nder
son
09/2
2/20
063.
853.
684.
311.
4738
.41.
130.
850.
110.
7637
.97
1.62
-13.
2-9
5.0
And
erso
n at
Why
chus
Cre
ek09
/22/
2006
3.95
4.04
4.42
1.98
37.3
1.95
0.90
0.13
0.35
39.6
25.
10
Cam
p P
olk
Spr
ingh
ouse
11/1
6/20
064.
274.
245.
061.
4942
.45.
411.
780.
123.
0625
.97
-6.8
404
/07/
2007
3.13
5.28
6.86
1.19
50.5
4.93
1.74
0.12
2.59
-6.7
1-1
3.1
-102
.006
/25/
2007
3.12
5.64
6.61
1.25
54.9
4.32
1.79
0.12
2.64
-8.2
8-1
2.8
-94.
709
/21/
2007
3.55
7.54
7.42
1.42
56.1
5.24
2.90
0.11
4.42
-2.0
5-1
2.8
-95.
401
/24/
2008
4.95
*3.
516.
871.
4348
.25.
593.
010.
123.
97-1
0.78
-12.
6-9
5.1
*err
or >
15%
, *
*err
or >
30%
, *
**er
ror
>50
%,
# =
val
ue <
min
imum
rep
ortin
g lim
it,
nd =
not
det
ecte
d ^
Nitr
ate
conc
entr
atio
ns r
epor
ted
as m
g/L
NO
3-N
hav
e be
en c
onve
rted
to m
g/L
NO
3
84

Tab
le 1
2.–C
onti
nu
ed. W
ater
Ch
emis
try
dat
a fo
r sa
mp
les
anal
yzed
du
rin
g th
e cu
rren
t st
ud
y an
d p
revi
ous
stu
die
s. M
ajor
ion
an
d s
ilica
co
nce
ntr
atio
ns
are
rep
orte
d in
mg/
L. δ
18O
and
δ2 H
val
ues
are
in s
tan
dar
d ‰
not
atio
n. M
ajor
ion
an
d s
ilica
err
ors
are
< 1
5% u
nle
ss o
ther
wis
e in
dic
ated
, δ18
O a
nd
δ2 H
err
ors
are
±0.1
‰ a
nd
±1.
0‰, r
esp
ecti
vely
. Bla
nk
rec
ord
s in
dic
ate
the
par
amet
er w
as n
ot m
easu
red
. A c
omp
lete
tre
atm
ent
of e
rror
s an
d u
nce
rtai
nti
es a
ssoc
iate
d w
ith
th
e d
eter
min
atio
n o
f m
ajor
ion
con
cen
trat
ion
s is
pre
sen
ted
in A
pp
end
ix B
.
Nam
eD
ate
(mo/
d/y
r)C
alci
um
(Ca)
Mag
nes
ium
(Mg)
Sod
uim
(Na)
Pot
assi
um
(K)
Bic
ar-
bon
ate
(HC
O3)
Ch
lori
de
(Cl)
Su
lfat
e(S
O4)
Flu
orid
e(F
)N
itra
te(N
O3)
Sil
ica
(SiO
2)
CB
E(%
)δ18
Oδ2 H
Oth
er S
pri
ngs
Pau
lina
08/2
9/20
071.
351.
473.
730.
9327
.40.
240.
100.
03**
0.14
-10.
46-1
3.1
-94.
1
Ald
er09
/20/
2007
1.86
5.12
9.22
1.90
62.0
1.62
1.40
0.10
1.27
-7.3
9-1
5.0
-111
.1
Met
oliu
s01
/23/
2008
2.71
*2.
818.
111.
8255
.81.
630.
620.
117.
59-1
8.04
-14.
7-1
10.0
Pre
viou
s S
tud
ies
Ald
er S
prin
gs (
Cal
dwel
l, 19
98)
01/1
9/19
95
7.30
6.10
11.0
02.
2065
.01.
901.
40<
0.1
1.20
^39
.00
-14.
8-1
11.0
Low
er O
pal S
prin
gs (
Cal
dwel
l, 19
98)
01/0
9/19
95
6.00
5.80
12.0
02.
1063
.01.
600.
900.
100.
93^
38.0
0-1
5.3
-114
.0
Pau
lina
Spr
ing
(Cal
dwel
l, 19
98)
01/1
1/19
95
4.70
2.00
4.30
1.00
29.0
0.50
0.30
<0.
10.
27^
29.0
0-1
2.8
-92.
1P
auli
na S
prin
g (I
ngeb
rits
en, 1
988)
07/2
6/19
87
3.90
0.40
Met
oliu
s S
prin
g (E
vans
, 200
4)08
/05/
2002
6.
196.
9810
.40
2.00
75.0
1.66
0.82
0.10
<0.
005
44.3
0-1
4.5
-107
.0M
etol
ius
Spr
ing
(Ing
ebri
tsen
, 198
8)09
/27/
1986
9.
201.
60-1
4.8
-108
.0M
etol
ius
Spr
ing
(Jam
es, 1
999)
10/1
8/19
97
48.0
-14.
6-1
08.0
11/0
1/19
97
62.0
-14.
6-1
07.0
05/3
0/19
98
-14.
8-1
09.0
06/2
5/19
98
64.0
-14.
6-1
07.0
Met
oliu
s S
prin
g (C
hitw
ood,
199
9)05
/17/
1996
0.
97^
06/2
7/19
96
0.44
^08
/15/
1996
0.
49^
09/1
8/19
96
0.49
^10
/29/
1996
0.
58^
01/2
2/19
97
1.15
^03
/13/
1997
0.
80^
05/0
2/19
97
3.36
^
*err
or >
15%
, *
*err
or >
30%
, *
**er
ror
>50
%,
# =
val
ue <
min
imum
rep
ortin
g lim
it,
nd =
not
det
ecte
d,
^ N
itrat
e co
ncen
trat
ions
rep
orte
d as
mg/
L N
O3-
N h
ave
been
con
vert
ed to
mg/
L N
O3
85

100
100
0
0
80
80
20
100
80
100
80
100 020
20
80
0
100
80
20
0
100
20
800
100
2080
0
20
0
20
Cal
ciu
mC
alci
um
Mag
ne
Mag
nes
Mix
edM
ixed
cati
onca
tion
siu
miu
m
Sod
ium
Sod
ium
--M
ixed
Mix
ed--
anio
nan
ion
Sulf
ate
Sulf
ate
Bic
arb
onat
eB
icar
bon
ate
Ch
lori
de
Ch
lori
de
100
100
0
0
80
80
20
100
80
100
80
100 020
20
80
0
100
80
20
0
100
20
800
100
2080
0
20
0
20
Cal
ciu
mC
alci
um
Mag
ne
Mag
nes
Mix
edM
ixed
cati
onca
tion
siu
miu
m
Sod
ium
Sod
ium
--M
ixed
Mix
ed--
anio
nan
ion
Sulf
ate
Sulf
ate
Bic
arb
onat
eB
icar
bon
ate
Ch
lori
de
Ch
lori
de
F
igu
re 2
8. P
iper
dia
gram
for
all
sp
rin
g an
d s
trea
m s
amp
lin
g lo
cati
ons.
Wat
er s
ampl
es a
re c
lass
ifie
d o
n t
he
basi
s of
dom
inan
t ca
tion
ic a
nd
anio
nic
sp
ecie
s. M
ost
sam
ple
s p
lot
as m
ixed
cat
ion
– b
icar
bon
ate
wat
ers,
bu
t se
vera
l sam
ple
s ar
e m
agn
esiu
m –
bic
arb
onat
e or
sod
ium
– b
icar
bona
te
wat
ers.
86

In general, ionic concentrations were higher in spring samples (average total
ionic concentration = 72.5 mg/L) than in stream samples (average total ionic
concentration = 29.5 mg/L) (Table 13). Paulina Spring was the exception; its total
ionic concentration of 35.4 mg/L was similar to average concentrations in Whychus
(25.9 mg/L) and Indian Ford (44.07 mg/L) creeks. Samples from Whychus Creek
above the McKinney Butte Springs had a lower average ion concentration (17.4 mg/L)
than samples below the McKinney Butte Springs (32.7 mg/L). Similar total ionic
concentrations were found in Chester Springs (76.3 mg/L), Frank Springs (73.4 mg/L),
Camp Polk Springhouse (78.2 mg/L), Alder Springs (84.5 mg/L), and Metolius Spring
(81.2 mg/L). The average total ionic concentration in Anderson Springs (54.8 mg/L)
was higher than stream samples but lower than all spring samples except Paulina
Spring.
Table 13. Total ionic concentration for various site types (mg/L).
Sample Type AverageStandardDeviation
Number ofSamples
All Streams 29.4 12.0 31All Springs 72.5 12.1 21Whychus Creek all samples 25.9 10.6 25Whychus Creek above McKinney Butte Springs 17.4 1.7 11Whychus Creek below McKinney Butte Springs 32.7 9.7 14Indian Ford Creek 44.1 2.5 6Chester Springs 76.3 5.7 5Frank Springs 73.4 4.3 6Anderson Springs 54.8 0.3 2Camp Polk Springhouse 78.2 7.5 5Paulina Spring 35.4 1Alder Springs 84.5 1Metolius Spring 81.2 1
87
88
Although the general geochemical characteristics of streams and springs
analyzed during this study are quite similar (all samples were classified as mixed
cation- , sodium- , or magnesium- bicarbonate waters), distinct differences emerge
when individual ions and ion ratios are compared. Schoeller and simple variation
diagrams aided in discerning differences between samples. Schoeller diagrams,
consisting of ionic concentrations (expressed in milliequivalents per liter) plotted on a
logarithmic scale allowed comparison of multiple ionic species from multiple samples
on one chart. Differences identified on Schoeller diagrams were then more closely
examined on variation diagrams.
Concentrations of Ca, Mg, Na, Cl, SO4, and HCO3 for all samples are
displayed on a Schoeller diagram in Figure 29. Ca, Na and HCO3 concentrations plot
in a relatively narrow range – less than one order of magnitude separates minimum
and maximum concentrations (Camax/Camin = 7.4, Namax/Namin = 7.5,
HCO3max/HCO3min = 6.7) – while Mg, Cl, and SO4 have a wider range of
concentrations (Mgmax/Mg min = 58.0, Clmax/Clmin = 28.9, SO4max/SO4min = 50.8). Also
noticeable on Figure 29 are concentration differences among spring samples,
especially between Cl and SO4. These concentration differences are more easily seen
when average concentrations for each spring are plotted (Figure 30). Concentrations
are lowest in Paulina Spring. High Cl and SO4 concentrations in Camp Polk
Springhouse distinguish it from the McKinney Butte Springs, Alder Springs, and
Metolius Spring, which all have similar concentrations of Cl and SO4. The low Mg
concentration in Metolius Spring (0.234 meq/L) is comparable to Mg concentrations

89
in Chester Springs (0.232 meq/L), and Frank Springs (0.225 meq/L) sampled during
the same time of year (January 2008).
Differences in concentrations of Cl, NO3, and SO4, are seen more easily on the
following variation diagrams: Cl vs NO3 (Figure 31), Cl vs SO4 (Figure 32), and Cl vs
Na (Figure 33). Data for samples from Metolius Spring, Paulina Spring, Alder Spring,
and Lower Opal Spring collected during previous studies are shown for comparison.
Field parameters for samples collected during previous studies are presented in Table
11 and major element chemistry and stable isotope data are shown in Table 12.
The most obvious observations are the elevated Cl concentrations in Camp
Polk Springhouse (Figures 31, 32, and 33), and the high concentration of NO3 in the
Metolius Spring sample from the current study (Figure 31). The Metolius Spring
sample from Evans et al. (2004) contains < 0.005 mg/L NO3. Concentrations of SO4
and NO3 in Camp Polk Springhouse are also elevated relative to other springs and
streams (with the exception of NO3 in Metolius Spring) (Figures 31 and 32) NO3
concentrations in samples from Whychus and Indian Ford creeks were typically very
low, and several samples from both creeks did not contain measureable NO3. Camp
Polk Springhouse displays a chloride "shift" in Figure 33, where Na concentrations in
Camp Polk Springhouse are similar to concentrations in the McKinney Butte Springs
and are slightly lower than concentrations in Metolius Spring, Alder Springs and
Lower Opal Springs, but Cl concentrations in Camp Polk Springhouse are
considerably larger than concentrations in any of the other springs.

Cal
ciu
mM
agn
esiu
mS
odiu
mC
hlo
ride
Su
lfat
eB
icar
bon
ate
milliequivalents per liter
Wh
ych
us
Cre
ek a
bov
e M
cKin
ney
Bu
tte
Sp
ring
sW
hyc
hu
s C
reek
bel
ow M
cKin
ney
Bu
tte
Sp
rin
gsIn
dian
For
d C
reek
Ch
este
r S
pri
ngs
Fra
nk
Spr
ings
An
der
son
Sp
rin
gsC
amp
Pol
k S
pri
ngh
ouse
Pau
lin
a S
pri
ng
Ald
er S
pri
ngs
Met
oliu
s S
pri
ng
0.00
1
0.010.
1110
F
igu
re 2
9. I
onic
con
cen
trat
ion
s fo
r al
l sam
ple
s. S
amp
les
from
all
site
s on
Why
chus
Cre
ek a
bove
Ch
este
r S
pri
ngs
are
incl
ude
d in
th
e gr
oup
"
Why
chus
Cre
ek a
bov
e M
cKin
ney
Bu
tte
Sp
rin
gs"
, sam
ple
s fr
om a
ll si
tes
on W
hyc
hus
Cre
ek b
elow
Fra
nk
Sp
rin
gs c
omp
rise
th
e gr
oup
"W
hyc
hus
Cre
ek b
elow
McK
inn
ey B
utte
Sp
rin
gs"
, an
d s
amp
les
from
all
sit
es o
n I
nd
ian
For
d C
reek
for
m t
he
grou
p "
Ind
ian
For
d C
reek
."
90

Cal
cium
Mag
nes
ium
Sod
ium
Chl
orid
eSu
lfat
eB
icar
bona
te
milliequivalents per liter
Che
ster
Sp
ring
s, n
=5
Fra
nk
Sp
ring
s, n
=6
And
erso
n Sp
ring
s, n
=2
Cam
p P
olk
Spr
ingh
ouse
, n=
5
Pau
lin
a Sp
ring
, n=
1A
lder
Spr
ings
, n=
1
Met
oliu
s S
prin
g, n
=1
0.00
1
0.010.
1110
F
igu
re 3
0. A
vera
ge io
nic
con
cen
trat
ion
s fo
r sp
rin
gs s
amp
les,
n =
# o
f sa
mp
les.
Pau
lina
Sp
rin
g, A
lder
Sp
rin
gs, a
nd
Met
oliu
s S
pri
ng
wer
e on
ly
sam
ple
d o
nce
eac
h, b
ut
are
show
n f
or c
omp
aris
on.
91

0.0
1.0
2.0
3.0
4.0
5.0
6.0
7.0
8.0
0.0
1.0
2.0
3.0
4.0
5.0
6.0
Cl (
mg/
L)
NO3 (mg/L)
Why
chus
Cre
ek a
bove
the
McK
inne
y B
utte
Spr
ings
Why
chus
Cre
ek b
elow
the
McK
inne
y B
utte
Spr
ings
Indi
an F
ord
Cre
ekC
hest
er S
prin
gs
Fran
k S
prin
gsA
nder
son
Spr
ings
Cam
p P
olk
Spr
ingh
ouse
Pau
lina
Spr
ing
Ald
er S
prin
gsM
etol
ius
Spr
ing
Met
oliu
s S
prin
g (E
vans
et a
l., 2
004)
Pau
lina
Spr
ing
(Cal
dwel
l, 19
98)
Ald
er S
prin
gs (
Cal
dwel
l, 19
98)
Low
er O
pal S
prin
gs (
Cal
dwel
l, 19
98)
Fig
ure
31.
Plo
t of
Cl v
s N
O3.
Con
cen
trat
ion
s of
bot
h io
ns
are
elev
ated
in C
amp
Pol
k S
pri
ngh
ouse
rel
ativ
e to
oth
er s
pri
ngs
an
d s
trea
ms,
an
d t
he
NO
3 co
nce
ntr
atio
n in
th
e M
etol
ius
Sp
rin
g sa
mp
le f
rom
th
e cu
rren
t st
ud
y is
mu
ch g
reat
er t
han
in a
ny o
ther
sam
ple
. Th
e M
etol
ius
Sp
ring
sam
ple
fr
om E
van
s et
al.
(200
4) c
onta
ined
ver
y lit
tle
NO
3 as
did
Pau
lin
a S
pri
ng
sam
ple
s. S
ever
al s
amp
les
from
Wh
ych
us
and
In
dia
n F
ord
cre
eks
did
not
co
nta
in m
easu
reab
le a
mou
nts
of
NO
3.
92

0.0
1.0
2.0
3.0
4.0
0.0
1.0
2.0
3.0
4.0
5.0
6.0
Cl (
mg/
L)
SO4 (mg/L)
Why
chus
Cre
ek a
bove
the
McK
inne
y B
utte
Spr
ings
Why
chus
Cre
ek b
elow
the
McK
inne
y B
utte
Spr
ings
Indi
an F
ord
Cre
ekC
hest
er S
prin
gs
Fra
nk S
prin
gsA
nder
son
Spr
ings
Cam
p P
olk
Spr
ingh
ouse
Pau
lina
Spr
ing
Ald
er S
prin
gsM
etol
ius
Spr
ing
Met
oliu
s S
prin
g (E
vans
et a
l., 2
004)
Pau
lina
Spr
ing
(Cal
dwel
l, 19
98)
Ald
er S
prin
gs (
Cal
dwel
l, 19
98)
Low
er O
pal S
prin
gs (
Cal
dwel
l, 19
98)
Fig
ure
32.
Plo
t of
Cl v
s SO
4. C
once
ntr
atio
ns
of b
oth
ion
s ar
e el
evat
ed in
Cam
p P
olk
Sp
rin
ghou
se r
elat
ive
to o
ther
sam
ple
d s
prin
gs a
nd
stre
ams.
T
he
McK
inn
ey B
utte
Sp
ring
s an
d A
nd
erso
n S
pri
ngs
plo
t n
ear
Met
oliu
s S
pri
ng, A
lder
Sp
ring
s, a
nd
Low
er O
pal S
pri
ngs.
Cl a
nd
SO
4 co
nce
ntr
atio
ns
vary
th
e m
ost
in I
nd
ian
For
d C
reek
. Con
cen
trat
ion
s of
bot
h io
ns
in W
hyc
hu
s C
reek
incr
ease
dow
nst
ream
of
the
McK
inn
ey B
utt
e an
d C
amp
Pol
k S
pri
ngs
.
93

0.0
5.0
10.0
15.0
0.0
1.0
Na (mg/L)
2.0
3.0
4.0
5.0
6.0
Cl (
mg/
L)
Why
chus
Cre
ek a
bove
the
McK
inne
y B
utte
Spr
ings
Why
chus
Cre
ek b
elow
the
McK
inne
y B
utte
Spr
ings
Indi
an F
ord
Cre
ekC
hest
er S
prin
gsFr
ank
Spr
ings
And
erso
n S
prin
gsC
amp
Pol
k S
prin
ghou
seP
auli
na S
prin
gA
lder
Spr
ings
Met
oliu
s S
prin
gM
etol
ius
Spr
ing
(Eva
ns e
t al.,
200
4)M
etol
ius
Spr
ing
(Ing
ebri
tsen
, 198
8)Pa
ulin
a S
prin
g (C
aldw
ell,
1998
)P
auli
na S
prin
g (I
ngeb
rits
en, 1
988)
Low
er O
pal S
prin
gs (
Cal
dwel
l, 19
98)
F
igu
re 3
3. P
lot
of C
l vs
Na.
Sam
ple
s fr
om C
amp
Pol
k S
pri
ngh
ouse
(C
PS
H)
dis
pla
y a
Cl "
shif
t" w
her
e N
a co
nce
ntr
atio
ns
in C
PS
H a
re s
imila
r to
or
slig
htl
y lo
wer
th
an c
once
ntr
atio
ns
in o
ther
sam
ple
d s
pri
ngs
, bu
t C
l con
cen
trat
ion
s ar
e ex
trem
ely
elev
ated
. Na
con
cen
trat
ion
s in
th
e M
cKin
ney
Bu
tte
Sp
ring
s ar
e sl
igh
tly
hig
her
tha
n in
An
der
son
Sp
rin
gs, a
re s
imil
ar t
o th
e N
a co
nce
ntra
tion
in t
he
Met
oliu
s S
pri
ng s
amp
le f
rom
th
e cu
rren
t st
udy
, are
low
er t
han
con
cen
trat
ion
s in
Ald
er S
pri
ngs
from
th
e cu
rren
t an
d p
revi
ous
stu
die
s, a
nd a
re lo
wer
tha
n c
once
ntr
atio
ns
in M
etol
ius
Sp
rin
g an
d L
ower
Op
al S
pri
ngs
fro
m o
ther
stu
dies
.
Ald
er S
prin
gs (
Cal
dwel
l, 19
98)
94

95
Stable Isotopes
A total of 31 samples (12 from Whychus Creek, 4 from Indian Ford Creek, 7
from the McKinney Butte Springs (6 from Frank Springs and 1 from Chester Springs),
5 from the Camp Polk Springs (4 from Camp Polk Springhouse and 1 Anderson
Springs), and one each from Paulina Spring, Alder Springs, and Metolius Spring) were
analyzed for 2H and 18O concentrations and are reported as delta values (‰) relative to
Vienna Standard Mean Ocean Water (VSMOW) (Table 12). Samples plot on a line
given by δ2H = 6.3 δ18O – 14.0, which has a lower slope than the Global Meteoric
Water Line (GMWL) defined as δ2H = δ18O + 10 by Craig (1961) (Figure 34).
However, several samples plot above the GMWL. The measured isotopic variation in
all samples ranges from -86.0 to -112.0‰ and -11.7 to -15.0‰ for δ2H and δ18O,
respectively. Indian Ford Creek, Paulina Spring, and the Camp Polk Springs are
isotopically enriched relative to Whychus Creek, the McKinney Butte Springs, Alder
Springs, and Metolius Spring. δ2H and δ18O delta values ranged from -86.0 to -95.0‰
and -11.7 to -13.5‰ in Indian Ford Creek, and from -94.7 to -102.0‰ and -12.6 to -
13.2‰ in the Camp Polk Springs. Ratios in Paulina Spring were -13.1‰ for δ18O and
-94.1‰ for δ2H. δ2H and δ18O delta values ranged from -112.0 to -100.0‰ and -14.2
to -15.0‰ in Whychus Creek, and -104.0 to -108.0‰ and -14.2 to -14.3‰ in the
McKinney Butte Springs. Alder Springs and Metolius Spring were most depleted in
δ2H and δ18O with delta values of -15.0‰ and -111.1‰ in Alder Springs and -14.7‰
and -110.0‰ in Metolius Spring for δ2H and δ18O, respectively.

96
Isotopic concentrations from previous studies by Ingebritsen et al. (1988),
Caldwell (1998), and James (1999) are shown in Figure 35. Local Meteoric Water
Lines (LMWLs) for each study are also shown. LMWLs for Ingebritsen (1988) and
James (1999) have lower slopes than the GMWL and are similar to the LMWL from
the current study, while samples from Caldwell (1998) plot on a line with the same
slope as the GMWL (Figure 35).
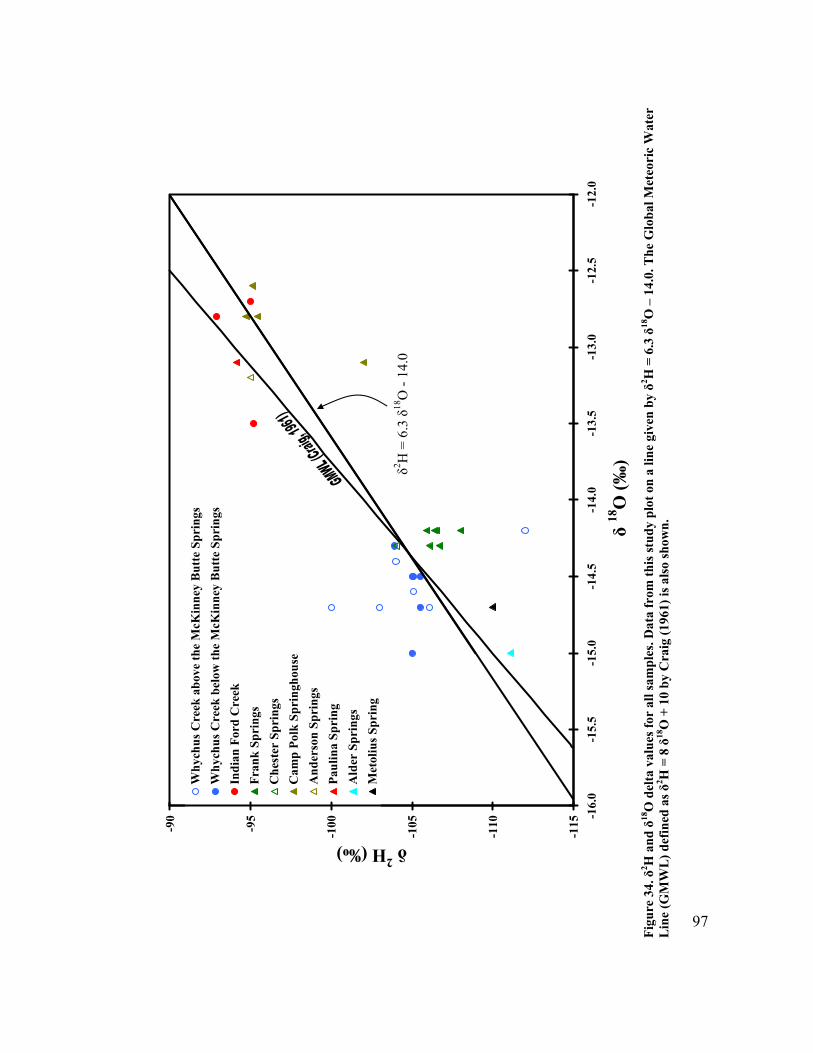
δ2 H =
6.3
δ18
O -
14.
0
-115
-110
-105
-100-9
5
-90 -1
6.0
-15.
5-1
5.0
-14.
5-1
4.0
-13.
5-1
3.0
-12.
5-1
2.0
δ 18
O (
‰)
δ 2H (‰)
Wh
ych
us
Cre
ek a
bov
e th
e M
cKin
ney
Bu
tte
Sp
rin
gs
Wh
ych
us
Cre
ek b
elow
th
e M
cKin
ney
Bu
tte
Sp
rin
gs
Ind
ian
For
d C
reek
Fra
nk
Sp
rin
gs
Ch
este
r S
pri
ngs
Cam
p P
olk
Sp
rin
ghou
se
An
der
son
Sp
rin
gs
Pau
lin
a S
pri
ng
Ald
er S
pri
ngs
Met
oliu
s S
pri
ng
Fig
ure
34.
δ2 H
an
d δ
18O
del
ta v
alu
es f
or a
ll sa
mp
les.
Dat
a fr
om t
his
stu
dy p
lot
on a
lin
e gi
ven
by δ2 H
= 6
.3 δ
18O
– 1
4.0.
Th
e G
lob
al M
eteo
ric
Wat
er
Lin
e (G
MW
L)
def
ined
as δ2 H
= 8
δ18
O +
10
by
Cra
ig (
1961
) is
als
o sh
own
.
97

Inge
brit
sen
et a
l. (1
988)
:
δ2 H =
5.1
δ18
O -
33.
1
Cal
dwel
l (19
98):
δ 2 H
= 8
.0 δ
18O
+ 4
.5
Jam
es (
1999
):
δ2 H =
5.5
δ18
O -
28.
2
Thi
s S
tudy
:
δ2 H =
6.3
δ18
-134
-126
-118
-110
-102-9
4
-86
-78
-70
-62 -1
8.0
-17.
0-1
6.0
δ 2H (‰)
O -
14.
0
-15.
0-1
4.0
-13.
0-1
2.0
-11.
0-1
0.0
-9.0
δ 18
O (
‰)
Thi
s S
tudy
Inge
brit
sen
et a
l. (1
988)
Cal
dwel
l (19
98)
Jam
es (
1999
)
F
igu
re 3
5. δ
2 H a
nd
δ18
O d
elta
val
ues
for
sam
ple
s fr
om p
revi
ous
stu
die
s. S
amp
les
from
th
e cu
rren
t st
ud
y ar
e sh
own
for
com
pari
son
. GM
WL
an
d
LM
WL
s fo
r ea
ch s
tud
y ar
e al
so s
how
n. L
MW
L s
lop
es a
re s
imil
ar f
or a
ll s
tud
ies
and
are
gen
eral
ly le
ss t
han
the
GM
WL
slo
pe, w
ith
th
e ex
cep
tion
of
Cal
dw
ell (
1998
), w
hic
h h
as t
he
sam
e sl
ope
as t
he
GM
WL
.
98

99
Temperature
Temperature data collected every 10 minutes from several locations in
Whychus Creek and in the McKinney Butte Springs from 08/30/2007 to 10/15/2007
along with measurements collected at study area streams and springs during water
sampling events are presented below. Temperature data collected every two hours in
the Lamb Well (DESC 54659) from 01/11/2007 to 10/31/2007 are also presented.
Temperature variations are generally larger in creeks than in springs. Standard
deviation from mean values range from 3.7 to 7.0 °C in Whychus and Indian Ford
creeks and from 0.4 to 0.9 °C in the McKinney Butte and Camp Polk springs (Table
14). Of the springs, the lowest temperature was measured in Paulina Spring (4.3 °C)
and the highest was measured in Alder Springs (10.5 °C). Chester Springs has a higher
mean temperature and a larger standard deviation (9.7 °C, σ = 0.9 °C) than the other
springs on McKinney Butte; the mean temperature and standard deviation in Frank
Springs and Camp Polk Springhouse are 8.9 °C, σ = 0.4 °C and 9.3 °C, σ = 0.6 °C,
respectively. The temperature in both Metolius Spring and Frank Springs in January
2008 was 8.9 °C.
Temperature measurements collected every 10 minutes from 08/30/2007 to
10/15/2007 above Chester Springs and below Frank Springs on Whychus Creek, and
in Frank Springs and Chester Springs are shown along with daily minimum and
maximum air temperatures recorded in Sisters in Figure 36. The temperature variation
at any location in Whychus Creek generally follows that of the local air temperature,

100
exhibiting diurnal fluctuations related to daily high and low air temperatures, although
variation in the creek is not as pronounced as air temperature differences (Figure 36).
The magnitude of temperature fluctuations in Whychus Creek below Frank Springs
site is less than those above Chester Springs (Figure 36).
Water temperatures recorded in the Lamb Well (DESC 54659) are displayed
with temperatures from McKinney Butte Springs in Figure 37. Average temperatures
in Frank and Chester springs during the period of continuous monitoring was 9.04 °C
(σ = 0.04 °C) and 9.42 °C (σ = 0.15 °C), respectively. The average temperature in the
Lamb Well during same period was 9.20 °C (σ = 0.01 °C). Temperatures in the well
are similar to, but more stable than, temperatures in the springs. The “angular”
appearance of the temperature data for the McKinney Butte Springs shown in Figure
37 is an artifact of the resolution limits (0.15 °C) of the temperature probes used in the
springs.

Tab
le 1
4. T
emp
erat
ure
mea
sure
men
ts (
°C)
colle
cted
du
rin
g w
ater
sam
pli
ng
even
ts f
or s
tudy
are
a st
ream
s an
d s
pri
ngs
. Ave
rage
mon
thly
te
mp
erat
ure
s in
th
e L
amb
Wel
l (D
ESC
546
59)
are
also
incl
uded
. S
epte
mb
er20
06N
ovem
ber
2006
Ap
ril
2007
Jun
e20
07A
ugu
st20
07S
epte
mb
er20
07Ja
nu
ary
2008
Min
Max
Mea
nS
tan
dar
dD
evia
tion
Wh
ych
us
Cre
ekat
Sis
ters
Gag
e4.
92.
310
.86.
15.
20.
00.
010
.84.
93.
7ab
ove
Che
ster
Spr
ings
8.3
7.7
5.5
0.0
0.0
8.3
5.4
3.8
belo
w F
rank
Spr
ings
3.9
8.5
9.9
7.8
0.9
0.9
9.9
6.2
3.7
at C
amp
Pol
k R
d.3.
19.
515
.210
.10.
00.
015
.27.
66.
0at
DR
C G
age
10.7
16.6
12.1
0.0
0.0
16.6
9.9
7.0
Ind
ian
For
d C
reek
at C
amp
Pol
k R
d.10
.33.
613
.20.
10.
113
.26.
86.
0at
Bar
clay
Dr.
3.9
3.9
at H
wy.
20
12.9
12.9
McK
inn
ey B
utt
e S
pri
ngs
Che
ster
Spr
ings
8.9
11.0
9.9
9.6
8.9
8.9
11.0
9.7
0.9
Fran
k S
prin
gs8.
49.
68.
98.
98.
98.
98.
49.
68.
90.
4C
amp
Pol
k S
pri
ngs
Cam
p P
olk
Spr
ingh
ouse
8.6
10.2
9.2
9.3
9.0
8.6
10.2
9.3
0.6
And
erso
n S
prin
gs7.
97.
9O
ther
Sp
rin
gsP
auli
na S
prin
g4.
34.
3M
etol
ius
Spr
ing
8.9
8.9
Ald
er S
prin
gs10
.510
.5L
amb
Wel
l
Lam
b W
ell (
DE
SC
546
59)
9.2*
9.2*
9.2*
9.2*
9.2
†0.
02†
*Ave
rage
mon
thly
tem
pera
ture
cal
cula
ted
from
tem
pera
ture
pro
be r
eadi
ngs
reco
rded
on
2 ho
ur in
terv
als.
† Mea
n an
d st
anda
rd d
evia
tion
for
the
enti
re p
erio
d of
rec
ord
(01/
11/2
007
– 10
/31/
2007
).
101

-8-404812162024283236 08/3
0/07
09/0
4/07
09/0
9/07
09/1
4/07
09/1
9/07
09/2
4/07
09/2
9/07
10/0
4/07
10/0
9/07
10/1
4/07
Temperature (oC)
Wh
ych
us
Cre
ek a
bov
e C
hes
ter
Sp
rin
gsW
hyc
hu
s C
reek
bel
ow F
ran
k S
pri
ngs
Fra
nk
Sp
rin
gsC
hes
ter
Sp
rin
gs
Sis
ters
air
tem
per
atu
re
Fig
ure
36.
Tem
per
atu
re m
easu
rem
ents
in W
hyc
hu
s C
reek
an
d t
he
McK
inn
ey B
utt
e S
pri
ngs
fro
m 0
8/30
/200
7 to
10/
15/2
007.
Tem
per
atu
re in
W
hyc
hu
s C
reek
gen
eral
ly f
ollo
ws
loca
l air
tem
per
atu
res.
Th
e co
nst
ant
tem
per
atu
re in
the
McK
inn
ey B
utt
e S
pri
ngs
att
enua
tes
tem
pera
ture
fl
uct
uati
ons
in W
hych
us
Cre
ek b
elow
th
e sp
rin
gs.
102
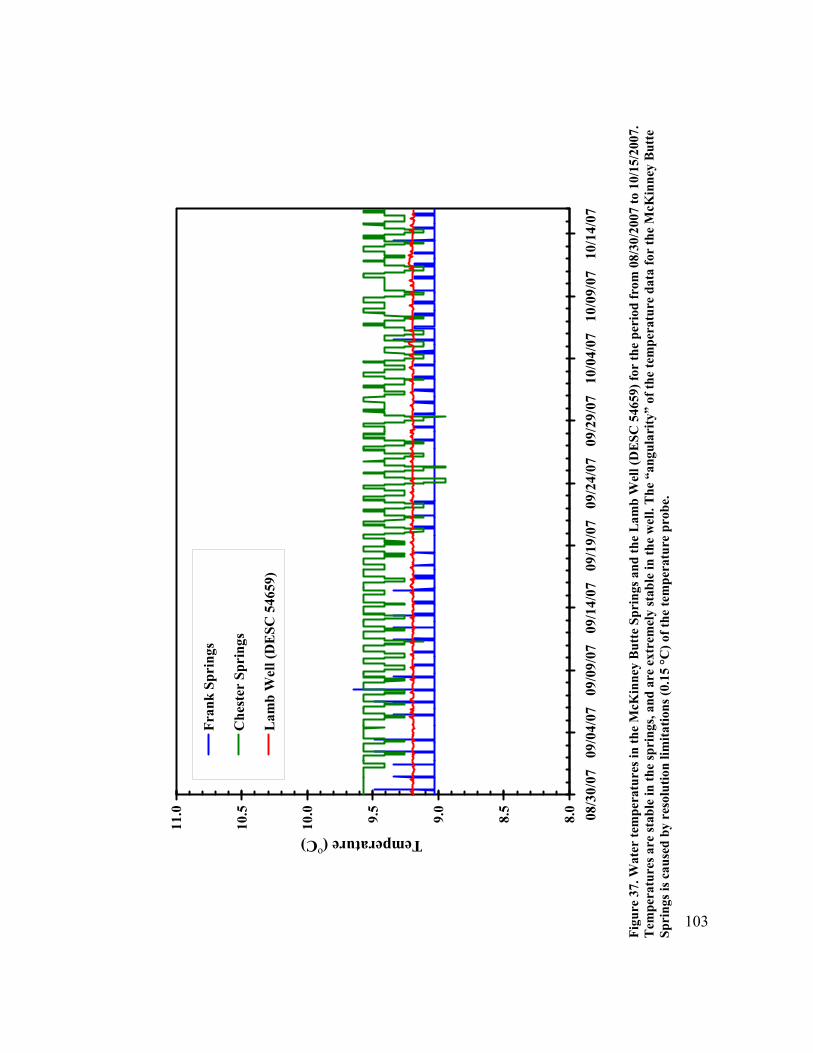
8.0
8.5
9.0
9.5
10.0
10.5
11.0 08
/30/
0709
/04/
0709
/09/
07
Temperature (oC)
09/1
4/07
09/1
9/07
09/2
4/07
09/2
9/07
10/0
4/07
10/0
9/07
10/1
4/07
Fra
nk
Sp
rin
gs
Ch
este
r S
pri
ngs
Lam
b W
ell (
DE
SC
546
59)
F
igu
re 3
7. W
ater
tem
per
atu
res
in t
he
McK
inn
ey B
utt
e S
pri
ngs
an
d t
he L
amb
Wel
l (D
ES
C 5
4659
) fo
r th
e p
erio
d f
rom
08/
30/2
007
to 1
0/15
/200
7.
Tem
per
atu
res
are
stab
le in
th
e sp
rin
gs, a
nd a
re e
xtre
mel
y st
able
in t
he
wel
l. T
he
“ang
ula
rity
” of
th
e te
mp
erat
ure
dat
a fo
r th
e M
cKin
ney
But
te
Sp
rin
gs is
cau
sed
by
reso
luti
on li
mit
atio
ns
(0.1
5 °C
) of
th
e te
mp
erat
ure
pro
be.
103

104
Chapter 6 – Discussion
Camp Polk Springs Discharge
The Camp Polk Springs are located in Reach 3 of Whychus Creek as described
in Chapter 4 (Figure 13, locations shown on Figure 2). Measured discharge along
Reach 3 increased on 04/16/2007, 06/25/2007, and 01/30/2008, and decreased on
09/21/2007 (Figure 16). However, the gains and losses were less than calculated errors
and therefore may not represent actual gains or losses. Despite measurement
uncertainties, discharge from the Camp Polk Springs provides a logical explanation
for increases in discharge along reach 3 during late spring, early summer, and winter.
As will be shown in the following sections, the Camp Polk Springs discharge shallow,
local-scale groundwater. Springs that are supplied by shallow groundwater tend to
have greater seasonal fluctuations in discharge than those that discharge groundwater
that has circulated deeper in the flow system. Expected discharge from the Camp Polk
Springs would be larger during times of greater recharge (late fall and winter due to
precipitation, and spring and early summer due to snowmelt) and would be lower
during times of less recharge (late summer).
McKinney Butte Springs Discharge
Estimates of discharge from the McKinney Butte Springs presented in the
Physical Hydrogeology chapter (Chapter 4) were determined via seepage runs on
Whychus Creek. One limitation of estimating discharge from springs using seepage

runs is that the differences measured at higher stream flow conditions represent a
significantly smaller percentage of total flow and, hence, are subject to greater error.
For example, on 01/30/2008, stream discharges of 1.648 m3/s and 1.849 m3/s were
measured at Whychus Creek above Chester Springs and at Whychus Creek below
Frank Springs, respectively. Propagation of the calculated errors (0.089 and 0.091
m3/s; Table 10) results in an error of 0.132 m3/s for a total difference (calculated
discharge from springs) of 0.201 m3/s (i.e., 66% uncertainty).
In an attempt to better constrain discharge estimates for the McKinney Butte
Springs, two simple mixing models, one using electrical conductivity (EC) and one
using temperature data from Whychus Creek and the McKinney Butte Springs were
employed. The models assume that EC and temperature contributions to Whychus
Creek from the McKinney Butte Springs are proportional to the discharge
contribution. Also assumed is that EC and temperature measured in Frank Springs is
representative of the entire McKinney Butte Springs complex. Equation 1 was used to
calculate the fraction of EC in Whychus Creek provided by the McKinney Butte
Springs:
)(
)(
ACMS
ACBFMS ECEC
ECECfEC
−−= (1)
where fECMS is the fraction of the EC measured in Whychus Creek that was provided
by the McKinney Butte Springs, ECBF and ECAC are the EC values in Whychus Creek
below Frank Springs and above Chester Springs (µS/cm), and ECMS is the EC
105
measured in the McKinney Butte Springs (µS/cm). Equation 2 was used to estimate
the discharge of the McKinney Butte Springs:
WCBFMSMS QfECQ ∗= (2)
where QMS is McKinney Butte Springs discharge (m3/s) and QWCBF is the measured
discharge at the Whychus Creek below Frank Springs seepage run site (m3/s).
Equation 2 requires discharge measured during seepage runs and EC measured during
water sampling events; consequently, McKinney Butte Springs discharge estimates
from EC data were only calculated when seepage runs and water sampling events
occurred concurrently (i.e., 06/25/2007 and 09/21/2007). Estimated discharges from
the McKinney Butte Springs determined by the EC mixing model were 0.166 m3/s on
06/25/2007 and 0.171 m3/s on 09/21/2007 (Table 15).
Uncertainty in the estimates of discharge from the McKinney Butte Springs via
the EC mixing model result from two primary sources; 1) error in the measurement of
QWCBF, and 2) error in measurements of ECBF, ECAC, and ECMS. Errors associated with
QWCBF measurements, previously discussed in the Study Design and Methods chapter
and presented in the Results section of the Physical Hydrogeology chapter, were 0.04
m3/s on 06/25/2007, and 0.05 m3/s on 09/21/2007 (Table 15).
Uncertainty in EC measurements can be attributed to accuracy of the EC
meter. The accuracy of the EC meter used in this study was the greater value between
±0.5% of the reading or ±1 µS/cm (YSI, 2002). The amount of error assigned to the
EC meter in m3/s was determined by solving for fECMS in equation 1 using values of
ECBF, ECAC, and ECMS that were 1 µS/cm greater than or less than the measured
106

values. Minimum values for fECMS were calculated when an ECBF value 1 µS/cm less
than the measured value, and ECMS and ECAC values 1 µS/cm greater than their
measured values were substituted into equation 1. Maximum values for fECMS were
calculated when ECBF was 1 µS/cm greater than its measured value, and ECMS, and
ECAC, were 1 µS/cm less than their measured values. Minimum and maximum values
of fECMS were substituted into equation 2 to solve for QMS. Minimum and maximum
values of QMS were 0.151 and 0.177 m3/s on 06/25/2007, and 0.154 and 0.187 m3/s on
09/21/2007. The percent error attributed to the accuracy of the EC meter was 9% on
06/25/2007 and 10% on 09/21/2007. The total uncertainty associated with estimating
QMS via the EC mixing model was calculated using equation 3, where ETEC is the total
error, in m3/s, eqbf is the calculated discharge error at the measurement site below
Frank Springs, in m3/s, and eec is the error in discharge attributed to the accuracy of
the EC meter, in m3/s (Table 15).
22ecqbfTEC eeE +=
(3)
Table 15. Estimates of Discharge from the McKinney Butte Springs. ECAC and ECBF are electrical conductivities measured in Whychus Creek above Chester Springs and below Frank Springs. ECMS is the electrical conductivity measured in Frank Springs and represents electrical conductivity in the McKinney Butte Springs complex. fECMS is the fraction of EC in Whychus Creek provided by the McKinney Butte Springs as calculated in equation 1; and QWCBF is the discharge in Whychus Creek below Frank Springs measured during seepage runs. QMS is the estimated discharge from the McKinney Butte Springs calculated from electrical conductivity data using equation 2.
Date
ECAC
(µS/cm)measured
ECBF
(µS/cm)measured
ECMS
(µS/cm)measured fECMS
QWCBF
(m3/s) measured
QMS
(m3/s)calculated
eqbf
(m3/s)
eec
(m3/s)
ETEC
(m3/s)
06/25/2007 16 38 61 0.489 0.34 0.166 0.04 0.015 0.04309/21/2007 19 33 63 0.318 0.54 0.171 0.05 0.017 0.053
107

108
The temperature mixing model utilized temperature probe measurements
collected every 10 minutes from 08/30/2007 to 10/15/2007 as another means of
constraining estimates of discharge from the McKinney Butte Springs. Unlike the EC
model which used instantaneous measurements of discharge and EC to estimate
discharge from the McKinney Butte Springs, the temperature model used mean daily
discharge in Whychus Creek recorded at the OWRD Gage Station in Sisters (QSISTERS),
mean daily temperatures from Whychus Creek above Chester Springs (TAC) and
Whychus Creek below Frank Springs (TBF), and the mean temperature during the
continuous data collection period in the McKinney Butte Springs (TMS) to estimate the
average discharge from the McKinney Butte Springs during the continuous data
collection period (QMS). A major assumption in this model is that no significant gains
or losses in streamflow occur between the gage in Sisters and the McKinney Butte
Springs. As described in the Results section of the Chapter 4, while streamflow losses
were measured between Sisters and the springs during each seepage run, the measured
losses were within the margin of measurement error and may not represent actual
losses.
The temperature model also differs from the EC model in that the equations
used in the temperature model were not solved for QMS. Instead, specified values of
QMS ranging from 0.10 to 0.20 m3/s (i.e. 0.10, 0.15, 0.17, 0.18, 0.185, 0.187, 0.19, and
0.20 m3/s) were used to solve equations 4 and 5 for the fractions of total streamflow in
Whychus Creek below the McKinney Butte Springs (QTOTAL) supplied by discharge
from Whychus Creek above the McKinney Butte Springs (fQSISTERS) and by discharge

from the McKinney Butte Springs (fQMS), where QTOTAL is the sum of QSISTERS and
QMS. fQSISTERS and fQMS were then used to solve equation 6 for TBF. The predicted
values of TBF calculated in equation 6 were compared to the observed values of TBF
measured by the temperature probe. Mean daily temperatures for TAC and TBF
calculated from temperature probe readings were used in equation 6 because discharge
readings at the OWRD Gage Station in Sisters were only available in that form. The
average temperature of Frank Springs (9.04 ºC) during the continuous data collection
period was used for TMS in equation 6 because its standard deviation (σ = 0.04 °C) was
less than the accuracy of the temperature probes (±0.2 °C).
TOTAL
SISTERSSISTERS Q
QfQ = (4)
TOTAL
MSMS Q
QfQ = (5)
)*()*( MSMSSISTERSACBF fQTfQTT += (6)
Predicted values of TBF for given estimates of QMS are compared graphically
with measured TBF values in Figure 38. An estimated discharge of 0.10 m3/s from the
springs under- or over-estimates TBF; this is dependent on TAC. A discharge of 0.20
m3/s fits the observed data better, but so do several other values (only 0.185 m3/s is
shown, but 0.17, 0.18, and 0.187 m3/s all plot similarly). To quantify the goodness of
fit between the predicted and observed values of TBF, the sum of the squares of the
differences between the observed and predicted values of TBF were calculated using
equation 7.
109

2)(1 )( )( iBFpredct
n
i iBFobs TTSS −= = (7)
Where, SS is the sum of squares, n is the number of sample observations, TBFobs(i) is the
observed mean daily temperature at Whychus Creek below Frank Springs, and
TBFpredict(i) is the predicted mean daily temperature at Whychus Creek below Frank
Springs. The SS values determined from equation 7 are presented in Table 16. A
constant spring discharge of 0.185 m3/s produces predicted temperatures with the
lowest SS value (0.614) which indicates it is the best fit to the observed data, and is
likely a reasonable estimate of discharge from 08/30/2007 to 10/15/2007.
Uncertainty in estimates of discharge from the McKinney Butte Springs
through the use of the temperature mixing model probably stem from 1) error in
discharge measurements recorded at OWRD Gage Station in Sisters, and 2) the
assumption that gains and losses between the gage in Sisters and the McKinney Butte
Springs are minimal. Discharge measurements from the OWRD Gage Station in
Sisters that were used in this study were considered “final” and were published by
OWRD. The error associated with final data is generally no greater than 10% of the
recorded discharge. The uncertainty associated with the assumption that no gains or
losses in streamflow occur between Sisters and the McKinney Butte Springs is not as
easily quantified. Losses of approximately 0.05 m3/s in streamflow between Sisters
and the McKinney Butte Springs were measured during seepage runs on 06/25/2007,
09/21/2007, and 01/30/2008, and had associated errors of 0.05, 0.06, and 0.13 m3/s,
respectively. Although the uncertainties are as large as or larger than the measured
losses, an assumed loss of 0.05 m3/s was used to account for the potential loss in
110

111
streamflow. The median streamflow recorded at the Sisters Gage during the
continuous data collection period (08/30/2007 to 10/15/2007) was 0.39 m3/s. The
assumed loss was divided by the median streamflow to approximate the uncertainty.
The approximate uncertainty due to loss of streamflow between Sisters and the
McKinney Butte Springs during the continuous data collection period was 13%. The
total error associated with estimation of QMS through the use of the temperature mixing
model was calculated using equation 8 where ETT is the total error, in percent, esisters is
the error in discharge measurements recorded at the OWRD Gage Station in Sisters, in
percent, and eloss is the uncertainty due to potential loss in streamflow between Sisters
and the McKinney Butte Springs, in percent.
22losssistersTT eeE += (8)
Table 16. Sum of Squares (SS) of differences between observed and predicted temperature values at Whychus Creek below Frank Springs for selected estimates of discharge from the McKinney Butte Springs (QMS). A discharge of 0.185 m3/s is the best fit to the data, and represents the estimated discharge from the McKinney Butte Springs for the period between 08/30/2007 and 10/15/2007.
QMS
(m3/s) SS0.100 7.0580.150 1.5030.170 0.7620.180 0.6280.185 0.6140.187 0.6180.190 0.6330.200 0.761

345678910111213141516 08/2
9/20
0709
/05/
2007
09/1
2/20
0709
/19/
2007
09/2
6/20
0710
/03/
2007
10/1
0/20
0710
/17/
2007
Temperature below Frank Springs (oC)
ME
AS
UR
ED
PR
ED
ICT
ED
(0.
10)
PR
ED
ICT
ED
(0.
185)
PR
ED
ICT
ED
(0.
20)
Fig
ure
38.
Mea
sure
d a
nd
pre
dic
ted
tem
per
atur
e va
lues
at
Wh
ych
us
Cre
ek b
elow
Fra
nk
sp
rin
gs. B
lue
and
red
ser
ies
are
pre
dic
ted
tem
per
atu
re
valu
es c
alcu
late
d fr
om lo
w (
0.10
m3 /s
) an
d h
igh
(0.2
0 m
3 /s)
esti
mat
es o
f d
isch
arge
fro
m t
he
McK
inn
ey B
utt
e Sp
rin
gs. T
eal s
erie
s (0
.185
m3 /s
) is
th
e b
est
fit
(low
est
SS)
to
the
obse
rved
dat
a.
112

113
Discharge from the McKinney Butte Springs was estimated using the
following three methods: 1) measurements of discharge in Whychus Creek above and
below the springs (seepage runs), 2) electrical conductivity measurements in the
springs and at sites on Whychus Creek above and below the springs, and 3) continuous
temperature monitoring of the springs and locations in Whychus Creek above and
below the springs. Uncertainty associated with each method was quite large and
ranged from 28% to 66% for seepage runs, 26% to 31% for electrical conductivity,
and 16% for temperature. However, estimates of discharge using all three methods on
09/21/2007 fell in a narrow range from 0.171 m3/s (electrical conductivity), to 0.192
m3/s (seepage runs) (Table 17, Figure 39). The agreement of discharge values
calculated through the use of independent techniques suggests that although the
uncertainty associated with each method is relatively large, when examined
collectively, these methods provide a focused range of potential discharge from the
McKinney Butte Springs. Based on discharge estimates presented in Table 17 and
Figure 39, low (0.10 m3/s), mean (0.20 m3/s), and high (0.30 m3/s) estimates of
discharge from the McKinney Butte Springs are used in the following section to
examine the seasonal variability in their contribution to flow in Whychus Creek.
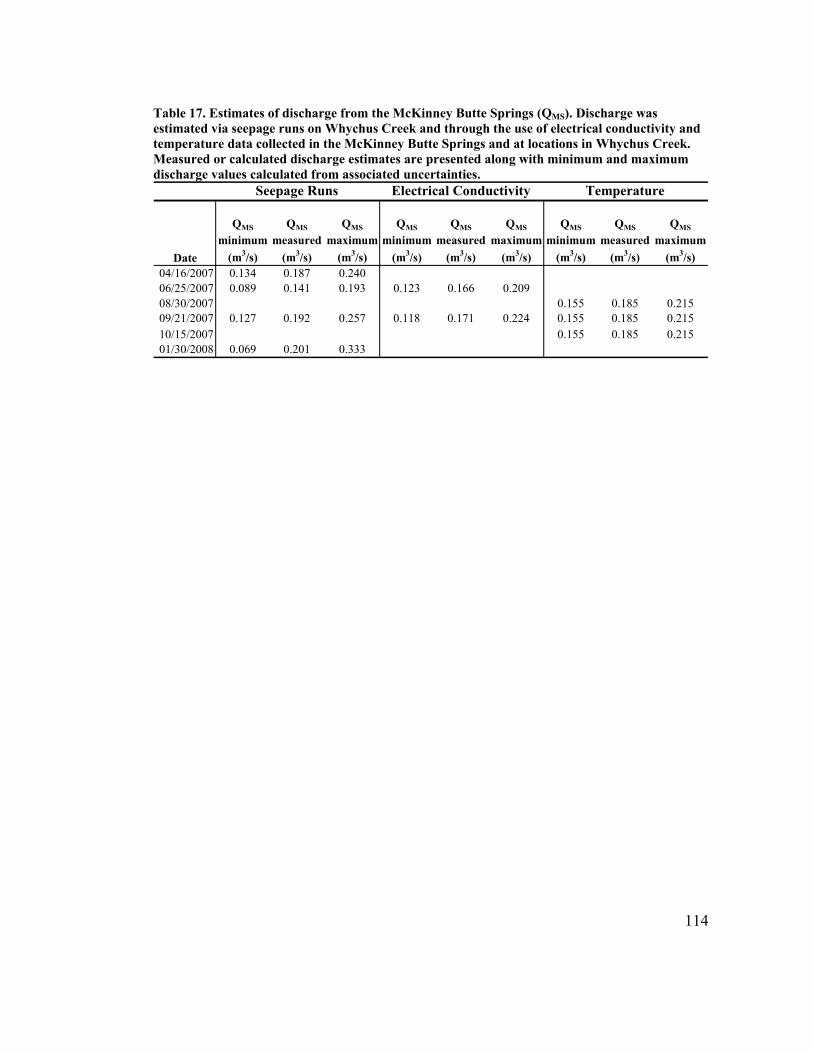
114
Table 17. Estimates of discharge from the McKinney Butte Springs (QMS). Discharge was estimated via seepage runs on Whychus Creek and through the use of electrical conductivity and temperature data collected in the McKinney Butte Springs and at locations in Whychus Creek. Measured or calculated discharge estimates are presented along with minimum and maximum discharge values calculated from associated uncertainties.
Seepage Runs Electrical Conductivity Temperature
Date
QMS
minimum
(m3/s)
QMS
measured
(m3/s)
QMS
maximum
(m3/s)
QMS
minimum
(m3/s)
QMS
measured
(m3/s)
QMS
maximum
(m3/s)
QMS
minimum
(m3/s)
QMS
measured
(m3/s)
QMS
maximum
(m3/s)04/16/2007 0.134 0.187 0.24006/25/2007 0.089 0.141 0.193 0.123 0.166 0.20908/30/2007 0.155 0.185 0.21509/21/2007 0.127 0.192 0.257 0.118 0.171 0.224 0.155 0.185 0.21510/15/2007 0.155 0.185 0.21501/30/2008 0.069 0.201 0.333

0.00
0.05
0.10
0.15
0.20
0.25
0.30
0.35 04
/200
706
/200
708
/200
710
/200
712
/200
702
/200
804
/200
8
McKinney Butte Springs Estimated Discharge (m3/s)
See
page
Run
s
Ele
ctri
cal C
ondu
ctiv
ity
Tem
pera
ture
Fig
ure
39.
McK
inn
ey B
utt
e S
pri
ngs
dis
char
ge e
stim
ated
th
rou
gh t
he
use
of
seep
age
run
s on
Wh
ych
us
Cre
ek, a
nd
tem
per
atu
re a
nd
ele
ctri
cal
con
du
ctiv
ity
dat
a co
llec
ted
in t
he
McK
inn
ey B
utt
e S
pri
ngs
an
d W
hyc
hu
s C
reek
. Err
or b
ars
are
pro
vid
ed f
or e
ach
met
hod
.
115

116
Discharge Contribution to Whychus Creek
The flow regime of Whychus Creek is typical of a runoff-dominated stream
(Whiting and Stamm, 1995). Historically, Whychus Creek has exhibited large seasonal
variations in discharge with peak flows generally occurring in late spring and early
summer in response to spring snowmelt, and low flows occurring in late summer and
early fall due to low precipitation (Figure 40). However, recent data suggests, at least
during years of below normal early summer precipitation (i.e. 2007), peak discharge
may occur during late fall or early winter (Figure 41). As a result, the percentage of
total discharge in Whychus Creek provided by the McKinney Butte Springs can vary
widely on both seasonal and yearly time scales. Discharge values of 0.10 m3/s (low
estimate), 0.20 m3/s (mean estimate), and 0.30 m3/s (high estimate) were used to
estimate the percent of streamflow in Whychus Creek supplied by the McKinney
Butte Springs on daily and monthly bases from 01/2006 to 02/2008 (Figure 42).
Estimated monthly discharge contributions from the McKinney Butte Springs to
Whychus Creek range from as little as 3-7% during winter (January – February 2006,
November 2006 – March 2007 and November 2007 – February 2008) and early
summer (June – July 2006) months; to as much as 24-46% during late summer
months. Estimated daily contributions range from 1% to 59% of total stream
discharge. The estimates of contributed discharge presented in Figure 42 indicate that
the McKinney Butte Springs will have the most impact on Whychus Creek during
times of low flow in the creek.

0123456789101112
1970
1972
1974
1976
1978
1980
1982
1984
1986
1988
1990
Discharge (m3/s)
Fig
ure
40.
Mea
n m
onth
ly d
isch
arge
in W
hyc
hu
s C
reek
fro
m 1
970
to 1
990
mea
sure
d a
t O
WR
D g
agin
g st
atio
n #
1407
5000
nea
r S
iste
rs, O
rego
n.
Pea
k d
isch
arge
typ
ical
ly o
ccu
rred
aft
er s
prin
g sn
owm
elt
and
was
as
mu
ch a
s te
n t
imes
larg
er t
han
low
-flo
w c
ond
itio
ns.
117

02468101214161820
Discharge (m3/s)
01234567
Total Monthly Precipitation (cm)
Mea
n D
aily
Dis
char
ge
Mea
n M
onth
ly D
isch
arge
Thr
ee C
reek
s M
eado
w to
tal m
onth
ly p
reci
pita
tion
06/2
005
12/2
005
06/2
006
12/2
006
06/2
007
12/2
007
06/2
008
Fig
ure
41.
Dai
ly a
nd
mon
thly
mea
n d
isch
arge
fro
m J
anu
ary
2006
to
Ap
ril 2
008
mea
sure
d a
t O
WR
D g
agin
g st
atio
n #
1407
6050
in S
iste
rs, O
rego
n.
Pea
k m
onth
ly m
ean
dis
char
ge o
ccu
rred
du
rin
g Ju
ne
in 2
006
and
du
rin
g N
ovem
ber
in 2
007.
Pea
k m
onth
ly d
isch
arge
usu
ally
occ
urs
du
rin
g m
onth
s of
hig
h p
reci
pit
atio
n;
how
ever
, in
200
7 p
eak
dis
char
ge o
ccu
rred
in J
un
e as
a r
esu
lt o
f la
te s
pri
ng
snow
mel
t.
118

01020304050 01/2
006
04/2
006
07/2
006
% of Whychus Creek Discharge
10/2
006
01/2
007
04/2
007
07/2
007
10/2
007
01/2
008
Sp
rin
gs %
of
Wh
ych
us
Cre
ek (
dai
ly, 0
.1)
Sp
rin
gs %
of
Wh
ych
us
Cre
ek (
mon
thly
, 0.1
)
Sp
rin
gs %
of
Wh
ych
us
Cre
ek (
dai
ly, 0
.2)
Sp
rin
gs %
of
Wh
ych
us
Cre
ek (
mon
thly
, 0.2
)
Sp
rin
gs %
of
Wh
ych
us
Cre
ek (
dai
ly, 0
.3)
Sp
rin
gs %
of
Wh
ych
us
Cre
ek (
mon
thly
, 0.3
)
Fig
ure
42.
Est
imat
ed c
ontr
ibu
tion
(%
of
tota
l flo
w in
Wh
ych
us
Cre
ek)
from
th
e M
cKin
ney
Bu
tte
Sp
rin
gs t
o W
hyc
hu
s C
reek
. Val
ues
are
sho
wn
as
per
cen
t of
mea
n d
aily
(op
en c
ircl
es)
and
mea
n m
onth
ly (
soli
d c
ircl
es, d
ash
ed li
nes
) d
isch
arge
in W
hyc
hu
s C
reek
. Th
e b
lue,
bla
ck, a
nd
red
ser
ies
use
est
imat
ed s
pri
ng
dis
char
ges
of 0
.10,
0.2
0, a
nd
0.3
0 m
3 /s r
esp
ecti
vely
.
119

120
Thermal Contribution to Whychus Creek
Temperature measurements collected every 10 minutes from 08/30/2007 to
10/15/2007 were analyzed to assess the thermal contribution of the McKinney Butte
springs to Whychus Creek. Locally, the springs act as a buffer against temperature
variations in Whychus Creek (Figure 43). Figure 43 is similar to Figure 36, however it
does not show Sisters air temperature. This was done to reduce the temperature scale,
making the temperature difference above Chester Springs and below Frank Springs
easier to see. Above Chester springs, the difference between low and high
temperatures is greater than below Frank springs. The magnitude of the springs’
impact on Whychus Creek is a function of the temperature and discharge in the creek
above the springs. Similar to the discharge contribution discussed in the previous
section, the McKinney Butte Springs will have a greater thermal impact during times
of low flow in Whychus Creek. The thermal contribution from the springs will be
greatest 1) when the temperature difference between the springs and Whychus Creek
is large, and 2) during low-flow conditions. As indicated in Figure 40, the timing of
low-flow conditions in Whychus Creek may vary from year to year, however,
discharge is generally lowest in mid to late summer.

246810121416182022 08/3
0/07
09/0
4/07
09/0
9/07
09/1
4/07
09/1
9/07
09/2
4/07
09/2
9/07
10/0
4/07
10/0
9/07
10/1
4/07
Temperature (oC)
Wh
ych
us
Cre
ek a
bov
e C
hes
ter
Sp
rin
gs
Why
chus
Cre
ek b
elow
Fra
nk S
pri
ngs
Fra
nk
Spr
ings
Ch
este
r S
pri
ngs
F
igu
re 4
3. T
emp
erat
ure
mea
sure
men
ts in
Wh
ych
us
Cre
ek a
nd
th
e M
cKin
ney
Bu
tte
Sp
rin
gs f
rom
08/
30/2
007
to 1
0/15
/200
7. T
emp
erat
ure
va
riat
ion
s in
Wh
ych
us
Cre
ek b
elow
th
e M
cKin
ney
But
te S
pri
ngs
are
atte
nu
ated
by
con
stan
t te
mp
erat
ure
dis
char
ge f
rom
th
e sp
rin
gs.
121

122
Source of McKinney Butte and Camp Polk Springs
Springs are windows into subsurface flow systems. Determination of a spring’s
source can provide information about local geology and the spatial scale of
groundwater flow. Because springs discharge water that may be recharged at several
locations along the length of an aquifer, “source” refers to an area where most of the
recharge originates and the subsequent path(s) groundwater takes on its way to a
spring. Tóth (1963) identified three different “scales” of ground-water flowpaths:
local, intermediate, and regional. Local groundwater flow systems typically circulate
to shallow depths and discharge proximal to recharge areas, while intermediate and
regional groundwater circulate to greater depths and discharge far from inferred
recharge areas. Generally, groundwater that circulates to greater depths in an aquifer is
less susceptible to contamination and short-term variations in recharge than
groundwater that circulates to shallow depths. Thus, understanding the spatial scales
of groundwater flow in an area is valuable when addressing water quality and water
resource management issues.
Establishing the source of a spring involves measurement and interpretation of
its physical, chemical, thermal, and isotopic characteristics. Seasonal variations in
discharge and temperature are related to the scale of groundwater flow; deeper (and
consequently longer) flowpaths attenuate fluctuations. Chemical characteristics (i.e.
dissolved ions, alkalinity, conductivity, pH) will vary depending on the amount of
time a mass of groundwater has spent in an aquifer (residence time) and the geologic

123
materials it contacts. The stable isotopes of oxygen and hydrogen fractionate
predictably as they pass through the hydrologic system, as a result, isotopic signatures
are a function of recharge elevation. Comparing the hydrogeologic characteristics of a
spring with nearby springs and surface water sources provides another avenue for
determining the source area of a spring. Analysis of physical and chemical
hydrogeologic data provides a framework for distinguishing source regions and
flowpaths of groundwater discharged at springs.
In this section, light stable isotope data and water chemistry and water quality
parameters of the McKinney Butte Springs, Camp Polk Springs, Paulina Spring, Alder
Springs, Metolius Spring and Whychus and Indian Ford creeks are examined with the
goal of determining the source and scale of groundwater flow discharging at the
McKinney Butte and Camp Polk Springs.
Major Ions
The amount of time water is in the ground, known as residence time, increases
as the water flows from recharge areas in a groundwater system to areas of discharge.
The greater the residence time, the longer the water has to react with aquifer material
and dissolve minerals. Therefore, the concentration of dissolved ions in groundwater
generally increases along regional flowpaths. In a study of the geochemistry of surface
water and groundwater in the upper Deschutes Basin, Caldwell (1998) showed that
concentrations of dissolved ions were lowest in the regional recharge area in and
around the Cascade Range, and dissolved ion concentrations generally increased to the

124
east in the regional discharge area near the confluence of the Deschutes and Crooked
rivers.
Concentrations of major ionic species in study area springs and streams were
used in the examination of source area and potential groundwater flowpaths for the
springs on McKinney Butte (springs on McKinney Butte include: The McKinney
Butte Springs (Chester Springs and Frank Springs) and The Camp Polk Springs
(Camp Polk Springhouse and Anderson Springs)). Source areas for several of the
springs sampled during the current study have been determined in previous
investigations (Metolius Spring, Paulina Spring, and Alder Springs). In her
examination of the use of isotope tracers in the Oregon Cascades, James (1999)
concluded that groundwater discharging from Metolius Spring was recharged at high
elevations near the crest of the Cascades and followed deep regional flowpaths.
Caldwell (1998) showed that discharge from Alder Springs is comprised mainly of
regional-scale groundwater flow, but contains a component of locally recharged
groundwater; Paulina Spring, the source of Indian Ford Creek, discharges locally
derived groundwater; and Lower Opal Springs, a high volume spring located in the
regional discharge area, discharges groundwater that has followed regional-scale
flowpaths from the Cascades. Major ion data from these springs serve primarily as a
comparison for streams and springs sampled during this study.
In general, the major ion geochemistry of streams and springs sampled during
this study are similar. HCO3 is the dominant anionic species in all 52 samples, and no
cationic species is dominant in 34 samples, while 13 samples from Whychus Creek,

125
two samples from The McKinney Butte Springs and the sample from Metolius Spring
are slightly Na dominant, and two samples from Camp Polk Springhouse are slightly
Mg dominant. Total ionic concentrations are generally higher in samples from springs,
with the exception of Paulina Spring whose total ionic concentration was similar to
Whychus Creek below the McKinney Butte Springs and lower than Indian Ford
Creek. Differences do exist, however, and are most prominent in NO3, Cl, and SO4.
Concentrations of Cl and NO3 in Camp Polk Springhouse (4.32 to 5.59 mg/L and 2.59
to 4.52 mg/L, respectively) are more than two times greater than concentrations at
most other sites and SO4 concentrations (1.74 to 3.01 mg/L) are approximately 1.5
times greater than at other sites. The sample from Metolius Spring is an exception,
with an NO3 concentration of 7.59 mg/L. Whychus and Indian Ford creeks generally
have the lowest NO3, Cl, and SO4; however some variability exists in Cl
concentrations in Indian Ford Creek, which range from 0.46 to 2.26 mg/L.
High concentrations of NO3, Cl and SO4 in Camp Polk Springhouse are of
particular interest because concentrations of these ions in Anderson Springs and the
McKinney Butte Springs, located 0.2 and 2.0 to 2.5 km upstream from Camp Polk
Springhouse, are significantly lower. Additionally, NO3, Cl, and SO4 concentrations in
springs that discharge regional-scale groundwater (Lower Opal, and Alder Springs)
are also significantly lower than concentrations in Camp Polk Springhouse. Also of
interest is the elevated NO3 concentration in Metolius Spring.
There is commonly a relationship between the chemical characteristics of
groundwater and the mineralogical properties of the geologic material with which it
has been in contact. The geological units of the upper Deschutes Basin consist mainly
of lavas, tuffaceous material, and volcaniclastic sediments of Cascade Range origin.
These rocks of igneous origin are composed of silicate minerals such as olivine,
pyroxene, amphibole, mica and feldspar. Dissolution of silicate minerals is the major
process that controls groundwater chemistry in igneous terrain and typically results in
the formation of clay and the release to aqueous solution of dissolved silica in the form
of silicic acid (H4SiO4) and metal cations such as Ca, Na, Mg, and K. The weathering
of albite, a Na feldspar, to kaolinite, a clay, is representative of these reactions:
442
4522283 42)(922 SiOHNaOHOSiAlOHHONaAlSi ++→++ ++ (9)
Minerals in which NO3, Cl, and SO4 are essential components are not very common in
igneous rocks (Hem, 1985), suggesting a process other than water-rock interaction
controls the amount of these anions in Camp Polk Springhouse and the amount of NO3
Metolius Spring.
Elevated concentrations of NO3, Cl, and SO4 are regularly found in
anthropogenic sources such as septic effluent, fertilizers, and animal wastes (Canter
and Knox, 1985). In the vicinity of McKinney Butte, potential anthropogenic sources
are limited to septic effluent and fertilizers; confined feed lots or high density grazing
(major sources of animal waste) are not locally present in areas up-gradient from the
springs. Irrigation occurs in the area around McKinney Butte; however, only an
average of 8.8% of the acreage in sections on, and bordering the west side of,
McKinney Butte are covered by irrigation water rights (OWRD, 2011b) (Table 18).
The low occurrence of irrigation locally suggests septic-tank effluent is the most likely
126

127
source of elevated NO3, Cl, and SO4 concentrations in Camp Polk Springhouse.
Additional evidence supporting a septic effluent source is considerably lower NO3, Cl,
and SO4 concentrations in Anderson Springs and the McKinney Butte Springs.
Fertilizers used for irrigation purposes are typically applied evenly over the land
surface, and should therefore be more evenly distributed in the subsurface. Lower
NO3, Cl, and SO4 concentrations in Anderson Springs and the McKinney Butte
Springs suggest the source responsible for the elevated concentrations in Camp Polk
Springhouse is localized. As is shown later in this chapter, the McKinney Butte
Springs discharge groundwater that has circulated deep in the aquifer system, which
explains its low NO3, Cl, and SO4 concentrations . Conversely, like Camp Polk
Springhouse, Anderson Springs discharges groundwater that has followed shallow
flow paths and should contain elevated concentrations of NO3, Cl, and SO4 if fertilizer
is the source. The most reasonable explanation for the variation in NO3, Cl, and SO4
concentrations in proximally located springs is a point source origin such as a septic-
tank effluent plume. The fact that many small acreage parcels, each with their own
septic system, are found on McKinney Butte is also consistent with a septic-tank
effluent origin.
Hinkle et al. (2007) found that elevated concentrations of Cl, NO3, and SO4 in
shallow wells in the LaPine basin (located in the southern portion of the upper
Deschutes basin) were caused by contamination of the aquifer from septic-tank
effluent and concluded that heterogeneous distributions of NO3 concentrations in the
subsurface is consistent with a number of point sources of septic-tank derived NO3

rather than a uniform nonpoint source such as agricultural sources. These findings are
also consistent with the argument presented above for a septic-tank effluent source of
elevated Cl, NO3, and SO4 concentrations in Camp Polk Springhouse.
Table 18. Total acreage covered by irrigation water rights in sections bordering the west side of McKinney Butte and sections on McKinney Butte. Data from Oregon Water Resources Department Water Rights Information System (WRIS) database.
Township Range SectionAcres on Irrigation
Water RightsTotal Acresin Section
% of Total Acreson IrrigationWater Rights
West of McKinney Butte
14S 10E 16 7.30 640 1.114S 10E 21 110.70 640 17.314S 10E 33 110.94 640 17.315S 10E 3 28.55 640 4.515S 10E 4 119.81 640 18.7
On McKinney Butte
14S 10E 34 8.00 640 1.315S 10E 2 8.50 640 1.3
Total Acres
393.80 4480 8.8
Determination of the source of elevated NO3 concentrations in Metolius Spring
is not as straightforward. Land use patterns in the Metolius Spring area are broadly
similar to those around McKinney Butte; irrigation is limited and small-acreage
residential lots are abundant. Black Butte Ranch, a local resort community, is the site
of the only up-gradient irrigation and residential development in the Metolius Spring
area. However, unlike the McKinney Butte area, many homes in Black Butte Ranch
are served by gravity sewers and fewer homes have septic-tanks (Black Butte Ranch,
2010). Two 18-hole golf courses at the ranch are maintained with 361.5 acres of
irrigation water rights (the water right certificate is for 361.5 acres) (OWRD, 2011b).
Septic effluent and irrigation water are both potential sources of NO3 in Metolius
128

129
Spring. Additional complications stem from the fact that Black Butte Ranch is located
over 7 km south of Metolius Spring, allowing ample time for mixing of multiple NO3
sources and, potentially, denitrification in the subsurface.
In contrast to Camp Polk Springhouse, concentrations of Cl and SO4 in
Metolius Spring are not elevated and are comparable to concentrations found in the
McKinney Butte Springs, Anderson Springs, Alder Springs, and Lower Opal Springs.
This suggests that the source of NO3 in Metolius Spring does not contain elevated
concentrations of Cl and SO4. Possible explanations include differences in the
chemical constituents found in septic-tank effluent in the Metolius Spring area versus
the McKinney Butte area, or fertilizer that contains significantly more NO3 than Cl or
SO4. The latter interpretation is consistent with golf course irrigation; most grasses
require large quantities of nitrogen (De Loach, 1921).
Chitwood (1999) sampled Metolius Spring for NO3 eight times between May
1996 and May 1997. NO3 concentrations ranged from 0.44 to 3.36 mg/L and 6 of the 8
samples contained NO3 concentrations below 1 mg/L (Table 15). The highest NO3
concentration was measured on 05/02/1997 and was approximately 4 times greater
than the concentration measured less than two months earlier (0.80 mg/L on
03/13/1997). The NO3 concentration measured on 05/02/1997 is comparable to
concentrations in Camp Polk Springhouse, but is approximately 50% less than the
NO3 concentration measured in Metolius Spring during the current study. Chitwood
(1999) did not postulate a source for elevated NO3 concentrations in Metolius Spring,
but he did conclude that NO3 and PO4 from septic systems in the Camp Sherman area,

130
located 3 km downstream (north) from Metolius Spring are carried by groundwater to
the Metolius River. Large variations in NO3 concentrations reported by Chitwood
(1999) indicate that the source is not constant, but varies temporally. Although the
source of NO3 is uncertain, elevated concentrations indicate that a portion of discharge
from the spring is provided by shallow groundwater flow.
Stable Isotopes
Oxygen and hydrogen isotopes are commonly used to determine groundwater
recharge areas and regional groundwater flow patterns. Their usefulness stems from
the fact that they fractionate in a predictable manner as water moves through the
hydrologic cycle depending on the physical and chemical processes that operate
(Criss, 1999). Fractionation occurs because two isotopes of the same element have
different masses, and hence possess slightly different physiochemical properties. As a
result, isotopes are partitioned unequally during chemical reactions. The stable
isotopes of light elements (e.g., hydrogen and oxygen) have large relative mass
differences, so their fractionation effects are more pronounced and more easily
detected than those of the heavy elements.
There are two stable isotopes of hydrogen: 1H and 2H (deuterium), and three of
oxygen: 16O, 17O, and 18O, of which 16O and 18O are more abundant. Because the
vapor pressure of water molecules is inversely proportional to their masses, water
vapor is depleted in the heavier isotopes 2H and 18O relative to coexisting liquid water
(Faure, 1986). During phase changes in general, the heavy isotopes are preferentially
partitioned into the more condensed phase. For example, for the various phases of
water, at equilibrium, δ18Osolid > δ18Oliquid > δ18Ogas (Kendall and McDonnell, 1998).
This fact indicates that the relative abundance of the heavy to light isotopes changes in
a predictable manner as water moves through the hydrologic cycle and has important
implications for determining the source of springs.
Craig (1961) established that there is a linear relationship between δ18O and
δ2H in precipitation on a global scale. The relationship is known as the Global
Meteoric Water Line and is described by:
108 182 += OH δδ (10)
The slope of this line, 8, reflects the difference in fractionation behavior between 18O
and 2H and is related to the amount of energy required to break chemical bonds,
known as zero point energy (ZPE) between isotopes of the same element. Molecules
containing heavy isotopes are more stable than molecules with lighter isotopes
(Kendall and McDonnell, 1998). Because the relative mass difference between 2H and
1H is greater than the mass difference between 18O and 16O, the magnitude of
fractionation between isotopes of H is 8 times greater than between isotopes of O.
The two major factors that control the isotopic concentration of precipitation at
any location are temperature and the proportion of the original water vapor that
remains in the air that is undergoing precipitation; these two factors can produce
geographic and temporal variations in precipitation (Kendall and McDonnell, 1998).
The result of these factors is that isotopic concentrations in precipitation will vary with
131

132
distance from the source of the water vapor (continental and latitude effects),
elevation, season, and amount (Kendall and McDonnell, 1998).
The continental effect is an observation that meteoric water is more depleted
farther from source of the water vapor. As an air mass moves inland, the heavier
isotopes are preferentially partitioned in the liquid phase leaving the residual vapor
more depleted. Subsequent precipitation events are further depleted, although still
enriched relative to the residual vapor (Clark and Fritz, 1997; Kendall and McDonnell,
1998).
Elevation and latitude effects are somewhat related to the continental effect in
that progressive rainout of the parent vapor is responsible for some of the depletion of
heavy isotopes at higher elevations and latitudes (Kendall and McDonnell, 1998).
However, temperature also plays a significant role due to increased fractionation at
lower temperatures found at higher elevations and latitudes.
Temperature is also the controlling factor for seasonal variations in the isotopic
composition of precipitation (Kendall and McDonnell, 1998). Regions that experience
large seasonal fluctuations in surface temperature exhibit large variations in the
isotopic composition of precipitation (Ingraham et al., 1991; Jacob and Sonntag,
1991). In general winter precipitation is more depleted than summer precipitation due
to low temperatures experience during winter months.
The isotopic composition of precipitation is also influenced by the amount that
occurs. Water collected during smaller rainfall events can be isotopically enriched
relative to water collected during larger events. This phenomenon is caused by

133
evaporation at the surface of individual raindrops during descent and is related to the
relative humidity in the atmosphere. During longer rainstorms the air below cloud base
may become more saturated which reduces the amount of evaporative loss of the
raindrops (Kendall and McDonnell, 1998). The amount effect is especially
pronounced in arid environments and can result in a local meteoric water line with a
slope that is less than the GMWL (Friedman et al., 1992). However, the amount effect
is not as severe at higher latitudes where more precipitation is in the form of snow,
which is not subjected to isotopic fractionation by evaporation during descent (Kendall
and McDonnell, 1998).
Precipitation that occurs in central Oregon typically originates in air masses in
the Pacific Ocean and forms by condensation within clouds. As a result, precipitation
is enriched in 2H and 18O relative to residual vapor, although the values are not as high
as those for seawater (Craig and Gordon, 1965). Air masses moving east from the
coast of Oregon must ascend and release moisture as they move across the Cascades.
As these air masses move east, subsequent precipitation events are further depleted in
2H and 18O, although still enriched relative to the residual vapor (Clark and Fritz,
1997).
James (1999) argued that elevation is the most important factor affecting the
isotopic composition of precipitation in the central Oregon Cascades. Her argument
was based on the analysis of 76 snow core samples and 56 water samples from cold
springs to the east of the Cascade crest. Seasonal effects were discounted because the
majority of precipitation to the east of the crest falls as snow during the winter.

134
Latitude effects were considered unimportant due to similarities in δ18O in
precipitation samples from locations in the southern (Willamette Pass), central (Mt.
Bachelor), and northern (Santiam Pass) parts of her study area (see Figure 4.7 in
James, 1999). She did find a correlation between distance from the coast and δ18O, but
attributed it to the general decrease in elevation from west to east from the Cascade
crest.
James (1999) found a linear relationship between elevation and δ18O in
precipitation samples for the central Oregon Cascades that is given by the equation:
9.10)(0018.018 −−= minelevationOδ (11)
Equation 11 indicates there is a decrease of 0.18‰ per 100 m rise in elevation.
Considerable scatter in hydrogen isotope data (R2 = 0.0066) prevented determination
of the relationship between δ2H and elevation. Some scatter also exists in the
relationship between elevation and δ18O (Figure 44), but it is consistent with the
elevation relationship determined for other regions (Table 19).
Table 19. Gradients of δ18O with elevation (After Clark and Fritz, 1997).
Site Region
Gradient
(δ18O ‰per 100 m) Reference
Jura Mountains Switzerland -0.2 Siegenthaler et al., 1980Black Forest Switzerland -0.19 Dubois and Flück, 1984Mont Blanc France -0.5 Moser and Stichler, 1970Coast Mountains British Columbia -0.25 Clark et al., 1982Piedmont Western Italy -0.31 Bortolami et al., 1978Dhofar Monsoon Southern Oman -0.10 Clark, 1987Saiq Plateau Northern Oman -0.12 Stanger, 1986Mount Camaroon West Africa -0.155 Fontes and Olivry, 1977Hat Creek Basin Northern CA -0.23 Rose et al., 1996Urumqu River Basin Xinjiang, China -0.4 Weizu and Longinelli, 1993

δ18O
= -
0.00
18(e
leva
tion
in m
) -
10.9
R2 =
0.2
25
-18
-17
-16
-15
-14
-13
-12
-11
-10 10
0012
0014
0016
0018
0020
0022
0024
00
Ele
vati
on (
m)
δ18
O (‰)
F
igu
re 4
4. R
elat
ion
ship
bet
wee
n δ
18O
in p
reci
pit
atio
n a
nd
ele
vati
on in
th
e ce
ntr
al O
rego
n C
asca
des
(fr
om J
ames
, 199
9).
135

The local regression relationship between elevation and the oxygen isotopic
composition of precipitation in the central Oregon Cascades determined by James
(1999) was used to approximate recharge elevations of springs in the current study
area. The recharge elevation was calculated by rearranging equation 11 to solve for
elevation (equation 12). The inferred recharge elevation is viewed graphically by
projecting the isotopic composition of the spring water to the elevation at which
precipitation has a comparable composition to infer a representative or mean recharge
elevation.
0018.0
)9.10()(
18 +−= OmElevation
δ (12)
Recharge elevation estimates for springs sampled during the current study and
the Lower Opal Springs sample from Caldwell (1998) are presented in Table 20 and
Figure 45. Due to uncertainties related to scatter in the precipitation data (Figure 44),
calculated recharge elevations are rounded to the nearest 50 meters. Estimated
recharge elevations are lowest for Camp Polk Springhouse, Anderson Springs, and
Paulina Spring, and are highest for Lower Opal Springs, Alder Springs, and Metolius
Spring. Estimated recharge elevations for the McKinney Butte Springs are
considerably higher than elevations for the Camp Polk Springs and Paulina Spring, but
are not quite as high as recharge elevations for Metolius, Alder, and Lower Opal
Springs.
136

137
Table 20. Spring recharge elevations estimated from the relationship between δ18O in precipitation and elevation on the east flank of the central Oregon Cascades.
SpringDischarge
Elevation (m)Recharge
Elevation (m)
Frank Springs 929 1800-1900Chester Springs 930 1900Anderson Springs 945 1300Camp Polk Springhouse 942 950-1200Paulina Spring 1024 1250Alder Springs 695 2300Metolius Spring 914 2150Lower Opal Springs (Caldwell, 1998) 597 2450
In several cases, inferred recharge elevations for springs coincide with local
topographic highs. For example, the inferred recharge elevation for Paulina Spring
(1250 m) suggests that recharge occurs on nearby topographic highs Fivemile Butte,
Graham Butte, or Sixmile Butte, that have maximum elevations of 1231, 1280, and
1391 m, respectively. In fact, Paulina Spring discharges from the toe of a Quaternary
basaltic andesite flow that originated on Fivemile Butte (Basalt of Fivemile Butte;
from Sherrod et al., 2004). Possible recharge locations for Anderson Springs and
Camp Polk Springhouse (inferred recharge elevations of 1250 m and 950-1200 m)
include the same locations as for Paulina Spring, the flanks of Black Butte, or lower
elevations on the east flank of Trout Creek Butte. As was the case with Paulina Spring,
possible recharge locations for Anderson Springs and Camp Polk Springhouse are
found near the springs, within a distance of approximately 10 km or less. The
proximity of the recharge and discharge areas for these springs suggests they
discharge local-scale groundwater flow.

-16.
0
-15.
0
-14.
0
-13.
0
-12.
0
-11.
0
-10.
0 500
1000
1500
2000
2500
Spri
ng E
leva
tion
(m
)
δ18
O (‰)Fr
ank
Spr
ings
Che
ster
Spr
ings
Cam
p P
olk
Spr
ingh
ouse
And
erso
n S
prin
gs
Pau
lina
Spr
ing
Ald
er S
prin
gs
Met
oliu
s S
prin
g
Low
er O
pal S
prin
gs (
Cal
dwel
l, 19
98)
δ18O
= -
0.00
18(e
leva
tion
in m
) -
10.9
spri
ngel
evat
ion
infe
rred
rec
harg
e el
evat
ion
F
igu
re 4
5. R
elat
ion
ship
bet
wee
n s
pri
ng
elev
atio
n a
nd
oxy
gen
isot
ope
com
pos
itio
n. T
he
soli
d li
ne
show
s th
e re
lati
onsh
ip b
etw
een
ele
vati
on a
nd
δ18
O
of p
reci
pit
atio
n a
s d
efin
ed b
y sn
ow c
ore
sam
ple
s. T
he
mea
n r
ech
arge
ele
vati
on o
f th
e w
ater
can
be
esti
mat
ed b
y tr
acin
g h
oriz
onta
l lin
es f
rom
th
e p
oin
ts r
epre
sen
tin
g sp
rin
g sa
mp
les
to t
he
elev
atio
ns
at w
hic
h p
reci
pit
atio
n is
com
para
ble
. Th
e d
ata
use
d f
or t
he
lin
ear
regr
essi
on a
re f
rom
Jam
es
(199
9) a
nd
are
sh
own
in F
igu
re 4
6 an
d a
re p
rese
nted
in A
ppen
dix
C.
138

139
Metolius Spring, which is found at an elevation of 914 m, has an inferred
recharge elevation of 2150 m. Possible recharge locations include Mt. Washington and
Belknap Crater, approximately 25-30 km from the spring. Alder Springs is also
recharged at high elevations near the Cascades crest, over 40 km from the discharge
point. James (1999) found the recharge elevation for Lower Opal Springs, a spring that
is found at an elevation of 597 m in the regional discharge area, ranged from 2450-
2600 m. Potential recharge locations include the Three Sisters or other high elevation
peaks along the Cascade crest, nearly 50 km from the spring. These observations
suggest that Metolius Spring, Alder Springs, and Lower Opal Springs (referred to as
the Regional Springs when the discussion applies to all) are all part of the regional
groundwater flow system.
Similar to the Regional Springs, inferred recharge elevations for the McKinney
Butte Springs (1800-1900 m for Frank Springs and 1900 m for Chester Springs) are
also much higher than their discharge elevations (Table 20). However, the McKinney
Butte Springs recharge elevations are slightly lower than those for the Regional
Springs, suggesting the locus of their recharge occurs on the flanks of the Cascades,
but not at the crest.
A second interpretation is that discharge from the McKinney Butte Springs is a
mixture of recharge from high elevations near the crest of the Cascades (recharge
elevations similar to those for the Regional Springs) and from more local, lower
elevation areas (recharge elevations similar to those for Paulina Spring and the Camp
Polk Springs). A simple mixing model was employed to calculate the fractions of
regional- and local-scale groundwater flow that would be discharged from the
McKinney Butte Springs in this scenario (equation 13).
140
)( ) ( LOSLOSPSPSMBS OfOfO 181818 δδδ += (13)
Where δ18OMBS, δ18OPS, and δ18OLOS are the δ18O values (‰) in the McKinney Butte
Springs, Paulina Spring, and Lower Opal Springs and fPS and fLOS are the fraction of
flow in the McKinney Butte Springs that is provided by local- (fPS) and regional- (fLOS)
scale groundwater flow.
The mixing model assumes that δ18O values in Paulina Spring and Lower Opal
Springs represent endmembers for local and regional recharge areas, respectively.
δ18O values used in the model were -14.2 ‰ for the McKinney Butte Springs, -13.1 ‰
for Paulina Spring and -15.28 ‰ for Lower Opal Springs. Solving equation 13 gives
values of 0.5 for fPS and 0.5 for fLOS. Thus, according to the model, 50% of the
discharge from the McKinney Butte Springs is provided by regional-scale
groundwater flow and 50% is supplied by local-scale groundwater.
Local-scale groundwater flow is typically more susceptible to short-term
variations in recharge, which suggests discharge from springs whose source is locally
recharged groundwater should display seasonal variations. This is true for the Camp
Polk Springs which had visibly higher discharges during winter 2008 than during June
and September 2007. If local-scale groundwater flow is supplying a significant
fraction of the discharge in the McKinney Butte Springs, seasonal variations in the
isotopic composition of the springs might be expected. For example, if fPS in equation
13 is reduced to 0.30, the δ18O value in the McKinney Butte Springs would be reduced
141
to -14.6 ‰. However, δ18O concentrations measured in the McKinney Butte Springs
six times during a 16-month period varied by only 0.1 ‰ (Table 12). This lack of
seasonal variation suggests either the contribution of local-scale discharge is
insignificant or, less likely, that seasonal variations in the magnitude of local-scale
groundwater flow are minimal.
The shallow aquifer on the west side of McKinney Butte is comprised of
highly permeable glacial outwash sediments and High Cascade lavas that have filled a
depositional basin created by down-to-the-west displacement along a normal fault
bounding the west side of the butte (Figure 5). Groundwater in the high permeability
outwash and High Cascade lavas is juxtaposed against lower permeability upper
Miocene to Pliocene Deschutes Formation strata that form and underlie McKinney
Butte. Evidence of this is the flattening of the hydraulic gradient that occurs in the
Sisters area (Figure 26). The water table elevation in the glacial outwash and High
Cascade lavas, 940-945 m, is very similar to the elevations of Anderson Springs (945
m) and Camp Polk Springhouse (942 m). General chemistry and isotopic composition
of these springs indicate they are supplied by local-scale groundwater flow. Seasonal
variations in the height of the water table will impact discharge from the springs by
altering the hydraulic gradient. During times when the water table is low, the gradient
between the water table and the Camp Polk Springs will be lower, and discharge,
which is proportional to the gradient, will be diminished. Because the elevations of the
Camp Polk Springs are within a few meters of the water table, seasonal fluctuations in
water table elevation will substantially affect discharge from the springs.

142
In contrast, the elevations of the McKinney Butte Springs (Chester Springs =
930 m and Frank Springs = 929 m) are 10-15 m lower than the local water table. If
shallow groundwater is supplying some of the discharge from these springs, the
seasonal variation should be less than in the Camp Polk Springs due to the greater
elevation difference between the water table and the springs. Less seasonal variation in
discharge would also result in less seasonal variation in δ18O values in the McKinney
Butte Springs.
Temperature
Circulating groundwater transports heat. If groundwater flow velocities are
sufficiently large, most of the subsurface heat will be transported by advection (Manga
and Kirchner, 2004). Such is the case in the central Oregon Cascades, where highly
permeable near-surface rocks permit high recharge rates and thus high groundwater
flow rates. The result is that most background geothermal heat is transported
advectively by groundwater and discharged at springs (Manga and Kirchner, 2004).
Therefore, the temperature of spring water can be used to infer the geothermal heat
flux. However, not all springs have been warmed geothermally, as deeply circulating
groundwater acquires more geothermal heat than groundwater that circulates to
shallow depths (James et al., 2000). Thus, temperature measurements at springs are
another means of assessing the relative scale of groundwater flow.
Several investigators have used water temperatures in springs to examine the
geothermal heat flux from the central Oregon Cascades (i.e., Ingebritsen et al., 1989,
1992, 1994; Blackwell and Priest, 1996; James, 1999; James et al., 2000; Manga,
1998; Manga and Kirchner, 2004). Many of these studies have attributed the
temperature increase (ΔT) in groundwater from the recharge area to the discharge area
entirely to geothermal warming (Ingebritsen et al., 1989, 1992, 1994; Blackwell and
Priest, 1996; James, 1999; James et al., 2000; Manga, 1998) However, recent work by
Manga and Kirchner (2004) has demonstrated that temperature increase due to the
conversion of gravitational potential energy (GPE) to heat is important in settings
where the difference in elevation between the recharge and discharge areas is
sufficiently large (~1 km), and conductive heat transfer with the Earth’s surface
contributes to ΔT when the water table depth is less than a few meters. Manga and
Kirchner (2004) calculated a GPE lapse rate of 2.3 ºC/km using equation 14:
wC
g
z
T =ΔΔ
(14)
where g is gravitational acceleration (9.8 m/s2), and Cw is the specific heat of water
(4186 J/kg ºC). The assumptions associated with determining ΔT are: 1) groundwater
recharge enters the subsurface at temperatures near the mean annual surface
temperature of the recharge area, and 2) the temperature of the aquifer is uniform
across its thickness. Additionally, heat conduction to and from the Earth’s surface can
generally be ignored in the central Oregon Cascades because aquifer depths are
typically greater than many tens of meters (e.g. Gannett, et al., 2003; cited in Manga
and Kirchner, 2004).
143

Temperature corrections for GPE dissipation in study area springs are provided
in Table 21. Figure 46a shows water temperature of a spring as a function of the
discharge elevation, and Figure 46b shows the relationship between spring
temperatures corrected for GPE dissipation and recharge elevation obtained from
oxygen isotope analysis. The plus signs show the mean annual surface temperature as
a function of elevation at seven climate stations in or near the current study area for
the period from 1961-1990 (Oregon Climate Service, 2008) (Table 22). The dashed
lines in Figure 46 bracket the range of expected surface temperatures as a function of
elevation. The scatter of climate station temperatures probably reflects local climate
variations that are influenced by various mountain chains in the region (Manga and
Kirchner, 2004). The temperature change (ΔT) attributed to geothermal warming is
shown in Figure 46b.
Table 21. Temperatures of study area springs corrected for gravitational potential energy dissipation (GPE).
NameElevation
(m)Temperature
(°C)
RechargeElevation
(m)
TemperatureCorrected for GPE
(°C)
Frank Spring 929 8.9 1849 6.8Anderson Springs 945 7.9 1278 7.1Camp Polk Springhouse 942 9.3 1053 9.0Paulina Spring 1024 4.3 1248 3.8Metolius Spring 914 8.9 2132 6.1Alder Springs 695 10.5 2271 6.9Lower Opal Springs (Caldwell, 1998) 597 12.0 2433 7.8
144

Table 22. Mean annual surface temperatures at climate stations in the region for the period from 1961-1990.
Station Name Elevation (m)Mean Annual
Temperature (°C)
Santiam Pass 1448 4.28Sisters 969 7.67Bend 1116 7.89Wickiup 1329 6.56Chemult 1451 5.67Crater Lake NP 1972 3.11Metolius 762 8.67
The water temperature of most springs is similar to the mean annual surface
temperature at the discharge elevation (Figure 46a). Frank Springs, Metolius Spring,
Alder Springs, and Lower Opal Springs discharge water that is several degrees warmer
than the mean recharge temperature (Figure 46b). The amount of geothermal warming
in each spring is 2.0, 2.6, 4.05, and 5.7 °C for Frank Springs, Metolius Spring, Alder
Springs, and Lower Opal Springs, respectively. Geothermal warming in these springs
suggests they discharge deep groundwater flow.
145
A linear relationship exists between recharge elevation and spring temperature
for the Regional Springs, where spring temperature increases 0.56 ºC for every 100 m
gain in recharge elevation (Figure 46b). Frank Springs, however, does not follow the
trend of the Regional Springs (Figure 46b). The reason for the linear trend could be
related to relative flow path depths of groundwater discharged at each of the springs.
Locally, for waters that circulate to the deep part of the aquifer system, recharge
elevation is related to groundwater flow paths, where the groundwater circulation
depth increases with increasing recharge elevation. This is due to the fact that the
majority of recharge occurs at high elevations, which is the major driving force for

groundwater flow in the study area. Water that circulates deeper, and as a result closer,
to geothermal heat sources could have slightly elevated temperatures relative to
groundwater that has followed shallower flow paths. The reason Frank Springs,
despite showing some geothermal warming, does not follow the linear trend is
uncertain, but could be explained by a shallow groundwater component of spring
discharge.
In contrast to the previously mentioned springs that discharge water with
several degrees of geothermal warming, Paulina Spring and Anderson Springs
discharge water that shows no evidence of geothermal warming (Figure 46b). Camp
Polk Springhouse discharges water that is 0.5 °C warmer than the mean annual surface
temperature at the inferred recharge elevation, but this could be attributed to local
climate variations. High concentrations of anthropogenically influenced ions and low
estimated recharge elevation suggest Camp Polk Springhouse discharges shallow
groundwater flow and supports the argument that it does not discharge water that has
been geothermally warmed.
As discussed in the Stable Isotopes section of this chapter, Frank Springs may
discharge a mixture of local- and regional-scale groundwater. The potential impact on
water temperature in Frank Springs where 50% of the water is locally recharged and
50% is regional-scale groundwater was examined using equation 15:
FSRSGWRSGWCPSHCPSH TTfTf =+ )()( (15)
where fCPSH and TCPSH are the fraction of flow from and temperature in Camp Polk
Springhouse, and represent local-scale groundwater, fRSGW and TRSGW are the fraction
146

147
of flow and temperature from regional-scale groundwater, and TFS is the water
temperature in Frank Springs. The mean temperatures measured in Frank Springs and
Camp Polk Springhouse were used for TCPSH (9.3 ºC) and TFS (8.9 ºC), respectively. A
temperature of 8.5 ºC was calculated when equation 15 was solved for TRSGW. Using
an assumed recharge elevation of 2400 m, ∆T due to GPE dissipation is 3.38 ºC,
leaving a GPE corrected temperature of 5.12 ºC. The upper bound of mean annual
surface temperature at 2400 m elevation is 2.22 ºC, and ∆T due to geothermal
warming is 2.9 ºC. This temperature is significant because it indicates that discharge
from the McKinney Butte Springs is carrying geothermal heat.
Temperature in Anderson Springs is comparable to the mean annual surface
temperature at the inferred recharge elevation, suggesting it does not discharge water
that has been geothermally warmed. Temperature in Camp Polk Springhouse is
slightly higher than expected at the inferred recharge elevation, but can be explained
by climatic variations that occur in the region (Manga and Kirchner, 2004).
Temperature data from the Camp Polk Springs aligns with previously presented
general chemistry and stable isotope data and indicates that they discharge shallow
groundwater that is recharged locally and at low elevations.

0
2
4
6
8
10
12
500 1000 1500 2000 2500 3000
Discharge Elevation (m)
Sp
rin
g T
emp
erat
ure
(°C
)
Lower OpalSprings
AndersonSprings
Camp Polk SpringhouseMetolius Spring
Frank Springs
Paulina Spring
Alder Springsa)
Spring Temperature (°C) = 0.0056(Recharge Elevation in m) - 5.79
0
2
4
6
8
10
12
500 1000 1500 2000 2500 3000
Recharge Elevation (m)
Sp
rin
g T
emp
erat
ure
(°C
)
Paulina Spring
Camp PolkSpringhouse
Anderson Springs Frank Spring
Metolius Spring
Alder Springs
Lower OpalSprings
geotherm
al warm
ing
ΔT
b)
Figure 46. Relationship between elevation and water temperature in study area springs. The plus signs show the mean annual surface temperature at climate stations in the region and the dashed lines show the upper and lower bounds of the relationship between elevation and surface temperature (data from Oregon Climate Service). (a) Spring temperature as a function of discharge elevation. (b) Spring temperature as a function of the mean recharge elevation inferred from oxygen isotope content of the spring water. Spring temperatures in (b) are corrected for the expected 2.3 ºC/km increase in water temperature as the water flows to lower elevations. The temperature difference ∆T indicates the amount of geothermal warming of the water. The Regional Springs (Lower Opal Springs, Alder Springs, and Metolius Spring) show a linear relationship between temperature and inferred recharge elevation.
148

149
The McKinney Butte Springs discharge water that contains geothermal heat, a
sign of deeper groundwater circulation. This is in agreement with previously presented
major ion and stable isotope data that also suggest regional-scale groundwater is a
major component of discharge from the McKinney Butte Springs. However, as was
the case with the stable isotope data, the temperature data does not eliminate the
potential contribution from shallow, local-scale groundwater flow.
Conceptual Model of Groundwater Flow
In general, the factors controlling groundwater flow through the study area are
the same as those operating throughout the upper Deschutes Basin. These include the
distribution of recharge and the physical characteristics of geologic units through
which the water is moving. Geologic structures, principally faults and fault zones,
influence groundwater flow by affecting patterns of sediment deposition, by
juxtaposing rocks of contrasting permeability and by providing preferential flow paths
for the upward migration of deeply circulating groundwater.
The area of greatest recharge is along the slopes of the Cascade Range to the
west of the study area with lesser amounts of recharge occurring on volcanic centers
bordering the study area to the north and south. The high recharge along the slopes of
the Cascades results from a combination of heavy precipitation and high infiltration
through young Quaternary volcanic deposits. Groundwater then moves towards
discharge areas east of the study area under a topographic gradient.

150
Horizontal Groundwater Flow
In the upper Deschutes Basin, groundwater follows many flowpaths from high-
elevation recharge areas along the slopes the Cascades toward low-elevation discharge
areas near the confluences of the Deschutes, Crooked, and Metolius Rivers (Gannett,
et al., 2001). Groundwater flow through the study area largely follows the same paths
although some groundwater surfaces as springs on the east side of McKinney Butte.
Water level contour maps indicate that horizontal gradients in shallow and deep parts
of the flow system are high in the recharge areas to the west of the study area,
decrease in the vicinity of McKinney Butte and the city of Sisters, and then increase
again east of the butte (Figures 26 and 27).
The water table elevation immediately west of McKinney Butte is relatively
high given its position in the basin (Gannett et al., 2001) and the horizontal head
gradient is low. These factors are controlled by the juxtaposition of highly permeable
glacial outwash and intercalated High Cascade lavas against lower permeability
Deschutes Formation material, which produces a "leaky dam" effect as groundwater is
impounded on the west side. The high permeability of the outwash coupled with the
fact that the shallow aquifer is unconfined also contributes to the low horizontal head
gradient that is present on the west side of the butte.
East of McKinney Butte, the horizontal gradients in both the shallow and deep
parts of the groundwater flow system increase dramatically (Figures 26 and 27). Two
probable reasons for this increase include the distribution of precipitation in the study
area, and the influence of local geologic faults. The McKinney Butte area is located to

151
the east of a high gradient precipitation region where annual precipitation decreases
from over 200 cm/yr in the western part of the region to less than 40 cm/yr
approximately 4.5 km west of McKinney Butte (Figure 4). This reduction in
precipitation, and consequently recharge, could play a part in the head gradient
increase. The influence of faults on the head gradient increase is twofold. First, faults
bounding McKinney Butte have juxtaposed higher permeability materials on the
down-thrown (west) side against lower permeability materials on the up-thrown (east)
side. The decrease in permeability east of the faults may be accommodated by an
increase in horizontal head gradient. Second, the shallow, saturated, higher
permeability materials that provide downward leakage to deeper parts of the flow
system west of the faults are not present on the east side. The lack of leakage from
shallow water-bearing zones east of McKinney Butte may also contribute to the
gradient increase in the deep part of the groundwater flow system.
Both the spatial distribution of precipitation and the factors related to faulting
in the McKinney Butte area are potential explanations for the horizontal head gradient
increase on the east side of McKinney Butte. However, the slope of the precipitation
gradient begins flattening 4.5 km west of McKinney Butte (Figure 4; Figure 3 in
Gannett et al., 2001) and is nearly flat from the butte to the eastern part of the basin,
whereas, the initiation of the high horizontal head gradient zone and the faults
bounding McKinney Butte are practically superimposed on one another (Figures 26
and 27). While both factors may contribute to the gradient increase on the east side of

152
McKinney Butte, the available evidence suggests that the faults bounding the butte are
the primary cause.
Vertical Groundwater Flow
The vertical hydraulic head gradient (60 m) between the shallow and deep
parts of the flow system is greatest in the western part of the study area, where the
locus of recharge occurs. The gradient decreases to approximately 15 m on the west
side of McKinney Butte. The hydraulic head in both the shallow and deep parts of the
system drop dramatically east of McKinney Butte. The paucity of shallow wells in the
eastern part of the study area did not allow mapping of contours below an elevation of
900 m (Figure 26). However, the vertical gradient between shallow and deep flow
zones is 15-30 m immediately east of the butte.
Groundwater Flow to Camp Polk Springs
Discharge from Camp Polk Springs is supplied by shallow groundwater.
Losing reaches of Indian Ford Creek on the west side of McKinney Butte contribute to
local shallow groundwater flow. Because shallow groundwater is the source of Camp
Polk Springs, their discharge is controlled by the permeability contrast caused by local
faulting. In fact, the springs probably owe their existence to the fault zone for two
reasons. First, the depositional basin created on the west side of the fault was filled
with highly permeable material, and second, the permeability contrast between the
upthrown and downthrown sides of the fault essentially created a bathtub on the west
side of McKinney Butte. Additionally, the lavas that form McKinney Butte are

153
underlain by an ash-flow tuff of the Deschutes Formation (Tp in Figure 5). The lower
permeability ash-flow tuff impedes downward leakage from the more permeable lavas
and diverts groundwater flow laterally to the Camp Polk Springs. As a result of
permeability contrasts between glacial outwash, the McKinney Butte lavas, and the
Deschutes Formation ash-flow tuff, the saturated outwash and intercalated lavas west
of McKinney Butte act as a head-dependent recharge boundary for the Camp Polk
Springs.
Groundwater Flow to the McKinney Butte Springs
The McKinney Butte Springs discharge groundwater that is depleted in heavy
isotopes of O and H and that is transporting geothermal heat. These factors suggest
intermediate- or regional-scale groundwater supplies a substantial fraction of the flow
to the springs. However, the McKinney Butte Springs are not as depleted in O and H
isotopes as the Regional Springs, potentially indicating minor contribution from
locally recharged, shallow groundwater flow that is enriched in isotopes of O and H
relative to the Regional Springs.
Interpretation of the flow paths followed by groundwater that discharges from
the McKinney Butte Springs is also complicated by the fact that the water is carrying
geothermal heat. In the upper Deschutes Basin, groundwater carrying geothermal heat
has been interpreted to circulate deep in the flow system (James, 1999; James et al.,
2000; Gannett et al., 2003). The fact that water discharging from the springs carries

154
geothermal heat indicates that upward migration of deep groundwater, presumably
along local geologic faults, is occurring.
The low-permeability ash-flow tuff that impedes downward groundwater
leakage from the shallow part of the system may also inhibit upward groundwater
migration from the deeper part of the flow system and divert groundwater laterally to
the McKinney Butte Springs. Evidence for this is provided on the driller’s log for the
Lamb Well (DESC 54659). On the log, sandstone is identified at a depth of 44.5 m
below land surface. Well drillers working in the Deschutes Basin have commonly
misidentified tuffs as sandstone (Lite, personal communication, 2011). Consequently,
the sandstone recorded on the log is probably the same ash-flow tuff (Tp) shown on
Figure 5. The water-bearing zone in the well occurs below the ash-flow tuff (49-58 m
below land surface) and the average water level is approximately 30 m below land
surface. The water level in the well is 19 m above the water-bearing zone indicating
confined conditions. Confining pressures in the Lamb Well may indicate that the
upward migration of groundwater is impeded locally by the low-permeability ash-flow
tuff.
The McKinney Butte Springs occur along a southern extension of the structural
trend that forms the eastern margin of the High Cascade graben and is responsible for
the substantial amount of groundwater discharged at Metolius Spring. Previous
research has shown that Metolius Spring contains geothermal heat, and magmatically
derived carbon and helium-3 (James, 1999), indicating that water discharged at the
spring has circulated deep in the groundwater flow system and migrated vertically up

155
the Green Ridge fault escarpment (Gannett et al., 2003). The hydrochemical
characteristics of the Metolius Spring sample analyzed during the current study are
very similar to those of the McKinney Butte Springs. Water temperatures measured in
Frank Springs and Metolius Spring in January 2008 were identical (8.9 °C, Table 11)
and EC measured on the same date only differed by 1 µS/cm (62 µS/cm in Frank
Spring and 63 µS/cm in Metolius Spring). Major ion and stable isotope concentrations
in both springs are also very similar (Table 12). Additionally, both springs discharge
water carrying geothermal heat (Table 21). The striking hydrochemical similarities
between Metolius Spring and the McKinney Butte Springs and the fact that both occur
in a part of the basin where regional-scale groundwater discharge is not expected
suggest that the geologic factors controlling groundwater discharge at the springs are
related, and that deep, regional-scale groundwater flow migrates vertically up faults
bounding McKinney Butte and discharges from the McKinney Butte Springs.
The major difference between Metolius Spring and the McKinney Butte
Springs is in the magnitude of their discharge. Discharge from Metolius Spring ranges
from approximately 2-3 m3/s (Table 12) and is one order of magnitude greater than
discharge from the McKinney Butte Springs (~0.20 m3/s, Table 17). Additionally,
Metolius Spring discharges a substantial fraction of groundwater in a 400 km2
drainage basin, whereas the majority of groundwater in the McKinney Butte Spring’s
drainage basin discharges in the regional discharge area near the confluence of the
Deschutes, Crooked, and Metolius Rivers and only a small fraction surfaces at the
McKinney Butte Springs.

156
The reason for the substantial difference in discharge between springs that
occur along the same structural trend could be explained by differences in the size of
the faults that occurs near each spring. Metolius Spring occurs along the Green Ridge
fault, which has experienced at least 1 km of down-to-the-west displacement (Sherrod
et al., 2004). In contrast, vertical offset on the Tumalo fault at McKinney Butte is less
than 100 m (Sherrod et al., 2004). The greater offset at Green Ridge may provide more
preferential pathways for the upward movement of deeply circulating groundwater
than at McKinney Butte.
Conceptual Groundwater Flow Model
The conceptual model presented here considers the interpretations from
horizontal and vertical groundwater flow presented previously in this section as well
as interpretations from the Source of McKinney Butte and Camp Polk Springs section
presented earlier in this chapter. A cross section of the proposed conceptual model is
presented in Figure 47.
Groundwater supplying the McKinney Butte Springs is recharged high on the
flanks of the Cascades, follows deep flow paths, and flows upward along preferential
pathways provided by the faults bounding McKinney Butte where it discharges from
the McKinney Butte Springs. Local and regional scale groundwater may mix near
McKinney Butte; and if this occurs, the regional-scale portion of flow is interpreted to
be recharged at very high elevations in the Cascades. If the proposed conceptual
model properly describes groundwater flow through the study area, upward head

157
gradients must occur near McKinney Butte. As shown in Figures 26 and 27, upward
head gradients were not identified in the study area. In fact, with the exception of a
limited zone in the regional discharge area near the confluence of the Deschutes,
Crooked, and Metolius Rivers, upward head gradients have not been encountered in
the upper Deschutes Basin (Gannett et al., 2001). The lack of observed upward
gradients in the study area does not preclude their existence, as they may be limited to
a laterally narrow zone that is not penetrated by many wells. As previously discussed,
confining pressures in the Lamb Well may indicate upward groundwater flow locally.
However, only one water-bearing zone was encountered in the well, so vertical
gradients could not be identified. Although upward gradients were not observed, the
gradient decrease on the east edge of McKinney Butte indicates the convergence of
shallow and deep groundwater flow paths.

Elevation, in meters
Wat
er T
able
Geo
ther
mal
hea
tLo
w P
erm
eabi
lity
Rock
560-
3480
mm
per
year
rech
arge
100-
560
mm
per
year
rech
arge
Less
than
100
mm
per
yea
rre
char
ge
Ó ÓÓÓ
Hig
h Pe
rmea
bilit
yG
laci
al O
utw
ash
Indian Ford Creek
Whychus Creek
Deschutes River
Crooked River
Sea
Leve
l
500
1000
1500
2000
2500
Not
to s
cale
F
igu
re 4
7. P
rop
osed
con
cept
ual
mod
el f
or g
rou
nd
wat
er f
low
th
roug
h t
he
stu
dy a
rea.
Th
e fa
ult
s bo
un
din
g M
cKin
ney
Bu
tte
not
only
jux
tapo
se
mat
eria
l of
con
tras
tin
g p
erm
eabi
lity,
th
ey a
lso
pro
vid
e a
pre
fere
nti
al p
ath
way
to
the
surf
ace
for
a sm
all a
mou
nt
of d
eep
gro
un
dw
ater
flo
w. M
uch
of
th
e gr
oun
dwat
er d
isch
arge
d a
t th
e M
cKin
ney
Bu
tte
Sp
rin
gs h
as c
ircu
late
d d
eep
in t
he
flow
sys
tem
.
158

159
Chapter 7 – Summary and Conclusions
This study has investigated the hydrologic and geochemical characteristics of
springs and streams in the McKinney Butte area of the upper Deschutes Basin in order
to gain an understanding of the local hydrologic system and examine the effects the
McKinney Butte Springs have on Whychus Creek. In particular this study had the
following objectives: 1) quantify the magnitude and seasonal variation of flow from
the McKinney Butte Springs; 2) quantify the relative contribution of the spring flow to
the total flow of Whychus Creek on a seasonal basis; 3) determine the thermal impact
of spring flow on Whychus Creek; 4) identify the source(s) of spring water via the
hydrochemistry of the McKinney Butte Springs and local surface waters; and 5)
develop a conceptual groundwater-flow model that accounts for the spatial and
temporal distribution of discharge, hydraulic head, chemistry, and temperature within
the geologic framework of the area.
Discharge from the McKinney Butte Springs was estimated via seepage runs
on Whychus Creek, and mixing models that employed electrical conductivity (EC)
and temperature data measured in the springs and Whychus Creek. Uncertainty
associated with each method was quite large and ranged from 28% to 66% for seepage
runs, 26% to 31% for electrical conductivity, and 16% for temperature. However,
discharge calculated via each method were generally in agreement and a likely range
for discharge from the McKinney Butte Springs is 0.10 - 0.30 m3/s. Little seasonal
variation in the McKinney Butte Springs was discernable. Estimated discharge from

160
seepage runs varied from 0.141 m3/s on 06/25/2007 to 0.201 m3/s on 01/30/2008, a
total variation of 0.06 m3/s, while even less variation was estimated from EC and
temperature data.
The contribution of discharge from the McKinney Butte Springs to Whychus
Creek was estimated on daily and monthly bases from 01/2006 to 02/2008. Estimated
monthly contributions ranged from 3-7% during winter months and from 24-46%
during later summer months. Daily contributions ranged from 1% to 59%. These
calculated contributions indicate discharge from the McKinney Butte Springs
represents a significant fraction of flow in Whychus Creek during certain times of the
year.
The McKinney Butte Springs discharge groundwater that has a stable
temperature of approximately 9 ºC and only varies by ±0.3 ºC. As a result, the springs
act as a thermal buffer locally. The thermal effect from the springs is greatest when
discharge in Whychus Creek is low and when the temperature in the creek is either
much greater or much less than the temperature of the springs. These two conditions
are usually met in late summer, when creek temperatures are high. As mentioned in
the Introduction Chapter, Whychus Creek is a ODEQ 303(d) listed stream for
exceeding the maximum allowable temperature for salmon rearing and spawning.
Because the McKinney Butte Springs lower temperature water, they potentially offer
aquatic species thermal refuge during hot summer months. However, temperature
regulation is also important in the winter; small fry were observed in the Frank

161
Springs outflow channel in January 2008 when the spring temperature was 8.85 ºC
and the temperature in Whychus Creek was 0.90 ºC.
Multiple scales of groundwater flow contribute to discharge from springs on
McKinney Butte. Groundwater discharged at the McKinney Butte Springs was
recharged at high elevations on the flanks of the Cascades and has experienced some
geothermal warming, indicating it has circulated deeper in the groundwater flow
system than water discharged from the Camp Polk Springs. However, shallow
groundwater may contribute to discharge from the McKinney Butte Springs.
Additionally, general chemistry indicates the springs show little to no effect of
anthropogenic sources. Conversely, water discharged from the Camp Polk Springs,
located 2-3 km downstream, was recharged at lower elevations, shows no signs of
geothermal warming, and has elevated concentrations of the anthropogenically
influenced ions NO3, SO4, and Cl.
The occurrence of springs along McKinney Butte is controlled by faulting
related to the structural trend that forms the eastern margin of the High Cascades
graben. The Camp Polk Springs are the result of permeability contrasts between
Pleistocene glacial outwash deposited in the down-dropped structural basin on the
west side of the butte, Pliocene lavas that form McKinney Butte, and the Miocene ash-
flow tuff that underlies the butte. Groundwater flow through the outwash is impeded at
the contact with less permeable McKinney Butte lavas, resulting in shallow water
table elevations on the west side of the butte. Vertical groundwater flow through the
McKinney Butte lavas is impeded by the less permeable ash-flow tuff that underlies

162
the butte. As a result, groundwater flows laterally and discharges at the Camp Polk
Springs.
A significant fraction of groundwater discharged at the McKinney Butte
Springs has migrated vertically up faults of the Sisters fault zone that bound
McKinney Butte. The hydrochemistry of the McKinney Butte Springs is very similar
to Metolius Spring suggesting the same geologic mechanisms control groundwater
discharge at both springs. The large difference in the amount of water discharging
from Metolius Spring (2-3 m3/s) and the McKinney Butte Springs (~0.20 m3/s) may be
related to the size of the faults controlling their occurrence. Metolius Spring is located
at the base of Green Ridge which has experienced at least 1 km of vertical
displacement, while displacement on the Tumalo fault, which controls discharge from
the McKinney Butte Springs is less than 100 m (Sherrod et al., 2004).

163
References Cited
Allen, J.E., 1966, The Cascade Range volcano-tectonic depression of Oregon, in Transactions of the Lunar Geological Field Conference, Bend, Oregon, August 1965: Oregon Department of Mineral Industries, p. 21-43.
Armstrong, R.L., Taylor, E.M., Hales, P.O., and Parker, D.J., 1975, K-Ar dates for volcanic rocks, central Cascade Range of Oregon: Isochron/West, no. 13, p. 5-10.
Baldwin, E.M., 1981, Geology of Oregon (3rd ed.): Dubuque, Iowa, Kendall/Hunt Publishing Company, 170 p.
Black Butte Ranch, 2010, Black Butte Ranch fees and rates schedule 2010, http://filelibrary.myaasite.com/Content/2/2499/32183051.pdf, site accessed April 11, 2011.
Blackwell, D.D., and Priest, G.R., 1996, Rates and patterns of groundwater flow in the Cascade Range volcanic arc and the effect on subsurface temperatures: Comment: Journal of Geophysical Research, v. 101, p. 17561-17568.
Bortolami, G.C., Ricci, B., Susella, G.F., Zuppi, G.M., 1978, Isotope hydrology of the Val Corsaglia, Maritime Alps, Piedmont, Italy, In: IAEA Staff (Editors), Isotope Hydrology, 1978, v. 1, IAEA, Vienna, p. 327-350.
Brown, J., Wyers, A., Aldous, A., and Bach, L., 2007, Groundwater and biodiversity conservation: a methods guide for integrating groundwater needs of ecosystems and species into conservation plans in the Pacific Northwest: The Nature Conservancy, 176 p.
Caldwell, R.R., and Truini, M., 1997, Ground-water and water-chemistry data for the upper Deschutes Basin, Oregon: U.S. Geological Survey Open-File Report 97–197, 77 p.
Caldwell, R.R., 1998, Chemical study of regional ground-water flow and ground-water/surface-water interaction in the upper Deschutes Basin, Oregon: U.S. Geological Survey Water-Resources Investigations Report 97–4233, 49 p.
Camp, V.E., and Ross, M.E., 2004, Mantle dynamics and genesis of mafic magmatism in the intermontane Pacific Northwest: Journal of Geophysical Research, v. 109, B08204, doi:10.1029/2003JB002838, 2004.\
Canter, L.W., and Knox, R.C., 1985, Septic tank system effects on ground water quality: Chelsea, Michigan, Lewis Publications, Inc., 336 p.

164
Carter, R.W., and Anderson, I.E., 1963, Accuracy of current-meter measurements: American Society of Civil Engineers Journal, v. 97, no. HY4, p. 105-115.
Chitwood, L., 1999, One-year study of water quality in the Metolius Basin, Oregon, 1996-1997: Deschutes National Forest, 15 p.
Clark, I., 1987, Groundwater resources in the Sultanate of Oman: Origin, circulation times, recharge processes, and paleoclimatology: Unpublished doctoral thesis, Université de Paris-Sud, Orsay, France.
Clark, I., and Fritz, P., 1997, Environmental isotopes in hydrogeology: New York, Lewis Publishers, 352 p.
Clark, I.D., Fritz, P., Michel, F.A., and Souther, J.G., 1982, Isotope hydrology and geothermometry of the Mount Meager geothermal area: Canadian Journal of Earth Science, v. 19, p. 1454-1473.
Coleman, M.L, Shepherd, T.J., Durham, J.J., Rouse, J.E., and Moore, G.R., 1982, Reduction of water with zinc for hydrogen isotope analysis: Analytical Chemistry, v. 54, p. 993-995.
Conrey, R.M., 1985, Volcanic stratigraphy of the Deschutes Formation, Green Ridge to Fly Creek, North-Central Oregon. MS Thesis. Oregon State University, Corvallis, 349 p.
Craig, H., 1961, Isotopic variations in meteoric waters: Science, v. 133, p. 1702-1703.
Craig, H., and Gordon, L., 1965, Deuterium and Oxygen-18 variation in the ocean and the marine atmosphere, In: E. Tongiori (Ed.), Stable Isotopes in Oceanographic Studies and Paleotemperatures, Spoleto, 1965.
Cramer, S.P., and Beamesderfer, R.C.P., 2006, Population dynamics, habitat capacity, and a life history simulation model for steelhead in the Deschutes River, Oregon. Prepared for PGE, Portland, OR. Prepared by S.P. Cramer & Associates, Inc. Portland, OR. 195 p.
Criss, R.E., 1999, Principles of Stable Isotope Distribution: New York, Oxford University Press, 254 p.
De Loach, R.J.H., 1921, Fertilizers for golf courses: Bulletin of Green Section of United States Golf Association, v. 1, no. 9, p. 186-187.
Draper, D.S., 1991, Late Cenozoic bimodal magmatism in the northern Basin and Range Province of southeastern Oregon: Journal of Volcanology and Geothermal Research, v. 47, p. 299-328.

165
DuBois, J.D., and Flück, J., 1984, Utilization of geothermal resources of the Baden area: Swiss National Energy Foundation, NEFF 165-1B-032, Basel.
Easterbrook, D.J., 1986, Stratigraphy and chronology of Quaternary deposits of the Puget Lowland and Olympic Mountains of Washington and the Cascade Mountains of Washington and Oregon in Sibrava, V., Bowen, D.Q., and Richmond, G.M., eds., Quaternary glaciations in the northern hemisphere: Oxford, Pergamon Press, p. 145-159.
Epstein S., and Mayeda, T., 1953, Variation of 18O content of waters from natural sources: Geochimica et Cosmochimica Acta, v. 4, p. 213-224.
Evans, W.C., Mariner, R.H., Ingebritsen, S.E., Kennedy, B.M., van Soest, M.C., and Huebner, M.A., 2002, Report of hydrologic investigations in the Three Sisters area of central Oregon, summer 2001: U.S. Geological Survey Water-Resources Investigations Report 02–4061, 13 p.
Evans, W.C., van Soest, M.C., Mariner, R.H., Hurwitz, S., Ingebritsen, S.E., Wicks Jr., C.W., Schmidt, M.E., 2004, Magmatic intrusion west of Three Sisters, central Oregon, USA: the perspective from spring geochemistry: Geology, v. 32; no. 1; p. 69-72.
Faure, G., 1986, Principles of isotope geology (2nd ed.): New York, Wiley, 589 p.
Fontes, J., and Olivry, J.C., 1977, Gradient istopique entre 0 et 4000 m dans les précipitations du Mount Cameroun: Comtes Redus Réunion Annuelle Sciences de la Terre, Société géologie française, Paris.
Friedman, E., Benson, C., Gleason, J., Warden, A., and Harris, J.M., 1992, Stable isotope composition of waters in southeastern California 1. Modern precipitation: Journal of Geophysical Research, v. 97, p. 5795-5812.
Friedrichsen, P.T., 1996, Summertime stream temperatures in the north and south forks of the Sprague River, South Central Oregon. MS thesis. Oregon State University, Corvallis, 147 p.
Gannett, M.W., and Lite, K.E., Jr., 2004, Simulation of regional ground-water flow in the upper Deschutes Basin, Oregon: U.S. Geological Survey Water-Resources Investigations Report 03–4195, 84 p.
Gannett, M.W., Lite, K.E., Jr., Morgan, D.S., and Collins, C.A., 2001, Ground-water hydrology of the upper Deschutes basin, Oregon: U.S. Geological Survey Water-Resources Investigations Report 00–4162, 77 p.

166
Gannett, M.W., Manga, M., and Lite, K.E., Jr., 2003, Groundwater hydrology of the upper Deschutes Basin and its influence on streamflow, In: A Peculiar River: Geology, Geomorphology, and Hydrology of the Deschutes River, Oregon, Water Science and Application Series, vol. 7, edited by J.E. O’Conner and G.E. Grant, p. 31-49, American Geophysical Union, Washington, D.C.
Hem, J.D., 1985, Study and interpretation of the chemical characteristics of natural water: U.S. Geological Survey Water Supply Paper 2254, 263 p.
Henshaw, F.F., Lewis, J.H., and McCaustland, E.J., 1914, Deschutes River, Oregon, and its utilization: U.S. Geological Survey Water Supply Paper 344, 200 p.
Herschy, R.W., 1971, The magnitude of errors at flow measurement stations: Water Resources Board, Reading Bridge House, Reading, Berkshire, England, TN11, (Revised), 30 p.
Hildreth, W., 2007, Quaternary magmatism in the Cascades; geologic perspectives: U.S. Geological Survey Professional Paper 1744, 125 p.
Hinkle, S.R., Böhlke, J.K., Duff, J.H., Morgan, D.S., and Weick, R.J., 2007, Aquifer-scale controls on the distribution of nitrate and ammonium in ground water near LaPine, Oregon, USA: Journal of Hydrology, v. 333, p. 486-503.
Hughes, S.S., and Taylor, E.M., 1986, Geochemistry, petrogenesis, and tectonic implications of central High Cascade mafic platform lavas: Geological Society of America Bulletin, v. 97, p. 1024-1036.
Ingebritsen, S.E., Mariner, R.H., Cassidy, D.E., Shepherd, L.D., Presser, T.S., Pringle, M.K.W., and White, L.D., 1988, Heat-flow and water-chemistry data from the Cascade Range and adjacent areas in North-Central Oregon: U.S. Geological Survey Open-File Report 88–702, 205 p.
Ingebritsen, S.E., Sherrod, D.R., and Mariner, R.H., 1989, Heat flow and hydrothermal circulation in the Cascade Range volcanic arc, and the effect of subsurface temperatures: Journal of Geophysical Research, v. 97, p. 4599-4627.
Ingebritsen, S.E., Sherrod, D.R., and Mariner, R.H., 1992, Rates and patterns of groundwater flow in the Cascade Range volcanic arc, and the effects on subsurface temperature: Journal of Geophysical Research, v. 97, p. 4599-4627.
Ingebritsen, S.E., Mariner, R.H., and Sherrod, D.R., 1994, Hydrothermal systems of the Cascade Range, north-central Oregon, U.S. Geological Survey Professional Paper 1044–L, 86 p.

167
Ingraham, N.L., Lyles, B.F., Jacobsen, R.L., and Hess, J.W., 1991, Stable isotope study of precipitation and spring discharge in southern Nevada: Journal of Hydrology, v. 125, p. 243-258.
Jacob, H., and Sonntag, C., 1991, An 8-year record of the seasonal variation of 2H and 18O in atmospheric water vapor and precipitation in Heidelberg, Germany: Tellus, v. 43, p. 291-300.
James, E.R., 1999. Isotope tracers and regional-scale groundwater flow: application to the Oregon Cascades. MS thesis. University of Oregon, Eugene, 150 p.
James, E.R., Manga, M., and Rose, T.P., 1999, CO2 degassing in the Oregon Cascades: Geology, v. 27, no. 9, p. 823-826.
James, E.R., Manga, M., Rose, T.P., and Hudson, G.B., 2000, The use of temperature and the isotopes of O,H,C, and noble gases to determine the pattern and spatial extent of groundwater flow: Journal of Hydrology, v. 237, p. 100-112.
Kendall, C., and McDonnell, J., 1998, Isotope tracers in catchment hydrology: Amsterdam, The Netherlands, Elsevier Science B.V., 839 p.
Lite, K.E., Jr., and Gannett, M.W., 2002, Geologic Framework of the Regional Ground-Water Flow System in the Upper Deschutes Basin, Oregon: U.S. Geological Survey Water-Resources Investigations Report 02–4015, 44 p.
Manga, M., 1996, Hydrology of spring-dominated streams in the Oregon Cascades: Water Resources Research, v. 32, no. 8, p. 2435-2439.
Manga, M., 1997, A model for discharge in spring-dominated streams and implications for the transmissivity and recharge of Quaternary volcanics in the Oregon Cascades: Water Resources Research, v. 33, p 1813-1822.
Manga, M., 1998, Advective heat transport by low-temperature discharge in the Oregon Cascades: Geology, v. 26, p. 799-802.
Manga, M., 2001, Using springs to study groundwater flow and active geologic processes: Annual Review of Earth and Planetary Science, v. 29, p. 201-228.
Manga, M., and Kirchner, J.W., 2004, Interpreting the temperature of water at cold springs and the importance of gravitational potential energy: Water Resources Research, v. 40, W05110, doi:10.1029/2003WR002905, 8 p.
McClaughry, J.D., Gordon, C.L., and Ferns, M.L., 2009a, Field trip guide to the middle Eocene Wildcat Mountain caldera, Ochoco National Forest, Crook County, Oregon: Oregon Geology, v. 69, no. 1, p. 5-24.

168
McClaughry, J.D., Ferns, M.L., Gordon, C.L., and Patridge, K.A., 2009b, Field trip guide to the Oligocene Crooked River caldera, central Oregon’s supervolcano, Crook, Deschutes, and Jefferson Counties, Oregon: Oregon Geology, v. 69, no. 1, p. 25-44.
Meinzer, O.E., 1927, Large springs in the United States: U.S. Geological Survey Water Supply Paper 557, 94 p.
Moser, H., and Stichler, W., 1970, Deuterium measurements on snow samples from the Alps, In: Isotope Hydrology 1970, IAEA Symposium 129, Vienna.
O'Connor, J.E., Grant, G.E., and Haluska, T.L., 2003, Overview of geology, Hydrology, geomorphology, and sediment budget of the Deschutes River Basin, Oregon, In: A Peculiar River: Geology, Geomorphology, and Hydrology of the Deschutes River, Oregon, Water Science and Application Series, vol. 7, edited by J.E. O’Conner and G.E. Grant, p. 9-31, American Geophysical Union, Washington, D.C.
Oregon Climate Service, 2008, Oregon Climate Data, http://www.ocs.orst.edu/oregon-climate-data, Site accessed January through May 2008.
Oregon DEQ, 2007, Water quality limited streams 303(d) list, http://www.deq.state.or.us/wq/303dlist/303dpage.htm, Site accessed January 2007.
OWRD, 2011a, Oregon Surface Water Data, http://apps.wrd.state.or.us/apps/sw/misc_measurements_view_only/default.aspx, Site accessed April 27, 2011.
OWRD, 2011b, Water Rights Information Database (WRIS), http://www.wrd.state.or.us/OWRD/WR/wris.shtml, Site accessed April 14, 2011.
Peck, D.L., 1964, Geological reconnaissance of Antelope-Ashwood area, north-central Oregon: U.S. Geological Survey Bulletin 1161–D, p. D1-D26.
Pelletier, P.M., 1988, Uncertainties in the single determination of river discharge: a literature review: Canadian Journal of Civil Engineering, v. 15, no. 5, p. 834-850.
Perkin Elmer, 1994, Analytical Methods for Atomic Absorption Spectrometry: The Perkin Elmer Corporation, Manual Part No. 0303-0152, release C, 300 p.

169
Priest, G.R., 1990, Volcanic and tectonic evolution of the Cascade volcanic arc, central Oregon: Journal of Geophysical Research, v. 95, no. B12, p. 19,583-15,999.
Rantz, S.E., 1982, Measurement and computation of streamflow: volume 1. measurement of stage and discharge: U.S. Geological Survey Water Supply Paper 2175, 313 p.
Robinson, P.T., 1975, Reconnaissance geologic map of the John Day Formation in the southwestern part of the Blue Mountains and adjacent areas, north-central Oregon: U.S. Geological Survey Miscellaneous Geologic Investigations Map I–872, scale 1:125000.
Robinson, P.T., Brem, G.F., and McKee, E.H., 1984, John Day Formation of Oregon–A distal record of early Cascade volcanism: Geology, v. 12, no. 4, p. 229-232.
Rose, T.P., Davisson, M.L., and Criss, R.E., 1996, Isotope hydrology of voluminous cold springs in fractured rock from an active volcanic region, northeastern California: Journal of Hydrology, v. 179, p. 207-236.
Russell, I.C., 1905, Preliminary report on the geology and water resources of central Oregon: U.S. Geological Survey Bulletin 252, 138 p.
Sauer, V.B., and Meyer, R.W., 1992, Determination of error in individual discharge measurements: U.S. Geological Survey Open-File Report 92–144, 26 p.
Schneider, V.R., and Smoot, G.F., 1976, Development of a standard rating for the Price Pygmy current meter: U.S. Geological Survey Journal of Research, v. 4, no. 3, p. 293-297.
Siegenthaler, U., and Oescher, H., 1980, Correlation of 18O in precipitation with temperature and altitude: Nature, v. 285, p. 314-317.
Sherrod, D.R., Gannett, M.W., and Lite, K.E., Jr., 2002, Hydrogeology of the upper Deschutes Basin, central Oregon: A young basin adjacent to the Cascade volcanic arc, In: Field Guide to Geologic Processes in Cascadia: Oregon Department of Geology and Mineral Industries Special Paper 36, p. 109-144.
Sherrod, D.R., and Smith, J.G., 2000, Geologic map of upper Eocene to Holocene volcanic and related rocks of the Cascade Range, Oregon: U.S. Geological Survey Geologic Investigations Map I–2569, scale 1:500,000.
Sherrod, D.R., Taylor, E.M., Ferns, M.L., Scott, W.E., Conrey, R.M., and Smith, G.A., 2004, Geologic Map of the Bend 30- × 60-Minute Quadrangle, Central Oregon: U.S. Geological Survey Geologic Investigations Series Map I–2683.

170
Smith, G.A., 1986, Stratigraphy, sedimentology, and petrology of Neogene rocks in the Deschutes Basin, central Oregon: A record of continental-margin volcanism and its influence on fluvial sedimentation in an arc-adjacent basin: Ph.D. dissertation Oregon State University, Corvallis, Oregon, 464 p.
Smith, G.A., 1991, A field guide to depositional processes and facies geometry of Neogene continental volcaniclastic rocks, Deschutes basin, central Oregon: Oregon Geology, v. 53, no.1, p. 3-20.
Smith, G.A., Snee, L.W., and Taylor, E.M., 1987, Stratigraphic, sedimentologic, and petrologic, record of late Miocene subsidence of the central Oregon High Cascades: Geology, v. 15, no. 5, p. 389-392.
Smoot, G.F., and Carter, R.W., 1968, Are individual current meter ratings necessary?: American Society of Civil Engineers Journal of the Hydraulics Division, 94 (HY2), p. 391-397.
Stanger, G., 1986, The hydrology of the Oman Mountains, Unpublished Ph.D. thesis, Open University, U.K.
Taylor, E.M., 1981, Central High Cascade roadside geology – Bend, Sisters, McKenzie Pass, and Santiam Pass, Oregon, in Johnston, D.A., and Donnelly-Nolan, J.M., eds., Guides to some volcanic terranes in Washington, Idaho, Oregon, and northern California: U.S. Geological Survey Circular–838, p. 55-83.
Taylor, E.M., 1998, Geologic map of the Henkle Butte quad, Deschutes County, Oregon: Oregon Department of Geology and Mineral Industries Geological Map Series GMS–95, 5 p.
Taylor, E.M., in preparation, Geologic map of the Sisters quad, Deschutes County, Oregon, 1:24,000.
Taylor, E.M., and Ferns, M.L., 1994, Geology and mineral resources map of the Tumalo Dam quad, Deschutes County, Oregon: Oregon Department of Geology and Mineral Industries Geological Map Series GMS–81, 5 p., 2 pls., 1:24,000.
Taylor, E.M., and Ferns, M.L., 1995, Geologic map of the Three Creek Butte quad, Deschutes County, Oregon: Oregon Department of Geology and Mineral Industries Geological Map Series GMS–81, 5 p., 2 pls., 1:24,000.
Taylor, G.H., 1993, Normal annual precipitation, State of Oregon: Corvallis, Oregon State University, Oregon Climate Service, map.

171
Tóth, J.A., 1963, A theoretical analysis of groundwater flow in small drainage basins: Journal of Geophysical Research, v. 68, no. 16, p. 4795-4812.
Waters, A.C., 1954, John Day formation west of its type locality [abs.]: Geological Society of America Bulletin, v. 65, p. 1320.
Weizu, G., and Longinelli, A., 1993, A case study on the hydrological significance of stable isotope data on alpine catchments with snow cover and glaciers, Xinjiang, China, In: Snow and Glacier Hydrology, Proceedings of the Kathmandu Symposium, IAHS Publication no. 218.
Wellik, J.M., 2008, Quaternary faulting of Deschutes County, Oregon: MS Thesis, Humboldt State University, Arcata, CA, 74 p.
YSI, 2002, YSI 556 MPS Multi Probe System Operations Manual: YSI Environmental, Yellow Springs, OH, 153 p.
Appendix A: Discharge Errors Discussion
Random Errors
Seepage run measurements were obtained using the velocity-area method
(Rantz, 1982; Sauer and Meyer, 1992). The velocity-area method of measurement
includes observations of width, depth, and velocity taken at intervals in a cross section
of a stream. Sauer and Meyer (1992) and Pelletier (1988) quantify and provide
detailed discussions of the errors and uncertainties associated with the determination
of river discharge via the velocity-area method. These errors include: 1) errors in cross
sectional area, which relate to errors in measurement of width and depth, and errors in
the assumption that the measured depth in a vertical represents the mean depth of a
segment; 2) errors in mean stream velocity, which relate to current meter errors,
vertical velocity distributions, velocity pulsations, and other factors; 3) errors
associated with the computation method; and 4) errors caused by change in stage
during the measurement, boundary effects, ice, obstructions, wind, incorrect
equipment, incorrect measuring technique, poor distribution of the measurement
verticals, carelessness, and other factors.
Theoretically, the true discharge would be an integration of the velocity and
area throughout the cross section. In practice, however, the discharge is approximated
by summing the products of the subsection areas of the stream cross section and their
respective average velocities (equation A1).
)(1
ii
N
ii vdbQ ××=
= (A1)
172

173
Where, Q is total calculated discharge (m3/s), N is the number of segments in the cross
section, bi is the width of segment i (m), di is the depth of segment i (m), and vi is the
mean velocity in segment i (m/s).
Velocities were measured with a current meter at discrete “verticals” (see
below) across the width of the stream. The principal of operation of a current meter is
based on the proportionality between the velocity of the water and the resulting
angular velocity of the meter rotor. The velocity of water at a point in a stream is
determined by counting the number of revolutions of the rotor during a measured
interval of time. Price AA and Pygmy current meters were used during this study.
These meters are used extensively by the USGS (Rantz, 1982). The Price AA meter
has a rotor 5 inches (0.127 m) in diameter, while the Pygmy meter has a 2-inch (0.051
m) diameter rotor. The Pygmy’s smaller diameter rotor more accurately measures
velocity in shallow depths (< 0.46 m). The Pygmy meter was used during most
seepage runs conducted during this study; while the AA meter was only used,
according to USGS standards, when the stream velocity was > 0.75 m/s and the stream
depth was greater than 0.46 m (these conditions were only met during the January
2008 seepage run on Whychus Creek). The current meters used in this study were
calibrated in rating tanks prior to purchase.
A vertical is defined as the vertical line in which the depth and velocity
measurements are made for the purpose of estimating the mean depth and mean
velocity for a segment of the stream cross section. The segment extends, on each side,
halfway to the adjacent vertical, if one exists, or all the way to the edge of the water.

174
In each vertical, velocity is measured at one or two points to determine the average
velocity in the vertical. Verticals are chosen so that flow in each segment of the
streamflow measurement is approximately 5 percent or less of the total flow. This
usually requires 25 to 30 verticals for each measurement (Sauer and Meyer, 1992).
Discharge measurements were performed following USGS guidelines
presented in Rantz (1982). These guidelines, dictated by stream conditions, indicate
the model of Price meter to be used, the amount of time necessary to determine the
true velocity at each point in a vertical, the number of velocity measurements
necessary to calculate the mean velocity at each vertical, and the number of verticals
in each cross section. The Pygmy meter was used when the bulk of depths at a cross
section were less than 0.46 m, while the AA meter was used at depths greater than
0.46 m. The AA meter was only used in the January 2008 seepage run on Whychus
Creek when the majority of depths of verticals were greater than 0.46 m. Rantz (1982)
identified several common methods of determining the mean velocity at each vertical.
Two common methods used by the USGS are the two-point and the six-tenths depth
methods. In the two-point method, observations are made in each vertical at 0.2 and
0.8 of the depth below the surface. The average of those two observations is taken as
the mean velocity in the vertical. When using the AA meter, the two-point method is
not used at depths less than 0.76 m because the meter would then be too close to the
water surface and to the streambed to give dependable results (Rantz, 1982). In the
six-tenths depth method, an observation of velocity made in the vertical at 0.6 of the
depth below the surface is used as the mean velocity in the vertical. The USGS uses

175
the six-tenths depth method when a Pygmy meter is being used and the depth is
between 0.09 m and 0.46 m, or when an AA meter is being used and the depth is
between 0.46 m and 0.76 m (Rantz, 1982). The depths in Whychus and Indian Ford
creeks were such that the six-tenths depths method was used for all discharge
measurements.
Two primary factors, width and depth, enter into the determination of the
cross-section area. While width errors have been considered insignificant by most
investigators (Sauer and Meyer, 1992), the uncertainty of making individual
measurements of depth is considered significant. Errors in measuring depth are related
to the composition of the streambed and the velocity of the stream. Uneven, rough
streambeds (cobbles, rocks, boulders, etc.) can cause errors in measuring the true
depth at each vertical. Depth measurements made with a rod in high velocities will
produce “pile-up” of water on the rod at the water surface; if this is not accounted for,
depth measurement errors will result. Sauer and Meyer (1992) present equations for
determining standard errors for individual depth measurements made under several
measuring conditions (Tables 1 and 2; Sauer and Meyer, 1992). Their measuring
condition C (stable streambed with uneven gravel and cobbles) applies to the
conditions in Whychus Creek, and condition B (soft streambed with silt, mud, and
muck) applies to Indian Ford Creek conditions. Equations A2 and A3 are used to
determine the approximate average standard error, in percent, attributable to individual
depth measurement errors (Sd) for conditions C and B. Sauer and Meyer (1992)
indicate the measurement errors are highly subjective and arbitrary, but they conform

as much as possible to information noted by previous investigators. Standard errors for
condition C increase with decreasing depth and range from 3 percent at 1.22 m to 20
percent at 0.15 m. Similarly, errors for condition B increase from 2.36 percent at 1.22
m to 10.36 percent at 0.15 m.
2
2
048.312
+=
DSd (A2)
2
2
524.112
+=
DSd (A3)
The primary sources of error for mean stream velocity are related to instrument
errors, velocity pulsations, and vertical velocity distribution. These topics are covered
by Smoot and Carter (1967), Schneider and Smoot (1976), and Carter and Anderson
(1963).
Price AA and Pygmy meters were used to measure velocity. Studies by Smoot
and Carter (1967) and Schneider and Smoot (1976) evaluated the error for the Price
AA meter and the Price Pygmy meter, respectively. Smoot and Carter (1968) found no
significant differences between new and used AA meters provided the meters were in
good working order. They also found no difference between meters that were
calibrated individually and meters calibrated in groups (referred to as standard
calibration). The meters used in this study have undergone standard calibration. Their
results indicate that for velocities greater than 0.7 m/s instrument error is constant at
about 0.3 percent. The standard errors for velocities from 0.076 to 0.69 m/s appear to
be logarithmically distributed and were thus used to define an equation (equation A4).
176

VSi
213.0= (A4)
Where Si is the instrument standard error, in percent, V is the mean velocity, in m/s,
and 0.213 is the regression constant. Instrument error for the Price pygmy current
meter was evaluated by Schneider and Smoot (1976). Unlike results for the AA meter,
they found that for most of the velocity range there is a significant difference between
standard rated and individually rated Pygmy meters. However, new meters show about
the same error characteristics as used meters. Additionally, their results show that for
standard calibration in the range of velocities tested (0.076 to 0.91 m/s), velocities
from 0.15 to 0.91 m/s are logarithmically distributed and are represented by equation
A5.
3.0258.1 −= VSi (A5)
Error calculated from equation 5 ranges from 2.22 percent at 0.15 m/s to 1.29 percent
at 0.91 m/s.
Water flowing in natural rivers and streams has a tendency to pulsate at any
given point. An instantaneous measurement of velocity could be very different from
the mean velocity at that point. Using data from 23 different rivers, Carter and
Anderson (1963) showed that pulsation errors vary with time of exposure and with the
observation depth. The errors are logarithmically distributed and are represented by
equation A6 for the six-tenths depth method.
28.06.16 −= TSt (A6)
177

Where, St is the standard error, in percent, for pulsation error, and T is the time of
exposure, in seconds. Using equation A6, the standard pulsation error for 40 s of
exposure time is 5.91 percent.
The determination of the mean velocity in a vertical is usually based on the
six-tenths depth method or the two-point method. Carter and Anderson (1963) used
data from 1,800 verticals taken at more than 100 stream sites to show that the standard
error, Srs, of the mean velocity in a vertical averaged about 11.2 percent for the six-
tenths depth method, and 4.3 percent for the two-point method. They also developed
equation A7 to compute the standard error due to error in the vertical velocity
distribution over an entire cross section.
N
pNSS rs
s
)1(1 −+= (A7)
Where Ss is the standard error, in percent, for the cross section, Srs is the standard
error, in percent, for a single vertical as previously defined, N is the number of
verticals in the cross section, and p is the average correlation coefficient for a cross
section. They defined the value of p as 0.04. Substituting values for Srs and p in
equation A7 yields the following equation for estimating Ss, the vertical velocity
distribution error for an entire cross section, for the six-tenths depth method (equation
A8). Inserting the number of verticals measured at each cross section during this study
yields an error 3.14 percent at N=25.
02.54.120 +=
NSs (A8)
178

As previously discussed, a discharge measurement consists of measurements
of depth and velocity at a number of verticals in a cross section, with discharge being
computed for a segment represented by a vertical, or two adjacent verticals. For this
study, discharge was calculated using the mid-section method. This method assumes
the depth and velocity for a vertical applies to a sub-area (segment) extending halfway
to the vertical on either side of the measured vertical. The assumption of linearity
and/or uniformity of depth and velocity between verticals has been studied by a
number of investigators including Carter and Anderson (1963) and Herschy (1971).
Using data from these studies, Sauer and Meyer (1992) developed the following
equation for the standard error related to horizontal distribution (equation A9).
(A9) 88.032 −= NSv
Where, Sv is the standard error related to horizontal distribution, in percent, and N is
the number of verticals in a cross section. This equation indicates that Sv is directly
related to the number of verticals used for the discharge measurement. Sv is 1.88
percent at N = 25.
Systematic Errors
All of the uncertainties mentioned thus far have been random errors, meaning
they can either be positive or negative and are randomly distributed throughout the
discharge measurement. In addition to random errors, there is the possibility of
systematic errors in the measurement of depth, width, and velocity. These are errors
caused by improperly calibrated equipment, or improper use of such equipment, so
179

that a systematic error (either positive or negative) is introduced. According to Sauer
and Meyer (1992), most investigators have stated that systematic errors are small,
generally less than 0.5 percent each for measurement of width, depth, and velocity.
Therefore, the standard errors, as used in this study, are, Ssb = 0.5 percent (for width),
Ssd = 0.5 percent (for depth), and Ssv = 0.5 percent (for velocity).
The standard error, Sq, for an individual discharge measurement can be
estimated by determining the individual component errors discussed in the preceding
paragraphs and combining them into a root-mean square error as shown in equation
A10.
22222222 )(
svsdsbvsitd
q SSSSSSN
SSS ++++++
+= (A10)
This equation assumes that each of the error terms are independent of each other. It
also assumes that the cross section is reasonably uniform so that the average values of
depth and velocity can be used (Sauer and Meyer, 1992). The number of verticals, N,
is used in equation 10 to account for the averaging effect of repeated measurements on
errors caused by depth measurements (Sd) and pulsation of velocity (St). Each of the
last three terms Ssb, Ssd, and Ssv, are assumed to be 0.5 percent, and can therefore have
that value substituted in the equation. The resulting equation for estimating discharge
error reduces to equation A11.
75.0)( 222
22
++++
+= vsi
idq SSS
N
SSS (A11)
180

181
Equation A11 was used to determine the percent error in individual measurements of
discharge on Whychus and Indian Ford creeks. Measurement variables for each
discharge measurement are presented in Table A1 and standard percent errors for each
measurement are given in Table A2.

Tab
le A
1. M
easu
rem
ent
vari
able
s fo
r lo
cati
ons
on W
hyc
hu
s an
d I
nd
ian
For
d c
reek
s.
Lo
cati
onD
ate
Ave
rage
dep
th(m
)A
vera
ge v
eloc
ity
(m/s
)A
vera
ge t
ime
of e
xpos
ure,
(s)
Nu
mb
er o
f ve
rtic
als
Met
er
Dep
thm
easu
rin
g co
ndit
ion
Why
chus
Cr
at S
iste
rs04
/16/
200
70.
460
.26
4025
Pyg
my
CW
hych
us C
r at
Wil
low
Ln.
04/1
6/20
07
0.46
0.4
440
25P
ygm
yC
Mou
th o
f R
eed
Dit
ch04
/16/
200
70.
460
.00
4025
Pyg
my
CW
hych
us C
r be
low
Ree
d D
itch
04/1
6/20
07
0.46
0.3
940
25P
ygm
yC
Why
chus
Cr
abo
ve C
hest
er s
prin
gs04
/16/
200
70.
460
.38
4025
Pyg
my
CW
hych
us C
r be
low
Che
ster
spr
ings
04/1
6/20
07
0.61
0.3
240
25P
ygm
yC
Why
chus
Cr
belo
w F
rank
spr
ings
04/1
6/20
07
0.61
0.3
640
25P
ygm
yC
Why
chus
Cr
at C
amp
Pol
k R
d.04
/16/
200
70.
610
.34
4025
Pyg
my
CIn
dian
Fo
rd C
r at
Cam
p P
olk
Rd.
04/1
6/20
07
0.61
0.1
540
25P
ygm
yB
Indi
an F
ord
Cr
at B
arcl
ay D
r.04
/16/
200
70.
000
.00
--
--
Why
chus
Cr
at S
iste
rs06
/25/
200
70.
300
.16
4025
Pyg
my
CW
hych
us C
r ab
ove
Che
ster
spr
ings
06/2
5/20
07
0.30
0.2
240
25P
ygm
yC
Why
chus
Cr
belo
w F
rank
spr
ings
06/2
5/20
07
0.46
0.2
140
25P
ygm
yC
Why
chus
Cr
at C
amp
Pol
k R
d.06
/25/
200
70.
460
.23
4025
Pyg
my
CW
hych
us C
r at
DR
C g
age
06/2
5/20
07
0.46
0.2
340
25P
ygm
yC
Indi
an F
ord
Cr
at C
amp
Pol
k R
d.06
/25/
200
70.
000
.00
--
--
Indi
an F
ord
Cr
at B
arcl
ay D
r.06
/25/
200
70.
000
.00
--
--
Why
chus
Cr
at S
iste
rs09
/21/
200
70.
460
.19
4025
Pyg
my
CW
hych
us C
r ab
ove
Che
ster
spr
ings
09/2
1/20
07
0.46
0.3
040
25P
ygm
yC
Why
chus
Cr
belo
w F
rank
spr
ings
09/2
1/20
07
0.61
0.3
240
25P
ygm
yC
Why
chus
Cr
at C
amp
Pol
k R
d.09
/21/
200
70.
610
.28
4025
Pyg
my
CW
hych
us C
r at
DR
C g
age
09/2
1/20
07
0.61
0.3
240
25P
ygm
yC
Indi
an F
ord
Cr
at C
amp
Pol
k R
d.09
/21/
200
70.
000
.00
--
--
Indi
an F
ord
Cr
at B
arcl
ay D
r.09
/21/
200
70.
000
.00
--
--
Why
chus
Cr
at S
iste
rs01
/30/
200
80.
610
.71
4025
AA
CW
hych
us C
r ab
ove
Che
ster
spr
ings
01/3
0/20
08
0.61
0.7
140
25A
AC
Why
chus
Cr
belo
w F
rank
spr
ings
01/3
0/20
08
0.76
0.6
840
25A
AC
Why
chus
Cr
at C
amp
Pol
k R
d.01
/30/
200
80.
760
.66
4025
AA
CW
hych
us C
r at
DR
C g
age
01/3
0/20
08
0.76
0.7
640
25A
AC
Indi
an F
ord
Cr
at C
amp
Pol
k R
d.01
/30/
200
80.
610
.16
4025
AA
BIn
dian
Fo
rd C
r at
Bar
clay
Dr.
01/3
0/20
08
0.00
0.0
0-
--
-
Dep
th m
easu
rem
ent c
ondi
tions
fro
m S
auer
and
Mey
er (
1992
). B
= s
oft s
trea
mbe
d w
ith s
ilt, m
ud, a
nd m
uck;
and
C =
sta
ble
stre
ambe
d w
ith
unev
en g
rave
l an
d co
bble
s.
182

Table A2. Standard error, in percent, for discharge measurement locations on Whychus and Indian Ford creeks.
Location Date Sd St Si Ss Sv Ssb + Ssd + Ssv Sq
Whychus Cr at Sisters 4/16/2007 2.44 5.91 1.88 3.14 1.88 0.75 4.40Whychus Cr at Willow Ln. 4/16/2007 2.44 5.91 1.61 3.14 1.88 0.75 4.28Mouth of Reed Ditch 4/16/2007 - - - - - - -Whychus Cr below Reed Ditch 4/16/2007 2.44 5.91 1.67 3.14 1.88 0.75 4.31Whychus Cr above Chester springs 4/16/2007 2.44 5.91 1.68 3.14 1.88 0.75 4.31Whychus Cr below Chester springs 4/16/2007 2.73 5.91 1.77 3.14 1.88 0.75 4.35Whychus Cr below Frank springs 4/16/2007 2.73 5.91 1.71 3.14 1.88 0.75 4.33Whychus Cr at Camp Polk Rd. 4/16/2007 2.73 5.91 1.74 3.14 1.88 0.75 4.34Indian Ford Cr at Camp Polk Rd. 4/16/2007 2.21 5.91 2.22 3.14 1.88 0.75 4.55Indian Ford Cr at Barclay Dr. 4/16/2007 - - - - - - -Whychus Cr at Sisters 6/25/2007 2.20 5.91 2.18 3.14 1.88 0.75 4.53Whychus Cr above Chester springs 6/25/2007 2.20 5.91 1.98 3.14 1.88 0.75 4.43Whychus Cr below Frank springs 6/25/2007 2.44 5.91 2.01 3.14 1.88 0.75 4.45Whychus Cr at Camp Polk Rd. 6/25/2007 2.44 5.91 1.96 3.14 1.88 0.75 4.43Whychus Cr at DRC gage 6/25/2007 2.44 5.91 1.96 3.14 1.88 0.75 4.43Indian Ford Cr at Camp Polk Rd. 6/25/2007 - - - - - - -Indian Ford Cr at Barclay Dr. 6/25/2007 - - - - - - -Whychus Cr at Sisters 9/21/2007 2.44 5.91 2.07 3.14 1.88 0.75 4.48Whychus Cr above Chester springs 9/21/2007 2.44 5.91 1.81 3.14 1.88 0.75 4.36Whychus Cr below Frank springs 9/21/2007 2.73 5.91 1.77 3.14 1.88 0.75 4.35Whychus Cr at Camp Polk Rd. 9/21/2007 2.73 5.91 1.84 3.14 1.88 0.75 4.38Whychus Cr at DRC gage 9/21/2007 2.73 5.91 1.77 3.14 1.88 0.75 4.35Indian Ford Cr at Camp Polk Rd. 9/21/2007 - - - - - - -Indian Ford Cr at Barclay Dr. 9/21/2007 - - - - - - -Whychus Cr at Sisters 1/30/2008 2.73 5.91 1.39 3.14 1.88 0.75 4.22Whychus Cr above Chester springs 1/30/2008 2.73 5.91 1.39 3.14 1.88 0.75 4.22Whychus Cr below Frank springs 1/30/2008 3.06 5.91 1.41 3.14 1.88 0.75 4.23Whychus Cr at Camp Polk Rd. 1/30/2008 3.06 5.91 1.43 3.14 1.88 0.75 4.24Whychus Cr at DRC gage 1/30/2008 3.06 5.91 1.37 3.14 1.88 0.75 4.22Indian Ford Cr at Camp Polk Rd. 1/30/2008 2.21 5.91 2.18 3.14 1.88 0.75 4.53Indian Ford Cr at Barclay Dr. 1/30/2008 - - - - - - - Sd = individual depth measurement standard error, St = pulsation standard error, Si = instrument standard error, Ss = cross section standard error, Sv = horizontal distribution standard error, Ssb = width measurement standard errror, Ssd = depth measurement standard error, Ssv = velocity measurement standard error, and Sq = total standard error.
Stream Discharge Variation Errors
Another potential source of error is variation in streamflow during the seepage
run. Discharge from the McKinney Butte springs was determined from the difference
in discharge at locations in Whychus Creek above and below the springs. Because
spring discharge was determined indirectly from stream discharge measurements, any
183
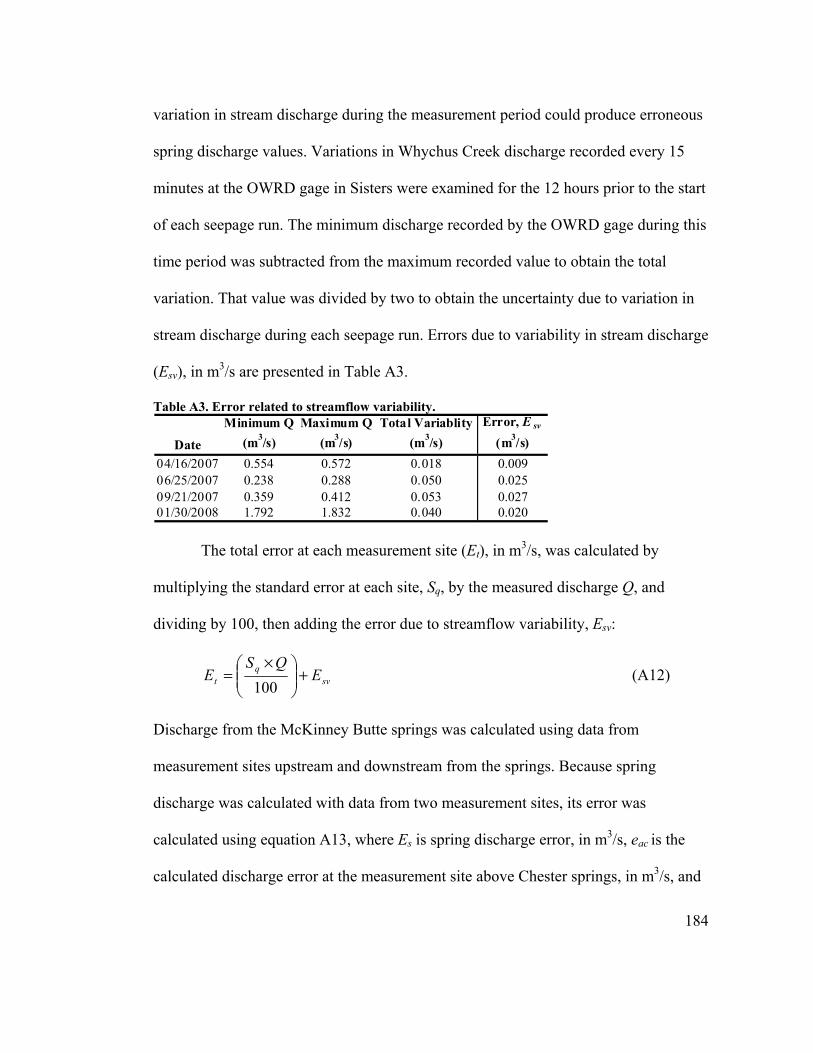
variation in stream discharge during the measurement period could produce erroneous
spring discharge values. Variations in Whychus Creek discharge recorded every 15
minutes at the OWRD gage in Sisters were examined for the 12 hours prior to the start
of each seepage run. The minimum discharge recorded by the OWRD gage during this
time period was subtracted from the maximum recorded value to obtain the total
variation. That value was divided by two to obtain the uncertainty due to variation in
stream discharge during each seepage run. Errors due to variability in stream discharge
(Esv), in m3/s are presented in Table A3.
Table A3. Error related to streamflow variability.
Date
Minimum Q
(m3/s)
Maximum Q
(m3/s)
Total Variablity
(m3/s)
Error, E sv
(m3/s)
04/16/2007 0.554 0.572 0.018 0.00906/25/2007 0.238 0.288 0.050 0.02509/21/2007 0.359 0.412 0.053 0.02701/30/2008 1.792 1.832 0.040 0.020
The total error at each measurement site (Et), in m3/s, was calculated by
multiplying the standard error at each site, Sq, by the measured discharge Q, and
dividing by 100, then adding the error due to streamflow variability, Esv:
svq
t EQS
E +
×=
100 (A12)
Discharge from the McKinney Butte springs was calculated using data from
measurement sites upstream and downstream from the springs. Because spring
discharge was calculated with data from two measurement sites, its error was
calculated using equation A13, where Es is spring discharge error, in m3/s, eac is the
calculated discharge error at the measurement site above Chester springs, in m3/s, and
184

185
ebf is the calculated discharge error at the measurement site below Frank springs, in
m3/s. The total uncertainty for each measurement site and for calculated spring
discharge is presented in the Results from Current Study section of Chapter 4.
22bfacs eeE +=
(A13)

Appendix B: General Chemistry Error Discussion
Anion and cation concentrations were measured in the Portland State
University Trace Element Analytical Laboratory using a Dionex Model 2500 ion
chromatograph and a Perkin Elmer AAnalyst 300 atomic absorption spectrometer,
respectively. Quality control samples – laboratory blanks and check standards – were
analyzed prior to analyzing samples and repeated after every 10 samples to monitor
accuracy and precision. A summary of analytical error is presented in Table B1 for
anion analysis and in Table B2 for cation analysis. Two errors and a minimum
reporting limit are presented. The first (Accuracy Error) was determined by analysis of
known standards and the second (Precision Error) represents one standard deviation
from replicate samples. The minimum reporting limit was determined from ion
concentrations measured in sample blanks and is reported as two standard deviations
greater than the mean concentration in the blanks. A minimum reporting limit is not
presented for cation analysis because concentrations in all samples were at least two
orders of magnitude greater than concentrations in field blanks. Total error for each
sample, calculated using equation B1 is presented in Table B3.
+= 100**96.1
sample
pACT C
EEE (B1)
Where ET is the total error (%), EAC is Accuracy Error (%), Ep is Precision Error
(mg/L), and Csample is the measured analyte concentration in the sample (mg/L).
186

Silica concentrations were measured in the Portland State University Trace
Element Analytical Laboratory using a Beckman Coulter DU 730 ultraviolet visible
spectrophotometer (UV-Vis). Total percent error presented in Table B3 represents two
standard deviations from the mean concentration based on triplicate analysis.
Table B1. Accuracy and precision errors associated with anion analysis.
IonAccuracyError (%)
PrecisionError (mg/L)
Min. ReportingLimit (mg/L)
Sept. and Nov. 2006 Samples
F 1.49 0.0015 0.0000Cl 4.38 0.0053 0.0520NO3 5.25 0.0018 0.0167
SO4 3.62 0.0007 0.0107
PO4 34.30 0.0095 0.3511April 2007 Samples
F 4.40 0.0019 0.0000Cl 3.32 0.0008 0.0000NO3 8.50 0.0000 0.0000
SO4 3.72 0.0015 0.0227
PO4 34.12 0.0029 0.2239June, Aug., and Sept. 2007 Samples
F 4.29 0.0035 0.0000Cl 2.69 0.0010 0.0591NO3 6.02 0.0056 0.0868
SO4 4.32 0.0031 0.0185
PO4 27.67 0.0036 0.2215January 2008 Samples
F 5.34 0.0010 0.0000Cl 8.00 0.0063 0.0399NO3 9.26 0.0919 0.1389
SO4 7.98 0.0095 0.0000PO4 33.93 0.0171 0.2685
187

188
Table B2. Accuracy and precision errors associated with cation analysis.
IonAccuracyError (%)
PrecisionError (mg/L)
Sept. and Nov. 2006 SamplesCa 5.26 0.0038K 2.40 0.0144Mg 2.19 0.0082Na 5.40 0.0227April, June, Aug., and Sept., 2007 SamplesCa 7.51 0.0180K 2.63 0.0071Mg 4.77 0.0291Na 4.62 0.0093January 2008 SamplesCa 10.99 0.1400K 1.43 0.0040Mg 0.70 0.0191Na 4.76 0.0182

Tab
le B
3. T
otal
per
cen
t er
ror
rela
ted
to
anio
n, c
atio
n, a
nd
sil
ica
anal
ysis
.
Nam
eD
ate
(mo/
d/y
r)C
alci
um
(Ca)
Mag
nes
ium
(Mg)
Sod
uim
(Na)
Pot
assi
um
(K)
Ch
lori
de
(Cl)
Su
lfat
e(S
O4)
Flu
orid
e(F
)N
itra
te(N
O3)
Sil
ica
(SiO
2)
Wh
ych
us
Cre
ekat
Sis
ters
Gag
e09
/22/
2006
11.9
85.
307.
826.
937.
943.
875.
990.
2011
/16/
2006
13.9
65.
999.
017.
987.
454.
026.
670.
8104
/07/
2007
11.8
914
.21
5.47
5.01
3.81
4.54
11.2
406
/25/
2007
12.4
515
.14
5.64
4.94
3.14
5.71
16.7
409
/21/
2007
12.8
213
.58
5.42
4.97
3.27
5.63
15.5
49.
1601
/24/
2008
35.4
429
.54
6.13
2.53
11.1
611
.85
8.31
at R
eed
Dit
ch09
/22/
2006
11.4
34.
537.
736.
517.
223.
853.
9328
.19
0.00
abov
e C
hest
er S
prin
gs04
/07/
2007
11.9
713
.90
5.37
5.19
3.82
4.56
14.0
806
/25/
2007
12.0
812
.24
5.59
5.38
3.41
5.04
16.8
709
/21/
2007
12.3
811
.45
5.40
4.90
3.24
5.35
15.0
401
/24/
2008
33.8
017
.47
6.07
2.53
10.7
711
.39
8.19
belo
w F
rank
Spr
ings
11/1
6/20
0612
.28
4.38
8.20
6.74
6.88
3.95
7.36
8.47
1.04
04/0
7/20
0711
.08
10.1
15.
224.
773.
714.
3812
.24
8.50
06/2
5/20
079.
906.
945.
073.
702.
924.
9212
.15
11.4
209
/21/
2007
10.4
97.
355.
094.
072.
955.
0812
.77
10.4
201
/24/
2008
27.7
37.
385.
782.
299.
8710
.82
7.95
149.
73
at C
amp
Pol
k R
d.11
/16/
2006
13.1
94.
968.
537.
227.
243.
997.
777.
640.
2604
/07/
2007
10.8
59.
545.
214.
763.
644.
3612
.10
06/2
5/20
079.
836.
885.
063.
902.
904.
9612
.63
09/2
1/20
0710
.63
7.48
5.08
4.03
2.95
5.12
12.5
701
/24/
2008
25.6
65.
545.
642.
219.
3710
.41
7.68
91.4
5
at D
RC
Gag
e09
/22/
2006
9.80
3.05
6.91
4.97
5.74
3.77
5.03
13.9
70.
0006
/25/
2007
9.92
6.90
5.06
3.94
2.90
4.97
12.4
109
/21/
2007
10.8
97.
405.
084.
002.
935.
1312
.67
15.5
401
/24/
2008
25.3
15.
695.
632.
219.
3410
.39
7.70
81.1
7
189

Tab
le B
3 –
con
tin
ute
d. T
otal
per
cen
t er
ror
rela
ted
to
anio
n, c
atio
n, a
nd
sil
ica
anal
ysis
.
Nam
eD
ate
(mo/
d/yr
)C
alci
um
(Ca)
Mag
nes
ium
(Mg)
Sod
uim
(Na)
Pot
assi
um
(K)
Ch
lori
de
(Cl)
Su
lfat
e(S
O4)
Flu
orid
e(F
)N
itra
te(N
O3)
Sil
ica
(SiO
2)
Ind
ian
For
d C
reek
at C
amp
Pol
k R
d.09
/22/
2006
8.69
2.77
6.63
6.31
6.63
5.77
4.24
15.0
70.
0011
/16/
2006
8.69
2.99
6.74
3.24
4.89
3.89
4.97
12.4
90.
1604
/07/
2007
9.37
7.19
5.02
4.11
3.59
5.70
9.92
8.50
01/2
2/20
0819
.88
3.36
7.37
1.91
8.65
10.2
07.
86
at B
arcl
ay D
r.11
/16/
2006
8.62
2.98
6.71
3.16
4.84
3.87
4.67
at H
wy.
20
06/2
5/20
079.
377.
455.
095.
303.
699.
2912
.34
McK
inne
y B
utte
Sp
rin
gsC
hest
er11
/16/
2006
8.27
2.58
6.17
3.72
4.91
3.72
3.70
5.53
0.12
04/0
7/20
079.
085.
804.
843.
443.
403.
967.
388.
5006
/25/
2007
9.26
5.84
4.85
3.44
2.80
4.84
10.1
47.
1009
/21/
2007
9.57
5.93
4.85
3.40
2.80
4.87
10.4
57.
3401
/24/
2008
20.2
02.
055.
211.
848.
709.
536.
8822
.78
Fran
k11
/16/
2006
8.19
2.61
6.21
3.75
4.96
3.72
3.81
5.52
0.45
04/0
7/20
079.
095.
904.
863.
473.
403.
967.
828.
5006
/25/
2007
9.20
5.92
4.87
3.41
2.81
4.87
10.5
27.
0008
/29/
2007
9.29
5.94
4.87
3.41
2.81
4.87
10.3
36.
9909
/21/
2007
9.56
5.92
4.85
3.41
2.81
4.86
10.2
57.
0001
/24/
2008
19.8
82.
115.
251.
858.
779.
636.
9624
.56
190

Nam
eD
ate
(mo/
d/y
r)C
alci
um
(Ca)
Mag
nes
ium
(Mg)
Sod
uim
(Na)
Pot
assi
um
(K)
Cam
p P
olk
Sp
rin
gsA
nder
son
09/2
2/20
067.
212.
626.
444.
32
And
erso
n at
Why
chus
Cre
ek09
/22/
2006
7.16
2.58
6.41
3.83
Cam
p P
olk
Spr
ingh
ouse
11/1
6/20
067.
022.
566.
714.
2904
/07/
2007
8.63
5.85
4.89
3.79
06/2
5/20
078.
645.
784.
903.
7409
/21/
2007
8.50
5.53
4.87
3.61
01/2
4/20
0816
.42
1.77
5.28
1.98
Oth
er S
pri
ngs
Paul
ina
08/2
9/20
0710
.12
5.91
5.11
4.13
Ald
er09
/20/
2007
9.41
5.88
4.82
3.36
Met
oliu
s01
/23/
2008
20.9
02.
045.
201.
86
Tab
le B
3 –
con
tin
ute
d. T
otal
per
cen
t er
ror
rela
ted
to
anio
n, c
atio
n, a
nd
sil
ica
anal
ysis
.
Ch
lori
de
(Cl)
Su
lfat
e(S
O4)
Flu
orid
e(F
)N
itra
te(N
O3)
Sil
ica
(SiO
2)
5.30
3.77
4.18
5.71
0.19
4.91
3.76
3.79
6.26
0.24
4.57
3.69
3.97
5.36
1.19
3.35
3.89
7.58
8.50
2.73
4.66
10.1
86.
442.
724.
5310
.42
6.27
8.22
8.60
6.92
13.8
0
3.51
10.1
931
.32
13.9
5
2.81
4.76
10.8
66.
89
8.75
10.9
77.
1211
.64
191

Ap
pen
dix
C:
Sta
ble
Iso
top
e D
ata
Tab
le C
1. δ
18O
an
d δ
2 H d
ata
for
spri
ng,
str
eam
, and
sn
ow c
ore
sam
ple
s fr
om J
ames
(19
99).
E
leva
tion
(m
)δ2 H
(‰
)δ18
O (
‰)
Ele
vati
on (
m)δ2 H
(‰
)δ18
O (
‰)
Lar
ge S
prin
gsS
mal
l Spr
ings
Bro
wns
Cre
ek13
32-1
01-1
3.8
Col
d10
36-9
8-1
3.3
Bro
wns
Cre
ek13
32-1
07-1
4C
liff
1585
-116
-15.
7B
row
ns C
reek
1332
-104
-13.
8M
owic
h16
52-1
13-1
5.8
Bro
wns
Cre
ek13
32-1
00-1
3.8
N. D
avis
Cre
ek13
23-1
03-1
4.1
Bro
wns
Cre
ek13
32-1
01-1
4.1
N. D
avis
Cre
ek13
23-1
02-1
4.1
Cul
tus
Riv
er13
56-9
7-1
4.1
Pum
ice
1664
-116
-15.
9C
ultu
s R
iver
1356
-98
-14
Sta
ms
Wel
l17
11-1
18-1
5.1
Cul
tus
Riv
er13
56-1
01-1
4.1
Tim
othy
1410
-107
-15.
4Fa
ll R
iver
1286
-111
-14.
1un
nam
ed 1
1329
-102
-13.
9Fa
ll R
iver
1286
-102
-14.
2un
nam
ed 2
1682
-98
-13.
8Fa
ll R
iver
1286
-104
-14.
8un
nam
ed 3
829
-101
-13.
6Fa
ll R
iver
1286
-110
-14.
3un
nam
ed 4
1451
-101
-13.
6H
ead
of M
etol
ius
914
-107
-14.
6C
anno
n16
75-1
16-1
6H
ead
of M
etol
ius
914
-109
-14.
8C
orra
l16
58-1
16-1
6H
ead
of M
etol
ius
914
-109
-14.
6un
nam
ed 5
1335
-98
-12
Hea
d of
Met
oliu
s91
4-1
08-1
4.6
Str
eam
sM
etol
ius
(gau
ging
sta
.)60
2-1
03-1
3.5
Cul
tus
Cre
ek (
stre
am)
1385
-85
-11
Qui
nn R
iver
1354
-101
-13.
8D
eer
Cre
ek (
stre
am)
1378
-98
-12.
6Q
uinn
Riv
er13
54-1
01-1
3.8
Wes
t of
cres
tQ
uinn
Riv
er13
54-9
9-1
3.6
Ald
er (
wes
t)10
87-8
3-1
1.5
Qui
nn R
iver
1354
-103
-13.
6un
nam
ed 8
(w
est)
268
-63
-9.8
Qui
nn R
iver
1354
-101
-13.
6un
nam
ed 9
(w
est)
280
-65
-10.
2S
now
Cre
ek13
78-1
02-1
4.1
unna
med
11
(wes
t)65
8-8
6-1
2.7
Sno
w C
reek
1378
-103
-14.
1S
prin
g C
reek
1268
-105
-14.
6L
ower
Opa
l59
7-1
14-1
5.3
192

Table C1 – Continued. δ18O and δ2H data for spring, stream, and snow core samples from James (1999).
Elevation (m) δ2H (‰) δ18O (‰) Elevation (m) δ2H (‰) δ18O (‰)
Snow Cores Snow Cores1a 2231 -115 -15.2 17 1469 -98 -12.51b 2231 -105 -14.6 17a 1469 -108 -12.91c 2231 -103 -14.1 17b 1469 -106 -13.52a 2060 -108 -14.4 17c 1469 -100 -12.42b 2060 -102 -14.3 17d 1469 -92 -10.92c 2060 -109 -14.4 18 1457 -104 -143a 1939 -115 -14.7 18a 1457 -118 -14.83b 1939 -99 -12.8 18b 1457 -107 -13.43c 1939 -107 -14.4 19 1463 -112 -14.14a 1829 -112 -14.3 20 1445 -117 -14.54b 1829 -110 -13.8 21a 1390 -112 -14.44c 1829 -103 -12.8 21b 1390 -97 -135a 2438 -106 -14.8 21c 1390 -111 -13.85b 2438 -108 -15.6 21d 1390 -105 -135c 2438 -84 -12.8 22 1366 -112 -13.96a 2292 -102 -14.9 23 1361 -116 -14.46b 2292 -129 -17.9 24 1361 -113 -14.36c 2292 -115 -16.1 25 1372 -114 -13.97a 2231 -81 -11.3 25a 1372 -113 -14.77b 2231 -102 -14.1 25b 1372 -104 -13.47c 2231 -102 -17.9 25c 1372 -107 -13.98a 2109 -113 -15.2 26 1410 -111 -13.88b 2109 -126 -16.8 26a 1410 -112 -14.88c 2109 -99 -13.9 26b 1410 -99 -139a 1859 -106 -14.1 26c 1410 -104 -13.59b 1859 -106 -14.2 27 1457 -92 -12.39c 1859 -117 -15.4 28 1457 -96 -12.7
10a 1768 -109 -14.1 29 1439 -90 -12.110b 1768 -101 -13.8 30 1439 -96 -12.410c 1768 -107 -14.5 31 1451 -100 -12.911 1561 -100 -12.7 32 1280 -99 -12.712 1561 -106 -13.4 33 1146 -92 -12.113 1561 -98 -12.6 35 1587 -122 -16.314 1554 -77 -10.7 36 1667 -113 -14.915 1463 -97 -12.4 37 1746 -106 -14.116 1469 -103 -13.5 38 1926 -107 -14
39 1585 -108 -14.1
193

Table C2. δ18O and δ2H data for spring, stream, and well samples from Ingebritsen et al. (1988).
Elevation (m) δ2H (‰) δ18O (‰)
unnamed spring 1658 -90 -12.7Sunrise Springs 1596 -97 -13.7unnamed spring 512 -111 -14.2unnamed spring 488 -104 -13.7Mt. Hood N.F. well 1676 -85 -12.3unnamed spring 1219 -95 -13.4Harvey & Jensen well 546 -101 -13.5Lichtenberger well 642 -102 -14.0Thompson well 664 -107 -13.2unnamed spring 620 -103 -12.9unnamed spring 1167 -93 -13.2Coyote Spring 832 -106 -13.7Nena Spring 814 -107 -14.5Nellie Spring 843 -105 -14.3unnamed spring 433 -104 -13.3unnamed spring 923 -99 -12.8unnamed spring 555 -117 -14.3unnamed spring 418 -110 -13.2unnamed spring 823 -103 -12.8unnamed spring 1183 -103 -14.5Seymore Springs 882 -103 -13.6unnamed spring 536 -118 -14.8unnamed stream 1999 -105 -14.2unnamed lake 2182 -100 -14.5unnamed stream 2185 -84 -12.2unnamed stream 1902 -94 -13.0Parker Creek 1658 -104 -14.7unnamed spring 1597 -100 -13.8Milk Creek 1902 -109 -14.7unnamed stream 1902 -103 -14.5unnamed stream 1686 -94 -13.4unnamed stream 1768 -96 -13.8unnamed spring 1530 -95 -13.1unnamed spring 1658 -104 -14.2Peters Spring 937 -107 -13.7unnamed spring 1878 -96 -13.2unnamed spring 1731 -97 -13.3
194

Table C2 – Continued. δ18O and δ2H data for spring, stream, and well samples from Ingebritsen et al. (1988).
Elevation (m) δ2H (‰) δ18O (‰)
Pipp Spring 689 -107 -13.6Monner Spring 850 -99 -12.3North Combs Spring 889 -116 -13.2unnamed spring 1090 -106 -12.3unnamed spring 1292 -106 -13.9Lovegren well 1061 -90 -12.7Blue Lake 1067 -93 -12.6Blue Lake 1067 -91 -12.7Blue Lake 1067 -90 -12.6Blue Lake 1067 -94 -13.0Blue Lake 1067 -92 -13.0Metolius Spring 914 -108 -14.8Clevenger well 805 -99 -13.3Cold Spring 1036 -97 -13.2Indian Ford L&C Co. w. 975 -93 -12.9unnamed spring 779 -114 -14.7well 921 -107 -13.5well 920 -106 -13.9unnamed spring 1154 -113 -13.7Melvin Spring 1329 -115 -15.0Black Pine Spring 1317 -111 -14.8well 1000 -114 -14.9Picket Spring 1214 -116 -15.0unnamed spring 2410 -116 -13.6Bull Spring 1164 -108 -14.6unnamed spring 1710 -103 -14.0unnamed spring 1710 -96 -14.0unnamed spring 1710 -96 -14.1unnamed spring 1414 -99 -14.1Kiwa Spring 1460 -114 -15.1Coyote Spring 1416 -112 -15.6unnamed spring 1372 -111 -14.2unnamed spring 1274 -112 -14.6well 1271 -109 -15.6Sand Spring 1506 -100 -9.1unnamed spring 1329 -87 -11.8
195

196
Table C3. δ18O and δ2H data for spring and well samples from Caldwell (1998).
Elevation (m) δ2H (‰) δ18O (‰)
SpringsLower Opal Springs 597 -114.0 -15.28Virgin River Springs 677 -114.0 -15.10Alder Springs 695 -111.0 -14.81Paulina Springs 1024 -92.1 -12.84Source Springs 1928 -101.0 -14.20Springs River Springs 1273 -109.0 -14.44WellsJEFF 221 547 -112.0 -13.42JEFF 231 596 -113.0 -13.58JEFF 538 901 -115.0 -14.45JEFF 164 873 -105.0 -13.62DESC 1800 1023 -92.6 -13.01DESC 1510 946 -110.0 -13.89DESC 2498 897 -95.9 -12.57DESC 2498 897 -98.2 -12.56DESC 3951 931 -115.0 -15.46DESC 4320 971 -98.8 -13.11DESC 4320 971 -98.4 -13.19DESC 4413 973 -98.5 -13.03DESC 4413 973 -99.7 -13.13DESC 4844 1045 -95.0 -12.79DESC 4844 1045 -100.0 -13.04DESC 5045 1055 -110.0 -14.66DESC 5180 1023 -96.2 -12.70DESC 5180 1023 -96.8 -12.75DESC 5750 1091 -124.0 -15.58DESC 5752 1299 -122.0 -15.65