Embed Size (px)
Citation preview

U.S. Department of the InteriorU.S. Geological Survey
Scientific Investigations Report 2015–5113
Prepared in cooperation with the Bedford County Board of Supervisors and the Virginia Department of Environmental Quality
Hydrogeology and Simulation of Groundwater Flow in Fractured-Rock Aquifers of the Piedmont and Blue Ridge Physiographic Provinces, Bedford County, Virginia

Front cover: Small waterfall on North Otter River in Bedford County, Virginia. Photograph by Don Hayes, U.S. Geological Survey.

Hydrogeology and Simulation of Groundwater Flow in Fractured-Rock Aquifers of the Piedmont and Blue Ridge Physiographic Provinces, Bedford County, Virginia
By Kurt J. McCoy, Bradley A. White, Richard M. Yager, and George E. Harlow, Jr.
Prepared in cooperation with the Bedford County Board of Supervisors and the Virginia Department of Environmental Quality
Scientific Investigations Report 2015–5113
U.S. Department of the InteriorU.S. Geological Survey

U.S. Department of the InteriorSALLY JEWELL, Secretary
U.S. Geological SurveySuzette M. Kimball, Acting Director
U.S. Geological Survey, Reston, Virginia: 2015
For more information on the USGS—the Federal source for science about the Earth, its natural and living resources, natural hazards, and the environment—visit http://www.usgs.gov or call 1–888–ASK–USGS.
For an overview of USGS information products, including maps, imagery, and publications, visit http://www.usgs.gov/pubprod/.
Any use of trade, firm, or product names is for descriptive purposes only and does not imply endorsement by the U.S. Government.
Although this information product, for the most part, is in the public domain, it also may contain copyrighted materials as noted in the text. Permission to reproduce copyrighted items must be secured from the copyright owner.
Suggested citation:McCoy, K.J., White, B.A., Yager, R.M., and Harlow, G.E., Jr., 2015, Hydrogeology and simulation of groundwater flow in fractured-rock aquifers of the Piedmont and Blue Ridge Physiographic Provinces, Bedford County, Virginia: U.S. Geological Survey Scientific Investigations Report 2015–5113, 54 p., http://dx.doi.org/10.3133/sir20155113.
ISSN 2328-031X (print)ISSN 2328-0328 (online)ISBN 978-1-4113-3965-1

iii
Contents
Acknowledgments ......................................................................................................................................viiiAbstract ...........................................................................................................................................................1Introduction.....................................................................................................................................................1
Purpose and Scope ..............................................................................................................................2Description of Study Area ...................................................................................................................2Previous Investigations........................................................................................................................4Hydrologic Data Collection ................................................................................................................5
Well Installation ...........................................................................................................................5Groundwater Data .......................................................................................................................9Borehole Logging .........................................................................................................................9Well Construction Report Compilation .....................................................................................9Streamflow Measurements ......................................................................................................9
Hydrogeology of Piedmont and Blue Ridge Aquifers ............................................................................10Hydrogeologic Units ...........................................................................................................................10
Cambro-Ordovician Metasedimentary Rocks .......................................................................14Proterozoic Basement Crystalline Rocks ..............................................................................18Late Proterozoic-Cambrian Cover Crystalline Rocks ...........................................................18
Conceptual Model of Groundwater Flow ........................................................................................19Groundwater Response to Precipitation ........................................................................................23Water Budget ......................................................................................................................................26
Inflows to Aquifer ......................................................................................................................26Precipitation ......................................................................................................................26
Estimates of Recharge from Streamflow ...............................................................................29Effluent from Septic Systems ..........................................................................................34
Outflows from Aquifer ...............................................................................................................34Water Use ..........................................................................................................................34Evapotranspiration ...........................................................................................................34Discharge to Surface Waters and Subsurface Outflow .............................................34
Simulation of Groundwater Flow ..............................................................................................................35Model Design.......................................................................................................................................36
Boundary Conditions .................................................................................................................37Hydraulic Properties .................................................................................................................39
Model Calibration................................................................................................................................41Observations ...............................................................................................................................41Model Fit ......................................................................................................................................41Parameters..................................................................................................................................42
Model Application...............................................................................................................................42Model Limitations ...............................................................................................................................42
Summary and Conclusions .........................................................................................................................45References Cited..........................................................................................................................................46Appendix 1. Borehole Geophysical Logs .................................................................................................49

iv
Figures 1. Map showing locations of stream-gaging and climate stations within the study area,
Bedford County, Virginia ..............................................................................................................3 2. Graph showing mean monthly precipitation at National Oceanic and Atmospheric
Administration climate station Bedford 4 NW 440561, 1981–2010 ........................................4 3. Map showing locations of wells within the study area, Bedford County, Virginia ............6 4. Diagram showing major hydrogeologic units, subunits, and geologic map units in
Bedford County, Virginia ............................................................................................................11 5. Map showing major hydrogeologic units and geologic map units in
Bedford County, Virginia ............................................................................................................12 6. Rose diagrams showing all linear features from selected wells in
Bedford County, Virginia ............................................................................................................13 7. Boxplots showing well characteristics by hydrogeologic unit in
Bedford County, Virginia. ...........................................................................................................14 8. Generalized conceptual model of the flow system in Blue Ridge fracture rock
aquifers in Bedford County, Virginia ........................................................................................20 9. Components of the groundwater-flow system and relative storage volumes in the
regolith and fractured-rock aquifers of the Piedmont Physiographic Province, Bedford County, Virginia ............................................................................................................21
10. Map showing groundwater levels in Bedford County, Virginia, December 2010 ............22 11. Graph showing water-level data from continuous monitoring wells and daily
precipitation from National Oceanic and Atmposheric Administration site 440561 in Bedford County, Virginia, 2009–2013 water years .............................................................24
12. Map showing average annual precipitation across Bedford County, Virginia, based on parameter-elevation regressions on independent slopes model .....................27
13. Graph showing relation of discharge measured at partial-record station 02011600 Elk Creek at Route 668 near Goode, Virginia, with concurrent mean daily discharge at long-term stream-gaging station 02061500 Big Otter River near Evington, Virginia ........................................................................................................................30
14. Map showing effective recharge as base flow calculated at partial-record stream-gaging stations in Bedford County, Virginia, 2006–2009 .......................................................31
15. Graph showing relation of discharge measured at partial-record stations in the Goose Creek Basin to concurrent mean daily discharge at long-term stream-gaging station 02059500 Goose Creek near Huddleston, Virginia ........................32
16. Graph showing relation of discharge measured at partial-record stations in the Big Otter River Basin to concurrent mean daily discharge at long-term stream-gaging station 02061500 Big Otter River near Evington, Virginia ..........................33
17. Pie charts showing water-use estimates for Bedford County, Virginia, 1985–2005 .....................................................................................................................................35
18. Map showing model domain, boundary conditions, and hydrogeologic units delineated in the Bedford County, Virginia, groundwater model .......................................36
19. Graph of section A-A’ showing thickness of model layers beneath areas with high relief, Bedford County, Virginia .................................................................................................38
20. Box plot showing distribution of hydraulic conductivity values computed from specific capacity of crystalline bedrock wells in Bedford County, Virginia .....................40
21. Three-dimensional block diagram showing model layers and hydraulic conductivity zones within model domain, Bedford County, Virginia ..................................40

v
22. Graph showing residual plots for heads in Bedford County groundwater-flow model: relation between simulated and observed values and relation between simulated values and weighted residuals ..............................................................................41
23. Graph showing residual plot for flows in Bedford County groundwater-flow model showing relation between simulated and measured values ...................................41
24. Map showing distribution of annual recharge for steady-state conditions in the Bedford County groundwater-flow model .......................................................................43
25. Map showing water table simulated for steady-state conditions by the Bedford County groundwater-flow model ..............................................................................44
26. Pie chart showing proportion of groundwater flow through major basins, Bedford County, Virginia ............................................................................................................45
Tables 1. NOAA climate stations in Bedford County, Virginia ................................................................2 2. Site information for monitoring wells in Bedford County, Virginia .......................................7 3. Streamflow measurement gages in Bedford County, Virginia ............................................10 4. Descriptive statistics of hydrogeologic parameters by rock type associated with a
selection of drilled water wells in Bedford County, Virginia ...............................................16 5. Water-level measurements from selected wells in Bedford County, Virginia..................25 6. Hydrologic budget components for select localities and basins in
Bedford County, Virginia ............................................................................................................28 7. Hydraulic properties estimated and specified in Bedford County
groundwater-flow model ...........................................................................................................38 8. Simulated water budget for Bedford County groundwater-flow model ............................45

vi
Conversion Factors and Datums
Inch/Pound to SIMultiply By To obtain
Length
inch (in.) 2.54 centimeter (cm)inch (in.) 25.4 millimeter (mm)foot (ft) 0.3048 meter (m)mile (mi) 1.609 kilometer (km)
Area
square mile (mi2) 259.0 hectare (ha)square mile (mi2) 2.590 square kilometer (km2)
Volume
gallon (gal) 3.785 liter (L) gallon (gal) 0.003785 cubic meter (m3) gallon (gal) 3.785 cubic decimeter (dm3) million gallons (Mgal) 3,785 cubic meter (m3)
Flow rate
cubic foot per second (ft3/s) 0.02832 cubic meter per second (m3/s)cubic foot per day (ft3/d) 0.02832 cubic meter per day (m3/d)gallon per minute (gal/min) 0.06309 liter per second (L/s)gallon per day (gal/d) 0.003785 cubic meter per day (m3/d)million gallons per day (Mgal/d) 0.04381 cubic meter per second (m3/s)inch per year (in/yr) 25.4 millimeter per year (mm/yr)
Pressure
atmosphere, standard (atm) 101.3 kilopascal (kPa)bar 100 kilopascal (kPa) pound per square inch (lb/in2) 6.895 kilopascal (kPa)
Specific capacity
gallon per minute per foot [(gal/min)/ft)]
0.2070 liter per second per meter [(L/s)/m]
Hydraulic conductivity
foot per day (ft/d) 0.3048 meter per day (m/d)Hydraulic gradient
foot per mile (ft/mi) 0.1894 meter per kilometer (m/km)Transmissivity*
foot squared per day (ft2/d) 0.09290 meter squared per day (m2/d)

vii
Temperature in degrees Celsius (°C) may be converted to degrees Fahrenheit (°F) as follows: °F=(1.8×°C)+32
Temperature in degrees Fahrenheit (°F) may be converted to degrees Celsius (°C) as follows: °C=(°F–32)/1.8
*Transmissivity: The standard unit for transmissivity is cubic foot per day per square foot times foot of aquifer thickness [(ft3/d)/ft2]ft. In this report, the mathematically reduced form, foot squared per day (ft2/d), is used for convenience.
Datum
Vertical coordinate information is referenced to the National Geodetic Vertical Datum of 1929 (NGVD 29).
Horizontal coordinate information is referenced to the North American Datum of 1983 (NAD 83).
Altitude, as used in this report, refers to distance above the vertical datum.

viii
Acknowledgments
The authors gratefully acknowledge the many individuals, establishments, and authorities in the county that permitted access to their wells to measure water levels during this study. The authors also thank the property owners that granted access to their property for collection of streamflow data. Special thanks are given to Frank J. Rogers, Deputy County Administrator of Bedford County, for his efforts with project logistics and support. Todd Fowler of the Bedford County Health Department provided well completion information and guidance in regards to the distribution of well yields.

AbstractAn annual groundwater budget was computed as part
of a hydrogeologic characterization and monitoring effort of fractured-rock aquifers in Bedford County, Virginia, a growing 764-square-mile (mi2) rural area between the cities of Roanoke and Lynchburg, Virginia. Data collection in Bedford County began in the 1930s when continuous stream gages were installed on Goose Creek and Big Otter River, the two major tributaries of the Roanoke River within the county. Between 2006 and 2014, an additional 2 stream gages, 3 groundwater monitoring wells, and 12 partial-record stream gages were operated. Hydrograph separation methods were used to compute base-flow recharge rates from the continuous data collected from the continuous stream gages. Mean annual base-flow recharge ranged from 8.3 inches per year (in/yr) for the period 1931–2012 at Goose Creek near Huddleston (drainage area 188 mi2) to 9.3 in/yr for the period 1938–2012 at Big Otter River near Evington (drainage area 315 mi2). Mean annual base-flow recharge was estimated to be 6.5 in/yr for the period 2007–2012 at Goose Creek at Route 747 near Bunker Hill (drainage area 125 mi2) and 8.9 in/yr for the period 2007–2012 at Big Otter River at Route 221 near Bedford (drainage area 114 mi2). Base-flow recharge computed from the partial-record data ranged from 5.0 in/yr in the headwaters of Goose Creek to 10.5 in/yr in the headwaters of Big Otter River.
A steady-state groundwater-flow simulation for Bedford County was developed to test the conceptual understanding of flow in the fractured-rock aquifers and to compute a ground-water budget for the four major drainages: James River, Smith Mountain and Leesville Lakes, Goose Creek, and Big Otter River. Model results indicate that groundwater levels mimic topography and that minimal differences in aquifer properties exist between the Proterozoic basement crystalline rocks and Late Proterozoic-Cambrian cover crystalline rocks. The Big Otter River receives 40.8 percent of the total daily groundwater outflow from fractured-rock aquifers in
Hydrogeology and Simulation of Groundwater Flow in Fractured-Rock Aquifers of the Piedmont and Blue Ridge Physiographic Provinces, Bedford County, Virginia
By Kurt J. McCoy,1 Bradley A. White,2 Richard M. Yager,1 and George E. Harlow, Jr.1
Bedford County; Goose Creek receives 25.8 percent, the James River receives 18.2 percent, and Smith Mountain and Leesville Lakes receive 15.2 percent. The remaining percent-age of outflow is attributed to pumping from the aquifer (consumptive use).
IntroductionGroundwater resources in Bedford County, Virginia
(Va.), are increasingly relied upon to supply water to local communities, industry, and individual residences. Groundwater withdrawals from fractured-rock aquifers are the primary source of water for most rural households and the majority of the county’s residents. Since 2003, more than 2,000 new wells have been permitted and drilled in Bedford County to meet the needs of individual residences (T.R. Fowler, Bedford County Health Department, oral commun., 2012). The area has a growing rural population which has expanded from approximately 38,300 residents in 1985 to 68,700 residents in 2010 (Maupin and others, 2014). To meet future water needs of individual residences, additional domestic development of these bedrock aquifers is likely. Pre-vious hydrologic work in rural areas of the central Piedmont and Blue Ridge Physiographic Provinces of Virginia is limited, and basic knowledge of aquifer systems in this area is needed to support the expanding economy and growing population of Bedford County.
From 2006 to 2014, the U.S. Geological Survey (USGS), in cooperation with the Bedford County Board of Supervisors and the Virginia Department of Environmental Quality (DEQ), collected hydrologic data in Bedford County to assess county-wide groundwater conditions and provide technical data and a scientific foundation that could be used as a basis for management and future planning of Bedford County water resources. A conceptual model of groundwater flow in Bedford County was developed based on (1) previous studies in the Piedmont and Blue Ridge fractured-rock aquifers, (2) compilation of existing data, and (3) results of new hydrologic data collected from wells and streams. Base-flow yields, general well construction information, and borehole
1U.S. Geological Survey.2Virginia Department of Environmental Quality.

2 Hydrogeology and Simulation of Groundwater Flow in Fractured-Rock Aquifers, Bedford County, Virginia
logs were summarized to support conceptualization of geologic features controlling the occurrence of groundwater in the Piedmont and Blue Ridge fractured-rock aquifers of Bedford County. A numerical model simulating groundwater flow in the aquifers was constructed as a component of this investigation to evaluate the conceptual model and estimate steady-state groundwater budgets for areas within Bedford County that drain to the Big Otter River, Goose Creek, the James River, and Smith Mountain and Leesville Lakes.
Purpose and Scope
This report provides a description of the hydrogeology and groundwater availability of the fractured-rock aquifer systems in Bedford County, Va. The primary purpose of the data collection and groundwater-flow simulation conducted as part of this study in Bedford County is to provide hydrogeo-logic information that can be used to guide the development and management of these important water resources in context of long-term aquifer inflows and outflows. The scope of this study included (1) the drilling of three new bedrock monitor-ing wells; (2) establishment of a continuous and biannual groundwater-level network; (3) continuous and partial-record measurement of stream discharge in the Big Otter River and Goose Creek Basins; and (4) borehole geophysical logging of five wells in Bedford County. Well completion reports from local and State health departments and archival State and Federal records were synthesized to document the variability in well construction and yields among hydrogeologic units.
This report also documents the development of a numerical model to synthesize all currently available data and evaluate the conceptualization of groundwater flow in the fractured-rock aquifers of Bedford County at a scale of hundreds of square miles. Extrapolation of model results to smaller-scale domains would require more hydrogeologic detail than is currently (2015) available.
Description of Study Area
Bedford County encompasses 764 square miles (mi2) in Virginia’s Piedmont and Blue Ridge Physiographic Provinces (fig. 1), two physiographic regions that extend over much of the central portion of Virginia. The two physiographic regions are defined by large topographic differences. The Piedmont is characterized by rolling and hilly terrain while the Blue Ridge has much steeper slopes. The Piedmont in Bedford County ranges in elevation from 800 feet (ft) to 2,100 ft above sea level, while elevations in the Blue Ridge are as much as 4,000 ft. The county is bounded by the Blue Ridge Mountains on the west, the James River on the northeast, Smith Mountain and Leesville Lakes on the south, and Campbell County on the east. The county contains the headwaters of Goose Creek and Big Otter River, which are major tributaries to the Roanoke River.
Bedford County has a mild climate with an average annual precipitation of 45.6 inches per year (in/yr) and a mean maximum daily temperature of 67.4 degrees Fahrenheit (PRISM Climate Group, Oregon State University, 2014). Climate station data for Bedford County were obtained from the National Oceanic and Atmospheric Administration (NOAA) National Climate Data Center (National Oceanic and Atmospheric Administration, 2014). Available precipitation data within or near Bedford County for which periods of data were available for the current normal climatological period 1981–2010 included five sites (table 1; fig. 1). Two of the sites (Holcomb Rock and Lynchburg #2) are within the James River Basin, two of the sites (Bedford 4 NW and Bedford) are within the Big Otter River Basin, and the remaining site (Huddleston 4 SW) is within the Goose Creek Basin.
Mean annual precipitation for the climatological period 1981–2010 decreases in an easterly direction, ranging from 46.5 in/yr (Holcomb Rock) to 41.5 in/yr (Lynchburg #2) (fig. 1; table 1). Mean monthly precipitation amounts among
Table 1. NOAA climate stations in Bedford County, Virginia.
[Site locations shown in figure 1. Abbreviations: ft, feet above National Geodetic Vertical Datum of 1929; NOAA, National Oceanic and Atmospheric Adminis-tration; in/yr, inches per year; NAD 83, North American Datum of 1983]
Station identification
numberStation name
Latitude (decimal degrees)
Longitude (decimal degrees)
DatumElevation
(ft)Operating
agencyPeriod of record (calendar years)1
NOAA climatological period 1981–2010
mean annual precipitation
(in/yr)
440561 Bedford 4 NW 37.380 –79.561 NAD 83 1,220 NOAA 1973–2014 44.2
440551 Bedford 37.348 –79.523 NAD 83 975 NOAA 1948–2006 45.1
444039 Holcomb Rock 37.544 –79.403 NAD 83 620 NOAA 1960–2014 46.5
444148 Huddleston 4 SW 37.126 –79.526 NAD 83 1,045 NOAA 1950–2014 42.5
445117 Lynchburg #2 37.385 –79.229 NAD 83 740 NOAA 1997–2014 41.5
1Discontinuous record and data gaps may exist within ranges of years.

Introduction 3
221
460
Town of Bedford
Terrapin RO A NO
Elk
Cre
ek
JAMES
Back
Cree
k
ROANO
*
FLAT
Creek
RIVER
SMITH MOUNTAIN LAKE Leesville
Lake
02061320
02061160
02060860
02060800
02060695
0206069202060592
02059490
02059459
02059452
02059450 02059420
02061500
02061000
02059485
02059500 #
#
#
02059500 #
V0205949079°30'
79°15'
37°30'37°30'
37°15'37°15'
37°
79°30'
79°45'
37°
0 12.5 KILOMETERS
0 15 MILESEXPLANATION
Continuous stream-gaging stationPartial-record stream-gaging stationNOAA climate station440561
440561
440551
444039
444148
445117
CAM
PBEL
L CO
UNTY
FRANKLIN COUNTY
RO
AN
OA
KE
CO
UN
TY
BOTETOURT COUNTY
ROCKBRIDGE
COUNTY
AMHERST COUNTY
City of
Lynchb
urg
FEET ABOVE NGVD 29
1,282
98
Roanoke
Rive
r
Rockcastle
Creek
MillCreek
Creek
CreekCree
k
Creek
Falli
ng
Islan
d
NiningerGoose
Creek
Enochs
Creek
Falling
Creek
Big Little
Otter
Otter
RiverRiver
Bore Auger
221
DayCreek
Cree
k
Buffa
lo
Run
Lick
Run
Roarin
g Creek
Ivy
501
CreekStony
Creek
Johnson
BEDFORD COUNTY
Matts
Creek
Hunting Creek
VV
V
V
#VV
V
V
V
V
V
V
#
#
#
Base from Esri® Data and Maps, 2008;Esri World Shaded Relief, 2014;UTM Zone 17N projectionNorth American Datum of 1983
PIEDMONT
VALLEY
AND
RIDGE
COAS
TAL
PLAI
NAPPALACHIANPLATEAUS
BLUE RIDGE
Location of Bedford County and physiographic provinces in Virginia
43
682
695 644
122
643663
622
811
4324
619
746
608
122
626
634
Figure 1. Locations of stream-gaging and climate stations within the study area, Bedford County, Virginia.

4 Hydrogeology and Simulation of Groundwater Flow in Fractured-Rock Aquifers, Bedford County, Virginia
Previous Investigations
During the mid- to late 1990s, the USGS Regional Aquifer System Analysis (RASA) Program used discharge data from surface-water basins to calculate base-flow yields and effective recharge for the Blue Ridge and Piedmont Physiographic Provinces (Rutledge and Mesko, 1996; Nelms and others, 1997; Swain and others, 2004). Rutledge and Mesko (1996) found a positive correlation between rates of recharge and base flow, or the water-yielding capacity of rocks in the Piedmont. Base-flow yields in the Piedmont, however, are lower in comparison to yields in the adjacent Valley and Ridge and Blue Ridge Physiographic Provinces (Nelms and others, 1997). By using data from the stream gage at Goose Creek near Huddleston (02059500, fig. 1) in Bedford County, mean effective recharge rates calculated by hydrograph separation techniques ranged from 10.45 in/yr during 1961–1990 (Rutledge and Mesko, 1996) to 8.40 in/yr during 1956–1984 (Nelms and others, 1997). For Big Otter River near Bedford (02061000, fig. 1), the mean effective recharge rate was 11.48 in/yr for the period 1945–1960 (Nelms and others, 1997).
Sanford and others (2012) developed a series of regres-sion equations for the entire State of Virginia to quantify components of the water budget on a watershed and locality basis, including the town of Bedford and Bedford County.
0
1
2
3
4
5
6
7
Percentage of meanannual precipitation
Meanmonthly precipitation
7.5
6.5
9.1 8.88.5 8.67.8
9.1
7.5 7.88.3
10.6
Bedford 4 NW 440561 mean annual precipitation = 44.2 in.
Mea
n m
onth
ly p
reci
pita
tion,
in in
ches
Jan. Feb. Mar. Apr. May June July Aug. Sept. Oct. Nov. Dec.
Figure 2. Mean monthly precipitation at National Oceanic and Atmospheric Administration climate station Bedford 4 NW 440561, 1981–2010.
all five climate stations are similar; the largest differences generally occur between the months of April and July. In the center of the county, the Bedford 4 NW station indicates that monthly precipitation amounts peak mid-summer with
45 percent of annual precipitation falling during May through September; generally, precipitation amounts vary only slightly from month to month (fig. 2). Mean monthly precipitation is lowest from November through February.
Groundwater recharge calculated by regression methods was 12.3 in/yr and 13.7 in/yr, respectively, for the town of Bedford and Bedford County. Their results for Bedford County indicate that 64.2 percent of average annual precipitation is lost to evapotranspiration processes or evaporation plus uptake by vegetation. Direct runoff to streams accounted for only 8.3 percent of total annual precipitation.
Heller (2008) summarized yields from public-supply wells in Virginia based on geologic province. Data indicated that public-supply wells from the Blue Ridge and Piedmont Physiographic Provinces were less likely to be high yielding (less than100 gallons per minute [gal/min]) than wells in other physiographic provinces in the State. Powell and Abe (1985) identified the major factors affecting well yields in the Piedmont of Virginia as topographic setting and the occurrence of clastic rock units; White (2012) later found topographic setting to also influence rates of recharge. In summarizing studies from the Piedmont in North Carolina and Maryland, neither Daniel and Payne (1990) nor Powell and Abe (1985) identified differences in the water-producing capacity of the various crystalline rock units in the Piedmont.
The occurrence of groundwater in crystalline rocks depends on the location and density of permeable fractures, some of which may be localized along regional structures (Keane and Gilstrap, 2011). Fracture-related heterogeneities in the Blue Ridge Physiographic Province are ubiquitous at a

Introduction 5
local scale (White, 2012) and can yield significant quantities of water if associated with faulting (Seaton and Burbey, 2005; White and Burbey, 2007). Fault zones have been observed to have permeabilities up to 6 orders of magnitude higher than the surrounding crystalline rock mass (Seaton and Burbey, 2005) and strongly control recharge processes in the Blue Ridge Physiographic Province (White and Burbey, 2007).
Lithology and structure are also important controls on groundwater yields in fractured rocks of the Piedmont Physio-graphic Province near Atlanta, Georgia (Chapman and others, 1998; Williams and others, 2005). Chapman and others (2011) studied a developed area in the Piedmont of North Carolina where annual water-level fluctuations exceeded 200 ft. Prior to development, water levels fluctuated only 15 to 50 ft. They concluded that the occurrence of intermittent dry wells during a period of drought correlated with geologic structure and a temporary loss of groundwater in storage potentially related to increased pumpage at community wells.
Much of the conceptual understanding of groundwater storage in the regolith, or weathered overburden, overlying fractured rocks of the Piedmont was developed by Heath (1984) and later expanded by Daniel and Harned (1998). White and Burbey (2007) and Seaton and Burbey (2005) characterize regolith of the Blue Ridge Physiographic Province as having significant geologic variability with confined conditions often found along a thin transition zone at the top of bedrock. The interaction of shallow water stored in the regolith with deeper fractures varies depending on the hydrologic connection from recharge to discharge zones (White and Burbey, 2007).
Hydrologic Data Collection
Various hydrologic data from Bedford County have been collected by the USGS and the DEQ since 1930. The longest period of record in the study area is at continuous stream-gaging station 02059500, Goose Creek near Huddleston, Va. Between 2006 and 2009, 12 partial-record streamflow
gaging stations, 3 continuous groundwater-level observation wells, and 2 additional continuous stream-gaging stations were instrumented to record hydrologic data. Geologic data collected from 5 wells in Bedford County and more than 2,000 well records are presented to investigate the geohydrology in Bedford County.
Well InstallationBetween May 13 and 15, 2008, monitoring wells were
drilled at three county-owned locations for the purpose of monitoring water levels in an assumed recharge area of western Bedford County (site numbers 33G 1 SOW 224, 33G 2 SOW 225, and 35H 1 SOW 226; fig. 3; table 2). All three wells were drilled as 10-inch (in.)-diameter boreholes to the depth of competent bedrock where a 6.625-in. inside-diameter black steel casing was seated, and the annulus space exterior to the casing was backfilled with a bentonite slurry to land surface. Below the casing interval, wells were completed as open boreholes drilled to various field-determined depths at which a desired yield was obtained from bedrock aquifers. Well cuttings were collected from each drill hole. Detailed lithologic descriptions were made at the site by DEQ person-nel using a hand lens and a Munsell color chart.
On October 16, 2011, well 35H 1 SOW 226 near Otterville, Va., was converted to a dual-zone groundwater monitoring well for independently monitoring hydraulic heads associated with transmissive fractures at 37 and 168 ft below land-surface datum. Interior 2-in. PVC monitoring wells were nested inside the open bedrock wellbore in a deep and shallow configuration with 10-ft sections of 0.2-in. slotted screen open to the transmissive fractures. Hydraulic heads were isolated by surrounding the screened intervals with #3 sand filter pack and placing bentonite pellets in lifts between the screened intervals of the deep and shallow 2-in. wells. Well 35H 1 SOW 226 was then discontinued, and the deep and shallow nested wells were assigned well numbers 35H 3 SOW 226A and 35H 4 SOW 226B, respectively.

6 Hydrogeology and Simulation of Groundwater Flow in Fractured-Rock Aquifers, Bedford County, Virginia
221
460
Town of Bedford
Matts
Creek
Terrapin RO A NO
Elk
Cre
ek
HuntingCreek
JAMES
Back
Cree
k
ROANO
*
FLAT
Creek
RIVER
SMITH MOUNTAIN LAKE Leesville
Lake
#
#
#
79°30'
79°15'
37°30'37°30'
37°15'37°15'
37°
79°30'
79°45'
37°
0 12.5 KILOMETERS
0 15 MILES
EXPLANATIONWell location and site number
CAM
PBEL
L CO
UNTY
FRANKLIN COUNTY
BEDFORD COUNTY
RO
AN
OA
KE
CO
UN
TY
BOTETOURT COUNTY
ROCKBRIDGE
COUNTY
AMHERST COUNTY
City of
Lynchb
urg
Roanoke
Rive
r
Rockcastle
Creek
MillCreek
Creek
CreekCree
k
Falli
ng
Islan
dNininger
GooseCree
kEnochs
Creek
Falling
Creek
Big
Little
OtterO
tter
River
River
Bore Auger
221
DayCreek
Cree
k
Buffa
lo
Run
Lick
Run
Roarin
g Creek
Ivy
501
Creek
Stony
Creek
Johnson
35J 5 36J 7
35J 4
35H 234H 6
33G 334G 3
34G 2
35G 4
36G 2
36H 1
36H 3
36H 2
36G 3
34H 4
34H 534H 734H 834H 9
34H 1034H 11
35H 1 SOW 22635H 3 SOW 226A35H 4 SOW226B
34E 3
Base from Esri® Data and Maps, 2008;Esri World Shaded Relief, 2014;UTM Zone 17N projectionNorth American Datum of 1983
43
682
695
644
643
122
663
622
811
4324
619
746
608
634
122
626
Creek
34F 1 34F 2
35G 235G 1
36G 1
36G 5
35F 1
35F 2
36G 4
Creek
34E 3
33F 2
34E 234E 1
33G 5
33G 733G 6
33G 4
33F 6
33F 333F 533F 4
32G 12
33G 2 SOW 225
33G 1 SOW 224
36G 2
PIEDMONT
VALLEY
AND
RIDGE
COAS
TAL
PLAI
NAPPALACHIANPLATEAUS
BLUE RIDGE
Location of Bedford County and physiographic provinces in Virginia
Figure 3. Locations of wells within the study area, Bedford County, Virginia.

Introduction 7
Table 2. Site information for monitoring wells in Bedford County, Virginia.
[Site locations shown in figure 3. Abbreviations: USGS, U.S. Geological Survey; DDMMSS, degrees, minutes and seconds; Elev, elevation above National Geodetic Vertical Datum of 1929; ft, feet; ft-blsd, feet below land-surface datum; --, no data reported]
Site number USGS station
numberLatitude
(DDMMSS)Longitude (DDMMSS)
Elev (ft)
Well depth
(ft-blsd)
Casing length
(ft)
Screened interval (ft-blsd)
Water level data
type Hydrogeologic unit
133G 1 SOW 224 372224079423601 372224 794236 930 101 51 -- hourly Cambro-Ordovician metasedimentary rocks
133G 2 SOW 225 372150079422301 372150 794223 1,070 201 95 -- hourly Proterozoic basement crystalline rocks
1, 2 35H 1 SOW 226 372543079295401 372543 792954 940 181 38 -- hourly Proterozoic basement crystalline rocks
35H 3 SOW 226A 372543079295402 372543 792954 940 181 -- 162–172 hourly Proterozoic basement crystalline rocks
35H 4 SOW 226B 372543079295403 372543 792954 940 50 -- 30–40 hourly Proterozoic basement crystalline rocks
32G 12 371621079482801 371621 794828 1,053 -- -- -- biannual Proterozoic basement crystalline rocks
33F 2 371019079375301 371019 793753 977 420 70 -- biannual Late Proterozoic-Cambrian cover crystalline rocks
33F 3 371136079431901 371137 794319 823 -- -- -- biannual Proterozoic basement crystalline rocks
33F 4 371138079431601 371138 794316 882 385 60 -- biannual Proterozoic basement crystalline rocks
33F 5 371139079432001 371139 794320 844 445 31 -- biannual Proterozoic basement crystalline rocks
33G 3 372106079374501 372106 793745 946 305 60 -- biannual Proterozoic basement crystalline rocks
33G 4 371538079435501 371538 794355 997 246 32 -- biannual Proterozoic basement crystalline rocks
33G 5 371508079431001 371508 794310 1,009 260 78 -- biannual Proterozoic basement crystalline rocks
33G 6 371505079431301 371505 794313 985 280 42 -- biannual Proterozoic basement crystalline rocks
1 33G 7 371503079431701 371503 794317 982 300 55 -- biannual Proterozoic basement crystalline rocks
1 34E 1 370636079370601 370636 793706 940 350 85 -- biannual Late Proterozoic-Cambrian cover crystalline rocks
34E 2 370645079341501 370645 793415 1,011 160 110 -- biannual Late Proterozoic-Cambrian cover crystalline rocks
34E 3 370522079352601 370522 793526 932 -- -- -- biannual Late Proterozoic-Cambrian cover crystalline rocks
33F 6 371252079434501 371252 794345 998 700 55 -- biannual Proterozoic basement crystalline rocks
34F 1 371330079333001 371330 793330 911 254 -- -- biannual Late Proterozoic-Cambrian cover crystalline rocks
34F 2 371237079321901 371237 793219 923 -- -- -- biannual Late Proterozoic-Cambrian cover crystalline rocks
34G 2 371634079333501 371634 793335 1,002 -- -- -- biannual Proterozoic basement crystalline rocks
34G 3 372100079345901 372100 793459 955 -- -- -- biannual Proterozoic basement crystalline rocks
34H 4 372256079303001 372256 793030 1,055 -- -- -- biannual Proterozoic basement crystalline rocks
34H 5 372531079343701 372531 793437 1,319 181 60 -- biannual Proterozoic basement crystalline rocks

8 Hydrogeology and Simulation of Groundwater Flow in Fractured-Rock Aquifers, Bedford County, Virginia
Table 2. Site information for monitoring wells in Bedford County, Virginia.—Continued
[Site locations shown in figure 3. Abbreviations: USGS, U.S. Geological Survey; DDMMSS, degrees, minutes and seconds; Elev, elevation above National Geodetic Vertical Datum of 1929; ft, feet; ft-blsd, feet below land-surface datum; --, no data reported]
Site number USGS station
numberLatitude
(DDMMSS)Longitude (DDMMSS)
Elev (ft)
Well depth
(ft-blsd)
Casing length
(ft)
Screened interval (ft-blsd)
Water level data
type Hydrogeologic unit
34H 6 372514079320801 372514 793208 1,006 450 21 -- biannual Proterozoic basement crystalline rocks
34H 7 372323079331301 372323 793313 853 450 -- -- biannual Proterozoic basement crystalline rocks
34H 8 372324079331701 372324 793317 854 413 -- -- biannual Proterozoic basement crystalline rocks
34H 9 372326079332001 372326 793320 857 500 -- -- biannual Proterozoic basement crystalline rocks
34H 10 372329079331901 372329 793319 861 450 -- -- biannual Proterozoic basement crystalline rocks
34H 11 372332079331801 372332 793318 865 500 -- -- biannual Proterozoic basement crystalline rocks
35F 1 371337079230701 371337 792307 858 305 65 -- biannual Late Proterozoic-Cambrian cover crystalline rocks
35F 2 370929079284801 370929 792848 705 320 100 -- biannual Late Proterozoic-Cambrian cover crystalline rocks
35G 1 371511079284901 371511 792849 874 -- -- -- biannual Late Proterozoic-Cambrian cover crystalline rocks
35G 2 371508079285501 371508 792855 881 240 40 -- biannual Late Proterozoic-Cambrian cover crystalline rocks
35G 3 372150079263101 372150 792631 910 -- -- -- biannual Proterozoic basement crystalline rocks
35G 4 372102079292801 372102 792928 926 -- -- -- biannual Proterozoic basement crystalline rocks
35H 2 372539079285901 372539 792859 922 206 90 -- biannual Proterozoic basement crystalline rocks
35J 4 373108079233301 373108 792333 889 305 105 -- biannual Proterozoic basement crystalline rocks
35J 5 373138079250801 373138 792508 1,056 -- -- -- biannual Proterozoic basement crystalline rocks
36G 1 371819079180501 371819 791805 871 296 -- -- biannual Late Proterozoic-Cambrian cover crystalline rocks
36G 2 372214079185501 372214 791855 811 175 67 -- biannual Late Proterozoic-Cambrian cover crystalline rocks
36G 3 372143079222501 372143 792225 852 245 52 -- biannual Proterozoic basement crystalline rocks
36G 4 371625079202301 371625 792023 816 -- -- -- biannual Late Proterozoic-Cambrian cover crystalline rocks
36G 5 371627079202501 371627 792025 845 -- -- -- biannual Late Proterozoic-Cambrian cover crystalline rocks
36H 1 372246079220901 372246 792209 892 -- -- -- biannual Proterozoic basement crystalline rocks
36H 2 372244079210401 372244 792104 900 305 53 -- biannual Proterozoic basement crystalline rocks
36H 3 372508079221401 372508 792214 1,013 -- -- -- biannual Proterozoic basement crystalline rocks
36J 7 373151079213001 373151 792130 726 -- -- -- biannual Proterozoic basement crystalline rocks
1 Denotes well with borehole geophysical log.2 Well later completed as a multiple-zone monitoring well.

Introduction 9
Groundwater Data
Pressure transducers with dataloggers were installed by the USGS in wells 33G 1 SOW 224 and 33G 2 SOW 225 and by the DEQ in well 35H 1 SOW 226, and subsequently installed by the DEQ in wells 35H 3 SOW 226A and 35H 4 SOW 226B to monitor and record water levels continuously. Water-level data were uploaded automatically via real-time satellite platforms to the USGS National Water Information System (NWIS, http://waterdata.usgs.gov/nwis) and field verified with manual tapedowns every 6 to 8 weeks.
Synoptic surveys of water levels in 47 wells (table 2; fig. 3) distributed across Bedford County were conducted during 1-week periods in December 2010 and April 2011. Water levels were measured manually with a steel tape to the nearest one-hundredth of a foot. An electric tape was substi-tuted for the steel tape in wells where the depth to water could not be successfully determined with the steel tape, typically because of moisture inside the well casing. At each visit, two water-level measurements were made, at least 5 minutes apart, to detect any short-term water-level fluctuations attributed to recent pumpage. The intent of the survey was to evaluate the seasonal water-table fluctuations across the county that coincide with periods of water-level lows in early winter and water-level highs in early spring. The water-level data were used to construct a water-level contour map for the county. Available well information was inventoried from well owner or local health department records.
Borehole Logging
Borehole geophysical logging of the three wells constructed during this study, as well as two additional wells (table 2), included caliper; ambient and pumping fluid resistiv-ity and temperature; ambient and pumping electromagnetic flow; multiparameter logs (gamma, formation resistivity); and acoustic televiewer (ATV) and borehole video. ATV, borehole video, and caliper logs were collected to characterize the loca-tions and orientation of subsurface features in the fractured bedrock aquifers. ATV logging produces a high-resolution, magnetically oriented, digital image that was used to delineate and measure orientations of fractures at depth that intersect the borehole. When used in conjunction with other logs, data from the caliper logs are diagnostic in pinpointing locations of open and transmissive fractures. Ambient and pumping electromagnetic (EM) flow and fluid resistivity and tempera-ture logs were run to ascertain the number and approximate position of transmissive fractures for four of the five wells in the study area. Gamma and formation resistivity logs were collected from all wells for evaluation of changes in rock type and formation competency adjacent to the wellbore.
Well Construction Report CompilationDigital water-well records were compiled from the
Virginia Department of Health Virginia Environmental Information System (VENIS), the Virginia Department of Health Safe Drinking Water Information System (SDWIS), the USGS Groundwater Site Inventory (GWSI), the DEQ Virginia Water Use Data System (VWUDS), and the U.S. Environmen-tal Protection Agency (EPA) Storage and Retrieval (STORET) database. The location accuracy and completeness of the water-well data vary within and among databases. Coordinate information for SDWIS public water supply wells is typically of Global Positioning System (GPS) or Differential Global Positioning System (DGPS ) quality, and location data for most of the wells originating in the GWSI and STORET databases were determined from locations using 7.5-minute quadrangles. Virginia Department of Health well data were located by assigning the coordinates for the tax parcel centroid associated with the well because original coordinate data were not given. A total of 2,140 well records were compiled and stored in a geographic information system (GIS) shapefile for geospatial analysis.
Streamflow Measurements Streamflow was measured with continuous data recorders
every 15 minutes at three gaging locations in Bedford County and one gaging location in Campbell County within the Roanoke River Basin (fig. 1; table 3). Two pre-existing stream gages—one on Goose Creek near Huddleston, Va. (02059500) and one on Big Otter River near Evington, Va. (02061500)—had been in operation since 1930 and 1936, respectively. In 2006, two additional stream gages were established as part of the current investigation—one on Goose Creek at Route 747 near Bunker Hill, Va. (02059485) and the other on Big Otter River at Route 221 near Bedford, Va. (02061000). Partial-record streamflow measurements (sites where discrete streamflow measurements were obtained over a period of time without continuous data being recorded) were also conducted at 12 sites within the county (fig. 1; table 3).

10 Hydrogeology and Simulation of Groundwater Flow in Fractured-Rock Aquifers, Bedford County, Virginia
Hydrogeology of Piedmont and Blue Ridge Aquifers
Hydrogeologic conditions and processes that control groundwater availability in the Piedmont and Blue Ridge fractured-rock aquifer systems in Bedford County were investigated by a synthesis of the literature and of data sources and analyses that are described in the following sec-tions. The rates of groundwater inflow, outflow, and volume of water stored in Piedmont and Blue Ridge aquifers are defined by the prevailing climate conditions and topography and by the complex distributions of aquifer properties in the regolith and fractured-rock parts of the aquifer.
Hydrogeologic Units
Piedmont and Blue Ridge fractured-rock aquifers within Bedford County were subdivided into three distinct hydrogeologic units following White (2012): (1) Cambro-Ordovician metasedimentary rocks, (2) Proterozoic basement crystalline rocks, and (3) Late Proterozoic-Cambrian cover crystalline rocks (figs. 4 and 5). For the Proterozoic basement crystalline rock and Late Proterozoic-Cambrian cover crystalline rock hydrogeologic units, subunits are defined by grouping geologic map units with similar metamorphic history or textural characteristics. While local
Table 3. Streamflow measurement gages in Bedford County, Virginia.
[Site locations shown in figure 1. Abbreviations: USGS, U.S. Geological Survey; DDMMSS, degrees, minutes, and seconds; mi2, square miles]
Station number
USGS station nameLatitude
(DDMMSS)Longitude
(DDMMSS)
Drainage area (mi2)
Station type Period of
record
02059485 Goose Creek at Route 747 near Bunker Hill, VA 371559 793516 125 Continuous 2007–2012
02061000 Big Otter River at Route 221 near Bedford, VA 372150 792510 114 Continuous 2007–2012
02059500 Goose Creek near Huddleston, VA 371023 793114 188 Continuous 1931–2012
02061500 Big Otter River near Evington, VA 371230 791814 315 Continuous 1938–2012
02059420 North Fork Goose Creek at Route 460 near Montvale, VA 372214 794155 31.5 Partial Record 2006–2009
02059450 South Fork Goose Creek at Route 607 at Montvale, VA 372247 794350 11.0 Partial Record 2006–2009
02059452 Goose Creek at Route 726 near Irving, VA 372122 794132 46.8 Partial Record 2006–2009
02059459 Bore Auger Creek at Route 754 near Irving, VA 371826 794040 17.6 Partial Record 2006–2009
02059490 Stony Fork at Route 608 near Moneta, VA 371236 793833 7.01 Partial Record 2006–2009
02060592 Sheep Creek at Route 688 near Thaxton, VA 372316 793653 10.3 Partial Record 2006–2009
02060692 Stony Creek at Route 43 near Peaks of Otter, VA 372334 793319 14 Partial Record 2006–2009
02060695 Big Otter River at Route 43 near Peaks of Otter, VA 372323 793305 37 Partial Record 2006–2009
02060800 North Otter Creek at Route 643 near Cifax, VA 372526 792758 25.8 Partial Record 2006–2009
02060860 Oslin Creek at Route 644 near Cifax, VA 372340 792702 12 Partial Record 2006–2009
02061160 Elk Creek at Route 668 near Goode, VA 371950 792329 41 Partial Record 2006–2009
02061320 Little Otter River at Route 715 near Otter Hill, VA 371636 792606 66.4 Partial Record 2006–2009
hydrogeologic conditions are highly variable within and across all three hydrogeologic units, these groups warrant distinction because of differences in texture and structure that can influence the storage and movement of groundwater (Daniel and Payne, 1990). The three hydrogeologic units occur within the Blue Ridge Anticlinorium, a larger geologic feature in Virginia that is composed of a stack of northeast- to southwest-striking thrust sheets (Bailey and others, 2006; Southworth and others, 2009).
Orientations of fractures and foliation (the preferential orientation of minerals and fabric in metamorphic rocks) were collected from borehole geophysical logs and plotted to describe general fracture trends of the three hydrogeologic units in the study area. Trends were assessed from borehole ATV geophysical log data collected in three wells in the Proterozoic basement crystalline rocks, one well in the Late Proterozoic-Cambrian cover crystalline rocks, and one well in the Cambro-Ordovician metasedimentary rocks (fig. 6). Foliation measurements were collected only in portions of wells that exhibited a metamorphic fabric or texture (schistosity and [or] cleavage) because of the inability of the ATV to resolve lineations present on otherwise smooth borehole wall. Fluid resistivity, fluid temperature, formation resistivity, natural gamma, EM flow, and ATV logs from the five wells are shown in Appendix 1. Several general state-ments can be made about the distribution and orientation of structural features collected from ATV logs in the study area:

Hydrogeology of Piedmont and Blue Ridge Aquifers 11
1. Fracturing in the Proterozoic basement crystalline rocks appears to be systematic at the borehole level but not at a regional scale. Similar observations have been made by workers studying fracturing at the outcrop and the regional level elsewhere in the Blue Ridge (Bailey and others, 2003; Hasty and Bailey, 2005).
2. A pervasive southeast dipping foliation can occur in bedrock wells across all hydrogeologic units. This folia-tion is more prevalent in the Late Proterozoic-Cambrian cover crystalline rocks and Cambro-Ordovician metasedimentary rocks, and fracturing related to folia-tion within these units may be a discernible regional trend.
3. Water-bearing fractures occur at a variety of orienta-tions. Notable trends in the orientation of water-bearing fractures across all hydrogeologic units are as follows:
Zam; Ashe Formation
ЄZmg; Moneta Gneiss1
ЄZmi; amphibolite
ЄZmy,ЄZas; Alligator Back Formation
ЄCa; Candler Formation of Evington Group
Єu; Unicoi Formation of Chilhowee Group
Yma; augen and flaser gneiss
Rome/Waynesboro Formation
Yhm; biotite granitoid
Ygb; biotite granofels and gneiss
Ybg; biotite-granitoid gneiss
Zsg, Zfg; granodiorite
Pzmy; mylonite
Yc, Ybc; charnockite
Ypg; layered gneiss and granulite
Zgd; granitic gneiss
HYDR
OGEO
LOGI
CUN
ITSU
BUN
ITGE
OLOG
IC M
AP U
NIT
Cambro-Ordovician metasedimentary
rocks
Proterozoic basement crystalline rocks
Late Proterozoic- Cambrian cover crystalline rocks
Piedmont and Blue Ridge Fractured Rock Aquifers of Bedford County
Volcanic ProtolithSedimentary ProtolithMassive Crystalline Rock
Foliated Crystalline Rock
1Nomenclature conforms to current usage of Virginia Division of Geology and Mineral Resources
a. Fractures parallel or subparallel to foliation (parting along foliation or schistosity).
b. Horizontal or subhorizontal water-bearing joints (sheet jointing).
c. Water-bearing fractures occurring as a component of a conjugate fracture set (tectonically induced fractures).
Similar trends have been noted in other locations along the Atlantic Seaboard by workers conducting hydrogeologic studies in crystalline rock (Chapman and others, 2005; Williams and others, 2005; Manda and others, 2008).
Figure 4. Major hydrogeologic units, subunits, and geologic map units in Bedford County, Virginia.

12 Hydrogeology and Simulation of Groundwater Flow in Fractured-Rock Aquifers, Bedford County, Virginia
Bedford County
ЄZmg
Ybg
Ybg
Ypg
Ygb
Yhm
Yhm
Yhm
Ygb
Yc, Ybc
Zgd
Base from Esri® Data and Maps, 2008;Esri World Shaded Relief, 2014;UTM Zone 17N projectionNorth American Datum of 1983
Town of Bedford
RO A NO
ROANO
*
FLAT
SMITH MOUNTAIN LAKE
#
#
#
79°30'
79°15'
37°30'37°30'
37°15'37°15'
37°
79°30'
79°45'
37°
0 12.5 KILOMETERS
0 15 MILES
EXPLANATION
Cambro-Ordovician Meta- sedimentary Rocks
Ashe Formation (Zam)Moneta Gneiss (ЄZmg)1
Amphibolite (ЄZmi)Alligator Back Formation (ЄZmy,ЄZas)Candler Formation of Evington Group (ЄCa)Unicoi Formation of Chilhowee Group (Єu)
Late Proterozoic-CambrianCover Crystalline Rocks
Augen and flaser gneiss (Yma)Biotite granitoid (Yhm)Biotite granofels and gneiss (Ygb)Biotite-granitoid gneiss (Ybg)Granodiorite (Zsg, Zfg)Mylonite (Pzmy)Charnockite (Yc, Ybc)Layered gneiss and granulite (Ypg)Granitic gneiss (Zgd)
Proterozoic BasementCrystalline Rocks
FRANKLIN COUNTY
RO
AN
OA
KE
CO
UN
TY
BOTETOURT COUNTY
ROCKBRIDGE
COUNTY
AMHERST COUNTY
City of
Lynchb
urg
CAM
PBEL
L CO
UNTY
BEDFORD COUNTY
Zam
Yhm
Yhm
Ypg
Yc, YbcYc, Ybc
Yc, Ybc
Yc, Ybc
Ygb
Ygb
Pzmy
Zsg,Zfg
Єu
Єu
Єu
ЄZmg
ЄZmi
ЄCa
ЄZmy,Є
Zas
ЄCa
ЄZmy,ЄZas
Zam
Zam
Zam
Yma
Ybg
Zgd
PEAKS
BLUE
RIDG
EFA
ULT
ROCKFISH
VALLEY
FAUL
T
BOWENS
CREEK
FAUL
T
OF OTTER FAULT
ЄZmi
UNNAMED FAULT
UNNAMED
FAULT
PIEDMONT
VALLEYAND
RIDGE
COAS
TAL
PLAI
NAPPALACHIANPLATEAUS
BLUE RIDGE
Location of Bedford County and physiographic provinces in Virginia
Fault
1Nomenclature conforms to current usage of VirginiaDivision of Geology and Mineral Resources
Figure 5. Major hydrogeologic units and geologic map units in Bedford County, Virginia. [Modified from Henika (1997).]

Hydrogeology of Piedmont and Blue Ridge Aquifers 13
Base from Esri® Data and Maps, 2008;Esri World Shaded Relief, 2014;UTM Zone 17N projectionNorth American Datum of 1983
Town of Bedford
RO A NO
ROANO
*
FLAT
SMITH MOUNTAIN LAKE
79°30'
79°15'
37°30'37°30'
37°15'37°15'
37°
79°30'
79°45'
37°
0 12.5 KILOMETERS
0 15 MILES
EXPLANATION
Cambro-Ordovician Meta- sedimentary rocks
Late Proterozoic-CambrianCover Crystalline Rocks
FRANKLIN COUNTY
RO
AN
OA
KE
CO
UN
TY
BOTE
TOU
RTCOUNTY
ROCKBRIDGE
COUNTY
AMHERST COUNTY
City of
Lynchb
urg
CAM
PBEL
L CO
UNTY
BEDFORD COUNTY
35H 235H 6
33G 334G 3
34G 2
34F 1
34F 2
35G 4
35G 235G 1
35G 335G 3
36H 1
36H 3
36H 2
36G 1
35G 336G 3
36G 5
35F 1
35F 2
36G 4
34H 4
33F 2
34E 1
33G 5
33G 733G 6
35H 534H 734H 834H 9
34H 1034H 11
35H 1 SOW 22635H 3 SOW 226A35H 4 SOW226B
33G 1 SOW 224
33G 433F 2
33F 6
33F 433F 333F 5
5
10
N
90
180
270
N
90
180
270
N
90
180
270
N
90
180
270
20
40
15
30
455
101520
Cambro-Ordovician metasedimentary rocks
Late Proterozoic-Cambrian cover crystalline rocks
Proterozoic basement crystalline rocks
EXPLANATIONHydrogeologic Units
5101520 Percent of total linear features
Fracture azimuth90270
180
N
N
90
180
270
5
10
15
33G 7
33G 1 SOW 224
33G 2 SOW 225
34E 1
35H 1 SOW 226
34E 2
34E 3
35J 536J 7
35J 4
33G 2 SOW 225
Figure 6. Rose diagrams showing all linear features from selected wells in Bedford County, Virginia. [Fracture data obtained from acoustic televiewer logs. Geology modified from Henika (1997).]

14 Hydrogeology and Simulation of Groundwater Flow in Fractured-Rock Aquifers, Bedford County, Virginia
Cambro-Ordovician Metasedimentary RocksThe Cambro-Ordovician-aged metasedimentary
rocks occur in the valleys along the north and south forks of Goose Creek in the northwestern portion of the county (fig. 5) and are exposed at land surface where erosion has removed the overlying Proterozoic basement crystalline rocks (Henika, 1981). In Bedford County, Cambro-Ordovician metasedimentary rocks are composed predominantly of the Rome-Waynesboro Formation—an interbedded sequence of mudstone, argillite, quartzite, and dolomite. Carbonate rocks of the Elbrook Limestone, Conococheague Limestone, and the Stonehenge Limestone of Beekmantown Group occur in the extreme northwestern end of Bedford County and are also included in this unit. These rocks originated as cyclic shallow marine sequences deposited in a cratonic basin during the late Cambrian and early Ordovician (Butts, 1940). Subsequent to lithification, these rocks were folded and faulted during the mid- to late Paleozoic. In Bedford County, rocks of the Rome-Waynesboro Formation are thrust over the younger carbonate units (Henika, 1981).
Well 33G 1 SOW 224 was drilled in the Rome-Waynesboro Formation. All noted fractures in the well strike between 15° and 70°, and although no prevalent schistosity was noted in the well with the televiewer, these fractures
strike in the same general direction as the foliation noted in wells 35H 1 SOW 226 and 34E 1, which are located in the Proterozoic basement crystalline rocks and Late Proterozoic-Cambrian cover crystalline rocks, respectively (fig. 6). Dip angles for noted fractures in well 33G 1 SOW 224 varied between 29° and 74°, with most dip angles greater than 50° (Appendix 1). Orientations for water-bearing fractures noted in well 33G 1 SOW 224 identified from EM flow and camera logging are coincident with the strikes and dip angles of other non-transmissive fractures in the well. Visual logs of the well via borehole camera show zones of complex folding and faulting with a persistent cleavage striking to the northeast. All open fractures observed on the camera log for well 33G 1 SOW 224 occurred within carbonate intervals.
The Rome-Waynesboro Formation was the only geologic unit in the Cambro-Ordovician metasedimentary rocks hydrogeologic unit with sufficient well completion data for summary evaluation. Wells drilled in the Rome-Waynesboro Formation are typically less than 300 ft deep (median well depth of 225 ft), with median yield of 20 gal/min, median depth to bedrock of 71.5 ft, and median casing depth of 108 ft (figure 7; table 4). Median depths for first and lowest reported water-bearing zones occur at 145 ft (15 wells) and 150 ft (7 wells), respectively, approximately 70 to 80 ft below the median depth to the bedrock interface.
1Nomenclature conforms to current usage of Virginia Division of Geology and Mineral Resources
EXPLANATION
Upper outlier
75th Percentile
Number of values
Whiskers are 1.5 x interquartile range
Median
25th Percentile
Lower outlier
33
Data value shown when population less than 10
Proterozoic basement crystalline rocksAugen and flaser gneissBiotite granitoidBiotite granofels and gneissBiotite-granitoid gneissGranitoidMyloniteChamockiteLayered gneiss and granuliteGranitic gneissLate Proterozoic-Cambrian cover crystalline rocksAshe FormationMoneta gneiss1
AmphiboliteAlligator Back FormationCandler Formation of Evington GroupUnicoi Formation of Chilhowee Group
Cambro-Ordovician metasedimentary rocksRome/Waynesboro Formation
Hydrogeologic unit summary statistics
75th percentile
Median
25th percentile
HYDROGEOLOGIC UNIT AND GEOLOGIC MAP UNIT
Figure 7. Well characteristics by hydrogeologic unit in Bedford County, Virginia.

Hydrogeology of Piedmont and Blue Ridge Aquifers 15
214 353 339 115 27 52 50 32 26 295 74 54 7 47 209 65
16 44 46 20 8 16 4 16 4 40 4 2 1 2 12 16
207 342 332 105 27 49 52 30 25 278 63 53 7 46 199 60
Auge
n an
d Fl
aser
Gne
iss
Laye
red
Gnei
ss a
nd G
ranu
lite
Biot
ite G
rano
fels
and
Gne
iss
Biot
ite G
rani
toid
Gne
iss
Myl
onite
Gran
itic
Gnei
ss
Char
nock
ite
Biot
ite G
rani
toid
Allig
ator
Bac
k Fo
rmat
ion
Unic
oi F
orm
atio
n of
Chi
lhow
ee G
roup
Cand
ler F
orm
atio
n of
Evi
ngto
n Gr
oup
Ashe
For
mat
ion
Amph
ibol
ite
Gran
odio
rtie
Rom
e/W
ayne
sbor
o
Mon
eta
Gnei
ss
Repo
rted
yiel
d, in
gal
lons
per
min
ute
100
400
10
1.0
0.1
Dept
h, in
feet
bel
ow la
nd s
urfa
ceDe
pth
to b
edro
ck, i
n fe
et b
elow
land
sur
face
0
200
400
600
800
1,000
0
50
100
150
200
250
Figure 7. Well characteristics by hydrogeologic unit in Bedford County, Virginia.—Continued

16 Hydrogeology and Simulation of Groundwater Flow in Fractured-Rock Aquifers, Bedford County, VirginiaTa
ble
4.
Desc
riptiv
e st
atis
tics
of h
ydro
geol
ogic
par
amet
ers
by ro
ck ty
pe a
ssoc
iate
d w
ith a
sel
ectio
n of
dril
led
wat
er w
ells
in B
edfo
rd C
ount
y, V
irgin
ia.
Hyd
roge
olog
ic u
nit
Prot
eroz
oic
base
men
t cry
stal
line
rock
s
Sub
unit
Folia
ted
crys
talli
ne ro
ckM
assi
ve c
ryst
allin
e ro
ck
Geo
logi
c m
ap u
nit
Aug
en
and
flase
r gn
eiss
Bio
tite-
gr
anito
id
gnei
ss
Bio
tite
gr
anof
els
an
d gn
eiss
Laye
red
gn
eiss
and
gr
anul
iteM
ylon
iteA
ll
folia
ted
Bio
tite
gran
itoid
Char
nock
iteG
rani
tic
gnei
ssG
rano
dior
iteA
ll
mas
sive
All
Repo
rted
yiel
d at
dril
ling,
in g
allo
ns p
er m
inut
eM
edia
n10
1010
1010
108
7.5
7.5
57
10M
inim
um1
11
11
11
11
11
1M
axim
um20
015
030
019
180
300
9510
060
6010
030
0N
umbe
r of o
bser
vatio
ns20
734
233
210
527
1,01
349
5230
2515
61,
169
Wel
l dep
th, i
n fe
etM
edia
n30
030
030
030
530
530
026
530
024
537
030
030
0M
inim
um65
5480
6075
5465
125
100
9565
54M
axim
um72
01,
000
900
850
560
1,00
052
056
056
050
056
01,
000
Num
ber o
f obs
erva
tions
214
353
339
115
271,
048
5250
3226
160
1,20
8De
pth
to b
edro
ck, i
n fe
etM
edia
n75
.563
5333
.520
5462
.570
53.5
2152
.553
.5M
inim
um32
1912
213
215
286
106
2M
axim
um24
014
011
014
788
240
9015
082
3615
024
0N
umbe
r of o
bser
vatio
ns16
4446
208
134
164
164
4017
4Ca
sing
dep
th, i
n fe
etM
edia
n75
67.5
6370
6568
60.5
6065
.540
6066
Min
imum
209
1316
209
3023
2019
199
Max
imum
160
180
140
148
120
180
103
124
100
8012
418
0N
umbe
r of o
bser
vatio
ns19
929
230
210
220
915
4042
2623
131
1,04
6De
pth
to fi
rst w
ater
-bea
ring
zone
, in
feet
Med
ian
115
102
105
101
8810
512
211
512
396
.611
711
0M
inim
um42
4031
2935
2950
7050
3838
29M
axim
um21
035
534
031
523
035
526
025
021
518
026
035
5N
umbe
r of o
bser
vatio
ns15
5651
189
149
186
195
4819
7De
pth
to lo
wes
t wat
er-b
earin
g zo
ne, i
n fe
etM
edia
n18
020
518
519
611
019
220
917
021
019
920
219
5M
inim
um95
110
5090
6050
183
150
115
168
115
50M
axim
um28
547
841
039
018
047
843
419
029
523
143
447
8N
umbe
r of o
bser
vatio
ns8
3337
104
926
210
220
112

Hydrogeology of Piedmont and Blue Ridge Aquifers 17Ta
ble
4.
Desc
riptiv
e st
atis
tics
of h
ydro
geol
ogic
par
amet
ers
by ro
ck ty
pe a
ssoc
iate
d w
ith a
sel
ectio
n of
dril
led
wat
er w
ells
in B
edfo
rd C
ount
y, V
A.—
Cont
inue
d
Hyd
roge
olog
ic u
nit
Late
Pro
tero
zoic
-Cam
bria
n co
ver c
ryst
allin
e ro
cks
Cam
bro-
Ord
ovic
ian
m
etas
edim
enta
ry ro
cks
Sub
unit
Sedi
men
tary
Pro
tolit
hVo
lcan
ic P
roto
lith
Hyd
roge
olog
ic
para
met
er
Alli
ga-
tor B
ack
Form
atio
n
Ash
e
Form
atio
n
Cand
ler
Form
atio
n of
Ev
ingt
on G
roup
Uni
coi
Form
atio
n of
Ch
ilhow
ee G
roup
All
se
dim
enta
ryA
mph
ibol
iteM
onet
a
gnei
ss1
All
vo
lcan
icA
llRo
me-
W
ayne
sbor
o Fo
rmat
ion
Elbr
ook
Lim
esto
ne
Repo
rted
yiel
d at
dril
ling,
in g
allo
ns p
er m
inut
eM
edia
n12
1010
1210
127
810
20M
inim
um1
11
51
21
11
2M
axim
um20
050
100
3520
068
112
112
200
100
Num
ber o
f obs
erva
tions
278
6353
740
146
199
245
646
60W
ell d
epth
, in
feet
Med
ian
300
305
305
400
300
255
300
300
300
225
300
Min
imum
656
9660
3784
8584
3774
300
Max
imum
908
560
700
520
908
500
700
700
908
550
300
Num
ber o
f obs
erva
tions
295
7454
742
947
209
256
685
651
Dept
h to
bed
rock
, in
feet
Med
ian
54.1
72.7
62.5
1357
37.5
66.2
5758
71.5
Min
imum
1052
6013
1020
1414
104
Max
imum
100
9265
1310
055
9595
100
196
Num
ber o
f obs
erva
tions
404
21
492
1214
6116
Casi
ng d
epth
, in
feet
Med
ian
71.6
6479
87.2
7068
.171
.168
7010
882
Min
imum
1620
3051
1620
1010
1020
82M
axim
um14
212
214
012
314
214
013
014
014
244
182
Num
ber o
f obs
erva
tions
158
6652
738
343
198
241
624
561
Dept
h to
firs
t wat
er-b
earin
g zo
ne, i
n fe
etM
edia
n16
013
610
514
014
517
513
813
214
214
5M
inim
um25
4560
140
2514
075
7525
62M
axim
um38
025
015
014
038
021
028
028
038
023
5N
umbe
r of o
bser
vatio
ns47
42
154
212
1468
15De
pth
to lo
wes
t wat
er-b
earin
g zo
ne, i
n fe
etM
edia
n22
020
015
022
524
018
118
520
215
0M
inim
um53
150
150
5323
092
9253
100
Max
imum
440
250
150
440
250
320
320
440
260
Num
ber o
f obs
erva
tions
182
121
28
1031
71 N
omen
clat
ure
conf
orm
s to
curr
ent u
sage
of V
irgin
ia D
ivis
ion
of G
eolo
gy a
nd M
iner
al R
esou
rces
.

18 Hydrogeology and Simulation of Groundwater Flow in Fractured-Rock Aquifers, Bedford County, Virginia
Proterozoic Basement Crystalline RocksProterozoic-aged basement crystalline rocks occur to
the northwest of a northeast-trending contact with the Late Proterozoic-Cambrian cover crystalline rocks (fig. 5). Protero-zoic basement crystalline rocks within Bedford County are composed predominantly of biotite-rich gneisses surrounding pods of relatively undeformed granitic rocks to the south of the Rockfish Valley Fault, and more pyroxene-rich granulites, gneisses, and charnockitic rocks to the north of the Rockfish Valley Fault (Henika, 1997). These are the oldest rocks in the study area, and many bear evidence of multiple periods of deformation. These rocks are variably foliated, granitoid gneisses and granitoids defined by a characteristic crystalline structure as well as by their lowest stratigraphic position within the Blue Ridge Anticlinorium. Basement crystalline rocks include the augen and flaser gneiss (Yma), biotite-granitoid gneiss (Ybg), biotite granofels and gneiss (Ygb), biotite granit-oid (Yhm), granitic gneiss (Zgd), charnockite (Yc,Ybc), layered gneiss and granulite (Ypg), mylonite (Pzmy), and granodiorite (Zsg, Zfg) geologic map units described in the geologic map of the Roanoke 30×60-minute quadrangle (Henika, 1997).
Fracturing within basement crystalline rocks is highly variable and dependent on the orientation of local stress fields in the rock imparted during deformation and exhumation, and in some cases by the presence or absence of metamorphic fabric (foliation and schistosity). Observations by the authors of basement outcrop within the study area and analysis of limited borehole geophysical log data obtained from three wells within the crystalline basement portion of the county indicate that jointing and parting along metamorphic fabric appear to be the predominant styles of fracturing within these rocks.
Conjugate sets of fractures striking between 20° to 60° and 210° to 230° were noted in well 33G 7 (fig. 6). Dip angles for noted fractures in well 33G 7 varied between 17° and 84° with the majority of noted fractures dipping at angles greater than 50° (Appendix 1). Four of the six water-bearing fractures identi-fied in well 33G 7 through EM flow and fluid logging have dip angles of 50° or less. The main water-producing zones for well 33G 7 are associated with a steeply dipping fracture (dip angle of 72°) at 119 ft below land surface (bls) and a moderately dipping fracture (dip angle of 17°) at 135 ft bls.
Conjugate fracture sets in well 33G 2 SOW 225 strike between 325° to 50° and 115° to 245°. Four water-bearing fractures were noted in well 33G 2 SOW 225. Two of the noted water-bearing fractures strike within the easterly dipping fracture set (strike angles of 26° and 343°), and two water-bearing fractures strike within the westward dipping fracture set (strike angles of 216° and 222°). Dip angles for noted fractures within well 33G2 SOW 225 vary between 11° and 74° with predominant dip angles for noted fractures ranging between 50° and 70°. Three of the noted water-bearing fractures in well 33G 2 SOW 225 have dip angles between 18° and 28° and collectively yielded about 3 gal/min during air lifting as the well was drilled. The main water-bearing fracture at 188 ft bls yielded approximately 10 gal/min and has a dip angle of 68°,
which is coincident with the predominant dip of fracturing within the wellbore.
Well 35H 1 SOW 226 was drilled in a mylonitic section of granodiorite and has a pervasive schistosity striking between 0° and 50° (Appendix 1). Two water-bearing zones were identified in this well—a nearly horizontal joint at 38 ft bls dipping at 2° and striking at 17° that yielded less than 1 gal/min during air lifting and a joint at 169 ft bls striking at 201° and dipping northwest at nearly 20°. Yield from the lower fracture during air lifting was approximately 60 gal/min. EM flow and fluid profiling confirmed observations about the positions and yields of transmissive fractures recorded during drilling of the well.
Wells drilled in the Proterozoic basement crystalline rocks typically have a median depth ranging from 300 to 305 ft (table 4; fig. 7) with median casing depth of 60 to 75 ft. Drilling depths of less than 300 ft are common for wells completed in the biotite granitoid and granitic gneiss map units, and drilling depths of greater than 350 ft and shallower casing depths (median value of 40 ft) can be expected for wells drilled in the granodiorite map unit. Reported median yield values for all rocks within the basement crystalline rocks ranged between 5 and 10 gal/min. The highest reported well yield of 300 gal/min occurred in the biotite granofels and gneiss map unit. Reported water-bearing zones occur at median depths between 110 ft and 195 ft, and median depth to bedrock occurs at 53.5 ft.
Late Proterozoic-Cambrian Cover Crystalline Rocks
Late Proterozoic-Cambrian cover crystalline rocks occur primarily to the southeast of the northeast trending contact with the basement crystalline rocks and in smaller areas of the county along the northwestern borders with Botetourt, Rockbridge, Roanoke, and Amherst Counties (fig. 5). These rocks were unconformably extruded or deposited on basement crystalline rocks and include rocks of volcanic and sedimentary origin. The rocks in this hydrogeologic unit include the Alligator Back Formation (ЄZmy, ЄZas), amphibolite (ЄZmi), Moneta Gneiss (ЄZmg—nomenclature conforms to current usage of the Virginia Division of Geology and Mineral Resources), Ashe Formation (Zam), Candler Formation of the Evington Group (ЄCa), and Unicoi Formation of the Chilhowee Group (Єu) described in Henika (1997).
Preserved textures in these rocks generally progress from coarse-grained conglomeratic metagraywacke and gneiss in the Ashe Formation to finer grained schistose and phyllitic rocks in the Alligator Back Formation and Candler Formation of the Evington Group. Along the northwestern border of the county, rocks of the Unicoi Formation of the Chilhowee group are com-posed of heterogeneous packages of coarse-grained basal units that typically fine upward into phyllitic and quartzose sequences (Henika, 1981). Well 34E 1 was completed in the Alligator Back Formation. Foliation was resolved with the optical televiewer throughout the well and strikes uniformly between 40° and 60° with dip angles between 50° and 79° (fig. 6; Appendix 1).

Hydrogeology of Piedmont and Blue Ridge Aquifers 19
Fracturing along and subangular to foliation is prevalent. A single transmissive joint at 292 ft bls strikes at 71° and dips 8°. Cascading conditions were observed in the well while camera logging. Cascading conditions indicate a downward hydraulic gradient between a flowing fracture observed on the camera log at 103 ft bls and the transmissive joint at 292 ft bls.
Wells drilled in the Late Proterozoic-Cambrian cover crystalline rocks have a median depth of 300 ft with a median casing depth of 70 ft (table 4; fig. 7). The median depth to bedrock in the Late Proterozoic-Cambrian cover crystalline rocks was 58 ft. Median well yields among geologic map units in the Late Proterozoic-Cambrian cover crystalline rocks range between 7 gal/min (Moneta Gneiss) and 12 gal/min (Alligator Back Formation, Unicoi Formation of the Chilhowee Group, and amphibolite). Median depths to first and lowest reported water-bearing zones are 142 and 202 ft, respectively.
Low-yielding or seasonally dry wells have been reported in southeastern areas of the county (Todd Fowler, Bedford County Health Department, written commun., 2012) in areas underlain by Late Proterozoic-Cambrian cover crystalline rocks. A simple one-way analysis of variance (ANOVA) test on drillers’ well yields was conducted to assess the hypothesis that low-yielding wells were more common in Late Proterozoic-Cambrian cover crystalline rocks than in the Proterozoic basement crystalline rocks. Yields were binned by hydrogeologic unit, and the mean yields for Proterozoic basement crystalline rocks and Late Proterozoic-Cambrian cover crystalline rocks were found to be identical (fig. 7). The ANOVA test resulted in a p-value of 0.26 that indicates no differences in well yields in the basement and cover crystalline rocks across the scale of the entire county. Daniel and Harned (1998) similarly found no difference in yields among crystalline rock units in the Piedmont of North Carolina. Reported low-yielding wells in the southeastern part of the county likely result from local heterogeneities of which insufficient data exist to characterize and which are not reflected in the current conceptual model.
Conceptual Model of Groundwater Flow
In the Blue Ridge Physiographic Province, topography provides the driving force for groundwater flow, and the water table is generally a subdued reflection of the land surface (figs. 8, 9). The high density of streams in the Blue Ridge Physiographic Province is probably the result of the underlying low-permeability rocks. The porous nature of the overlying regolith material (overburden) and the sharp contrast in perme-ability with the underlying hydrogeologic units coupled with numerous streams and hilly terrain are probably conducive for the development of local flow systems. Groundwater discharges at low elevation points along small streams and headwater springs (White, 2012). Groundwater flow in the bedrock is primarily controlled by the irregular fracture network and steep terrain (Wright, 1990) and by the development of complex potentiometric head relations between recharge and discharge zones (White, 2012). Local flow systems may be controlled
by stress relief or other brittle fracturing; however, bedding-plane partings in metasedimentary rocks and foliations in the metamorphic rocks may facilitate more of a subregional- to regional-type flow.
The groundwater-flow system of the Piedmont Physio-graphic Province can be idealized to consist of four components (fig. 9): (1) unsaturated regolith, (2) saturated regolith, (3) a transition zone between regolith and bedrock aquifer, and (4) fractured bedrock aquifer or hydrogeologic unit as described previously (Daniel and Harned, 1998). The regolith is a mantle of organic materials in surface soils, residuum, and saprolite, as well as alluvium and colluvium, that overlies bedrock in most locations. The sandy-clay residuum or saprolite that composes the majority of the regolith thickness is derived from in-place weathering of bedrock and commonly contains fragments of solid rock that is highly fractured near a transition zone (Daniel and Harned, 1998) to bedrock. Residuum is produced from the weathering of feldspars and micas found in crystalline rocks to clays and differs from saprolite, which is weathered material that retains the structural characteristics of the parent rock (Chapman and others, 2005). The thickness of the regolith may vary considerably from near zero to greater than 150 ft. The regolith and transition zone contain intergranular porosity that provides the majority of water storage within the Piedmont and Blue Ridge aquifers (Heath, 1980). Storage potential of the regolith is dependent on a number of factors, including topo-graphic position, thickness of the material, hydraulic gradients, and orientation of relict structure (saprolite) (White, 2012). An abrupt change in storage potential occurs at the bedrock interface because of the reduction in porosity from typical values of 35 to 55 percent in the regolith to 1 to 3 percent in the fractured bedrock (Daniel and Harned, 1998) (fig. 9). Hydraulic gradients are downward in recharge areas where water stored in the regolith slowly leaks downward into the bedrock fractures or moves laterally along the interface towards discharge points. In discharge areas, hydraulic gradients are reversed, and water from the fractured bedrock flows upward into the regolith (White, 2012).
Groundwater-level altitudes that were measured in December 2010 in Bedford County range from about 1,300 ft NGVD 29 in the northwest part of the county to about 600 ft NGVD 29 in the southeastern part of the county (fig. 10). The water-level map shown in figure 10 assumes streams are a surficial expression of the water level in adjacent aquifers, and the water-level altitude associated with streams were assigned by using a 20-meter digital elevation model (DEM). Ground-water generally flows from northwest to southeast in Bedford County, although groundwater flows locally towards drainages in eastern portions of the county where surface-water channels are deeply incised. Although the spatial coverage of the wells used to measure groundwater levels as part of this study was limited, in general, groundwater divides appear coincident with surface-water divides that separate the county’s major surface drainages: Smith Mountain Lake, Goose Creek, Big Otter River, and the James River (fig. 10).

20 Hydrogeology and Simulation of Groundwater Flow in Fractured-Rock Aquifers, Bedford County, Virginia
Hydrogeologic unitcontact
Intermittentspring
Perennialspring
Alluvium andcolluvium
Land surface
Southeast
Northwest
Feet1,400
1,200
1,000
800
600
1,400
1,200
1,000
800
600
0 500 1,000 1,500Distance, in feet
2,000 2,500 3,000 3,500
Frac
ture
d ro
cks
with
lo
w p
rimar
y pe
rmea
bilit
yRe
golit
h w
ith h
igh
prim
ary
perm
eabi
lity
Figure 8. Generalized conceptual model of the flow system in Blue Ridge fracture rock aquifers in Bedford County, Virginia. [Modified from Nelms and Moberg (2010).]

Hydrogeology of Piedmont and Blue Ridge Aquifers 21
Fracture
Bedrockstructure
Unweatheredbedrock
Weatheredbedrock, boulders
Saprolite
Stress-relieffracture
Water table
Transitionzone
Soil zone
Storagein
bedrock
Storage in regolith
Regolith
Regolithunsaturated
zone
Regolithsaturated
zone
Fracturedbedrock
Figure 9. Components of the groundwater-flow system and relative storage volumes in the regolith and fractured-rock aquifers of the Piedmont Physiographic Province, Bedford County, Virginia. [Modified from Heath (1984) and Daniel and Harned (1998).]

22 Hydrogeology and Simulation of Groundwater Flow in Fractured-Rock Aquifers, Bedford County, Virginia
Base from Esri® Data and Maps, 2008;Esri World Shaded Relief, 2014;UTM Zone 17N projectionNorth American Datum of 1983
Town of Bedford
RO A NO
ROANO
*
FLAT
SMITH MOUNTAIN LAKE
#
#
#
79°30'
79°15'
37°30'37°30'
37°15'37°15'
37°
79°30'
79°45'
37°
0 12.5 KILOMETERS
0 15 MILES
EXPLANATIONLine of equal water-level—Dashed where approximately located. Contour interval 200 feetWell location and water-level altitude to the nearest footLand-surface elevation, in feet above NGVD 29
FRANKLIN COUNTY
RO
AN
OA
KE
CO
UN
TY
BOTETOURT COUNTY
ROCKBRIDGE
COUNTY
AMHERST COUNTY
City of
Lynchb
urg
CAM
PBEL
L CO
UNTY
BEDFORD COUNTY
1,282
98
PIEDMONT
VALLEY
AND
RIDGE
COAS
TAL
PLAI
NAPPALACHIANPLATEAUS
BLUE RIDGE
Location of Bedford County and physiographic provinces in Virginia
921
922
821
844
617
966
850
770
870
866901
860814
843
816
827774
931
822683
950945
870
957
830
965978
963
882876
854853850
853850
940
946
783802781
1,020
1,015
1,007
1,286
858
816
1,000
1,200
800
800
800
800
600
600
600
800
Figure 10. Groundwater levels in Bedford County, Virginia, December 2010.

Hydrogeology of Piedmont and Blue Ridge Aquifers 23
Groundwater Response to Precipitation
The fractured-bedrock aquifers in the study area respond to natural transient atmospheric conditions, and the response is measured as changes in groundwater levels and base-level conditions in streams. The range of natural water-level fluctuation in the fractured-rock aquifer system varies across Bedford County and is controlled by (1) the location and magnitude of recharge, (2) topographic relief, or position in the local flow system, (3) amount of evapotranspiration (ET), particularly during the growing season, (4) hydraulic proper-ties of the aquifer, (5) groundwater discharge to springs and streams, and (6) the location of pumped wells.
The differences between the December 2010 and April 2011 water levels measured at 47 wells averaged 1.0 ft (table 5); seasonal water-level fluctuations between the two measurement time periods were minimal (as noted from continuous hourly groundwater levels recorded in the study area for this time period) and are less than the resolution of the 200-ft contour intervals shown in figure 10. With the exception of two wells (33F 5 and 34H 6) that are thought to be influenced by recent pumpage, the maximum change from December 2010 to April 2011 was 6.12 ft (table 5).
Daily water-level data from October 2009 through September 2013 in continuous monitoring wells 33G 1 SOW 224, 33G 2 SOW 225, 35H 1 SOW 226, 35H 3 SOW 226A, and 35H 4 SOW 226B are shown in figure 11 with daily precipitation data from NOAA site 440561 Bedford 4 NW, the site closest to the three well locations (figs. 1, 3). The hydrographs for these wells indicate annual water-level variation of less than 10 ft, with subtle differences in amplitude and duration of interannual peaks. White (2012) prescribed the differences in response to precipitation to the variation in regolith storage, hydrologic communication with the surface, and depths of water-bearing fractures in the respective wells.
Water-level variation attributed to changing climate conditions during the study period can be quantified by using the Standardized Precipitation Index (SPI) (McKee and others, 1993). In the SPI, raw observations of precipitation are transformed to follow a normal distribution, and a single numeric value, equivalent to the number of standard devia-tions the observed data differ from the long-term mean, is assigned to observed precipitation data. For Bedford County, a 3-month time period was used to calculate SPI values from the precipitation data collected at NOAA site 440561 Bedford 4 NW, although a variety of time scales is possible. The SPI results during the water years 2009 to 2013 (fig. 11) indicate periods of below-normal precipitation during the winter of 2008–2009 and from March 2010 through June 2011, and periods of above-normal precipitation from July 2011 through May 2012 and January 2013 through September 2013.
Wells 33G 1 SOW 224, 33G 2 SOW 225, and 35H 1 SOW 226 had similar water-level trends that followed the 3-month SPI trends with broad peak lags of 3 to 4 months (White, 2012). The general absence of flashiness or response
to individual precipitation events in the hydrographs of 33G 1 SOW 224, 33G 2 SOW 225, and 35H 1 SOW 226 for any of the years of record qualitatively implies either (1) a delayed response to subsurface flow within adjacent hillslopes, or (2) unconsolidated sediment in the regolith contains large accessible storage to modulate climatic inputs. For the first case, the rounded peaks are considered a result of an increase in distance, depth, or areal distribution of recharge to the aquifer. In the second case, permeability contrast at the bedrock interface likely provides additional moderation of the downgradient rate of leakage from the overlying regolith to the fractured-rock aquifers. Other factors such as prevailing and antecedent moisture conditions, hydrogeologic framework of the aquifer, proximity of a well to streams or other point of aquifer discharge, degree of aquifer confine-ment, or duration and intensity of seasonal events also may contribute to low-amplitude peaks and longer response times to precipitation.
Winter precipitation is a critical source of recharge to aquifers and is directly related to base flow in receiving streams during later periods of low flow in late summer and early fall (Austin, 2014). The response of aquifers to cold-season recharge was evident in hydrographs following heavy snows in the winter of 2009–10. Water levels in 33G 1 SOW 224 and 35H 1 SOW 226 rose approximately 2 ft and nearly 6 ft in 33 G2 SOW 225, the highest water levels recorded during the study period (fig. 11). The 2009–10 winter represents a weather extreme; however, the response of water levels to typical winter season precipitation have similar timing albeit lower magnitude of change than seen during the 2009–10 winter.
Replacement of 35H 1 SOW 226 with the nested piezometers 35H 3 SOW 226A (168-ft fracture zone) and 35H 4 SOW 226B (37-ft fracture zone) resulted in measurement of a 4.5- to 9.9-ft head differential between fractures at 37 ft and 168 ft below land surface. This range of measurements equates to a downward vertical gradient of 0.03 to 0.08. Water levels in the shallow fracture as measured in 35H 4 SOW 226B are more responsive to individual precipitation events than water levels in the deeper fracture measured in 35H 3 SOW 226A.
On August 23, 2011, a magnitude 5.8 earthquake was recorded near Mineral, Va., approximately 110 miles (mi) northwest of well 33G 2 SOW 225. This event was one of the largest earthquakes recorded in the eastern United States. Water levels in 33G 2 SOW 225 instantaneously lowered 0.74 ft in response to the propagation of seismic waves following the earthquake. Following the initial response to the earthquake, water levels in 33G 2 SOW 225 appeared to stabilize until September 26, 2011. During the next 4 days, through September 30, 2011, water levels rose 8.43 ft. The anomalous rise in water level followed the timing of the earthquake and daily rainfall totals of 4.8 in. (August 14, 2011) and 5.5 in. (September 6, 2011), the two highest daily rainfall totals observed during the study period.

24 Hydrogeology and Simulation of Groundwater Flow in Fractured-Rock Aquifers, Bedford County, Virginia
Topography in mountainous settings has been related to differences in the range of water levels observed in valley and hilltop settings. Aquifer recharge and discharge are both largely driven by topography, such that valleys and hilltops serve as hydrologic boundaries. Proximity of wells to these boundaries is reflected in observed water levels. Seasonal water-level fluctuations tend to be greater in the elevated recharge areas and in areas underlain by low-permeability rocks; water levels in discharge areas near streams and springs and areas underlain by permeable rocks tend to fluctuate less
(Nelms and Moberg, 2010). The water levels in Bedford County wells 33G 1 SOW 224 and 33G 2 SOW 225 exemplify these tendencies. Well 33G 2 SOW 225 is on a ridge at an elevation of 1,070 ft above mean sea level approximately 0.7 mi southeast of well 33G 1 SOW 224, which is in the adjacent valley at an elevation of 930 ft above mean sea level. Depth to water in the valley setting ranges from about 7 to 12 ft in 33G 1 SOW 224 and is much shallower than the measured range of depth to water of about 41 to 55 ft along the ridgeline in 33G 2 SOW 225 (fig. 11).
Figure 11. Water-level data from continuous monitoring wells and daily precipitation from National Oceanic and Atmposheric Administration site 440561 in Bedford County, Virginia, 2009–2013 water years.
Thre
e-m
onth
Sta
ndar
dize
d Pr
ecip
itatio
n In
dex Extremely wet
Extremely dry
Prec
ipita
tion,
in in
ches
Wat
er-le
vel d
epth
, in
feet
bel
ow la
nd s
urfa
ce
WATER YEAR2009 2010 2011 2012 2013
35H 1 SOW 226 replaced by Otterville Research Stationwells 35H 3 SOW 226A and
35H 4 SOW 226B 10/16/2011
0
10
20
30
40
50
60
3
2
1
–3
–2
–1
0
35H 1 SOW 226
33G 2 SOW 225
33G 1 SOW 224
440561 Bedford 4 NW
2
0
4
6
Aug. 23, 2011 earthquake near
Mineral, Va.
35H 4 SOW 226B
35H 3 SOW 226A
Dec. 2010 synopticwater-level
measurement,see fig. 10
O J F M A M J J A SN D O J F M A M J J A SN D O J F M A M J J A SN D O J F M A M J J A SN D O J F M A M J J A SN D
O J F M A M J J A SN D O J F M A M J J A SN D O J F M A M J J A SN D O J F M A M J J A SN D O J F M A M J J A SN D

Hydrogeology of Piedmont and Blue Ridge Aquifers 25
Table 5. Water-level measurements from selected wells in Bedford County, Virginia.
[Site locations shown in figure 3. Abbreviations: USGS, U.S. Geological Survey; ft-blsd, feet below land-surface datum; —, no data reported]
Site number USGS station numberDecember 2010 April 2011 December 2010–April 2011
change in water level (ft blsd) Date
Water level (ft-blsd)
DateWater level
(ft-blsd)
32G 12 371621079482801 12/7/2010 46.48 4/18/2011 45.73 0.7533F 2 371019079375301 12/6/2010 36.91 4/18/2011 37.46 –0.5533F 3 371136079431901 12/6/2010 41.64 4/18/2011 41.22 0.4233F 4 371138079431601 12/6/2010 79.7 4/18/2011 73.58 6.1233F 5 371139079432001 12/6/2010 60.91 4/18/2011 48.05 12.8633G 3 372106079374501 12/7/2010 0.57 4/18/2011 0.60 –0.0333G 4 371538079435501 12/7/2010 33.51 4/18/2011 32.22 1.2933G 5 371508079431001 12/7/2010 43.66 4/18/2011 39.81 3.8533G 6 371505079431301 12/7/2010 6.85 4/18/2011 4.62 2.2333G 7* 371503079431701 — — 6/21/2011 7.42 —34E 2 370645079341501 12/10/2010 45.3 4/18/2011 45.04 0.2634E 3 370522079352601 12/10/2010 81.54 4/18/2011 80.27 1.2733F 6 371252079434501 12/7/2010 167.51 4/18/2011 170.21 –2.7034F 1 371330079333001 12/7/2010 28.78 4/18/2011 29.51 –0.7334F 2 371237079321901 12/7/2010 47.36 4/18/2011 49.22 –1.8634G 2 371634079333501 12/7/2010 45.34 4/19/2011 46.37 –1.0334G 3 372100079345901 12/8/2010 5.08 4/18/2011 3.59 1.4934H 4 372256079303001 12/8/2010 196.73 — — —34H 5 372531079343701 12/6/2010 33.29 4/18/2011 29.43 3.8634H 6 372514079320801 12/6/2010 60.09 4/18/2011 41.07 19.0234H 7 372323079331301 12/6/2010 2.9 4/18/2011 2.58 0.3234H 8 372324079331701 12/6/2010 1.05 4/18/2011 3.59 –2.5434H 9 372326079332001 12/6/2010 7.07 4/18/2011 6.16 0.9134H 10 372329079331901 12/6/2010 6.97 4/18/2011 6.26 0.7134H 11 372332079331801 12/6/2010 11.88 4/18/2011 11.16 0.7235F 1 371337079230701 12/9/2010 41.6 4/18/2011 42.49 –0.8935F 2 370929079284801 12/10/2010 88.22 4/18/2011 89.15 –0.9335G 1 371511079284901 — — 4/18/2011 51.60 —35G 2 371508079285501 12/10/2010 36.75 4/18/2011 37.04 –0.2935G 3 372150079263101 12/8/2010 43.9 4/19/2011 45.05 –1.15
35G 4 372102079292801 12/8/2010 25.37 4/18/2011 28.23 –2.8635H 2 372539079285901 12/8/2010 51.98 4/19/2011 51.03 0.95
35J 4 373108079233301 12/8/2010 67.29 4/19/2011 69.73 –2.4435J 5 373138079250801 12/8/2010 41.07 4/19/2011 39.45 1.6236G 1 371819079180501 12/9/2010 27.75 4/18/2011 29.88 –2.1336G 2 372214079185501 12/9/2010 41.11 4/19/2011 42.40 –1.2936G 3 372143079222501 12/9/2010 38.31 4/19/2011 37.33 0.9836G 4 371625079202301 12/9/2010 42.28 4/18/2011 42.32 –0.0436G 5 371627079202501 12/9/2010 18.47 4/18/2011 17.97 0.5036H 1 372246079220901 12/9/2010 32.33 4/19/2011 33.24 –0.9136H 2 372244079210401 12/9/2010 30.42 4/19/2011 29.80 0.6236H 3 372508079221401 12/8/2010 82.38 4/18/2011 81.49 0.8936J 7 373151079213001 12/8/2010 42.88 4/19/2011 42.12 0.76
* Single measurement made at well in June 2011.

26 Hydrogeology and Simulation of Groundwater Flow in Fractured-Rock Aquifers, Bedford County, Virginia
Water Budget
A water budget is an estimate of water entering and leaving a basin plus or minus storage changes for a given time period. Water enters a basin as precipitation and leaves as streamflow, ET, and diversions, such as surface-water withdrawals and groundwater pumpage. The conceptualization of flow in Bedford County suggests that groundwater and surface-water divides are coincident and that groundwater does not enter or leave a surface-water basin as underflow. Based on that conceptualization, a simple water budget for a typical watershed in Bedford County can be described by the following equation:
PR = ET + SF + ΔS, (1)
where PR is the mean precipitation, in inches per year, ET is the mean evapotranspiration, in inches per
year, SF is the mean streamflow, in inches per year,
and ΔS is the change in groundwater storage, in
inches per year.Streamflow can be divided into two components as
SF = RO + BF, (2)
where RO is runoff from land surface, in inches per
year, and BF is base-flow discharge from aquifers, in
inches per year. For the purposes of this water-budget analysis, ΔS is assumed equal to zero because all recharge from precipitation is assumed to discharge to streams as base flow. All terms in the water-budget equation are known or can be estimated except ET, and the equation is solved for ET. Deviations from the assumptions of the equation, such as underflow between basins, and errors in other terms, are, therefore, included in ET.
Inflows to AquiferPrecipitation that falls on Bedford County is the sole
source of inflow to the groundwater system. Climate records of precipitation and hydrologic records of streamflow are the most available data with which to assess the variability in hydrologic budget components of Bedford County. The mag-nitude and distribution of groundwater supplies in Bedford County was quantified by using streamflow data collected at continuous and partial-record stations and estimates of return flow from domestic wastewater systems.
PrecipitationThe PRISM (Parameter-elevation Regressions on
Independent Slopes Model) Climate Group at Oregon State University provides yearly and monthly precipitation datasets (Daly and others, 2008). The average annual precipitation for Bedford County was extracted from the National PRISM data (fig. 12; PRISM Climate Group, Oregon State University, 2014). The gridded precipitation data are based on a model of the National Weather Service (NWS) station data for the normal climatological period 1981–2010. Mean annual pre-cipitation rates listed in table 6 are the average of 1981–2010 PRISM precipitation normals (fig. 12) within respective local-ity or basin boundary defining polygon. PRISM data indicate that average precipitation ranges from 39.4 to 66.9 inches per year in Bedford County. The orographic influence of the Blue Ridge Mountains is shown by the higher values in the western portions of the Big Otter River Basin. The lowest values are found in the southeastern portion of Bedford County near the mouth of Goose Creek.

Hydrogeology of Piedmont and Blue Ridge Aquifers 27
221
460
Town of Bedford
SMITH MOUNTAIN LAKE Leesville
Lake
79°30'
79°15'
37°30'37°30'
37°15'37°15'
37°
79°30'
79°45'
37°
0 12.5 KILOMETERS
0 15 MILES
EXPLANATIONAverage annual precipitation,
in inches
CAM
PBEL
L CO
UNTY
FRANKLIN COUNTY
RO
AN
OA
KE
CO
UN
TY
BOTETOURT COUNTY
ROCKBRIDGE
COUNTY
AMHERST COUNTY
City of
Lynchb
urg
Roanoke
Rive
r
Rockcastle
Creek
MillCreek
Creek
CreekCree
k
Creek
Falli
ng
Islan
d
NiningerGoose
Creek
Enochs
Creek
Falling
Creek
Big Little
Otter
Otter
RiverRiver
Bore Auger
221
DayCreek
Cree
k
Buffa
lo
Run
Lick
Run
Roarin
g Creek
Ivy
501
CreekStony
Creek
Johnson
BEDFORD COUNTY
Matts
Creek
Hunting Creek
Physiographic province boundary
Base from Esri® Data and Maps, 2008;Esri World Shaded Relief, 2014;UTM Zone 17N projectionNorth American Datum of 1983
PIEDMONT
VALLEY
AND
RIDGE
COAS
TAL
PLAI
NAPPALACHIANPLATEAUS
BLUE RIDGE
Location of Bedford County and physiographic provinces in Virginia
BLUE RIDGE
PIEDMONT
43
682
695 644
122
643663
622
811
4324
619
746
608
122
626
634
66.9
39.4
Figure 12. Average annual precipitation across Bedford County, Virginia, based on parameter-elevation regressions on independent slopes model (PRISM) (PRISM Climate Group, Oregon State University, 2014). The normal values are based on the National Weather Service’s current normal climatological period from 1981 to 2000.
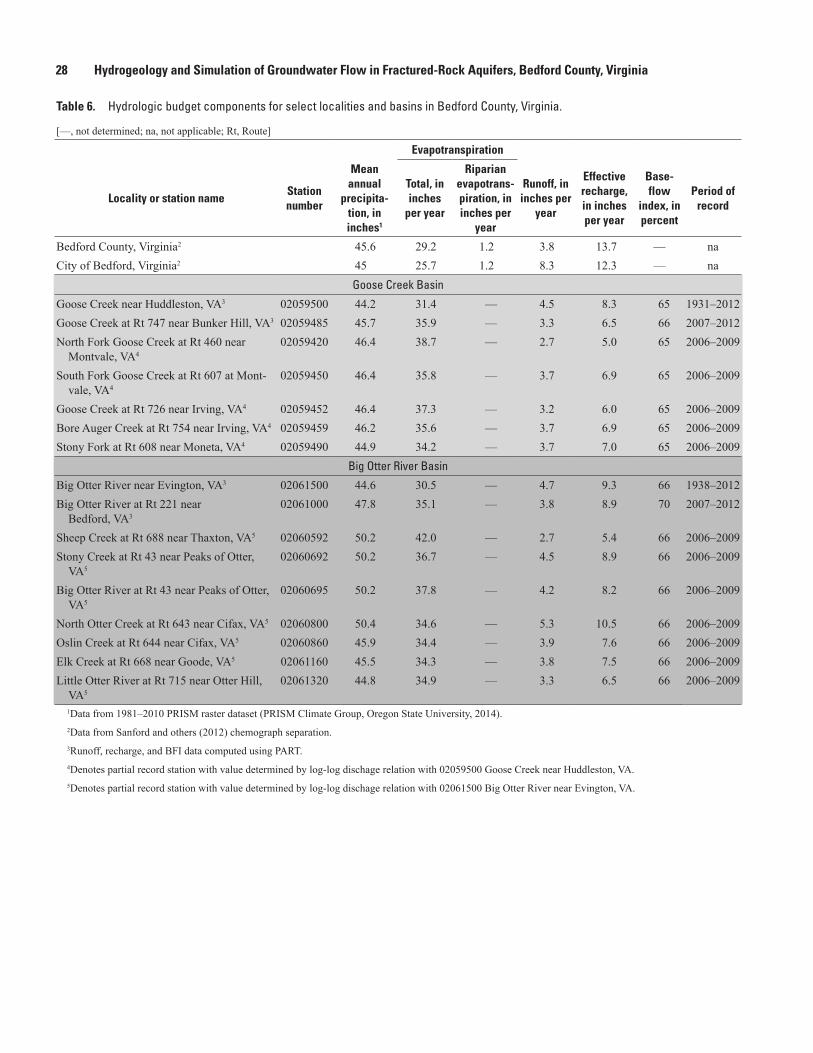
28 Hydrogeology and Simulation of Groundwater Flow in Fractured-Rock Aquifers, Bedford County, Virginia
Table 6. Hydrologic budget components for select localities and basins in Bedford County, Virginia.
[—, not determined; na, not applicable; Rt, Route]
Evapotranspiration
Locality or station name Station number
Mean annual
precipita-tion, in inches1
Total, in inches
per year
Riparian evapotrans-piration, in inches per
year
Runoff, in inches per
year
Effective recharge, in inches per year
Base-flow
index, in percent
Period of record
Bedford County, Virginia2 45.6 29.2 1.2 3.8 13.7 — naCity of Bedford, Virginia2 45 25.7 1.2 8.3 12.3 — na
Goose Creek Basin
Goose Creek near Huddleston, VA3 02059500 44.2 31.4 — 4.5 8.3 65 1931–2012Goose Creek at Rt 747 near Bunker Hill, VA3 02059485 45.7 35.9 — 3.3 6.5 66 2007–2012North Fork Goose Creek at Rt 460 near
Montvale, VA402059420 46.4 38.7 — 2.7 5.0 65 2006–2009
South Fork Goose Creek at Rt 607 at Mont-vale, VA4
02059450 46.4 35.8 — 3.7 6.9 65 2006–2009
Goose Creek at Rt 726 near Irving, VA4 02059452 46.4 37.3 — 3.2 6.0 65 2006–2009Bore Auger Creek at Rt 754 near Irving, VA4 02059459 46.2 35.6 — 3.7 6.9 65 2006–2009Stony Fork at Rt 608 near Moneta, VA4 02059490 44.9 34.2 — 3.7 7.0 65 2006–2009
Big Otter River Basin
Big Otter River near Evington, VA3 02061500 44.6 30.5 — 4.7 9.3 66 1938–2012Big Otter River at Rt 221 near
Bedford, VA302061000 47.8 35.1 — 3.8 8.9 70 2007–2012
Sheep Creek at Rt 688 near Thaxton, VA5 02060592 50.2 42.0 — 2.7 5.4 66 2006–2009Stony Creek at Rt 43 near Peaks of Otter,
VA502060692 50.2 36.7 — 4.5 8.9 66 2006–2009
Big Otter River at Rt 43 near Peaks of Otter, VA5
02060695 50.2 37.8 — 4.2 8.2 66 2006–2009
North Otter Creek at Rt 643 near Cifax, VA5 02060800 50.4 34.6 — 5.3 10.5 66 2006–2009Oslin Creek at Rt 644 near Cifax, VA5 02060860 45.9 34.4 — 3.9 7.6 66 2006–2009Elk Creek at Rt 668 near Goode, VA5 02061160 45.5 34.3 — 3.8 7.5 66 2006–2009Little Otter River at Rt 715 near Otter Hill,
VA502061320 44.8 34.9 — 3.3 6.5 66 2006–2009
1Data from 1981–2010 PRISM raster dataset (PRISM Climate Group, Oregon State University, 2014).2Data from Sanford and others (2012) chemograph separation.3Runoff, recharge, and BFI data computed using PART.4Denotes partial record station with value determined by log-log dischage relation with 02059500 Goose Creek near Huddleston, VA.5Denotes partial record station with value determined by log-log dischage relation with 02061500 Big Otter River near Evington, VA.

Hydrogeology of Piedmont and Blue Ridge Aquifers 29
Estimates of Recharge from StreamflowPrecipitation that infiltrates into the soil and percolates to
the water table recharges the groundwater system. The amount of recharge depends on many factors, including antecedent soil-moisture conditions, the timing, duration, and intensity of precipitation, depth to the water table, and soil, regolith, and bedrock characteristics. Generally, recharge areas coincide with topographic highs in an area, whereas topographic lows are commonly discharge areas. Because of climatic variability, the amount of recharge is expected to vary from year to year.
Because the water table is relatively shallow and streams in Bedford County are assumed to be gaining, or receiving groundwater discharge, base flow is used as an approximation of recharge. Annual recharge rates were estimated based on streamflow records and the hydrograph separation technique PART (Rutledge, 1998). PART was used to separate stream-flow into its groundwater discharge (BF) and surface-runoff (RO) components and to estimate groundwater recharge under the previously mentioned assumptions. PART also generates annual estimates of base-flow index (BFI), which is the percentage of streamflow that is accounted for by BF. Streamflow data from the four continuous-record stream gages in the study area were analyzed for their respective entire periods of record (tables 3, 6). Graphical regression methods were used to relate measurements at the partial-record sites (table 3) to concurrent daily mean discharge at their respective downstream long-term continuous data stations (02061500 Big Otter River near Evington or 02059500 Goose Creek near Huddleston; fig. 13). A curve was visually fitted to the data points, and mean base-flow discharge was estimated by transferring the mean base-flow discharge from the continuous stations through the relation line to the partial-record station based on the methods of Harlow and others (2005).
Base-flow discharge is commonly assumed to be equivalent to effective recharge; however, it is not the total recharge for a basin. Total recharge is always larger than effective recharge and includes riparian evapotranspiration (RET), which is the quantity of water evaporated or transpired by plants in the riparian zone adjacent to streams. RET is also a component of total ET and is included in the ET component of the water-budget estimates presented in table 6.
Using PART, the average annual effective recharge for continuous stream gage 02059500, Goose Creek near Huddleston, Va., during the period 1931–2012 was 8.3 in/yr (table 6), with base-flow discharge composing 65 percent of mean streamflow. During the 2006–2009 period of partial-record station data collection, average annual effective recharge at continuous stream gage 02059500, Goose Creek near Huddleston, Va., was 5.4 in/yr, and BFI was 67 percent. The 2006–09 average annual effective recharge at continuous stream gage 02059500 is a decrease from the 1931–2012 average annual effective recharge at the gage by about 35 percent, which is equivalent to a decrease of approximately 26.9 million gallons per day (Mgal/d) over the 188-mi2 drainage area.
Continuous stream gage 02059485, Goose Creek at Route 747 near Bunker Hill, Va., is upstream of 02059500 about 4 mi south of the town of Bedford and was constructed in December 2006 as part of the current investigation (fig. 1). The average annual effective recharge for this station for 2007–12 was 6.5 in/yr, with base-flow discharge composing 66 percent of mean streamflow. A log-log relation of base-flow discharge at five partial-record streamflow sites in the Goose Creek Basin (02059420, 02059450, 02059452, 02059459, and 02059490) and concurrent daily mean discharge at the continuous station 02059500 Goose Creek near Huddleston, Va., yielded base-flow values ranging from 5.0 to 6.9 in/yr during the period 2006–09 (table 6; figs. 14–15).
The average annual effective recharge for 02061500, Big Otter River near Evington, Va., during the period 1938–2012 was 9.3 inches per year, with base-flow discharge composing 66 percent of mean streamflow (table 6). During the 2006–09 period of partial-record station data collection, average annual effective recharge at 02061500, Big Otter River near Evington, Va., was 6.5 in/yr, and BFI was 68 percent. The 2006–09 average annual effective recharge at continuous stream gage 02061500 was a decrease from the 1938–2012 average annual effective recharge by about 30 percent, which is equivalent to a decrease of approximately 26.9 Mgal/d over the 315-mi2 drainage area.
At 02061000, Big Otter River at Route 221 near Bedford, Va., the average annual effective recharge for 2007–12 was 8.9 in/yr, with base-flow discharge composing 70 percent of mean streamflow. Partial-record streamflow measurements con-ducted at seven sites in the Big Otter River Basin (02060592, 02060692, 02060695, 02060800, 02060860, 02061160, and 02061320) were evaluated with concurrent daily mean discharge values at station 02061500 Big Otter River near Evington, Va. The average annual effective recharge values for the seven partial-record stations ranged from 5.4 to 10.5 in/yr during the period (2006–09) (table 6; figs. 14 and 16).
Sanford and others (2012) computed water budgets at two gages in Bedford County by using chemograph separation techniques. They spatially extrapolated the computed water budgets across the entire State of Virginia through a regression analysis of ET and runoff with land use and basin character-istics. Sanford and others (2012) used political boundaries to summarize their water-budget results. Chemograph separation techniques by Sanford and others (2012) for the town of Bedford and Bedford County areas yielded approximately 30 percent higher effective recharge values than those gener-ated from PART for the period of record at 02059500 and 02061500 (table 6). Hydrograph separation techniques are intuitive and follow the assumption that peak flows are domi-nated by surface-water runoff. Water in streams, however, will retain the chemical character of the groundwater and surface-runoff inputs throughout the peak event. Where groundwater chemistry is known or can be established, stream chemograph separation techniques have been shown to consistently yield higher base-flow values (Sanford and others, 2012).

30 Hydrogeology and Simulation of Groundwater Flow in Fractured-Rock Aquifers, Bedford County, Virginia
y = 0.0651 * 1.1657R² = 0.9139
0.1
1
10
100
1 10 100 1,000
Disc
harg
e at
020
6116
0 El
k Cr
eek
at R
oute
668
nea
r Goo
de, V
irgin
ia,
in c
ubic
feet
per
sec
ond
Discharge at 02061500 Big Otter River near Evington, Virginia, in cubic feet per second
02061500 Big Otter River near
Evington, Va. mean 2007–2009 base flow from
PART (150 cfs)
Calculated 2007–2009base flow for partial-
record station02061160
Elk Creek at Route 668 near Goode, Va.
(22.5 ft3/s)
Figure 13. Relation of discharge measured at partial-record station 02011600 Elk Creek at Route 668 near Goode, Virginia, with concurrent mean daily discharge at long-term stream-gaging station 02061500 Big Otter River near Evington, Virginia.

Hydrogeology of Piedmont and Blue Ridge Aquifers 31
Town of Bedford
Terrapin RO A NO
Elk
Cre
ek
JAMES
Back
Cree
k
ROANO
*
FLAT
Creek
RIVER
SMITH MOUNTAIN LAKE Leesville
Lake
02061320
02061160
0206086002060800
020606950206069202060592
02059490
02059459
02059452
02059450
02059420
02061500
02061000
02059485
02059500 #
#
#
02059500 #
V02059490
79°30'
79°15'
37°30'37°30'
37°15'37°15'
37°
79°30'
79°45'
37°
0 12.5 KILOMETERS
0 15 MILESEXPLANATION
Effective recharge, in inches per year5.0–6.56.6–8.08.1–9.59.6–11.0Continuous stream-gaging stationPartial-record stream-gaging station
CAM
PBEL
L CO
UNTY
FRANKLIN COUNTY
RO
AN
OA
KE
CO
UN
TY
BOTETOURT COUNTY
ROCKBRIDGE
COUNTY
AMHERST COUNTY
City of
Lynchb
urg
FEET ABOVE NGVD 29
1,282
98
Roanoke
Rive
r
Rockcastle
Creek
MillCreek
Creek
CreekCree
k
Creek
Falli
ng
Islan
d
Nininger
GooseCree
k
Enochs
Creek
Falling
Creek
Big Little
Otter
Otter
RiverRiver
Bore Auger
DayCreek
Cree
k
Buffa
lo
Run
Lick
Run
Roarin
g Creek
Ivy
CreekStony
Creek
Johnson
BEDFORD COUNTY
Matts
Creek
Hunting Creek
VV
V
V
#VV
V
V
V
V
V
V
#
#
#
Base from Esri® Data and Maps, 2008;Esri World Shaded Relief, 2014;UTM Zone 17N projectionNorth American Datum of 1983
PIEDMONT
VALLEY
AND
RIDGE
COAS
TAL
PLAI
NAPPALACHIANPLATEAUS
BLUE RIDGE
Location of Bedford County and physiographic provinces in Virginia
Figure 14. Effective recharge as base flow calculated at partial-record stream-gaging stations in Bedford County, Virginia, 2006–2009.

32 Hydrogeology and Simulation of Groundwater Flow in Fractured-Rock Aquifers, Bedford County, Virginia
0.1
1
10
100
0.1
1
10
100
1 10 100 1,000Discharge at 02059500 Goose Creek near Huddleston, VA,
in cubic feet per second
1 10 100 1,000Discharge at 02059500 Goose Creek near Huddleston, VA,
in cubic feet per second
A B
C
E
D
Disc
harg
e at
020
5942
0 N
orth
For
k Go
ose
Cree
k at
Rout
e 46
0 at
Mon
tval
e, V
A, in
cub
ic fe
et p
er s
econ
d
Disc
harg
e at
020
5945
0 So
uth
Fork
Goo
se C
reek
at
Rout
e 60
7 at
Mon
tval
e, V
A, in
cub
ic fe
et p
er s
econ
dDi
scha
rge
at 0
2059
459
Bore
Aug
er C
reek
at
Rout
e 75
4 ne
ar Ir
ving
, VA,
in c
ubic
feet
per
sec
ond
R² = 0.72
R² = 0.67
Disc
harg
e at
020
5945
2 Go
ose
Cree
k at
Rou
te 7
26 n
ear I
rvin
g, V
A, in
cub
ic fe
et p
er s
econ
d
0.1
1
10
100
0.1
1
10
100
0.1
1
10
100
R² = 0.88
R² = 0.82
Disc
harg
e at
020
5949
0 St
ony
Fork
at R
oute
608
ne
ar M
onet
a, V
A, in
cub
ic fe
et p
er s
econ
d
R² = 0.77
Figure 15. Relation of discharge measured at partial-record stations in the Goose Creek Basin to concurrent mean daily discharge at long-term stream-gaging station 02059500 Goose Creek near Huddleston, Virginia.

Hydrogeology of Piedmont and Blue Ridge Aquifers 33
0.1
1
10
100
0.1
1
10
100
1 10 100 1,000Discharge at 02061500 Big Otter River near Evington, VA,
in cubic feet per second Discharge at 02061500 Big Otter River near Evington, VA,
in cubic feet per second
A B
C
E
D
Disc
harg
e at
020
6059
2 Sh
eep
Cree
k at
Rout
e 68
8 at
Tha
xton
, VA,
in c
ubic
feet
per
sec
ond
Disc
harg
e at
020
6069
2 St
ony
Cree
k at
Rout
e 43
nea
r Pea
ks o
f Otte
r, VA
,in
cub
ic fe
et p
er s
econ
dDi
scha
rge
at 0
2060
800
Nor
th O
tter C
reek
at
Rout
e 64
3 ne
ar C
ifax,
VA,
in c
ubic
feet
per
sec
ond
R² = 0.90
R² = 0.88
Disc
harg
e at
020
6069
5 Bi
g Ot
ter R
iver
at R
oute
43
nea
r Pea
ks o
f Otte
r, VA
, in
cubi
c fe
et p
er s
econ
d
0.1
1
10
100
0.1
1
10
100
0.1
1
10
100
R² = 0.90 R² = 0.77
Disc
harg
e at
020
6086
0 Os
lin C
reek
at R
oute
644
ne
ar C
ifax,
VA,
in c
ubic
feet
per
sec
ond
R² = 0.84
1 10 100 1,000
F
0.1
1
10
100
Disc
harg
e at
020
6132
0 Li
ttle
Otte
r Riv
er a
t Rou
te 7
15ne
ar O
tter H
ill, V
A, in
cub
ic fe
et p
er s
econ
d
R² = 0.98
Figure 16. Relation of discharge measured at partial-record stations in the Big Otter River Basin to concurrent mean daily discharge at long-term stream-gaging station 02061500 Big Otter River near Evington, Virginia.

34 Hydrogeology and Simulation of Groundwater Flow in Fractured-Rock Aquifers, Bedford County, Virginia
Effluent from Septic SystemsFor a typical domestic household discharging to a septic
system, 84 percent of the indoor water use is assumed to return to the aquifer (Horn and others, 2008). Approximately 43,200 residents who relied on domestic wells for water supplies in Bedford County in 2005 (Kenny and others, 2009) are assumed to have also discharged wastewater to a typical household septic system. If per-capita use from domestic wells is 75 gallons per day (gal/d) (Hutson and others, 2004), then 2.8 Mgal/d (0.8 in/yr) of water is returned to the aquifer by infiltration from septic systems. Return flow from septic systems can potentially mitigate adverse effects of aquifer pumping, but the fate of water discharged into the shallow regolith by septic systems and the rate and timing at which wastewater will recharge to deeper bedrock aquifers are unknown.
Outflows from AquiferThe hydrologic budget for any basin must balance the
quantity of water entering the basin with the quantity of water leaving the basin. Outflows from aquifers in Bedford County include ET and groundwater withdrawals. Groundwater is an important source of freshwater withdrawn from the Piedmont and Blue Ridge fractured-rock aquifers for several uses, including drinking water, and for commercial, industrial, mining, and agricultural purposes.
Water UseAnnual water-use data for Bedford County were com-
piled from the Virginia Water Use Data System (VWUDS), a State-mandated reporting system for surface- and groundwater withdrawals exceeding 10,000 gal/d in any single month. VWUDS provides data on specific water-use categories in Virginia that are summarized on a county level as part of the USGS national water-use estimates (Kenny and others, 2009). The USGS summary also includes computed daily estimated withdrawal rates attributed to private domestic use based on a published per-capita withdrawal coefficient of 75 gal/d (Hutson and others, 2004). All withdrawals are reported in million gallons per day.
Bedford County relies on surface-water sources to meet most of its residential and industrial demands (fig. 17). Surface-water withdrawals primarily support industry along the James River and public drinking water supplies for the town of Bedford (Virginia Department of Environmental Quality, oral commun., 2012). Between the years of 1985 and 2005, withdrawals from surface-water sources increased from 12.8 to 13.6 Mgal/d (Kenny and others, 2009). The proportion of surface-water withdrawals with respect to total withdrawals, however, has steadily declined from 82 to 74 percent during this period (fig. 17).
Total groundwater withdrawals from bedrock aquifers in Bedford County increased from about 2.80 Mgal/d in 1985 to about 4.85 Mgal/d in 2005 (fig. 17; Kenny and others, 2009).
Domestic withdrawals of groundwater also increased between 1985 and 2005 from 2.37 Mgal/d to 3.24 Mgal/d, ranging from 67 to 94 percent of the total, likely as a result of the increase in county population by 37,000 residents during that period. The domestic withdrawal estimate includes small community systems that supply less than the 10,000-gal/d State-mandated reporting limit.
The town of Bedford operates five public-supply wells as a backup supply when surface-water sources are insufficient to meet public-supply demands. Groundwater used for public supply in Bedford County was less than 10 percent of the total public supply for 1985, 1995, and 2005 (fig. 17). Groundwater withdrawals used for public supply were about 0.17 Mgal/d, or 6 percent of the total groundwater withdrawals, in 1985, and were about 0.07 Mgal/d, or 1 percent of the total groundwater withdrawals, in 2005 (Kenny and others, 2009).
The proportion of groundwater use attributed to mining varied considerably between 1985 and 2005. Groundwater withdrawals for mining purposes from a single quarry dewa-tering operation accounted for 1.27 Mgal/d, or 26 percent of the total groundwater used, in 2005. Increases in groundwater withdrawals used in mining from 1985 to 2005 likely reflect inconsistencies in data reporting.
Evapotranspiration
For each basin, total ET was computed by subtracting the PART-derived mean streamflow at individual gages from the PRISM-derived mean value of precipitation (fig. 12) over the respective drainage areas for each gage (tables 3, 6). Long-term estimates of total ET accounted for 68 percent (30.5 in/yr) of precipitation falling in the Goose Creek Basin (station 02059500) and 71 percent (31.4 in/yr) of precipitation falling in the Big Otter River Basin (station 02061500). These estimates of total ET are within the previous range of ET values (23.7 to 31.5 in/yr) for Bedford County that were extrapolated from national datasets (Sanford and Selnick, 2013). Most of the water removed by ET is rerouted to the atmosphere by plant uptake prior to reaching the groundwater table. RET or direct discharge from the water table by plant uptake is included in estimates of total ET, but cannot be estimated from the PART data. Rutledge and Mesko (1996) noted that RET generally ranges between 1 and 2 in/yr in the Appalachian Valley and Ridge, the Piedmont, and the Blue Ridge from Alabama to New Jersey, and Sanford and others (2012) estimated an RET of 1.2 in/yr for Bedford County (table 6).
Discharge to Surface Waters and Subsurface Outflow
As previously discussed, groundwater discharges from the groundwater system in Bedford County as base flow to streams and rivers. In the previously described conceptual model, the rates of discharge to surface-water bodies are assumed to be equal to the rate at which the aquifer is recharged by precipitation, which ranges from 5.0 to 13.7 in/yr (table 6) depending on the method of analysis and

Simulation of Groundwater Flow 35
1985
2.80 Mgal/d
19953.47 Mgal/d
Surface water74%
Groundwater26%
Surface water78%
Groundwater22%
Surface water82%
Groundwater18%
20054.85 Mgal/d
Public supply1%
Domestic supply67%
Domestic supply94%
Mining26%
Mining1%
Mining7%
Livestock1%
Livestock1%
Irrigation5%
Industrial1%
Livestock1%
Industrial1%
Public supply4%
Domestic supply85%
Public supply6%
Total Water Withdrawals
Groundwater WithdrawalsYear
Figure 17. Water-use estimates for Bedford County, Virginia, 1985–2005 (from Kenny and others, 2009).
the prevailing climatic conditions. Stream gages permit direct measurement of stream discharge and estimation of base flow for areas draining to Big Otter River and Goose Creek. Direct groundwater discharge to the James River or Smith Mountain Lake are assumed to be similar in magnitude to that measured in the Big Otter River and Goose Creek drainages, but are more fully explored in the following sections of this report.
Subsurface outflow, or groundwater that originates in Bedford County and discharges to surface-water bodies outside of the county, is assumed to be minimal. The northern and southern boundaries of Bedford County are major regional drains that likely function as controlling hydrologic boundar-ies on the outflow of adjacent fractured-rock aquifers.
Simulation of Groundwater Flow
Groundwater flow through the fractured-rock aquifer underlying Bedford County was simulated by using MOD-FLOW (Harbaugh, 2005), a three-dimensional finite-difference model. The application of MODFLOW was based on the common assumption that flow through the fracture network at the scale of miles can be represented as flow through porous media. This approach has been used in other simulation studies of groundwater flow through crystalline rocks (Tiedeman and others, 1997). The groundwater-flow model used a steady-state
simulation to represent equilibrium conditions for the aquifer system in December 2010 (fig. 10), a period when water levels were near the median levels measured in continuous observa-tion wells (fig. 11). Model simulations were used to compute a groundwater budget including sources of recharge and ground-water discharge for the four major drainages within the study area. Previously discussed groundwater budgets are constrained by watershed boundaries and do not include estimates for all areas in Bedford County. Model estimates therefore provide additional coverage of areas in Bedford County outside of gaged basins.

36 Hydrogeology and Simulation of Groundwater Flow in Fractured-Rock Aquifers, Bedford County, Virginia
Model Design
The model domain was divided into a uniform grid of 820-ft cells aligned along 229 rows and 280 columns. The grid was oriented at an azimuth of 320º to best align model boundaries with major surface-water features. The western model boundary coincided with the upper watershed divides of the major drainages: the James River, Big Otter River,
0 12.5 KILOMETERS
0 15 MILES
EXPLANATIONHydrogeologic units
Cambro-Ordovician metasedimentary rockCrystalline rockLate Proterozoic-Cambrian cover rockProterozoic basement rockModel boundaryDrainGeneral head boundaryBasin boundaryPumped wellObservation wellStream gage
79°30'
37°30'37°30'
37°15'
37°
79°30'
79°15'
79°45'
79°45'
37°
79°15'
37°15'
#
#
#
#
A
A'
Activemodel
boundary
James River
GooseCreek
SMITH MOUNTAINLAKE Leesville
Lake
Big OtterRiver
#
Model gridboundary
Roanoke
River
Figure 18. Model domain, boundary conditions, and hydrogeologic units delineated in the Bedford County, Virginia, groundwater model.
and Goose Creek (fig. 18). The northern and southern model boundaries were delineated along the James River and the Roanoke River, respectively. The eastern model boundary coincided with local surface-water divides of the major drainages downstream of the stream gages that were used to measure streamflow within the study area. The resulting 975-mi2 model domain contains 40,424 active cells (fig. 18).

Simulation of Groundwater Flow 37
Boundary Conditions
Three model layers of increasing thickness with depth were used to represent the upper 655 ft of crystalline (Proterozoic basement and Late Proterozoic-Cambrian cover crystalline rocks) and Cambro-Ordovician metasedimentary rock aquifers. The model layers are parallel and were constructed to form a subdued reflection of the land surface. Model layer 1, the top layer, has minimum and maximum thicknesses of 130 and 425 ft, respectively, and represents the regolith and upper weathered portion of bedrock. In areas of high relief in the western portion of the model domain, the thickness of layer 1 reaches the maximum value of 425 ft and extends into unweathered bedrock so that the bottom of layer 1 is smoother than the land surface (fig. 19). Model layers 2 and 3 have uniform thicknesses of 200 and 330 ft, respectively, and represent the fractured bedrock aquifers.
The western, eastern, and bottom model boundaries were specified as no-flow (impervious to flow). Head-dependent (GHB) boundaries were specified in layer 2 to represent discharge to Smith Mountain Lake and Leesville Lake along the southern model boundary (fig. 18); the head elevation of the GHB boundaries were specified as the mean lake stages (795 and 615 ft, respectively). Drain boundaries were specified in layer 1 within the model domain and along the northern boundary to represent groundwater discharge to the major drainages. Head elevations of the drain boundaries were calculated from a 100-ft DEM. The conductance C of the GHB and drain boundaries is defined as
C KA
L--------= , (3)
where K is hydraulic conductivity, A is the cross-sectional flow area of the
boundary, and L is the flow-path length across the boundary. For the GHB boundary, the flow area A is WB where W is the cell width and B is the layer thickness. If the flow-path length L is assumed equal to W, then the conductance can be com-puted as KB, the transmissivity of the model cell.
For drain cells, the flow-path length L is the streambed thickness, which is assumed to be 3 ft. The flow area A was computed for each cell as the product of the length of the stream channel crossing the cell and an assumed stream width. Stream widths were based on the location of the channel within the drainage network. The widths of the channels of the James River and Roanoke River ranged from 16 to 330 ft. The widths of the channels of the Big Otter River and Goose Creek ranged from 16 to 65 ft. The hydraulic conductivities K for the GHB and drain boundaries were insensitive model parameters and were specified as 3 feet per day (ft/d) so that groundwater discharge through the boundaries was limited by the 1.3- to 1.7-ft/d hydraulic conductivities of the adjacent crystalline fractured-rock aquifers (table 7).
The top model boundary represents recharge as a specified flux. The recharge rate was spatially variable and assumed to be proportional to the available water, calculated as the difference between mean annual precipitation from PRISM (Daly and others, 2008) and actual ET. ET was estimated from a regression based on national climate and land-cover data by Sanford and Selnick (2013). The propor-tion of the available water that was diverted to recharge (Rch) was estimated through model calibration, discussed further on. Values of Rch were estimated for three areas within the model domain with different degrees of relief, ranging from low to steep. Grid cells were assigned to low, moderate, or steep slope classes (less than 770 feet per mile [ft/mi], 770 to 1,540 ft/mi, and more than 1,540 ft/mi, respectively) by using a 100-ft DEM to estimate the average surface slope within each cell. Pumping from 14 municipal wells was represented by constant flux boundaries in layer 2. Reported well depths from 7 of the 14 municipal wells averaged 366 ft. Pumping rates ranged from 1.3 to 12.6 Mgal/d and were estimated from average monthly groundwater withdrawals recorded in VWUDS for 2005.

38 Hydrogeology and Simulation of Groundwater Flow in Fractured-Rock Aquifers, Bedford County, Virginia
0 20 3010 40 45
2,000
1,000
0
Altit
ude
abov
e se
a le
vel,
in fe
et
Distance along cross section, in miles
Vertical Exaggeration x20
Model layer: 1
2
3
A A'
Figure 19. Section A-A’ showing thickness of model layers beneath areas with high relief, Bedford County, Virginia. Location of section shown in figure 18.
Table 7. Hydraulic properties estimated and specified in Bedford County groundwater-flow model.
[ft/d, foot per day; ft, foot; Shaded values were specified]
Parameter Abbreviation ValueApproximate
95-percent confidence interval
Coefficient of variation,
percentHorizontal hydraulic conductivity, ft/d
Cambro-Ordovician metasedimentary rocks Kh-carb 15Proterozoic basement crystalline rocks Kh-base 1.9 0.7 to 1.9 51Late Proterozoic-Cambrian cover crystalline rocks Kh-cover 1.1 0.3 to 2 32Faults Kh-fault
12Streambed KDRN 3General head boundary KGHB 3
Vertical anisotropyKh/v-carb 5Kh/v-base 78.5 26Kh/v-cover 15.8 56Kh/v-fault 2
Decay factor, ft –1
λcarb 7.6E-05λcrystal 1.5E-4
Recharge factor, percentShallow slope Rchlow 0.645 40Moderate slope Rchmod 0.418 60Steep slope Rchsteep 0.125 73
Standard error of weighted residuals, ftWater level 42.6Flow 49.9
1 Hydraulic conductivity perpendicular to fault specified as 0.02 ft/d.

Simulation of Groundwater Flow 39
Hydraulic PropertiesTransmissivity was estimated from specific-capacity data
from 22 wells drilled into Proterozoic basement crystalline rocks and Late Proterozoic-Cambrian cover crystalline rocks in Bedford County by using an equation from Todd and Mays (2005). Transmissivity values (T) ranged from 7 to 800 feet squared per day (ft2/d), with a mean value of 73 ft2/d. Corre-sponding values of horizontal hydraulic conductivity (Kh) were computed by dividing the T values by the aquifer-saturated thickness intercepted by each well. The Kh values ranged from 0.04 to 8.6 ft/d, with a mean value of 1.7 ft/d, and occupy the lower end of the range of mean values reported by Daniel and others (1997) for 1,153 wells in three topographic settings in fractured crystalline rocks in North Carolina (fig. 20).
The three hydrogeologic units presented earlier (Cambro-Ordovician metasedimentary rocks, Proterozoic basement crystalline rocks, and Late Proterozoic-Cambrian cover crystalline rocks) were each delineated as separate zones within the model domain and assumed to extend vertically through all model layers (figs. 18 and 21). Values of horizontal and vertical hydraulic conductivity (Kh and Kv) were estimated for each unit through model calibration. Horizontal hydraulic conductivity is assumed to be isotropic even though some borehole data indicate that the fracture networks within these units are aligned regionally along preferential directions (fig. 6). Available hydraulic conductivity data are insufficient, however, to characterize the differences in horizontal tensors. Hydraulic conductivity is assumed to be vertically anisotropic; values of vertical anisotropy (Kh/Kv) were estimated through model calibration. Assigned hydraulic conductivity values are intended only to characterize bulk aquifer properties at a regional scale. It is important to note that at the regional scale, data are also insufficient to define discrete fracture heterogeneities which may supply water at depth.
In addition, a power function similar to that applied in the groundwater-flow model of the Shenandoah Valley by Yager and others (2008) was used to relate the decrease in hydraulic conductivity Kh in each hydrogeologic unit below a threshold depth D below the bedrock surface (fig. 21):
Kdepth = K10–λd (4)
where Kdepth is the hydraulic conductivity [length/time] at
depth D [length] below a threshold depth D, and
λ is a decay factor [length–1]. The threshold depth for each hydrogeologic unit was set as the depth to the bottom of layer 1. Two depth-decay factors λ were estimated through model calibration—one for the Cambro-Ordovician metasedimentary rock unit and one for the combined Proterozoic basement crystalline-rock and Late Proterozoic-Cambrian cover crystalline-rock units.
The specified-thickness approximation (Sheets and others, 2015) was used to compute transmissivity in model layer 1, which is assumed to be unconfined. With this approximation
model, layer 1 is treated as confined with a specified thickness to facilitate the numerical convergence of the groundwater-flow equation. The specified thickness was obtained by multiplying the model layer 1 thickness by a factor (Satfactor) to account for partial saturation:
Satfactorhead bottom
thicksim� �=
− , (5)
where headsim is the head computed by a prior simulation, bottom is the elevation of the bottom of model layer 1,
and thick is the thickness of model layer 1.Satfactor was set to 0.05 × thick in areas where the simulated head was below the bottom of model layer 1. The value of Satfactor was computed iteratively through a sequence of simulations until the computed headsim approached stable values. Model layers 2 and 3 were also treated as confined, but the full layer thicknesses were used to compute the transmissiv-ity of each layer. The specified thickness assumption for model layer 1 is appropriate for the steady-state simulation because the effect of pumping on the saturated thickness is negligible.
The location of the public-supply wells along mapped faults in Bedford County (City of Bedford, Well System Drilling Report, unpub. data, 1981) suggests the potential for hydraulic conductivity along faults to be larger than that of the surrounding fracture network, thereby channeling groundwater flow parallel to the fault. Alternatively, faults could be sealed, thereby creating low-permeability barriers to flow perpendicular to the fault. Faults cutting Blue Ridge and Piedmont rocks are extremely complex and not currently well understood. Because the faults have experienced multiple phases of deformation, structural markers indicating the direction of fault displacement are often variable within individual fault systems. Regional fault systems such as the Rockfish Valley Fault system in the northeastern portion of Bedford County contain both extensional and compressional (younger) features (Simpson and Kalaghan, 1989; Bailey and Simpson, 1993; Tollo and others, 2004), while the Bowens Creek Fault system to the southeast has a primarily dextral sense of shear with a younger compres-sional overprint (Edelman and others, 1987; Conley, 1989). The Blue Ridge and Peaks of Otter faults are thought to be primarily thrust related (Henika, 1981, 1997), while two unnamed faults in the central and northeastern portions of the county are shown to have a dextral sense of shear (Henika, 1997).
The hydraulic properties of faults are insensitive model parameters and could not be estimated through model calibra-tion because the faults mapped at a 1:100,000 scale are widely spaced (Henika, 1997) and appear to have little influence on regional groundwater flow. The hydraulic effects of faults, how-ever, are known to be important locally (Seaton and Burbey, 2005; White and Burbey, 2007), so hydraulic properties of faults were specified in the model to reflect larger horizontal and vertical hydraulic conductivities than those of the surround-ing fracture network. Faults were also specified as horizontally anisotropic with the larger hydraulic conductivity value parallel to the fault and the smaller value perpendicular to the fault.

40 Hydrogeology and Simulation of Groundwater Flow in Fractured-Rock Aquifers, Bedford County, Virginia
0
2
4
6
8
10
90th percentile
Number of observations
75th percentile
50th percentile25th percentile
10th percentile
Outlier less than 10th percentile or greater than 90th percentile
Hydraulic conductivity estimated with Bedford County groundwater-flow model
EXPLANATION
22
Range reportedby Daniel andothers (1997)
Hydr
aulic
con
duct
ivity
, in
feet
per
day
1.5 ft/d
22
Figure 20. Distribution of hydraulic conductivity values computed from specific capacity of crystalline bedrock wells in Bedford County, Virginia.
A
metasedimentaryrocks
VERTICAL EXAGGERATION x 5fault
Hydraulic conductivity,in feet per day
EXPLANATION
basement crystallinerocks
cover crystallinerocks
A'
30
0.3
3
Figure 21. Model layers and hydraulic conductivity zones within model domain, Bedford County, Virginia. Location of section A’–A’ shown in figure 18.

Simulation of Groundwater Flow 41
Mea
sure
d he
ad, i
n fe
etRe
sidu
al, i
n fe
et
Simulated head, in feet
A
B
1,300
1,200
1,100
1,000
900
800
700
600150
100
50
0
–50
–100
–150600 700 800 900 1,000 1,100 1,200 1,300
1:1 line
Figure 22. Residual plots for heads in Bedford County groundwater-flow model: (A) relation between simulated and observed values; (B) relation between simulated values and weighted residuals.
Mea
sure
d flo
w, i
n cu
bic
feet
per
day
Simulated flow, in cubic feet per day
250
200
150
100
50
00 50 100 150 200 250
1:1 line
Figure 23. Residual plot for flows in Bedford County groundwater-flow model showing relation between simulated and measured values.
Model Calibration
The Bedford County groundwater-flow model was calibrated by adjusting hydraulic conductivity and recharge values to minimize the difference between simulated ground-water levels and discharges, and those observed in wells and at stream gages. Optimum values for model parameters were obtained through nonlinear regression by using UCODE 2005 (Poeter and others, 2005).
Observations
The nonlinear regression compared simulated water levels with the water levels measured in 47 bedrock wells in December 2010. The open intervals of many of these wells are not known (table 2), but drilled wells in the study area are typically cased below bedrock (table 4; fig. 7). For wells where the open interval was unknown, the assumed measure-ment depth was computed as midway between land surface and the bottom of layer 1. The measurement depths of two wells (33G 2 SOW 225 and 34H 5), located in areas where the simulated water table was below the bottom of layer 1, were specified as midway between the top and bottom of layer 2. The weights assigned to all water-level measurements were equivalent to a 3-ft standard deviation in measurement error.
Simulated groundwater discharges to drain boundaries representing Big Otter River and Goose Creek were compared with average base flows computed by PART from streamflow measurements obtained from four continuous record stream-flow gages (02059485, 02059500, 02061000, and 02061500) during the period 2007 through 2012 (table 6). Each stream was divided into an upstream and downstream reach based on the locations of the four stream gages (fig. 18). The flow observations were assigned weights based on an arbitrary coefficient of variation in measurement error of 1 percent. Although the accuracy of the flow measurements is less than this value, the resulting weights in flow observations resulted in weighted residuals (observed minus simulated values) that were comparable in magnitude with weighted residuals in heads, so that both observation groups influenced the regression equally.
Model Fit
Residual plots for heads and flows (observed minus simulated values) indicate that the model simulates the groundwater system reasonably well. Residual plots for heads (fig. 22) show little bias in model error with the mean weighted residual near zero. The standard error (SE) of the weighted residuals for water level is 42.6 ft, which is less than 7 percent of the 685-ft range in head (table 7). Nearly all the simulated heads are within 100 ft of the measured value.
Simulated groundwater discharge to Big Otter River and Goose Creek closely match base flow estimated by PART for the period 2007 through 2012 with little bias (fig. 23).

42 Hydrogeology and Simulation of Groundwater Flow in Fractured-Rock Aquifers, Bedford County, Virginia
Simulated flows are within 10 percent of the measured flow at three of the stream gages. The largest error (23 percent) is for the upstream gage on Big Otter River. At a scale of hundreds of square miles, the error in head and flow is acceptable for an exercise in conceptual understanding; however, extrapolation of model results to smaller-scale domains would require additional hydrogeologic detail than is currently (2014) available.
Parameters
Fifteen parameter values were specified in the model, 8 of which were optimized through nonlinear regression (table 7). Coefficients of variation (cv) for the hydraulic conductivity parameters ranged from 26 to 56 percent. The cv for the recharge parameters ranged from 40 to 73 percent. These cv values indicate that the regression is relatively sensitive to most of the estimated parameters, but that the values are not particu-larly well estimated. Values of K for Proterozoic basement and Late Proterozoic-Cambrian cover crystalline rocks are similar (table 7), indicating little difference in permeability between these two units. Daniel and others (1997) reached a similar conclusion with respect to five hydrogeologic units delineated within crystalline rocks in North Carolina. The estimated depth-decay factor for crystalline rocks (5.5×10⁻⁴ ft–1) resulted in an 80 percent reduction in Kh at a depth of 400 ft in model layer 3, which compares favorably with the range of 60 to 90 percent reduction in Kh at a depth of 300 ft estimated by Daniel and others (1997) for crystalline bedrock wells in North Carolina.
Estimated recharge factors ranged from about 42 percent of available water (PR–ET) for moderate to steep slopes, to 64 percent of available water for shallow slopes. Recharge values applied to model cells ranged from 4 in/yr near streams and in the southeastern corner of the model domain, to 28 in/yr in isolated flat areas in uplands near the northwestern corner (fig. 24). The mean recharge value within the model domain was 9.4 in/yr, which is similar to the mean long-term base flow computed using hydrograph separation for Goose Creek (8.3 in/yr at continuous station 02059500) and Big Otter River (9.3 in/yr at continuous station 02061500). The spatial distribu-tion of recharge reflects the grid resolution of the PRISM data used to estimate precipitation within the model domain (fig. 24).
Model Application
The hydraulic head distribution computed by using the Bedford County model indicates that groundwater flows towards the major drainages within the model domain and that the water table reflects the pattern of the stream network (fig. 25). The highest water levels are in the uplands along watershed divides and along the northwest model boundary. The distribution of head residuals indicates no spatial bias in the model (fig. 25).
The water budget computed by the Bedford County model indicates that nearly all the recharge within each major
watershed discharges to the drainage network within that watershed (table 8). The distribution of recharge and discharge is generally proportionate to the drainage area of the four major basins, although the Goose Creek and James River Basins derive about 7 percent of their discharge as underflow from adjacent watersheds. The Big Otter River receives 40.8 percent of the total daily groundwater outflow from fractured-rock aquifers in Bedford County; Goose Creek receives 25.8 percent, the James River receives 18.2 percent, and Smith Mountain and Leesville Lakes receive 15.2 percent (fig. 26). The volume of public-supply pumping within the model domain (not indicated in table 8) is a small part of the water budget and represents 0.2 percent of the total groundwater outflow.
Model Limitations
The Bedford County groundwater-flow model was constructed to represent recent (December 2010) steady-state conditions when recharge and water levels are near their long-term averages, and not extreme conditions, such as drought. The model could be modified to simulate transient conditions with varying recharge, but this would necessitate the specification of values for specific yield in the model. Continuous water-level monitoring for periods of 3 or more years at multiple wells could supply the required information to estimate this model parameter. Simulation of transient conditions could have the additional benefit of supporting an estimate of the volume of groundwater stored within the model domain.
The volume of pumping within the model domain is small and exerts little stress on the aquifer system. The values of hydraulic parameters estimated through model calibration are based on limited data, including base-flow volumes and water-level observations at 47 wells. The uncertainty in the parameter values is reflected by the relatively large coefficients of variation associated with the estimates. In addition, although the hydraulic conductivity of the fracture network varies over 4 orders of magnitude, uniform values of Kh are specified within the model. As a result, computed water levels likely will differ from those measured locally in wells, as indicated by the standard error (45.6 ft) and scatter in the head residuals (fig. 22). Other approaches could include anisotropy in Kh to account for the preferential alignment of fractures noted in borehole logs (fig. 6). Finally, computed water levels are likely underpredicted in upland areas as a result of the specified-thickness approxima-tion for model layer 1. More accurate results could be obtained by treating model layers 1 and 2 as convertible, that is, either confined or unconfined. This representation would require the application of the Newton solver (Niswonger and others, 2011), however, which does not support the depiction of directional permeability along faults that was used in the current model. Despite these limitations, the model provides accurate estimates of the rate and direction of regional groundwater flow and serves as a solid basis for future modifications to simulate the aquifer system in greater detail.

Simulation of Groundwater Flow 43
0 12.5 KILOMETERS
0 15 MILES
EXPLANATIONAnnual recharge, in inches
Less than 55.1 to 77.1 to 99.1 to 1111.1 to 1313.1 to 15More than 15Stream
79°30'
37°30'37°30'
37°15'
37°
79°30'
79°15'
79°45'
79°45'
37°
79°15'
37°15'
Activemodel
boundary
James River
SMITH MOUNTAINLAKE
Model gridboundary
Figure 24. Distribution of annual recharge for steady-state conditions in the Bedford County groundwater-flow model.

44 Hydrogeology and Simulation of Groundwater Flow in Fractured-Rock Aquifers, Bedford County, Virginia
0 12.5 KILOMETERS
0 15 MILES
79°30’
37°30’37°30’
37°15’
37°
79°30’
79°15’
79°45’
79°45’
37°
79°15’
37°15’
EXPLANATIONWater-table altitude, in feet
Residual (difference between observedand simulated water level), in feet
501 to 600601 to 700701 to 800801 to 900901 to 1,0001,001 to 1,1001,101 to 1,2001,201 to 1,3001,301 to 1,4001,401 to 1,5001,501 to 1,6001,601 to 1,7001,701 to 1,800More than 1,800
Less than –50
–50 to –25
–24 to 24
25 to 50
More than 50
Activemodel
boundary
Model gridboundary
!
!
!
!
!
!
!
!
!!
!
!
!
!
!
!
!
!
!
!
!
!
!
!
!
Figure 25. Water table simulated for steady-state conditions by the Bedford County groundwater-flow model.

Summary and Conclusions 45
Table 8. Simulated water budget for Bedford County groundwater-flow model.
[ft3/d, cubic foot per day]
SourceInflow volume
(105 ft3/d)Percent Discharge
Outflow volume (105 ft3/d)
Percent
Recharge Base flow
James River 9.8 16.9 James River 10.5 18.2Big Otter River 23.5 40.5 Big Otter River 23.5 40.8Goose Creek 14.1 24.3 Goose Creek 14.9 25.8Smith Mountain & Leesville Lakes 10.6 18.3 Smith Mountain & Leesville Lakes 8.8 15.2Total 58.0 100.0 57.7 100.0
James River18.2%
Goose Creek25.8%
Big Otter River40.8%
Smith Mountain and Leesville Lakes
15.2%
Public-supply wells0.2%
Note: Numbers may not add up to 100 percent because of independent rounding.
Figure 26. Proportion of groundwater flow through major basins, Bedford County, Virginia.
Summary and ConclusionsGroundwater resources in Bedford County, Virginia,
include water that is stored in and flows through Piedmont and Blue Ridge regolith and fractured-rock aquifers. The fractured-rock aquifers in Bedford County were subdivided into three hydrogeologic units based on rock type: Cambro-Ordovician metasedimentary rocks, Proterozoic basement crystalline rocks, and Late Proterozoic-Cambrian cover crystalline rocks. Cambro-Ordovician metasedimentary rocks in the northwest part of the county have the highest driller-reported well yields, largest depth to bedrock, and highest model calibrated hydraulic conductivity of the three hydrogeologic units. Mean reported drillers’ well yields and model-calibrated hydraulic conductivity in Proterozoic basement and Late Proterozoic-Cambrian cover crystalline-rock units were similar. Well characteristics and model results
indicate little difference between the crystalline-rock units in Bedford County, a conclusion that is supported by findings in geologically similar areas of North Carolina. Reported seasonally dry wells or low-yielding wells in the southeastern portion of the county cannot be explained by rock type but likely reflect local heterogeneities that are beyond the scope of this study.
Groundwater levels for the period of study (2009–2013) were found to vary only a few feet in response to seasonal changes in climate conditions. Because the water level mimics land surface, groundwater flow is topographically driven. Groundwater flows from upland areas to local streams and rivers such that surface-water divides are coincident with groundwater divides.
A water budget for the county shows model-calibrated recharge rates that mimic precipitation patterns and range from 4 inches per year (in/yr) near streams to 28 in/yr in upland

46 Hydrogeology and Simulation of Groundwater Flow in Fractured-Rock Aquifers, Bedford County, Virginia
areas of the Blue Ridge Physiographic Province. The mean rate of recharge from model results is 9.4 in/yr, a value equiva-lent to the long-term mean from hydrograph separation of streamflow in the Big Otter River. An expanding rural popula-tion has resulted in an increase in the groundwater use in Bedford County from 2.80 million gallons per day (Mgal/d) to 4.85 Mgal/d between 1985 and 2005. Evapotranspiration rates ranged from 30.5 to 31.4 in/yr based on streamflow and are within the higher end of the 23.7- to 31.5-in/yr range of values from national datasets. The percent volume of groundwater discharging from Piedmont and Blue Ridge fractured-rock aquifers of Bedford County is proportional to the drainage area of the four major basins: Big Otter River (40.8 percent), Goose Creek (25.8 percent), James River (18.2 percent), and Smith Mountain and Leesville Lakes (15.2 percent).
References Cited
Austin, S.H., 2014, Methods for estimating drought streamflow probabilities for Virginia streams: U.S. Geological Survey Scientific Investigations Report 2014–5145, 20 p., accessed March 27, 2015, at http://dx.doi.org/10.3133/sir20145145.
Bailey, C.M., Berquist, P.J., Mager, S.M., Knight, B.D., Shotwell, N.L., and Gilmer, A.K., 2003, Bedrock geology of the Madison quadrangle, Virginia: Virginia Division of Mineral Resources Publication 157, 22 p.
Bailey, C.M., and Simpson, C., 1993, Extensional and contractional deformation in the Blue Ridge Province, Virginia: Geological Society of America Bulletin, v. 105, p. 411–422.
Bailey, C.M., Southworth, S., and Tollo, R.P., 2006, Tectonic history of the Blue Ridge, north-central Virginia—Excur-sions in geology and history—Field trips in the middle Atlantic States: Geological Society of America Field Guide 8, p. 113–134.
Butts, Charles, 1940, Geology of the Appalachian Valley in Virginia: Virginia Geological Survey Bulletin 52, 568 p.
Chapman, M.J., Almanaseer, N., McClenney, B., and Hinton, N., 2011, Fluctuations in groundwater levels related to regional and local withdrawals in the fractured-bedrock groundwater system in northern Wake County, North Carolina, March 2008–February 2009: U.S. Geological Survey Scientific Investigations Report 2010–5219, 60 p., accessed March 27, 2015, at http://pubs.er.usgs.gov/publication/sir20105219.
Chapman, M.J., Bolich, R.E., and Huffman, B.A., 2005, Hydrogeologic setting, ground-water flow, and ground-water quality at the Lake Wheeler Road research station, 2001–03, North Carolina Piedmont and Mountains Resource Evaluation Program: U.S. Geological Survey Scientific Investigations Report 2005–5166, 85 p., accessed March 27, 2015, at http://pubs.usgs.gov/sir/2005/5166/.
Chapman, M.J., Crawford, T.J., and Tharpe, W.T., 1998, Geology and ground-water resources of the Lawrenceville area, Georgia: U.S. Geological Survey Water-Resources Investigations Report 98–4233, accessed March 27, 2015, at http://pubs.er.usgs.gov/publication/wri984233.
Conley, J.F., 1989, Geology of the Rocky Mount, Gladehill, Penhook, and Mountain Valley Quadrangles, Virginia: Virginia Division of Mineral Resources Publication 90, Part C, 15 p.
Daly, Christopher, Halbleib, Michael, Smith, J.I., Gibson, W.P., Doggett, M.K., Taylor, G.H., Curtis, Jan, and Pasteris, P.P., 2008, Physiographically sensitive mapping of climatological temperature and precipitation across the conterminous United States: International Journal of Climatology, v. 28, no. 15, p. 2031–2064.
Daniel, C.C., III, and Harned, D.A., 1998, Ground-water recharge to and storage in the regolith-fractured crystalline rock aquifer system, Guilford County, North Carolina: U.S. Geological Survey Water-Resources Investigations Report 97–4140, 65 p., accessed March 27, 2015, at http://pubs.er.usgs.gov/publication/wri974140.
Daniel, C.C., III, and Payne, R.A., 1990, Hydrogeologic unit map of the Piedmont and Blue Ridge provinces of North Carolina: U.S. Geological Survey Water-Resources Investigations Report 90–4035, scale 1:500,000, 1 sheet, accessed March 27, 2015, at http://pubs.er.usgs.gov/publication/wri904035.
Daniel, C.C., III, Smith, D.G., and Eimers, J.L., 1997, Hydrogeology and simulation of ground-water flow in the thick regolith-fractured crystalline rock aquifer system of Indian Creek Basin, North Carolina: U.S. Geological Survey Water-Supply Paper 2341–C, 197 p., accessed March 27, 2015, at http://pubs.er.usgs.gov/publication/wsp2341C.
Edelman, S.H., Kiu, A., and Hatcher, R.D., Jr., 1987, The Brevard zone in South Carolina and adjacent areas: An Alleghanian orogen-scale dextral shear zone reactivated as a thrust fault: Journal of Geology, v. 95, p.793–806.
Harbaugh, A.W., 2005, MODFLOW-2005, The U.S. Geological Survey modular ground-water model—The ground-water flow process: U.S. Geological Survey Techniques and Methods 6–A16 [variously paged], accessed March 27, 2015, at http://pubs.er.usgs.gov/publication/tm6A16.

References Cited 47
Harlow, G.E., Jr., Orndorff, R.C., Nelms, D.L., Weary, D.J., and Moberg, R.M., 2005, Hydrogeology and ground-water availability in the carbonate aquifer system of Frederick County, Virginia: U.S. Geological Survey Scientific Investi-gations Report 2005–5161, 30 p., accessed March 27, 2015, at http://pubs.er.usgs.gov/publication/sir20055161.
Hasty, B.A., and Bailey, C.M., 2005, Kinematic and temporal significance of fractures in the western Blue Ridge prov-ince, north-central Virginia [abs.]: Geological Society of America Abstracts with Programs, v. 37.
Heath, R.C., 1980, Basic elements of ground-water hydrology with reference to conditions in North Carolina: U.S. Geological Survey Open-File Report 80–44, 86 p., accessed March 27, 2015, at http://pubs.er.usgs.gov/publication/ofr8044.
Heath, R.C., 1984, Ground-water regions of the United States: U.S. Geological Survey Water-Supply Paper 2242, 78 p., accessed March 27, 2015, at http://pubs.er.usgs.gov/publication/wsp2242.
Heller, M.J., 2008, Trends in the depth, yield, and water quality of wells in Virginia related to geologic conditions: Virginia Division of Geology and Mineral Resources Virginia Minerals Publication v. 51, nos. 1 & 2, 16 p.
Henika, W.S., 1981, Geology of the Villamont and Montvale quadrangles, Virginia: Virginia Division of Mineral Resources Publication 35, 18 p.
Henika, W.S., 1997, Geologic map of the Roanoke 30 × 60 minute quadrangle: Virginia Division of Mineral Resources Publication 148, scale 1:100,000.
Horn, M.A., Moore, R.B., Hayes, Laura, and Flanagan, S.M., 2008, Methods for and estimates of 2003 and projected water use in the Seacoast region, southeastern New Hampshire: U.S. Geological Survey Scientific Investigations Report 2007–5157, 87 p., plus 2 appen-dixes on CD-ROM, accessed March 27, 2015, at http://pubs.usgs.gov/sir/2007/5157.
Hutson, S.S., Barber, N.L., Kenny, J.F., Linsey, K.S., Lumia, D.S., and Maupin, M.A., 2004, Estimated use of water in the United States in 2000: U.S. Geological Survey Circular 1268, 46 p., accessed March 27, 2015, at http://pubs.er.usgs.gov/publication/cir1268.
Keane, James, and Gilstrap, Tatiana, 2011, Delineation of mafic intrusions near Bedford (Virginia, USA) using geological and geophysical methods: Environmental Earth Science, v. 66, p. 1393–1402.
Kenny, J.F., Barber, N.L., Hutson, S.S., Linsey, K.S., Lovelace, J.K., and Maupin, M.A., 2009, Estimated use of water in the United States in 2005: U.S. Geological Survey Circular 1344, 52 p., accessed March 27, 2015, at http://pubs.er.usgs.gov/publication/cir1344.
Manda, A.K., Mabee, S.B., and Wise, D.U., 2008, Influ-ence of rock fabric on fracture attribute distribution and implications for groundwater flow in the Nashoba Terrane, eastern Massachusetts: Journal of Structural Geology, v. 30, p. 464–477.
Maupin, M.A., Kenny, J.F., Hutson, S.S., Lovelace, J.K., Barber, N.L., and Linsey, K.S., 2014, Estimated use of water in the United States in 2010: U.S. Geological Survey Circular 1405, 56 p., accessed March 27, 2015, at http://dx.doi.org/10.3133/cir1405.
McKee, T.B., Doesken, N.J., and Kleist, John, 1993, The relationship of drought frequency and duration of time scales: Eighth Conference on Applied Climatology, American Meteorological Society, January 17–23, 1993, Anaheim, Calif., p.179–186.
National Oceanic and Atmospheric Administration, 2014, National Climatic Data Center, accessed March 17, 2014, at http://www.ncdc.noaa.gov/.
Nelms, D.L., Harlow, G.E., Jr., and Hayes, D.C., 1997, Base-flow characteristics of streams in the Valley and Ridge, the Blue Ridge, and the Piedmont Physiographic Provinces of Virginia: U.S. Geological Survey Water-Supply Paper 2457, 48 p., 1 pl., accessed March 30, 2015, at http://pubs.usgs.gov/wsp/wsp_2457/.
Nelms, D.L., and Moberg, R.M., Jr., 2010, Preliminary assess-ment of the hydrogeology and groundwater availability in the metamorphic and siliciclastic fractured-rock aquifer sys-tems of Warren County, Virginia: U.S. Geological Survey Scientific Investigations Report 2010–5190, 74 p., accessed March 30, 2015, at http://pubs.usgs.gov/sir/2010/5190/.
Niswonger, R.G., Panday, Sorab, and Ibaraki, Motomu, 2011, MODFLOW-NWT, A Newton formulation for MODFLOW-2005: U.S. Geological Survey Techniques and Methods 6–A37, 44 p.
Poeter, E.P., Hill, M.C., Banta, E.R., Mehl, Steffen, and Chris-tensen, Steen, 2005, UCODE 2005 and six other computer codes for universal sensitivity analysis, calibration, and uncertainty evaluation: U.S. Geological Survey Techniques and Methods 6–A11, 283 p., accessed March 30, 2015, at http://pubs.er.usgs.gov/publication/tm6A11.
Powell, J.D., and Abe, J.M., 1985, Availability and quality of ground water in the Piedmont Province of Virginia: U.S. Geological Survey Water-Resources Investigations Report 85–4235, 33 p., accessed March 30, 2015, at http://pubs.er.usgs.gov/publication/wri854235.

48 Hydrogeology and Simulation of Groundwater Flow in Fractured-Rock Aquifers, Bedford County, Virginia
PRISM Climate Group, Oregon State University, 2014, PRISM climate data, accessed March 2014 at http://prism.oregonstate.edu/.
Rutledge, A.T., 1998, Computer programs for describ-ing the recession of ground-water discharge and for estimating mean ground-water recharge and discharge from streamflow records—Update: U.S. Geological Survey Water-Resources Investigations Report 98–4148, 43 p., accessed March 30, 2015, at http://pubs.er.usgs.gov/publication/wri984148.
Rutledge, A.T., and Mesko, T.O., 1996, Estimated hydrologic characteristics of shallow aquifer systems in the Valley and Ridge, the Blue Ridge, and the Piedmont Physiographic Provinces based on analysis of streamflow recession and base flow: U.S. Geological Survey Professional Paper 1422–B, 58 p., accessed March 30, 2015, at http://pubs.er.usgs.gov/publication/pp1422B.
Sanford, W.E., Nelms, D.L., Pope, J.P., and Selnick, D.L., 2012, Quantifying components of the hydrologic cycle in Virginia using chemical hydrograph separation and multiple regression analysis: U.S. Geological Survey Scientific Investigations Report 2011–5198, 152 p., accessed March 30, 2015, at http://pubs.usgs.gov/sir/2011/5198/.
Sanford, W.E., and Selnick, D.L., 2013, Estimation of evapotranspiration across the conterminous United States using a regression with climate and land-cover data: Journal of the American Water Resources Association, v. 49, no. 1, p. 217–230.
Seaton, W.J., and Burbey, T.J., 2005, Influence of ancient thrust faults on the hydrogeology of the Blue Ridge Province: Ground Water, v. 43, no. 3, p. 301–313.
Sheets, R.A., Hill, M.C., Haitjema, H.M., Provost, A.M., and Masterson, J.P., 2015, Simulation of water-table aquifers using specified saturated thickness: Ground Water, v. 53, no. 1, p. 151–157.
Simpson, C., and Kalaghan, T., 1989, Late Precambrian crustal extension preserved in Fries fault zone mylonites, southern Appalachaians: Geology, v. 17, p. 148–151.
Southworth, S., Bailey, C.M., Eaton, L.S., Hancock, G., Lamoreaux, M.H., Litwin, R.J., Burton, W.C., and Whitten, J., 2009, Geology of the Shenandoah National Park Region: Harrisonburg, Va., James Madison University, Virginia Geology Field Conference Guidebook, 40 p.
Swain, L.A., Mesko, T.O., and Hollyday, E.F., 2004, Sum-mary of the hydrogeology of the Valley and Ridge, Blue Ridge, and Piedmont Physiographic Provinces in the Eastern United States: U.S. Geological Survey Profes-sional Paper 1422–A, 23 p., accessed March 30, 2015, at http://pubs.er.usgs.gov/publication/pp1422A.
Tiedeman, C.R., Goode, D.J., and Hsieh, P.A., 1997, Numerical simulation of ground-water flow through glacial deposits and crystalline bedrock in the Mirror Lake area, Grafton County, New Hampshire: U.S. Geological Survey Professional Paper 1572, 50 p., accessed March 30, 2015, at http://pubs.er.usgs.gov/publication/pp1572.
Todd, D.K., and Mays, L.W., 2005, Groundwater hydrology: Hoboken, N.J., John Wiley & Sons, 636 p.
Tollo, R.P., Bailey, C.M., Borduas, E.A., and Aleinikoff, J.N., 2004, Mezoproterozoic geology of the Blue Ridge Province in north-central Virginia: Petrologic and structural perspectives on Grenvillian orogenesis and Paleozoic tectonic processes, in Southworth, S., and Burton, W., eds., Geology of the National Capital Region—Field trip guidebook: U.S. Geological Survey Circular 1264, 287 p.
White, B.A., 2012, Groundwater resources of the Blue Ridge geologic province, Virginia: Virginia Department of Environmental Quality Technical Bulletin 12-01, 209 p.
White, B.A., and Burbey, T.J., 2007, Evidence for structurally controlled recharge in the Blue Ridge Province, Virginia, USA: Hydrogeology Journal, v. 15, no. 5, p. 929–943, accessed March 30, 2015, at http://dx.doi.org/10.1007/s10040-006-0150-0.
Williams, L.J., Kath, R.L., Crawford, T.J., and Chapman, M.J., 2005, Influence of geologic setting on ground-water availability in the Lawrenceville area, Gwinnett County, Georgia: U.S. Geological Survey Scientific Investigations Report 2005–5136, 43 p., accessed March 30, 2015, at http://pubs.er.usgs.gov/publication/sir20055136.
Wright, W.G., 1990, Ground-water hydrology and quality in the Valley and Ridge and Blue Ridge Physiographic Provinces of Clarke County, Virginia: U.S. Geological Survey Water-Resources Investigations Report 90–4134, 61 p., accessed March 30, 2015, at http://pubs.er.usgs.gov/publication/wri904134.
Yager, R.M., Southworth, Scott, and Voss, C.I., 2008, Simulation of ground-water flow in the Shenandoah Valley, Virginia and West Virginia, using variable-direction anisotropy in hydraulic conductivity to represent bedrock structure: U.S. Geological Survey Scientific Investigations Report 2008–5002, 54 p., accessed March 30, 2015, at http://pubs.er.usgs.gov/publication/sir20085002.

Appendix 1. Borehole Geophysical Logs

50 Hydrogeology and Simulation of Groundwater Flow in Fractured-Rock Aquifers, Bedford County, Virginia
Figu
re 1
–1.
Bore
hole
geo
phsy
ical
logs
from
wel
l 33G
7 in
Bed
ford
Cou
nty,
Virg
inia
.
Dip
Ang
le o
fFea
ture
090
ATV
Imag
e
°072°09
°081°0
°0N
atur
alG
amm
a
RG-IP
A003
0
Cal
iper
68
INC
H
Res
(16N
)
M-M
HO
00040
Res
(64N
)
M-M
HO
00040
Late
ral M-
MH
O0004
0
Am
bien
tFlu
idTe
mp
FG
ED
9555 Pum
ping
Flui
dTe
mp
FG
ED
9555
Am
bien
tFlu
idR
es
M-M
HO
04101 P
umpi
ngFl
uid
Res
M-M
HO
04101
Am
bien
tFlo
wS
tatio
ns
NIM/LA
G53
53-
NIM/LA
G53
53-
0.0
50.0
100.
0
150.
0
200.
0
250.
0
DE
GR
EE
S
Depth, in feet below land surface
7.63
ft b
elow
land
su
rface
on
6/2
2/20
11
Cas
ing
to 5
5 ft
belo
wla
nd s
urfa
ce
EXPL
AN
ATIO
NTr
ansm
issi
ve fr
actu
re
Frac
ture
Folia
tion
Wat
er le
vel

Figu
re 1
–2.
Bore
hole
geo
phsy
ical
logs
from
wel
l 33G
2 S
OW 2
25 in
Bed
ford
Cou
nty,
Virg
inia
.
Dip
Ang
le o
fFea
ture
090
ATV
Imag
e
°072°09
°081°0
°0N
atur
alG
amm
a
RG-IP
A003
0
Cal
iper
68
INC
H
Res
(16N
)
M-M
HO
00040
Res
(64N
)
M-M
HO
00040
Late
ral M-
MH
O0004
0
Am
bien
tFlu
idTe
mp
Pum
ping
Flui
dTe
mp
Am
bien
tFlu
idR
es
Pum
ping
Flui
dR
es
Am
bien
tFlo
wS
tatio
ns
0.0
50.0
100.
0
150.
0
200.
0
DE
GR
EE
S
Depth, in feet below land surface
5557
DEG
F
5557
DEG
F
M-M
HO
091571
M-M
HO
091571
NIM/LA
G5.1
5.1-
NIM/LA
G5.1
5.1- Pum
ping
Flo
wS
tatio
ns
EXPL
AN
ATIO
NTr
ansm
issi
ve fr
actu
reFr
actu
re
Folia
tion
Wat
er le
vel
47.9
3 ft
belo
w
land
sur
face
on
8/8
/200
8
Cas
ing
to70
ftbe
low
land
sur
face
Appendix 1 51

52 Hydrogeology and Simulation of Groundwater Flow in Fractured-Rock Aquifers, Bedford County, Virginia
Figu
re 1
–3.
Bore
hole
geo
phsy
ical
logs
from
wel
l 35H
1 S
OW 2
26 in
Bed
ford
Cou
nty,
Virg
inia
.
Dip
Ang
le o
fFea
ture
090
ATV
Imag
e
°072°09
°081°0
°0N
atur
alG
amm
a
RG-IP
A003
0
Cal
iper
68
INC
H
Res
(16N
)
M-M
HO
00040
Res
(64N
)
M-M
HO
00040
Late
ral M-
MH
O0004
0
Am
bien
tFlu
idTe
mp
Pum
ping
Flui
dTe
mp
Am
bien
tFlu
idR
es
Pum
ping
Flui
dR
es
Am
bien
tFlo
wS
tatio
ns
0.0
50.0
100.
0
150.
0
200.
0
DE
GR
EE
SDepth, in feet below land surface
6265
DEG
F
6265
DEG
F
M-M
HO
0652
M-M
HO
0652
NIM/LA
G5.4
5.4-
NIM/LA
G5.4
5.4-
EXPL
AN
ATIO
NTr
ansm
issi
ve fr
actu
re
Folia
tion
Wat
er le
vel
Pum
ping
Flo
wS
tatio
ns
18.6
5 ft
belo
w
land
sur
face
on
9/3
/200
8
Cas
ing
to38
ftbe
low
land
sur
face

Figu
re 1
–4.
Bore
hole
geo
phsy
ical
logs
from
wel
l 33G
1 S
OW 2
24 in
Bed
ford
Cou
nty,
Virg
inia
.
Dip
Ang
le o
fFea
ture
090
ATV
Imag
e
°072°09
°081°0
°0N
atur
alG
amm
a
RG-IP
A003
0
Cal
iper
INC
H
Res
(16N
)
M-M
HO
00040
Res
(64N
)
M-M
HO
00040
Late
ral M-
MH
O0004
0
Am
bien
tFlu
idTe
mp
Pum
ping
Flui
dTe
mp
Am
bien
tFlu
idR
es
Pum
ping
Flui
dR
es
Am
bien
tFlo
wS
tatio
ns
0.0
DE
GR
EE
S
Depth, in feet below land surface
25.0
50.0
75.0
100.
0
69
6263
DEG
F
6263
DEG
FM-
MH
O7.3
5.3
M-M
HO
7.35.3
NIM/LA
G2
2-
NIM/LA
G2
2-
EXPL
AN
ATIO
N
Tran
smis
sive
frac
ture
Frac
ture
Bedd
ing
Wat
er le
vel
Pum
ping
Flo
wS
tatio
ns
11.6
3 ft
belo
w
land
sur
face
on
7/3
1/20
08
Cas
ing
to 5
1 ft
belo
wla
nd s
urfa
ce
Appendix 1 53

54 Hydrogeology and Simulation of Groundwater Flow in Fractured-Rock Aquifers, Bedford County, Virginia
Dip
Ang
le o
fFea
ture
090
Cal
iper
69
INC
H
Res
(16N
)
Res
(64N
)
Late
ral
Am
bien
tFlu
idTe
mp
FG
ED
2505
Am
bien
tFlu
idR
es
DE
GR
EE
S
Depth, in feet below land surfaceA
TVIm
age
°072°09
°081°0
°0N
atur
alG
amm
a
RG-IP
A054
0
0.0
50.0
100.
0
150.
0
200.
0
250.
0
300.
0
350.
0
Res MH
O0004
0M-
MH
O012
011
129.
99 ft
bel
ow
land
sur
face
on
8/1
9/20
10
Cas
cadi
ng w
ater
fro
m fr
actu
re a
t10
3.8
ftbe
low
land
sur
face
Cas
ing
to 8
5 ft
belo
wla
nd s
urfa
ce
EXPL
AN
ATIO
NTr
ansm
issi
ve fr
actu
re
Frac
ture
Folia
tion
Wat
er le
vel
Bedd
ing
Figu
re 1
–5.
Bore
hole
geo
phsy
ical
logs
from
wel
l 34E
1 in
Bed
ford
Cou
nty,
Virg
inia
.

Manuscript was approved on July 30, 2015
For further information about this publication, contact: Director USGS Virginia Water Science Center 1730 East Parham Road Richmond, VA 23228 (804) 261-2600
Or visit the Virginia Water Science Center Web site at http://va.water.usgs.gov
Publishing support provided by the USGS Science Publishing Network, Raleigh Publishing Service Center


Printed on recycled paper
McCoy and others—
Hydrogeology and Simulation of Groundw
ater Flow in Fractured-Rock Aquifers, Bedford County, Virginia—
Scientific Investigations Report 2015–5113
ISSN 2328-031X (print)ISSN 2328-0328 (online)http://dx.doi.org/10.3133/sir20155113