Embed Size (px)
Citation preview
HYDROGEOLOGY AND GROUNDWATER
RESOURCES OF THE COLLIE BASIN,
WESTERN AUSTRALIA
HG 52002
Water and RiversCommission
HYDROGEOLOGY AND GROUNDWATERRESOURCES OF THE COLLIE BASIN,
WESTERN AUSTRALIA
by
S. VARMA
Water and Rivers CommissionResource Science Division
WATER AND RIVERS COMMISSION
HYDROGEOLOGICAL RECORD SERIES
REPORT HG 5
2002
December 2002
ISBN 0-7309-7449-9ISSN 1329-542X
Recommended ReferenceVARMA, S., 2002, Hydrogeology and GroundwaterResources of the Collie Basin, Western Australia,Water and Rivers Commission, HydrogeologicalRecord Series, Report HG 5, 80 p.
Copies available from:Copies available from:Copies available from:Copies available from:Copies available from:Resource Science DivisionWater and Rivers Commission3 Plain Street EAST PERTHWESTERN AUSTRALIA 6004Telephone: (08) 9278 0300 Facsimile (08) 9278 0301http://www.wrc.gov.au
WWWWWe welcome your feedback:e welcome your feedback:e welcome your feedback:e welcome your feedback:e welcome your feedback:A publication feedback form can be foundat http://www.wrc.wa.gov.au/public/feedback/
Cover photograph: Stockton Lake, Collie Basin [taken by S Varma, 2002]
Stockton Lake in the Collie Basin is a disused open cut coal mine that subsequently filled with water.The surface area of the lake is about 15 ha and it is a popular recreation site for activities
such as water skiing and swimming. The pH of the lake water varies between 3 and 4.

Acknowledgments
The support provided by the Collie Water Advisory
Group and the Collie Basin Research SteeringCommittee in assessing the hydrogeology andgroundwater resources of the Collie Basin is
acknowledged. Acknowledgments are due to Western
Power Corporation, Griffin Coal Mining Company andWesfarmers Coal Limited for their support andinformation during the course of this study.
Contents
Summary
1 Introduction ........................................................................................ 11.1 Purpose, scope and methodology ............................................................................................. 1
1.2 Previous studies ........................................................................................................................ 41.3 Physiography ............................................................................................................................ 5
1.3.1 Climate ........................................................................................................................... 51.3.2 Geomorphology .............................................................................................................. 5
1.3.3 Drainage ........................................................................................................................ 5
2 Geology ............................................................................................. 92.1 Overview ................................................................................................................................. 9
2.2 Archaean ................................................................................................................................. 92.3 Permian ................................................................................................................................. 10
2.3.1 Stockton Group ............................................................................................................. 102.3.1.1 Shotts Formation ................................................................................................ 10
2.3.1.2 Moorhead Formation.......................................................................................... 102.3.2 Collie Group ................................................................................................................. 10
2.3.2.1 Westralia Sandstone ........................................................................................... 102.3.2.2 Ewington Coal Measures .................................................................................... 10
2.3.2.3 Allanson Sandstone ............................................................................................ 102.3.2.4 Premier Coal Measures ...................................................................................... 10
2.3.2.5 Muja Coal Measures .......................................................................................... 122.4 Cretaceous ............................................................................................................................. 12
2.4.1 Nakina Formation ......................................................................................................... 122.5 Tertiary to Recent ..................................................................................................................... 12
3 Hydrogeology .................................................................................. 143.1 Groundwater occurrence/hydrostratigraphy ............................................................................. 14
3.2 Groundwater flow system ........................................................................................................ 173.3 Potentiometric head distribution ............................................................................................... 19
3.4 Water level fluctutation ............................................................................................................ 193.5 Recharge................................................................................................................................ 19
3.5.1 Rainfall recharge by chloride mass balance.................................................................... 193.5.2 Recharge based on groundwater balance ...................................................................... 23
3.5.3 Recharge to Permian aquifers ........................................................................................ 233.6 Groundwater discharge ........................................................................................................... 25
3.6.1 Groundwater discharge to Collie River ........................................................................... 253.6.2 Evapotranspiration from vegetation................................................................................ 25
3.7 Storage ................................................................................................................................... 253.8 Aquifer parameters ................................................................................................................. 25
3.9 Groundwater quality ............................................................................................................... 273.9.1 Major ions .................................................................................................................... 27
3.9.2 pH ................................................................................................................................ 273.9.3 Iron .............................................................................................................................. 27
3.9.4 Nitrate .......................................................................................................................... 273.9.5 Sulphate ....................................................................................................................... 28
3.9.6 Chloride ....................................................................................................................... 283.9.7 Hardness ...................................................................................................................... 28
3.9.8 Heavy metals ................................................................................................................ 283.9.9 Salinity .......................................................................................................................... 28
3.9.10 Potability ..................................................................................................................... 28
4 Groundwater abstraction and impacts ............................................... 334.1 Historical groundwater abstraction .......................................................................................... 33
4.2 Groundwater levels recovery/decline ....................................................................................... 344.3 Impact of abstraction on river pools ........................................................................................ 37
4.3.1 Recovery of groundwater levels near pools of South Branch ............................................ 41
5 Water balance .................................................................................. 425.1 General .................................................................................................................................. 42
5.2 Surface water inflow ................................................................................................................ 425.2.1 South Branch catchment yield ........................................................................................ 425.2.2 Inflow from Collie River East Branch ............................................................................... 42
5.3 Surface water outflow .............................................................................................................. 425.4 Groundwater recharge from South Branch and East Branch ..................................................... 42
5.5 Groundwater discharge to the Collie River system .................................................................... 435.6 Surface water balance ............................................................................................................. 43
5.7 Components of groundwater balance ...................................................................................... 435.7.1 Groundwater abstraction ............................................................................................... 43
5.7.2 Evapotranspiration from vegetation in areas of shallow watertable ................................. 435.7.3 Groundwater recharge .................................................................................................. 44
5.7.4 Change in storage ........................................................................................................ 445.8 Groundwater balance ............................................................................................................. 44
6 Groundwater management issues ..................................................... 456.1 History of management .......................................................................................................... 456.2 Groundwater use ................................................................................................................... 45
6.2.1 Past abstraction ............................................................................................................. 456.2.2 Future groundwater demand ......................................................................................... 46
6.3 Strategies for water resources management ............................................................................ 466.4 Pertinent groundwater management issues .............................................................................. 47
6.4.1 Artificial supplementation of river pools .......................................................................... 486.4.2 Recovery of open cut mine void water levels ................................................................... 54
6.4.3 Quality of groundwater discharge to the Collie River ...................................................... 576.5 Research and monitoring......................................................................................................... 59
7 Conclusions ..................................................................................... 61
8 References ...................................................................................... 62
9 Glossary .......................................................................................... 64
FFFFFiguresiguresiguresiguresigures
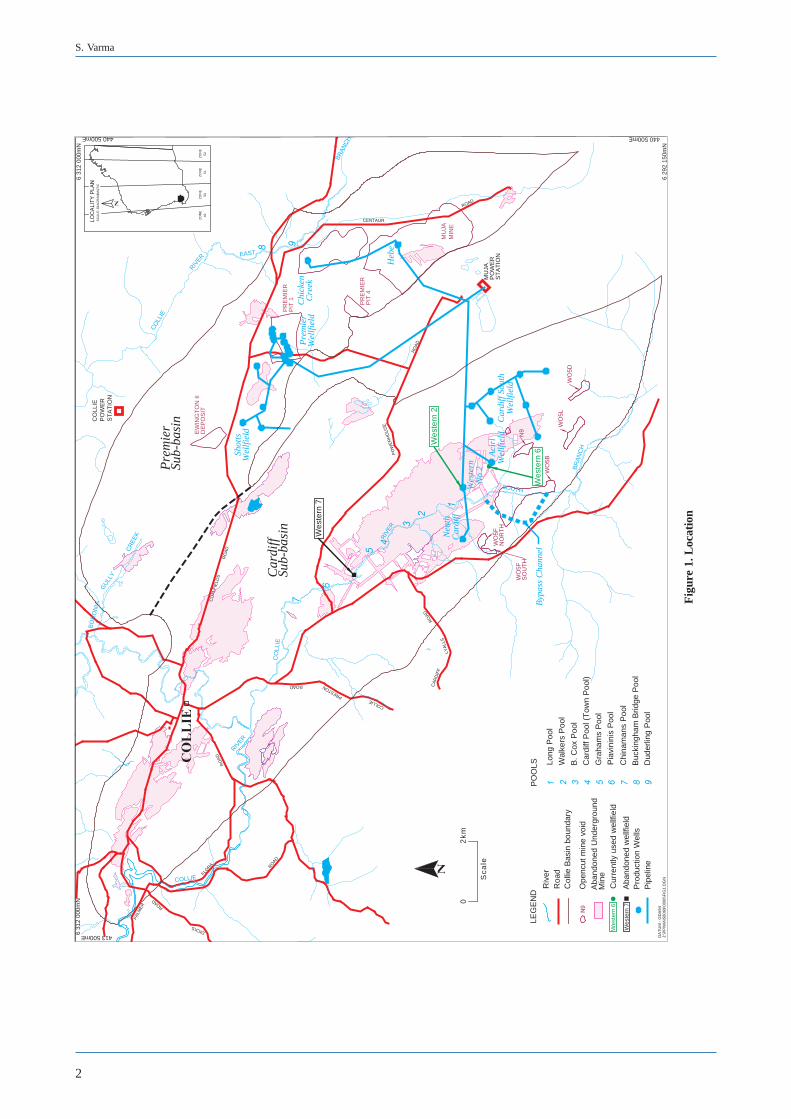
1. Location ............................................................................................................................................................... 2
2. Bore locations......................................................................................................................................................... 3
3. Annual rainfall – Collie Post Office .......................................................................................................................5
4. Annual rainfall – Muja ........................................................................................................................................... 5
5. Gravity anomaly of the Collie Basin ...................................................................................................................... 6
6. Topography and drainage ....................................................................................................................................... 7
7. Schematic structural cross sections of the Collie Basin ....................................................................................... 11
8. Contours of the base of Nakina Formation with strata subcrop ........................................................................... 13
9. Nakina Formation isopachs and saturated thickness ............................................................................................ 16
10. Watertable contours .............................................................................................................................................. 18
11. Schematic hydrogeological section (SW–NE) ..................................................................................................... 20
12. Schematic hydrogeological section (NW–SE) ..................................................................................................... 21
13. Depth to watertable .............................................................................................................................................. 22
14. Generalised water balance of Collie Basin aquifers under pre-mining conditions derived from the model ........ 24
15. Generalised water balance of Collie Basin aquifers for 1999 derived from the model ........................................24
16. Groundwater quality, Piper diagram.....................................................................................................................27
17. Groundwater pH ................................................................................................................................................... 31
18. Groundwater salinity at watertable .......................................................................................................................32
19. Correlation between coal production and mine dewatering in the Collie Basin ..................................................35
20. Interpreted past mine dewatering from the Collie Basin ......................................................................................35
21. Correlation between coal production and mine dewatering in
the Muja Coal Measures (Cardiff Sub-basin) ....................................................................................................... 35
22. Interpreted past mine dewatering from the Muja Coal Measures (Cardiff Sub-basin) ......................................... 35
23. Correlation between coal production and mine dewatering in the Premier Sub-basin ......................................... 35
24. Interpreted past mine dewatering from the Premier Sub-basin ............................................................................35
25. Hydrographs of the Muja aquifer, Cardiff Sub-basin ........................................................................................... 36
26. Hydrographs of the Premier and Allanson aquifers, Cardiff Sub-basin ............................................................... 36
27. Hydrographs of the aquifers in the Premier Sub-basin ......................................................................................... 36
28. Water levels decline or recovery – 1998 to 1999 ................................................................................................. 38
29. Water levels decline or recovery – 1999 to 2000 ................................................................................................. 39
30. Hydrogeological section along river pools ...........................................................................................................40
31. Groundwater levels and abstractions adjacent to Buckingham Mills Pool .......................................................... 41
32. Hydrographs of bore W679 near Long Pool ........................................................................................................ 41
33. Baseflow separation for streamflow at S612002 on Collie River ........................................................................ 43
FFFFFigures igures igures igures igures (continued)(continued)(continued)(continued)(continued)
34. Variation of conductance per unit area with pool dimensions of the South Branch pools ...................................50
35. Pool supplementation requirements .....................................................................................................................51
36. Water level decline in pools .................................................................................................................................52
37. Pool filling times ..................................................................................................................................................53
38. Buckingham Mills Pool supplementation requirements ....................................................................................... 54
39. Western 5B void water balance model calibration ...............................................................................................54
40. Predicted Western 5B void water levels ............................................................................................................... 56
41. Predicted Western 5B void salinity ......................................................................................................................56
42. Comparison of observed and calculated pH in Western 5B void ......................................................................... 57
43. Salinity variation in South Branch ........................................................................................................................58
TTTTTablesablesablesablesables
1. Generalised stratigraphy of the Collie Basin .......................................................................................................... 9
2. Hydrostratigraphy of the Collie Basin .................................................................................................................. 15
3. Components of groundwater balance ...................................................................................................................23
4. Recharge to Permian aquifers ...............................................................................................................................23
5. Groundwater storage ............................................................................................................................................ 26
6. Summary of aquifer parameters ........................................................................................................................... 26
7. Hydraulic parameters derived from the model .....................................................................................................26
8. Chemical analyses of groundwater .......................................................................................................................29
9. Summary of recent groundwater abstraction ........................................................................................................ 33
10. Interpreted watertable elevation near river pools ................................................................................................. 41
11. Components of surface water balance .................................................................................................................. 43
12. Components of groundwater balance ...................................................................................................................44
13. Average annual groundwater use (major abstractions, 1984–1997).....................................................................46
14. Environmental water provisions for South Branch pools ..................................................................................... 47
15. Water balance components of the pools ............................................................................................................... 49
16. Physical data of pools ...........................................................................................................................................49
17. Summary of pool supplementation requirements ................................................................................................. 50
18. Program listing – Western 5B void water balance simulation .............................................................................. 55
19. Water quality of South Branch pools .................................................................................................................... 57
AppendicesAppendicesAppendicesAppendicesAppendices
I. Summary of bore data .......................................................................................................................................... 66
II. Groundwater balance of the Collie Basin under pre-mining steady-state conditions derived from the model ....71
III. Groundwater balance of the Collie Basin for 1999 derived from the model .......................................................72
IV. Western 5B opencut mine void water balances ....................................................................................................73
Summary
The Collie Basin, which forms a northwesterly trendingvalley in the Darling Plateau has a maximum length of
27 km and a maximum width of about 13 km. It issurrounded by Archaean granitic rocks of the YilgarnCraton. The surface area of the basin is about
230 km2. The basin is bilobate in shape and is filledwith Permian and Cretaceous sediments having amaximum thickness of 1400 m.
An improved understanding of the hydrogeology of thebasin has been developed based on extensive literature
review and analysis of drilling, testing and monitoringdata. The hydrostratigraphy of the basin has beendefined and an aquifer nomenclature proposed. Data
were analysed to determine the watertable fluctuations,regional effects of groundwater abstraction, surfacewater and groundwater interaction, and water
balance. The surface water and groundwater balanceof the Collie Basin have been established.
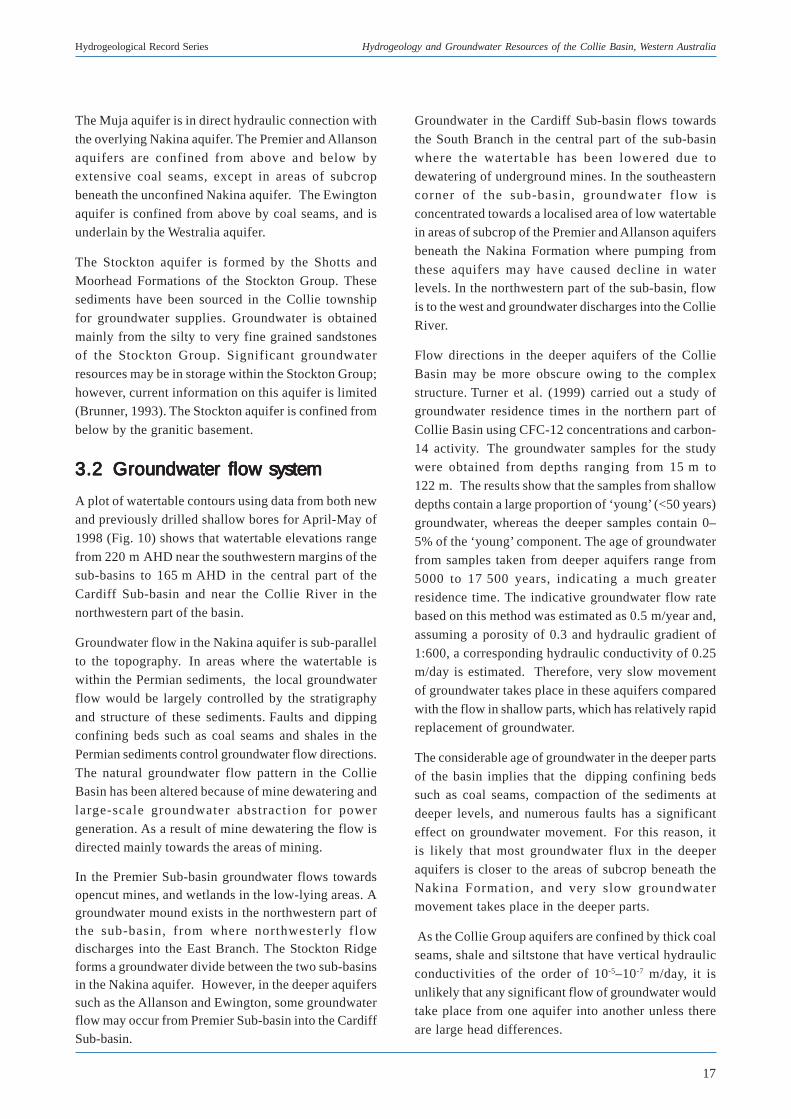
Based on data from about 140 monitoring bores in thebasin, a synoptic watertable contour map has beenprepared, which has enabled the shallow groundwater
flow in the basin to be defined. The regionalgroundwater flow direction in the Collie Basin is highlymodified from a conceptual pre-mining flow pattern
because of mine dewatering and large-scalegroundwater abstraction for power generation. The netgroundwater recharge to the basin from direct
infiltration of rainfall is estimated as 19 106 m3/year.In addition there is 1 106 m3/year of recharge fromstreams flowing into the basin. The recharge to the
basin equates to about 10% of the annual rainfall. Thevolume of abstractable groundwater stored within thebasin is about 7100 106 m3; however, economics and
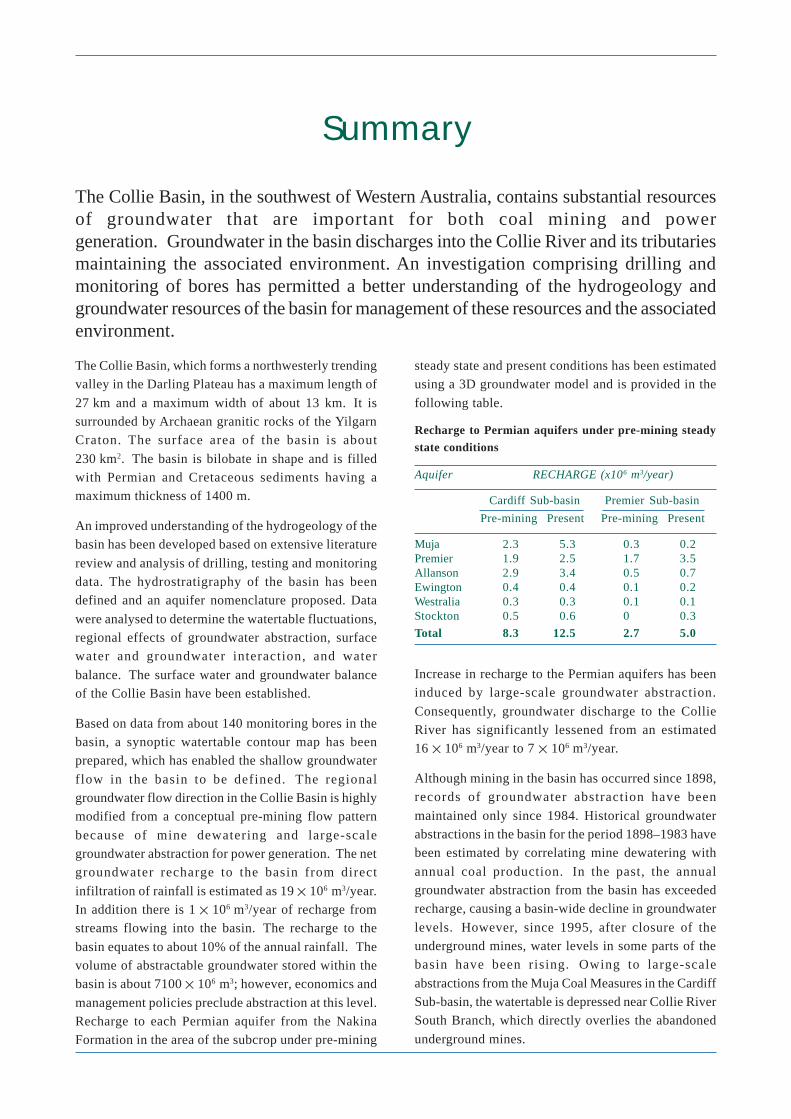
management policies preclude abstraction at this level.Recharge to each Permian aquifer from the NakinaFormation in the area of the subcrop under pre-mining
The Collie Basin, in the southwest of Western Australia, contains substantial resourcesof groundwater that are important for both coal mining and powergeneration. Groundwater in the basin discharges into the Collie River and its tributariesmaintaining the associated environment. An investigation comprising drilling andmonitoring of bores has permitted a better understanding of the hydrogeology andgroundwater resources of the basin for management of these resources and the associatedenvironment.
steady state and present conditions has been estimatedusing a 3D groundwater model and is provided in the
following table.
Recharge to Permian aquifers under pre-mining steadystate conditions
Aquifer RECHARGE (x106 m3/year)
Cardiff Sub-basin Premier Sub-basin
Pre-mining Present Pre-mining Present
Muja 2.3 5.3 0.3 0.2Premier 1.9 2.5 1.7 3.5Allanson 2.9 3.4 0.5 0.7Ewington 0.4 0.4 0.1 0.2Westralia 0.3 0.3 0.1 0.1Stockton 0.5 0.6 0 0.3
Total 8.3 12.5 2.7 5.0
Increase in recharge to the Permian aquifers has beeninduced by large-scale groundwater abstraction.
Consequently, groundwater discharge to the CollieRiver has significantly lessened from an estimated16 106 m3/year to 7 106 m3/year.
Although mining in the basin has occurred since 1898,records of groundwater abstraction have been
maintained only since 1984. Historical groundwaterabstractions in the basin for the period 1898–1983 havebeen estimated by correlating mine dewatering with
annual coal production. In the past, the annualgroundwater abstraction from the basin has exceededrecharge, causing a basin-wide decline in groundwater
levels. However, since 1995, after closure of theunderground mines, water levels in some parts of thebasin have been rising. Owing to large-scale
abstractions from the Muja Coal Measures in the CardiffSub-basin, the watertable is depressed near Collie RiverSouth Branch, which directly overlies the abandoned
underground mines.
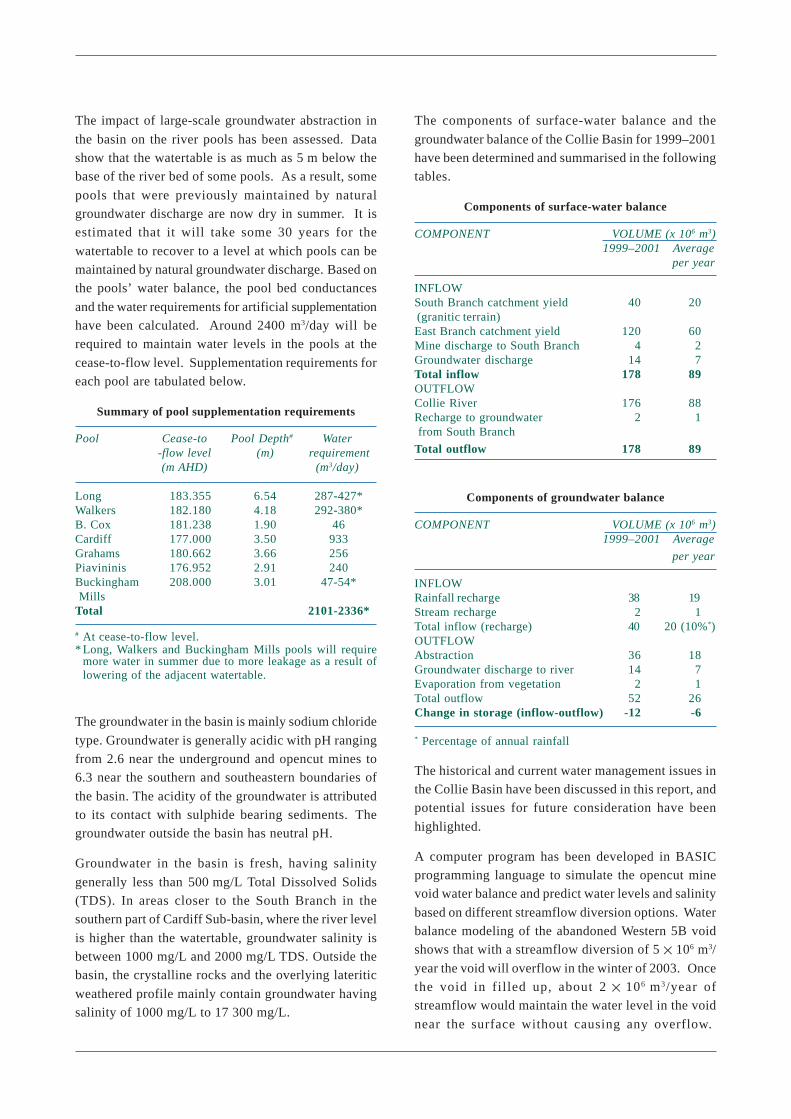
The impact of large-scale groundwater abstraction in
the basin on the river pools has been assessed. Datashow that the watertable is as much as 5 m below thebase of the river bed of some pools. As a result, some
pools that were previously maintained by naturalgroundwater discharge are now dry in summer. It isestimated that it will take some 30 years for the
watertable to recover to a level at which pools can bemaintained by natural groundwater discharge. Based onthe pools’ water balance, the pool bed conductances
and the water requirements for artificial supplementationhave been calculated. Around 2400 m3/day will berequired to maintain water levels in the pools at the
cease-to-flow level. Supplementation requirements foreach pool are tabulated below.
Summary of pool supplementation requirements
Pool Cease-to Pool Depth# Water-flow level (m) requirement(m AHD) (m3/day)
Long 183.355 6.54 287-427*Walkers 182.180 4.18 292-380*B. Cox 181.238 1.90 46Cardiff 177.000 3.50 933Grahams 180.662 3.66 256Piavininis 176.952 2.91 240Buckingham 208.000 3.01 47-54* MillsTotal 2101-2336*
# At cease-to-flow level.* Long, Walkers and Buckingham Mills pools will require
more water in summer due to more leakage as a result oflowering of the adjacent watertable.
The groundwater in the basin is mainly sodium chloride
type. Groundwater is generally acidic with pH rangingfrom 2.6 near the underground and opencut mines to6.3 near the southern and southeastern boundaries of
the basin. The acidity of the groundwater is attributedto its contact with sulphide bearing sediments. Thegroundwater outside the basin has neutral pH.
Groundwater in the basin is fresh, having salinity
generally less than 500 mg/L Total Dissolved Solids(TDS). In areas closer to the South Branch in thesouthern part of Cardiff Sub-basin, where the river level
is higher than the watertable, groundwater salinity isbetween 1000 mg/L and 2000 mg/L TDS. Outside thebasin, the crystalline rocks and the overlying lateritic
weathered profile mainly contain groundwater havingsalinity of 1000 mg/L to 17 300 mg/L.
The components of surface-water balance and the
groundwater balance of the Collie Basin for 1999–2001have been determined and summarised in the followingtables.
Components of surface-water balance
COMPONENT VOLUME (x 106 m3)1999–2001 Average
per year
INFLOWSouth Branch catchment yield 40 20 (granitic terrain) East Branch catchment yield 120 60Mine discharge to South Branch 4 2Groundwater discharge 14 7Total inflow 178 89OUTFLOWCollie River 176 88Recharge to groundwater 2 1 from South Branch
Total outflow 178 89
Components of groundwater balance
COMPONENT VOLUME (x 106 m3)1999–2001 Average
per year
INFLOWRainfall recharge 38 19 Stream recharge 2 1Total inflow (recharge) 40 20 (10%*)OUTFLOWAbstraction 36 18Groundwater discharge to river 14 7Evaporation from vegetation 2 1Total outflow 52 26Change in storage (inflow-outflow) -12 -6
* Percentage of annual rainfall
The historical and current water management issues inthe Collie Basin have been discussed in this report, andpotential issues for future consideration have been
highlighted.
A computer program has been developed in BASICprogramming language to simulate the opencut minevoid water balance and predict water levels and salinity
based on different streamflow diversion options. Waterbalance modeling of the abandoned Western 5B voidshows that with a streamflow diversion of 5 106 m3/
year the void will overflow in the winter of 2003. Oncethe void in filled up, about 2 106 m3/year ofstreamflow would maintain the water level in the void
near the surface without causing any overflow.
Alternatively, continuation of a streamflow diversion
of 5 106 m3/year will result in an overflow of3 106 m3/year. The water in the mine voids willincrease in salinity if streamflow is continually not
diverted to the voids. Although, the diversion of waterfrom the South Branch into the voids may reduce theriver flows downstream of the voids, it could help
recharge the groundwater and, if used for water supply,reduce the demand on the groundwater resources of thebasin.
An assessment has been made of the potential dischargeof low pH groundwater in the Collie Basin river system
as the groundwater level rises, as well as potentialoverflow of acidic water from the opencut mine voidsunder certain conditions. The effects of discharge of
groundwater of low salinity on the salinity of the Collie
River show that the current discharge volumes(7 106 m3/year) cause a reduction of about 7% inthe Collie River salinity. Reduction in salinity could
be as much as 15% if the groundwater levels in thebasin recovered to pre-mining levels. Under increasedgroundwater discharge conditions, the resultant average
pH of the Collie River could reduce from currentlyneutral to about 6.5. As a result, some toxic pollutantssuch as As, Be, Cu, Ni, Mo and U, which are present in
the Collie Basin coal and able to be mobilised by acidicgroundwater, could enter the river. Although, theconcentrations of these elements are likely to be low,
further research may be required to confirm this andstudy their downstream impacts.
1
Hydrogeological Record Series Hydrogeology and Groundwater Resources of the Collie Basin, Western Australia
1 Introduction
1.11.11.11.11.1 Purpose, scope andPurpose, scope andPurpose, scope andPurpose, scope andPurpose, scope andmethodologymethodologymethodologymethodologymethodology
The Collie Basin lies about 160 km south-southeast of
Perth, in the southwest of Western Australia, and
contains the only producing coal mines in the State(Fig. 1). These provide fuel for generation of about 70%
of the electricity that is consumed in the southwest of
Western Australia. The basin contains substantialresources of fresh groundwater that are important for
both coal mining and power generation. The control
of groundwater discharge to the opencut mines isessential to ensure safe and efficient operation.
Groundwater from the basin is used for cooling at Muja
and Collie power stations. A good understanding of thehydrogeology and groundwater resources of the basin
is important for sound management of the groundwater
resources and the associated environment.
In 1996, the Collie Water Advisory Group (CWAG),
coordinated by the Department of Resource
Development, proposed a strategy to upgrade themonitoring bore network to improve the current
understanding of the hydrogeology of the basin. This
strategy provided for the establishment of anapproximate 1.5 km grid of shallow monitoring bores
throughout the basin (Collie Water Advisory Group,
1996).
CWAG commissioned a desktop study by consultants
Dames and Moore to review the existing network andselect additional sites to establish a network of
monitoring bores on a 1.5 km grid. Dames and Moore
concluded that about 100 additional monitoring boreswere required to complete the network, and identified
appropriate drilling sites. These included 11 boresites
to be drilled by Griffin Coal under groundwaterallocation licence conditions applied by the Water and
Rivers Commission (Dames and Moore, 1995). CWAG
recommended that Water and Rivers Commissioncoordinate the drilling of the monitoring bores in the
Collie Basin and analyse all data to develop a good
understanding of the hydrogeology. It wasrecommended that subsequent monitoring of the bores
be carried out by Griffin Coal, Wesfarmers Coal and
Western Power Corporation, who are the major usersof groundwater in the basin.
As a part of this study the monitoring bore layout
proposed by Dames and Moore was reviewed and
modified. Modifications in boresite locations wereintroduced taking into account access to boresites, the
need to install some monitoring bores near the Collie
River (both South Branch and East Branch), and toavoid areas vulnerable to subsidence. As required by
CALM, a botanical survey at each site was carried out
to ensure that drilling did not affect endangered flora(Strawbridge, 1997). Achaeological and anthropological
surveys were conducted to avoid drilling near sites of
Aboriginal heritage (Harris, 1997; Chown et al., 1997).
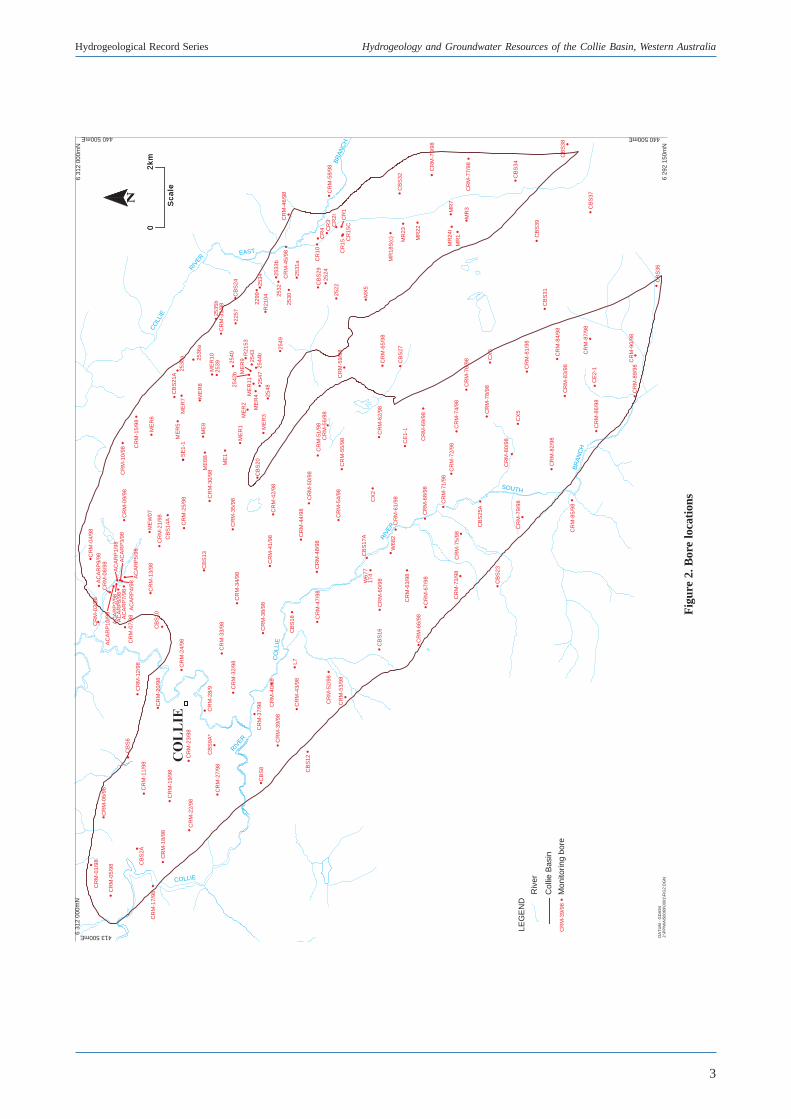
Montoring bores were constructed by Water and Rivers
Commission (WRC) at 80 sites to a maximum depth of76 m during the months of February, March and
April 1998. These bores are known as the Collie
Regional Monitoring bores and are denoted by theprefix CRM. A map of the Collie Basin showing all
monitoring bores is given in Figure 2. At nine sites,
bores could not be constructed due to drillinglimitations. Chemical analyses of groundwater samples
from the bores were carried out and the quality of the
groundwater in the basin has been assessed. A drillingand bore completion report was prepared incorporating
the results of drilling and testing (Mohsenzadeh,
1998). A summary of bore data is given in Appendix I.
The geology and hydrostratigraphy of the basin is
reviewed and an aquifer nomenclature is proposed. This
report provides an understanding of the shallowgroundwater flow systems based on extensive literature
review and drilling and testing data. Monitoring data
were analysed to determine the watertable fluctuations,regional effects of groundwater abstraction, surface
water and groundwater interaction, and water balance.
Groundwater recharge to the basin were estimated
based on chloride mass balance and water balance.
Groundwater discharge in the basin has been assessedand quantified. Estimates of groundwater in storage in
the basin have been derived by determining the volume
of silt-free sandstone within the Permian units.
An improved understanding of the groundwater flow
in the deeper layers of the basin has been achieved using
a 3D finite difference groundwater flow model
2
S. Varma
Aba
ndon
ed w
ellfi
eld
ROAD
DICKS
ROAD
COLLIEPRESTON
RO
AD
LYA
LLS
CO
ALF
IELD
SR
OA
D
PO
WE
RH
OU
SE
RO
AD
CENTAUR
ROAD
PA
LME
R
ROAD
FLO
RA
RO
AD
Byp
ass
Cha
nnel
0
Sc
ale
2k
m
6 31
2 00
0mN
440 500mE
6 29
2 15
0mN
440 500mE
6 31
2 00
0mN
413 500mE
CA
RD
IFF
PO
OLS Lo
ng P
ool
Car
diff
Poo
l (T
own
Poo
l)
Buc
king
ham
Brid
ge P
ool
Dud
erlin
g P
ool
Wal
kers
Poo
l
B. C
ox P
ool
Gra
ham
s P
ool
LEG
EN
D
Roa
dR
iver
Heb
e
Nea
thC
ardi
ff
Wes
tern
No
2
Car
diff
Sou
thW
ellf
ield
Shot
tsW
ellf
ield
Aci
rlW
ellf
ield
Chi
cken
Cre
ekP
rem
ier
Wel
lfie
ld
Pre
mie
rSu
b-ba
sin
Car
diff
Sub-
basi
n
EW
ING
TO
N II
DE
PO
SIT
PR
EM
IER
PIT
1 PR
EM
IER
PIT
4
MU
JAM
INE
Pia
vini
nis
Poo
l
Chi
nam
ans
Poo
l
CO
LLIE
PO
WE
RS
TA
TIO
N
MU
JAP
OW
ER
ST
AT
ION
WO
5FN
OR
TH
WO
5FS
OU
TH
WO
5B
N9
WO
5L
WO
5D
Wes
tern
7
Wes
tern
2
SC
ALE
: DIA
GR
AM
MA
TIC
ZO
NE
49
ZO
NE
50
ZO
NE
51
ZO
NE
52
Wes
tern
6
COLLIE
RIVER
CO
LLIE
RIV
ER
BR
AN
CH
CO
LLIE
RIVER EAST
BR
AN
CH
SOUTH
BO
RO
NIA
CR
EE
K
GU
LLY
Col
lie B
asin
bou
ndar
y
Wes
tern
7
Wes
tern
6
Pip
elin
eP
rodu
ctio
n W
ells
Aba
ndon
ed U
nder
grou
ndM
ine
Cur
rent
ly u
sed
wel
lfiel
d
DA
TU
M -
GD
A94
J:\P
P\W
A\5
8069
\000
6\F
IG1.
DG
N
Ope
ncut
min
e vo
id
Fig
ure
1. L
ocat
ion
3
Hydrogeological Record Series Hydrogeology and Groundwater Resources of the Collie Basin, Western Australia
0
Sc
ale
2k
m
W67
7
17
4
0
Sc
ale
2k
m
LEG
EN
D
Riv
erCOLLIE
RIVER
CO
LLIE
RIV
ER
BR
AN
CH
CO
LLIE
RIVER
EAST
BR
AN
CH
SOUTH
CR
M-0
1/98
C
RM
-06/
98
CB
S2A
CR
M-1
7/98
CR
M-1
8/98
CR
M-0
5/98
CR
M-1
1/98
CB
S6
CR
M-1
2/98
CR
M-1
9/98
CR
M-2
2/98
CR
M-2
3/98
CB
S9A
*C
RM
-27/
98
CB
S8
CR
M-2
8/9
CR
M-2
0/98
CR
M-2
4/98
CB
S10
CR
M-0
7/98
CR
M-3
2/98
AC
AR
P10
/98
CR
M-0
3/98
AC
AR
P9/
98C
RM
-08/
98
CR
M-0
4/98
AC
AR
P1/
98A
CA
RP
3/98
AC
AR
P2/
98A
CA
RP
8/98
AC
AR
P7/
98A
CA
RP
4/98
AC
AR
P5/
98
CR
M-1
3/98
CR
M-3
3/98
CR
M-3
4/98
CR
M-3
8/98
CR
M-4
1/98
CB
S13
CR
M-2
5/98
CR
M-2
1/98
CB
S14
A
ME
W07
CR
M-3
0/98
CR
M-3
5/98
CR
M-3
7/98 C
RM
-40/
98
CR
M-0
9/98
CR
M-1
0/98
CR
M-1
5/98
ME
R6
ME
R5
CB
S21
A
SE
1-1
ME
R7
2538
a
ME
6BM
ER
8M
E8
ME
1
ME
R1
ME
R2
ME
R10
2539
2536
a
2535
bC
RM
-31/
98
2257
CB
S24
2299
2542
b ME
R9
R21
53M
ER
11M
ER
425
4725
4325
44b
R21
0425
34
2532
2548
ME
R3
2549
2530
2533
b
2540
CR
M-4
5/98
CR
M-4
6/98
2531
a
CR
4 CR
3C
R2I
CR
M-5
8/98
CR
1C
R15
CC
R15
2524
CB
S29
2522
MX
5
CR
10
MR
18S
(c)
MR
23
MR
22
CB
S32
CR
M-7
0/98
CR
M-7
7/98
MR
24I
MR
7
MR
3
MR
1
CR
M-6
2/98
CR
M-6
5/98
CB
S27
CR
M-6
9/98
CR
M-7
6/98
CR
M-7
4/98
CE
1-1
CR
M-7
2/98
CR
M-7
1/98
CR
M-6
1/98C
X2
CR
M-5
5/98
CR
M-5
9/98
CR
M-5
6/98
CR
M-5
1/98
CR
M-5
4/98
CR
M-5
0/98
CR
M-4
2/98
CB
S18 C
RM
-47/
98
CR
M-4
4/98
CR
M-4
8/98
CB
S17
A
CB
S16
CR
M-6
0/98
W68
2
CR
M-6
3/98
CR
M-6
7/98
C
RM
-68/
98
CR
M-7
5/98
C
RM
-73/
98
CR
M-6
6/98
CB
S23
CB
S25
A
CR
M-7
9/98
CR
M-8
5/98
CR
M-3
9/98
CB
S12
CR
M-4
3/98
L7
CR
M-5
2/98
CR
M-5
3/98
CB
S20
CR
M-7
8/98
CX
5
CX
6
CR
M-8
0/98
CB
S34
CB
S31
CB
S39
CB
S37
CB
S38
CB
S36
CR
M-8
4/98
CR
M-8
7/98
CR
M-8
1/98
CR
M-8
3/98
CE
2-1
CR
M-8
9/98
CR
M-9
0/98
CR
M-8
6/98
CR
M-8
2/98
CR
M-3
9/98
Col
lie B
asin
Mon
itorin
g bo
re
6 31
2 00
0mN
413 500mE
6 31
2 00
0mN
440 500mE
6 29
2 15
0mN
440 500mE
DA
TU
M -
GD
A94
J:\P
P\W
A\5
8069
\000
1\F
IG2.
DG
N
Fig
ure
2. B
ore
loca
tion
s
4
S. Varma
developed by the Water and Rivers Commission (Varma
and Zhang 2002).The model has been used to estimate
recharge to the Permian Collie Group sediments underpre-mining and present conditions.
Slug-injection and slug-recovery tests were carried out
to obtain estimates of hydraulic conductivities of thedifferent sedimentary units in the basin. The results of
the slug tests, and tests carried out as a part of previous
studies for determination of aquifer parameters havebeen discussed in this report.
Assessment of the impact of coal mining andgroundwater abstraction on the groundwater levels, and
on the dependent Collie River South Branch pools, has
also been carried out. Monitoring bore hydrographshave been analysed to assess the impact of abstraction
from different sedimentary units. Although records of
groundwater abstraction in Collie Basin are availableonly since 1984, annual abstraction prior to this period
has been approximated from correlation with coal
production data.
The surface-water balance and the groundwater balance
of the basin have been established. In some cases wheredata were not available, for example streamflow
volumes for Collie River East Branch, analytical
methods have been used to estimate such flows.
The historical and current water management issues in
the Collie Basin have been discussed in this report, and
potential issues for future consideration have beenidentified. A water-balance method has been used to
determine the stream-bed conductance of the Collie
River South Branch at the pools which, in turn, hasbeen used to determine the water requirements for
maintaining the pool water levels at different depths. A
water balance model of Western 5B opencut mine voidhas been developed in BASIC programming language.
The model can be used to predict water levels and
salinity based on different management options, suchas use of streamflow diversion for rapid filling of the
void. Sample outputs from trial runs of the model have
been tabulated.
The results of this study will allow better management
of the groundwater resources of the basin in general,and in particular the allocation of groundwater,management of river pools and mine voids.
1.21.21.21.21.2 PPPPPrevious studiesrevious studiesrevious studiesrevious studiesrevious studies
The geology of the Collie Basin was first studied indetail by Lord (1952) from drilling of numerous deepbores for coal exploration. Thereafter, generaldescriptions of the geology of the basin have beenprovided by Low (1958), Lowry (1976), Wilde (1981)and Wilson (1990).
Hydrogeological studies in the basin have focusedmainly on the various mine groundwater-controlschemes and power station water supplies, and beendescribed in numerous unpublished reports byconsultants. Hirschberg (1976) was the first toundertake a hydrogeological study of the Collie Basinon a regional scale. Australian GroundwaterConsultants (1978) investigated the hydrogeology ofthe basin based on a network of 15 watertable-monitoring bores to determine the availability of thegroundwater resources to meet the power stationrequirements.
Although previous hydrogeological work in the basingives some indication of the groundwater conditionsat that time, the results were based on sparse data andwere not able to define the basin hydrogeology.
In 1989, the Geological Survey of Western Australia(GSWA) constructed a network of monitoring bores at39 sites on a 3 km grid to augment the then monitoringbore network (Moncrieff, 1993). A watertable-monitoring bore was constructed at each site, and atsome sites bores were constructed to monitor thepiezometric heads at deeper intervals. This work wasthe first to study the shallow groundwater flow patternsand impact of groundwater abstraction from mines andwellfields. However, owing to the complexity of thegeology and hydrogeology of the basin and lack ofhydrogeological data, a good understanding of thegroundwater flow patterns, recharge to the aquifers, andthe extent of impacts from the large-scale abstractionof groundwater was not achieved. Later, a detailedreview of the geology and Permian coal resources ofthe basin was undertaken by GSWA with the resultspresented by Le Blanc Smith (1993). The report by LeBlanc Smith (1993) is the most recent description ofthe geology of Collie Basin, and has significantlyassisted in developing a better understanding of CollieBasin hydrogeology.
5
Hydrogeological Record Series Hydrogeology and Groundwater Resources of the Collie Basin, Western Australia
1.31.31.31.31.3 PhysiographyPhysiographyPhysiographyPhysiographyPhysiography
1.3.11.3.11.3.11.3.11.3.1 ClimateClimateClimateClimateClimate
The Collie Basin has a Mediterranean type climate withhot, dry summers and cool, wet winters. Temperatures
can range from below zero on some winter mornings
to above 40°C on some summer days. The long-term(100-year) average annual rainfall at the town of Collie
is 950 mm (Fig. 3).
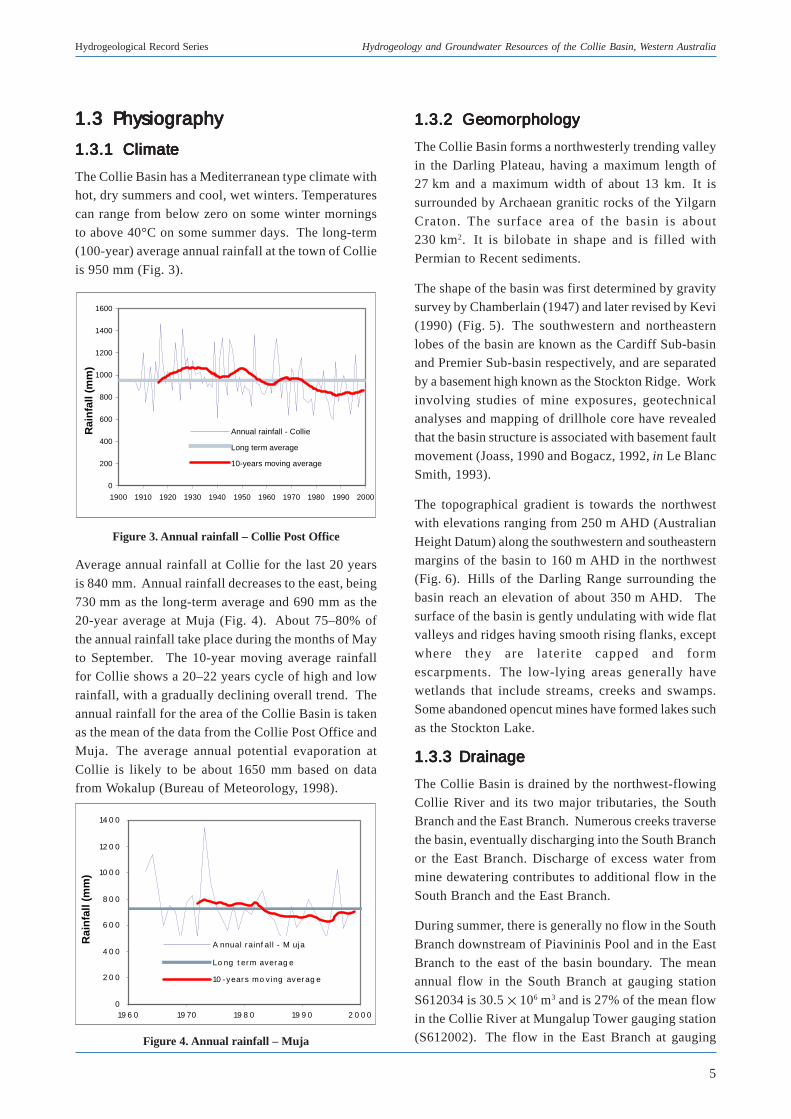
Figure 3. Annual rainfall – Collie Post Office
Average annual rainfall at Collie for the last 20 years
is 840 mm. Annual rainfall decreases to the east, being
730 mm as the long-term average and 690 mm as the20-year average at Muja (Fig. 4). About 75–80% of
the annual rainfall take place during the months of May
to September. The 10-year moving average rainfallfor Collie shows a 20–22 years cycle of high and low
rainfall, with a gradually declining overall trend. The
annual rainfall for the area of the Collie Basin is takenas the mean of the data from the Collie Post Office and
Muja. The average annual potential evaporation at
Collie is likely to be about 1650 mm based on datafrom Wokalup (Bureau of Meteorology, 1998).
1.3.21.3.21.3.21.3.21.3.2 GeomorphologyGeomorphologyGeomorphologyGeomorphologyGeomorphology
The Collie Basin forms a northwesterly trending valley
in the Darling Plateau, having a maximum length of27 km and a maximum width of about 13 km. It is
surrounded by Archaean granitic rocks of the Yilgarn
Craton. The surface area of the basin is about230 km2. It is bilobate in shape and is filled with
Permian to Recent sediments.
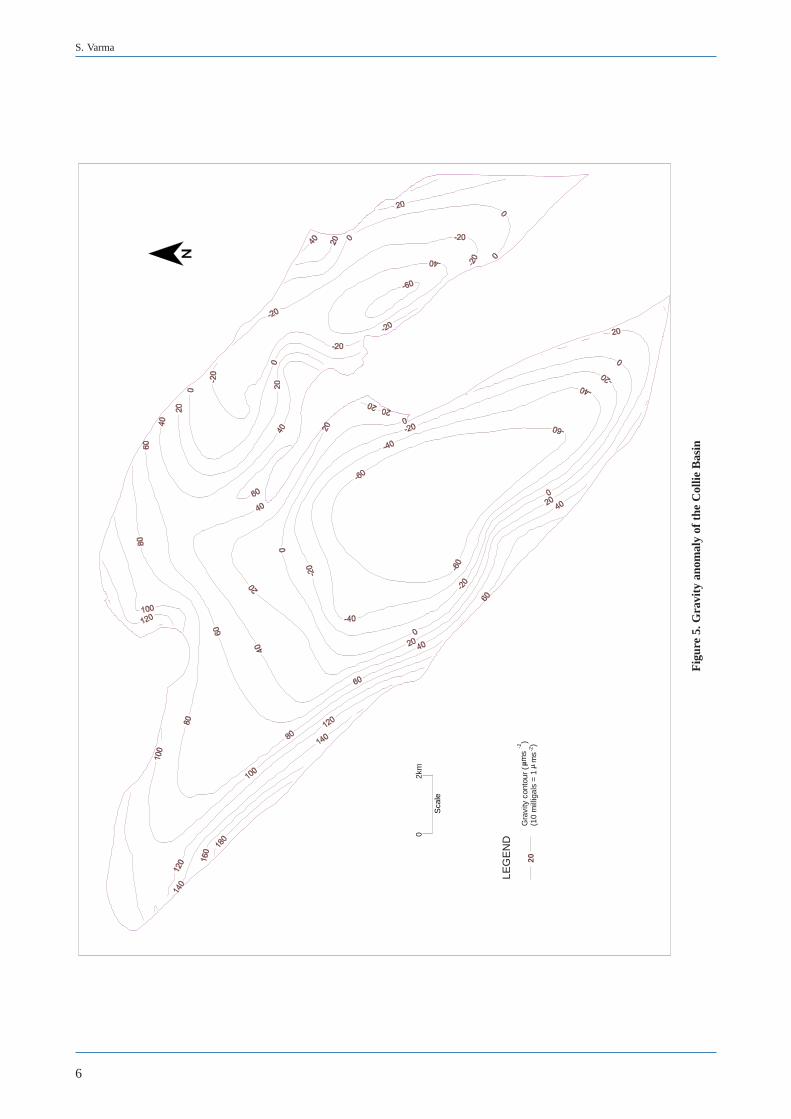
The shape of the basin was first determined by gravitysurvey by Chamberlain (1947) and later revised by Kevi
(1990) (Fig. 5). The southwestern and northeastern
lobes of the basin are known as the Cardiff Sub-basinand Premier Sub-basin respectively, and are separated
by a basement high known as the Stockton Ridge. Work
involving studies of mine exposures, geotechnicalanalyses and mapping of drillhole core have revealed
that the basin structure is associated with basement fault
movement (Joass, 1990 and Bogacz, 1992, in Le BlancSmith, 1993).
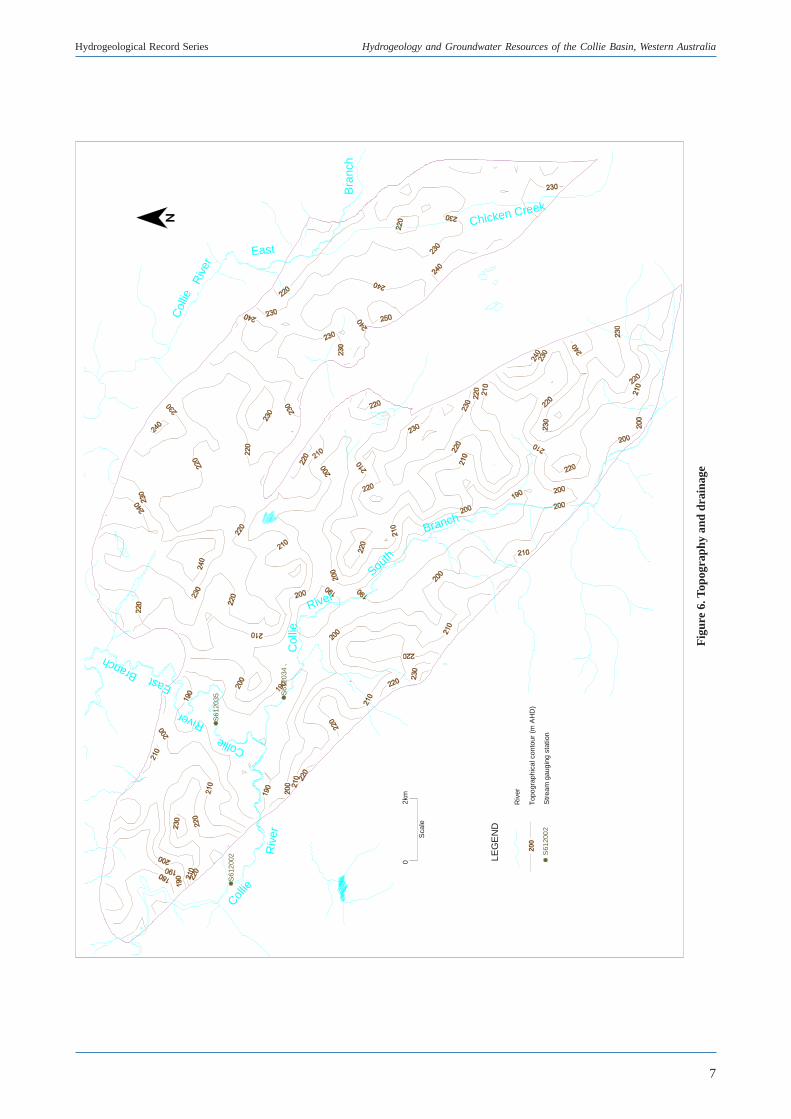
The topographical gradient is towards the northwestwith elevations ranging from 250 m AHD (Australian
Height Datum) along the southwestern and southeastern
margins of the basin to 160 m AHD in the northwest(Fig. 6). Hills of the Darling Range surrounding the
basin reach an elevation of about 350 m AHD. The
surface of the basin is gently undulating with wide flatvalleys and ridges having smooth rising flanks, except
where they are laterite capped and form
escarpments. The low-lying areas generally havewetlands that include streams, creeks and swamps.
Some abandoned opencut mines have formed lakes such
as the Stockton Lake.
1.3.3 Drainage1.3.3 Drainage1.3.3 Drainage1.3.3 Drainage1.3.3 Drainage
The Collie Basin is drained by the northwest-flowing
Collie River and its two major tributaries, the SouthBranch and the East Branch. Numerous creeks traverse
the basin, eventually discharging into the South Branch
or the East Branch. Discharge of excess water frommine dewatering contributes to additional flow in the
South Branch and the East Branch.
During summer, there is generally no flow in the South
Branch downstream of Piavininis Pool and in the East
Branch to the east of the basin boundary. The meanannual flow in the South Branch at gauging station
S612034 is 30.5 106 m3 and is 27% of the mean flow
in the Collie River at Mungalup Tower gauging station(S612002). The flow in the East Branch at gaugingFigure 4. Annual rainfall – Muja
0
2 0 0
4 0 0
6 0 0
8 0 0
10 0 0
12 0 0
14 0 0
19 6 0 19 70 19 8 0 19 9 0 2 0 0 0
Rai
nfa
ll (m
m)
A nnual rainf al l - M uja
Lo ng t erm aver ag e
10 -years mo v ing aver ag e
0
200
400
600
800
1000
1200
1400
1600
1900 1910 1920 1930 1940 1950 1960 1970 1980 1990 2000
Rai
nfa
ll (m
m)
Annual rainfall - Collie
Long term average
10-years moving average
6
S. Varma
Fig
ure
5. G
ravi
ty a
nom
aly
of t
he C
ollie
Bas
in
LEG
EN
D
20G
ravi
ty c
onto
ur (
(10
mill
igal
s =
1
ms
ms
-2 -2) )
02k
m
Sca
le
7
Hydrogeological Record Series Hydrogeology and Groundwater Resources of the Collie Basin, Western Australia
Fig
ure
6. T
opog
raph
y an
d dr
aina
ge
S61
2002
S61
2034
S61
2035
Col
lie
River
South
Branch
CollieRiver
EastBranch
Collie
Riv
er
LEG
EN
D
Riv
er
200
Top
ogra
phic
al c
onto
ur (
m A
HD
)
Str
eam
gau
ging
sta
tion
S61
2002
Chicken Creek
Col
lieR
iver
East
Bra
nch
02k
m
Sca
le

8
S. Varma
station S612035 has been recorded intermittently
between 1952 and 1976. However, recent annual flows
in the East Branch have been analytically estimatedfrom correlation of flows at other gauging stations
within the catchment. Ephemeral flow also occurs in
Chicken Creek in the southeast of the basin and BoroniaGully in the north, both draining into the East Branch.
The salinity of water in the South Branch ranges
between 1000 mg/L and 1500 mg/L and is about 10%
greater than the salinity in the Collie River. Salinity inthe pools of South Branch is about 2000–2500 mg/L.
Salinity in Chinamans Pool on the downstream part of
the South Branch, however, is less than 500 mg/L. Thepools of the East Branch in the southeastern part of the
basin have salinity in the range of 3000–4500 mg/L.
9
Hydrogeological Record Series Hydrogeology and Groundwater Resources of the Collie Basin, Western Australia
2.1 Overview2.1 Overview2.1 Overview2.1 Overview2.1 Overview
The Collie Basin consists of Permian to Recentsedimentary deposits overlying the Archaean crystalline
rocks.The Permian sediments of the basin are classified
under the coal-bearing Collie Group and the glacialStockton Group. These sediments subcrop beneath the
laterally extensive Cretaceous Nakina Formation, and
have a predominant southwesterly dip. The geology ofthe Premier and Cardiff Sub-basins is similar in
stratigraphic sequence and the sedimentary units are
correlatable within the two sub-basins. Maximumthickness of the Permian sediments is about 1400 m in
the Cardiff Sub-basin and about 750 m in the Premier
Sub-basin and is based on correlation of several deepexploratory drillholes. However, the drillholes have not
penetrated the basement in the deeper parts of the basin
and the actual thickness of the sediments in the basinis uncertain. Quantitative interpretation of the Bouguer
anomaly calibrated with the wireline density logs could
provide a better understanding of the basin at depth.Several northwesterly faults traverse the basin and
predate the deposition of the Nakina Formation.
Faulting in the basin has been described in detail by LeBlanc Smith (1993). The faults are believed to have
2 Geology
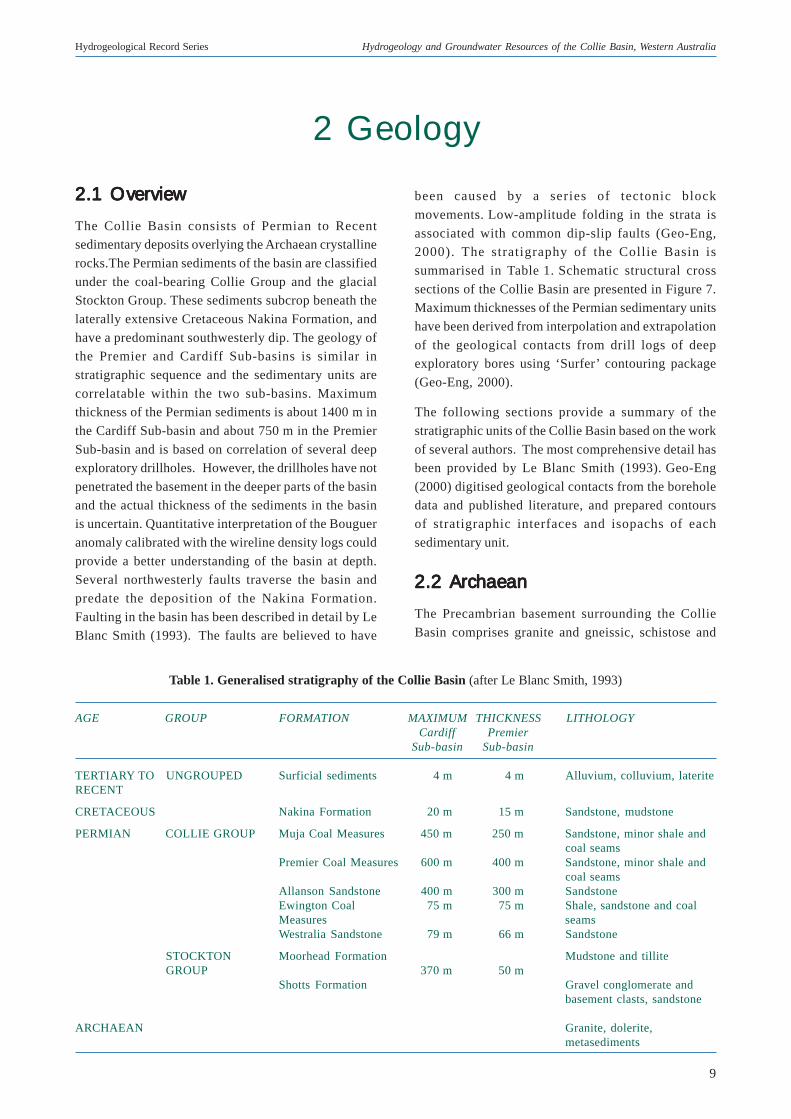
Table 1. Generalised stratigraphy of the Collie Basin (after Le Blanc Smith, 1993)
AGE GROUP FORMATION MAXIMUM THICKNESS LITHOLOGYCardiff Premier
Sub-basin Sub-basin
TERTIARY TO UNGROUPED Surficial sediments 4 m 4 m Alluvium, colluvium, lateriteRECENT
CRETACEOUS Nakina Formation 20 m 15 m Sandstone, mudstone
PERMIAN COLLIE GROUP Muja Coal Measures 450 m 250 m Sandstone, minor shale andcoal seams
Premier Coal Measures 600 m 400 m Sandstone, minor shale andcoal seams
Allanson Sandstone 400 m 300 m SandstoneEwington Coal 75 m 75 m Shale, sandstone and coalMeasures seamsWestralia Sandstone 79 m 66 m Sandstone
STOCKTON Moorhead Formation Mudstone and tilliteGROUP 370 m 50 m
Shotts Formation Gravel conglomerate andbasement clasts, sandstone
ARCHAEAN Granite, dolerite,metasediments
been caused by a series of tectonic block
movements. Low-amplitude folding in the strata is
associated with common dip-slip faults (Geo-Eng,2000). The stratigraphy of the Collie Basin is
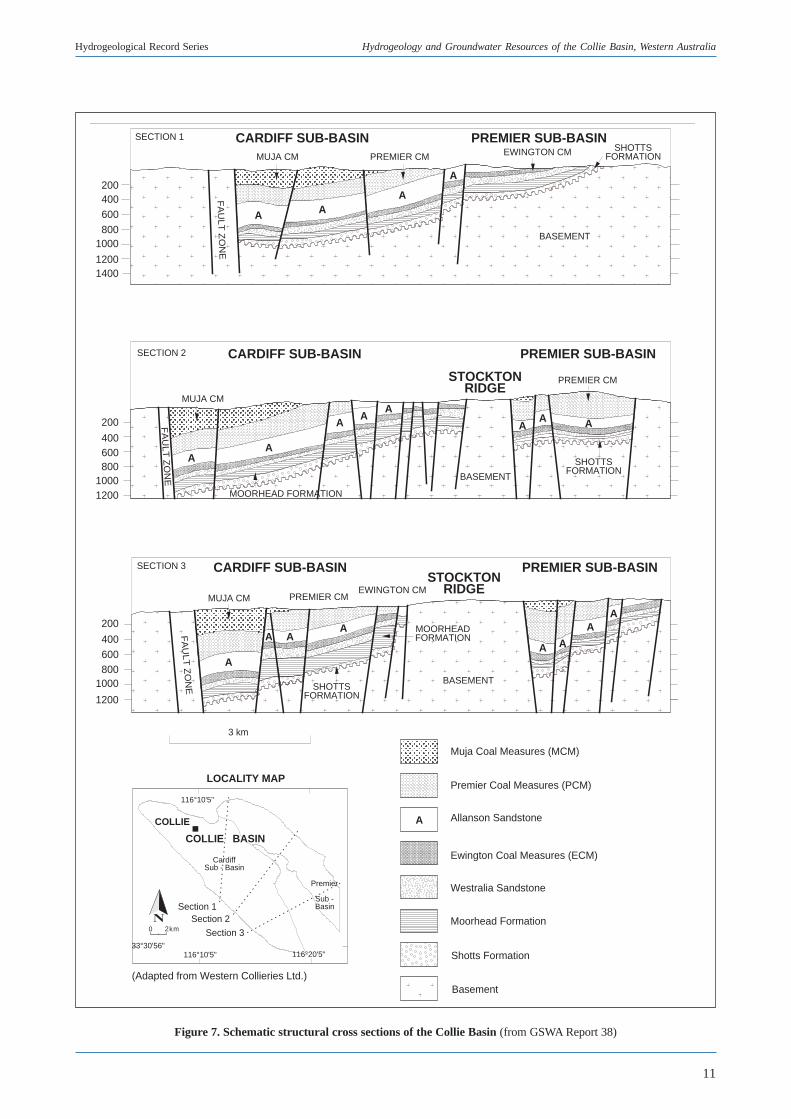
summarised in Table 1. Schematic structural cross
sections of the Collie Basin are presented in Figure 7.Maximum thicknesses of the Permian sedimentary units
have been derived from interpolation and extrapolation
of the geological contacts from drill logs of deepexploratory bores using ‘Surfer’ contouring package
(Geo-Eng, 2000).
The following sections provide a summary of the
stratigraphic units of the Collie Basin based on the work
of several authors. The most comprehensive detail hasbeen provided by Le Blanc Smith (1993). Geo-Eng
(2000) digitised geological contacts from the borehole
data and published literature, and prepared contoursof stratigraphic interfaces and isopachs of each
sedimentary unit.
2.2 Archaean2.2 Archaean2.2 Archaean2.2 Archaean2.2 Archaean
The Precambrian basement surrounding the Collie
Basin comprises granite and gneissic, schistose and
10
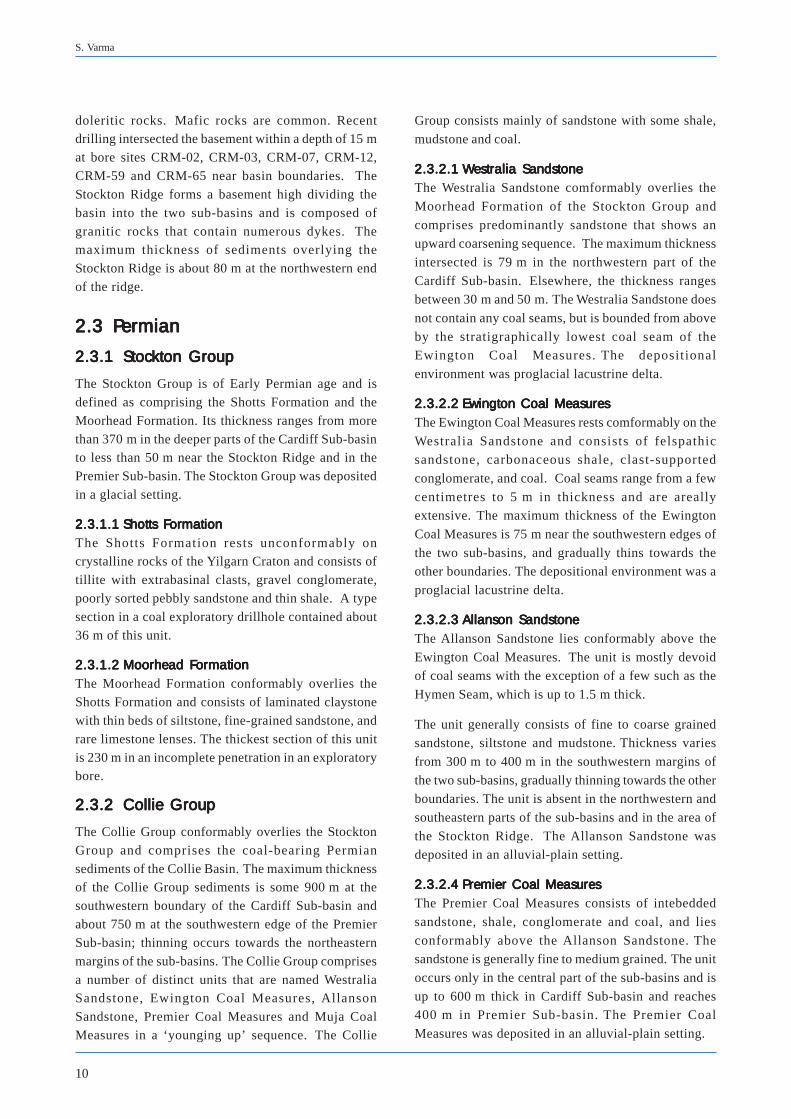
S. Varma
doleritic rocks. Mafic rocks are common. Recentdrilling intersected the basement within a depth of 15 mat bore sites CRM-02, CRM-03, CRM-07, CRM-12,CRM-59 and CRM-65 near basin boundaries. TheStockton Ridge forms a basement high dividing thebasin into the two sub-basins and is composed ofgranitic rocks that contain numerous dykes. Themaximum thickness of sediments overlying theStockton Ridge is about 80 m at the northwestern endof the ridge.
2.32.32.32.32.3 PPPPPermianermianermianermianermian
2.3.12.3.12.3.12.3.12.3.1 Stockton GroupStockton GroupStockton GroupStockton GroupStockton Group
The Stockton Group is of Early Permian age and isdefined as comprising the Shotts Formation and theMoorhead Formation. Its thickness ranges from morethan 370 m in the deeper parts of the Cardiff Sub-basinto less than 50 m near the Stockton Ridge and in thePremier Sub-basin. The Stockton Group was depositedin a glacial setting.
2.3.1.12.3.1.12.3.1.12.3.1.12.3.1.1 Shotts FShotts FShotts FShotts FShotts FormationormationormationormationormationThe Shotts Formation rests unconformably oncrystalline rocks of the Yilgarn Craton and consists oftillite with extrabasinal clasts, gravel conglomerate,poorly sorted pebbly sandstone and thin shale. A typesection in a coal exploratory drillhole contained about36 m of this unit.
2.3.1.22.3.1.22.3.1.22.3.1.22.3.1.2 Moorhead FMoorhead FMoorhead FMoorhead FMoorhead FormationormationormationormationormationThe Moorhead Formation conformably overlies theShotts Formation and consists of laminated claystonewith thin beds of siltstone, fine-grained sandstone, andrare limestone lenses. The thickest section of this unitis 230 m in an incomplete penetration in an exploratorybore.
2.3.22.3.22.3.22.3.22.3.2 Collie GroupCollie GroupCollie GroupCollie GroupCollie Group
The Collie Group conformably overlies the StocktonGroup and comprises the coal-bearing Permiansediments of the Collie Basin. The maximum thicknessof the Collie Group sediments is some 900 m at thesouthwestern boundary of the Cardiff Sub-basin andabout 750 m at the southwestern edge of the PremierSub-basin; thinning occurs towards the northeasternmargins of the sub-basins. The Collie Group comprisesa number of distinct units that are named WestraliaSandstone, Ewington Coal Measures, AllansonSandstone, Premier Coal Measures and Muja CoalMeasures in a ‘younging up’ sequence. The Collie
Group consists mainly of sandstone with some shale,
mudstone and coal.
2.3.2.12.3.2.12.3.2.12.3.2.12.3.2.1 WWWWWestralia Sandstoneestralia Sandstoneestralia Sandstoneestralia Sandstoneestralia SandstoneThe Westralia Sandstone comformably overlies the
Moorhead Formation of the Stockton Group and
comprises predominantly sandstone that shows anupward coarsening sequence. The maximum thickness
intersected is 79 m in the northwestern part of the
Cardiff Sub-basin. Elsewhere, the thickness rangesbetween 30 m and 50 m. The Westralia Sandstone does
not contain any coal seams, but is bounded from above
by the stratigraphically lowest coal seam of theEwington Coal Measures. The depositional
environment was proglacial lacustrine delta.
2.3.2.22.3.2.22.3.2.22.3.2.22.3.2.2 Ewington Coal MeasuresEwington Coal MeasuresEwington Coal MeasuresEwington Coal MeasuresEwington Coal MeasuresThe Ewington Coal Measures rests comformably on the
Westralia Sandstone and consists of felspathicsandstone, carbonaceous shale, clast-supported
conglomerate, and coal. Coal seams range from a few
centimetres to 5 m in thickness and are areallyextensive. The maximum thickness of the Ewington
Coal Measures is 75 m near the southwestern edges of
the two sub-basins, and gradually thins towards theother boundaries. The depositional environment was a
proglacial lacustrine delta.
2.3.2.32.3.2.32.3.2.32.3.2.32.3.2.3 Allanson SandstoneAllanson SandstoneAllanson SandstoneAllanson SandstoneAllanson SandstoneThe Allanson Sandstone lies conformably above the
Ewington Coal Measures. The unit is mostly devoidof coal seams with the exception of a few such as the
Hymen Seam, which is up to 1.5 m thick.
The unit generally consists of fine to coarse grainedsandstone, siltstone and mudstone. Thickness varies
from 300 m to 400 m in the southwestern margins of
the two sub-basins, gradually thinning towards the otherboundaries. The unit is absent in the northwestern and
southeastern parts of the sub-basins and in the area of
the Stockton Ridge. The Allanson Sandstone wasdeposited in an alluvial-plain setting.
2.3.2.42.3.2.42.3.2.42.3.2.42.3.2.4 PPPPPremier Coal Measuresremier Coal Measuresremier Coal Measuresremier Coal Measuresremier Coal MeasuresThe Premier Coal Measures consists of intebedded
sandstone, shale, conglomerate and coal, and lies
conformably above the Allanson Sandstone. Thesandstone is generally fine to medium grained. The unit
occurs only in the central part of the sub-basins and is
up to 600 m thick in Cardiff Sub-basin and reaches400 m in Premier Sub-basin. The Premier Coal
Measures was deposited in an alluvial-plain setting.
11
Hydrogeological Record Series Hydrogeology and Groundwater Resources of the Collie Basin, Western Australia
Figure 7. Schematic structural cross sections of the Collie Basin (from GSWA Report 38)
A AA
A
AA
AA
A
AA A
AA
AA
AAA
A
A
200400600800
1000
12001400
12001000
800600400
200
200
400600800
1000
1200
SECTION 1
MUJA CM PREMIER CM EWINGTON CM SHOTTSFORMATION
BASEMENT
BASEMENT
MUJA CM
MUJA CM PREMIER CMEWINGTON CM
SHOTTSFORMATION
SHOTTSFORMATION
BASEMENT
MOORHEADFORMATION
MOORHEAD FORMATION
PREMIER CM
FA
ULT
ZO
NE
FA
ULT
ZO
NE
FA
ULT
ZO
NE
CARDIFF SUB-BASIN PREMIER SUB-BASIN
PREMIER SUB-BASINCARDIFF SUB-BASIN
CARDIFF SUB-BASIN PREMIER SUB-BASINSTOCKTON
RIDGE
STOCKTONRIDGE
SECTION 2
SECTION 3
COLLIE
0 2km
COLLIE BASIN
CardiffSub - Basin
Premier
Sub -Basin
Muja Coal Measures (MCM)
Premier Coal Measures (PCM)
Allanson Sandstone
Ewington Coal Measures (ECM)
Westralia Sandstone
Moorhead Formation
Shotts Formation
Basement(Adapted from Western Collieries Ltd.)
LOCALITY MAP
3 km
Section 1Section 2
Section 3
116°10'5"
116°10'5"33°30'56"
116°20'5"
M - GDA94
12
S. Varma
2.3.2.52.3.2.52.3.2.52.3.2.52.3.2.5 Muja Coal MeasuresMuja Coal MeasuresMuja Coal MeasuresMuja Coal MeasuresMuja Coal MeasuresThe Muja Coal Measures comprises sandstone and
siltstone intercalated with numerous coal seams thatare up to 15 m thick. The unit has a maximum thickness
of about 450 m in the Cardiff Sub-basin and 250 m in
the Premier Sub-basin. It is present only in the centralpart of the Cardiff Sub-basin and abuts the Precambrian
rocks at the edge of the sub-basin, and at the
southwestern edge of the Premier Sub-basin. The MujaCoal Measures was deposited in an alluvial-plain
setting.
2.42.42.42.42.4 CretaceousCretaceousCretaceousCretaceousCretaceous
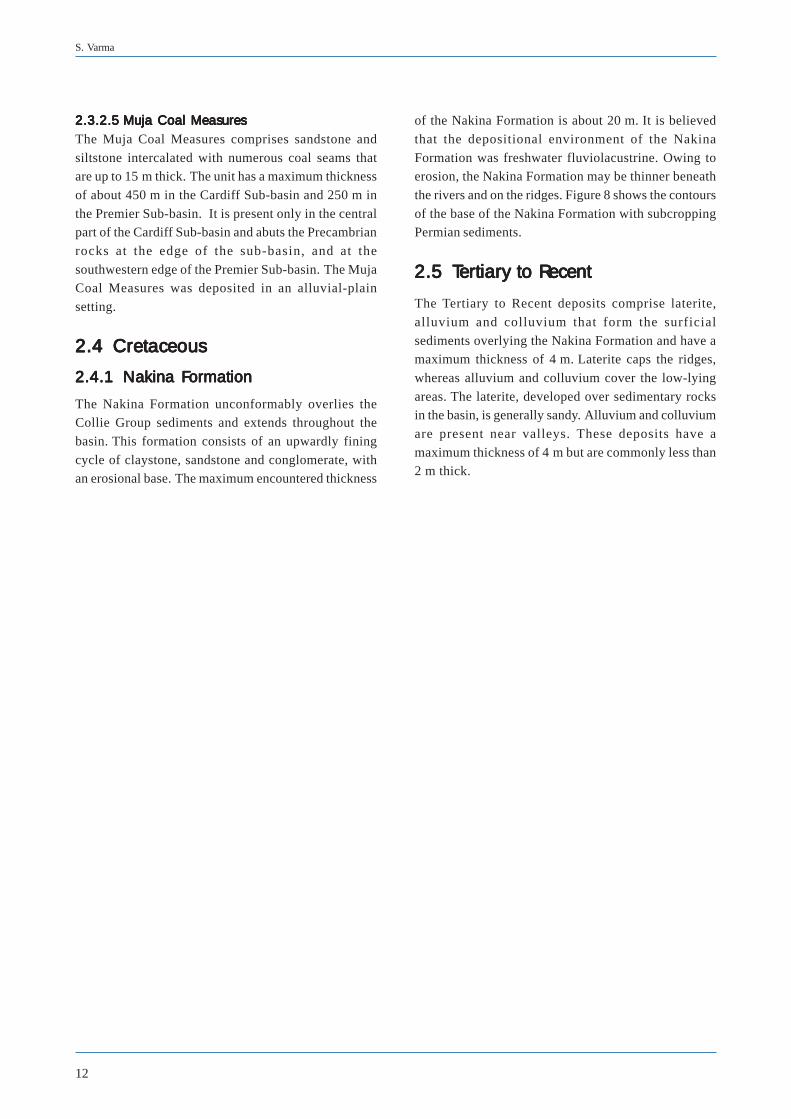
2.4.12.4.12.4.12.4.12.4.1 Nakina FNakina FNakina FNakina FNakina Formationormationormationormationormation
The Nakina Formation unconformably overlies theCollie Group sediments and extends throughout the
basin. This formation consists of an upwardly fining
cycle of claystone, sandstone and conglomerate, withan erosional base. The maximum encountered thickness
of the Nakina Formation is about 20 m. It is believed
that the depositional environment of the Nakina
Formation was freshwater fluviolacustrine. Owing toerosion, the Nakina Formation may be thinner beneath
the rivers and on the ridges. Figure 8 shows the contours
of the base of the Nakina Formation with subcroppingPermian sediments.
2.52.52.52.52.5 TTTTTertiary to Recentertiary to Recentertiary to Recentertiary to Recentertiary to Recent
The Tertiary to Recent deposits comprise laterite,
alluvium and colluvium that form the surficial
sediments overlying the Nakina Formation and have amaximum thickness of 4 m. Laterite caps the ridges,
whereas alluvium and colluvium cover the low-lying
areas. The laterite, developed over sedimentary rocksin the basin, is generally sandy. Alluvium and colluvium
are present near valleys. These deposits have a
maximum thickness of 4 m but are commonly less than2 m thick.
13
Hydrogeological Record Series Hydrogeology and Groundwater Resources of the Collie Basin, Western Australia
Fig
ure
8. C
onto
urs
of t
he b
ase
of N
akin
a F
orm
atio
n w
ith
stra
ta s
ubcr
op
Fau
lt w
ith th
row
Muj
a C
oal M
easu
res
Pre
mie
r C
oal M
easu
res
Alla
nson
San
dsto
ne
Ew
ingt
on C
oal M
easu
res
Wes
tral
ia S
ands
tone
Moo
rhea
d F
orm
atio
n
Sho
tts F
orm
atio
n
Bas
emen
t
RE
FE
RE
NC
E
COLLIE GROUP
PERMIAN
AR
CH
AE
AN
10
12
km
Sc
ale
LEG
EN
D
Riv
er
TRAN
SVER
SE M
ERCA
TOR
PRO
JECT
ION
Grid
indi
cate
s 5
000
met
re in
terv
al o
f the
Aus
tralia
n M
ap G
rid Z
one
50
STOCKTONGROUP
Base
Map
Sou
rce:
Dep
artm
ent o
f Min
eral
s an
d En
ergy
, Rep
ort 3
8
413 500mE 6 29
2 20
0mN
6 29
2 20
0mN
440 200mE
6 31
2 20
0mN
440 200mE
6 31
2 20
0mN
413 500mE
Bas
e of
Nak
ina
For
mat
ion
(m A
HD
)
DA
TU
M -
GD
A94
J:\P
P\W
A\5
8069
\000
6\F
IG11
.DG
N
170
14
S. Varma
3.1 3.1 3.1 3.1 3.1 Groundwater occurrence/Groundwater occurrence/Groundwater occurrence/Groundwater occurrence/Groundwater occurrence/hydrostratigraphyhydrostratigraphyhydrostratigraphyhydrostratigraphyhydrostratigraphy
The hydrogeology of the Collie Basin is complex. Until
now, a good understanding of the hydrogeology of the
basin on a regional scale was not possible owing tolack of sufficient drilling, testing and monitoring
data. As a part of this investigation, the drilling of
additional monitoring bores in 1998, to establish acloser monitoring network, has made it possible to
develop a better understanding of the shallow
groundwater flow systems, and identify areas ofrecharge and discharge. Water level monitoring of bores
has helped in developing an improved understanding
of the watertable fluctuations, surface water andgroundwater interactions, regional and local impacts
of groundwater abstraction and dewatering related to
mining, and water balance. Owing to a lack ofmonitoring bores in deeper sediments, it has not been
possible to determine the piezometric heads in deeper
aquifers and groundwater patterns within thesesediments at depth. Groundwater flows in the deeper
parts of the basin have, however, been studied using a
groundwater model.
Groundwater in abstractable quantities in the Collie
Basin is mainly contained within the sandstone of the
Muja Coal Measures, Premier Coal Measures, AllansonSandstone, Ewington Coal Measures and Westralia
Sandstone of the Collie Group; within the sand and
sandstone of the Nakina Formation; and in the surficialsediments. Some groundwater may also occur in the
sandstone of the Shotts Formation. Groundwater flow
in the Collie Basin takes place through the pores of thesedimentary units. Porosity is mainly intergranular but
fracture porosity also exists at depth (Vogwill and
Brunner, 1985 in Moncrieff, 1993). Based on anassessment of the lithological logs of some deep
production bores in the Cardiff Sub-basin, the aggregate
thickness of sandstone is about 70% of the totalsediment thickness, and the remaining 30% consists of
shale, mudstone and coal seams.
In the past, the coal mining companies have identified
the different sandstone beds between individual coal
seams as distinct aquifers that have been given the name
of the immediately underlying coal seam. While this
approach may be appropriate on a local scale whenconsidering dewatering and depressurisation of the
water-bearing zones for mining purposes, the use of
this nomenclature on a regional scale is not suitable. This is due to the discontinuities of the sandstone beds
because of the complexity of the structure that arises
mainly from numerous faults that could truncate thesesandstone beds over short distances. For the purpose
of groundwater resource management on a regional
scale, it is more appropriate to lump these sandstonebeds into groups of major sandstone layers ideally
based on lithostratigraphy as defined by Le Blanc Smith
(1993) and separated by extensive confining beds suchas coal seams or shale.
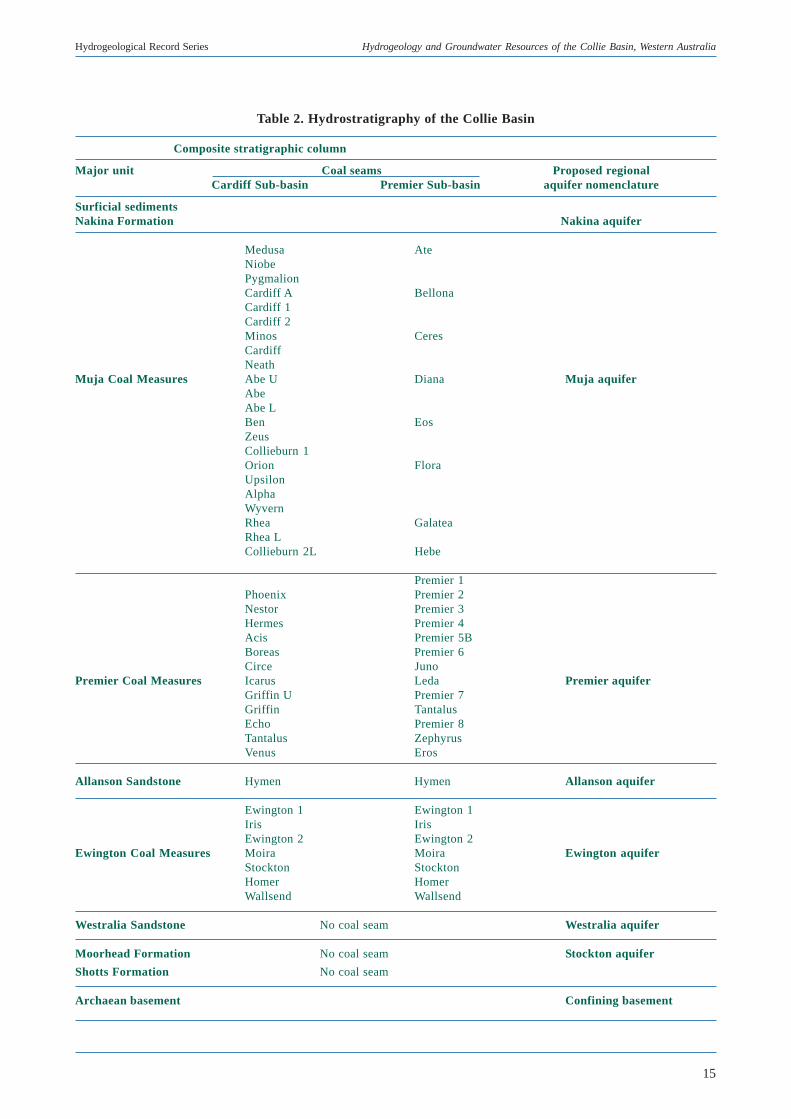
With the exception of the Nakina Formation and thesurficial sediments, the geological formations form
discrete units separated by extensive coal seams or a
thick layer of siltstone. Taking this into consideration,seven distinct regional aquifers are proposed for the
Collie Basin as shown in Table 2.
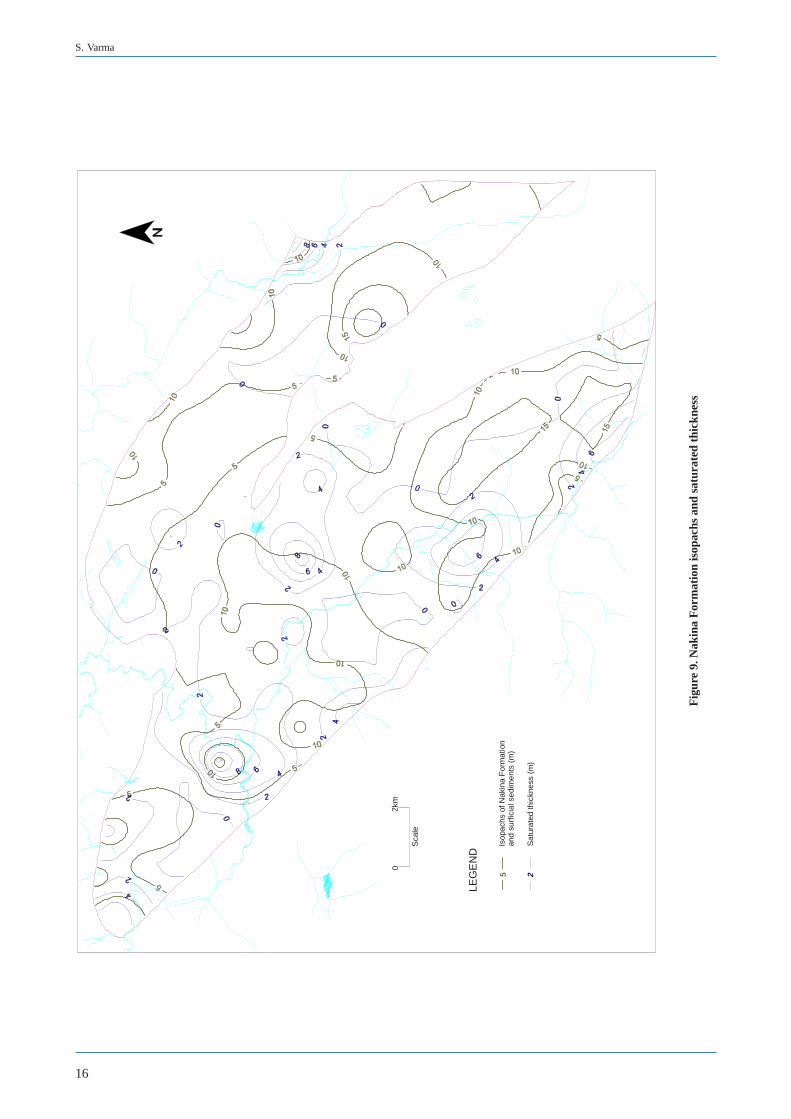
The Nakina aquifer comprises the Nakina Formationand the surficial sediments. The Nakina Formation is
unsaturated in some parts of the Collie Basin,
particularly in areas of major groundwater abstractionand where the formation is thin (Fig. 9). In the Cardiff
Sub-basin, areas of unsaturated Nakina Formation
occur near the southeastern part where this unit overliesthe subcrop zones of the Premier, Allanson and
Ewington aquifers, from which abstraction occurs at
the Cardiff South wellfield. In the Premier Sub-basin,the Nakina Formation is generally unsaturated in the
central and southern parts where large-scale mine
dewatering occurs. The watertable is, therefore, mostlywithin the Collie Group sediments. The Nakina aquifer
is unconfined and is in direct hydraulic connection with
underlying dipping strata of the Collie Group aquifers.
The Muja, Premier, Allanson, Ewington and Westralia
aquifers are formed by the respective Collie Groupsediments. The aquifers consist of mainly sandstone
with interbedded shale, mudstone and coal seams.
3 Hydrogeology
15
Hydrogeological Record Series Hydrogeology and Groundwater Resources of the Collie Basin, Western Australia
Composite stratigraphic column
Major unit Coal seams Proposed regionalCardiff Sub-basin Premier Sub-basin aquifer nomenclature
Surficial sedimentsNakina Formation Nakina aquifer
Medusa AteNiobePygmalionCardiff A BellonaCardiff 1Cardiff 2Minos CeresCardiffNeath
Muja Coal Measures Abe U Diana Muja aquiferAbeAbe LBen EosZeusCollieburn 1Orion FloraUpsilonAlphaWyvernRhea GalateaRhea LCollieburn 2L Hebe
Premier 1Phoenix Premier 2Nestor Premier 3Hermes Premier 4Acis Premier 5BBoreas Premier 6Circe Juno
Premier Coal Measures Icarus Leda Premier aquiferGriffin U Premier 7Griffin TantalusEcho Premier 8Tantalus ZephyrusVenus Eros
Allanson Sandstone Hymen Hymen Allanson aquifer
Ewington 1 Ewington 1Iris IrisEwington 2 Ewington 2
Ewington Coal Measures Moira Moira Ewington aquiferStockton StocktonHomer HomerWallsend Wallsend
Westralia Sandstone No coal seam Westralia aquifer
Moorhead Formation No coal seam Stockton aquifer
Shotts Formation No coal seam
Archaean basement Confining basement
Table 2. Hydrostratigraphy of the Collie Basin
16
S. Varma
Fig
ure
9. N
akin
a F
orm
atio
n is
opac
hs a
nd s
atur
ated
thi
ckne
ss
LEG
EN
D
Isop
achs
of N
akin
a F
orm
atio
n an
d su
rfic
ial s
edim
ents
(m
)
Sat
urat
ed th
ickn
ess
(m)
5 2
02k
m
Sca
le
17
Hydrogeological Record Series Hydrogeology and Groundwater Resources of the Collie Basin, Western Australia
The Muja aquifer is in direct hydraulic connection with
the overlying Nakina aquifer. The Premier and Allanson
aquifers are confined from above and below byextensive coal seams, except in areas of subcrop
beneath the unconfined Nakina aquifer. The Ewington
aquifer is confined from above by coal seams, and isunderlain by the Westralia aquifer.
The Stockton aquifer is formed by the Shotts and
Moorhead Formations of the Stockton Group. Thesesediments have been sourced in the Collie township
for groundwater supplies. Groundwater is obtained
mainly from the silty to very fine grained sandstonesof the Stockton Group. Significant groundwater
resources may be in storage within the Stockton Group;
however, current information on this aquifer is limited(Brunner, 1993). The Stockton aquifer is confined from
below by the granitic basement.
3.23.23.23.23.2 Groundwater flow systemGroundwater flow systemGroundwater flow systemGroundwater flow systemGroundwater flow system
A plot of watertable contours using data from both newand previously drilled shallow bores for April-May of
1998 (Fig. 10) shows that watertable elevations range
from 220 m AHD near the southwestern margins of thesub-basins to 165 m AHD in the central part of the
Cardiff Sub-basin and near the Collie River in the
northwestern part of the basin.
Groundwater flow in the Nakina aquifer is sub-parallel
to the topography. In areas where the watertable iswithin the Permian sediments, the local groundwater
flow would be largely controlled by the stratigraphy
and structure of these sediments. Faults and dippingconfining beds such as coal seams and shales in the
Permian sediments control groundwater flow directions.
The natural groundwater flow pattern in the CollieBasin has been altered because of mine dewatering and
large-scale groundwater abstraction for power
generation. As a result of mine dewatering the flow isdirected mainly towards the areas of mining.
In the Premier Sub-basin groundwater flows towardsopencut mines, and wetlands in the low-lying areas. Agroundwater mound exists in the northwestern part ofthe sub-basin, from where northwesterly flowdischarges into the East Branch. The Stockton Ridgeforms a groundwater divide between the two sub-basinsin the Nakina aquifer. However, in the deeper aquiferssuch as the Allanson and Ewington, some groundwaterflow may occur from Premier Sub-basin into the CardiffSub-basin.
Groundwater in the Cardiff Sub-basin flows towards
the South Branch in the central part of the sub-basin
where the watertable has been lowered due todewatering of underground mines. In the southeastern
corner of the sub-basin, groundwater flow is
concentrated towards a localised area of low watertablein areas of subcrop of the Premier and Allanson aquifers
beneath the Nakina Formation where pumping from
these aquifers may have caused decline in waterlevels. In the northwestern part of the sub-basin, flow
is to the west and groundwater discharges into the Collie
River.
Flow directions in the deeper aquifers of the Collie
Basin may be more obscure owing to the complex
structure. Turner et al. (1999) carried out a study ofgroundwater residence times in the northern part of
Collie Basin using CFC-12 concentrations and carbon-
14 activity. The groundwater samples for the studywere obtained from depths ranging from 15 m to
122 m. The results show that the samples from shallow
depths contain a large proportion of ‘young’ (<50 years)groundwater, whereas the deeper samples contain 0–
5% of the ‘young’ component. The age of groundwaterfrom samples taken from deeper aquifers range from
5000 to 17 500 years, indicating a much greater
residence time. The indicative groundwater flow ratebased on this method was estimated as 0.5 m/year and,
assuming a porosity of 0.3 and hydraulic gradient of
1:600, a corresponding hydraulic conductivity of 0.25m/day is estimated. Therefore, very slow movement
of groundwater takes place in these aquifers compared
with the flow in shallow parts, which has relatively rapidreplacement of groundwater.
The considerable age of groundwater in the deeper parts
of the basin implies that the dipping confining bedssuch as coal seams, compaction of the sediments at
deeper levels, and numerous faults has a significant
effect on groundwater movement. For this reason, itis likely that most groundwater flux in the deeper
aquifers is closer to the areas of subcrop beneath the
Nakina Formation, and very slow groundwatermovement takes place in the deeper parts.
As the Collie Group aquifers are confined by thick coalseams, shale and siltstone that have vertical hydraulic
conductivities of the order of 10-5–10-7 m/day, it is
unlikely that any significant flow of groundwater wouldtake place from one aquifer into another unless there
are large head differences.
18
S. Varma
Fig
ure
10. W
ater
tabl
e co
ntou
rs
0
Sc
ale
2k
m
170
165
175
170
170
175
180
180
180
185
190195
185
185
185
190
190
185
185
190
190
190
190
195
195
200
205
210
170175
180
180190
185
195
195
195
200
200
205
200200
205
210
215
165
170
170
175
175
180
180
180
210
210
215
195
205
205
205
205 190
200
210
215
210
215
205
210
210
210
205
205
200
210 215
220
225
230
180
LEG
EN
D
Riv
er
COLLIE
RIVER
CO
LLIE
RIV
ER
BR
AN
CH
CO
LLIE
RIVER EAST
BR
AN
CH
SOUTH
BO
RO
NIA
CR
EE
K
GU
LLY
Wat
erta
ble
cont
our
(mA
HD
)
Col
lie B
asin
6 31
2 00
0mN
413 500mE
6 31
2 00
0mN
440 500mE 440 500mE
6 29
2 15
0mN
DA
TU
M -
GD
A94
J:\P
P\W
A\5
8069
\000
6\F
IG8.
DG
N
App
aren
t gro
undw
ater
flow
dire
ctio
n
Stoc
kton
Rid
ge
19
Hydrogeological Record Series Hydrogeology and Groundwater Resources of the Collie Basin, Western Australia
Groundwater flow in the deeper parts of the Collie
Basin has been studied using a three dimensional
groundwater flow model of the basin (Varma andZhang, 2002). For the purpose of modeling, the Muja
aquifer has been separated into three model layers based
on the different zones of mine dewatering – Muja 1,Muja 2 and Muja 3.The remaining model layers are
similar to the corresponding hydrostratigraphic units
of the basin as shown in Table 2. Groundwater flow inthe deeper parts of the basin under pre-mining steady
state conditions is illustrated in Figures 11 and 12.
Water balances of the Collie Basin aquifers under both,pre-mining steady state and present conditions have
been derived from the groundwater flow model and
presented in Appendices II and III. The water balanceof the aquifers of the basin shows that, under pre-mining
steady-state conditions, groundwater leakage in the
deeper aquifers in the Collie Basin is very low andpredominantly upwards. The model shows that
groundwater enters the Permian aquifers as leakage
from the Nakina aquifer in the areas of subcrop, andeventually discharges back into the Nakina aquifer in
areas of subcrop that underlie the Collie River.
However, under present conditions, there is a significanthead difference in the aquifers as result of mine
dewatering; this has resulted in large volumes of
leakage.
3.33.33.33.33.3 PPPPPotentiometric head distribution otentiometric head distribution otentiometric head distribution otentiometric head distribution otentiometric head distribution
Hydraulic head gradients at most of the bores, where
heads from different depths are recorded, show a
downward head gradient due to large-scale abstractionfrom deeper aquifers. The steepest downward gradient
of 34 m over a 40 m interval was recorded at W677 in
Western 2 underground mine area in the Cardiff Sub-basin where abstraction occurs at depths of 150–
200 m. Upward head gradients were recorded in bores
(ME6 and CBS5) near areas of groundwaterdischarge. The depth to the watertable ranges from less
than 3 m in the Collie River near the northern part of
the basin, to as much as 70 m in the southern part ofthe Cardiff Sub-basin (Fig. 13). The watertable is
generally deeper in topographically high areas and
shallower near valleys.
3.43.43.43.43.4 WWWWWater level fluctuationater level fluctuationater level fluctuationater level fluctuationater level fluctuation
Watertable elevation in the Collie Basin is highest in
October or November and lowest in April or May. Theaverage seasonal fluctuation of the watertable is 0.7 m
with a maximum of 2.5 m. Lesser or no seasonal
fluctuation is observed in bores that are near areas ofprevious or present groundwater abstraction. This
implies that there is insignificant recharge in such areas,
and/or continued water level decline due to currentabstractions or downward leakage of groundwater
where there is considerable vertical head gradient due
to past dewatering. Higher positive fluctuations tendto be near the Collie River South Branch owing to
recharge from the river.
3.53.53.53.53.5 RechargeRechargeRechargeRechargeRecharge
Groundwater recharge to the watertable is mainly viadirect infiltration of rainfall. Some recharge from
streams also occurs in areas where the stream bed is at
a higher elevation than the watertable. Discharge ofgroundwater obtained from mine dewatering to
Stockton Lake and South Branch provides additional
recharge. Recharge to the sediments of the Collie Grouptakes place in areas of subcrop beneath the permeable
Nakina Formation and by leakage from overlying and
underlying aquifers. Groundwater recharge within theCollie Basin in the past has been estimated mainly using
the chloride mass balance technique. As a part of this
study, groundwater recharge has been assessed fromchloride mass balance and water balance.
3.5.13.5.13.5.13.5.13.5.1 Rainfall recharge by chloride massRainfall recharge by chloride massRainfall recharge by chloride massRainfall recharge by chloride massRainfall recharge by chloride massbalancebalancebalancebalancebalance
The ratio of chloride concentration in rainfall to that in
groundwater can be used to estimate the groundwater
recharge by infiltration of rainfall. This method isbased on the assumption that rainfall is the only source
of chloride ion in the groundwater and that its
concentration in the groundwater is due toevapotranspiration.
Using this technique Hirschberg (1976) estimatedgroundwater recharge to the basin as 3.36%. AGC
(1978) estimated that groundwater recharge ranged
from 5% to 18% of annual rainfall with an average of8%. For this study, recharge from rainfall has been
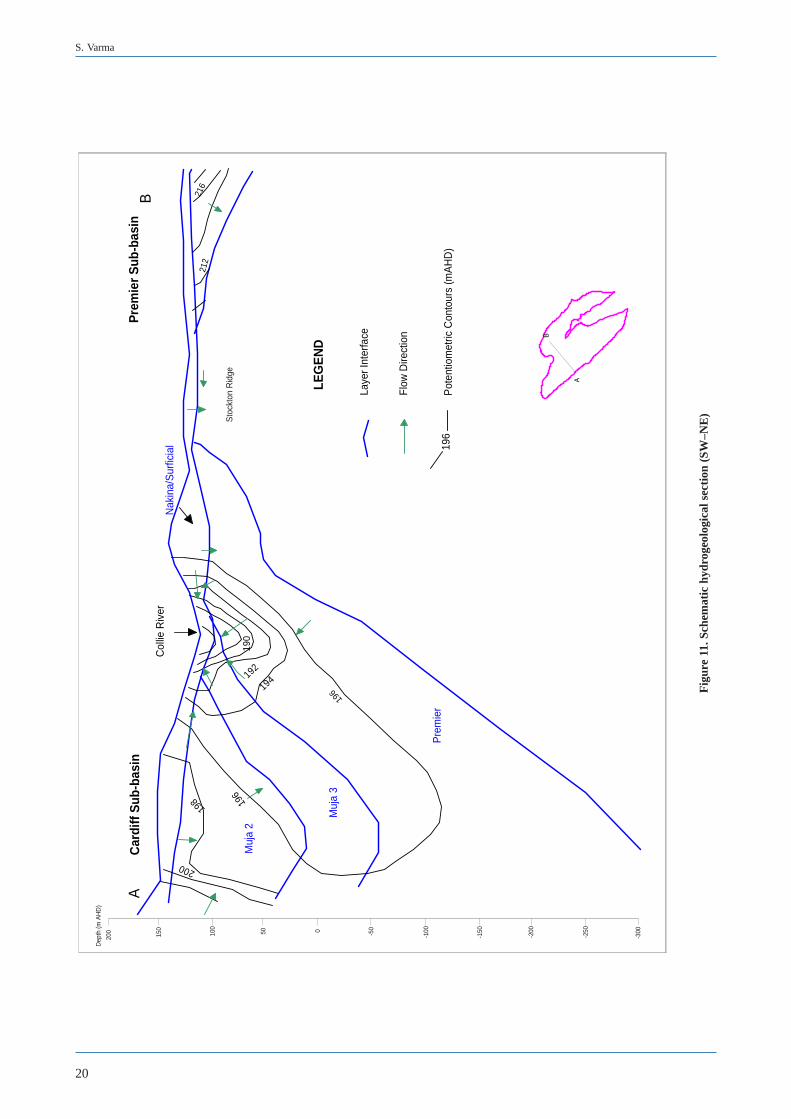
20
S. Varma
Fig
ure
11. S
chem
atic
hyd
roge
olog
ical
sec
tion
(SW
–NE
)
Col
lie R
iver
Nak
ina/
Sur
ficia
l
BA
194192
198
200
196
Pot
entio
met
ric C
onto
urs
(mA
HD
)
216
212
Flow
Dire
ctio
n
Laye
r Int
erfa
ce
LEG
EN
D
Car
diff
Sub
-bas
inP
rem
ier
Sub
-bas
in
196
190
A
B
196
Sto
ckto
n R
idge
Arc
haea
n B
asem
ent
Pre
mie
r
Muj
a 3
Muj
a 2
200
150
100
50 0 -50
-100
-150
-200
-250
-300
Dep
th (m
AH
D)
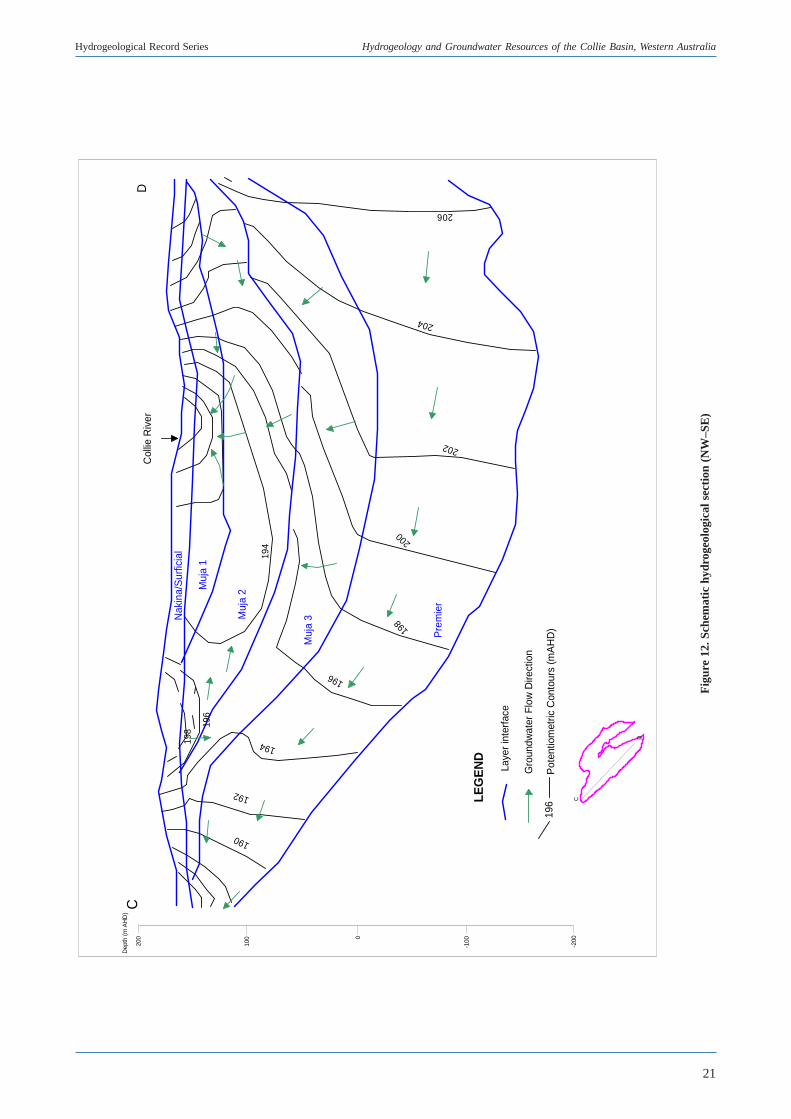
21
Hydrogeological Record Series Hydrogeology and Groundwater Resources of the Collie Basin, Western Australia
Fig
ure
12. S
chem
atic
hyd
roge
olog
ical
sec
tion
(N
W–S
E)
206
204
202
Pre
mie
r
Muj
a 3M
uja
2Muj
a 1
200
198
196
194
192
190
198
196
Nak
ina/
Sur
ficia
l
Col
lie R
iver
CD
196
Pot
entio
met
ric C
onto
urs
(mA
HD
)
Gro
undw
ater
Flo
w D
irect
ion
Laye
r int
erfa
ce
LEG
EN
D
194
C
D
200
100 0
-100
-200
Dep
th (
m A
HD
)
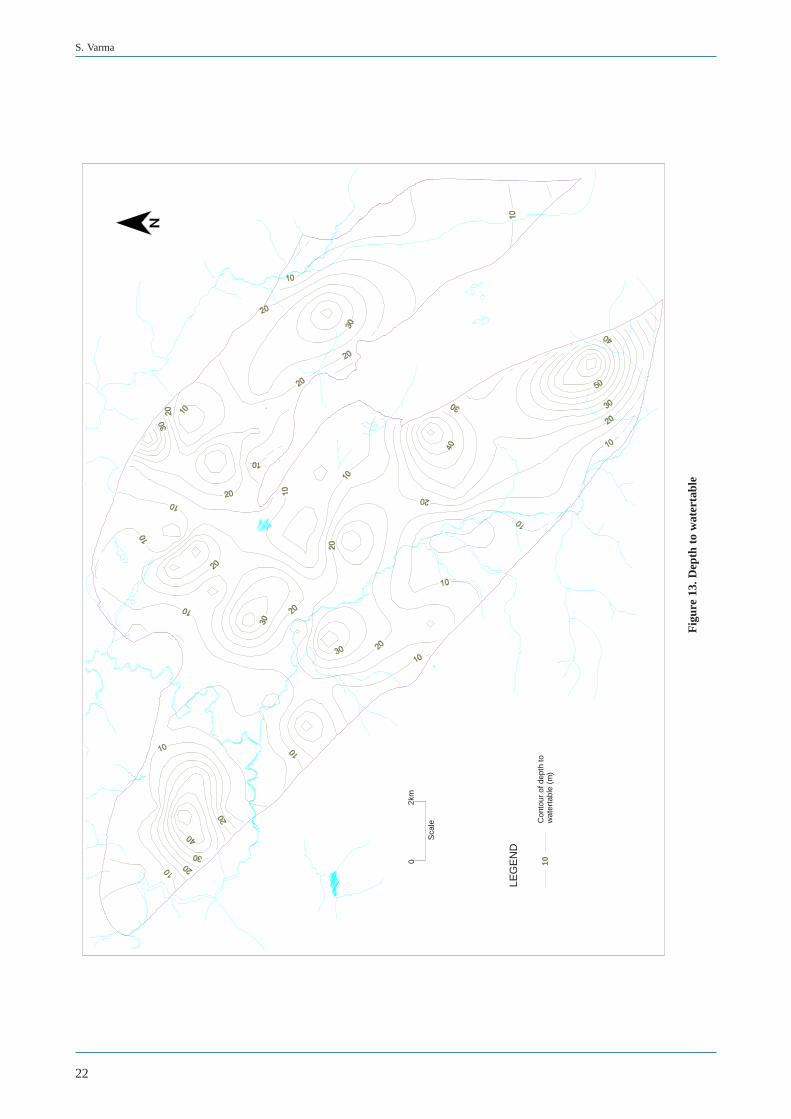
22
S. Varma
Fig
ure
13. D
epth
to
wat
erta
ble
LEG
EN
D
Con
tour
of d
epth
to
wat
erta
ble
(m)
1002k
m
Sca
le
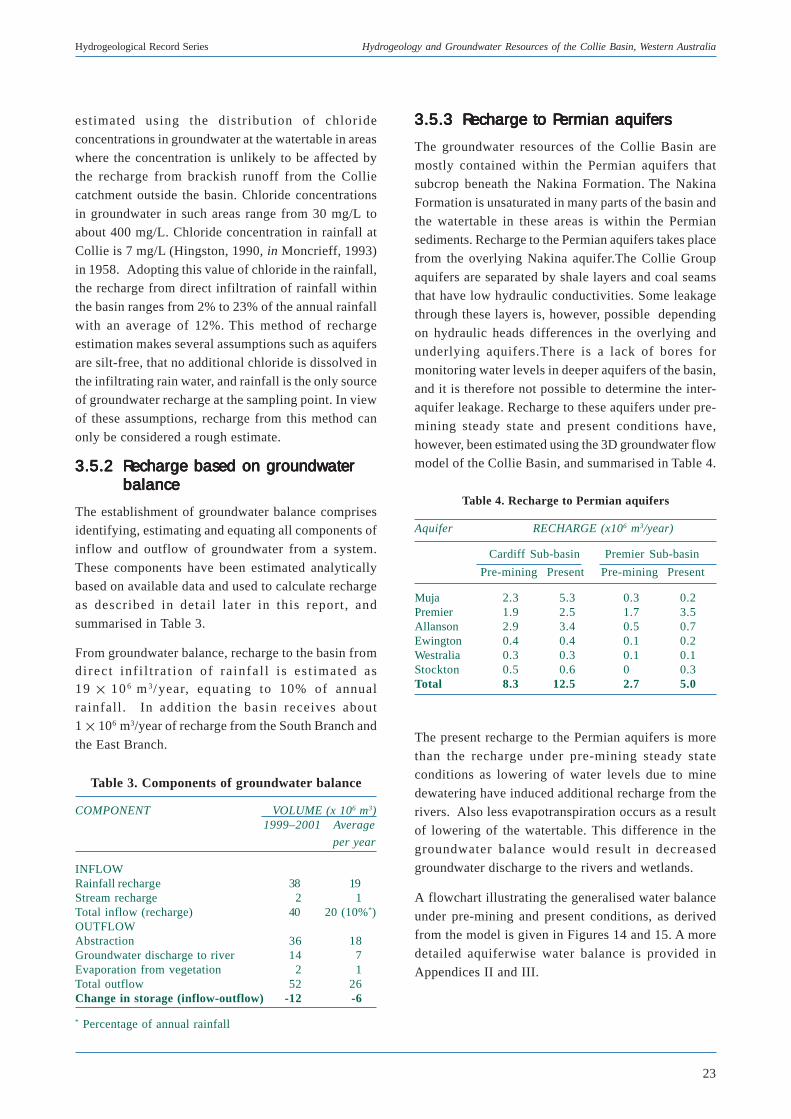
23
Hydrogeological Record Series Hydrogeology and Groundwater Resources of the Collie Basin, Western Australia
estimated using the distribution of chloride
concentrations in groundwater at the watertable in areas
where the concentration is unlikely to be affected bythe recharge from brackish runoff from the Collie
catchment outside the basin. Chloride concentrations
in groundwater in such areas range from 30 mg/L toabout 400 mg/L. Chloride concentration in rainfall at
Collie is 7 mg/L (Hingston, 1990, in Moncrieff, 1993)
in 1958. Adopting this value of chloride in the rainfall,the recharge from direct infiltration of rainfall within
the basin ranges from 2% to 23% of the annual rainfall
with an average of 12%. This method of rechargeestimation makes several assumptions such as aquifers
are silt-free, that no additional chloride is dissolved in
the infiltrating rain water, and rainfall is the only sourceof groundwater recharge at the sampling point. In view
of these assumptions, recharge from this method can
only be considered a rough estimate.
3.5.23.5.23.5.23.5.23.5.2 Recharge based on groundwaterRecharge based on groundwaterRecharge based on groundwaterRecharge based on groundwaterRecharge based on groundwaterbalancebalancebalancebalancebalance
The establishment of groundwater balance comprisesidentifying, estimating and equating all components of
inflow and outflow of groundwater from a system.
These components have been estimated analyticallybased on available data and used to calculate recharge
as described in detail later in this report, and
summarised in Table 3.
From groundwater balance, recharge to the basin fromdirect inf i l t ra t ion of ra infa l l i s es t imated as19 10 6 m 3/year, equating to 10% of annualrainfall. In addition the basin receives about1 106 m3/year of recharge from the South Branch and
the East Branch.
3.5.33.5.33.5.33.5.33.5.3 Recharge to PRecharge to PRecharge to PRecharge to PRecharge to Permian aquifersermian aquifersermian aquifersermian aquifersermian aquifers
The groundwater resources of the Collie Basin are
mostly contained within the Permian aquifers thatsubcrop beneath the Nakina Formation. The Nakina
Formation is unsaturated in many parts of the basin and
the watertable in these areas is within the Permiansediments. Recharge to the Permian aquifers takes place
from the overlying Nakina aquifer.The Collie Group
aquifers are separated by shale layers and coal seamsthat have low hydraulic conductivities. Some leakage
through these layers is, however, possible depending
on hydraulic heads differences in the overlying andunderlying aquifers.There is a lack of bores for
monitoring water levels in deeper aquifers of the basin,
and it is therefore not possible to determine the inter-aquifer leakage. Recharge to these aquifers under pre-
mining steady state and present conditions have,
however, been estimated using the 3D groundwater flowmodel of the Collie Basin, and summarised in Table 4.
The present recharge to the Permian aquifers is more
than the recharge under pre-mining steady stateconditions as lowering of water levels due to mine
dewatering have induced additional recharge from the
rivers. Also less evapotranspiration occurs as a resultof lowering of the watertable. This difference in the
groundwater balance would result in decreased
groundwater discharge to the rivers and wetlands.
A flowchart illustrating the generalised water balance
under pre-mining and present conditions, as derivedfrom the model is given in Figures 14 and 15. A more
detailed aquiferwise water balance is provided in
Appendices II and III.
Table 3. Components of groundwater balance
COMPONENT VOLUME (x 106 m3)1999–2001 Average
per year
INFLOWRainfall recharge 38 19 Stream recharge 2 1Total inflow (recharge) 40 20 (10%*)OUTFLOWAbstraction 36 18Groundwater discharge to river 14 7Evaporation from vegetation 2 1Total outflow 52 26Change in storage (inflow-outflow) -12 -6
* Percentage of annual rainfall
Aquifer RECHARGE (x106 m3/year)
Cardiff Sub-basin Premier Sub-basin
Pre-mining Present Pre-mining Present
Muja 2.3 5.3 0.3 0.2Premier 1.9 2.5 1.7 3.5Allanson 2.9 3.4 0.5 0.7Ewington 0.4 0.4 0.1 0.2Westralia 0.3 0.3 0.1 0.1Stockton 0.5 0.6 0 0.3Total 8.3 12.5 2.7 5.0
Table 4. Recharge to Permian aquifers
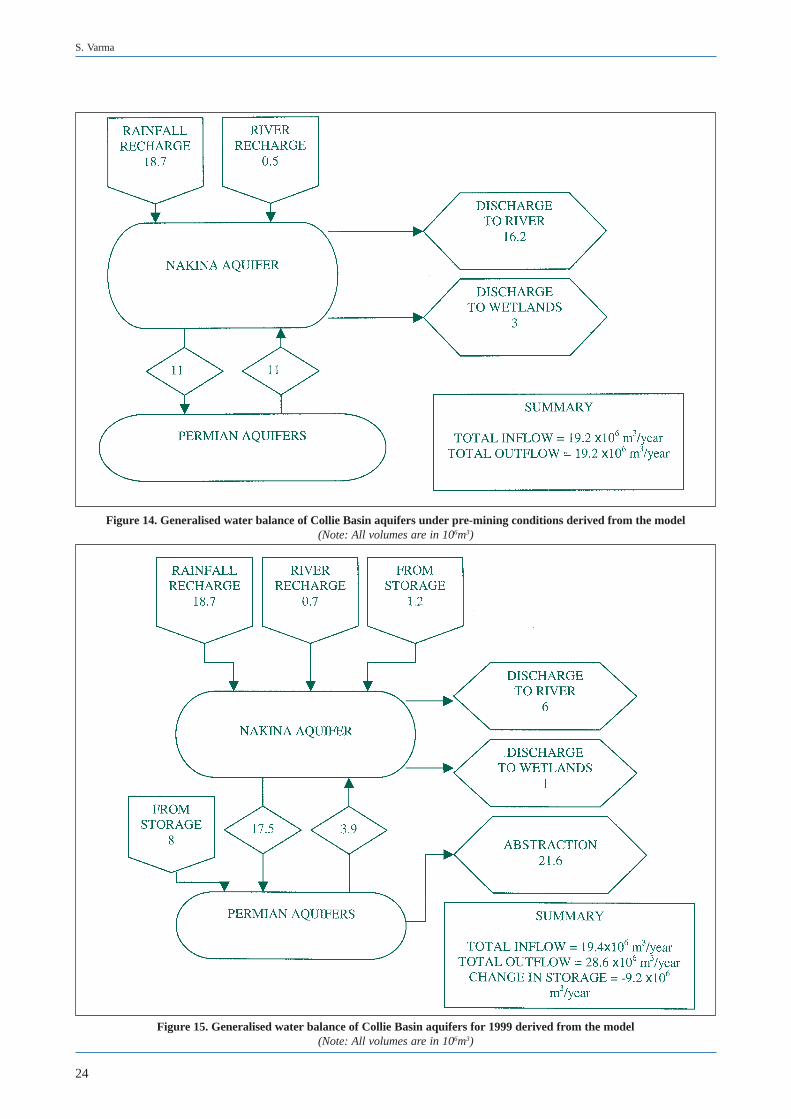
24
S. Varma
Figure 15. Generalised water balance of Collie Basin aquifers for 1999 derived from the model(Note: All volumes are in 106m3)
Figure 14. Generalised water balance of Collie Basin aquifers under pre-mining conditions derived from the model(Note: All volumes are in 106m3)
25
Hydrogeological Record Series Hydrogeology and Groundwater Resources of the Collie Basin, Western Australia
3.63.63.63.63.6 Groundwater dischargeGroundwater dischargeGroundwater dischargeGroundwater dischargeGroundwater discharge
Most groundwater discharge in the basin takes place
by abstraction from wellfields and mine dewatering.Natural groundwater discharge from the Permian
aquifers is to the overlying Nakina aquifer. Groundwater
in the Nakina aquifer discharges to the Collie Riverand its tributaries, and by evaporation from wetlands
including river pools and transpiration by vegetation
that draws water directly from the watertable in areasof shallow watertable.
3.6.13.6.13.6.13.6.13.6.1 Groundwater discharge toGroundwater discharge toGroundwater discharge toGroundwater discharge toGroundwater discharge toCollie RiverCollie RiverCollie RiverCollie RiverCollie River
Groundwater discharge as baseflow to the river system
in the Collie Basin takes place down-gradient of thegauging stations S612034 on South Branch and
S612035 on the East Branch.The volume of
groundwater discharge has been estimated as7 106 m3/year based on baseflow analysis and surface
water balance as detailed in Section 5.5 of this report.
3.6.23.6.23.6.23.6.23.6.2 Evapotranspiration from vegetationEvapotranspiration from vegetationEvapotranspiration from vegetationEvapotranspiration from vegetationEvapotranspiration from vegetation
Evapotranspiration from vegetation in areas of shallow
watertable is a significant component of groundwater
discharge. Farrington et al. (1989) used the diurnalfluctuation method to estimate evapotranspiration from
vegetation in areas where watertable is 0-3 m deep.
The results showed that evapotranspiration fromvegetation in such areas can be as much 110% of annual
rainfall. In Collie Basin, the depth to the watertable is
less than 3 m in a combined area of about0.5 106 m2. Such areas are mainly near the Collie
River, South Branch and the East Branch and in some
topographically depressed areas in the northern part ofthe Premier Sub-basin. Moncrieff (1993) measured
diurnal fluctuation in the watertable in bores drilled in
an area of shallow watertable, to be about 0.03 m insummer of 1990. Winter data was not collected, but
according to the study of Farrington et al. (1989) diurnal
fluctuation is generally not observed inwinter. Adopting 0.03 m per day as the average
fluctuation and 0.15 as the specific yield, the amount
of groundwater uptake by vegetation in areas of shallowwatertable is estimated as 1 106 m3/year.
3.73.73.73.73.7 StorageStorageStorageStorageStorage
The total volume of aquifers in Collie Basin is estimated
as 92 500 106 m3. It is estimated that out of this, thevolume of silt-free sandstone is 71 000 106 m3. The
percentage of silt-free sandstone has been interpreted
from representative core logs of deep coal exploratorybores. Adopting an average specific yield of 0.1 for
the sandstone in the basin, except for Nakina aquifer
for which the specific yield of 0.15 is estimated, thenet storage of groundwater is about 7100 106 m3. The
adopted specific yield values are approximate, and at
depths could get as low as 0.08 (AGC, 1978) and inthe shallower parts of the basin it could be as much as
0.26 (Brunner, 1993).
The estimate of storage is similar to the earlier estimates
of 6750 106 m3 by the Collie Land Use Working
Group (1987), 7000 106 m3 by Allen (1991) and7300 106 m3 by Moncrieff (1993). Estimated
groundwater storage volumes for each aquifer are given
in Table 5.
3.83.83.83.83.8 Aquifer parametersAquifer parametersAquifer parametersAquifer parametersAquifer parameters
The hydraulic conductivity and storage coefficient of
the Collie Basin aquifers have been estimated in the
past by pumping tests, granulometric analysis and slugtests by Western Collieries Limited (1991), Brunner
(1993) and Henderson (1999).
As a part of this study, slug-injection and slug-recoverytests were carried out in 13 bores within the Collie
Group aquifers in the areas of subcrop beneath the
Nakina Formation to determine hydraulic conductivitiesof these aquifers. This and the aquifer parameters
derived using other techniques in previous studies are
given in Table 6.
The hydraulic conductivities derived from pumping
tests and the granulometric analysis are generally anorder higher than the values determined using slug
tests. Results of pumping tests may be more accurate
as the tests are performed over a longer period of timeand as a result the pumping bore is more developed. The
estimated storage coefficient of the Permian aquifers
where they are confined are generally of the order of10-3 to 10-4. In the areas where the Permian strata
subcrop beneath the Nakina Formation, the storage
coefficient will be higher representing a semi-confinedto unconfined condition.
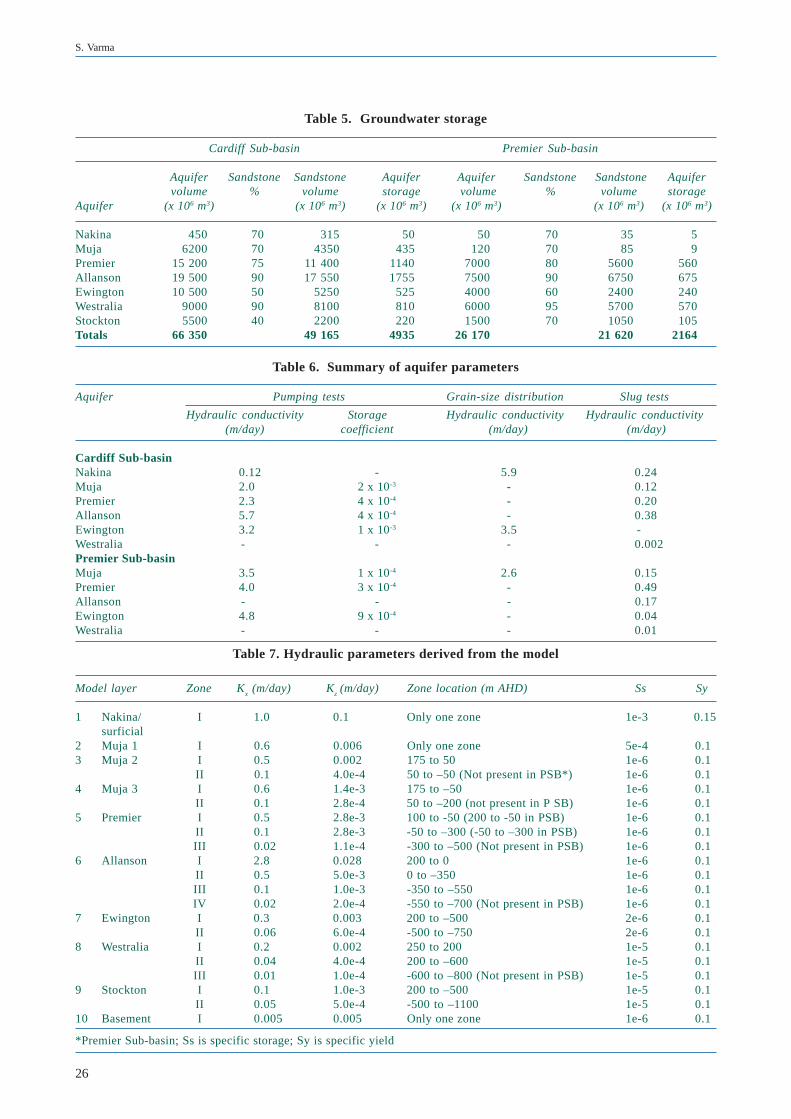
26
S. Varma
Table 5. Groundwater storage
Cardiff Sub-basin Premier Sub-basin
Aquifer Sandstone Sandstone Aquifer Aquifer Sandstone Sandstone Aquifervolume % volume storage volume % volume storage
Aquifer (x 106 m3) (x 106 m3) (x 106 m3) (x 106 m3) (x 106 m3) (x 106 m3)
Nakina 450 70 315 50 50 70 35 5Muja 6200 70 4350 435 120 70 85 9Premier 15 200 75 11 400 1140 7000 80 5600 560Allanson 19 500 90 17 550 1755 7500 90 6750 675Ewington 10 500 50 5250 525 4000 60 2400 240Westralia 9000 90 8100 810 6000 95 5700 570Stockton 5500 40 2200 220 1500 70 1050 105Totals 66 350 49 165 4935 26 170 21 620 2164
Table 6. Summary of aquifer parameters
Aquifer Pumping tests Grain-size distribution Slug tests
Hydraulic conductivity Storage Hydraulic conductivity Hydraulic conductivity(m/day) coefficient (m/day) (m/day)
Cardiff Sub-basinNakina 0.12 - 5.9 0.24Muja 2.0 2 x 10⁻³ - 0.12Premier 2.3 4 x 10⁻⁴ - 0.20Allanson 5.7 4 x 10⁻⁴ - 0.38Ewington 3.2 1 x 10⁻³ 3.5 -Westralia - - - 0.002Premier Sub-basinMuja 3.5 1 x 10⁻⁴ 2.6 0.15Premier 4.0 3 x 10⁻⁴ - 0.49Allanson - - - 0.17Ewington 4.8 9 x 10⁻⁴ - 0.04Westralia - - - 0.01
Table 7. Hydraulic parameters derived from the model
Model layer Zone Kx (m/day) K
z (m/day) Zone location (m AHD) Ss Sy
1 Nakina/ I 1.0 0.1 Only one zone 1e-3 0.15surficial
2 Muja 1 I 0.6 0.006 Only one zone 5e-4 0.13 Muja 2 I 0.5 0.002 175 to 50 1e-6 0.1
II 0.1 4.0e-4 50 to –50 (Not present in PSB*) 1e-6 0.14 Muja 3 I 0.6 1.4e-3 175 to –50 1e-6 0.1
II 0.1 2.8e-4 50 to –200 (not present in P SB) 1e-6 0.15 Premier I 0.5 2.8e-3 100 to -50 (200 to -50 in PSB) 1e-6 0.1
II 0.1 2.8e-3 -50 to –300 (-50 to –300 in PSB) 1e-6 0.1III 0.02 1.1e-4 -300 to –500 (Not present in PSB) 1e-6 0.1
6 Allanson I 2.8 0.028 200 to 0 1e-6 0.1II 0.5 5.0e-3 0 to –350 1e-6 0.1III 0.1 1.0e-3 -350 to –550 1e-6 0.1IV 0.02 2.0e-4 -550 to –700 (Not present in PSB) 1e-6 0.1
7 Ewington I 0.3 0.003 200 to –500 2e-6 0.1II 0.06 6.0e-4 -500 to –750 2e-6 0.1
8 Westralia I 0.2 0.002 250 to 200 1e-5 0.1II 0.04 4.0e-4 200 to –600 1e-5 0.1III 0.01 1.0e-4 -600 to –800 (Not present in PSB) 1e-5 0.1
9 Stockton I 0.1 1.0e-3 200 to –500 1e-5 0.1II 0.05 5.0e-4 -500 to –1100 1e-5 0.1
10 Basement I 0.005 0.005 Only one zone 1e-6 0.1
*Premier Sub-basin; Ss is specific storage; Sy is specific yield
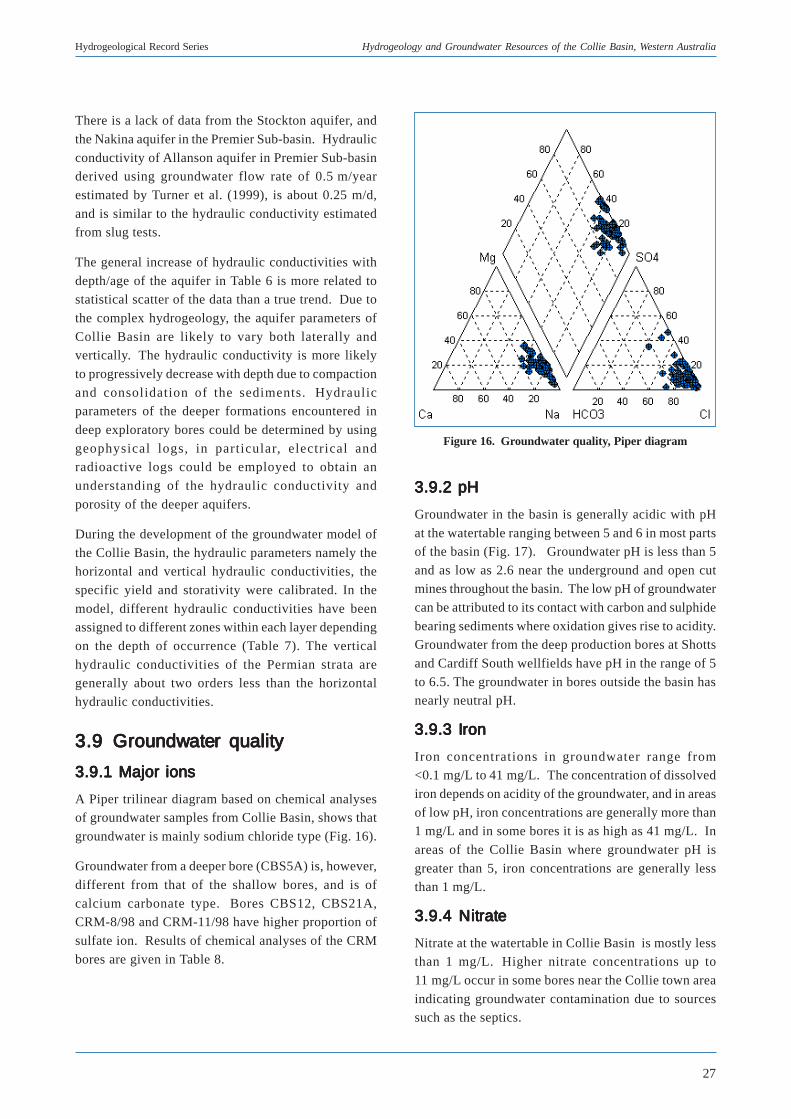
27
Hydrogeological Record Series Hydrogeology and Groundwater Resources of the Collie Basin, Western Australia
There is a lack of data from the Stockton aquifer, and
the Nakina aquifer in the Premier Sub-basin. Hydraulic
conductivity of Allanson aquifer in Premier Sub-basinderived using groundwater flow rate of 0.5 m/year
estimated by Turner et al. (1999), is about 0.25 m/d,
and is similar to the hydraulic conductivity estimatedfrom slug tests.
The general increase of hydraulic conductivities with
depth/age of the aquifer in Table 6 is more related tostatistical scatter of the data than a true trend. Due to
the complex hydrogeology, the aquifer parameters of
Collie Basin are likely to vary both laterally andvertically. The hydraulic conductivity is more likely
to progressively decrease with depth due to compaction
and consolidation of the sediments. Hydraulicparameters of the deeper formations encountered in
deep exploratory bores could be determined by using
geophysical logs, in particular, electrical andradioactive logs could be employed to obtain an
understanding of the hydraulic conductivity and
porosity of the deeper aquifers.
During the development of the groundwater model of
the Collie Basin, the hydraulic parameters namely thehorizontal and vertical hydraulic conductivities, the
specific yield and storativity were calibrated. In the
model, different hydraulic conductivities have beenassigned to different zones within each layer depending
on the depth of occurrence (Table 7). The vertical
hydraulic conductivities of the Permian strata aregenerally about two orders less than the horizontal
hydraulic conductivities.
3.93.93.93.93.9 Groundwater qualityGroundwater qualityGroundwater qualityGroundwater qualityGroundwater quality
3.9.1 Major ions3.9.1 Major ions3.9.1 Major ions3.9.1 Major ions3.9.1 Major ions
A Piper trilinear diagram based on chemical analysesof groundwater samples from Collie Basin, shows that
groundwater is mainly sodium chloride type (Fig. 16).
Groundwater from a deeper bore (CBS5A) is, however,
different from that of the shallow bores, and is of
calcium carbonate type. Bores CBS12, CBS21A,CRM-8/98 and CRM-11/98 have higher proportion of
sulfate ion. Results of chemical analyses of the CRM
bores are given in Table 8.
Figure 16. Groundwater quality, Piper diagram
3.9.2 pH3.9.2 pH3.9.2 pH3.9.2 pH3.9.2 pH
Groundwater in the basin is generally acidic with pH
at the watertable ranging between 5 and 6 in most partsof the basin (Fig. 17). Groundwater pH is less than 5
and as low as 2.6 near the underground and open cutmines throughout the basin. The low pH of groundwater
can be attributed to its contact with carbon and sulphide
bearing sediments where oxidation gives rise to acidity.Groundwater from the deep production bores at Shotts
and Cardiff South wellfields have pH in the range of 5
to 6.5. The groundwater in bores outside the basin hasnearly neutral pH.
3.9.3 Iron3.9.3 Iron3.9.3 Iron3.9.3 Iron3.9.3 Iron
Iron concentrations in groundwater range from<0.1 mg/L to 41 mg/L. The concentration of dissolved
iron depends on acidity of the groundwater, and in areas
of low pH, iron concentrations are generally more than1 mg/L and in some bores it is as high as 41 mg/L. In
areas of the Collie Basin where groundwater pH is
greater than 5, iron concentrations are generally lessthan 1 mg/L.
3.9.4 Nitrate3.9.4 Nitrate3.9.4 Nitrate3.9.4 Nitrate3.9.4 Nitrate
Nitrate at the watertable in Collie Basin is mostly lessthan 1 mg/L. Higher nitrate concentrations up to
11 mg/L occur in some bores near the Collie town area
indicating groundwater contamination due to sourcessuch as the septics.
28
S. Varma
3.9.5 Sulphate3.9.5 Sulphate3.9.5 Sulphate3.9.5 Sulphate3.9.5 Sulphate
Sulphate ion concentrations in Collie Basin
groundwater are mostly less than 20 mg/L. Higherconcentrations of up to 200 mg/L in the basin may result
from oxidation of sulfides associated with coal seams
and due to evaporation in areas of shallow watertable.
3.9.6 Chloride3.9.6 Chloride3.9.6 Chloride3.9.6 Chloride3.9.6 Chloride
Chloride concentrations in the Collie Basin
groundwater range from 10 mg/L to as much as2300 mg/L, but are mostly less than 500 mg/L. Higher
concentrations occur mainly near water courses where
groundwater is recharged from streams with brackishto saline water flows originating in the upper Collie
River catchment.
3.9.7 Hardness3.9.7 Hardness3.9.7 Hardness3.9.7 Hardness3.9.7 Hardness
Hardness of water is expressed as an equivalent of
calcium carbonate. Groundwater hardness in the basin
generally does not exceed 100 mg/L and is commonlyless than 50 mg/L. In areas where groundwater receives
recharge from streams, hardness is greater. The
qualitative degree or scale of hardness is subjective andwould depend on source of groundwater (Davidson,
1995). For example in areas where groundwater
recharge is mainly from direct infiltration of rainfall,such as Collie Basin, water may be considered hard if
hardness is 100 mg/L, whereas in a coastal limestone
area groundwater having a hardness of 100 mg/L maybe considered as soft.
3.9.8 Heavy metals3.9.8 Heavy metals3.9.8 Heavy metals3.9.8 Heavy metals3.9.8 Heavy metals
Heavy metals were not recorded as part of this study
but are known to occur in the basin particularly in the
residues that are left after burning of coal (Davy andWilson, 1989) that may be remobilised and contaminate
the groundwater.
3.9.9 Salinity3.9.9 Salinity3.9.9 Salinity3.9.9 Salinity3.9.9 Salinity
Groundwater salinity in Collie Basin varies from 40 mg/
L TDS in bore CRM-11/98 in the northwestern part of
the basin to 4200 mg/L in bore CRM-45/98 near EastBranch in the southeastern part of the basin. However,
in most of the basin, the salinity is generally less than
500 mg/L (Fig. 18).
In areas closer to the South Branch in the southern part
of Cardiff Sub-basin, where the river level is higher
than the watertable, groundwater salinity is between1000 mg/L and 2000 mg/L. This is due to groundwater
recharge in this area from the river, which mainly
contains brackish water. Outside the basin near thenorthern and the southeastern boundaries, the
crystalline rocks and the overlying lateritic weathered
prof i le , main ly conta in brackish or sa l inegroundwater ranging in salinity from 1000 mg/L to
17 300 mg/L. Groundwater salinity in the crystalline
rocks near the western margin is less than 1000 mg/Lpossibly due to increased recharge from run-off from
granitic outcrops, and higher rainfall.
3.9.10 P3.9.10 P3.9.10 P3.9.10 P3.9.10 Potabilityotabilityotabilityotabilityotability
Potability of groundwater in Collie Basin has not been
assessed as a part of this study. National Health and
Medical Research Council (NHMRC) and Agricultureand Resource Management Council of Australia and
New Zealand (ARMCANZ) guidelines are used to
assess the potability of water in Australia. Theseguidelines are continually being revised as more
research data are available. The health-related and
aesthetic guidelines set acceptable limits of physical,microbiological, chemical and radiological
characteristics of water.
In Collie Basin, the potentially toxic pollutants
associated with coal as determined by Davy and Wilson
(1989) include As, Be, Cu, Mo, Ni, and U that areparticularly significant in coal ash. These elements if
present in groundwater can be a health concern
depending on their concentrations. The low pH ofgroundwater is also potentially unacceptable according
to aesthetic guidelines. Insufficient data exits for
assessing health risks of low pH water. Groundwatersalinity throughout Collie Basin is mostly within
NHMRC drinking water guidelines.
The groundwater from deeper aquifers of the basin mayhave better quality for human consumption than the
shallow aquifers. The Cardiff South wellfield that
draws groundwater from depths of 100 – 400 m ispresently used to supplying drinking water to Western
Power facilities at Muja. Groundwater from the
wellfield has pH in the range of 5-5.5, and salinity ofabout 350 mg/L TDS.
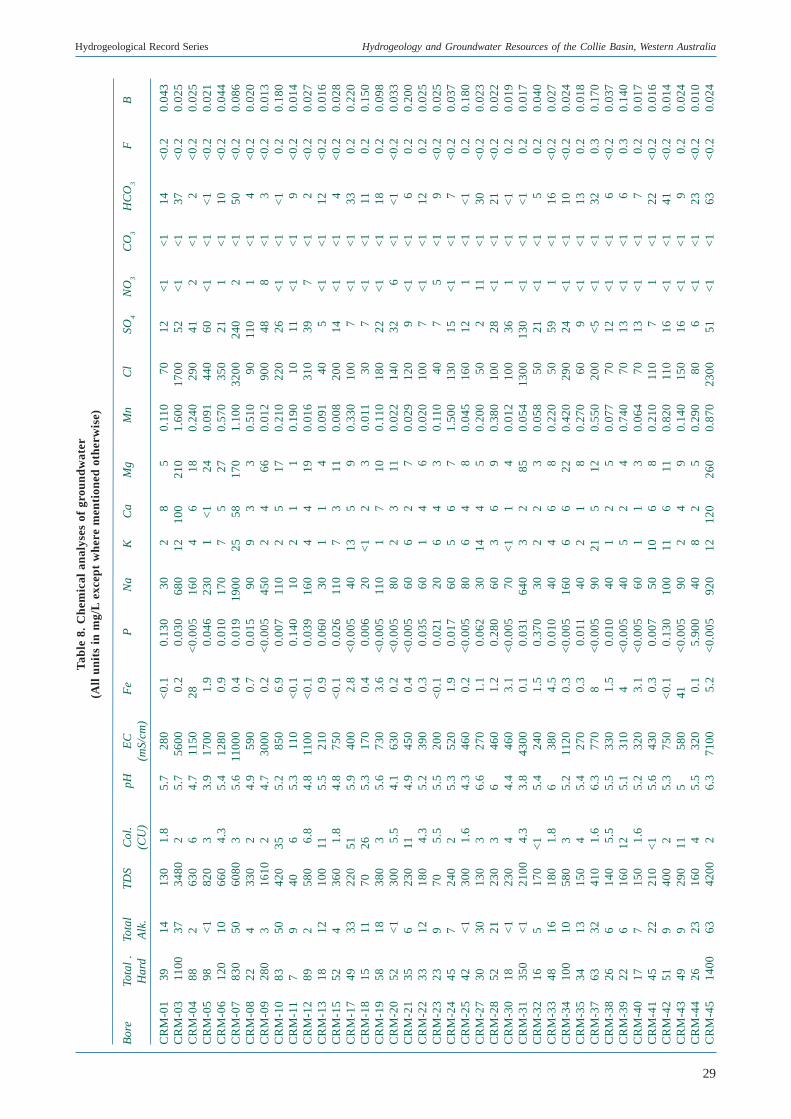
29
Hydrogeological Record Series Hydrogeology and Groundwater Resources of the Collie Basin, Western Australia
CR
M-0
139
1413
01.
85.
728
0<
0.1
0.13
030
28
50.
110
7012
<1
<1
14<
0.2
0.04
3C
RM
-03
1100
3734
802
5.7
5600
0.2
0.03
068
012
100
210
1.60
017
0052
<1
<1
37<
0.2
0.02
5C
RM
-04
882
630
64.
711
5028
<0.
005
160
46
180.
240
290
412
<1
2<
0.2
0.02
5C
RM
-05
98<
182
03
3.9
1700
1.9
0.04
623
01
<1
240.
091
440
60<
1<
1<
1<
0.2
0.02
1C
RM
-06
120
1066
04.
35.
412
800.
90.
010
170
75
270.
570
350
211
<1
10<
0.2
0.04
4C
RM
-07
830
5060
803
5.6
1100
00.
40.
019
1900
2558
170
1.10
032
0024
02
<1
50<
0.2
0.08
6C
RM
-08
224
330
24.
959
00.
70.
015
909
33
0.51
090
110
1<
14
<0.
20.
020
CR
M-0
928
03
1610
24.
730
000.
2<
0.00
545
02
466
0.01
290
048
8<
13
<0.
20.
013
CR
M-1
083
5042
035
5.2
850
6.9
0.00
711
02
517
0.21
022
026
<1
<1
<1
0.2
0.18
0C
RM
-11
79
406
5.3
110
<0.
10.
140
102
11
0.19
010
11<
1<
19
<0.
20.
014
CR
M-1
289
258
06.
84.
811
00<
0.1
0.03
916
04
419
0.01
631
039
7<
12
<0.
20.
027
CR
M-1
318
1210
011
5.5
210
0.9
0.06
030
11
40.
091
405
<1
<1
12<
0.2
0.01
6C
RM
-15
524
360
1.8
4.8
750
<0.
10.
026
110
73
110.
008
200
14<
1<
14
<0.
20.
028
CR
M-1
749
3322
051
5.9
400
2.8
<0.
005
4013
59
0.33
010
07
<1
<1
330.
20.
220
CR
M-1
815
1170
265.
317
00.
40.
006
20<
12
30.
011
307
<1
<1
110.
20.
150
CR
M-1
958
1838
03
5.6
730
3.6
<0.
005
110
17
100.
110
180
22<
1<
118
0.2
0.09
8C
RM
-20
52<
130
05.
54.
163
00.
2<
0.00
580
23
110.
022
140
326
<1
<1
<0.
20.
033
CR
M-2
135
623
011
4.9
450
0.4
<0.
005
606
27
0.02
912
09
<1
<1
60.
20.
200
CR
M-2
233
1218
04.
35.
239
00.
30.
035
601
46
0.02
010
07
<1
<1
120.
20.
025
CR
M-2
323
970
5.5
5.5
200
<0.
10.
021
206
43
0.11
040
75
<1
9<
0.2
0.02
5C
RM
-24
457
240
25.
352
01.
90.
017
605
67
1.50
013
015
<1
<1
7<
0.2
0.03
7C
RM
-25
42<
130
01.
64.
346
00.
2<
0.00
580
64
80.
045
160
121
<1
<1
0.2
0.18
0C
RM
-27
3030
130
36.
627
01.
10.
062
3014
45
0.20
050
211
<1
30<
0.2
0.02
3C
RM
-28
5221
230
36
460
1.2
0.28
060
36
90.
380
100
28<
1<
121
<0.
20.
022
CR
M-3
018
<1
230
44.
446
03.
1<
0.00
570
<1
14
0.01
210
036
1<
1<
10.
20.
019
CR
M-3
135
0<
121
004.
33.
843
000.
10.
031
640
32
850.
054
1300
130
<1
<1
<1
0.2
0.01
7C
RM
-32
165
170
<1
5.4
240
1.5
0.37
030
22
30.
058
5021
<1
<1
50.
20.
040
CR
M-3
348
1618
01.
86
380
4.5
0.01
040
46
80.
220
5059
1<
116
<0.
20.
027
CR
M-3
410
010
580
35.
211
200.
3<
0.00
516
06
622
0.42
029
024
<1
<1
10<
0.2
0.02
4C
RM
-35
3413
150
45.
427
00.
30.
011
402
18
0.27
060
9<
1<
113
0.2
0.01
8C
RM
-37
6332
410
1.6
6.3
770
8<
0.00
590
215
120.
550
200
<5
<1
<1
320.
30.
170
CR
M-3
826
614
05.
55.
533
01.
50.
010
401
25
0.07
770
12<
1<
16
<0.
20.
037
CR
M-3
922
616
012
5.1
310
4<
0.00
540
52
40.
740
7013
<1
<1
60.
30.
140
CR
M-4
017
715
01.
65.
232
03.
1<
0.00
560
11
30.
064
7013
<1
<1
70.
20.
017
CR
M-4
145
2221
0<
15.
643
00.
30.
007
5010
68
0.21
011
07
1<
122
<0.
20.
016
CR
M-4
251
940
02
5.3
750
<0.
10.
130
100
116
110.
820
110
16<
1<
141
<0.
20.
014
CR
M-4
349
929
011
558
041
<0.
005
902
49
0.14
015
016
<1
<1
90.
20.
024
CR
M-4
426
2316
04
5.5
320
0.1
5.90
040
82
50.
290
806
<1
<1
23<
0.2
0.01
0C
RM
-45
1400
6342
002
6.3
7100
5.2
<0.
005
920
1212
026
00.
870
2300
51<
1<
163
<0.
20.
024
Tab
le 8
. Ch
emic
al a
nal
yses
of
grou
nd
wat
er(A
ll u
nit
s in
mg/
L e
xcep
t w
her
e m
enti
oned
oth
erw
ise)
Bor
eTo
tal
.To
tal
TD
SC
ol.
pHE
CF
eP
Na
KC
aM
gM
nC
lSO
4N
O3
CO
3H
CO
3F
BH
ard
Alk
.(C
U)
(mS/
cm)
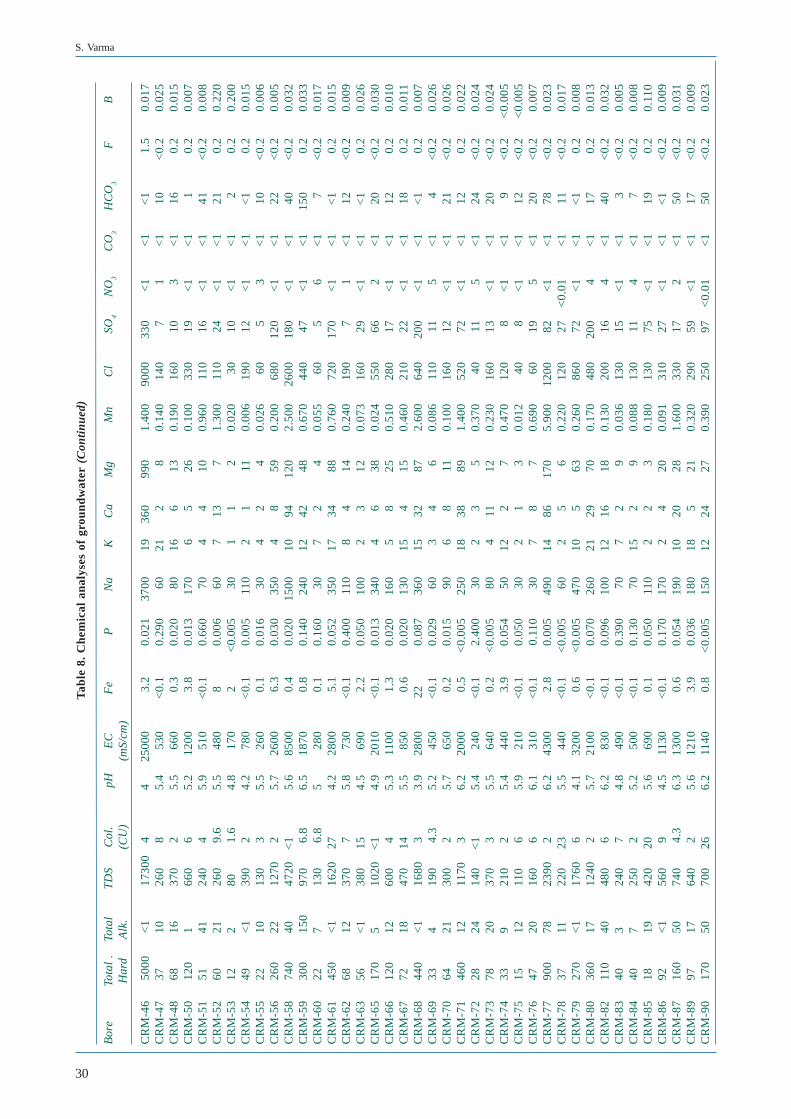
30
S. Varma
CR
M-4
650
00<
117
300
44
2500
03.
20.
021
3700
1936
099
01.
400
9000
330
<1
<1
<1
1.5
0.01
7C
RM
-47
3710
260
85.
453
0<
0.1
0.29
060
212
80.
140
140
71
<1
10<
0.2
0.02
5C
RM
-48
6816
370
25.
566
00.
30.
020
8016
613
0.19
016
010
3<
116
0.2
0.01
5C
RM
-50
120
166
06
5.2
1200
3.8
0.01
317
06
526
0.10
033
019
<1
<1
10.
20.
007
CR
M-5
151
4124
04
5.9
510
<0.
10.
660
704
410
0.96
011
016
<1
<1
41<
0.2
0.00
8C
RM
-52
6021
260
9.6
5.5
480
80.
006
607
137
1.30
011
024
<1
<1
210.
20.
220
CR
M-5
312
280
1.6
4.8
170
2 <
0.00
530
11
20.
020
3010
<1
<1
20.
20.
200
CR
M-5
449
<1
390
24.
278
0<
0.1
0.00
511
02
111
0.00
619
012
<1
<1
<1
0.2
0.01
5C
RM
-55
2210
130
35.
526
00.
10.
016
304
24
0.02
660
53
<1
10<
0.2
0.00
6C
RM
-56
260
2212
702
5.7
2600
6.3
0.03
035
04
859
0.20
068
012
0<
1<
122
<0.
20.
005
CR
M-5
874
040
4720
<1
5.6
8500
0.4
0.02
015
0010
9412
02.
500
2600
180
<1
<1
40<
0.2
0.03
2C
RM
-59
300
150
970
6.8
6.5
1870
0.8
0.14
024
012
4248
0.67
044
047
<1
<1
150
0.2
0.03
3C
RM
-60
227
130
6.8
528
00.
10.
160
307
24
0.05
560
56
<1
7<
0.2
0.01
7C
RM
-61
450
<1
1620
274.
228
005.
10.
052
350
1734
880.
760
720
170
<1
<1
<1
0.2
0.01
5C
RM
-62
6812
370
75.
873
0<
0.1
0.40
011
08
414
0.24
019
07
1<
112
<0.
20.
009
CR
M-6
356
<1
380
154.
569
02.
20.
050
100
23
120.
073
160
29<
1<
1<
10.
20.
026
CR
M-6
517
05
1020
<1
4.9
2010
<0.
10.
013
340
46
380.
024
550
662
<1
20<
0.2
0.03
0C
RM
-66
120
1260
04
5.3
1100
1.3
0.02
016
05
825
0.51
028
017
<1
<1
120.
20.
010
CR
M-6
772
1847
014
5.5
850
0.6
0.02
013
015
415
0.46
021
022
<1
<1
180.
20.
011
CR
M-6
844
0<
116
803
3.9
2800
220.
087
360
1532
872.
600
640
200
<1
<1
<1
0.2
0.00
7C
RM
-69
334
190
4.3
5.2
450
<0.
10.
029
603
46
0.08
611
011
5<
14
<0.
20.
026
CR
M-7
064
2130
02
5.7
650
0.2
0.01
590
68
110.
100
160
12<
1<
121
<0.
20.
026
CR
M-7
146
012
1170
36.
220
000.
5<
0.00
525
018
3889
1.40
052
072
<1
<1
120.
20.
022
CR
M-7
228
2414
0<
15.
424
0<
0.1
2.40
030
23
50.
370
4011
5<
124
<0.
20.
024
CR
M-7
378
2037
03
5.5
640
0.2
<0.
005
804
1112
0.23
016
013
<1
<1
20<
0.2
0.02
4C
RM
-74
339
210
25.
444
03.
90.
054
5012
27
0.47
012
08
<1
<1
9<
0.2
<0.
005
CR
M-7
515
1211
06
5.9
210
<0.
10.
050
302
13
0.01
240
8<
1<
112
<0.
2<
0.00
5C
RM
-76
4720
160
66.
131
0<
0.1
0.11
030
78
70.
690
6019
5<
120
<0.
20.
007
CR
M-7
790
078
2390
26.
243
002.
80.
005
490
1486
170
5.90
012
0082
<1
<1
78<
0.2
0.02
3C
RM
-78
3711
220
235.
544
0<
0.1
<0.
005
602
56
0.22
012
027
<0.
01<
111
<0.
20.
017
CR
M-7
927
0<
117
606
4.1
3200
0.6
<0.
005
470
105
630.
260
860
72<
1<
1<
10.
20.
008
CR
M-8
036
017
1240
25.
721
00<
0.1
0.07
026
021
2970
0.17
048
020
04
<1
170.
20.
013
CR
M-8
211
040
480
66.
283
0<
0.1
0.09
610
012
1618
0.13
020
016
4<
140
<0.
20.
032
CR
M-8
340
324
07
4.8
490
<0.
10.
390
707
29
0.03
613
015
<1
<1
3<
0.2
0.00
5C
RM
-84
407
250
25.
250
0<
0.1
0.13
070
152
90.
088
130
114
<1
7<
0.2
0.00
8C
RM
-85
1819
420
205.
669
00.
10.
050
110
22
30.
180
130
75<
1<
119
0.2
0.11
0C
RM
-86
92<
156
09
4.5
1130
<0.
10.
170
170
24
200.
091
310
27<
1<
1<
1<
0.2
0.00
9C
RM
-87
160
5074
04.
36.
313
000.
60.
054
190
1020
281.
600
330
172
<1
50<
0.2
0.03
1C
RM
-89
9717
640
25.
612
103.
90.
036
180
185
210.
320
290
59<
1<
117
<0.
20.
009
CR
M-9
017
050
700
266.
211
400.
8<
0.00
515
012
2427
0.39
025
097
<0.
01<
150
<0.
20.
023
Tab
le 8
. C
hem
ical
an
alys
es o
f gr
oun
dw
ater
(C
onti
nu
ed)
Bor
eTo
tal
.To
tal
TD
SC
ol.
pHE
CF
eP
Na
KC
aM
gM
nC
lSO
4N
O3
CO
3H
CO
3F
BH
ard
Alk
.(C
U)
(mS/
cm)
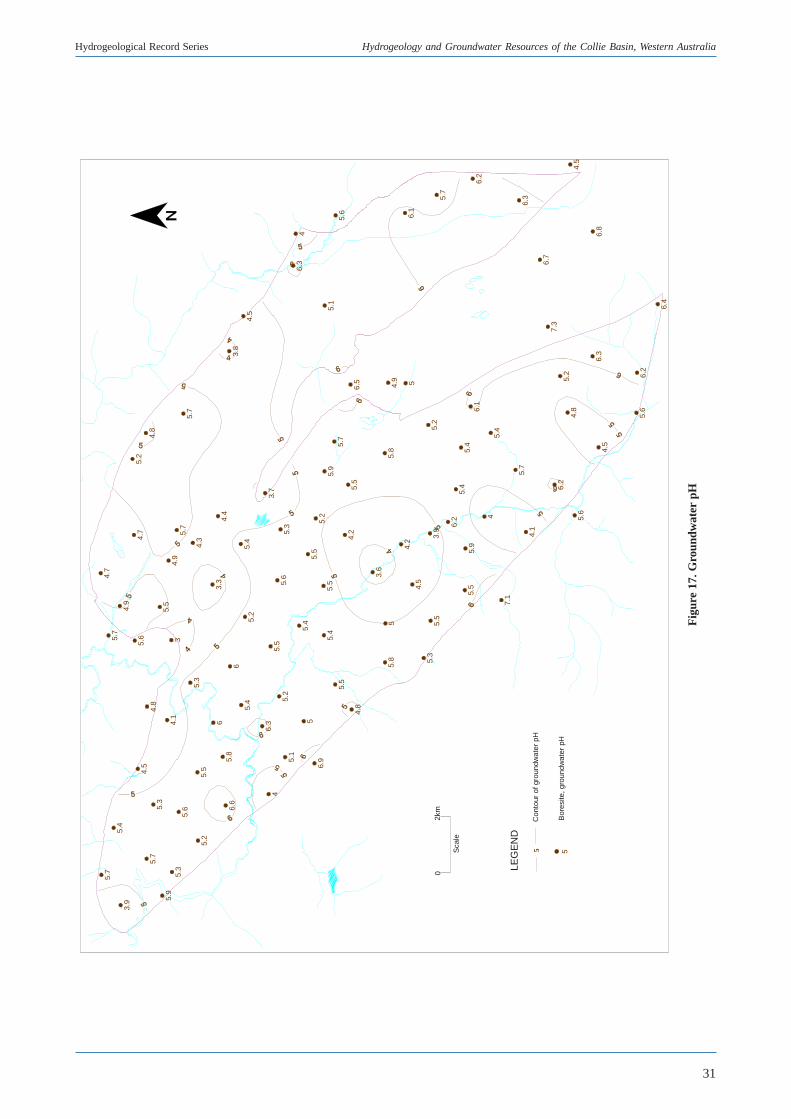
31
Hydrogeological Record Series Hydrogeology and Groundwater Resources of the Collie Basin, Western Australia
Fig
ure
17. G
roun
dwat
er p
H
5.7
4.5
4
5.8
3
6.9
3.3
5.7
5.8
3.6
5.4
3.7
5.7
7.1
4.5
4
5
5.1
7.3
6.1
6.3
6.4
6.8
4.5
6.7
5.7
5.7
4.7
3.9
5.4
5.6
4.9
4.7
5.2
5.3
4.8
5.5
4.8
5.9
5.3
5.6
4.1
4.9
5.2
5.5
5.3
4.3
6.6
64.
4
3.8
5.4
6
5.2
5.4
6.3
5.5
5.1
5.2
5.6
5.3
55.
5
6.3
4
5.4
5.5
5.2
5.9
5.5
4.8
4.2
5.5
5.7
5.6
6.5
5
4.2
5.8
4.5
4.9
5.3
5.5
3.9
5.2
5.7
6.2
5.4
5.5
5.4
5.9
6.1
6.2
5.4
4.1
5.7
6.2
4.8
5.2
5.6
4.5
6.3
5.6
6.2
5C
onto
ur o
f gro
undw
ater
pH
LEG
EN
D
5B
ores
ite, g
roun
dwat
er p
H
02k
m
Sca
le
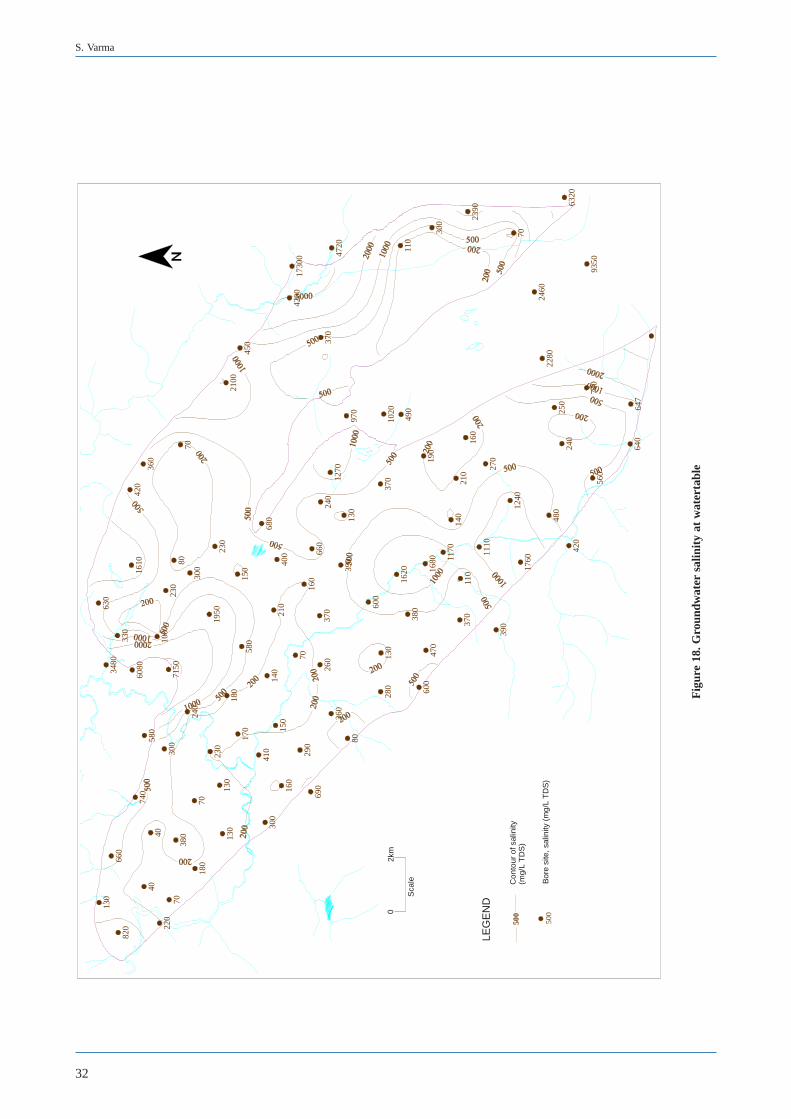
32
S. Varma
Fig
ure
18. G
roun
dwat
er s
alin
ity
at w
ater
tabl
e
4074
0
300
130
7150
690
1950
80
280
600
70
680
70
390
450
1110
490
370
2280
110
70
9350
6320
2460
130
3480
630
820
660
6080
330
1610
420
4058
0
100
360
220
7038
030
023
0
180
7024
030
0
130
230
230
2100
170
180
580
150
410
140
160
150
210
400
290
160
4200
1730
0
260
370
660
240
260
8039
013
0
1270
4720
970
130
1620
370
380
1020
600
470
1680
190
300
1170
140
370
210
110
160
2390
270
1760
1240
480
240
250
420
560
740
640
647
500
Con
tour
of s
alin
ity
(mg/
L T
DS
)
LEG
EN
D
500
Bor
e si
te, s
alin
ity (
mg/
L T
DS
)
02k
m
Sca
le
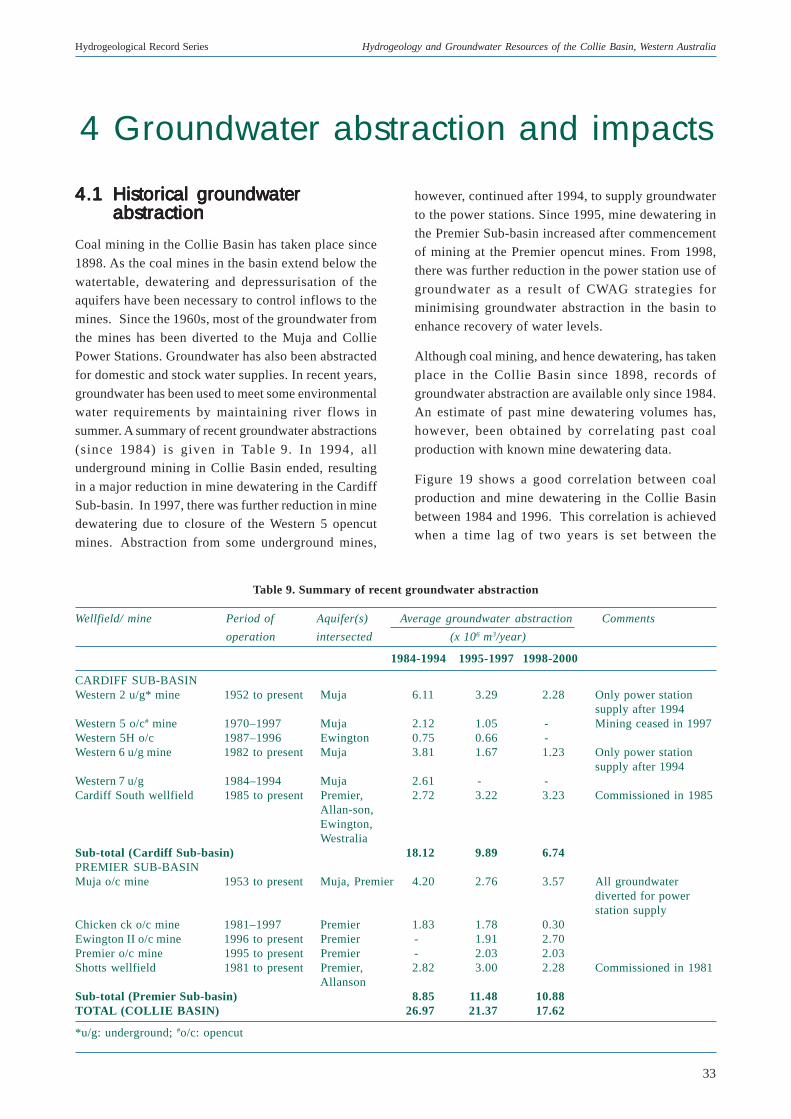
33
Hydrogeological Record Series Hydrogeology and Groundwater Resources of the Collie Basin, Western Australia
4 Groundwater abstraction and impacts
4.14.14.14.14.1 Historical groundwaterHistorical groundwaterHistorical groundwaterHistorical groundwaterHistorical groundwaterabstractionabstractionabstractionabstractionabstraction
Coal mining in the Collie Basin has taken place since
1898. As the coal mines in the basin extend below the
watertable, dewatering and depressurisation of theaquifers have been necessary to control inflows to the
mines. Since the 1960s, most of the groundwater from
the mines has been diverted to the Muja and ColliePower Stations. Groundwater has also been abstracted
for domestic and stock water supplies. In recent years,
groundwater has been used to meet some environmentalwater requirements by maintaining river flows in
summer. A summary of recent groundwater abstractions
(since 1984) is given in Table 9. In 1994, allunderground mining in Collie Basin ended, resulting
in a major reduction in mine dewatering in the Cardiff
Sub-basin. In 1997, there was further reduction in minedewatering due to closure of the Western 5 opencut
mines. Abstraction from some underground mines,
Table 9. Summary of recent groundwater abstraction
Wellfield/ mine Period of Aquifer(s) Average groundwater abstraction Comments
operation intersected (x 106 m3/year)
1984-1994 1995-1997 1998-2000
CARDIFF SUB-BASINWestern 2 u/g* mine 1952 to present Muja 6.11 3.29 2.28 Only power station
supply after 1994Western 5 o/c# mine 1970–1997 Muja 2.12 1.05 - Mining ceased in 1997Western 5H o/c 1987–1996 Ewington 0.75 0.66 -Western 6 u/g mine 1982 to present Muja 3.81 1.67 1.23 Only power station
supply after 1994Western 7 u/g 1984–1994 Muja 2.61 - -Cardiff South wellfield 1985 to present Premier, 2.72 3.22 3.23 Commissioned in 1985
Allan-son,Ewington,Westralia
Sub-total (Cardiff Sub-basin) 18.12 9.89 6.74PREMIER SUB-BASINMuja o/c mine 1953 to present Muja, Premier 4.20 2.76 3.57 All groundwater
diverted for powerstation supply
Chicken ck o/c mine 1981–1997 Premier 1.83 1.78 0.30Ewington II o/c mine 1996 to present Premier - 1.91 2.70Premier o/c mine 1995 to present Premier - 2.03 2.03Shotts wellfield 1981 to present Premier, 2.82 3.00 2.28 Commissioned in 1981
AllansonSub-total (Premier Sub-basin) 8.85 11.48 10.88TOTAL (COLLIE BASIN) 26.97 21.37 17.62
*u/g: underground; #o/c: opencut
however, continued after 1994, to supply groundwater
to the power stations. Since 1995, mine dewatering in
the Premier Sub-basin increased after commencementof mining at the Premier opencut mines. From 1998,
there was further reduction in the power station use of
groundwater as a result of CWAG strategies forminimising groundwater abstraction in the basin to
enhance recovery of water levels.
Although coal mining, and hence dewatering, has taken
place in the Collie Basin since 1898, records of
groundwater abstraction are available only since 1984.An estimate of past mine dewatering volumes has,
however, been obtained by correlating past coal
production with known mine dewatering data.
Figure 19 shows a good correlation between coal
production and mine dewatering in the Collie Basin
between 1984 and 1996. This correlation is achievedwhen a time lag of two years is set between the
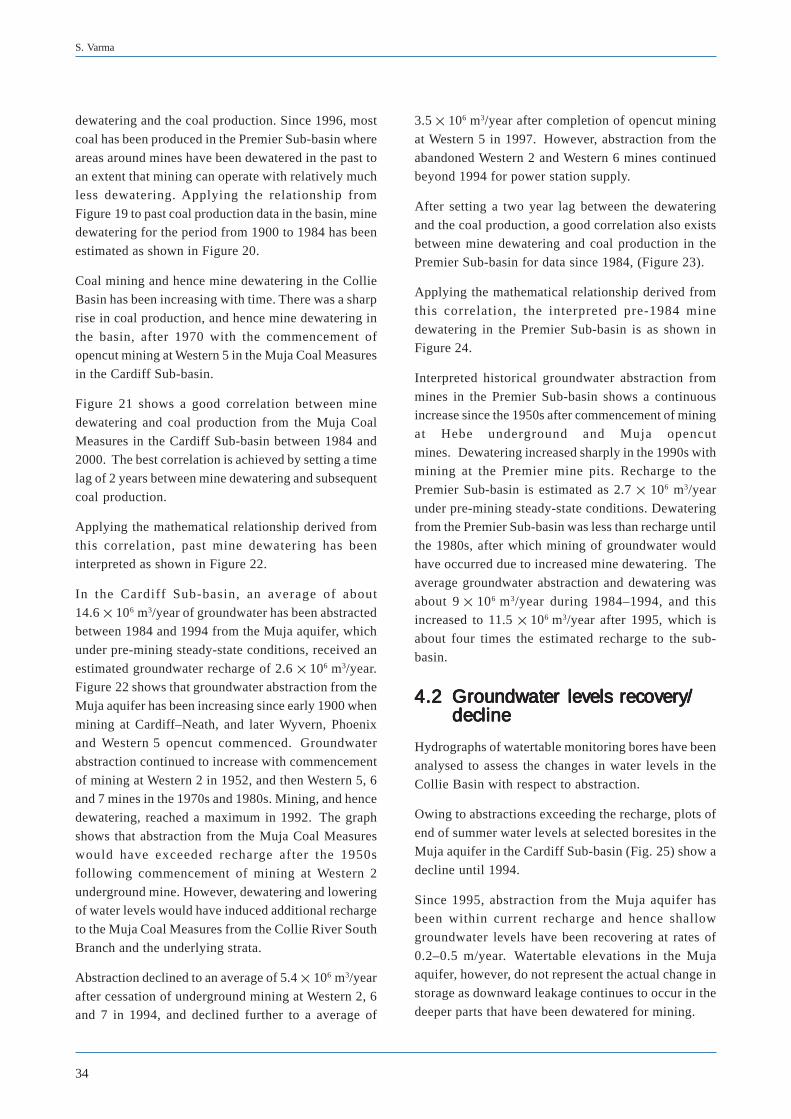
34
S. Varma
dewatering and the coal production. Since 1996, most
coal has been produced in the Premier Sub-basin where
areas around mines have been dewatered in the past toan extent that mining can operate with relatively much
less dewatering. Applying the relationship from
Figure 19 to past coal production data in the basin, minedewatering for the period from 1900 to 1984 has been
estimated as shown in Figure 20.
Coal mining and hence mine dewatering in the CollieBasin has been increasing with time. There was a sharp
rise in coal production, and hence mine dewatering in
the basin, after 1970 with the commencement ofopencut mining at Western 5 in the Muja Coal Measures
in the Cardiff Sub-basin.
Figure 21 shows a good correlation between mine
dewatering and coal production from the Muja Coal
Measures in the Cardiff Sub-basin between 1984 and2000. The best correlation is achieved by setting a time
lag of 2 years between mine dewatering and subsequent
coal production.
Applying the mathematical relationship derived from
this correlation, past mine dewatering has beeninterpreted as shown in Figure 22.
In the Cardiff Sub-basin, an average of about
14.6 106 m3/year of groundwater has been abstractedbetween 1984 and 1994 from the Muja aquifer, which
under pre-mining steady-state conditions, received an
estimated groundwater recharge of 2.6 106 m3/year.Figure 22 shows that groundwater abstraction from the
Muja aquifer has been increasing since early 1900 when
mining at Cardiff–Neath, and later Wyvern, Phoenixand Western 5 opencut commenced. Groundwater
abstraction continued to increase with commencement
of mining at Western 2 in 1952, and then Western 5, 6and 7 mines in the 1970s and 1980s. Mining, and hence
dewatering, reached a maximum in 1992. The graph
shows that abstraction from the Muja Coal Measureswould have exceeded recharge after the 1950s
following commencement of mining at Western 2
underground mine. However, dewatering and loweringof water levels would have induced additional recharge
to the Muja Coal Measures from the Collie River South
Branch and the underlying strata.
Abstraction declined to an average of 5.4 106 m3/year
after cessation of underground mining at Western 2, 6and 7 in 1994, and declined further to a average of
3.5 106 m3/year after completion of opencut mining
at Western 5 in 1997. However, abstraction from the
abandoned Western 2 and Western 6 mines continuedbeyond 1994 for power station supply.
After setting a two year lag between the dewatering
and the coal production, a good correlation also existsbetween mine dewatering and coal production in the
Premier Sub-basin for data since 1984, (Figure 23).
Applying the mathematical relationship derived from
this correlation, the interpreted pre-1984 mine
dewatering in the Premier Sub-basin is as shown inFigure 24.
Interpreted historical groundwater abstraction from
mines in the Premier Sub-basin shows a continuousincrease since the 1950s after commencement of mining
at Hebe underground and Muja opencut
mines. Dewatering increased sharply in the 1990s withmining at the Premier mine pits. Recharge to the
Premier Sub-basin is estimated as 2.7 106 m3/year
under pre-mining steady-state conditions. Dewateringfrom the Premier Sub-basin was less than recharge until
the 1980s, after which mining of groundwater wouldhave occurred due to increased mine dewatering. The
average groundwater abstraction and dewatering was
about 9 106 m3/year during 1984–1994, and thisincreased to 11.5 106 m3/year after 1995, which is
about four times the estimated recharge to the sub-
basin.
4.24.24.24.24.2 Groundwater levels recovery/Groundwater levels recovery/Groundwater levels recovery/Groundwater levels recovery/Groundwater levels recovery/declinedeclinedeclinedeclinedecline
Hydrographs of watertable monitoring bores have been
analysed to assess the changes in water levels in the
Collie Basin with respect to abstraction.
Owing to abstractions exceeding the recharge, plots of
end of summer water levels at selected boresites in theMuja aquifer in the Cardiff Sub-basin (Fig. 25) show a
decline until 1994.
Since 1995, abstraction from the Muja aquifer hasbeen within current recharge and hence shallow
groundwater levels have been recovering at rates of
0.2–0.5 m/year. Watertable elevations in the Mujaaquifer, however, do not represent the actual change in
storage as downward leakage continues to occur in the
deeper parts that have been dewatered for mining.
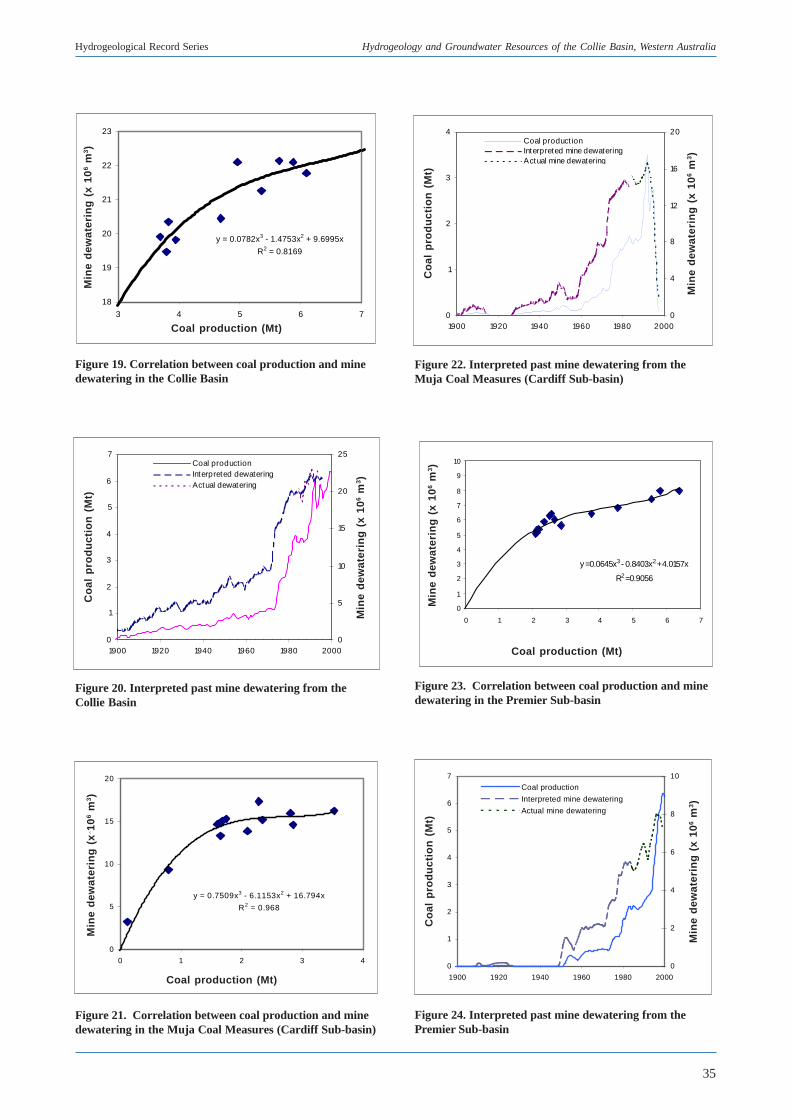
35
Hydrogeological Record Series Hydrogeology and Groundwater Resources of the Collie Basin, Western Australia
Figure 19. Correlation between coal production and minedewatering in the Collie Basin
y = 0.0782x3 - 1.4753x2 + 9.6995x
R2 = 0.8169
18
19
20
21
22
23
3 4 5 6 7
Coal production (Mt)
Min
e de
wat
erin
g (x
106 m
3 )
0
1
2
3
4
5
6
7
1900 1920 1940 1960 1980 20000
5
10
15
20
25
Min
e de
wat
erin
g (x
106
m3 )
Coal productionInterpreted dewateringActual dewatering
y = 0.7509x3 - 6.1153x2 + 16.794x
R2 = 0.968
0
5
10
15
20
0 1 2 3 4
Coal production (Mt)
Min
e de
wat
erin
g (x
106 m
3 )
y = 0.0645x3 - 0.8403x2 + 4.0157x
R2 = 0.9056
0
1
2
3
4
5
6
7
8
9
10
0 1 2 3 4 5 6 7
0
1
2
3
4
5
6
7
1900 1920 1940 1960 1980 2000
Coa
l pro
duct
ion
(Mt)
0
2
4
6
8
10
Min
e de
wat
erin
g (x
106 m
3 )
Coal production
Interpreted mine dewatering
Actual mine dewatering
Figure 20. Interpreted past mine dewatering from theCollie Basin
Figure 21. Correlation between coal production and minedewatering in the Muja Coal Measures (Cardiff Sub-basin)
Figure 22. Interpreted past mine dewatering from theMuja Coal Measures (Cardiff Sub-basin)
Figure 23. Correlation between coal production and minedewatering in the Premier Sub-basin
Figure 24. Interpreted past mine dewatering from thePremier Sub-basin
0
1
2
3
4
1900 1920 1940 1960 1980 20000
4
8
12
16
20Coal product ionInterpreted mine dewateringActual mine dewatering
Co
al p
rod
uct
ion
(M
t)
Min
e d
ewat
erin
g (
x 10
6 m
3 )
Min
e d
ewat
erin
g (
x 10
6 m
3 )
Coal production (Mt)
Coal production (Mt)
Min
e d
ewat
erin
g (
x 10
6 m
3 )
Co
al p
rod
uct
ion
(M
t)M
ine
dew
ater
ing
(x
106
m3 )
Min
e d
ewat
erin
g (
x 10
6 m
3 )
Min
e d
ewat
erin
g (
x 10
6 m
3 )
Co
al p
rod
uct
ion
(M
t)
Coal production (Mt)

36
S. Varma
Most abstraction from the Premier, Allanson and
Ewington aquifers of the Cardiff Sub-basin has taken
place since 1985 from Cardiff South wellfield at anaverage rate of 2.7–3.2 106 m3/year (Table 9). Although
abstraction has always been within the recharge limits
(5.5 106 m3/year), water levels in these aquifers nearthe Cardiff South wellfield declined between 1998 and
2000 at 0.5–1.0 m/year (Fig. 26). The reasons for this
decline could be
• Truncation of the aquifers due to faulting and hence
decreased recharge,
• The wellfield has not attained steady state condition,
or
• There is leakage from these aquifers to the Mujaaquifer where heads are lowered due to large-scale
dewatering in the past.
Groundwater modeling has shown that in response to
reduced heads in Muja aquifer, there is significant flow of
groundwater from the Premier aquifer to the overlyingMuja aquifer under present conditions (2.7 106 m3/year)
compared with pre-mining steady-state conditions
(0.3 106 m3/year).
In the Premier Sub-basin, groundwater abstraction
occurs mainly from the Premier, Allanson and Mujaaquifers. Abstraction from the Allanson aquifer took
place in the Shotts wellfield between 1984 and 1997.
It is estimated that an average of 1.5 106 m3/year wasabstracted from the Allanson aquifer from the Shotts
wellfield. Bores CBS14A and CBS32 that monitor
water levels in the area beneath which this aquifersubcrops have not shown any significant decline in the
water levels (Fig. 27), indicating that abstraction from
this aquifer has occurred within recharge.
Abstraction from the Premier aquifer, from the Shotts
wellfield and the opencut mines, in the Premier Sub-
basin has been significantly higher than the estimatedrecharge of 1.7 106 m3/year. As a result, water levels
in bores CBS21D and CBS29 that are installed in this
aquifer have declined at the rate of 1 to 2.5 m/year. The rainfall during the period of assessment (1984–
2000) has remained stable. This implies that decline in
water level is due mainly to abstractions and notclimatic factors. While there has been about 20%
decline in the average annual rainfall in the Collie
Basin, as in the entire southwest of Western Australiasince 1950, increased mining and consequent clearing
165
170
175
180
185
190
195
200
205
1984 1986 1988 1990 1992 1994 1996 1998 2000
Wat
er le
vel (
m A
HD
)
W682s
W682d
CBS16
CBS25A
CBS25B
CE2-1
175
185
195
205
215
225
1986 1990 1994 1998 2002
Year
Wat
er le
vel (
m A
HD
)
CBS21D
CBS29
CBS32
CBS14A
Figure 25. Hydrographs of the Muja aquifer, Cardiff Sub-basin
Figure 26. Hydrographs of the Premier and Allansonaquifers, Cardiff Sub-basin
Figure 27. Hydrographs of the aquifers in Premier Sub-basin
165
170
175
180
185
190
195
1982 1987 1992 1997 2002
Wat
er le
vel (
m A
HD
)
L7
CBS18
CE1-1
CBS2A
CBS9A
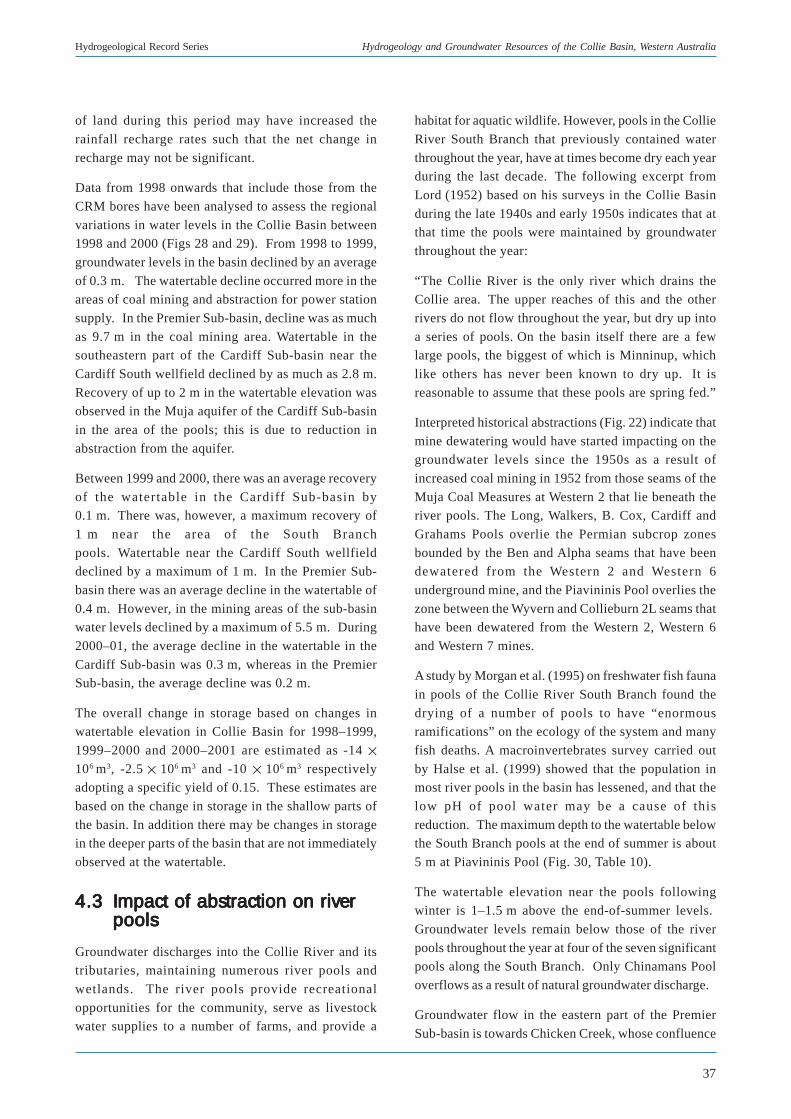
37
Hydrogeological Record Series Hydrogeology and Groundwater Resources of the Collie Basin, Western Australia
of land during this period may have increased the
rainfall recharge rates such that the net change in
recharge may not be significant.
Data from 1998 onwards that include those from the
CRM bores have been analysed to assess the regional
variations in water levels in the Collie Basin between1998 and 2000 (Figs 28 and 29). From 1998 to 1999,
groundwater levels in the basin declined by an average
of 0.3 m. The watertable decline occurred more in theareas of coal mining and abstraction for power station
supply. In the Premier Sub-basin, decline was as much
as 9.7 m in the coal mining area. Watertable in thesoutheastern part of the Cardiff Sub-basin near the
Cardiff South wellfield declined by as much as 2.8 m.
Recovery of up to 2 m in the watertable elevation wasobserved in the Muja aquifer of the Cardiff Sub-basin
in the area of the pools; this is due to reduction in
abstraction from the aquifer.
Between 1999 and 2000, there was an average recovery
of the watertable in the Cardiff Sub-basin by0.1 m. There was, however, a maximum recovery of
1 m near the area of the South Branch
pools. Watertable near the Cardiff South wellfielddeclined by a maximum of 1 m. In the Premier Sub-
basin there was an average decline in the watertable of
0.4 m. However, in the mining areas of the sub-basinwater levels declined by a maximum of 5.5 m. During
2000–01, the average decline in the watertable in the
Cardiff Sub-basin was 0.3 m, whereas in the PremierSub-basin, the average decline was 0.2 m.
The overall change in storage based on changes inwatertable elevation in Collie Basin for 1998–1999,
1999–2000 and 2000–2001 are estimated as -14
106 m3, -2.5 106 m3 and -10 106 m3 respectivelyadopting a specific yield of 0.15. These estimates are
based on the change in storage in the shallow parts of
the basin. In addition there may be changes in storagein the deeper parts of the basin that are not immediately
observed at the watertable.
4.34.34.34.34.3 Impact of abstraction on riverImpact of abstraction on riverImpact of abstraction on riverImpact of abstraction on riverImpact of abstraction on riverpoolspoolspoolspoolspools
Groundwater discharges into the Collie River and itstributaries, maintaining numerous river pools and
wetlands. The river pools provide recreational
opportunities for the community, serve as livestockwater supplies to a number of farms, and provide a
habitat for aquatic wildlife. However, pools in the Collie
River South Branch that previously contained water
throughout the year, have at times become dry each yearduring the last decade. The following excerpt from
Lord (1952) based on his surveys in the Collie Basin
during the late 1940s and early 1950s indicates that atthat time the pools were maintained by groundwater
throughout the year:
“The Collie River is the only river which drains theCollie area. The upper reaches of this and the other
rivers do not flow throughout the year, but dry up into
a series of pools. On the basin itself there are a fewlarge pools, the biggest of which is Minninup, which
like others has never been known to dry up. It is
reasonable to assume that these pools are spring fed.”
Interpreted historical abstractions (Fig. 22) indicate that
mine dewatering would have started impacting on thegroundwater levels since the 1950s as a result of
increased coal mining in 1952 from those seams of the
Muja Coal Measures at Western 2 that lie beneath theriver pools. The Long, Walkers, B. Cox, Cardiff and
Grahams Pools overlie the Permian subcrop zones
bounded by the Ben and Alpha seams that have beendewatered from the Western 2 and Western 6
underground mine, and the Piavininis Pool overlies the
zone between the Wyvern and Collieburn 2L seams thathave been dewatered from the Western 2, Western 6
and Western 7 mines.
A study by Morgan et al. (1995) on freshwater fish fauna
in pools of the Collie River South Branch found the
drying of a number of pools to have “enormousramifications” on the ecology of the system and many
fish deaths. A macroinvertebrates survey carried out
by Halse et al. (1999) showed that the population inmost river pools in the basin has lessened, and that the
low pH of pool water may be a cause of this
reduction. The maximum depth to the watertable belowthe South Branch pools at the end of summer is about
5 m at Piavininis Pool (Fig. 30, Table 10).
The watertable elevation near the pools followingwinter is 1–1.5 m above the end-of-summer levels.
Groundwater levels remain below those of the river
pools throughout the year at four of the seven significantpools along the South Branch. Only Chinamans Pool
overflows as a result of natural groundwater discharge.
Groundwater flow in the eastern part of the Premier
Sub-basin is towards Chicken Creek, whose confluence
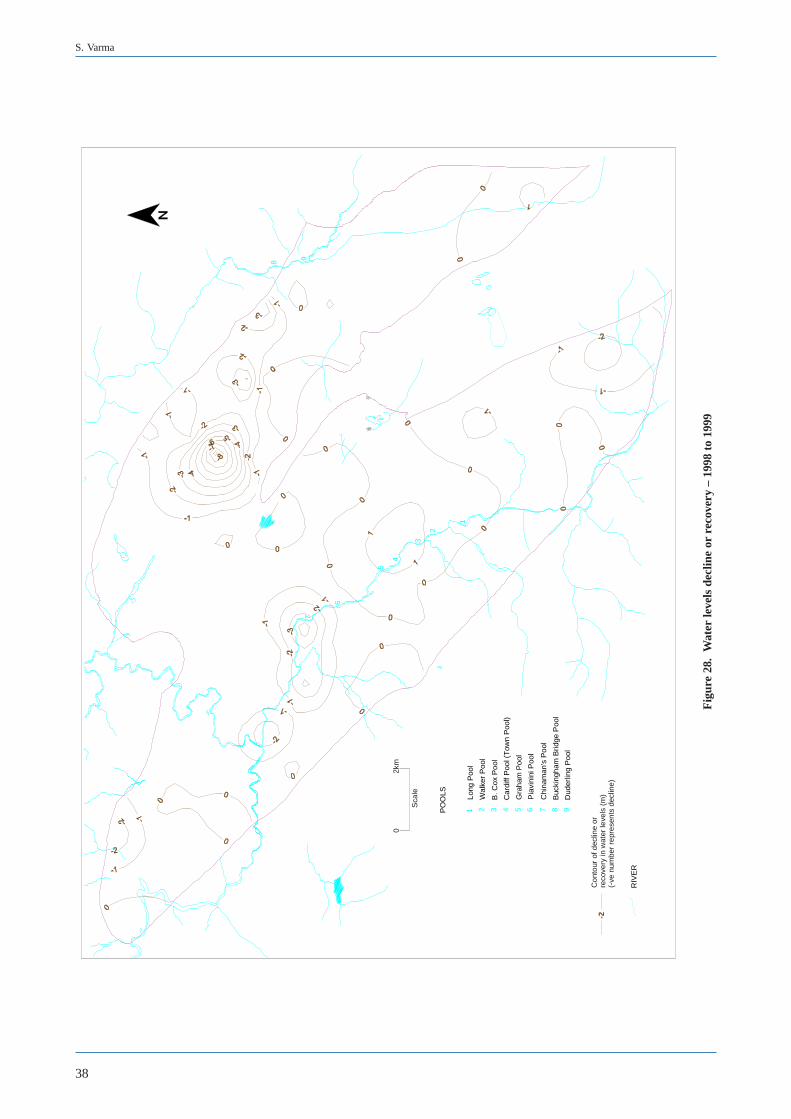
38
S. Varma
Fig
ure
28.
Wat
er le
vels
dec
line
or r
ecov
ery
– 19
98 t
o 19
99
8 9
4
3
2
5
6
7
1
PO
OLS Lo
ng P
ool
Car
diff
Poo
l (T
own
Poo
l)
Chi
nam
an's
Poo
l
Buc
king
ham
Brid
ge P
ool
Dud
erlin
g P
ool
Wal
ker
Poo
l
B. C
ox P
ool
Gra
ham
Poo
l
Pia
vini
ni P
ool
1 2 3 4 5 6 7 8 9
RIV
ER
-2C
onto
ur o
f dec
line
orre
cove
ry in
wat
er le
vels
(m
)(-
ve n
umbe
r re
pres
ents
dec
line)
02k
m
Sca
le
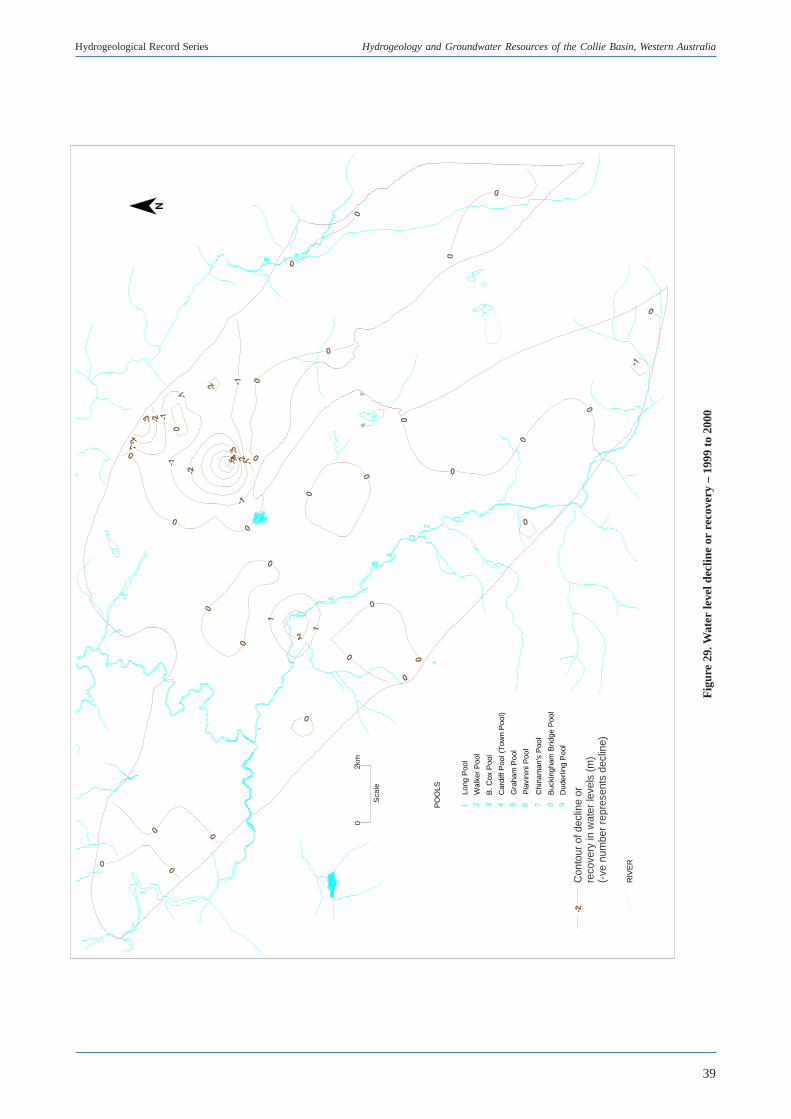
39
Hydrogeological Record Series Hydrogeology and Groundwater Resources of the Collie Basin, Western Australia
Fig
ure
29. W
ater
leve
l dec
line
or r
ecov
ery
– 19
99 t
o 20
00
8 9
4
3
2
5
6
7
1
PO
OLS Lo
ng P
ool
Car
diff
Poo
l (T
own
Poo
l)
Chi
nam
an's
Poo
l
Buc
king
ham
Brid
ge P
ool
Dud
erlin
g P
ool
Wal
ker
Poo
l
B. C
ox P
ool
Gra
ham
Poo
l
Pia
vini
ni P
ool
1 2 3 4 5 6 7 8 9
RIV
ER
-2C
onto
ur o
f dec
line
orre
cove
ry in
wat
er le
vels
(m)
(-ve
num
ber
repr
esen
ts d
eclin
e)
02k
m
Sca
le
40
S. Varma
Fig
ure
30. H
ydro
geol
ogic
al s
ecti
on a
long
riv
er p
ools
CO
LL
IE
A
B
PIA
VIN
INIS
PO
OL
CA
RD
IFF
PO
OL
CO
XP
OO
LLO
NG
PO
OL
CB
S18
CB
S17
A
W68
2C
RM
61/9
8
CR
M68
/98
CR
M71
/98
PR
EM
IER
CO
AL
ME
AS
UR
ES
MU
JA C
OA
LM
EA
SU
RE
S
LE
GE
ND M
onito
ring
bore
Coa
l sea
m
K2S
WS
UPS
CH
INA
MA
NS
PO
OL
GR
AH
AM
SP
OO
LW
ALK
ER
SP
OO
L
Muj
a C
oal M
easu
res
Pre
mie
r C
oal M
easu
res
CB
S17
A
AB
140
150
160
170
180
190
Metres (AHD)
Nak
ina
For
mat
ion
140
150
160
170
180
190
Metres (AHD)
Wat
erta
ble
0
2km
Sca
le
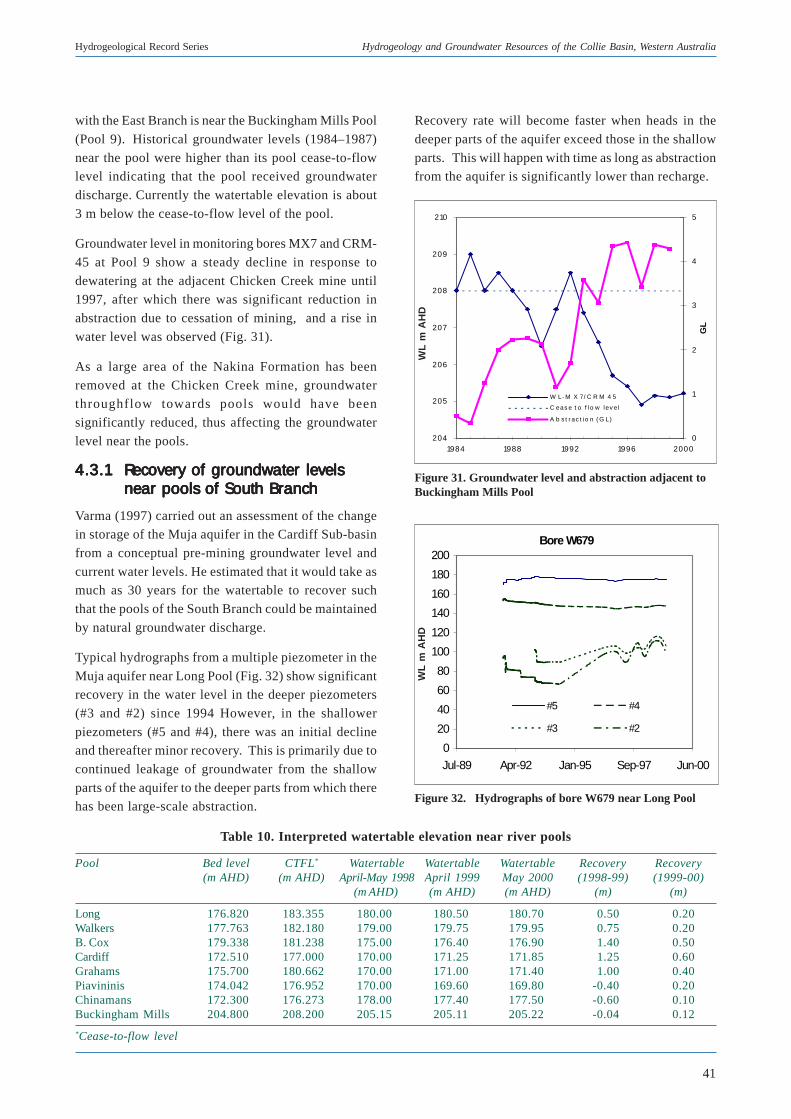
41
Hydrogeological Record Series Hydrogeology and Groundwater Resources of the Collie Basin, Western Australia
with the East Branch is near the Buckingham Mills Pool
(Pool 9). Historical groundwater levels (1984–1987)
near the pool were higher than its pool cease-to-flowlevel indicating that the pool received groundwater
discharge. Currently the watertable elevation is about
3 m below the cease-to-flow level of the pool.
Groundwater level in monitoring bores MX7 and CRM-
45 at Pool 9 show a steady decline in response to
dewatering at the adjacent Chicken Creek mine until1997, after which there was significant reduction in
abstraction due to cessation of mining, and a rise in
water level was observed (Fig. 31).
As a large area of the Nakina Formation has been
removed at the Chicken Creek mine, groundwaterthroughflow towards pools would have been
significantly reduced, thus affecting the groundwater
level near the pools.
4.3.14.3.14.3.14.3.14.3.1 Recovery of groundwater levelsRecovery of groundwater levelsRecovery of groundwater levelsRecovery of groundwater levelsRecovery of groundwater levelsnear pools of South Branchnear pools of South Branchnear pools of South Branchnear pools of South Branchnear pools of South Branch
Varma (1997) carried out an assessment of the changein storage of the Muja aquifer in the Cardiff Sub-basin
from a conceptual pre-mining groundwater level and
current water levels. He estimated that it would take asmuch as 30 years for the watertable to recover such
that the pools of the South Branch could be maintained
by natural groundwater discharge.
Typical hydrographs from a multiple piezometer in the
Muja aquifer near Long Pool (Fig. 32) show significantrecovery in the water level in the deeper piezometers
(#3 and #2) since 1994 However, in the shallower
piezometers (#5 and #4), there was an initial declineand thereafter minor recovery. This is primarily due to
continued leakage of groundwater from the shallow
parts of the aquifer to the deeper parts from which therehas been large-scale abstraction.
Figure 32. Hydrographs of bore W679 near Long Pool
Figure 31. Groundwater level and abstraction adjacent toBuckingham Mills Pool
Bore W679
0
20
40
60
80
100
120
140
160
180
200
Jul-89 Apr-92 Jan-95 Sep-97 Jun-00
WL(
m A
HD
)
#5 #4
#3 #2
Table 10. Interpreted watertable elevation near river pools
Pool Bed level CTFL* Watertable Watertable Watertable Recovery Recovery(m AHD) (m AHD) April-May 1998 April 1999 May 2000 (1998-99) (1999-00)
(m AHD) (m AHD) (m AHD) (m) (m)
Long 176.820 183.355 180.00 180.50 180.70 0.50 0.20Walkers 177.763 182.180 179.00 179.75 179.95 0.75 0.20B. Cox 179.338 181.238 175.00 176.40 176.90 1.40 0.50Cardiff 172.510 177.000 170.00 171.25 171.85 1.25 0.60Grahams 175.700 180.662 170.00 171.00 171.40 1.00 0.40Piavininis 174.042 176.952 170.00 169.60 169.80 -0.40 0.20Chinamans 172.300 176.273 178.00 177.40 177.50 -0.60 0.10Buckingham Mills 204.800 208.200 205.15 205.11 205.22 -0.04 0.12
*Cease-to-flow level
Recovery rate will become faster when heads in the
deeper parts of the aquifer exceed those in the shallow
parts. This will happen with time as long as abstractionfrom the aquifer is significantly lower than recharge.
WL
m A
HD
204
205
206
207
208
209
210
1984 1988 1992 1996 2000
WL
mA
HD
0
1
2
3
4
5
GL
W L- M X 7/ C R M 4 5
C eas e t o f lo w lev el
A b s t r ac t io n ( G L)W
L m
AH
D
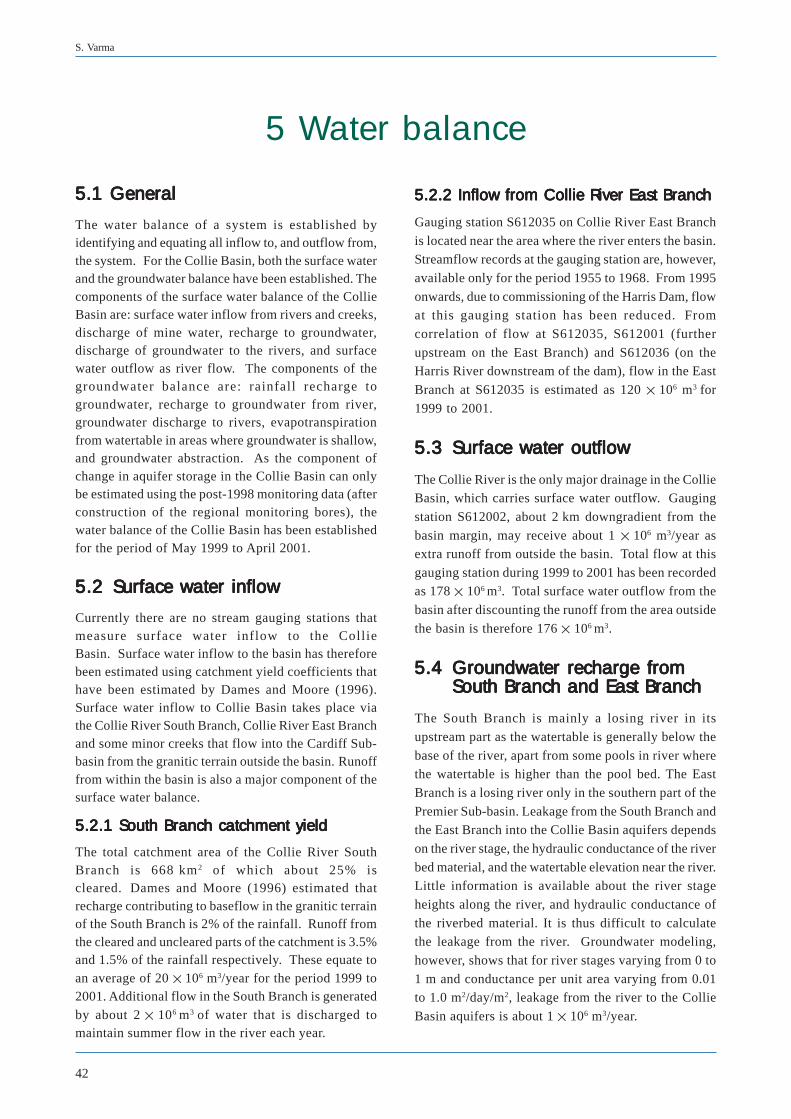
42
S. Varma
5.1 General5.1 General5.1 General5.1 General5.1 General
The water balance of a system is established byidentifying and equating all inflow to, and outflow from,the system. For the Collie Basin, both the surface waterand the groundwater balance have been established. Thecomponents of the surface water balance of the CollieBasin are: surface water inflow from rivers and creeks,discharge of mine water, recharge to groundwater,discharge of groundwater to the rivers, and surfacewater outflow as river flow. The components of thegroundwater balance are: rainfall recharge togroundwater, recharge to groundwater from river,groundwater discharge to rivers, evapotranspirationfrom watertable in areas where groundwater is shallow,and groundwater abstraction. As the component ofchange in aquifer storage in the Collie Basin can onlybe estimated using the post-1998 monitoring data (afterconstruction of the regional monitoring bores), thewater balance of the Collie Basin has been establishedfor the period of May 1999 to April 2001.
5.25.25.25.25.2 Surface water inflowSurface water inflowSurface water inflowSurface water inflowSurface water inflow
Currently there are no stream gauging stations thatmeasure surface water inflow to the CollieBasin. Surface water inflow to the basin has thereforebeen estimated using catchment yield coefficients thathave been estimated by Dames and Moore (1996).Surface water inflow to Collie Basin takes place viathe Collie River South Branch, Collie River East Branchand some minor creeks that flow into the Cardiff Sub-basin from the granitic terrain outside the basin. Runofffrom within the basin is also a major component of thesurface water balance.
5.2.1 South Branch catchment yield5.2.1 South Branch catchment yield5.2.1 South Branch catchment yield5.2.1 South Branch catchment yield5.2.1 South Branch catchment yield
The total catchment area of the Collie River SouthBranch is 668 km2 of which about 25% iscleared. Dames and Moore (1996) estimated thatrecharge contributing to baseflow in the granitic terrainof the South Branch is 2% of the rainfall. Runoff fromthe cleared and uncleared parts of the catchment is 3.5%and 1.5% of the rainfall respectively. These equate toan average of 20 106 m3/year for the period 1999 to2001. Additional flow in the South Branch is generatedby about 2 106 m3 of water that is discharged tomaintain summer flow in the river each year.
5 Water balance
5.2.2 Inflow from Collie River East Branch5.2.2 Inflow from Collie River East Branch5.2.2 Inflow from Collie River East Branch5.2.2 Inflow from Collie River East Branch5.2.2 Inflow from Collie River East Branch
Gauging station S612035 on Collie River East Branch
is located near the area where the river enters the basin.Streamflow records at the gauging station are, however,
available only for the period 1955 to 1968. From 1995
onwards, due to commissioning of the Harris Dam, flowat this gauging station has been reduced. From
correlation of flow at S612035, S612001 (further
upstream on the East Branch) and S612036 (on theHarris River downstream of the dam), flow in the East
Branch at S612035 is estimated as 120 106 m3 for
1999 to 2001.
5.35.35.35.35.3 Surface water outflowSurface water outflowSurface water outflowSurface water outflowSurface water outflow
The Collie River is the only major drainage in the CollieBasin, which carries surface water outflow. Gauging
station S612002, about 2 km downgradient from the
basin margin, may receive about 1 106 m3/year asextra runoff from outside the basin. Total flow at this
gauging station during 1999 to 2001 has been recordedas 178 106 m3. Total surface water outflow from the
basin after discounting the runoff from the area outside
the basin is therefore 176 106 m3.
5.45.45.45.45.4 Groundwater recharge fromGroundwater recharge fromGroundwater recharge fromGroundwater recharge fromGroundwater recharge fromSouth Branch and East BranchSouth Branch and East BranchSouth Branch and East BranchSouth Branch and East BranchSouth Branch and East Branch
The South Branch is mainly a losing river in its
upstream part as the watertable is generally below the
base of the river, apart from some pools in river wherethe watertable is higher than the pool bed. The East
Branch is a losing river only in the southern part of the
Premier Sub-basin. Leakage from the South Branch andthe East Branch into the Collie Basin aquifers depends
on the river stage, the hydraulic conductance of the river
bed material, and the watertable elevation near the river.Little information is available about the river stage
heights along the river, and hydraulic conductance of
the riverbed material. It is thus difficult to calculatethe leakage from the river. Groundwater modeling,
however, shows that for river stages varying from 0 to
1 m and conductance per unit area varying from 0.01to 1.0 m2/day/m2, leakage from the river to the Collie
Basin aquifers is about 1 106 m3/year.
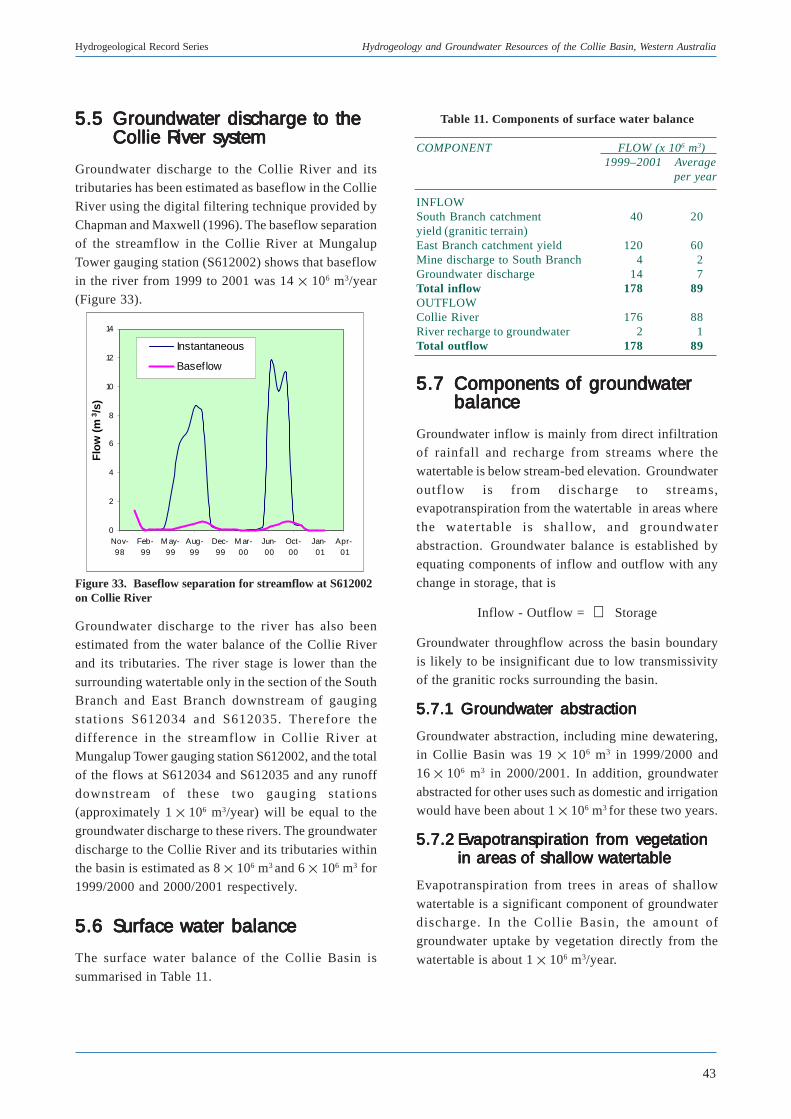
43
Hydrogeological Record Series Hydrogeology and Groundwater Resources of the Collie Basin, Western Australia
5.55.55.55.55.5 Groundwater discharge to theGroundwater discharge to theGroundwater discharge to theGroundwater discharge to theGroundwater discharge to theCollie River systemCollie River systemCollie River systemCollie River systemCollie River system
Groundwater discharge to the Collie River and itstributaries has been estimated as baseflow in the Collie
River using the digital filtering technique provided by
Chapman and Maxwell (1996). The baseflow separationof the streamflow in the Collie River at Mungalup
Tower gauging station (S612002) shows that baseflow
in the river from 1999 to 2001 was 14 106 m3/year(Figure 33).
Figure 33. Baseflow separation for streamflow at S612002on Collie River
Groundwater discharge to the river has also beenestimated from the water balance of the Collie River
and its tributaries. The river stage is lower than the
surrounding watertable only in the section of the SouthBranch and East Branch downstream of gauging
stations S612034 and S612035. Therefore the
difference in the streamflow in Collie River atMungalup Tower gauging station S612002, and the total
of the flows at S612034 and S612035 and any runoff
downstream of these two gauging stations(approximately 1 106 m3/year) will be equal to the
groundwater discharge to these rivers. The groundwater
discharge to the Collie River and its tributaries withinthe basin is estimated as 8 106 m3 and 6 106 m3 for
1999/2000 and 2000/2001 respectively.
5.65.65.65.65.6 Surface water balanceSurface water balanceSurface water balanceSurface water balanceSurface water balance
The surface water balance of the Collie Basin is
summarised in Table 11.
Table 11. Components of surface water balance
COMPONENT FLOW (x 106 m3)1999–2001 Average
per year
INFLOWSouth Branch catchment 40 20yield (granitic terrain) East Branch catchment yield 120 60Mine discharge to South Branch 4 2Groundwater discharge 14 7Total inflow 178 89OUTFLOWCollie River 176 88River recharge to groundwater 2 1Total outflow 178 89
5.75.75.75.75.7 Components of groundwaterComponents of groundwaterComponents of groundwaterComponents of groundwaterComponents of groundwaterbalancebalancebalancebalancebalance
Groundwater inflow is mainly from direct infiltrationof rainfall and recharge from streams where the
watertable is below stream-bed elevation. Groundwater
outflow is from discharge to streams,evapotranspiration from the watertable in areas where
the watertable is shallow, and groundwater
abstraction. Groundwater balance is established byequating components of inflow and outflow with any
change in storage, that is
Inflow - Outflow = Storage
Groundwater throughflow across the basin boundary
is likely to be insignificant due to low transmissivityof the granitic rocks surrounding the basin.
5.7.1 Groundwater abstraction5.7.1 Groundwater abstraction5.7.1 Groundwater abstraction5.7.1 Groundwater abstraction5.7.1 Groundwater abstraction
Groundwater abstraction, including mine dewatering,in Collie Basin was 19 106 m3 in 1999/2000 and
16 106 m3 in 2000/2001. In addition, groundwater
abstracted for other uses such as domestic and irrigationwould have been about 1 106 m3 for these two years.
5.7.25.7.25.7.25.7.25.7.2 Evapotranspiration from vegetationEvapotranspiration from vegetationEvapotranspiration from vegetationEvapotranspiration from vegetationEvapotranspiration from vegetationin areas of shallow watertablein areas of shallow watertablein areas of shallow watertablein areas of shallow watertablein areas of shallow watertable
Evapotranspiration from trees in areas of shallow
watertable is a significant component of groundwaterdischarge. In the Collie Basin, the amount of
groundwater uptake by vegetation directly from the
watertable is about 1 106 m3/year.
0
2
4
6
8
10
12
14
Nov-98
Feb-99
M ay-99
Aug-99
Dec-99
M ar-00
Jun-00
Oct-00
Jan-01
Apr-01
Flo
w (
m3 /
s)
Instantaneous
Baseflow
∇
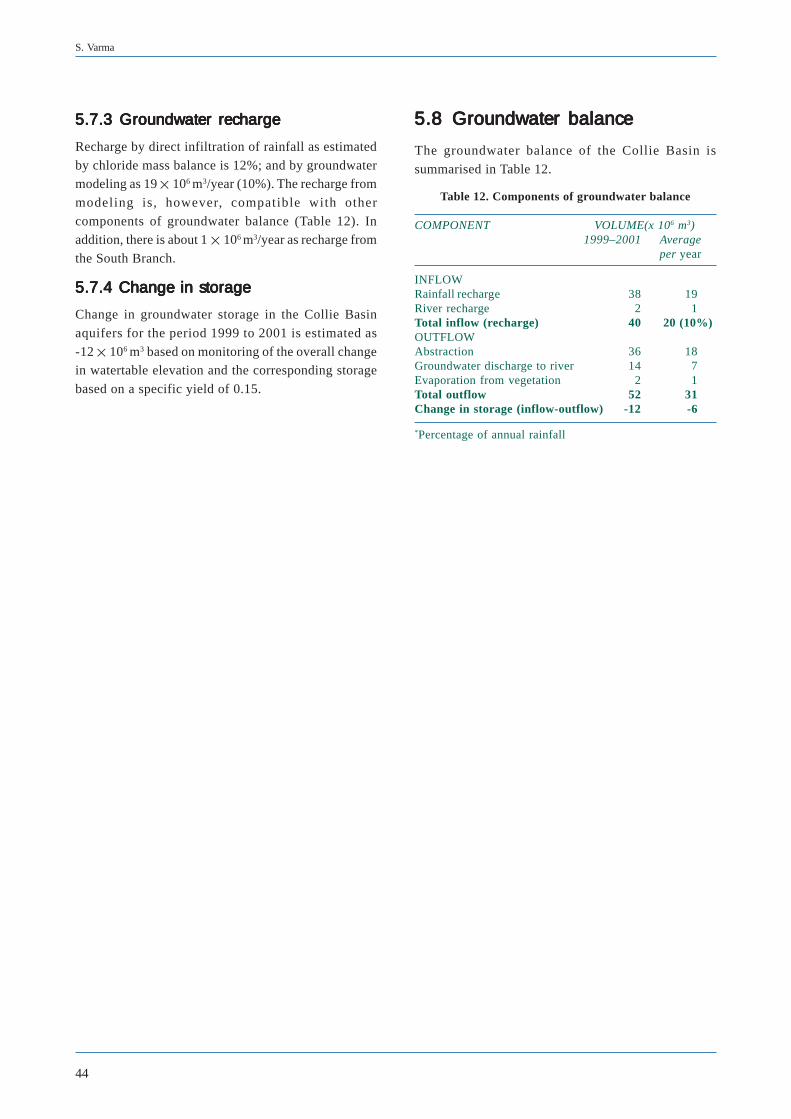
44
S. Varma
5.7.3 Groundwater recharge5.7.3 Groundwater recharge5.7.3 Groundwater recharge5.7.3 Groundwater recharge5.7.3 Groundwater recharge
Recharge by direct infiltration of rainfall as estimated
by chloride mass balance is 12%; and by groundwatermodeling as 19 106 m3/year (10%). The recharge from
modeling is, however, compatible with other
components of groundwater balance (Table 12). Inaddition, there is about 1 106 m3/year as recharge from
the South Branch.
55555.7.4 Change in storage.7.4 Change in storage.7.4 Change in storage.7.4 Change in storage.7.4 Change in storage
Change in groundwater storage in the Collie Basin
aquifers for the period 1999 to 2001 is estimated as
-12 106 m3 based on monitoring of the overall changein watertable elevation and the corresponding storage
based on a specific yield of 0.15.
5.85.85.85.85.8 Groundwater balanceGroundwater balanceGroundwater balanceGroundwater balanceGroundwater balance
The groundwater balance of the Collie Basin is
summarised in Table 12.
Table 12. Components of groundwater balance
COMPONENT VOLUME(x 106 m3)1999–2001 Average
per year
INFLOWRainfall recharge 38 19River recharge 2 1Total inflow (recharge) 40 20 (10%)OUTFLOWAbstraction 36 18Groundwater discharge to river 14 7Evaporation from vegetation 2 1Total outflow 52 31Change in storage (inflow-outflow) -12 -6
*Percentage of annual rainfall
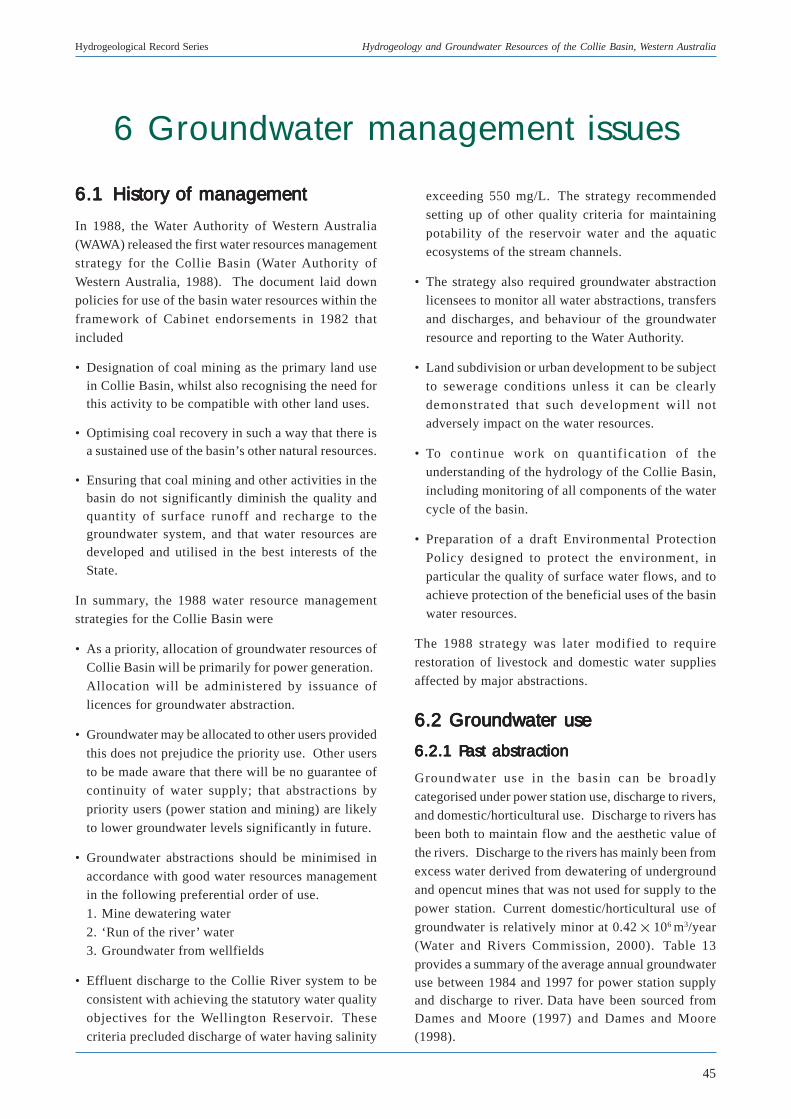
45
Hydrogeological Record Series Hydrogeology and Groundwater Resources of the Collie Basin, Western Australia
6.16.16.16.16.1 History of managementHistory of managementHistory of managementHistory of managementHistory of management
In 1988, the Water Authority of Western Australia(WAWA) released the first water resources management
strategy for the Collie Basin (Water Authority of
Western Australia, 1988). The document laid downpolicies for use of the basin water resources within the
framework of Cabinet endorsements in 1982 that
included
• Designation of coal mining as the primary land usein Collie Basin, whilst also recognising the need forthis activity to be compatible with other land uses.
• Optimising coal recovery in such a way that there isa sustained use of the basin’s other natural resources.
• Ensuring that coal mining and other activities in thebasin do not significantly diminish the quality andquantity of surface runoff and recharge to thegroundwater system, and that water resources aredeveloped and utilised in the best interests of theState.
In summary, the 1988 water resource managementstrategies for the Collie Basin were
• As a priority, allocation of groundwater resources ofCollie Basin will be primarily for power generation.
Allocation will be administered by issuance of
licences for groundwater abstraction.
• Groundwater may be allocated to other users provided
this does not prejudice the priority use. Other users
to be made aware that there will be no guarantee ofcontinuity of water supply; that abstractions by
priority users (power station and mining) are likely
to lower groundwater levels significantly in future.
• Groundwater abstractions should be minimised in
accordance with good water resources managementin the following preferential order of use.
1. Mine dewatering water
2. ‘Run of the river’ water3. Groundwater from wellfields
• Effluent discharge to the Collie River system to be
consistent with achieving the statutory water qualityobjectives for the Wellington Reservoir. These
criteria precluded discharge of water having salinity
6 Groundwater management issues
exceeding 550 mg/L. The strategy recommended
setting up of other quality criteria for maintaining
potability of the reservoir water and the aquaticecosystems of the stream channels.
• The strategy also required groundwater abstractionlicensees to monitor all water abstractions, transfers
and discharges, and behaviour of the groundwater
resource and reporting to the Water Authority.
• Land subdivision or urban development to be subject
to sewerage conditions unless it can be clearly
demonstrated that such development will notadversely impact on the water resources.
• To continue work on quantification of theunderstanding of the hydrology of the Collie Basin,
including monitoring of all components of the water
cycle of the basin.
• Preparation of a draft Environmental Protection
Policy designed to protect the environment, in
particular the quality of surface water flows, and toachieve protection of the beneficial uses of the basin
water resources.
The 1988 strategy was later modified to require
restoration of livestock and domestic water supplies
affected by major abstractions.
6.2 Groundwater use6.2 Groundwater use6.2 Groundwater use6.2 Groundwater use6.2 Groundwater use
6.2.1 P6.2.1 P6.2.1 P6.2.1 P6.2.1 Past abstractionast abstractionast abstractionast abstractionast abstraction
Groundwater use in the basin can be broadly
categorised under power station use, discharge to rivers,
and domestic/horticultural use. Discharge to rivers hasbeen both to maintain flow and the aesthetic value of
the rivers. Discharge to the rivers has mainly been from
excess water derived from dewatering of undergroundand opencut mines that was not used for supply to the
power station. Current domestic/horticultural use of
groundwater is relatively minor at 0.42 106 m3/year(Water and Rivers Commission, 2000). Table 13
provides a summary of the average annual groundwateruse between 1984 and 1997 for power station supplyand discharge to river. Data have been sourced fromDames and Moore (1997) and Dames and Moore(1998).
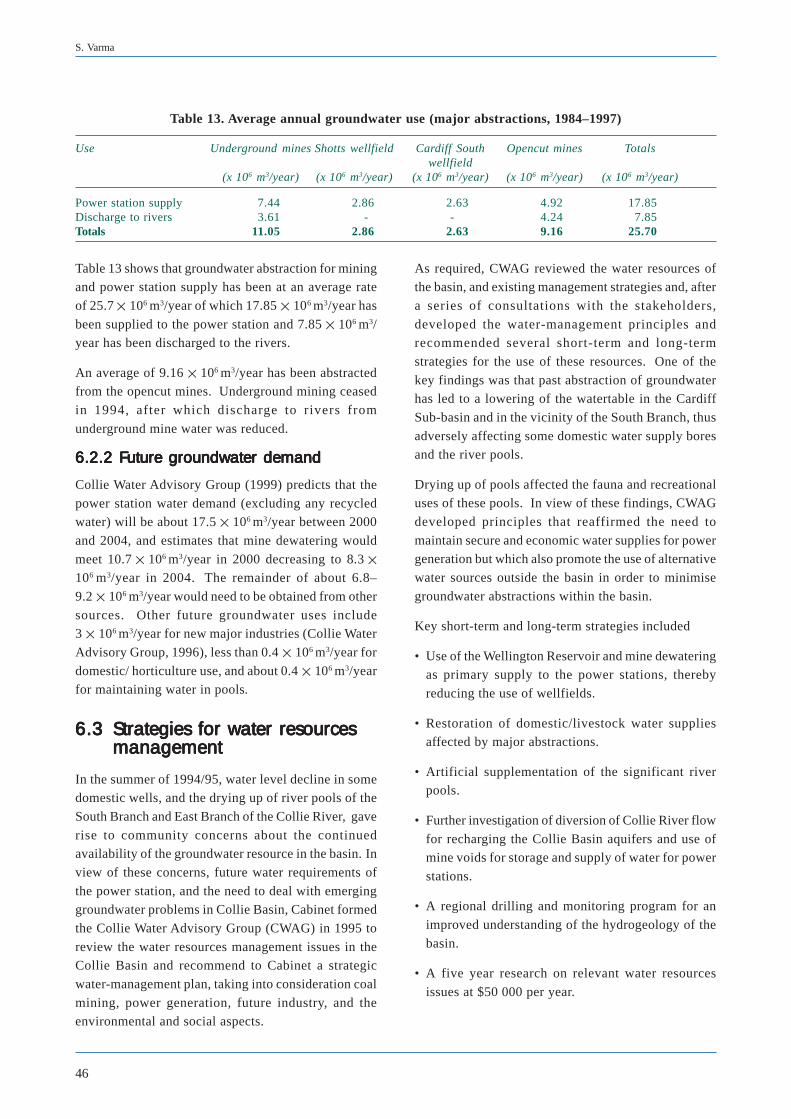
46
S. Varma
Table 13 shows that groundwater abstraction for miningand power station supply has been at an average rate
of 25.7 106 m3/year of which 17.85 106 m3/year has
been supplied to the power station and 7.85 106 m3/year has been discharged to the rivers.
An average of 9.16 106 m3/year has been abstractedfrom the opencut mines. Underground mining ceased
in 1994, after which discharge to rivers from
underground mine water was reduced.
6.2.2 F6.2.2 F6.2.2 F6.2.2 F6.2.2 Future groundwater demanduture groundwater demanduture groundwater demanduture groundwater demanduture groundwater demand
Collie Water Advisory Group (1999) predicts that the
power station water demand (excluding any recycledwater) will be about 17.5 106 m3/year between 2000
and 2004, and estimates that mine dewatering would
meet 10.7 106 m3/year in 2000 decreasing to 8.3 106 m3/year in 2004. The remainder of about 6.8–
9.2 106 m3/year would need to be obtained from other
sources. Other future groundwater uses include3 106 m3/year for new major industries (Collie Water
Advisory Group, 1996), less than 0.4 106 m3/year for
domestic/ horticulture use, and about 0.4 106 m3/yearfor maintaining water in pools.
6.36.36.36.36.3 Strategies for water resourcesStrategies for water resourcesStrategies for water resourcesStrategies for water resourcesStrategies for water resourcesmanagementmanagementmanagementmanagementmanagement
In the summer of 1994/95, water level decline in somedomestic wells, and the drying up of river pools of the
South Branch and East Branch of the Collie River, gave
rise to community concerns about the continuedavailability of the groundwater resource in the basin. In
view of these concerns, future water requirements of
the power station, and the need to deal with emerginggroundwater problems in Collie Basin, Cabinet formed
the Collie Water Advisory Group (CWAG) in 1995 to
review the water resources management issues in theCollie Basin and recommend to Cabinet a strategic
water-management plan, taking into consideration coal
mining, power generation, future industry, and theenvironmental and social aspects.
As required, CWAG reviewed the water resources ofthe basin, and existing management strategies and, after
a series of consultations with the stakeholders,
developed the water-management principles andrecommended several short-term and long-term
strategies for the use of these resources. One of the
key findings was that past abstraction of groundwaterhas led to a lowering of the watertable in the Cardiff
Sub-basin and in the vicinity of the South Branch, thus
adversely affecting some domestic water supply boresand the river pools.
Drying up of pools affected the fauna and recreationaluses of these pools. In view of these findings, CWAG
developed principles that reaffirmed the need to
maintain secure and economic water supplies for powergeneration but which also promote the use of alternative
water sources outside the basin in order to minimise
groundwater abstractions within the basin.
Key short-term and long-term strategies included
• Use of the Wellington Reservoir and mine dewateringas primary supply to the power stations, thereby
reducing the use of wellfields.
• Restoration of domestic/livestock water suppliesaffected by major abstractions.
• Artificial supplementation of the significant riverpools.
• Further investigation of diversion of Collie River flow
for recharging the Collie Basin aquifers and use ofmine voids for storage and supply of water for power
stations.
• A regional drilling and monitoring program for an
improved understanding of the hydrogeology of the
basin.
• A five year research on relevant water resources
issues at $50 000 per year.
Table 13. Average annual groundwater use (major abstractions, 1984–1997)
Use Underground mines Shotts wellfield Cardiff South Opencut mines Totalswellfield
(x 106 m3/year) (x 106 m3/year) (x 106 m3/year) (x 106 m3/year) (x 106 m3/year)
Power station supply 7.44 2.86 2.63 4.92 17.85Discharge to rivers 3.61 - - 4.24 7.85Totals 11.05 2.86 2.63 9.16 25.70
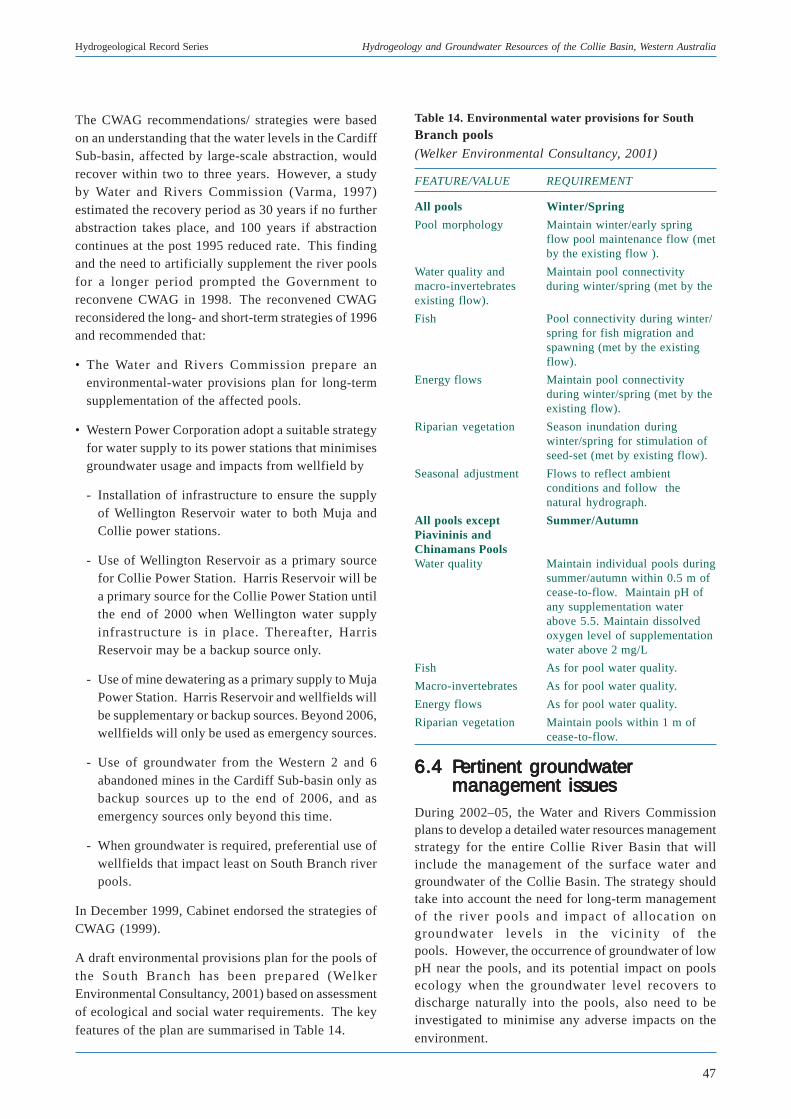
47
Hydrogeological Record Series Hydrogeology and Groundwater Resources of the Collie Basin, Western Australia
The CWAG recommendations/ strategies were basedon an understanding that the water levels in the CardiffSub-basin, affected by large-scale abstraction, wouldrecover within two to three years. However, a studyby Water and Rivers Commission (Varma, 1997)estimated the recovery period as 30 years if no furtherabstraction takes place, and 100 years if abstractioncontinues at the post 1995 reduced rate. This findingand the need to artificially supplement the river poolsfor a longer period prompted the Government toreconvene CWAG in 1998. The reconvened CWAGreconsidered the long- and short-term strategies of 1996and recommended that:
• The Water and Rivers Commission prepare anenvironmental-water provisions plan for long-termsupplementation of the affected pools.
• Western Power Corporation adopt a suitable strategyfor water supply to its power stations that minimisesgroundwater usage and impacts from wellfield by
- Installation of infrastructure to ensure the supplyof Wellington Reservoir water to both Muja andCollie power stations.
- Use of Wellington Reservoir as a primary sourcefor Collie Power Station. Harris Reservoir will bea primary source for the Collie Power Station untilthe end of 2000 when Wellington water supplyinfrastructure is in place. Thereafter, HarrisReservoir may be a backup source only.
- Use of mine dewatering as a primary supply to MujaPower Station. Harris Reservoir and wellfields willbe supplementary or backup sources. Beyond 2006,wellfields will only be used as emergency sources.
- Use of groundwater from the Western 2 and 6abandoned mines in the Cardiff Sub-basin only asbackup sources up to the end of 2006, and asemergency sources only beyond this time.
- When groundwater is required, preferential use ofwellfields that impact least on South Branch riverpools.
In December 1999, Cabinet endorsed the strategies ofCWAG (1999).
A draft environmental provisions plan for the pools ofthe South Branch has been prepared (WelkerEnvironmental Consultancy, 2001) based on assessmentof ecological and social water requirements. The keyfeatures of the plan are summarised in Table 14.
Table 14. Environmental water provisions for SouthBranch pools(Welker Environmental Consultancy, 2001)
FEATURE/VALUE REQUIREMENT
All pools Winter/Spring
Pool morphology Maintain winter/early springflow pool maintenance flow (metby the existing flow ).
Water quality and Maintain pool connectivitymacro-invertebrates during winter/spring (met by theexisting flow).
Fish Pool connectivity during winter/spring for fish migration andspawning (met by the existingflow).
Energy flows Maintain pool connectivityduring winter/spring (met by theexisting flow).
Riparian vegetation Season inundation duringwinter/spring for stimulation ofseed-set (met by existing flow).
Seasonal adjustment Flows to reflect ambientconditions and follow thenatural hydrograph.
All pools except Summer/AutumnPiavininis andChinamans PoolsWater quality Maintain individual pools during
summer/autumn within 0.5 m ofcease-to-flow. Maintain pH ofany supplementation waterabove 5.5. Maintain dissolvedoxygen level of supplementationwater above 2 mg/L
Fish As for pool water quality.
Macro-invertebrates As for pool water quality.
Energy flows As for pool water quality.
Riparian vegetation Maintain pools within 1 m ofcease-to-flow.
6.46.46.46.46.4 PPPPPertinent groundwaterertinent groundwaterertinent groundwaterertinent groundwaterertinent groundwatermanagement issuesmanagement issuesmanagement issuesmanagement issuesmanagement issues
During 2002–05, the Water and Rivers Commissionplans to develop a detailed water resources managementstrategy for the entire Collie River Basin that willinclude the management of the surface water andgroundwater of the Collie Basin. The strategy shouldtake into account the need for long-term managementof the river pools and impact of allocation ongroundwater levels in the vicinity of thepools. However, the occurrence of groundwater of lowpH near the pools, and its potential impact on poolsecology when the groundwater level recovers todischarge naturally into the pools, also need to beinvestigated to minimise any adverse impacts on theenvironment.
48
S. Varma
Management of abandoned mine voids and long-termimpact on the groundwater resources should beconsidered, particularly in view of the potential of theoverflow of poor-quality water into the SouthBranch. Outcomes of the ACARP projects regardingamelioration of acid in opencut mine voids will assist
in management of the voids.
6.4.1 Artificial supplementation of6.4.1 Artificial supplementation of6.4.1 Artificial supplementation of6.4.1 Artificial supplementation of6.4.1 Artificial supplementation ofriver poolsriver poolsriver poolsriver poolsriver pools
As it will take several years for the watertable to recoverin the Cardiff Sub-basin, the Collie Water AdvisoryGroup has recommended consideration of long-termstrategies for artificial supplementation of pools. Sixof seven environmentally and socially significant poolsof the South Branch and one pool of the East Branchwill need to be supplemented artificially during cease-to-flow periods in the river. At Chinamans Poolgroundwater level is sufficiently high to maintain thedesired pool level, even in summer. Long Pool,Walkers Pool and Buckingham Mills Pool aremaintained by groundwater discharge in summer, butthe pool levels if not supplemented, decline below thecease-to-flow level.
The volume of water required to maintain the pools ata particular level is equivalent to change in storage ofthe pools at that level. The change in storage is duemainly to evaporation and leakage from the pools. Thedaily water requirement for maintaining the pools at awater stage height of ‘h’ is given as
Vm = A (h -h') c + A e (1)
Vm is the volume of water required (m3/day)
A is the area of water surface (m2),h is the depth of water(m),c is the conductance of the pool sediments per unitarea (m2/day/m2),e is the rate of evaporation (m/day), andh' is the difference between the adjacent watertableelevation and pool bed. For all pools except Long,Walkers and Buckingham pools h' = 0 .
The conductance has been calculated from the leakagecomponent of the pool water balance. This has beenachieved by monitoring of pool water levels duringsummer to avoid any complexities in water balance dueto the uncertainty in components of run-off, and surfacewater inflow and outflow at the upstream anddownstream parts of the pools. The water balancecomponents of the pools during the summer monthsare essentially the leakage from pools (L), evaporationfrom the water surface (E) and change in storage
( s), and is written as
s = L + E (2)
For pools that intersect the watertable, such as the LongPool and Walkers Pool, leakage from the pool will occuronly when the pool water level is higher than theadjacent watertable, and during this time there will notbe any groundwater inflow to the pool. The leakagefrom the pool is dependent on the depth of water in thepool (h), area of the water surface (A) and theconductance of the pool-bed sediments (c).
L = A (h -h') c (3)
For the pools that intersect the watertable, the leakagewill vary seasonally depending on the adjacentwatertable elevation. Leakage will be maximum whenthe watertable is deepest as in April/May. Equation (3)is a variation of the relationship used by McDonaldand Harbaugh (1988) in determination of interflowbetween river and aquifer. The evaporation from thepool will depend on the area of the water surface andrate of evaporation (e).
E = A e (4)
As the pools of the South Branch are generally semi-ellipsoidal in shape, the surface area of water will bedirectly proportional to the depth of water in thepool. Therefore, both leakage and evaporation wouldbe directly proportional to the depth of water. Aschange in pool storage and evaporation can be directlyestimated from the change in water levels, andevaporation can be estimated from meteorological data,the component of leakage can therefore be calculated.The conductance per unit area (c) can be calculatedfrom leakage using equation (3) for each monitoringinterval.
Table 15 provides the components of the losses due toleakage at the average of the initial and final waterlevels of the monitoring interval for each pool. Thecalculated values of streambed conductance per unitarea are generally consistent for different areas of thepool beds (as a function of the water depth), but showa significant variation from one pool to another withconductance per unit area ranging from 0.006 to0.07 m2/day/m2. The conductance of the pools appearsto vary inversely with its size (product of length anddepth) possibly because of deposition of a thicker layerof the streambed material in larger pools (Fig. 34). Theaverage streambed conductance values are given inTable 16 along with the other physical data of the pools.
∂
∂
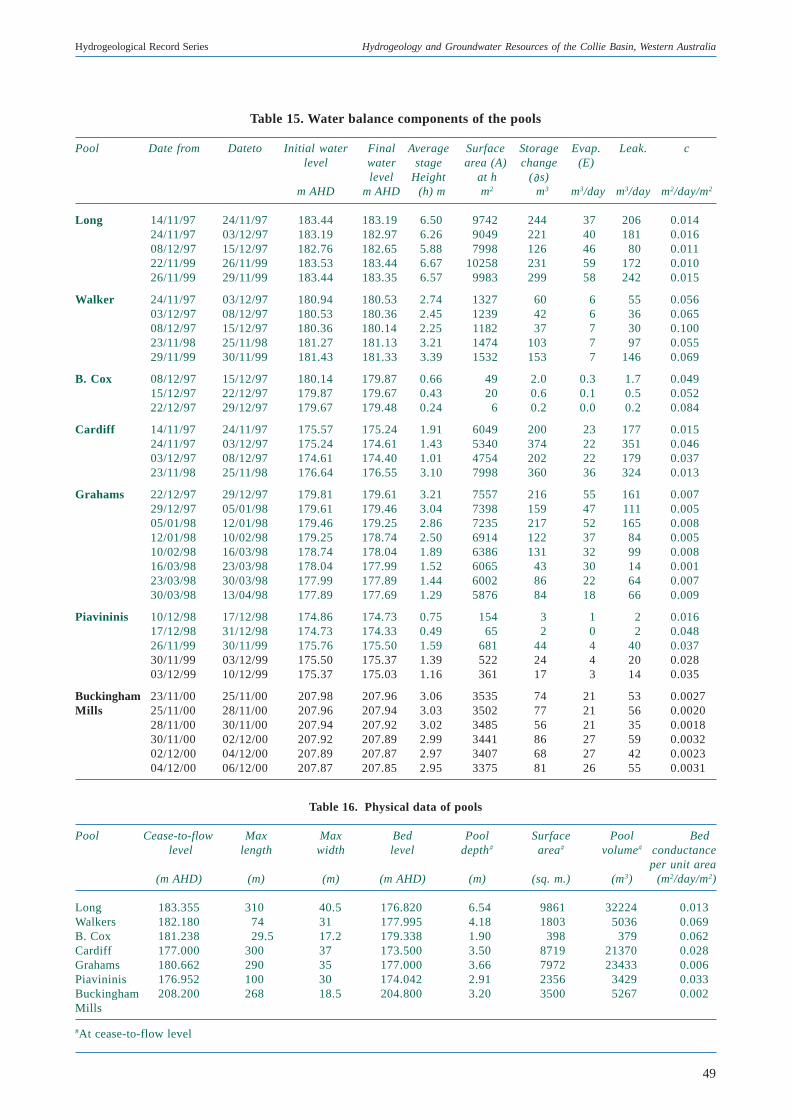
49
Hydrogeological Record Series Hydrogeology and Groundwater Resources of the Collie Basin, Western Australia
Table 15. Water balance components of the pools
Pool Date from Dateto Initial water Final Average Surface Storage Evap. Leak. clevel water stage area (A) change (E)
level Height at h ( s)m AHD m AHD (h) m m2 m3 m3/day m3/day m2/day/m2
Long 14/11/97 24/11/97 183.44 183.19 6.50 9742 244 37 206 0.01424/11/97 03/12/97 183.19 182.97 6.26 9049 221 40 181 0.01608/12/97 15/12/97 182.76 182.65 5.88 7998 126 46 80 0.01122/11/99 26/11/99 183.53 183.44 6.67 10258 231 59 172 0.01026/11/99 29/11/99 183.44 183.35 6.57 9983 299 58 242 0.015
Walker 24/11/97 03/12/97 180.94 180.53 2.74 1327 60 6 55 0.05603/12/97 08/12/97 180.53 180.36 2.45 1239 42 6 36 0.06508/12/97 15/12/97 180.36 180.14 2.25 1182 37 7 30 0.10023/11/98 25/11/98 181.27 181.13 3.21 1474 103 7 97 0.05529/11/99 30/11/99 181.43 181.33 3.39 1532 153 7 146 0.069
B. Cox 08/12/97 15/12/97 180.14 179.87 0.66 49 2.0 0.3 1.7 0.04915/12/97 22/12/97 179.87 179.67 0.43 20 0.6 0.1 0.5 0.05222/12/97 29/12/97 179.67 179.48 0.24 6 0.2 0.0 0.2 0.084
Cardiff 14/11/97 24/11/97 175.57 175.24 1.91 6049 200 23 177 0.01524/11/97 03/12/97 175.24 174.61 1.43 5340 374 22 351 0.04603/12/97 08/12/97 174.61 174.40 1.01 4754 202 22 179 0.03723/11/98 25/11/98 176.64 176.55 3.10 7998 360 36 324 0.013
Grahams 22/12/97 29/12/97 179.81 179.61 3.21 7557 216 55 161 0.00729/12/97 05/01/98 179.61 179.46 3.04 7398 159 47 111 0.00505/01/98 12/01/98 179.46 179.25 2.86 7235 217 52 165 0.00812/01/98 10/02/98 179.25 178.74 2.50 6914 122 37 84 0.00510/02/98 16/03/98 178.74 178.04 1.89 6386 131 32 99 0.00816/03/98 23/03/98 178.04 177.99 1.52 6065 43 30 14 0.00123/03/98 30/03/98 177.99 177.89 1.44 6002 86 22 64 0.00730/03/98 13/04/98 177.89 177.69 1.29 5876 84 18 66 0.009
Piavininis 10/12/98 17/12/98 174.86 174.73 0.75 154 3 1 2 0.01617/12/98 31/12/98 174.73 174.33 0.49 65 2 0 2 0.04826/11/99 30/11/99 175.76 175.50 1.59 681 44 4 40 0.03730/11/99 03/12/99 175.50 175.37 1.39 522 24 4 20 0.02803/12/99 10/12/99 175.37 175.03 1.16 361 17 3 14 0.035
Buckingham 23/11/00 25/11/00 207.98 207.96 3.06 3535 74 21 53 0.0027Mills 25/11/00 28/11/00 207.96 207.94 3.03 3502 77 21 56 0.0020
28/11/00 30/11/00 207.94 207.92 3.02 3485 56 21 35 0.001830/11/00 02/12/00 207.92 207.89 2.99 3441 86 27 59 0.003202/12/00 04/12/00 207.89 207.87 2.97 3407 68 27 42 0.002304/12/00 06/12/00 207.87 207.85 2.95 3375 81 26 55 0.0031
Table 16. Physical data of pools
Pool Cease-to-flow Max Max Bed Pool Surface Pool Bed level length width level depth# area# volume# conductance
per unit area(m AHD) (m) (m) (m AHD) (m) (sq. m.) (m3) (m2/day/m2)
Long 183.355 310 40.5 176.820 6.54 9861 32224 0.013Walkers 182.180 74 31 177.995 4.18 1803 5036 0.069B. Cox 181.238 29.5 17.2 179.338 1.90 398 379 0.062Cardiff 177.000 300 37 173.500 3.50 8719 21370 0.028Grahams 180.662 290 35 177.000 3.66 7972 23433 0.006Piavininis 176.952 100 30 174.042 2.91 2356 3429 0.033Buckingham 208.200 268 18.5 204.800 3.20 3500 5267 0.002Mills
#At cease-to-flow level
∂
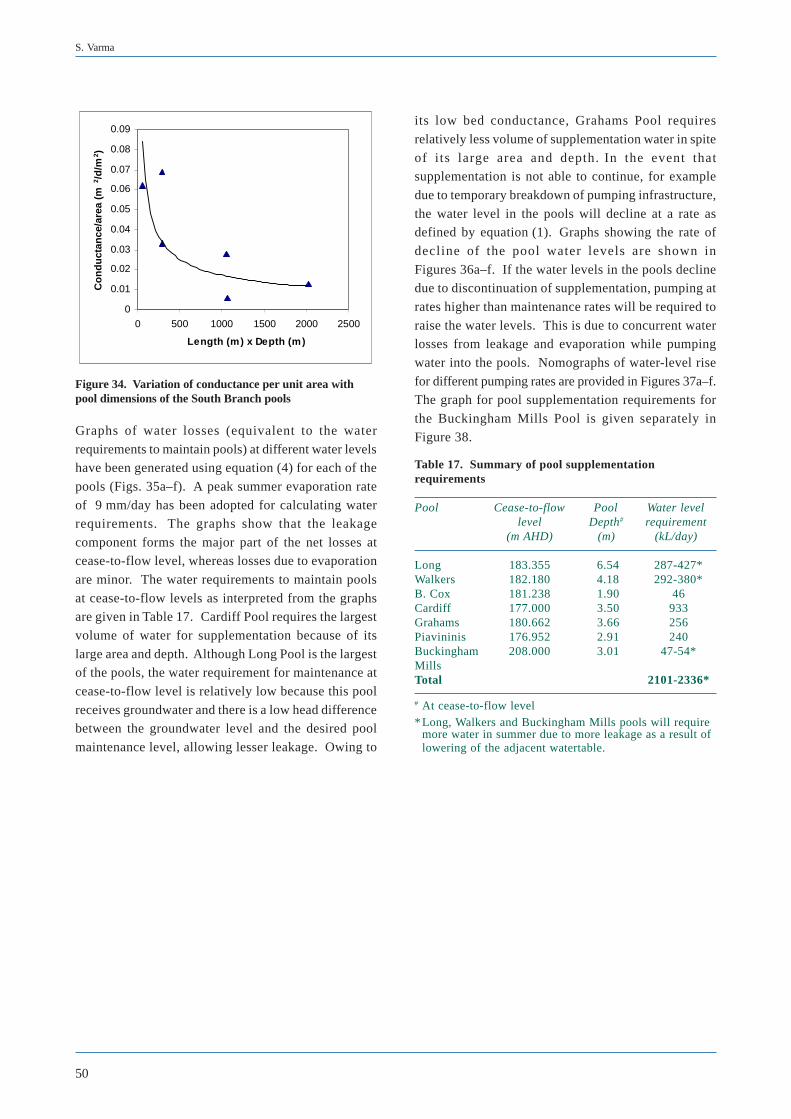
50
S. Varma
Graphs of water losses (equivalent to the water
requirements to maintain pools) at different water levelshave been generated using equation (4) for each of the
pools (Figs. 35a–f). A peak summer evaporation rate
of 9 mm/day has been adopted for calculating waterrequirements. The graphs show that the leakage
component forms the major part of the net losses atcease-to-flow level, whereas losses due to evaporation
are minor. The water requirements to maintain pools
at cease-to-flow levels as interpreted from the graphsare given in Table 17. Cardiff Pool requires the largest
volume of water for supplementation because of its
large area and depth. Although Long Pool is the largestof the pools, the water requirement for maintenance at
cease-to-flow level is relatively low because this pool
receives groundwater and there is a low head differencebetween the groundwater level and the desired pool
maintenance level, allowing lesser leakage. Owing to
its low bed conductance, Grahams Pool requires
relatively less volume of supplementation water in spite
of its large area and depth. In the event thatsupplementation is not able to continue, for example
due to temporary breakdown of pumping infrastructure,
the water level in the pools will decline at a rate asdefined by equation (1). Graphs showing the rate of
decline of the pool water levels are shown in
Figures 36a–f. If the water levels in the pools declinedue to discontinuation of supplementation, pumping at
rates higher than maintenance rates will be required to
raise the water levels. This is due to concurrent waterlosses from leakage and evaporation while pumping
water into the pools. Nomographs of water-level rise
for different pumping rates are provided in Figures 37a–f.The graph for pool supplementation requirements for
the Buckingham Mills Pool is given separately in
Figure 38.
Table 17. Summary of pool supplementationrequirements
Pool Cease-to-flow Pool Water levellevel Depth# requirement
(m AHD) (m) (kL/day)
Long 183.355 6.54 287-427*Walkers 182.180 4.18 292-380*B. Cox 181.238 1.90 46Cardiff 177.000 3.50 933Grahams 180.662 3.66 256Piavininis 176.952 2.91 240Buckingham 208.000 3.01 47-54*MillsTotal 2101-2336*
# At cease-to-flow level* Long, Walkers and Buckingham Mills pools will require
more water in summer due to more leakage as a result oflowering of the adjacent watertable.
Figure 34. Variation of conductance per unit area withpool dimensions of the South Branch pools
0
0.01
0.02
0.03
0.04
0.05
0.06
0.07
0.08
0.09
0 500 1000 1500 2000 2500
Length (m) x Depth (m)
Co
nd
uct
ance
/are
a (m
2 /d
/m2 )
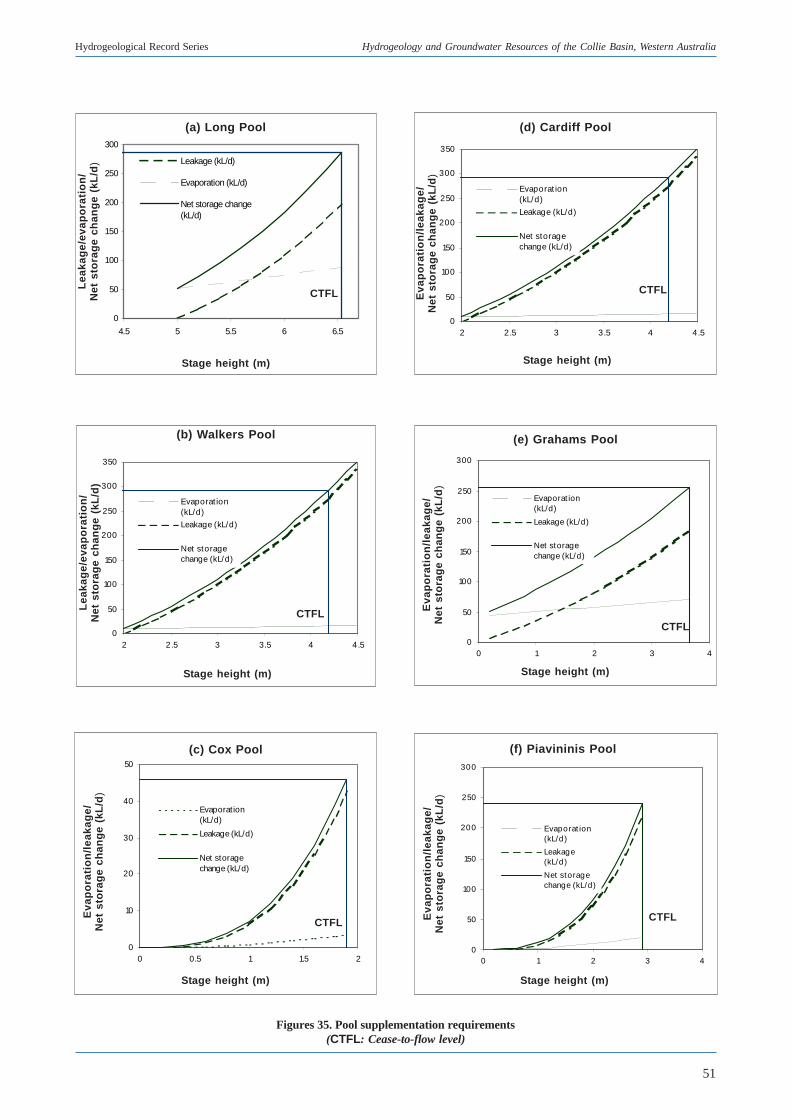
51
Hydrogeological Record Series Hydrogeology and Groundwater Resources of the Collie Basin, Western Australia
0
10
20
30
40
50
0 0.5 1 1.5 2
Evaporation(kL/d)
Leakage (kL/d)
Net storagechange (kL/d)
0
50
100
150
200
250
300
0 1 2 3 4
Evaporat ion(kL/d)
Leakage (kL/d)
Net storagechange (kL/d)
0
50
100
150
200
250
300
350
2 2.5 3 3.5 4 4.5
Evaporat ion(kL/d)
Leakage (kL/d)
Net storagechange (kL/d)
0
50
100
150
200
250
300
350
2 2.5 3 3.5 4 4.5
Evaporat ion(kL/d)
Leakage (kL/d)
Net storagechange (kL/d)
0
50
100
150
200
250
300
0 1 2 3 4
Evaporat ion(kL/d)
Leakage(kL/d)
Net storagechange (kL/d)
0
50
100
150
200
250
300
4.5 5 5.5 6 6.5
Leakage (kL/d)
Evaporation (kL/d)
Net storage change(kL/d)
Figures 35. Pool supplementation requirements(CTFL: Cease-to-flow level)
Stage height (m)
Stage height (m)
Stage height (m)
CTFLCTFL
CTFLEva
po
rati
on
/lea
kag
e/N
et s
tora
ge
chan
ge
(kL
/d)
Eva
po
rati
on
/lea
kag
e/N
et s
tora
ge
chan
ge
(kL
/d)
Eva
po
rati
on
/lea
kag
e/N
et s
tora
ge
chan
ge
(kL
/d)
CTFL
Stage height (m)
CTFL
(a) Long Pool
(e) Grahams Pool(b) Walkers Pool
(f) Piavininis Pool(c) Cox Pool
Lea
kag
e/ev
apo
rati
on
/N
et s
tora
ge
chan
ge
(kL
/d)
Stage height (m)
Stage height (m)
Eva
po
rati
on
/lea
kag
e/N
et s
tora
ge
chan
ge
(kL
/d)
(d) Cardiff Pool
CTFLLea
kag
e/ev
apo
rati
on
/N
et s
tora
ge
chan
ge
(kL
/d)
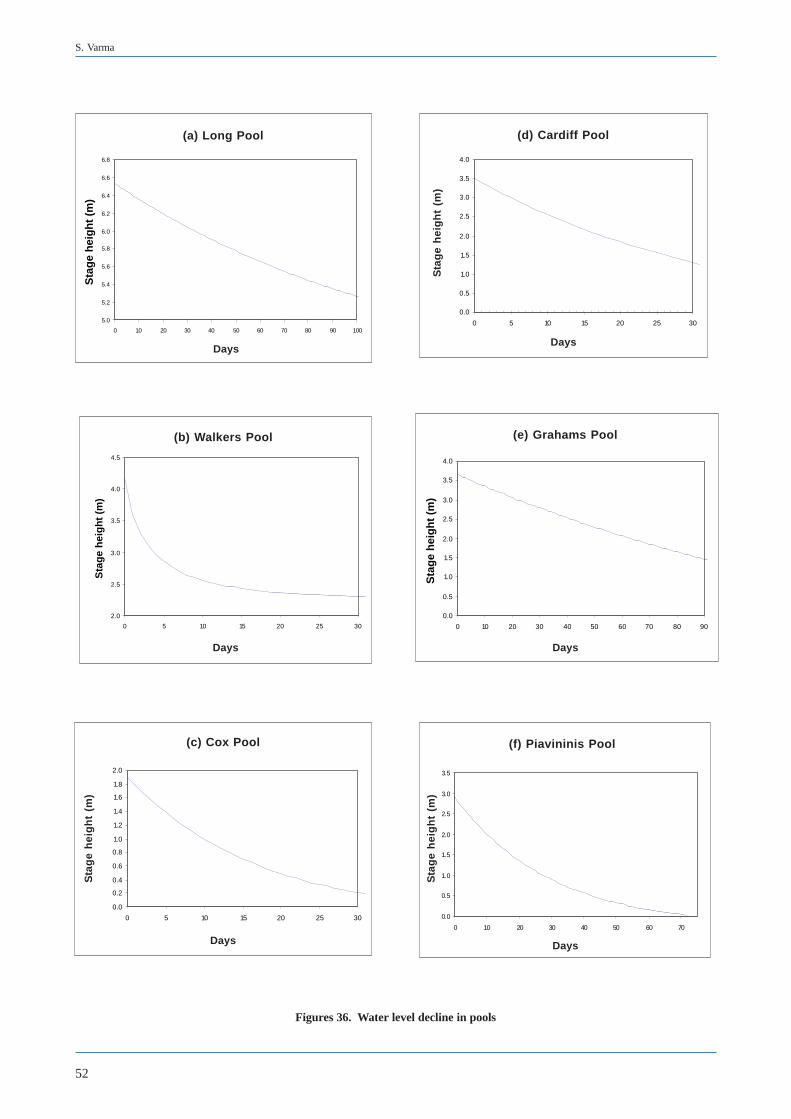
52
S. Varma
(a) Long Pool
5.0
5.2
5.4
5.6
5.8
6.0
6.2
6.4
6.6
6.8
0 10 20 30 40 50 60 70 80 90 100
Days
Sta
ge
hei
gh
t (m
)
(d) Cardiff Pool
0.0
0.5
1.0
1.5
2.0
2.5
3.0
3.5
4.0
0 5 10 15 20 25 30
Da y s
(b) Walkers P ool
2.0
2.5
3.0
3.5
4.0
4.5
0 5 10 15 20 25 30
Days
Sta
ge
hei
gh
t (m
)
(e) Grahams Pool
0.0
0.5
1.0
1.5
2.0
2.5
3.0
3.5
4.0
0 10 20 30 40 50 60 70 80 90
Days
Sta
ge
hei
gh
t (m
)
(c)Cox Pool
0.0
0.2
0.4
0.6
0.8
1.0
1.2
1.4
1.6
1.8
2.0
0 5 10 15 20 25 30
Days
(f) Piavininis Pool
0.0
0.5
1.0
1.5
2.0
2.5
3.0
3.5
0 10 20 30 40 50 60 70
Days
Figures 36. Water level decline in pools
(a) Long Pool
(b) Walkers Pool
(c) Cox Pool (f) Piavininis Pool
(e) Grahams Pool
(d) Cardiff Pool
Sta
ge
hei
gh
t (m
)
Sta
ge
hei
gh
t (m
)S
tag
e h
eig
ht
(m)
DaysDays
Days Days
Days Days
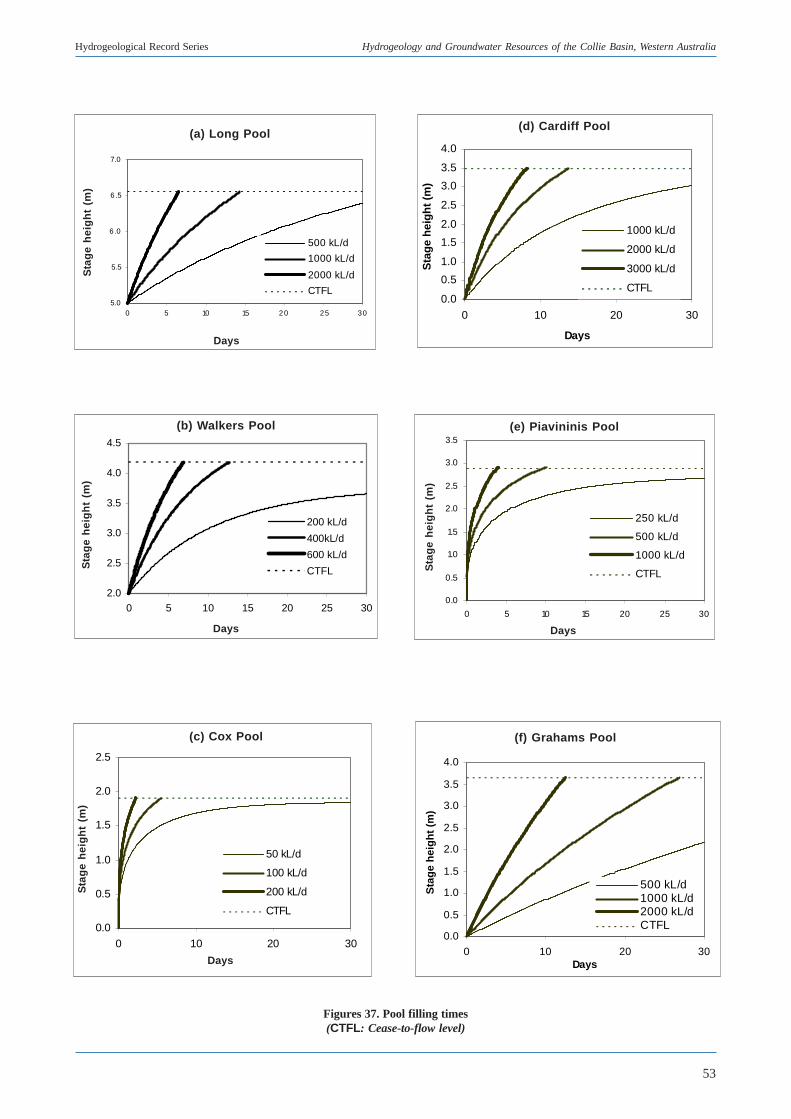
53
Hydrogeological Record Series Hydrogeology and Groundwater Resources of the Collie Basin, Western Australia
5.0
5.5
6.0
6.5
7.0
0 5 10 15 20 25 30
500 kL/d
1000 kL/d
2000 kL/d
CTFL
(d) Cardiff Pool
0.0
0.5
1.0
1.5
2.0
2.5
3.0
3.5
4.0
0 10 20 30
Days
Sta
ge
hei
gh
t (m
)
1000 kL/d
2000 kL/d
3000 kL/d
CTFL
(e ) Piavininis Pool
0.0
0.5
1.0
1.5
2.0
2.5
3.0
3.5
0 5 10 15 20 25 30
D ays
250 kL/d
500 kL/d
1000 kL/d
CTFL
(c)Cox Pool
0.0
0.5
1.0
1.5
2.0
2.5
0 10 20 30
Days
Sta
ge
hei
gh
t (m
)
50 kL/d
100 kL/d
200 kL/d
CTFL
(f) Grahams Pool
0.0
0.5
1.0
1.5
2.0
2.5
3.0
3.5
4.0
0 10 20 30Days
Sta
ge
hei
gh
t (m
)
500 kL/d1000 kL/d2000 kL/dCTFL
Figures 37. Pool filling times(CTFL: Cease-to-flow level)
Sta
ge
hei
gh
t (m
)
(c) Cox Pool (f) Grahams Pool
(e) Piavininis Pool
(a) Long Pool(d) Cardiff Pool
Days
Sta
ge
hei
gh
t (m
)
2.0
2.5
3.0
3.5
4.0
4.5
0 5 10 15 20 25 30
200 kL/d
400kL/d
600 kL/d
CTFL
(b) Walkers Pool
Sta
ge
hei
gh
t (m
)
Days Days
Sta
ge
hei
gh
t (m
)
Days
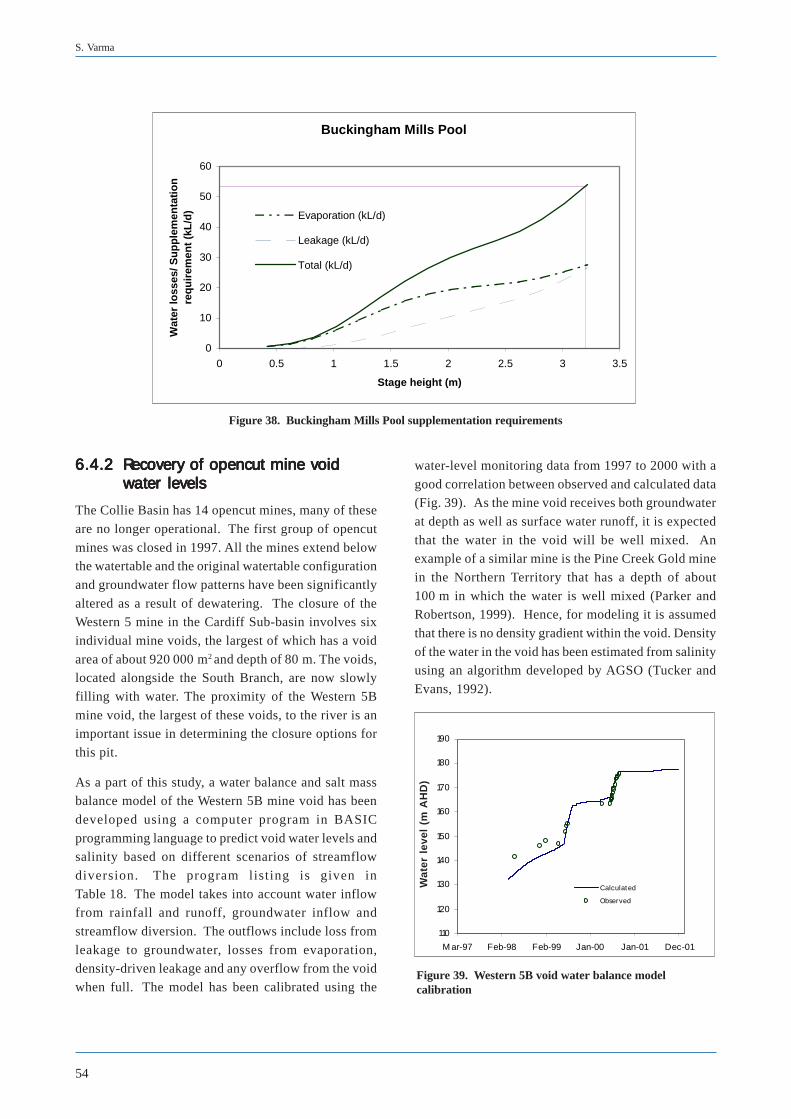
54
S. Varma
110
120
130
140
150
160
170
180
190
M ar-97 Feb-98 Feb-99 Jan-00 Jan-01 Dec-01
Calculated
Observed
6.4.26.4.26.4.26.4.26.4.2 Recovery of opencut mine voidRecovery of opencut mine voidRecovery of opencut mine voidRecovery of opencut mine voidRecovery of opencut mine voidwater levelswater levelswater levelswater levelswater levels
The Collie Basin has 14 opencut mines, many of these
are no longer operational. The first group of opencut
mines was closed in 1997. All the mines extend belowthe watertable and the original watertable configuration
and groundwater flow patterns have been significantly
altered as a result of dewatering. The closure of theWestern 5 mine in the Cardiff Sub-basin involves six
individual mine voids, the largest of which has a void
area of about 920 000 m2 and depth of 80 m. The voids,located alongside the South Branch, are now slowly
filling with water. The proximity of the Western 5B
mine void, the largest of these voids, to the river is animportant issue in determining the closure options for
this pit.
As a part of this study, a water balance and salt massbalance model of the Western 5B mine void has been
developed using a computer program in BASIC
programming language to predict void water levels andsalinity based on different scenarios of streamflow
diversion. The program listing is given in
Table 18. The model takes into account water inflowfrom rainfall and runoff, groundwater inflow and
streamflow diversion. The outflows include loss from
leakage to groundwater, losses from evaporation,density-driven leakage and any overflow from the void
when full. The model has been calibrated using the
water-level monitoring data from 1997 to 2000 with a
good correlation between observed and calculated data(Fig. 39). As the mine void receives both groundwater
at depth as well as surface water runoff, it is expected
that the water in the void will be well mixed. Anexample of a similar mine is the Pine Creek Gold mine
in the Northern Territory that has a depth of about
100 m in which the water is well mixed (Parker andRobertson, 1999). Hence, for modeling it is assumed
that there is no density gradient within the void. Density
of the water in the void has been estimated from salinityusing an algorithm developed by AGSO (Tucker and
Evans, 1992).
Figure 38. Buckingham Mills Pool supplementation requirements
Figure 39. Western 5B void water balance modelcalibration
Wat
er l
evel
(m
AH
D)
Buckingham Mills Pool
0
10
20
30
40
50
60
0 0.5 1 1.5 2 2.5 3 3.5
Stage height (m)
Wat
er lo
sses
/ Su
pp
lem
enta
tio
n
req
uir
emen
t (k
L/d
) Evaporation (kL/d)
Leakage (kL/d)
Total (kL/d)
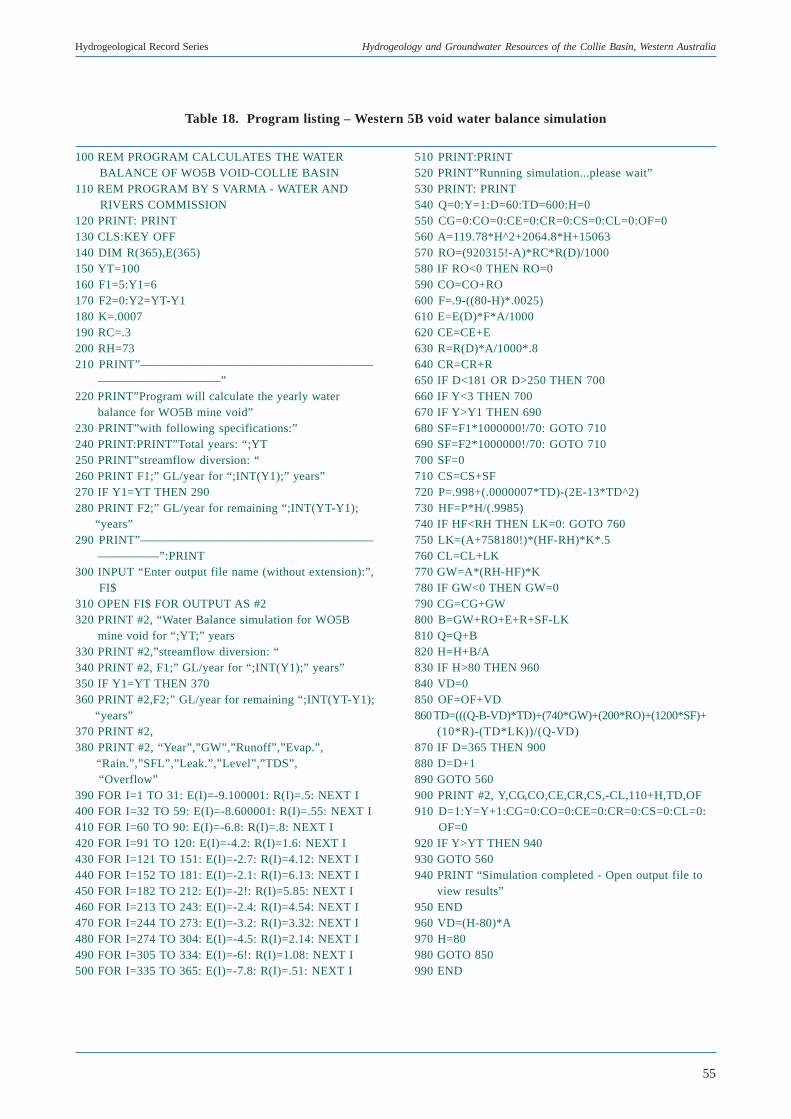
55
Hydrogeological Record Series Hydrogeology and Groundwater Resources of the Collie Basin, Western Australia
100 REM PROGRAM CALCULATES THE WATER BALANCE OF WO5B VOID-COLLIE BASIN110 REM PROGRAM BY S VARMA - WATER AND RIVERS COMMISSION120 PRINT: PRINT130 CLS:KEY OFF140 DIM R(365),E(365)150 YT=100160 F1=5:Y1=6170 F2=0:Y2=YT-Y1180 K=.0007190 RC=.3200 RH=73210 PRINT”———————————————————
——————————”220 PRINT”Program will calculate the yearly water
balance for WO5B mine void”230 PRINT”with following specifications:”240 PRINT:PRINT”Total years: “;YT250 PRINT”streamflow diversion: “260 PRINT F1;” GL/year for “;INT(Y1);” years”270 IF Y1=YT THEN 290280 PRINT F2;” GL/year for remaining “;INT(YT-Y1); “years”290 PRINT”———————————————————
—————”:PRINT300 INPUT “Enter output file name (without extension):”, FI$310 OPEN FI$ FOR OUTPUT AS #2320 PRINT #2, “Water Balance simulation for WO5B
mine void for “;YT;” years330 PRINT #2,”streamflow diversion: “340 PRINT #2, F1;” GL/year for “;INT(Y1);” years”350 IF Y1=YT THEN 370360 PRINT #2,F2;” GL/year for remaining “;INT(YT-Y1); “years”370 PRINT #2,380 PRINT #2, “Year”,”GW”,”Runoff”,”Evap.”, “Rain.”,”SFL”,”Leak.”,”Level”,”TDS”, “Overflow”390 FOR I=1 TO 31: E(I)=-9.100001: R(I)=.5: NEXT I400 FOR I=32 TO 59: E(I)=-8.600001: R(I)=.55: NEXT I410 FOR I=60 TO 90: E(I)=-6.8: R(I)=.8: NEXT I420 FOR I=91 TO 120: E(I)=-4.2: R(I)=1.6: NEXT I430 FOR I=121 TO 151: E(I)=-2.7: R(I)=4.12: NEXT I440 FOR I=152 TO 181: E(I)=-2.1: R(I)=6.13: NEXT I450 FOR I=182 TO 212: E(I)=-2!: R(I)=5.85: NEXT I460 FOR I=213 TO 243: E(I)=-2.4: R(I)=4.54: NEXT I470 FOR I=244 TO 273: E(I)=-3.2: R(I)=3.32: NEXT I480 FOR I=274 TO 304: E(I)=-4.5: R(I)=2.14: NEXT I490 FOR I=305 TO 334: E(I)=-6!: R(I)=1.08: NEXT I500 FOR I=335 TO 365: E(I)=-7.8: R(I)=.51: NEXT I
510 PRINT:PRINT520 PRINT”Running simulation...please wait”530 PRINT: PRINT540 Q=0:Y=1:D=60:TD=600:H=0550 CG=0:CO=0:CE=0:CR=0:CS=0:CL=0:OF=0560 A=119.78*H^2+2064.8*H+15063570 RO=(920315!-A)*RC*R(D)/1000580 IF RO<0 THEN RO=0590 CO=CO+RO600 F=.9-((80-H)*.0025)610 E=E(D)*F*A/1000620 CE=CE+E630 R=R(D)*A/1000*.8640 CR=CR+R650 IF D<181 OR D>250 THEN 700660 IF Y<3 THEN 700670 IF Y>Y1 THEN 690680 SF=F1*1000000!/70: GOTO 710690 SF=F2*1000000!/70: GOTO 710700 SF=0710 CS=CS+SF720 P=.998+(.0000007*TD)-(2E-13*TD^2)730 HF=P*H/(.9985)740 IF HF<RH THEN LK=0: GOTO 760750 LK=(A+758180!)*(HF-RH)*K*.5760 CL=CL+LK770 GW=A*(RH-HF)*K780 IF GW<0 THEN GW=0790 CG=CG+GW800 B=GW+RO+E+R+SF-LK810 Q=Q+B820 H=H+B/A830 IF H>80 THEN 960840 VD=0850 OF=OF+VD860 TD=(((Q-B-VD)*TD)+(740*GW)+(200*RO)+(1200*SF)+
(10*R)-(TD*LK))/(Q-VD)870 IF D=365 THEN 900880 D=D+1890 GOTO 560900 PRINT #2, Y,CG,CO,CE,CR,CS,-CL,110+H,TD,OF910 D=1:Y=Y+1:CG=0:CO=0:CE=0:CR=0:CS=0:CL=0: OF=0920 IF Y>YT THEN 940930 GOTO 560940 PRINT “Simulation completed - Open output file to
view results”950 END960 VD=(H-80)*A970 H=80980 GOTO 850990 END
Table 18. Program listing – Western 5B void water balance simulation
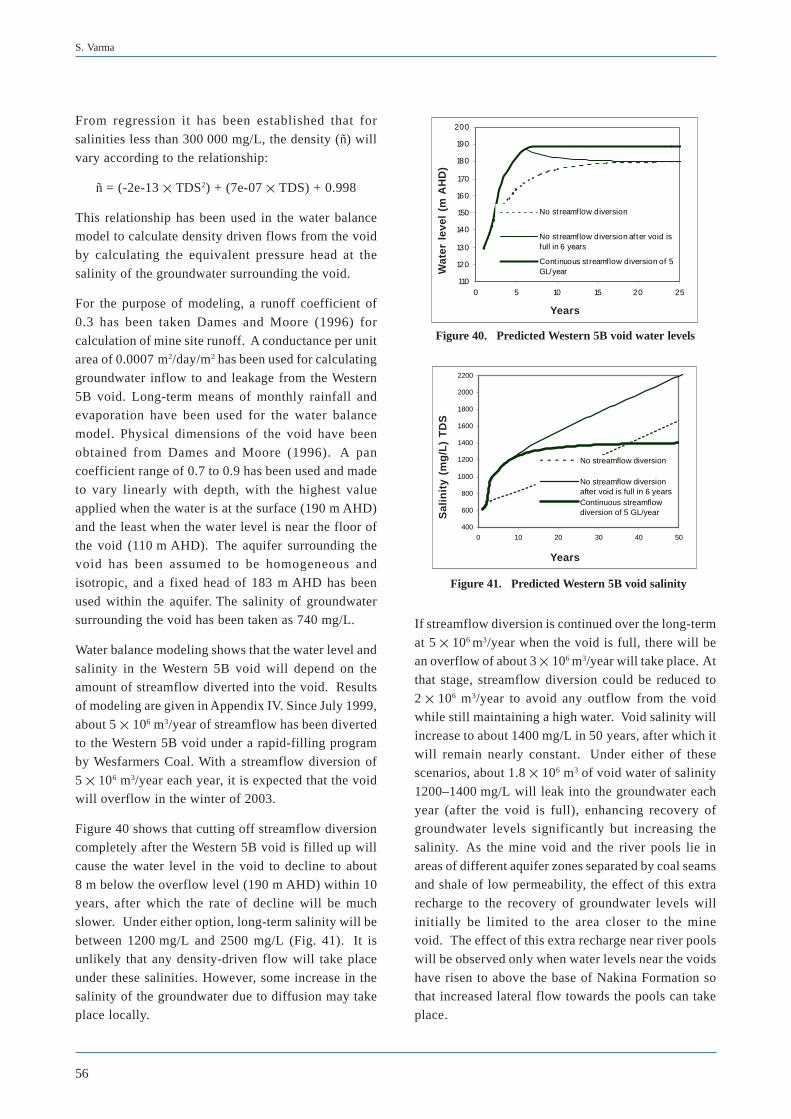
56
S. Varma
110
120
130
140
150
160
170
180
190
200
0 5 10 15 20 25
Y ears
No streamflow diversion
No streamflow diversion af ter void isfull in 6 years
Cont inuous streamflow diversion of 5GL/year
From regression it has been established that for
salinities less than 300 000 mg/L, the density (ñ) will
vary according to the relationship:
ñ = (-2e-13 TDS2) + (7e-07 TDS) + 0.998
This relationship has been used in the water balancemodel to calculate density driven flows from the void
by calculating the equivalent pressure head at the
salinity of the groundwater surrounding the void.
For the purpose of modeling, a runoff coefficient of
0.3 has been taken Dames and Moore (1996) for
calculation of mine site runoff. A conductance per unitarea of 0.0007 m2/day/m2 has been used for calculating
groundwater inflow to and leakage from the Western
5B void. Long-term means of monthly rainfall andevaporation have been used for the water balance
model. Physical dimensions of the void have been
obtained from Dames and Moore (1996). A pancoefficient range of 0.7 to 0.9 has been used and made
to vary linearly with depth, with the highest value
applied when the water is at the surface (190 m AHD)and the least when the water level is near the floor of
the void (110 m AHD). The aquifer surrounding thevoid has been assumed to be homogeneous and
isotropic, and a fixed head of 183 m AHD has been
used within the aquifer. The salinity of groundwatersurrounding the void has been taken as 740 mg/L.
Water balance modeling shows that the water level and
salinity in the Western 5B void will depend on theamount of streamflow diverted into the void. Results
of modeling are given in Appendix IV. Since July 1999,
about 5 106 m3/year of streamflow has been divertedto the Western 5B void under a rapid-filling program
by Wesfarmers Coal. With a streamflow diversion of
5 106 m3/year each year, it is expected that the voidwill overflow in the winter of 2003.
Figure 40 shows that cutting off streamflow diversioncompletely after the Western 5B void is filled up will
cause the water level in the void to decline to about
8 m below the overflow level (190 m AHD) within 10years, after which the rate of decline will be much
slower. Under either option, long-term salinity will be
between 1200 mg/L and 2500 mg/L (Fig. 41). It isunlikely that any density-driven flow will take place
under these salinities. However, some increase in the
salinity of the groundwater due to diffusion may takeplace locally.
If streamflow diversion is continued over the long-term
at 5 106 m3/year when the void is full, there will bean overflow of about 3 106 m3/year will take place. At
that stage, streamflow diversion could be reduced to
2 106 m3/year to avoid any outflow from the voidwhile still maintaining a high water. Void salinity will
increase to about 1400 mg/L in 50 years, after which it
will remain nearly constant. Under either of thesescenarios, about 1.8 106 m3 of void water of salinity
1200–1400 mg/L will leak into the groundwater each
year (after the void is full), enhancing recovery ofgroundwater levels significantly but increasing the
salinity. As the mine void and the river pools lie in
areas of different aquifer zones separated by coal seamsand shale of low permeability, the effect of this extra
recharge to the recovery of groundwater levels will
initially be limited to the area closer to the minevoid. The effect of this extra recharge near river pools
will be observed only when water levels near the voids
have risen to above the base of Nakina Formation sothat increased lateral flow towards the pools can take
place.
Figure 40. Predicted Western 5B void water levels
Figure 41. Predicted Western 5B void salinity
Wat
er l
evel
(m
AH
D)
400
600
800
1000
1200
1400
1600
1800
2000
2200
0 10 20 30 40 50
Years
Sal
init
y (m
g/L
) T
DS
No streamflow diversion
No streamflow diversionafter void is full in 6 yearsContinuous streamflowdiversion of 5 GL/yearS
alin
ity
(mg
/L)
TD
S
Years
Years
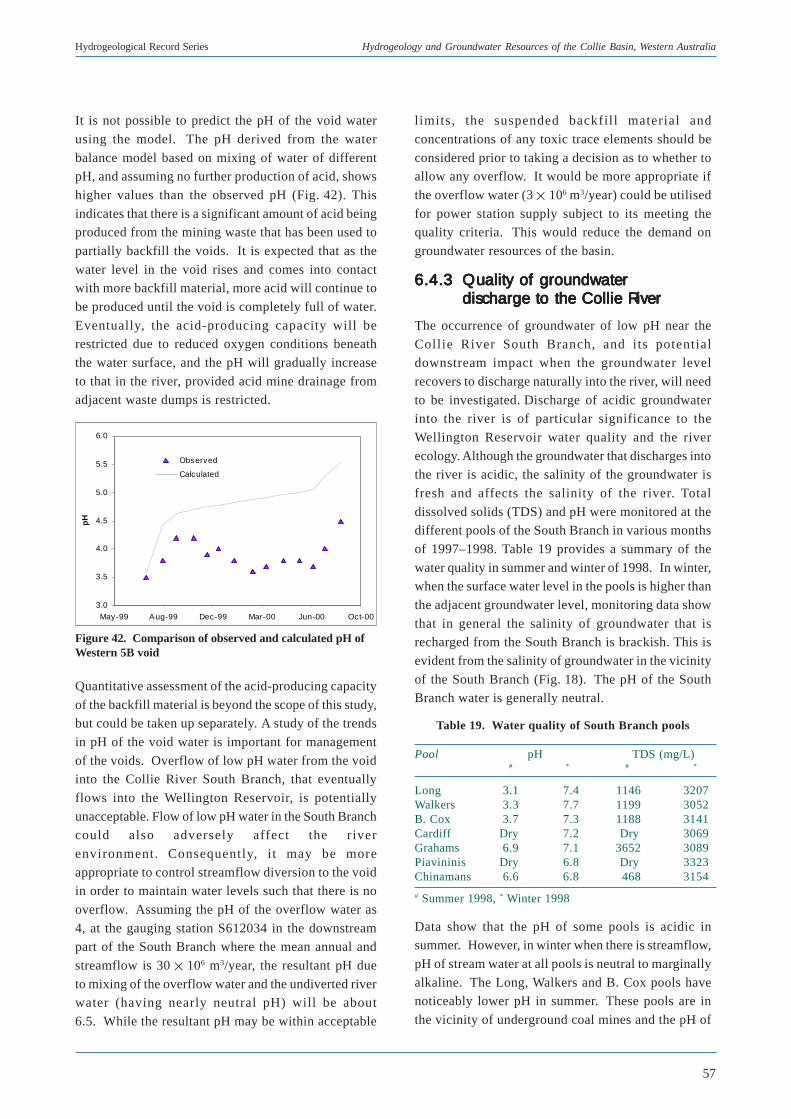
57
Hydrogeological Record Series Hydrogeology and Groundwater Resources of the Collie Basin, Western Australia
3.0
3.5
4.0
4.5
5.0
5.5
6.0
May-99 Aug-99 Dec-99 Mar-00 Jun-00 Oct-00
pH
Observed
Calculated
It is not possible to predict the pH of the void water
using the model. The pH derived from the water
balance model based on mixing of water of differentpH, and assuming no further production of acid, shows
higher values than the observed pH (Fig. 42). This
indicates that there is a significant amount of acid beingproduced from the mining waste that has been used to
partially backfill the voids. It is expected that as the
water level in the void rises and comes into contactwith more backfill material, more acid will continue to
be produced until the void is completely full of water.
Eventually, the acid-producing capacity will berestricted due to reduced oxygen conditions beneath
the water surface, and the pH will gradually increase
to that in the river, provided acid mine drainage fromadjacent waste dumps is restricted.
Quantitative assessment of the acid-producing capacity
of the backfill material is beyond the scope of this study,but could be taken up separately. A study of the trends
in pH of the void water is important for management
of the voids. Overflow of low pH water from the voidinto the Collie River South Branch, that eventually
flows into the Wellington Reservoir, is potentially
unacceptable. Flow of low pH water in the South Branchcould also adversely affect the river
environment. Consequently, i t may be more
appropriate to control streamflow diversion to the voidin order to maintain water levels such that there is no
overflow. Assuming the pH of the overflow water as
4, at the gauging station S612034 in the downstreampart of the South Branch where the mean annual and
streamflow is 30 106 m3/year, the resultant pH due
to mixing of the overflow water and the undiverted riverwater (having nearly neutral pH) will be about
6.5. While the resultant pH may be within acceptable
Figure 42. Comparison of observed and calculated pH ofWestern 5B void
l imits, the suspended backfill material and
concentrations of any toxic trace elements should be
considered prior to taking a decision as to whether toallow any overflow. It would be more appropriate if
the overflow water (3 106 m3/year) could be utilised
for power station supply subject to its meeting thequality criteria. This would reduce the demand on
groundwater resources of the basin.
6.4.36.4.36.4.36.4.36.4.3 Quality of groundwaterQuality of groundwaterQuality of groundwaterQuality of groundwaterQuality of groundwaterdischarge to the Collie Riverdischarge to the Collie Riverdischarge to the Collie Riverdischarge to the Collie Riverdischarge to the Collie River
The occurrence of groundwater of low pH near the
Collie River South Branch, and its potentialdownstream impact when the groundwater level
recovers to discharge naturally into the river, will need
to be investigated. Discharge of acidic groundwaterinto the river is of particular significance to the
Wellington Reservoir water quality and the river
ecology. Although the groundwater that discharges intothe river is acidic, the salinity of the groundwater is
fresh and affects the salinity of the river. Total
dissolved solids (TDS) and pH were monitored at thedifferent pools of the South Branch in various months
of 1997–1998. Table 19 provides a summary of the
water quality in summer and winter of 1998. In winter,when the surface water level in the pools is higher than
the adjacent groundwater level, monitoring data show
that in general the salinity of groundwater that isrecharged from the South Branch is brackish. This is
evident from the salinity of groundwater in the vicinity
of the South Branch (Fig. 18). The pH of the SouthBranch water is generally neutral.
Table 19. Water quality of South Branch pools
Pool pH TDS (mg/L)# * # *
Long 3.1 7.4 1146 3207Walkers 3.3 7.7 1199 3052B. Cox 3.7 7.3 1188 3141Cardiff Dry 7.2 Dry 3069Grahams 6.9 7.1 3652 3089Piavininis Dry 6.8 Dry 3323Chinamans 6.6 6.8 468 3154
# Summer 1998, * Winter 1998
Data show that the pH of some pools is acidic insummer. However, in winter when there is streamflow,
pH of stream water at all pools is neutral to marginally
alkaline. The Long, Walkers and B. Cox pools havenoticeably lower pH in summer. These pools are in
the vicinity of underground coal mines and the pH of
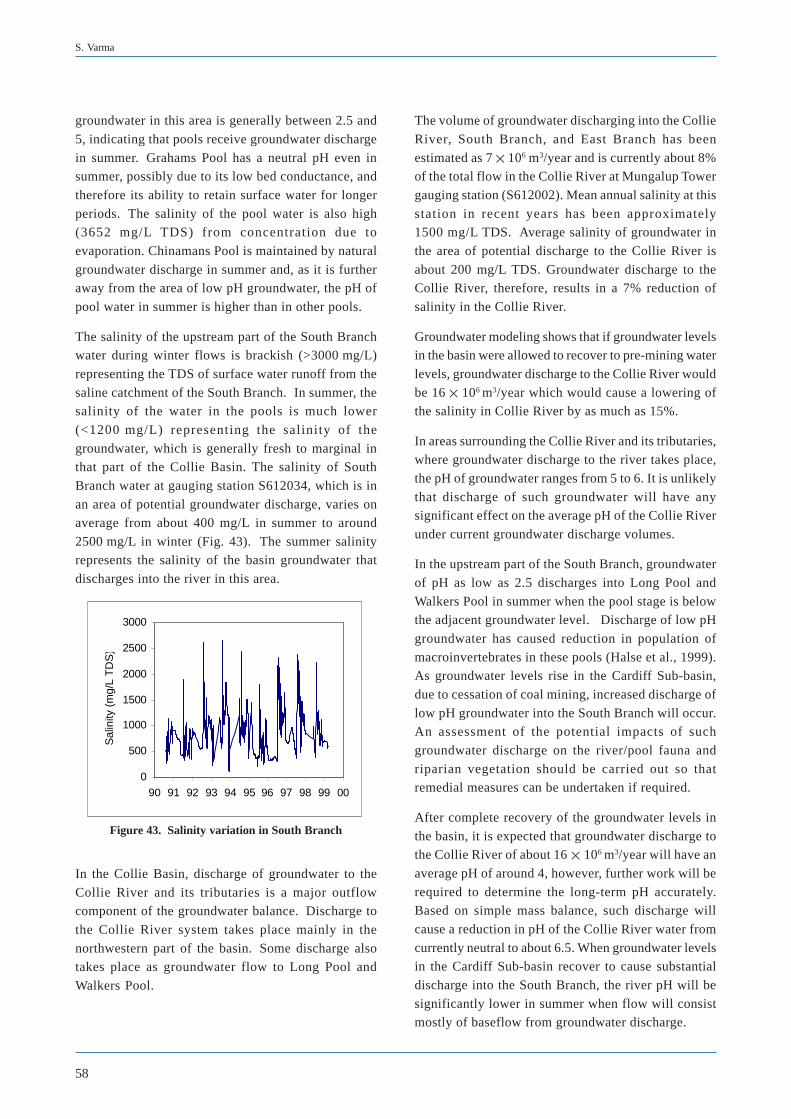
58
S. Varma
groundwater in this area is generally between 2.5 and
5, indicating that pools receive groundwater discharge
in summer. Grahams Pool has a neutral pH even insummer, possibly due to its low bed conductance, and
therefore its ability to retain surface water for longer
periods. The salinity of the pool water is also high(3652 mg/L TDS) from concentration due to
evaporation. Chinamans Pool is maintained by natural
groundwater discharge in summer and, as it is furtheraway from the area of low pH groundwater, the pH of
pool water in summer is higher than in other pools.
The salinity of the upstream part of the South Branchwater during winter flows is brackish (>3000 mg/L)
representing the TDS of surface water runoff from the
saline catchment of the South Branch. In summer, thesalinity of the water in the pools is much lower
(<1200 mg/L) representing the salinity of the
groundwater, which is generally fresh to marginal inthat part of the Collie Basin. The salinity of South
Branch water at gauging station S612034, which is in
an area of potential groundwater discharge, varies onaverage from about 400 mg/L in summer to around
2500 mg/L in winter (Fig. 43). The summer salinityrepresents the salinity of the basin groundwater that
discharges into the river in this area.
In the Collie Basin, discharge of groundwater to the
Collie River and its tributaries is a major outflowcomponent of the groundwater balance. Discharge to
the Collie River system takes place mainly in the
northwestern part of the basin. Some discharge alsotakes place as groundwater flow to Long Pool and
Walkers Pool.
The volume of groundwater discharging into the Collie
River, South Branch, and East Branch has been
estimated as 7 106 m3/year and is currently about 8%of the total flow in the Collie River at Mungalup Tower
gauging station (S612002). Mean annual salinity at this
station in recent years has been approximately1500 mg/L TDS. Average salinity of groundwater in
the area of potential discharge to the Collie River is
about 200 mg/L TDS. Groundwater discharge to theCollie River, therefore, results in a 7% reduction of
salinity in the Collie River.
Groundwater modeling shows that if groundwater levelsin the basin were allowed to recover to pre-mining water
levels, groundwater discharge to the Collie River would
be 16 106 m3/year which would cause a lowering ofthe salinity in Collie River by as much as 15%.
In areas surrounding the Collie River and its tributaries,where groundwater discharge to the river takes place,
the pH of groundwater ranges from 5 to 6. It is unlikely
that discharge of such groundwater will have anysignificant effect on the average pH of the Collie River
under current groundwater discharge volumes.
In the upstream part of the South Branch, groundwater
of pH as low as 2.5 discharges into Long Pool and
Walkers Pool in summer when the pool stage is belowthe adjacent groundwater level. Discharge of low pH
groundwater has caused reduction in population of
macroinvertebrates in these pools (Halse et al., 1999).As groundwater levels rise in the Cardiff Sub-basin,
due to cessation of coal mining, increased discharge of
low pH groundwater into the South Branch will occur.An assessment of the potential impacts of such
groundwater discharge on the river/pool fauna and
riparian vegetation should be carried out so thatremedial measures can be undertaken if required.
After complete recovery of the groundwater levels in
the basin, it is expected that groundwater discharge tothe Collie River of about 16 106 m3/year will have an
average pH of around 4, however, further work will be
required to determine the long-term pH accurately.Based on simple mass balance, such discharge will
cause a reduction in pH of the Collie River water from
currently neutral to about 6.5. When groundwater levelsin the Cardiff Sub-basin recover to cause substantial
discharge into the South Branch, the river pH will be
significantly lower in summer when flow will consistmostly of baseflow from groundwater discharge.
0
500
1000
1500
2000
2500
3000
90 91 92 93 94 95 96 97 98 99 00
Sal
inity
(m
g/L
TD
S)
Figure 43. Salinity variation in South Branch
59
Hydrogeological Record Series Hydrogeology and Groundwater Resources of the Collie Basin, Western Australia
In addition to the discharge of low pH groundwater into
the Collie River system, overflow of acidic water from
the abandoned opencut mine voids could take place asstreamflow is diverted into the voids under a “Rapid
filling program”. Downstream impacts of such
overflow will need further investigation.
Acidic groundwater can mobilise potentially toxic
pollutants, such as As, Be, Cu, Mo, Ni and U, associated
with the Collie Basin coal. Although these coulddischarge into the Collie River, concentrations are likely
to be low.
6.5 Research and monitoring6.5 Research and monitoring6.5 Research and monitoring6.5 Research and monitoring6.5 Research and monitoring
Based on the recommendations of the Collie WaterAdvisory Group (1996) the State Government has
allocated $50 000 per annum for five years to be used
for supporting research to enhance water resourcemanagement in the basin. Since 1997, the funds have
been provided for relevant research upon
recommendations of the Collie Basin Research SteeringCommittee established for advising Water and Rivers
Commission on selection of projects for research.
The Collie Basin Research Steering Committee has
representatives from key Government agencies, the
Shire of Collie and major users of Collie Basingroundwater, and is chaired by Water and Rivers
Commission. The committee has identified the
following issues as the key focus for research in theCollie Basin
• Groundwater recovery
• Sustainable use of groundwater resources in future
• Management of river pools
• Ecosystem and social issues
The committee has so far undertaken the following
projects
• Audit of geological, hydrogeological and
hydrological data of the Collie Basin by Water andRivers Commission.
• Age dating of groundwater in the Collie Basin, using
Carbon-14 and CFC concentrations, by CSIRO(Turner et al., 1999).
• Monitoring of water quality in the Collie Basin –
Macroinvertebrates and the AusRivas approach by
CALM (Halse et al., 1999).
• Cardiff Sub-basin conceptual groundwater model by
Aquaterra Consulting (Aquaterra, 1999).
• Three-dimensional numerical groundwater flow
modeling of the Collie Basin by Geo-Eng (Australia)
Pty Ltd and Water and Rivers Commission (Varmaand Zhang, 2002).
These projects have made significant contributions to
an improved understanding of the water resources ofthe basin. The groundwater modeling in particular will
provide an important management tool in order to
• understand the local and regional impacts of mine
dewatering and other groundwater abstraction;
• gain an improved understanding of the groundwater–river interaction to aid river pool augmentation;
• assess options for enhancing recovery of groundwaterlevels, including artificial recharge; and
• assess options for rehabilitation of opencut minevoids.
As mining and large-scale groundwater abstraction are
likely to continue for the next 30 years, monitoring ofhydrological and hydrogeological parameters will be
required to facilitate research to support efficient long-
term management of the water resources of the basin. Itwill be necessary to continue monitoring the water
levels in the bores for continued assessment of the
impact of mining and groundwater abstraction forpower generation. It is recommended that the regional
monitoring bores be monitored for water level twice a
year to obtain peak minimum and maximum waterlevels. Salinity and pH in these bores should be
monitored annually in summer. Apart from these
activities, monitoring specific to the groundwaterlicence conditions and environmental water provisions
should be carried out as required.
It is recommended that a review of the hydrogeology
of the basin is carried out every five years taking into
account new data and any advancement in the sciencethat may aid further assessment of the complex
hydrogeology of the basin. Study of acid mine drainage
from the waste dumps and acidification of rehabilitated
60
S. Varma
mine voids in the Collie Basin should be undertaken to
assess future downstream impacts of these voids. These
would require regular monitoring of physical andchemical parameters of the void water and of the
surrounding groundwater. As a part of the Australian
Coal Association Research Program (ACARP), CurtinUniversity of Technology is undertaking a multi-
disciplinary research project to develop appropriate low
cost and low maintenance technology for rehabilitatingacid water to treat the water in the mine voids.
Possibilities of using the voids for aquaculture are being
investigated at Ewington II opencut mine void (Phillipset al., 2000). Several sub-projects of the research
program include
• geology, geochemistry and hydrogeology of the area,
• amelioration of acid runoff from coal mine dumps,
• passive mine drainage treatments and aquaticvegetation strategies, and
• bacterial strategies for increasing pH in acidic voids.
Outcomes of this research project will greatly assist in
management of the abandoned mine voids in the CollieBasin.
There is a need for a coordinated ‘whole of the basinapproach’ in monitoring and reporting of
hydrogeological data and assessments on local and
regional scale by the major users of the groundwaterof the basin. Such an approach will maintain integrity
of data and facilitate data retrieval from a central
source. Data collated as part of the Collie Basingroundwater modeling project should be taken up by
the WIN database of Water and Rivers Commission,
and ld continue to be updated with both point-sourceand time-series data for ready use for future
hydrological/hydrogeological research.
61
Hydrogeological Record Series Hydrogeology and Groundwater Resources of the Collie Basin, Western Australia
An investigation comprising drilling and monitoring ofbores has permitted a better understanding of thehydrogeology and groundwater resources of the CollieBasin for management of these resources and theassociated environment.
An improved understanding of the hydrogeology of thebasin has been developed based on literature reviewand analysis of drilling, testing and monitoring data.The hydrostratigraphy of the basin has been definedand a new aquifer nomenclature has been proposed.Components of both surface-water and groundwaterbalance of the Collie Basin have been determined.
Based on data from about 140 monitoring bores in thebasin, a synoptic watertable contour map has beenprepared, and has formed the basis for a study of theshallow groundwater flow in the basin. The regionalgroundwater flow direction in the Collie Basin ischanged from a conceptual pre-mining flow scenariobecause of mine dewatering and large-scalegroundwater abstraction for power generation.
Recharge to the basin from direct infiltration of rainfallis estimated as 19 x 106 m3/year. In addition there is1 x 106 m3/year of recharge from the SouthBranch. Recharge to the basin equates to about 14%of annual rainfall. The volume of groundwater instorage is about 7100 x 106 m3. However, economicsand policies preclude abstraction at this level. Rechargeto and flow through each Permian aquifer under pre-mining steady state and present transient conditionshave been estimated from a 3D groundwater flow modelusing MODFLOW and GMS.
Assessment of the impact of large-scale groundwaterabstraction in the basin on groundwater levels has beencarried out. In the past, annual groundwater abstractionfrom the basin has significantly exceeded recharge,causing a basin-wide decline in water levels. In places,the watertable is as much as 5 m below the base of theSouth Branch river bed. As a result, some river poolsof the South Branch that were previously maintainedby natural groundwater discharge are now dry insummer. It is estimated that it would take around30 years for the watertable to recover so that pools canbe maintained by natural groundwater discharge.However, since 1995, after closure of the undergroundmines and subsequent reduction in groundwater
7 Conclusions
abstraction, water levels in some parts of the basin,including the area of the pools, have been rising.
Analytical techniques have been used to determine bedconductance of the pools. Based on the pools waterbalance, the water requirements for artificialsupplementation have been calculated. It is estimatedthat the six environmentally significant pools of theSouth Branch will together require supplementation at2400 m3/day to maintain water levels at cease-to-flowlevels.
A computer program has been developed to simulatethe Western 5B opencut mine void water balance andto predict water levels and salinity based on differentstreamflow diversion options. Since July 1999, about5 x 106 m3/year of streamflow have been diverted to theWestern 5B void under a rapid filling program. At thisrate of streamflow diversion it is expected that the voidwill overflow after the winter of 2003.
Groundwater in the Collie Basin is acidic, with pHranging between 2.6 near the underground and opencutmines to 6.3 near the southern and southeasternboundaries of the basin. The salinity of groundwaterin the basin is generally less than 500 mg/L TDS.Groundwater of salinity 1000–2000 mg/L TDS occursin areas adjacent to South Branch in the southern partof Cardiff Sub-basin. Outside the basin, groundwatersalinity generally exceeds 1000 mg/L. A preliminaryassessment of the effects of discharge of groundwaterof low salinity on the salinity of the Collie River showsthat the current discharge volumes (7 x 10⁶ m3/year)cause a reduction of about 8% in the Collie Riversalinity. Reduction in salinity could be as much as 15%if the groundwater levels in the basin recovered to pre-mining levels. Under increased groundwater dischargeconditions, the resultant average pH of the Collie Rivercould reduce to 6.5.
Long-term monitoring of water levels will be requiredfor assessment of ongoing local and regional impactsof groundwater abstraction in the basin. Deepermonitoring bores may be required to develop a goodunderstanding of the hydrogeology of deeper sedimentsof the basin. The results of this study will enhancemanagement of the groundwater resources of the CollieBasin in general, and in particular ensure appropriateallocation of groundwater, and improved managementof river pools and mine voids.
62
S. Varma
ALLEN, A. D., 1991, Groundwater resources ofPhanerozoic sedimentary basins of WesternAustralia: International Conference on Groundwaterin Large Sedimentary Basins, Proceedings, Perth,1990.
AQUATERRA, 1999, Cardiff Sub-basin conceptualmodel: Report to Water and Rivers Commission.
AUSTRALIAN GROUNDWATER CONSULTANTS,1978, Muja Power Station Water Supply, Phase 2 –Groundwater Study, Volume 1.
BRUNNER, I. G., 1993, Resolution of aquiferparameters within the Muja Member of the CollieCoal Measures, Collie Basin, Western Australia:Curtin University of Technology: Master of Sciencethesis (Unpublished).
BUREAU OF METEOROLOGY, 1998, Faxed dataproviding mean daily evaporation for every monthfrom 1977 to 1998 (9 September 1998).
CHAMBERLAIN, N. G., 1947, Preliminary report onthe geophysical survey of the Collie Coal Basin:Australia Bureau of Mineral resources, Report 1(Geophysical Report 1).
CHAPMAN, T. G., and MAXWELL, A. I., 1996,Baseflow separation – comparison of numericalmethods with tracer experiments, Institution ofEngineers Australian National ConferencePublication, 96/05, pp 539–545.
CHOWN, R., MACHIN, B., and HARRIS, J., 1997,Report of an Aboriginal heritage sites avoidancesurvey for the Collie Basin watertable monitoringbores drilling project for Water and RiversCommission.
COLLIE LAND USE WORKING GROUP, 1987, Areport to Cabinet on land-use planning in the CollieBasin, May 1987.
COLLIE WATER ADVISORY GROUP (CWAG),1996, Strategies for water resource management inthe Collie Basin: Coordinated by the Departmentof Resources Development.
COLLIE WATER ADVISORY GROUP (CWAG),1999, Collie Basin water resource management;reconsideration of long and short term strategies:
8 References
Coordinated by Department of ResourcesDevelopment.
DAMES and MOORE, 1995, Report – Collie Basinhydrogeological monitoring for Department ofResources Development on behalf of Collie WaterAdvisory Group.
DAMES and MOORE, 1996, Report – Proposedclosure criteria for the WO5 mine for WesternCollieries limited.
DAMES and MOORE, 1997, Collie Basin groundwaterresource and aquifer review to June 1996 on behalfof Western Power Corporation.
DAMES and MOORE, 1998, Collie Basin production/monitoring summary (July 1997 to June 1998) forWestern Power.
DAVIDSON, W. A., 1995, Hydrogeology andgroundwater resources of the Perth region, WesternAustralia: Western Australian Geological Survey,Bulletin 142, 257p.
DAVY, R., and WILSON, A. C., 1989, Geochemicalstudy of inorganic components of the Collie CoalMeasures: Western Australia Geological Survey,Report 25, Professional Papers, p1–5.
FARRINGTON, P., GREENWOOD, E. A. N.,BARTLE, G. A. and WATSON, G. D., 1990,Evaporation from dampland vegetation on agroundwater mound, Journal of Hydrology 115(1990), p 65–75.
GEO-ENG, 2000, Data search, literature review andconceptualisation for a three dimensionalgroundwater flow model of the Collie Basin: Reportto Water and Rivers Commission.
GEO-ENG, 2001, Collie Basin – 3D GroundwaterModeling, Stage 2: Report to Water and RiversCommission.
HENDERSON, N., 1999, Surface Water andGroundwater Quality and Water Balance Studies atLong Pool, Collie Basin: Curtin University ofTechnology: Bachelors of Science thesis(Unpublished).
HIRSCHBERG, K-J. B., 1976, Collie Basingroundwater resources: Western AustraliaGeological Survey, Hydrogeology Report 1457(unpublished).
HALSE, S., KAY, W., SCANLON, M. and SMITH, M.,1999, Macroinvertebrate monitoring in the Collie
63
Hydrogeological Record Series Hydrogeology and Groundwater Resources of the Collie Basin, Western Australia
Basin: Department of Conservation and LandManagement (Unpublished).
HARRIS, J., 1997, Report of an archaeological siteavoidance survey of watertable monitoring boresdrilling project at Collie Basin for Water and RiversCommission.
KEVI, L., 1990, Revised Bouger anomaly map of theCollie Basin and adjoining areas: Western AustraliaGeological Survey, Record 1990/9.
LE BLANC SMITH, G., 1993, The geology andPermian coal resources of the Collie Basin, WesternAustralia: Western Australia Geological Survey,Report 38, 86 p.
LORD, J. H., 1952, Collie Mineral Field: WesternAustralia Geological Survey, Bulletin 105, part 1.
LOW, G. H., 1958, Collie Mineral Field: WesternAustralian Geological Survey, Bulletin 105, part 2.
LOWRY, D., 1976, Tectonic history of the Collie Basin,Western Australia: Geological Society of AustraliaJournal, v. 23, p. 95–104.
MACDONALD, M. G., and HARBAUGH, W., 1988,Techniques of water resources investigations of theUnited States Geological Survey, Chapter A1, Amodular three-dimensional ground-water flowmodel, United States Geological Survey.
MOHSENZADEH, H. A., 1998, Collie Basinwatertable monitoring bores drilling project – Borecompletion reports: Water and Rivers Commission,Hydrogeology Report No. HR 118 (Unpublished).
MONCRIEFF, J. S., 1993, Hydrogeology of the CollieBasin, Western Australia: Western AustraliaGeological Survey, Report 34, p 129–153.
MORGAN, D., POTTER, I., and GILL, H. (FreshwaterFish Group, Murdoch University), 1995, TheFreshwater fish and fauna of the pools of the SouthBranch of the Collie River, during a period ofextremely low water levels: Report to the WaterAuthority of Western Australia.
PARKER, G., and ROBERTSON, A., 1999, AcidDrainage: Australian Minerals and EnergyEnvironmental Foundation, Occasional PaperNo. 11.
PHILLIPS, B. F., EVANS, L. H., SAPPAL, K., FOX,J. E. D., JOHN, J., LUND, M., 2000, AustralianCoal Association Research Program - Final void
water quality enhancement: Curtin University ofTechnology.
STRAWBRIDGE, M., 1997, Flora survey of proposedboresites for Collie regional monitoring project inthe Collie Basin, September 9–12 and December15–16, 1997: Water and Rivers Commission.
TUCKER, A. G., and EVANS, R., 1992, Users guideto head calculation program, Release 1.2.2:Australian Geological Survey Organisation(AGSO).
TURNER, J., BARTLE, G., WOODBURY, R.,GAILITIS, V., and WATSON, G., 1999, Estimationof groundwater residence times in the Collie Basinusing Carbon-14 activity and CFC concentrations,a final report to Water and Rivers Commission onbehalf of the Collie Basin Research SteeringCommittee: CSIRO Land and Water, ConsultancyReport 99–26, April 1999.
VARMA, S, 1997, Effect of groundwater abstractionin the Cardiff Sub-Basin on pools of the Collie RiverSouth Branch: Water and Rivers Commission,Hydrogeology Report No. HR 97 (Unpublished).
VARMA, S., and ZHANG, Q., 2002, Draft report onThree-dimensional finite difference groundwaterflow model of the Collie Basin: Water and RiversCommission, Hydrogeological Report No. 207.
WATER AND RIVERS COMMISSION, 2000, WesternAustralia Water Assessment 2000 – WaterAvailability and Use, National Land and WaterResources Audit.
WATER AUTHORITY OF WESTERN AUSTRALIA,1988, Collie Coal Basin – Water ResourcesManagement Strategy, Report No. WG 60.
WELKER ENVIRONMENTAL CONSULTANCY,2001, Draft Environmental water provisions, SouthBranch of Collie River downstream of Western 5Opencut for Water and Rivers Commission.
WESTERN COLLIERIES LIMITED, 1991, Compositegroundwater abstraction report, Collie BasinOperations (Opencut and underground mines).
WILDE, S. A., 1981, The Collie Basin, in MineralFields of the Southwest, Western Australia compiledby T. E. JOHNSTON: Geological Society ofAustralia, Fifth Australian Geological Convention,Excursion Guide A 4, p. 33 – 45.
WILSON, A. C., 1990, Collie Basin, in Geology andMineral Resources of Western Australia: Western
64
S. Varma
Abstraction Pumping groundwater from an
aquifer.
AHD Australian Height Datum;
equivalent to: Mean Sea Level
(MSL) + 0.026 m; Low WaterMark Fremantle (LWMF) +
0.756 m.
Alluvium Unconsolidated sedimentstransported by streams and rivers
and deposited.
AMG Australian Map Grid.
Anticline Sedimentary strata folded in an
arch.
Aquifer A geological formation or group of
ormations able to receive, storeand transmit significant quantities
of water.
Unconfined A permeable bed only partiallyfilled water and overlying a
relatively impermeable layer. Its
upper boundary is formed by a freewatertable or phreatic level under
atmospheric pressure.
Confined A permeable bed saturated with
water and lying between an upper
and a lower confining layer of lowpermeability.
Semi-confined A semi-confined or a leaky aquifer
is saturated and bounded above bya semi-permeable layer and below
by a layer that is either
impermeable or semi-permeable.
Semi-unconfined Intermediate between semi-
confined and unconfined, when theupper semi-permeable layer easily
transmits water.
9 Glossary
Archaean Period containing the oldest rocks
of the Earth’s crust – older than
2.4 billion years.
Baseflow Portion of river and streamflow
coming from groundwaterdischarge.
Basement Competent rock formationsunderneath sediments.
Bore Small diameter well, usually
drilled with machinery.
bns Below natural surface.
Colluvium Material transported by gravitydownhill of slopes.
Confining bed Sedimentary bed of very lowhydraulic conductivity.
Conformably Sediments deposited in a continuous
sequence without a break.
Cretaceous Final period of Mesozoic era; 65-
144 million years ago.
Dewatering Abstraction of groundwater from
bores to assist in mining.
Evapotranspiration A collective term for evaporation
and transpiration.
Fault A fracture in rocks or sedimentsalong which there has been an
observable displacement.
Flux Flow.
Formation A group of rocks or sediments
which have certain characteristicsin common, were deposited about
the same geological period, and
which constitute a convenient unitfor description.
65
Hydrogeological Record Series Hydrogeology and Groundwater Resources of the Collie Basin, Western Australia
Hydraulic Pertaining to groundwater motion.
Conductivity The flow through a unit cross-
sectional area of an aquifer undera unit hydraulic gradient.
Gradient The rate of change of total headper unit distance of flow at a given
poit and in a given direction.
Head The height of the free surface of abody of water above a given
subsurface point.
Lacustrine Pertaining to, produced by, or
formed in a lake.
Leach Remove soluble matter bypercolation of water.
Permian An era of geological time; 225–280 million years ago.
Porosity The ratio of the volume of void
spaces, to the total volume of arock matrix.
Potentiometric An imaginary surface representingthe total head of groundwater and
defined by the level to which water
will rise in a bore.
Quaternary Relating to the most recent period
in the Cainozoic era, from2 million years to present.
Salinity A measure of the concentration of
total dissolved solids in water0–500 mg/L, fresh 500–1500 mg/
L, fresh to marginal 1500–3000 mg/
L, brackish >3000 mg/L, saline.
surface
Scarp A line of cliffs (steep slopes)
produced by faulting or by erosion.
Specific yield The volume of water than anunconfined aquifer releases from
storage per unit surface area of the
aquifer per unit decline in thewatertable.
Storage coefficient The volume of water that aconfined aquifer releases from
storage per unit surface area of the
aquifer per unit decline in thecomponent of hydraulic head
normal to that surface.
Syncline A basin shaped fold in sedimentarystrata.
Tectonic Pertaining to forces that producestructures or features in rocks.
Tertiary The first period of the Cainozoic
era; 2–65 million years ago.
Transmissivity The rate at which water is
transmitted through a unit width ofan aquifer under a unit hydraulic
gradient.
Transpiration The loss of water vapour from a
plant, mainly through the leaves.
Watertable The surface of a body ofunconfined groundwater at which
the pressure is equal to that of the
atmosphere.
Well Large diameter bore, usually dug
by hand.
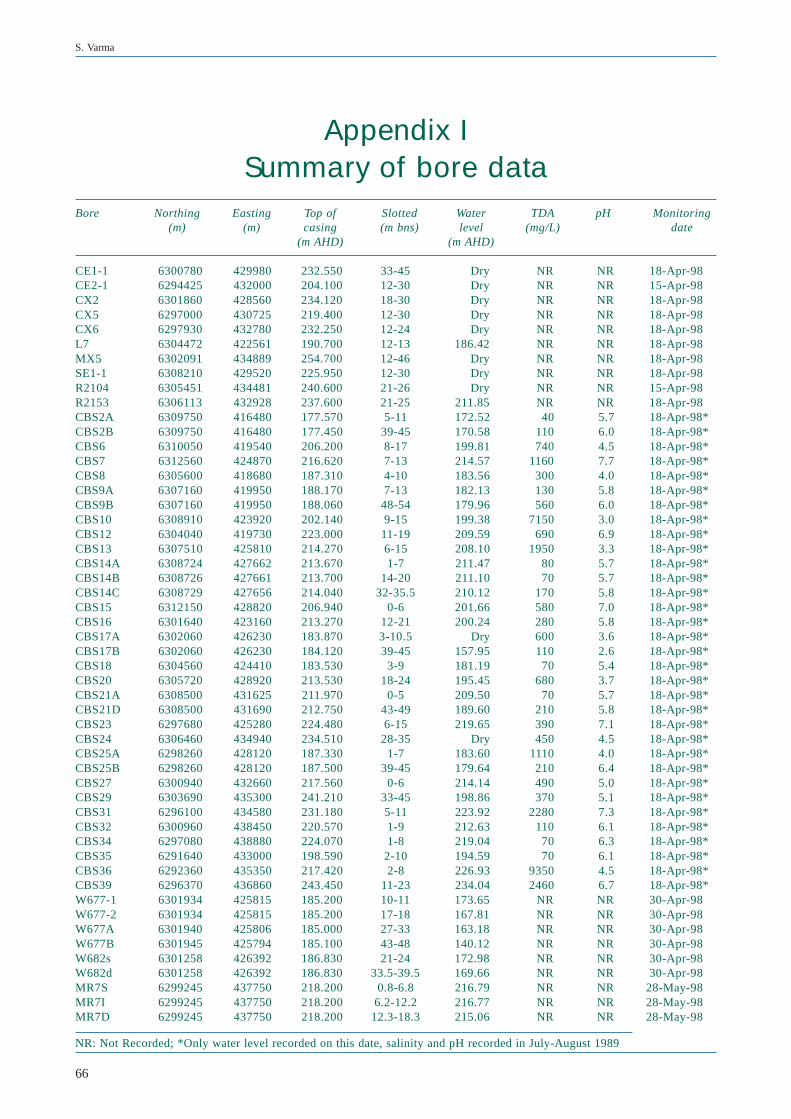
66
S. Varma
Bore Northing Easting Top of Slotted Water TDA pH Monitoring(m) (m) casing (m bns) level (mg/L) date
(m AHD) (m AHD)
CE1-1 6300780 429980 232.550 33-45 Dry NR NR 18-Apr-98CE2-1 6294425 432000 204.100 12-30 Dry NR NR 15-Apr-98CX2 6301860 428560 234.120 18-30 Dry NR NR 18-Apr-98CX5 6297000 430725 219.400 12-30 Dry NR NR 18-Apr-98CX6 6297930 432780 232.250 12-24 Dry NR NR 18-Apr-98L7 6304472 422561 190.700 12-13 186.42 NR NR 18-Apr-98MX5 6302091 434889 254.700 12-46 Dry NR NR 18-Apr-98SE1-1 6308210 429520 225.950 12-30 Dry NR NR 18-Apr-98R2104 6305451 434481 240.600 21-26 Dry NR NR 15-Apr-98R2153 6306113 432928 237.600 21-25 211.85 NR NR 18-Apr-98CBS2A 6309750 416480 177.570 5-11 172.52 40 5.7 18-Apr-98*CBS2B 6309750 416480 177.450 39-45 170.58 110 6.0 18-Apr-98*CBS6 6310050 419540 206.200 8-17 199.81 740 4.5 18-Apr-98*CBS7 6312560 424870 216.620 7-13 214.57 1160 7.7 18-Apr-98*CBS8 6305600 418680 187.310 4-10 183.56 300 4.0 18-Apr-98*CBS9A 6307160 419950 188.170 7-13 182.13 130 5.8 18-Apr-98*CBS9B 6307160 419950 188.060 48-54 179.96 560 6.0 18-Apr-98*CBS10 6308910 423920 202.140 9-15 199.38 7150 3.0 18-Apr-98*CBS12 6304040 419730 223.000 11-19 209.59 690 6.9 18-Apr-98*CBS13 6307510 425810 214.270 6-15 208.10 1950 3.3 18-Apr-98*CBS14A 6308724 427662 213.670 1-7 211.47 80 5.7 18-Apr-98*CBS14B 6308726 427661 213.700 14-20 211.10 70 5.7 18-Apr-98*CBS14C 6308729 427656 214.040 32-35.5 210.12 170 5.8 18-Apr-98*CBS15 6312150 428820 206.940 0-6 201.66 580 7.0 18-Apr-98*CBS16 6301640 423160 213.270 12-21 200.24 280 5.8 18-Apr-98*CBS17A 6302060 426230 183.870 3-10.5 Dry 600 3.6 18-Apr-98*CBS17B 6302060 426230 184.120 39-45 157.95 110 2.6 18-Apr-98*CBS18 6304560 424410 183.530 3-9 181.19 70 5.4 18-Apr-98*CBS20 6305720 428920 213.530 18-24 195.45 680 3.7 18-Apr-98*CBS21A 6308500 431625 211.970 0-5 209.50 70 5.7 18-Apr-98*CBS21D 6308500 431690 212.750 43-49 189.60 210 5.8 18-Apr-98*CBS23 6297680 425280 224.480 6-15 219.65 390 7.1 18-Apr-98*CBS24 6306460 434940 234.510 28-35 Dry 450 4.5 18-Apr-98*CBS25A 6298260 428120 187.330 1-7 183.60 1110 4.0 18-Apr-98*CBS25B 6298260 428120 187.500 39-45 179.64 210 6.4 18-Apr-98*CBS27 6300940 432660 217.560 0-6 214.14 490 5.0 18-Apr-98*CBS29 6303690 435300 241.210 33-45 198.86 370 5.1 18-Apr-98*CBS31 6296100 434580 231.180 5-11 223.92 2280 7.3 18-Apr-98*CBS32 6300960 438450 220.570 1-9 212.63 110 6.1 18-Apr-98*CBS34 6297080 438880 224.070 1-8 219.04 70 6.3 18-Apr-98*CBS35 6291640 433000 198.590 2-10 194.59 70 6.1 18-Apr-98*CBS36 6292360 435350 217.420 2-8 226.93 9350 4.5 18-Apr-98*CBS39 6296370 436860 243.450 11-23 234.04 2460 6.7 18-Apr-98*W677-1 6301934 425815 185.200 10-11 173.65 NR NR 30-Apr-98W677-2 6301934 425815 185.200 17-18 167.81 NR NR 30-Apr-98W677A 6301940 425806 185.000 27-33 163.18 NR NR 30-Apr-98W677B 6301945 425794 185.100 43-48 140.12 NR NR 30-Apr-98W682s 6301258 426392 186.830 21-24 172.98 NR NR 30-Apr-98W682d 6301258 426392 186.830 33.5-39.5 169.66 NR NR 30-Apr-98MR7S 6299245 437750 218.200 0.8-6.8 216.79 NR NR 28-May-98MR7I 6299245 437750 218.200 6.2-12.2 216.77 NR NR 28-May-98MR7D 6299245 437750 218.200 12.3-18.3 215.06 NR NR 28-May-98
Appendix ISummary of bore data
NR: Not Recorded; *Only water level recorded on this date, salinity and pH recorded in July-August 1989
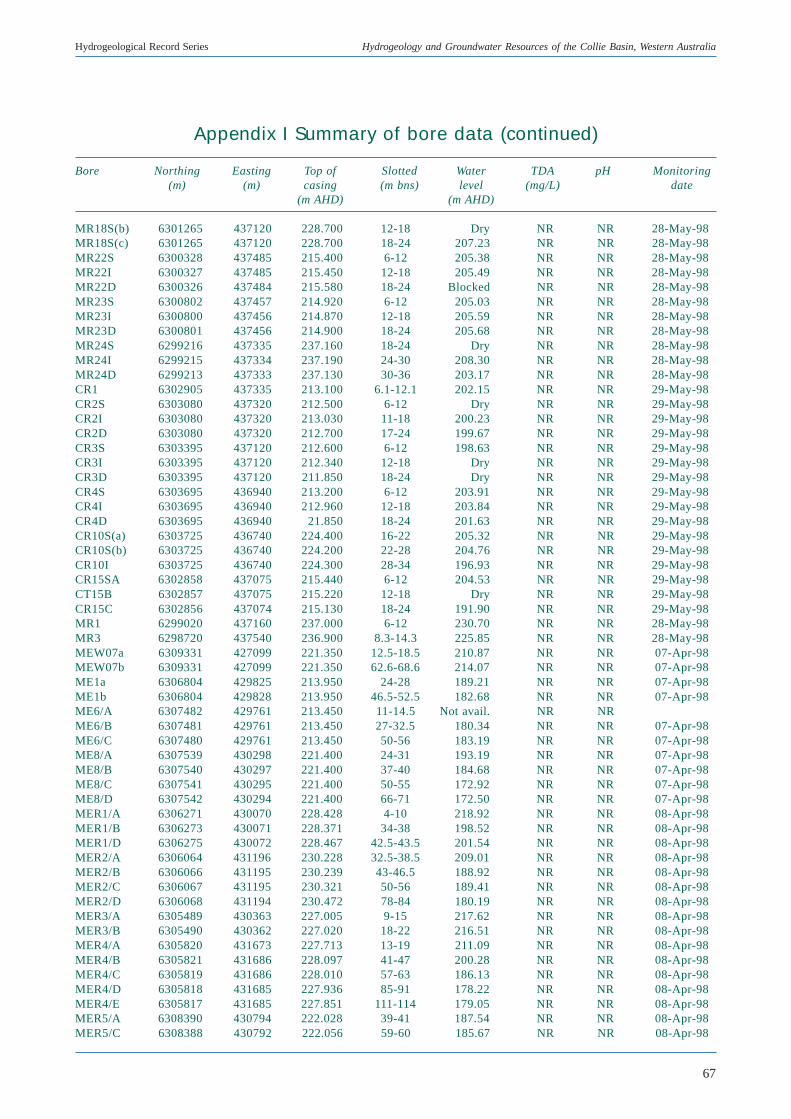
67
Hydrogeological Record Series Hydrogeology and Groundwater Resources of the Collie Basin, Western Australia
Appendix I Summary of bore data (continued)
Bore Northing Easting Top of Slotted Water TDA pH Monitoring(m) (m) casing (m bns) level (mg/L) date
(m AHD) (m AHD)
MR18S(b) 6301265 437120 228.700 12-18 Dry NR NR 28-May-98MR18S(c) 6301265 437120 228.700 18-24 207.23 NR NR 28-May-98MR22S 6300328 437485 215.400 6-12 205.38 NR NR 28-May-98MR22I 6300327 437485 215.450 12-18 205.49 NR NR 28-May-98MR22D 6300326 437484 215.580 18-24 Blocked NR NR 28-May-98MR23S 6300802 437457 214.920 6-12 205.03 NR NR 28-May-98MR23I 6300800 437456 214.870 12-18 205.59 NR NR 28-May-98MR23D 6300801 437456 214.900 18-24 205.68 NR NR 28-May-98MR24S 6299216 437335 237.160 18-24 Dry NR NR 28-May-98MR24I 6299215 437334 237.190 24-30 208.30 NR NR 28-May-98MR24D 6299213 437333 237.130 30-36 203.17 NR NR 28-May-98CR1 6302905 437335 213.100 6.1-12.1 202.15 NR NR 29-May-98CR2S 6303080 437320 212.500 6-12 Dry NR NR 29-May-98CR2I 6303080 437320 213.030 11-18 200.23 NR NR 29-May-98CR2D 6303080 437320 212.700 17-24 199.67 NR NR 29-May-98CR3S 6303395 437120 212.600 6-12 198.63 NR NR 29-May-98CR3I 6303395 437120 212.340 12-18 Dry NR NR 29-May-98CR3D 6303395 437120 211.850 18-24 Dry NR NR 29-May-98CR4S 6303695 436940 213.200 6-12 203.91 NR NR 29-May-98CR4I 6303695 436940 212.960 12-18 203.84 NR NR 29-May-98CR4D 6303695 436940 21.850 18-24 201.63 NR NR 29-May-98CR10S(a) 6303725 436740 224.400 16-22 205.32 NR NR 29-May-98CR10S(b) 6303725 436740 224.200 22-28 204.76 NR NR 29-May-98CR10I 6303725 436740 224.300 28-34 196.93 NR NR 29-May-98CR15SA 6302858 437075 215.440 6-12 204.53 NR NR 29-May-98CT15B 6302857 437075 215.220 12-18 Dry NR NR 29-May-98CR15C 6302856 437074 215.130 18-24 191.90 NR NR 29-May-98MR1 6299020 437160 237.000 6-12 230.70 NR NR 28-May-98MR3 6298720 437540 236.900 8.3-14.3 225.85 NR NR 28-May-98MEW07a 6309331 427099 221.350 12.5-18.5 210.87 NR NR 07-Apr-98MEW07b 6309331 427099 221.350 62.6-68.6 214.07 NR NR 07-Apr-98ME1a 6306804 429825 213.950 24-28 189.21 NR NR 07-Apr-98ME1b 6306804 429828 213.950 46.5-52.5 182.68 NR NR 07-Apr-98ME6/A 6307482 429761 213.450 11-14.5 Not avail. NR NRME6/B 6307481 429761 213.450 27-32.5 180.34 NR NR 07-Apr-98ME6/C 6307480 429761 213.450 50-56 183.19 NR NR 07-Apr-98ME8/A 6307539 430298 221.400 24-31 193.19 NR NR 07-Apr-98ME8/B 6307540 430297 221.400 37-40 184.68 NR NR 07-Apr-98ME8/C 6307541 430295 221.400 50-55 172.92 NR NR 07-Apr-98ME8/D 6307542 430294 221.400 66-71 172.50 NR NR 07-Apr-98MER1/A 6306271 430070 228.428 4-10 218.92 NR NR 08-Apr-98MER1/B 6306273 430071 228.371 34-38 198.52 NR NR 08-Apr-98MER1/D 6306275 430072 228.467 42.5-43.5 201.54 NR NR 08-Apr-98MER2/A 6306064 431196 230.228 32.5-38.5 209.01 NR NR 08-Apr-98MER2/B 6306066 431195 230.239 43-46.5 188.92 NR NR 08-Apr-98MER2/C 6306067 431195 230.321 50-56 189.41 NR NR 08-Apr-98MER2/D 6306068 431194 230.472 78-84 180.19 NR NR 08-Apr-98MER3/A 6305489 430363 227.005 9-15 217.62 NR NR 08-Apr-98MER3/B 6305490 430362 227.020 18-22 216.51 NR NR 08-Apr-98MER4/A 6305820 431673 227.713 13-19 211.09 NR NR 08-Apr-98MER4/B 6305821 431686 228.097 41-47 200.28 NR NR 08-Apr-98MER4/C 6305819 431686 228.010 57-63 186.13 NR NR 08-Apr-98MER4/D 6305818 431685 227.936 85-91 178.22 NR NR 08-Apr-98MER4/E 6305817 431685 227.851 111-114 179.05 NR NR 08-Apr-98MER5/A 6308390 430794 222.028 39-41 187.54 NR NR 08-Apr-98MER5/C 6308388 430792 222.056 59-60 185.67 NR NR 08-Apr-98
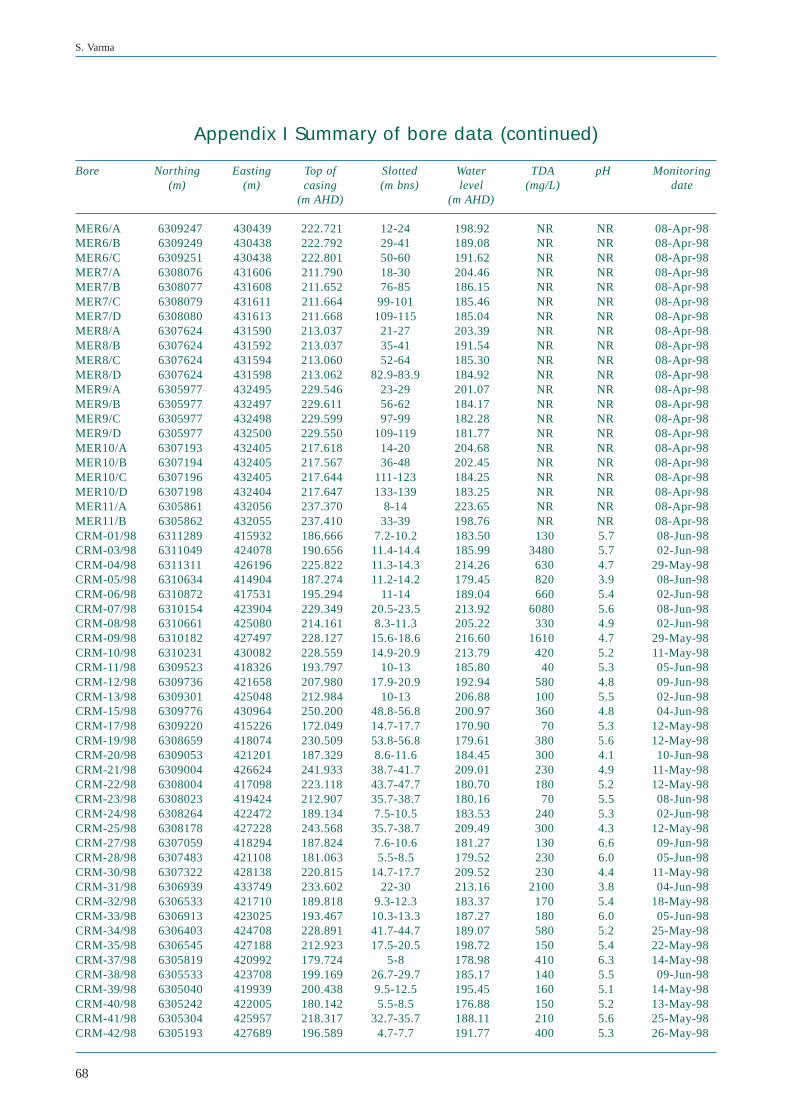
68
S. Varma
Appendix I Summary of bore data (continued)
Bore Northing Easting Top of Slotted Water TDA pH Monitoring(m) (m) casing (m bns) level (mg/L) date
(m AHD) (m AHD)
MER6/A 6309247 430439 222.721 12-24 198.92 NR NR 08-Apr-98MER6/B 6309249 430438 222.792 29-41 189.08 NR NR 08-Apr-98MER6/C 6309251 430438 222.801 50-60 191.62 NR NR 08-Apr-98MER7/A 6308076 431606 211.790 18-30 204.46 NR NR 08-Apr-98MER7/B 6308077 431608 211.652 76-85 186.15 NR NR 08-Apr-98MER7/C 6308079 431611 211.664 99-101 185.46 NR NR 08-Apr-98MER7/D 6308080 431613 211.668 109-115 185.04 NR NR 08-Apr-98MER8/A 6307624 431590 213.037 21-27 203.39 NR NR 08-Apr-98MER8/B 6307624 431592 213.037 35-41 191.54 NR NR 08-Apr-98MER8/C 6307624 431594 213.060 52-64 185.30 NR NR 08-Apr-98MER8/D 6307624 431598 213.062 82.9-83.9 184.92 NR NR 08-Apr-98MER9/A 6305977 432495 229.546 23-29 201.07 NR NR 08-Apr-98MER9/B 6305977 432497 229.611 56-62 184.17 NR NR 08-Apr-98MER9/C 6305977 432498 229.599 97-99 182.28 NR NR 08-Apr-98MER9/D 6305977 432500 229.550 109-119 181.77 NR NR 08-Apr-98MER10/A 6307193 432405 217.618 14-20 204.68 NR NR 08-Apr-98MER10/B 6307194 432405 217.567 36-48 202.45 NR NR 08-Apr-98MER10/C 6307196 432405 217.644 111-123 184.25 NR NR 08-Apr-98MER10/D 6307198 432404 217.647 133-139 183.25 NR NR 08-Apr-98MER11/A 6305861 432056 237.370 8-14 223.65 NR NR 08-Apr-98MER11/B 6305862 432055 237.410 33-39 198.76 NR NR 08-Apr-98CRM-01/98 6311289 415932 186.666 7.2-10.2 183.50 130 5.7 08-Jun-98CRM-03/98 6311049 424078 190.656 11.4-14.4 185.99 3480 5.7 02-Jun-98CRM-04/98 6311311 426196 225.822 11.3-14.3 214.26 630 4.7 29-May-98CRM-05/98 6310634 414904 187.274 11.2-14.2 179.45 820 3.9 08-Jun-98CRM-06/98 6310872 417531 195.294 11-14 189.04 660 5.4 02-Jun-98CRM-07/98 6310154 423904 229.349 20.5-23.5 213.92 6080 5.6 08-Jun-98CRM-08/98 6310661 425080 214.161 8.3-11.3 205.22 330 4.9 02-Jun-98CRM-09/98 6310182 427497 228.127 15.6-18.6 216.60 1610 4.7 29-May-98CRM-10/98 6310231 430082 228.559 14.9-20.9 213.79 420 5.2 11-May-98CRM-11/98 6309523 418326 193.797 10-13 185.80 40 5.3 05-Jun-98CRM-12/98 6309736 421658 207.980 17.9-20.9 192.94 580 4.8 09-Jun-98CRM-13/98 6309301 425048 212.984 10-13 206.88 100 5.5 02-Jun-98CRM-15/98 6309776 430964 250.200 48.8-56.8 200.97 360 4.8 04-Jun-98CRM-17/98 6309220 415226 172.049 14.7-17.7 170.90 70 5.3 12-May-98CRM-19/98 6308659 418074 230.509 53.8-56.8 179.61 380 5.6 12-May-98CRM-20/98 6309053 421201 187.329 8.6-11.6 184.45 300 4.1 10-Jun-98CRM-21/98 6309004 426624 241.933 38.7-41.7 209.01 230 4.9 11-May-98CRM-22/98 6308004 417098 223.118 43.7-47.7 180.70 180 5.2 12-May-98CRM-23/98 6308023 419424 212.907 35.7-38.7 180.16 70 5.5 08-Jun-98CRM-24/98 6308264 422472 189.134 7.5-10.5 183.53 240 5.3 02-Jun-98CRM-25/98 6308178 427228 243.568 35.7-38.7 209.49 300 4.3 12-May-98CRM-27/98 6307059 418294 187.824 7.6-10.6 181.27 130 6.6 09-Jun-98CRM-28/98 6307483 421108 181.063 5.5-8.5 179.52 230 6.0 05-Jun-98CRM-30/98 6307322 428138 220.815 14.7-17.7 209.52 230 4.4 11-May-98CRM-31/98 6306939 433749 233.602 22-30 213.16 2100 3.8 04-Jun-98CRM-32/98 6306533 421710 189.818 9.3-12.3 183.37 170 5.4 18-May-98CRM-33/98 6306913 423025 193.467 10.3-13.3 187.27 180 6.0 05-Jun-98CRM-34/98 6306403 424708 228.891 41.7-44.7 189.07 580 5.2 25-May-98CRM-35/98 6306545 427188 212.923 17.5-20.5 198.72 150 5.4 22-May-98CRM-37/98 6305819 420992 179.724 5-8 178.98 410 6.3 14-May-98CRM-38/98 6305533 423708 199.169 26.7-29.7 185.17 140 5.5 09-Jun-98CRM-39/98 6305040 419939 200.438 9.5-12.5 195.45 160 5.1 14-May-98CRM-40/98 6305242 422005 180.142 5.5-8.5 176.88 150 5.2 13-May-98CRM-41/98 6305304 425957 218.317 32.7-35.7 188.11 210 5.6 25-May-98CRM-42/98 6305193 427689 196.589 4.7-7.7 191.77 400 5.3 26-May-98
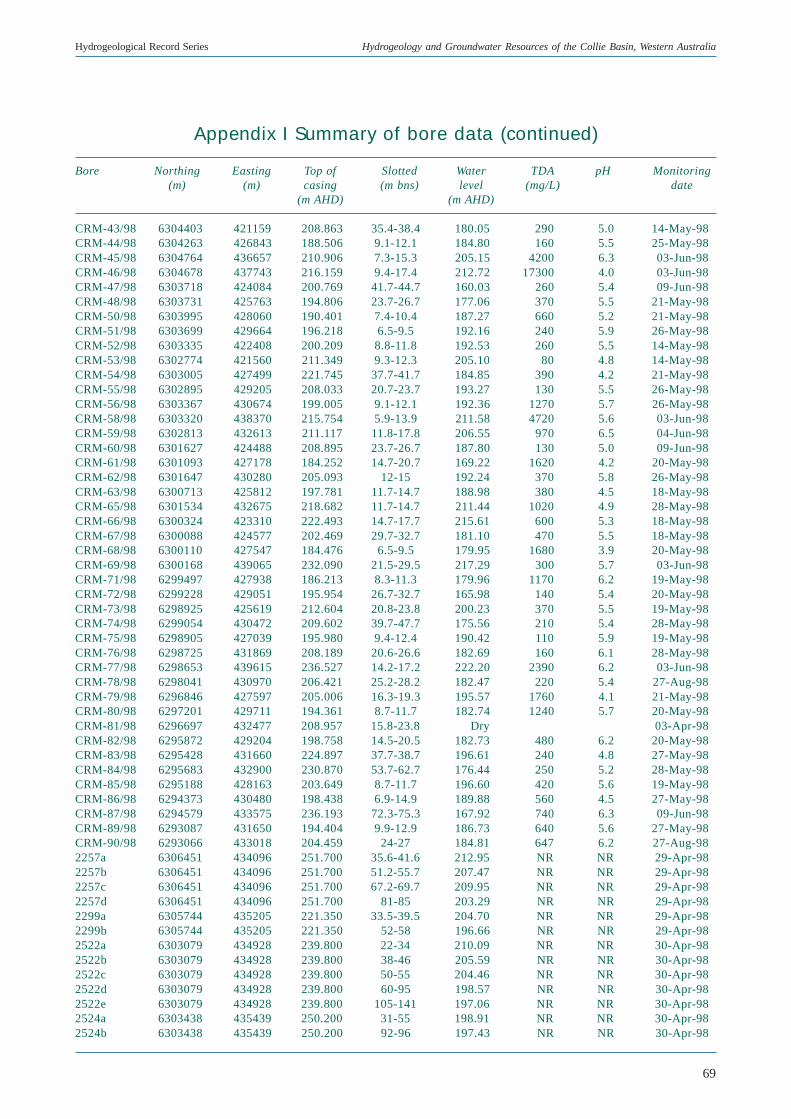
69
Hydrogeological Record Series Hydrogeology and Groundwater Resources of the Collie Basin, Western Australia
Appendix I Summary of bore data (continued)
Bore Northing Easting Top of Slotted Water TDA pH Monitoring(m) (m) casing (m bns) level (mg/L) date
(m AHD) (m AHD)
CRM-43/98 6304403 421159 208.863 35.4-38.4 180.05 290 5.0 14-May-98CRM-44/98 6304263 426843 188.506 9.1-12.1 184.80 160 5.5 25-May-98CRM-45/98 6304764 436657 210.906 7.3-15.3 205.15 4200 6.3 03-Jun-98CRM-46/98 6304678 437743 216.159 9.4-17.4 212.72 17300 4.0 03-Jun-98CRM-47/98 6303718 424084 200.769 41.7-44.7 160.03 260 5.4 09-Jun-98CRM-48/98 6303731 425763 194.806 23.7-26.7 177.06 370 5.5 21-May-98CRM-50/98 6303995 428060 190.401 7.4-10.4 187.27 660 5.2 21-May-98CRM-51/98 6303699 429664 196.218 6.5-9.5 192.16 240 5.9 26-May-98CRM-52/98 6303335 422408 200.209 8.8-11.8 192.53 260 5.5 14-May-98CRM-53/98 6302774 421560 211.349 9.3-12.3 205.10 80 4.8 14-May-98CRM-54/98 6303005 427499 221.745 37.7-41.7 184.85 390 4.2 21-May-98CRM-55/98 6302895 429205 208.033 20.7-23.7 193.27 130 5.5 26-May-98CRM-56/98 6303367 430674 199.005 9.1-12.1 192.36 1270 5.7 26-May-98CRM-58/98 6303320 438370 215.754 5.9-13.9 211.58 4720 5.6 03-Jun-98CRM-59/98 6302813 432613 211.117 11.8-17.8 206.55 970 6.5 04-Jun-98CRM-60/98 6301627 424488 208.895 23.7-26.7 187.80 130 5.0 09-Jun-98CRM-61/98 6301093 427178 184.252 14.7-20.7 169.22 1620 4.2 20-May-98CRM-62/98 6301647 430280 205.093 12-15 192.24 370 5.8 26-May-98CRM-63/98 6300713 425812 197.781 11.7-14.7 188.98 380 4.5 18-May-98CRM-65/98 6301534 432675 218.682 11.7-14.7 211.44 1020 4.9 28-May-98CRM-66/98 6300324 423310 222.493 14.7-17.7 215.61 600 5.3 18-May-98CRM-67/98 6300088 424577 202.469 29.7-32.7 181.10 470 5.5 18-May-98CRM-68/98 6300110 427547 184.476 6.5-9.5 179.95 1680 3.9 20-May-98CRM-69/98 6300168 439065 232.090 21.5-29.5 217.29 300 5.7 03-Jun-98CRM-71/98 6299497 427938 186.213 8.3-11.3 179.96 1170 6.2 19-May-98CRM-72/98 6299228 429051 195.954 26.7-32.7 165.98 140 5.4 20-May-98CRM-73/98 6298925 425619 212.604 20.8-23.8 200.23 370 5.5 19-May-98CRM-74/98 6299054 430472 209.602 39.7-47.7 175.56 210 5.4 28-May-98CRM-75/98 6298905 427039 195.980 9.4-12.4 190.42 110 5.9 19-May-98CRM-76/98 6298725 431869 208.189 20.6-26.6 182.69 160 6.1 28-May-98CRM-77/98 6298653 439615 236.527 14.2-17.2 222.20 2390 6.2 03-Jun-98CRM-78/98 6298041 430970 206.421 25.2-28.2 182.47 220 5.4 27-Aug-98CRM-79/98 6296846 427597 205.006 16.3-19.3 195.57 1760 4.1 21-May-98CRM-80/98 6297201 429711 194.361 8.7-11.7 182.74 1240 5.7 20-May-98CRM-81/98 6296697 432477 208.957 15.8-23.8 Dry 03-Apr-98CRM-82/98 6295872 429204 198.758 14.5-20.5 182.73 480 6.2 20-May-98CRM-83/98 6295428 431660 224.897 37.7-38.7 196.61 240 4.8 27-May-98CRM-84/98 6295683 432900 230.870 53.7-62.7 176.44 250 5.2 28-May-98CRM-85/98 6295188 428163 203.649 8.7-11.7 196.60 420 5.6 19-May-98CRM-86/98 6294373 430480 198.438 6.9-14.9 189.88 560 4.5 27-May-98CRM-87/98 6294579 433575 236.193 72.3-75.3 167.92 740 6.3 09-Jun-98CRM-89/98 6293087 431650 194.404 9.9-12.9 186.73 640 5.6 27-May-98CRM-90/98 6293066 433018 204.459 24-27 184.81 647 6.2 27-Aug-982257a 6306451 434096 251.700 35.6-41.6 212.95 NR NR 29-Apr-982257b 6306451 434096 251.700 51.2-55.7 207.47 NR NR 29-Apr-982257c 6306451 434096 251.700 67.2-69.7 209.95 NR NR 29-Apr-982257d 6306451 434096 251.700 81-85 203.29 NR NR 29-Apr-982299a 6305744 435205 221.350 33.5-39.5 204.70 NR NR 29-Apr-982299b 6305744 435205 221.350 52-58 196.66 NR NR 29-Apr-982522a 6303079 434928 239.800 22-34 210.09 NR NR 30-Apr-982522b 6303079 434928 239.800 38-46 205.59 NR NR 30-Apr-982522c 6303079 434928 239.800 50-55 204.46 NR NR 30-Apr-982522d 6303079 434928 239.800 60-95 198.57 NR NR 30-Apr-982522e 6303079 434928 239.800 105-141 197.06 NR NR 30-Apr-982524a 6303438 435439 250.200 31-55 198.91 NR NR 30-Apr-982524b 6303438 435439 250.200 92-96 197.43 NR NR 30-Apr-98
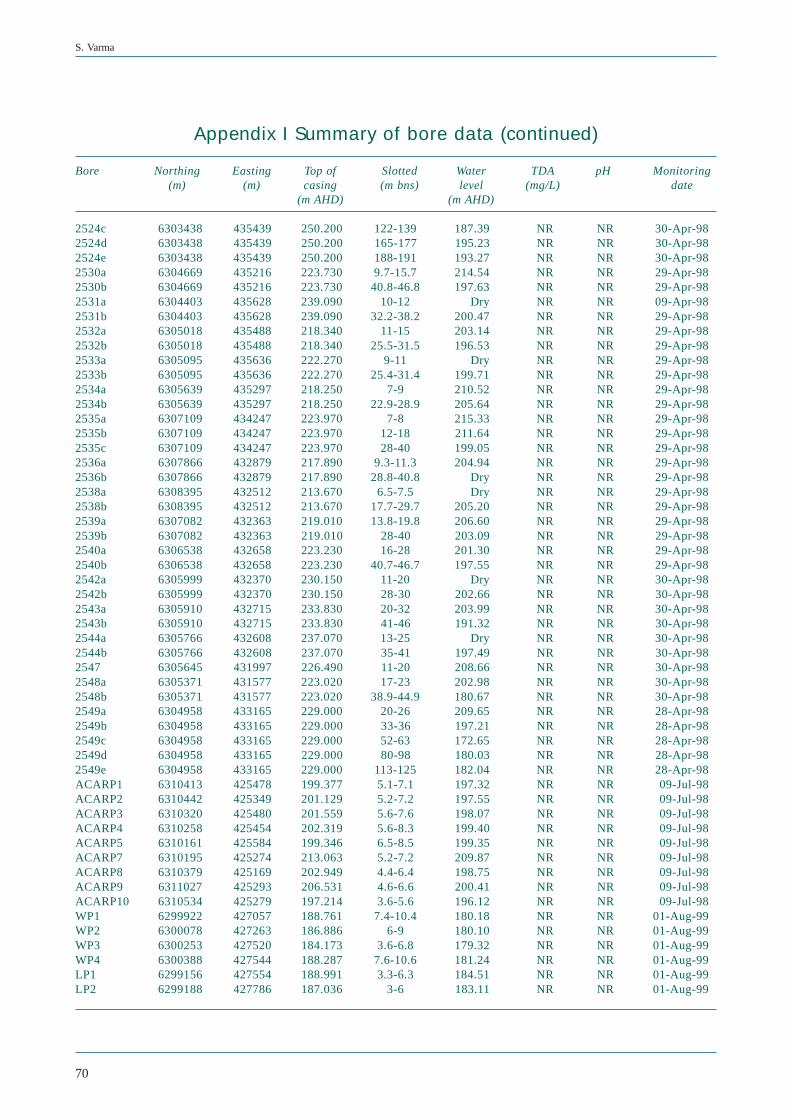
70
S. Varma
Appendix I Summary of bore data (continued)
Bore Northing Easting Top of Slotted Water TDA pH Monitoring(m) (m) casing (m bns) level (mg/L) date
(m AHD) (m AHD)
2524c 6303438 435439 250.200 122-139 187.39 NR NR 30-Apr-982524d 6303438 435439 250.200 165-177 195.23 NR NR 30-Apr-982524e 6303438 435439 250.200 188-191 193.27 NR NR 30-Apr-982530a 6304669 435216 223.730 9.7-15.7 214.54 NR NR 29-Apr-982530b 6304669 435216 223.730 40.8-46.8 197.63 NR NR 29-Apr-982531a 6304403 435628 239.090 10-12 Dry NR NR 09-Apr-982531b 6304403 435628 239.090 32.2-38.2 200.47 NR NR 29-Apr-982532a 6305018 435488 218.340 11-15 203.14 NR NR 29-Apr-982532b 6305018 435488 218.340 25.5-31.5 196.53 NR NR 29-Apr-982533a 6305095 435636 222.270 9-11 Dry NR NR 29-Apr-982533b 6305095 435636 222.270 25.4-31.4 199.71 NR NR 29-Apr-982534a 6305639 435297 218.250 7-9 210.52 NR NR 29-Apr-982534b 6305639 435297 218.250 22.9-28.9 205.64 NR NR 29-Apr-982535a 6307109 434247 223.970 7-8 215.33 NR NR 29-Apr-982535b 6307109 434247 223.970 12-18 211.64 NR NR 29-Apr-982535c 6307109 434247 223.970 28-40 199.05 NR NR 29-Apr-982536a 6307866 432879 217.890 9.3-11.3 204.94 NR NR 29-Apr-982536b 6307866 432879 217.890 28.8-40.8 Dry NR NR 29-Apr-982538a 6308395 432512 213.670 6.5-7.5 Dry NR NR 29-Apr-982538b 6308395 432512 213.670 17.7-29.7 205.20 NR NR 29-Apr-982539a 6307082 432363 219.010 13.8-19.8 206.60 NR NR 29-Apr-982539b 6307082 432363 219.010 28-40 203.09 NR NR 29-Apr-982540a 6306538 432658 223.230 16-28 201.30 NR NR 29-Apr-982540b 6306538 432658 223.230 40.7-46.7 197.55 NR NR 29-Apr-982542a 6305999 432370 230.150 11-20 Dry NR NR 30-Apr-982542b 6305999 432370 230.150 28-30 202.66 NR NR 30-Apr-982543a 6305910 432715 233.830 20-32 203.99 NR NR 30-Apr-982543b 6305910 432715 233.830 41-46 191.32 NR NR 30-Apr-982544a 6305766 432608 237.070 13-25 Dry NR NR 30-Apr-982544b 6305766 432608 237.070 35-41 197.49 NR NR 30-Apr-982547 6305645 431997 226.490 11-20 208.66 NR NR 30-Apr-982548a 6305371 431577 223.020 17-23 202.98 NR NR 30-Apr-982548b 6305371 431577 223.020 38.9-44.9 180.67 NR NR 30-Apr-982549a 6304958 433165 229.000 20-26 209.65 NR NR 28-Apr-982549b 6304958 433165 229.000 33-36 197.21 NR NR 28-Apr-982549c 6304958 433165 229.000 52-63 172.65 NR NR 28-Apr-982549d 6304958 433165 229.000 80-98 180.03 NR NR 28-Apr-982549e 6304958 433165 229.000 113-125 182.04 NR NR 28-Apr-98ACARP1 6310413 425478 199.377 5.1-7.1 197.32 NR NR 09-Jul-98ACARP2 6310442 425349 201.129 5.2-7.2 197.55 NR NR 09-Jul-98ACARP3 6310320 425480 201.559 5.6-7.6 198.07 NR NR 09-Jul-98ACARP4 6310258 425454 202.319 5.6-8.3 199.40 NR NR 09-Jul-98ACARP5 6310161 425584 199.346 6.5-8.5 199.35 NR NR 09-Jul-98ACARP7 6310195 425274 213.063 5.2-7.2 209.87 NR NR 09-Jul-98ACARP8 6310379 425169 202.949 4.4-6.4 198.75 NR NR 09-Jul-98ACARP9 6311027 425293 206.531 4.6-6.6 200.41 NR NR 09-Jul-98ACARP10 6310534 425279 197.214 3.6-5.6 196.12 NR NR 09-Jul-98WP1 6299922 427057 188.761 7.4-10.4 180.18 NR NR 01-Aug-99WP2 6300078 427263 186.886 6-9 180.10 NR NR 01-Aug-99WP3 6300253 427520 184.173 3.6-6.8 179.32 NR NR 01-Aug-99WP4 6300388 427544 188.287 7.6-10.6 181.24 NR NR 01-Aug-99LP1 6299156 427554 188.991 3.3-6.3 184.51 NR NR 01-Aug-99LP2 6299188 427786 187.036 3-6 183.11 NR NR 01-Aug-99
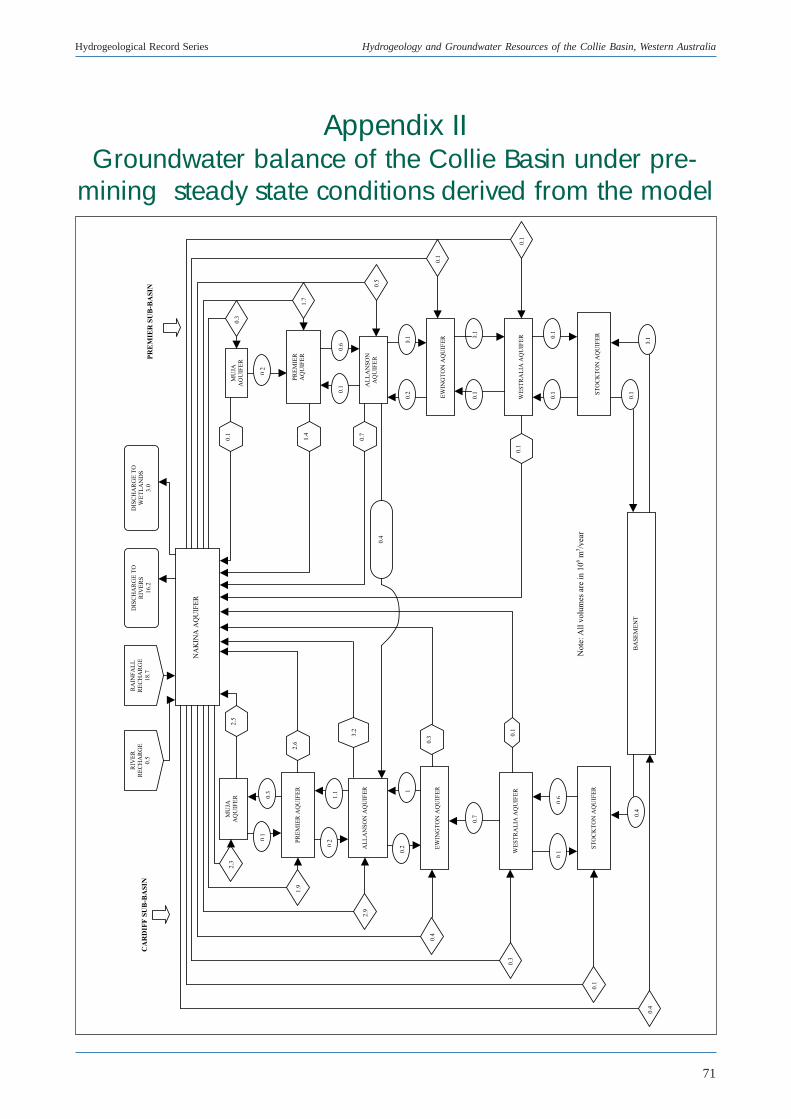
71
Hydrogeological Record Series Hydrogeology and Groundwater Resources of the Collie Basin, Western Australia
Appendix IIGroundwater balance of the Collie Basin under pre-
mining steady state conditions derived from the model
2.6
E
WIN
GT
ON
AQ
UIF
ER
W
ES
TR
AL
IA A
QU
IFE
R
S
TO
CK
TO
N A
QU
IFE
R
PR
EM
IE
R S
UB
-BA
SIN
MU
JA
AQ
UIF
ER
PR
EM
IER
AQ
UIF
ER
AL
LA
NS
ON
AQ
UIF
ER
0.6
0.1
0.2
0.1
0.1
0.7
0.1 1.4
0.1
0.1
0.1
0.1
0.1
0.1
0.2
0.4
0.3
1.7
0.5
0.1
0.1
DIS
CH
AR
GE
TO
WE
TL
AN
DS
3.0
A
LL
AN
SO
N A
QU
IFE
R
E
WIN
GT
ON
AQ
UIF
ER
W
ES
TR
AL
IA A
QU
IFE
R
S
TO
CK
TO
N A
QU
IFE
R
BA
SE
ME
NT
0.4
0.3
0.1
0.4
0.3
0.2
1
0.7
0.1
0.6
0.4
P
RE
MIE
R A
QU
IFE
R
1.9
2.9
0.3
1.1
0.2
0.1
N
AK
INA
AQ
UIF
ER
CA
RD
IF
F S
UB
-BA
SIN
MU
JA
AQ
UIF
ER
2.3
2.5
RA
INF
AL
L
RE
CH
AR
GE
18.7
RIV
ER
RE
CH
AR
GE
0.5
DIS
CH
AR
GE
TO
RIV
ER
S
16.2
No
te:
All
vo
lum
es a
re i
n 1
06 m
3/y
ear
3.2
0.1
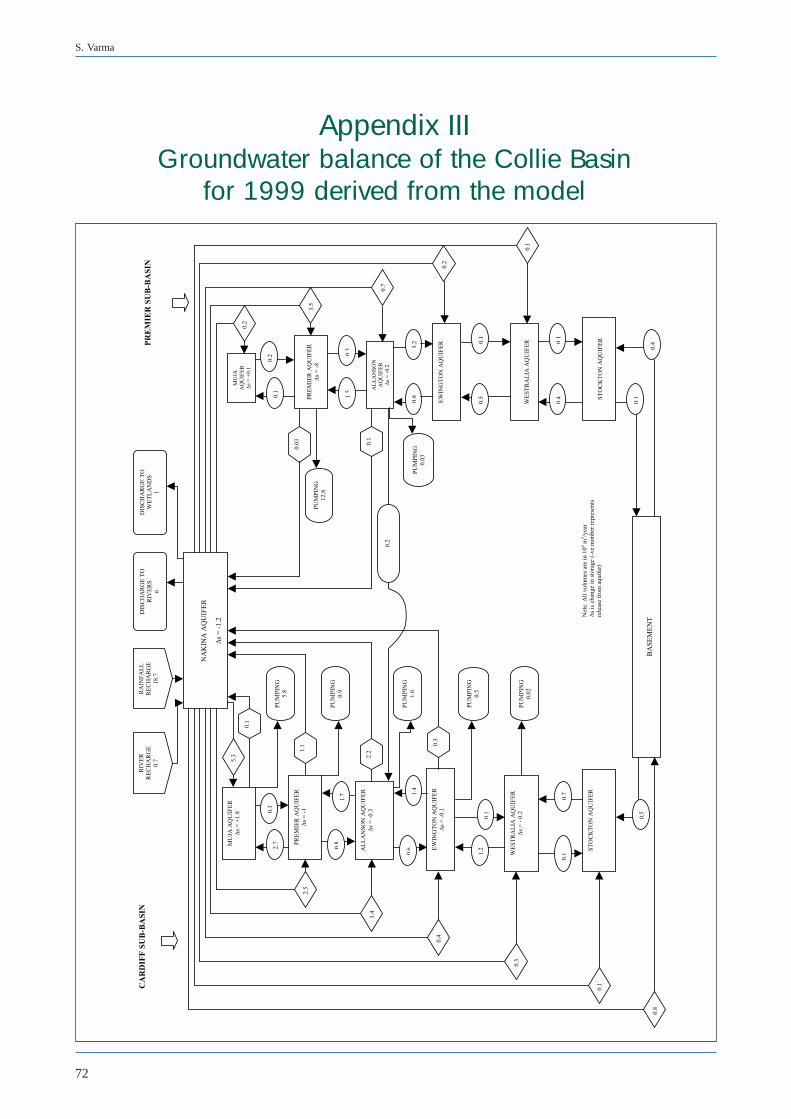
72
S. Varma
Appendix IIIGroundwater balance of the Collie Basin
for 1999 derived from the model
PU
MP
ING
0.5
PU
MP
ING
0.0
3
EW
ING
TO
N A
QU
IFE
R
s =
-0
.1
N
AK
INA
AQ
UIF
ER
s =
-1
.2
PR
EM
IER
AQ
UIF
ER
s =
-1
AL
LA
NS
ON
AQ
UIF
ER
s =
-0
.3
WE
ST
RA
LIA
AQ
UIF
ER
s =
- 0
.2
ST
OC
KT
ON
AQ
UIF
ER
CA
RD
IF
F S
UB
-BA
SIN
P
RE
MIE
R S
UB
-BA
SIN
MU
JA
AQ
UIF
ER
s =
+0.1
PR
EM
IER
AQ
UIF
ER
s =
-8
AL
LA
NS
ON
AQ
UIF
ER
s =
-0
.2
EW
ING
TO
N A
QU
IFE
R
W
ES
TR
AL
IA A
QU
IFE
R
S
TO
CK
TO
N A
QU
IFE
R
0.3
1.5
0.2
0.2
BA
SE
ME
NT
MU
JA A
QU
IFE
R
s =
+1
.8
5.3
2.5
3.4
0.4
0.3
0.1
0.8
1.1
2.2
0.3
0.1
0.1
0.0
3
0.1
0.4
0.4
0.1
0.5
0.1
0.8
0.2
2.7
1.7
0.8
0.6
1.4
1.2
0.1
0.7
0.5
RA
INF
AL
L
RE
CH
AR
GE
18.7
RIV
ER
RE
CH
AR
GE
0.7
0.2
3.5
0.7
0.2
0.1
DIS
CH
AR
GE
TO
RIV
ER
S
6
DIS
CH
AR
GE
TO
WE
TL
AN
DS
1
PU
MP
ING
5.8
0.3
PU
MP
ING
0.9
PU
MP
ING
1.6
PU
MP
ING
0.0
2
0.1
0.1
PU
MP
ING
12.8
No
te:
All
vo
lum
es a
re i
n 1
06 m
3/y
ear
s is
ch
ang
e in
sto
rag
e (-
ve
nu
mb
er r
epre
sen
ts
rele
ase
fro
m a
qu
ifer
)
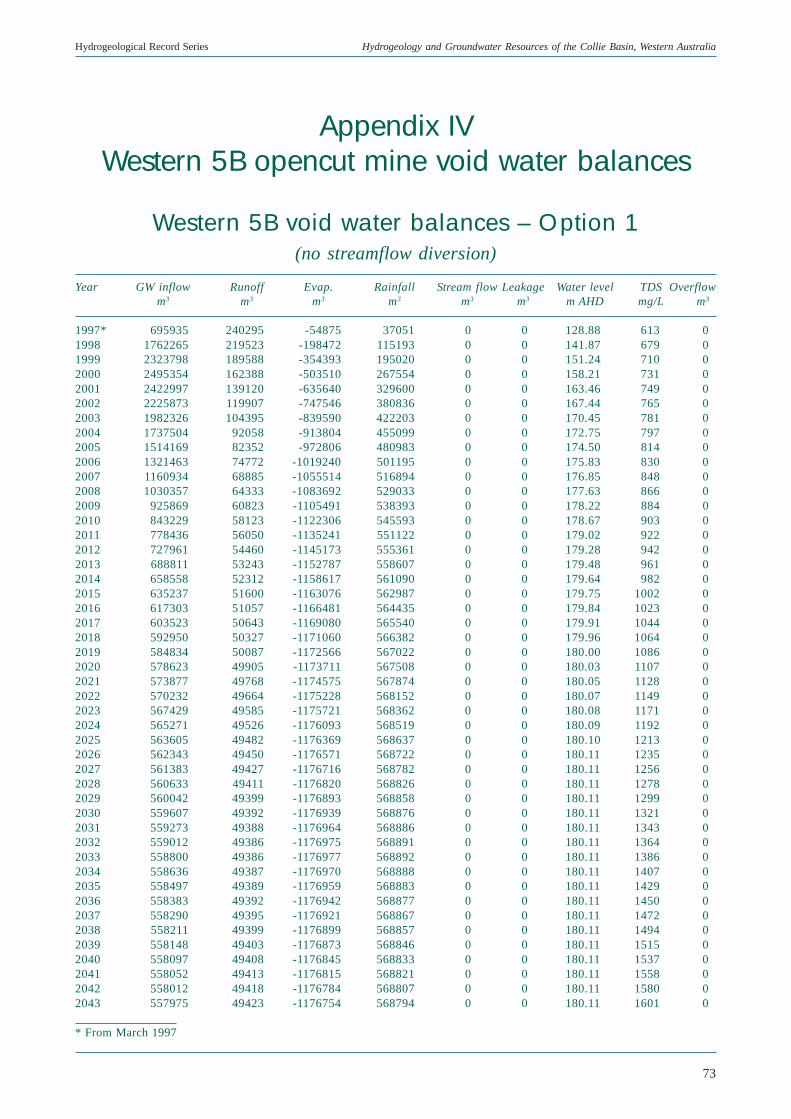
73
Hydrogeological Record Series Hydrogeology and Groundwater Resources of the Collie Basin, Western Australia
Western 5B void water balances – Option 1(no streamflow diversion)
Year GW inflow Runoff Evap. Rainfall Stream flow Leakage Water level TDS Overflowm3 m3 m3 m3 m3 m3 m AHD mg/L m3
1997* 695935 240295 -54875 37051 0 0 128.88 613 01998 1762265 219523 -198472 115193 0 0 141.87 679 01999 2323798 189588 -354393 195020 0 0 151.24 710 02000 2495354 162388 -503510 267554 0 0 158.21 731 02001 2422997 139120 -635640 329600 0 0 163.46 749 02002 2225873 119907 -747546 380836 0 0 167.44 765 02003 1982326 104395 -839590 422203 0 0 170.45 781 02004 1737504 92058 -913804 455099 0 0 172.75 797 02005 1514169 82352 -972806 480983 0 0 174.50 814 02006 1321463 74772 -1019240 501195 0 0 175.83 830 02007 1160934 68885 -1055514 516894 0 0 176.85 848 02008 1030357 64333 -1083692 529033 0 0 177.63 866 02009 925869 60823 -1105491 538393 0 0 178.22 884 02010 843229 58123 -1122306 545593 0 0 178.67 903 02011 778436 56050 -1135241 551122 0 0 179.02 922 02012 727961 54460 -1145173 555361 0 0 179.28 942 02013 688811 53243 -1152787 558607 0 0 179.48 961 02014 658558 52312 -1158617 561090 0 0 179.64 982 02015 635237 51600 -1163076 562987 0 0 179.75 1002 02016 617303 51057 -1166481 564435 0 0 179.84 1023 02017 603523 50643 -1169080 565540 0 0 179.91 1044 02018 592950 50327 -1171060 566382 0 0 179.96 1064 02019 584834 50087 -1172566 567022 0 0 180.00 1086 02020 578623 49905 -1173711 567508 0 0 180.03 1107 02021 573877 49768 -1174575 567874 0 0 180.05 1128 02022 570232 49664 -1175228 568152 0 0 180.07 1149 02023 567429 49585 -1175721 568362 0 0 180.08 1171 02024 565271 49526 -1176093 568519 0 0 180.09 1192 02025 563605 49482 -1176369 568637 0 0 180.10 1213 02026 562343 49450 -1176571 568722 0 0 180.11 1235 02027 561383 49427 -1176716 568782 0 0 180.11 1256 02028 560633 49411 -1176820 568826 0 0 180.11 1278 02029 560042 49399 -1176893 568858 0 0 180.11 1299 02030 559607 49392 -1176939 568876 0 0 180.11 1321 02031 559273 49388 -1176964 568886 0 0 180.11 1343 02032 559012 49386 -1176975 568891 0 0 180.11 1364 02033 558800 49386 -1176977 568892 0 0 180.11 1386 02034 558636 49387 -1176970 568888 0 0 180.11 1407 02035 558497 49389 -1176959 568883 0 0 180.11 1429 02036 558383 49392 -1176942 568877 0 0 180.11 1450 02037 558290 49395 -1176921 568867 0 0 180.11 1472 02038 558211 49399 -1176899 568857 0 0 180.11 1494 02039 558148 49403 -1176873 568846 0 0 180.11 1515 02040 558097 49408 -1176845 568833 0 0 180.11 1537 02041 558052 49413 -1176815 568821 0 0 180.11 1558 02042 558012 49418 -1176784 568807 0 0 180.11 1580 02043 557975 49423 -1176754 568794 0 0 180.11 1601 0
* From March 1997
Appendix IVWestern 5B opencut mine void water balances
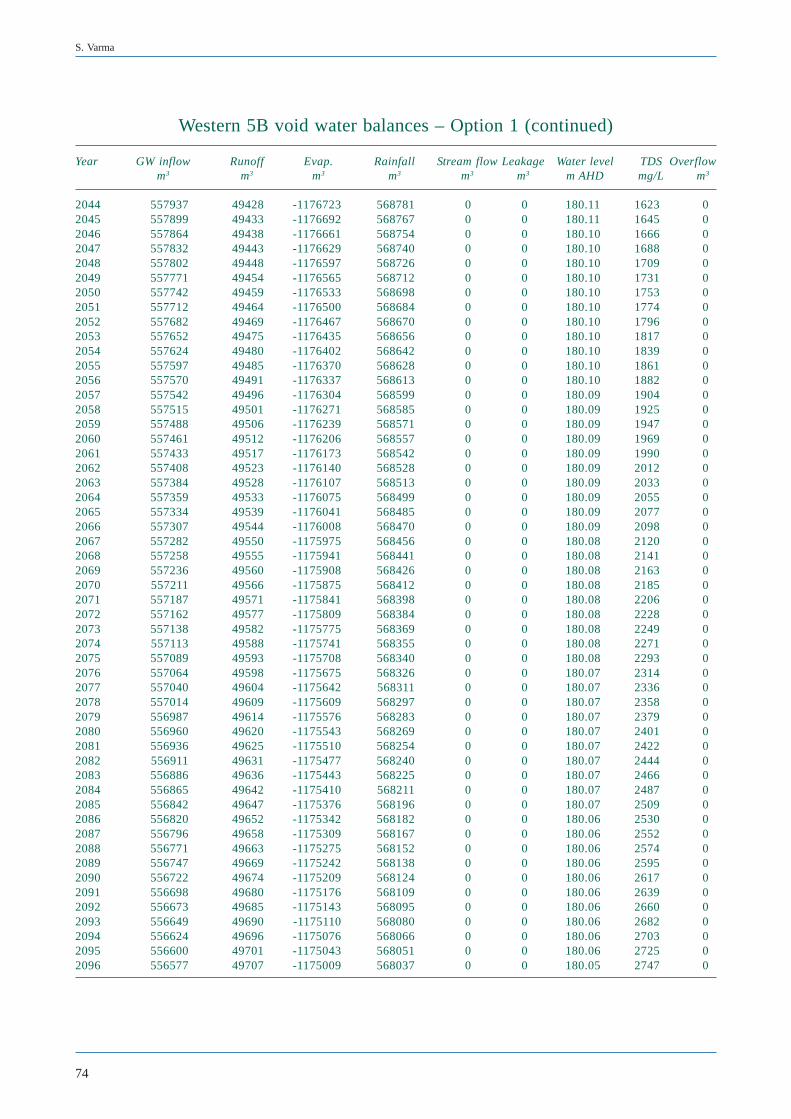
74
S. Varma
Western 5B void water balances – Option 1 (continued)
Year GW inflow Runoff Evap. Rainfall Stream flow Leakage Water level TDS Overflowm3 m3 m3 m3 m3 m3 m AHD mg/L m3
2044 557937 49428 -1176723 568781 0 0 180.11 1623 02045 557899 49433 -1176692 568767 0 0 180.11 1645 02046 557864 49438 -1176661 568754 0 0 180.10 1666 02047 557832 49443 -1176629 568740 0 0 180.10 1688 02048 557802 49448 -1176597 568726 0 0 180.10 1709 02049 557771 49454 -1176565 568712 0 0 180.10 1731 02050 557742 49459 -1176533 568698 0 0 180.10 1753 02051 557712 49464 -1176500 568684 0 0 180.10 1774 02052 557682 49469 -1176467 568670 0 0 180.10 1796 02053 557652 49475 -1176435 568656 0 0 180.10 1817 02054 557624 49480 -1176402 568642 0 0 180.10 1839 02055 557597 49485 -1176370 568628 0 0 180.10 1861 02056 557570 49491 -1176337 568613 0 0 180.10 1882 02057 557542 49496 -1176304 568599 0 0 180.09 1904 02058 557515 49501 -1176271 568585 0 0 180.09 1925 02059 557488 49506 -1176239 568571 0 0 180.09 1947 02060 557461 49512 -1176206 568557 0 0 180.09 1969 02061 557433 49517 -1176173 568542 0 0 180.09 1990 02062 557408 49523 -1176140 568528 0 0 180.09 2012 02063 557384 49528 -1176107 568513 0 0 180.09 2033 02064 557359 49533 -1176075 568499 0 0 180.09 2055 02065 557334 49539 -1176041 568485 0 0 180.09 2077 02066 557307 49544 -1176008 568470 0 0 180.09 2098 02067 557282 49550 -1175975 568456 0 0 180.08 2120 02068 557258 49555 -1175941 568441 0 0 180.08 2141 02069 557236 49560 -1175908 568426 0 0 180.08 2163 02070 557211 49566 -1175875 568412 0 0 180.08 2185 02071 557187 49571 -1175841 568398 0 0 180.08 2206 02072 557162 49577 -1175809 568384 0 0 180.08 2228 02073 557138 49582 -1175775 568369 0 0 180.08 2249 02074 557113 49588 -1175741 568355 0 0 180.08 2271 02075 557089 49593 -1175708 568340 0 0 180.08 2293 02076 557064 49598 -1175675 568326 0 0 180.07 2314 02077 557040 49604 -1175642 568311 0 0 180.07 2336 02078 557014 49609 -1175609 568297 0 0 180.07 2358 02079 556987 49614 -1175576 568283 0 0 180.07 2379 02080 556960 49620 -1175543 568269 0 0 180.07 2401 02081 556936 49625 -1175510 568254 0 0 180.07 2422 02082 556911 49631 -1175477 568240 0 0 180.07 2444 02083 556886 49636 -1175443 568225 0 0 180.07 2466 02084 556865 49642 -1175410 568211 0 0 180.07 2487 02085 556842 49647 -1175376 568196 0 0 180.07 2509 02086 556820 49652 -1175342 568182 0 0 180.06 2530 02087 556796 49658 -1175309 568167 0 0 180.06 2552 02088 556771 49663 -1175275 568152 0 0 180.06 2574 02089 556747 49669 -1175242 568138 0 0 180.06 2595 02090 556722 49674 -1175209 568124 0 0 180.06 2617 02091 556698 49680 -1175176 568109 0 0 180.06 2639 02092 556673 49685 -1175143 568095 0 0 180.06 2660 02093 556649 49690 -1175110 568080 0 0 180.06 2682 02094 556624 49696 -1175076 568066 0 0 180.06 2703 02095 556600 49701 -1175043 568051 0 0 180.06 2725 02096 556577 49707 -1175009 568037 0 0 180.05 2747 0
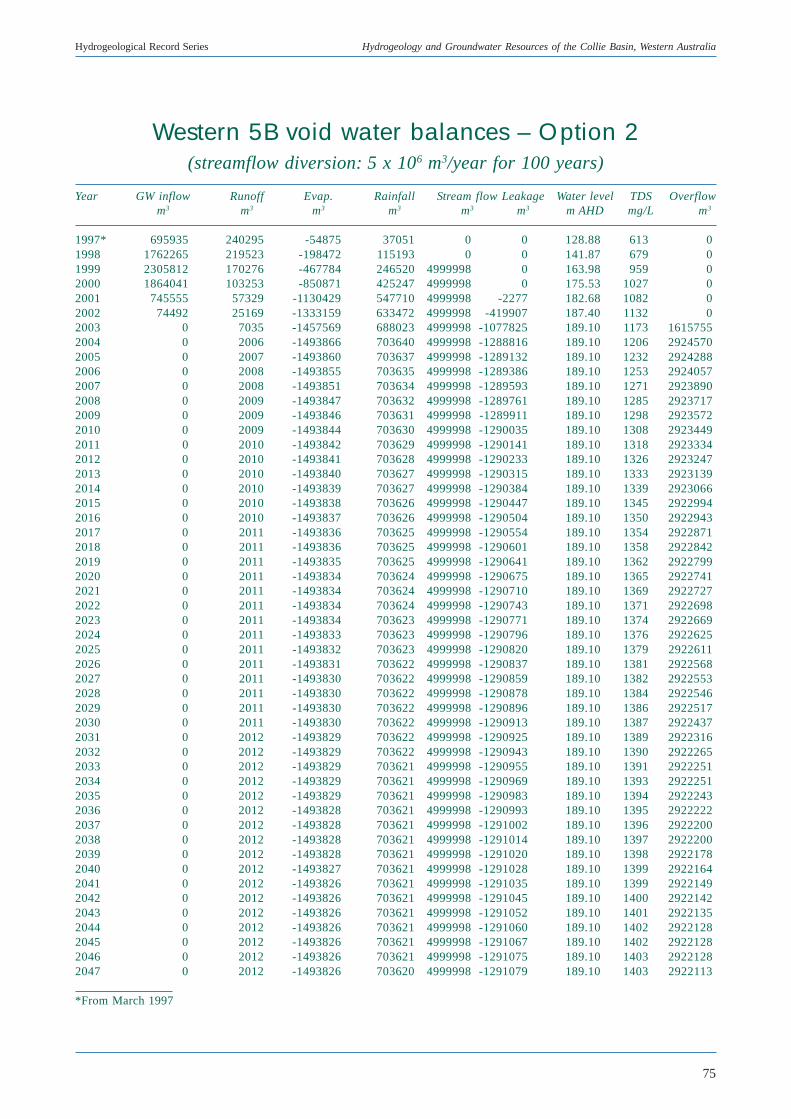
75
Hydrogeological Record Series Hydrogeology and Groundwater Resources of the Collie Basin, Western Australia
Western 5B void water balances – Option 2(streamflow diversion: 5 x 10⁶ m3/year for 100 years)
Year GW inflow Runoff Evap. Rainfall Stream flow Leakage Water level TDS Overflowm3 m3 m3 m3 m3 m3 m AHD mg/L m3
1997* 695935 240295 -54875 37051 0 0 128.88 613 01998 1762265 219523 -198472 115193 0 0 141.87 679 01999 2305812 170276 -467784 246520 4999998 0 163.98 959 02000 1864041 103253 -850871 425247 4999998 0 175.53 1027 02001 745555 57329 -1130429 547710 4999998 -2277 182.68 1082 02002 74492 25169 -1333159 633472 4999998 -419907 187.40 1132 02003 0 7035 -1457569 688023 4999998 -1077825 189.10 1173 16157552004 0 2006 -1493866 703640 4999998 -1288816 189.10 1206 29245702005 0 2007 -1493860 703637 4999998 -1289132 189.10 1232 29242882006 0 2008 -1493855 703635 4999998 -1289386 189.10 1253 29240572007 0 2008 -1493851 703634 4999998 -1289593 189.10 1271 29238902008 0 2009 -1493847 703632 4999998 -1289761 189.10 1285 29237172009 0 2009 -1493846 703631 4999998 -1289911 189.10 1298 29235722010 0 2009 -1493844 703630 4999998 -1290035 189.10 1308 29234492011 0 2010 -1493842 703629 4999998 -1290141 189.10 1318 29233342012 0 2010 -1493841 703628 4999998 -1290233 189.10 1326 29232472013 0 2010 -1493840 703627 4999998 -1290315 189.10 1333 29231392014 0 2010 -1493839 703627 4999998 -1290384 189.10 1339 29230662015 0 2010 -1493838 703626 4999998 -1290447 189.10 1345 29229942016 0 2010 -1493837 703626 4999998 -1290504 189.10 1350 29229432017 0 2011 -1493836 703625 4999998 -1290554 189.10 1354 29228712018 0 2011 -1493836 703625 4999998 -1290601 189.10 1358 29228422019 0 2011 -1493835 703625 4999998 -1290641 189.10 1362 29227992020 0 2011 -1493834 703624 4999998 -1290675 189.10 1365 29227412021 0 2011 -1493834 703624 4999998 -1290710 189.10 1369 29227272022 0 2011 -1493834 703624 4999998 -1290743 189.10 1371 29226982023 0 2011 -1493834 703623 4999998 -1290771 189.10 1374 29226692024 0 2011 -1493833 703623 4999998 -1290796 189.10 1376 29226252025 0 2011 -1493832 703623 4999998 -1290820 189.10 1379 29226112026 0 2011 -1493831 703622 4999998 -1290837 189.10 1381 29225682027 0 2011 -1493830 703622 4999998 -1290859 189.10 1382 29225532028 0 2011 -1493830 703622 4999998 -1290878 189.10 1384 29225462029 0 2011 -1493830 703622 4999998 -1290896 189.10 1386 29225172030 0 2011 -1493830 703622 4999998 -1290913 189.10 1387 29224372031 0 2012 -1493829 703622 4999998 -1290925 189.10 1389 29223162032 0 2012 -1493829 703622 4999998 -1290943 189.10 1390 29222652033 0 2012 -1493829 703621 4999998 -1290955 189.10 1391 29222512034 0 2012 -1493829 703621 4999998 -1290969 189.10 1393 29222512035 0 2012 -1493829 703621 4999998 -1290983 189.10 1394 29222432036 0 2012 -1493828 703621 4999998 -1290993 189.10 1395 29222222037 0 2012 -1493828 703621 4999998 -1291002 189.10 1396 29222002038 0 2012 -1493828 703621 4999998 -1291014 189.10 1397 29222002039 0 2012 -1493828 703621 4999998 -1291020 189.10 1398 29221782040 0 2012 -1493827 703621 4999998 -1291028 189.10 1399 29221642041 0 2012 -1493826 703621 4999998 -1291035 189.10 1399 29221492042 0 2012 -1493826 703621 4999998 -1291045 189.10 1400 29221422043 0 2012 -1493826 703621 4999998 -1291052 189.10 1401 29221352044 0 2012 -1493826 703621 4999998 -1291060 189.10 1402 29221282045 0 2012 -1493826 703621 4999998 -1291067 189.10 1402 29221282046 0 2012 -1493826 703621 4999998 -1291075 189.10 1403 29221282047 0 2012 -1493826 703620 4999998 -1291079 189.10 1403 2922113
*From March 1997
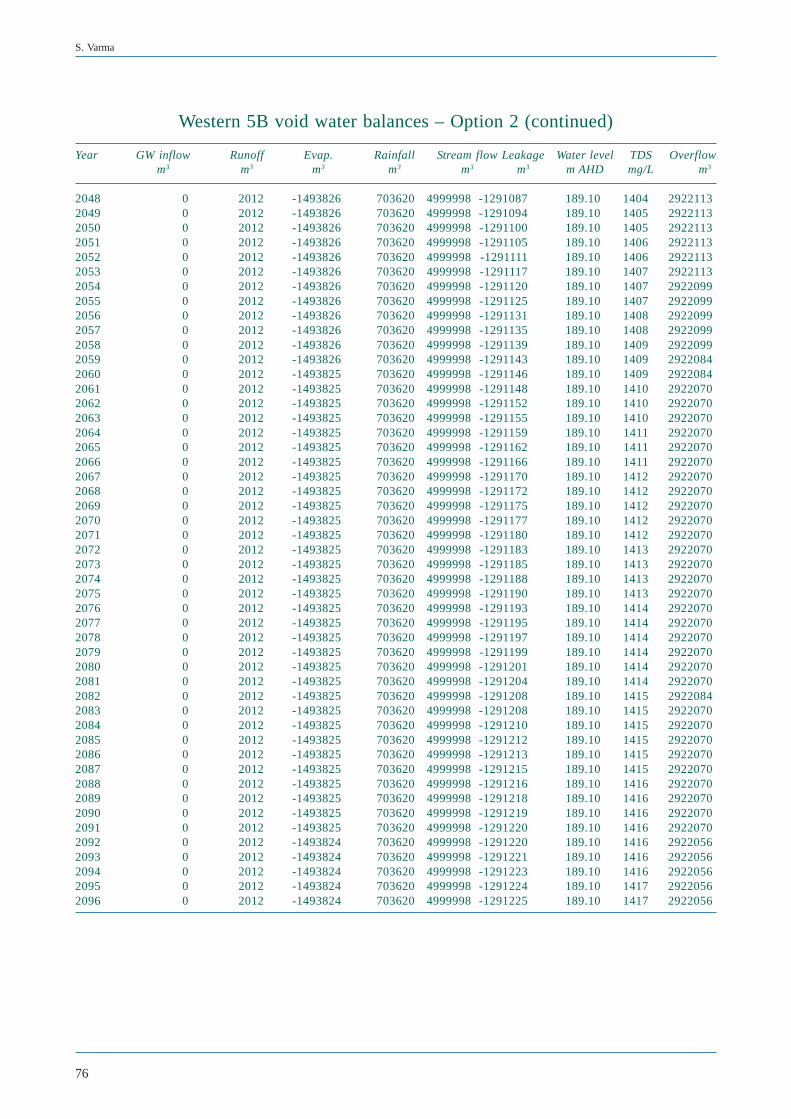
76
S. Varma
Western 5B void water balances – Option 2 (continued)
Year GW inflow Runoff Evap. Rainfall Stream flow Leakage Water level TDS Overflowm3 m3 m3 m3 m3 m3 m AHD mg/L m3
2048 0 2012 -1493826 703620 4999998 -1291087 189.10 1404 29221132049 0 2012 -1493826 703620 4999998 -1291094 189.10 1405 29221132050 0 2012 -1493826 703620 4999998 -1291100 189.10 1405 29221132051 0 2012 -1493826 703620 4999998 -1291105 189.10 1406 29221132052 0 2012 -1493826 703620 4999998 -1291111 189.10 1406 29221132053 0 2012 -1493826 703620 4999998 -1291117 189.10 1407 29221132054 0 2012 -1493826 703620 4999998 -1291120 189.10 1407 29220992055 0 2012 -1493826 703620 4999998 -1291125 189.10 1407 29220992056 0 2012 -1493826 703620 4999998 -1291131 189.10 1408 29220992057 0 2012 -1493826 703620 4999998 -1291135 189.10 1408 29220992058 0 2012 -1493826 703620 4999998 -1291139 189.10 1409 29220992059 0 2012 -1493826 703620 4999998 -1291143 189.10 1409 29220842060 0 2012 -1493825 703620 4999998 -1291146 189.10 1409 29220842061 0 2012 -1493825 703620 4999998 -1291148 189.10 1410 29220702062 0 2012 -1493825 703620 4999998 -1291152 189.10 1410 29220702063 0 2012 -1493825 703620 4999998 -1291155 189.10 1410 29220702064 0 2012 -1493825 703620 4999998 -1291159 189.10 1411 29220702065 0 2012 -1493825 703620 4999998 -1291162 189.10 1411 29220702066 0 2012 -1493825 703620 4999998 -1291166 189.10 1411 29220702067 0 2012 -1493825 703620 4999998 -1291170 189.10 1412 29220702068 0 2012 -1493825 703620 4999998 -1291172 189.10 1412 29220702069 0 2012 -1493825 703620 4999998 -1291175 189.10 1412 29220702070 0 2012 -1493825 703620 4999998 -1291177 189.10 1412 29220702071 0 2012 -1493825 703620 4999998 -1291180 189.10 1412 29220702072 0 2012 -1493825 703620 4999998 -1291183 189.10 1413 29220702073 0 2012 -1493825 703620 4999998 -1291185 189.10 1413 29220702074 0 2012 -1493825 703620 4999998 -1291188 189.10 1413 29220702075 0 2012 -1493825 703620 4999998 -1291190 189.10 1413 29220702076 0 2012 -1493825 703620 4999998 -1291193 189.10 1414 29220702077 0 2012 -1493825 703620 4999998 -1291195 189.10 1414 29220702078 0 2012 -1493825 703620 4999998 -1291197 189.10 1414 29220702079 0 2012 -1493825 703620 4999998 -1291199 189.10 1414 29220702080 0 2012 -1493825 703620 4999998 -1291201 189.10 1414 29220702081 0 2012 -1493825 703620 4999998 -1291204 189.10 1414 29220702082 0 2012 -1493825 703620 4999998 -1291208 189.10 1415 29220842083 0 2012 -1493825 703620 4999998 -1291208 189.10 1415 29220702084 0 2012 -1493825 703620 4999998 -1291210 189.10 1415 29220702085 0 2012 -1493825 703620 4999998 -1291212 189.10 1415 29220702086 0 2012 -1493825 703620 4999998 -1291213 189.10 1415 29220702087 0 2012 -1493825 703620 4999998 -1291215 189.10 1415 29220702088 0 2012 -1493825 703620 4999998 -1291216 189.10 1416 29220702089 0 2012 -1493825 703620 4999998 -1291218 189.10 1416 29220702090 0 2012 -1493825 703620 4999998 -1291219 189.10 1416 29220702091 0 2012 -1493825 703620 4999998 -1291220 189.10 1416 29220702092 0 2012 -1493824 703620 4999998 -1291220 189.10 1416 29220562093 0 2012 -1493824 703620 4999998 -1291221 189.10 1416 29220562094 0 2012 -1493824 703620 4999998 -1291223 189.10 1416 29220562095 0 2012 -1493824 703620 4999998 -1291224 189.10 1417 29220562096 0 2012 -1493824 703620 4999998 -1291225 189.10 1417 2922056
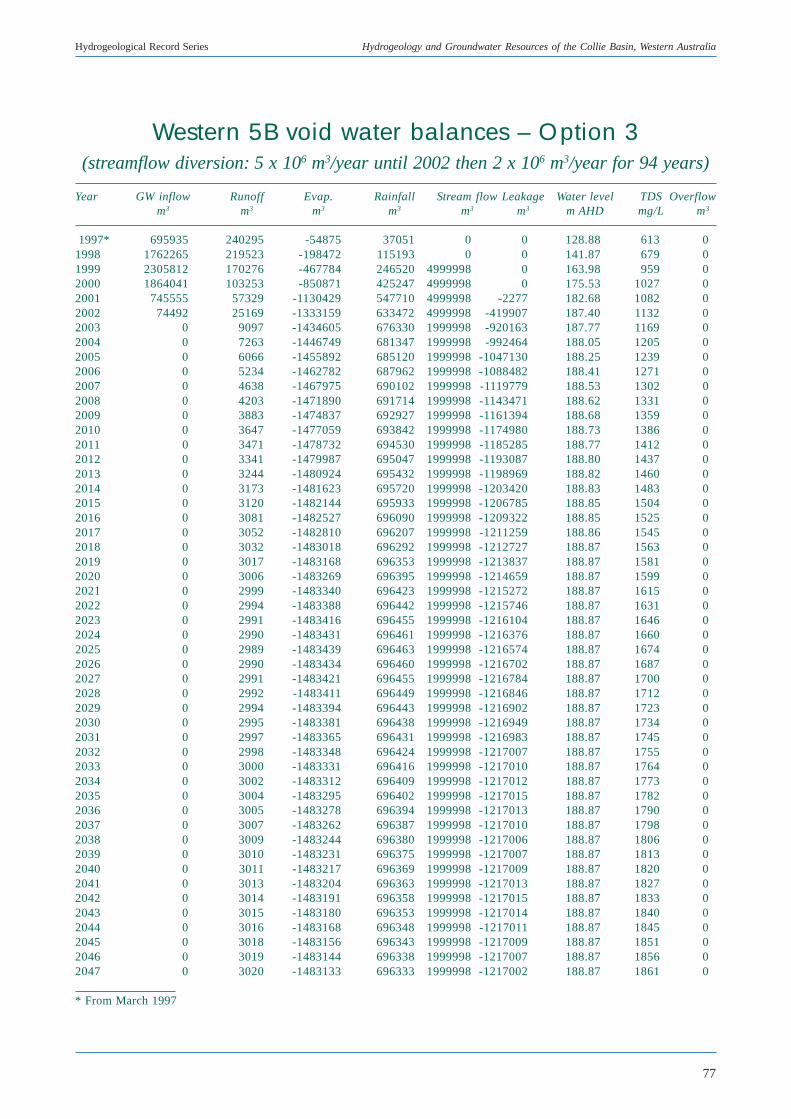
77
Hydrogeological Record Series Hydrogeology and Groundwater Resources of the Collie Basin, Western Australia
Western 5B void water balances – Option 3(streamflow diversion: 5 x 10⁶ m3/year until 2002 then 2 x 10⁶ m3/year for 94 years)
Year GW inflow Runoff Evap. Rainfall Stream flow Leakage Water level TDS Overflowm3 m3 m3 m3 m3 m3 m AHD mg/L m3
1997* 695935 240295 -54875 37051 0 0 128.88 613 01998 1762265 219523 -198472 115193 0 0 141.87 679 01999 2305812 170276 -467784 246520 4999998 0 163.98 959 02000 1864041 103253 -850871 425247 4999998 0 175.53 1027 02001 745555 57329 -1130429 547710 4999998 -2277 182.68 1082 02002 74492 25169 -1333159 633472 4999998 -419907 187.40 1132 02003 0 9097 -1434605 676330 1999998 -920163 187.77 1169 02004 0 7263 -1446749 681347 1999998 -992464 188.05 1205 02005 0 6066 -1455892 685120 1999998 -1047130 188.25 1239 02006 0 5234 -1462782 687962 1999998 -1088482 188.41 1271 02007 0 4638 -1467975 690102 1999998 -1119779 188.53 1302 02008 0 4203 -1471890 691714 1999998 -1143471 188.62 1331 02009 0 3883 -1474837 692927 1999998 -1161394 188.68 1359 02010 0 3647 -1477059 693842 1999998 -1174980 188.73 1386 02011 0 3471 -1478732 694530 1999998 -1185285 188.77 1412 02012 0 3341 -1479987 695047 1999998 -1193087 188.80 1437 02013 0 3244 -1480924 695432 1999998 -1198969 188.82 1460 02014 0 3173 -1481623 695720 1999998 -1203420 188.83 1483 02015 0 3120 -1482144 695933 1999998 -1206785 188.85 1504 02016 0 3081 -1482527 696090 1999998 -1209322 188.85 1525 02017 0 3052 -1482810 696207 1999998 -1211259 188.86 1545 02018 0 3032 -1483018 696292 1999998 -1212727 188.87 1563 02019 0 3017 -1483168 696353 1999998 -1213837 188.87 1581 02020 0 3006 -1483269 696395 1999998 -1214659 188.87 1599 02021 0 2999 -1483340 696423 1999998 -1215272 188.87 1615 02022 0 2994 -1483388 696442 1999998 -1215746 188.87 1631 02023 0 2991 -1483416 696455 1999998 -1216104 188.87 1646 02024 0 2990 -1483431 696461 1999998 -1216376 188.87 1660 02025 0 2989 -1483439 696463 1999998 -1216574 188.87 1674 02026 0 2990 -1483434 696460 1999998 -1216702 188.87 1687 02027 0 2991 -1483421 696455 1999998 -1216784 188.87 1700 02028 0 2992 -1483411 696449 1999998 -1216846 188.87 1712 02029 0 2994 -1483394 696443 1999998 -1216902 188.87 1723 02030 0 2995 -1483381 696438 1999998 -1216949 188.87 1734 02031 0 2997 -1483365 696431 1999998 -1216983 188.87 1745 02032 0 2998 -1483348 696424 1999998 -1217007 188.87 1755 02033 0 3000 -1483331 696416 1999998 -1217010 188.87 1764 02034 0 3002 -1483312 696409 1999998 -1217012 188.87 1773 02035 0 3004 -1483295 696402 1999998 -1217015 188.87 1782 02036 0 3005 -1483278 696394 1999998 -1217013 188.87 1790 02037 0 3007 -1483262 696387 1999998 -1217010 188.87 1798 02038 0 3009 -1483244 696380 1999998 -1217006 188.87 1806 02039 0 3010 -1483231 696375 1999998 -1217007 188.87 1813 02040 0 3011 -1483217 696369 1999998 -1217009 188.87 1820 02041 0 3013 -1483204 696363 1999998 -1217013 188.87 1827 02042 0 3014 -1483191 696358 1999998 -1217015 188.87 1833 02043 0 3015 -1483180 696353 1999998 -1217014 188.87 1840 02044 0 3016 -1483168 696348 1999998 -1217011 188.87 1845 02045 0 3018 -1483156 696343 1999998 -1217009 188.87 1851 02046 0 3019 -1483144 696338 1999998 -1217007 188.87 1856 02047 0 3020 -1483133 696333 1999998 -1217002 188.87 1861 0
* From March 1997
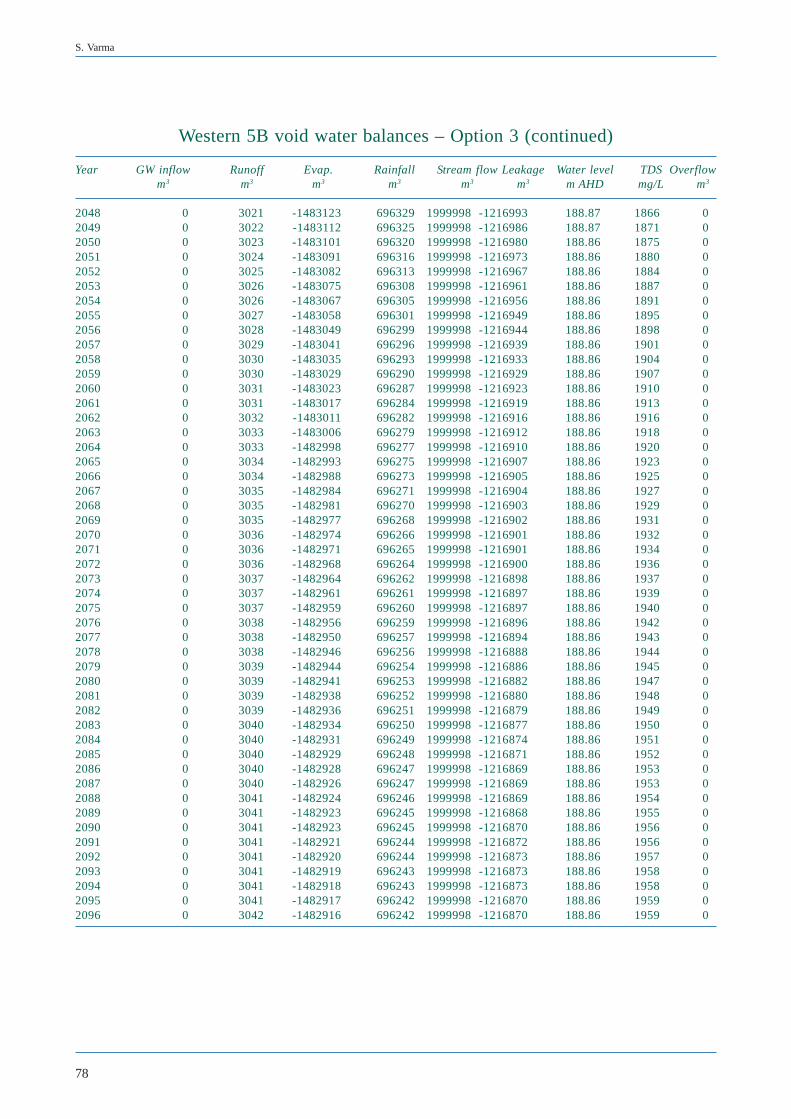
78
S. Varma
Western 5B void water balances – Option 3 (continued)
Year GW inflow Runoff Evap. Rainfall Stream flow Leakage Water level TDS Overflowm3 m3 m3 m3 m3 m3 m AHD mg/L m3
2048 0 3021 -1483123 696329 1999998 -1216993 188.87 1866 02049 0 3022 -1483112 696325 1999998 -1216986 188.87 1871 02050 0 3023 -1483101 696320 1999998 -1216980 188.86 1875 02051 0 3024 -1483091 696316 1999998 -1216973 188.86 1880 02052 0 3025 -1483082 696313 1999998 -1216967 188.86 1884 02053 0 3026 -1483075 696308 1999998 -1216961 188.86 1887 02054 0 3026 -1483067 696305 1999998 -1216956 188.86 1891 02055 0 3027 -1483058 696301 1999998 -1216949 188.86 1895 02056 0 3028 -1483049 696299 1999998 -1216944 188.86 1898 02057 0 3029 -1483041 696296 1999998 -1216939 188.86 1901 02058 0 3030 -1483035 696293 1999998 -1216933 188.86 1904 02059 0 3030 -1483029 696290 1999998 -1216929 188.86 1907 02060 0 3031 -1483023 696287 1999998 -1216923 188.86 1910 02061 0 3031 -1483017 696284 1999998 -1216919 188.86 1913 02062 0 3032 -1483011 696282 1999998 -1216916 188.86 1916 02063 0 3033 -1483006 696279 1999998 -1216912 188.86 1918 02064 0 3033 -1482998 696277 1999998 -1216910 188.86 1920 02065 0 3034 -1482993 696275 1999998 -1216907 188.86 1923 02066 0 3034 -1482988 696273 1999998 -1216905 188.86 1925 02067 0 3035 -1482984 696271 1999998 -1216904 188.86 1927 02068 0 3035 -1482981 696270 1999998 -1216903 188.86 1929 02069 0 3035 -1482977 696268 1999998 -1216902 188.86 1931 02070 0 3036 -1482974 696266 1999998 -1216901 188.86 1932 02071 0 3036 -1482971 696265 1999998 -1216901 188.86 1934 02072 0 3036 -1482968 696264 1999998 -1216900 188.86 1936 02073 0 3037 -1482964 696262 1999998 -1216898 188.86 1937 02074 0 3037 -1482961 696261 1999998 -1216897 188.86 1939 02075 0 3037 -1482959 696260 1999998 -1216897 188.86 1940 02076 0 3038 -1482956 696259 1999998 -1216896 188.86 1942 02077 0 3038 -1482950 696257 1999998 -1216894 188.86 1943 02078 0 3038 -1482946 696256 1999998 -1216888 188.86 1944 02079 0 3039 -1482944 696254 1999998 -1216886 188.86 1945 02080 0 3039 -1482941 696253 1999998 -1216882 188.86 1947 02081 0 3039 -1482938 696252 1999998 -1216880 188.86 1948 02082 0 3039 -1482936 696251 1999998 -1216879 188.86 1949 02083 0 3040 -1482934 696250 1999998 -1216877 188.86 1950 02084 0 3040 -1482931 696249 1999998 -1216874 188.86 1951 02085 0 3040 -1482929 696248 1999998 -1216871 188.86 1952 02086 0 3040 -1482928 696247 1999998 -1216869 188.86 1953 02087 0 3040 -1482926 696247 1999998 -1216869 188.86 1953 02088 0 3041 -1482924 696246 1999998 -1216869 188.86 1954 02089 0 3041 -1482923 696245 1999998 -1216868 188.86 1955 02090 0 3041 -1482923 696245 1999998 -1216870 188.86 1956 02091 0 3041 -1482921 696244 1999998 -1216872 188.86 1956 02092 0 3041 -1482920 696244 1999998 -1216873 188.86 1957 02093 0 3041 -1482919 696243 1999998 -1216873 188.86 1958 02094 0 3041 -1482918 696243 1999998 -1216873 188.86 1958 02095 0 3041 -1482917 696242 1999998 -1216870 188.86 1959 02096 0 3042 -1482916 696242 1999998 -1216870 188.86 1959 0
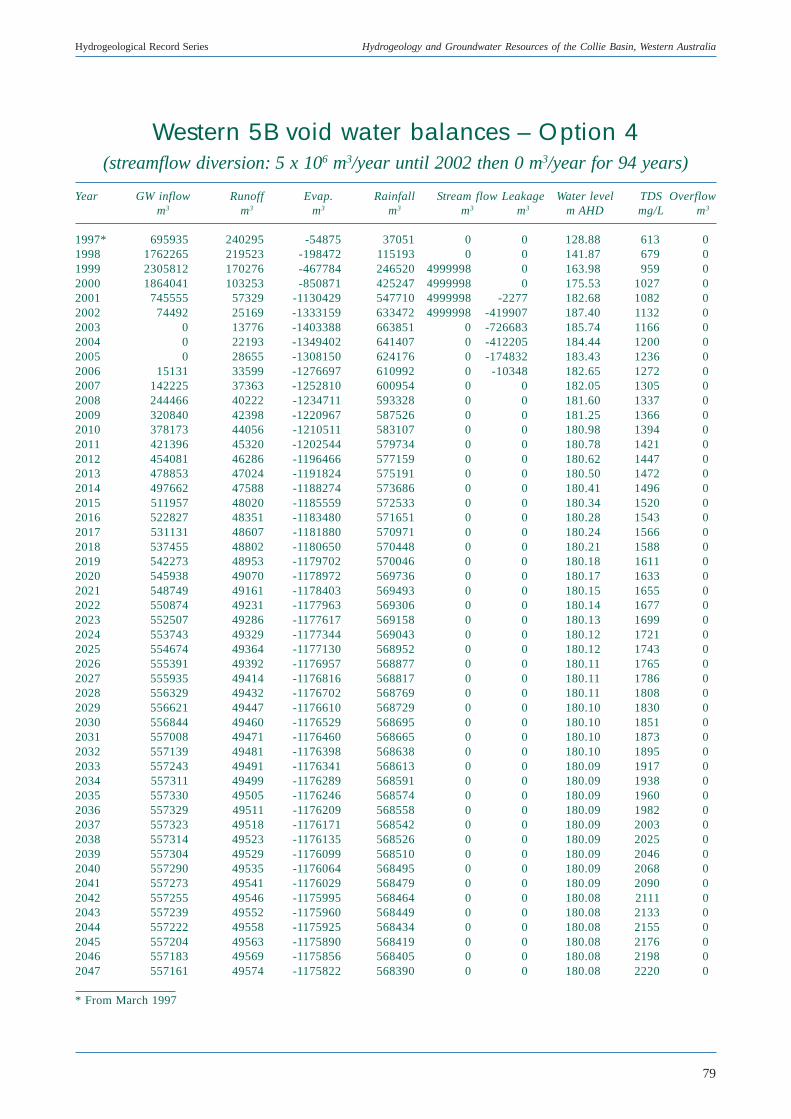
79
Hydrogeological Record Series Hydrogeology and Groundwater Resources of the Collie Basin, Western Australia
Western 5B void water balances – Option 4(streamflow diversion: 5 x 10⁶ m3/year until 2002 then 0 m3/year for 94 years)
Year GW inflow Runoff Evap. Rainfall Stream flow Leakage Water level TDS Overflowm3 m3 m3 m3 m3 m3 m AHD mg/L m3
1997* 695935 240295 -54875 37051 0 0 128.88 613 01998 1762265 219523 -198472 115193 0 0 141.87 679 01999 2305812 170276 -467784 246520 4999998 0 163.98 959 02000 1864041 103253 -850871 425247 4999998 0 175.53 1027 02001 745555 57329 -1130429 547710 4999998 -2277 182.68 1082 02002 74492 25169 -1333159 633472 4999998 -419907 187.40 1132 02003 0 13776 -1403388 663851 0 -726683 185.74 1166 02004 0 22193 -1349402 641407 0 -412205 184.44 1200 02005 0 28655 -1308150 624176 0 -174832 183.43 1236 02006 15131 33599 -1276697 610992 0 -10348 182.65 1272 02007 142225 37363 -1252810 600954 0 0 182.05 1305 02008 244466 40222 -1234711 593328 0 0 181.60 1337 02009 320840 42398 -1220967 587526 0 0 181.25 1366 02010 378173 44056 -1210511 583107 0 0 180.98 1394 02011 421396 45320 -1202544 579734 0 0 180.78 1421 02012 454081 46286 -1196466 577159 0 0 180.62 1447 02013 478853 47024 -1191824 575191 0 0 180.50 1472 02014 497662 47588 -1188274 573686 0 0 180.41 1496 02015 511957 48020 -1185559 572533 0 0 180.34 1520 02016 522827 48351 -1183480 571651 0 0 180.28 1543 02017 531131 48607 -1181880 570971 0 0 180.24 1566 02018 537455 48802 -1180650 570448 0 0 180.21 1588 02019 542273 48953 -1179702 570046 0 0 180.18 1611 02020 545938 49070 -1178972 569736 0 0 180.17 1633 02021 548749 49161 -1178403 569493 0 0 180.15 1655 02022 550874 49231 -1177963 569306 0 0 180.14 1677 02023 552507 49286 -1177617 569158 0 0 180.13 1699 02024 553743 49329 -1177344 569043 0 0 180.12 1721 02025 554674 49364 -1177130 568952 0 0 180.12 1743 02026 555391 49392 -1176957 568877 0 0 180.11 1765 02027 555935 49414 -1176816 568817 0 0 180.11 1786 02028 556329 49432 -1176702 568769 0 0 180.11 1808 02029 556621 49447 -1176610 568729 0 0 180.10 1830 02030 556844 49460 -1176529 568695 0 0 180.10 1851 02031 557008 49471 -1176460 568665 0 0 180.10 1873 02032 557139 49481 -1176398 568638 0 0 180.10 1895 02033 557243 49491 -1176341 568613 0 0 180.09 1917 02034 557311 49499 -1176289 568591 0 0 180.09 1938 02035 557330 49505 -1176246 568574 0 0 180.09 1960 02036 557329 49511 -1176209 568558 0 0 180.09 1982 02037 557323 49518 -1176171 568542 0 0 180.09 2003 02038 557314 49523 -1176135 568526 0 0 180.09 2025 02039 557304 49529 -1176099 568510 0 0 180.09 2046 02040 557290 49535 -1176064 568495 0 0 180.09 2068 02041 557273 49541 -1176029 568479 0 0 180.09 2090 02042 557255 49546 -1175995 568464 0 0 180.08 2111 02043 557239 49552 -1175960 568449 0 0 180.08 2133 02044 557222 49558 -1175925 568434 0 0 180.08 2155 02045 557204 49563 -1175890 568419 0 0 180.08 2176 02046 557183 49569 -1175856 568405 0 0 180.08 2198 02047 557161 49574 -1175822 568390 0 0 180.08 2220 0
* From March 1997
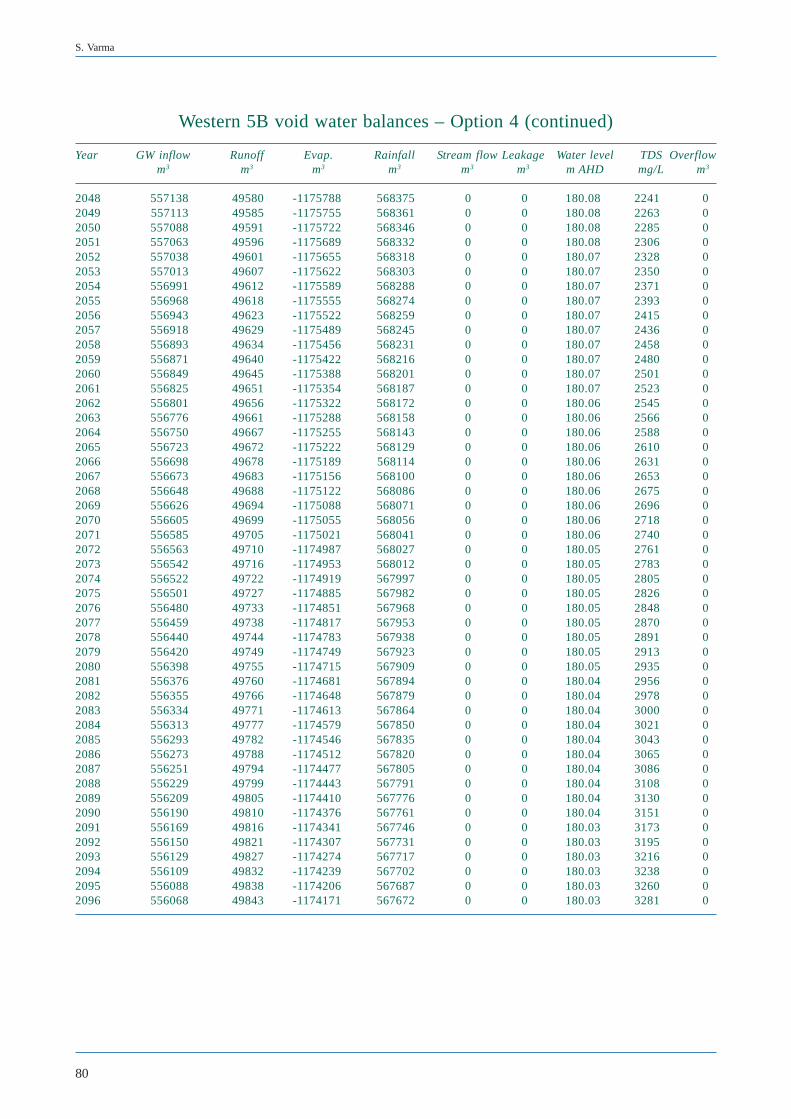
80
S. Varma
Western 5B void water balances – Option 4 (continued)
Year GW inflow Runoff Evap. Rainfall Stream flow Leakage Water level TDS Overflowm3 m3 m3 m3 m3 m3 m AHD mg/L m3
2048 557138 49580 -1175788 568375 0 0 180.08 2241 02049 557113 49585 -1175755 568361 0 0 180.08 2263 02050 557088 49591 -1175722 568346 0 0 180.08 2285 02051 557063 49596 -1175689 568332 0 0 180.08 2306 02052 557038 49601 -1175655 568318 0 0 180.07 2328 02053 557013 49607 -1175622 568303 0 0 180.07 2350 02054 556991 49612 -1175589 568288 0 0 180.07 2371 02055 556968 49618 -1175555 568274 0 0 180.07 2393 02056 556943 49623 -1175522 568259 0 0 180.07 2415 02057 556918 49629 -1175489 568245 0 0 180.07 2436 02058 556893 49634 -1175456 568231 0 0 180.07 2458 02059 556871 49640 -1175422 568216 0 0 180.07 2480 02060 556849 49645 -1175388 568201 0 0 180.07 2501 02061 556825 49651 -1175354 568187 0 0 180.07 2523 02062 556801 49656 -1175322 568172 0 0 180.06 2545 02063 556776 49661 -1175288 568158 0 0 180.06 2566 02064 556750 49667 -1175255 568143 0 0 180.06 2588 02065 556723 49672 -1175222 568129 0 0 180.06 2610 02066 556698 49678 -1175189 568114 0 0 180.06 2631 02067 556673 49683 -1175156 568100 0 0 180.06 2653 02068 556648 49688 -1175122 568086 0 0 180.06 2675 02069 556626 49694 -1175088 568071 0 0 180.06 2696 02070 556605 49699 -1175055 568056 0 0 180.06 2718 02071 556585 49705 -1175021 568041 0 0 180.06 2740 02072 556563 49710 -1174987 568027 0 0 180.05 2761 02073 556542 49716 -1174953 568012 0 0 180.05 2783 02074 556522 49722 -1174919 567997 0 0 180.05 2805 02075 556501 49727 -1174885 567982 0 0 180.05 2826 02076 556480 49733 -1174851 567968 0 0 180.05 2848 02077 556459 49738 -1174817 567953 0 0 180.05 2870 02078 556440 49744 -1174783 567938 0 0 180.05 2891 02079 556420 49749 -1174749 567923 0 0 180.05 2913 02080 556398 49755 -1174715 567909 0 0 180.05 2935 02081 556376 49760 -1174681 567894 0 0 180.04 2956 02082 556355 49766 -1174648 567879 0 0 180.04 2978 02083 556334 49771 -1174613 567864 0 0 180.04 3000 02084 556313 49777 -1174579 567850 0 0 180.04 3021 02085 556293 49782 -1174546 567835 0 0 180.04 3043 02086 556273 49788 -1174512 567820 0 0 180.04 3065 02087 556251 49794 -1174477 567805 0 0 180.04 3086 02088 556229 49799 -1174443 567791 0 0 180.04 3108 02089 556209 49805 -1174410 567776 0 0 180.04 3130 02090 556190 49810 -1174376 567761 0 0 180.04 3151 02091 556169 49816 -1174341 567746 0 0 180.03 3173 02092 556150 49821 -1174307 567731 0 0 180.03 3195 02093 556129 49827 -1174274 567717 0 0 180.03 3216 02094 556109 49832 -1174239 567702 0 0 180.03 3238 02095 556088 49838 -1174206 567687 0 0 180.03 3260 02096 556068 49843 -1174171 567672 0 0 180.03 3281 0
WATER AND RIVERS COMMISSION
Hyatt Centre3 Plain Street
East PerthWestern Australia 6004
Telephone (08) 9278 0300Facsimile (08) 9278 0301
Website http://www.wrc.wa.gov.au