Embed Size (px)
Citation preview
EXPLANATORY NOTES
HYDROGEOLOGICAL AND HYDROCHEMICAL MAPSOF FILTU NB 37-12
Ameha Atnafu (Chief Compiler)
Jiri Sima (Editor)
The Main Project Partners
The Czech Development Agency (CzDA)cooperates with the Ministry of Foreign Affairs on the establishment of an institutional framework of Czech development cooperation and actively participates in the creation and financing of development cooperation programs between the Czech Republic and partner countries.
www.czda.cz
The Geological Survey of Ethiopia (GSE)which is accountable to the Ministry of Mines and Energy, collects and assesses geology, geological engineering and hydrogeology data for publication. The project beneficiary.www.geology.gov.et (www.mome.gov.et)
AQUATEST a.s. a Czech consulting and engineering company in water management and environmental protection. The main contractor.www.aquatest.cz
The Czech Geological Service collects data and information on geology and processes it for political, economical and environmental management. The main subcontractor.www.geology.cz
Copyright © 2011 AQUATEST a.s., Geologicka 4, 152 00 Prague 5, Czech RepublicFirst editionISBN 978-80-260-0333-5
aquatest

Acknowledgment
Field work and primary compilation of the map and explanatory notes was done by a team from the Geological Survey of Ethiopia (GSE) consisting of staff from the Groundwater Resources Assessment Department; the Czech experts from AQUATEST a.s. and the Czech Geological Survey in the framework of the Czech Official Development Assistance Program. The team is greatly indebted to the Liben and Afder zone administration of Somali regional state and Negele Borena city administration for their limit-less cooperation. The team is grateful to the management of the Geological Survey of Ethiopia, particu-larly to Director General (GSE) Mr. Masresha G/Selassie and Mr. Yohannes Belete, Head of Groundwater Resources Assessment Department (GSE) and Mr. Muhudin Abdela, Senior Hydrogeologist and Project Coordinator. Special thanks go to the NGOs and private water drilling and consultant companies for providing data from private databases. Finally, the team acknowledges the untiring support of the local people who assisted the team by all means possible and facilitated the data collection and those who helped us in different ways.
Acknowledgment

ContentsAcknowledgment ................................................................................................................................................................................ 3Extended Summary .......................................................................................................................................................................... 11Introduction ........................................................................................................................................................................................151. Basic Characteristics of the Area .................................................................................................................................171.1 Location and Accessibility .......................................................................................................................................................171.2 Population, Settlements and Health Status ........................................................................................................................181.3 Land Use ......................................................................................................................................................................................232. Selected Physical and Geographical Settings ........................................................................................................... 252.1 Geomorphology .........................................................................................................................................................................262.2 Soil and Vegetation Cover .......................................................................................................................................................272.3 Climatic Characteristics ...........................................................................................................................................................312.3.1 Climatic Zones and Measurements...................................................................................................................................312.3.2 Precipitation ............................................................................................................................................................................332.4 Hydrography and Hydrology of the Area ............................................................................................................................382.4.1 Surface Water Network Development ..............................................................................................................................382.4.2 Surface Water Regime .........................................................................................................................................................402.4.3 Baseflow .................................................................................................................................................................................. 412.5 Water Balance ............................................................................................................................................................................472.6 Drought and Climate Changes...............................................................................................................................................493. Geological Settings .......................................................................................................................................................... 533.1 Previous Work ............................................................................................................................................................................533.2 Stratigraphy ................................................................................................................................................................................543.3 Lithology ......................................................................................................................................................................................543.3.1 Mesozoic Sedimentary Formations .................................................................................................................................553.3.2 Quaternary Volcanic and Sedimentary Rocks ...............................................................................................................573.4 Structure ......................................................................................................................................................................................573.5 Geological History .....................................................................................................................................................................584. Hydrogeology .....................................................................................................................................................................614.1 Water Point Inventory ...............................................................................................................................................................614.2 Hydrogeological Classification/Characterization ..............................................................................................................644.3 Elements of the Hydrogeological System of the Area (Aquifers) ..................................................................................644.3.1 Extensive and Moderately Productive Porous Aquifers (Qa, Qe) ...............................................................................654.3.2 Extensive and Moderately Productive Fissured Aquifers. ...........................................................................................664.3.3 Extensive Formations Consisting of Minor Fissured Aquifers with Local and Limited Groundwater Resources (Kg1, Km, Ka) ..........................................................................................................................................................684.3.4 Formations with Essentially no Groundwater Resources ............................................................................................704.4 Hydrogeological Conceptual Model .....................................................................................................................................704.5 Annual Recharge in the Area .................................................................................................................................................735. Hydrogeochemistry ..........................................................................................................................................................775.1 Sampling and Analysis .............................................................................................................................................................755.2 Classification of Natural Waters ............................................................................................................................................765.2.1 Surface Water .........................................................................................................................................................................795.2.2 Groundwater in Mesozoic and Quaternary Sediments ...............................................................................................795.3 Water Quality .............................................................................................................................................................................80

5.3.1 Domestic Use ..........................................................................................................................................................................805.3.2 Irrigation Use ..........................................................................................................................................................................825.3.3 Industrial Use ..........................................................................................................................................................................825.4 Mineral and Thermal Water ....................................................................................................................................................846. Natural Resources of the Area ..................................................................................................................................... 856.1 Economic Geology ....................................................................................................................................................................856.2 Water Resources .......................................................................................................................................................................856.2.1 Surface Water Resources Development .........................................................................................................................866.2.2 Groundwater Resources Development ............................................................................................................................886.3 Human and Land Use Resources and Development........................................................................................................946.4 Wind and Solar Energy Development ..................................................................................................................................946.5 Environmental Problems and their Control / Management ...........................................................................................946.6 Touristic Potential of the Area ................................................................................................................................................96Conclusions ........................................................................................................................................................................................97References ..........................................................................................................................................................................................99Annex 1 – Field Inventory Data.................................................................................................................................................. 101Annex 2 – Water Chemistry........................................................................................................................................................ 107Annex 3 – Well Logs ..................................................................................................................................................................... 109

List of Figures
Fig. 1.1 Location map ............................................................................................................................................................ 17Fig. 1.2 The main road and settlements............................................................................................................................ 18Fig. 1.3 Administrative zones .............................................................................................................................................. 19Fig. 1.4 Malaria risk in Ethiopia ........................................................................................................................................... 21Fig. 1.5 Land use ....................................................................................................................................................................24Fig. 2.1 Generalized physiographic units ..........................................................................................................................25Fig. 2.2 Gorges of Genale River viewed from the SW ....................................................................................................26Fig. 2.3 Mountain slope collapse ........................................................................................................................................27Fig. 2.4 Distribution of soil types ........................................................................................................................................28Fig. 2.5 Acacia tree ................................................................................................................................................................30Fig. 2.6 Palm tree ....................................................................................................................................................................30Fig. 2.7 Climatic zones ..........................................................................................................................................................32Fig. 2.8 Temperature at Filtu meteo-station .....................................................................................................................33Fig. 2.9 Seasonal classification and precipitation regimes of Ethiopia (source: NMSA, 1996) ...........................35Fig. 2.10 The Filtu meteo-station precipitation pattern....................................................................................................36Fig. 2.11 Long-term fluctuation and average of precipitation from the Filtu meteo-station ..................................37 Fig. 2.12 The Dollo Odo meteo-station precipitation pattern ........................................................................................37Fig. 2.13 Long-term fluctuation and average of precipitation from the Dollo Odo meteo-station ........................38Fig. 2.14 The principal river basins of the area .................................................................................................................39Fig. 2.15 Dam on Weyb River in Chereti town (Photo taken 9th of Feb, 2010 G.C) ................................................39Fig. 2.16 Mean monthly flow of the Genale River at Halowey, Chenemasa and Girja gauging
stations [m3/s] ........................................................................................................................................................ 41Fig. 2.17 Method of Kille baseflow assessment ...............................................................................................................42Fig. 2.18 Kille baseflow separation ......................................................................................................................................43Fig. 2.19 Method of baseflow separation ..........................................................................................................................44Fig. 2.20 Hydrograph of baseflow separation ...................................................................................................................45Fig. 2.21 The most drought prone areas of Ethiopia (source: RRC, 1985) .................................................................50Fig. 3.1 Position of the Gabredare (Jg) and Hamanlei (Jh2) formation in the study area ....................................55Fig. 3.2 Lithostratigraphic section of the Gabredare formation near Fitlu ...............................................................56Fig. 3.3 Fractures in gypsum intercalated with limestone and limestone intercalated with shale ....................58Fig. 3.4 Horizontal bedding of limestone .........................................................................................................................58Fig. 3.5 Mesozoic propagation of the Karoo rift to the southeastern part of Ethiopia
(modified after Gani et al., 2008) .......................................................................................................................59Fig. 4.1 Extent and location of porous aquifers ..............................................................................................................66Fig. 4.2 Extent and location of moderately productive fissured and karst aquifers in limestone .......................67Fig. 4.3 FSP-1 from Melmel limestone .............................................................................................................................68Fig. 4.4 Extent and location of fissured aquifers with local and limited and/or formations with no
groundwater resources .........................................................................................................................................69Fig. 4.5 Conceptual hydrogeological model of the southeastern highlands and lowlands .................................70Fig. 4.6 Fissures in roof of the Sof Omar cave ................................................................................................................ 71Fig. 4.7 Conceptual hydrogeological model of the Filtu area .....................................................................................72

Fig. 5.1 Level of cation-anion balance .............................................................................................................................. 76Fig. 5.2 Piper diagram for classification of natural waters ..........................................................................................78Fig. 5.3 Evaporates of Korahe formation near Chereti town .......................................................................................79Fig. 5.4 Content of nitrate in analysis of water in the study area ...............................................................................82Fig. 6.1 Pond in Filtu town used as a source of drinking water for local inhabitants ............................................87Fig. 6.2 Geoelectric section in the Mesaged site ............................................................................................................89Fig. 6.3 Geoelectric section in the Melka Libi site .........................................................................................................89Fig. 6.4 Geoelectric section in the Chereti site ...............................................................................................................90Fig. 6.5 Geoelectric section in the Halimeslo site .......................................................................................................... 91Fig. 6.6 Geoelectric section in the Ananis site ............................................................................................................... 91Fig. 6.7 Geoelectric section in the Filtu site ....................................................................................................................92
List of TablesList of authors and professionals participating in the project ............................................................................................ 16Tab. 1.1 Population in the study area ................................................................................................................................. 19Tab. 1.2 Mortal diseases in Ethiopia (WHO, 2006) .........................................................................................................20Tab. 1.3 Rural water facilities by Zones and Weredas ....................................................................................................22Tab. 1.4 Leading causes of hospital and health center morbidity 2008/2009 .......................................................22Tab. 2.1 Ethiopian climate classification ............................................................................................................................ 31Tab. 2.2 Characterization of the precipitation pattern in Ethiopia ...............................................................................34Tab. 2.3 Basic characteristics Fitu and Dollo Odo meteo-stations ...............................................................................34Tab. 2.4 Monthly long-term average precipitation at Filtu and Dollo Odo meteo-stations [mm] .........................34Tab. 2.5 Long-term monthly rainfall at Filtu [mm] (fully recorded years only) ..........................................................36Tab. 2.6 Data on the nearest river gauging stations .......................................................................................................40Tab. 2.7 Runoff data ................................................................................................................................................................40Tab. 2.8 Baseflow data for the Filtu area ........................................................................................................................... 47Tab. 2.9 Water balance input data ......................................................................................................................................48Tab. 2.10 Water balance of Shaya basin ..............................................................................................................................49Tab. 2.11 Comparison of water losses in water balance with estimated deep base flow ........................................49Tab. 3.1 Log data of wells in the study area ......................................................................................................................53Tab. 3.2 Lithostratigraphy of the mapped area ................................................................................................................54Tab. 4.1 Aquifer classification based on well yield for Genale-Dawa basin ...............................................................62Tab. 4.2 Aquifer classification for Genale-Dawa basin ....................................................................................................62Tab. 4.3 Summary of borehole yield [l/s] and transmissivity [m2/d] by WWDST (2003) .....................................63Tab. 4.4 Summary of spring yield [l/s] by WWDST (2003) ..........................................................................................63Tab. 4.5 Summary of field inventory ...................................................................................................................................63Tab. 4.6 Estimated minimum recharge to groundwater from stations of the Genale-Dawa basin ......................73 Tab. 4.7 Rainfall infiltration factor for Wabe Shebelle basin by WWDST (2003) ....................................................73Tab. 5.1 Level of balance ....................................................................................................................................................... 76Tab. 5.2 Summary of hydrochemical types .......................................................................................................................77Tab. 5.3 Groundwater descriptive statistics of TDS, EC and Cl values .......................................................................78Tab. 5.4 Groundwater chemistry compared to drinking water standards and guidelines ..................................... 81Tab. 5.6 Suitability of water for irrigation ..........................................................................................................................82Tab. 5.7 Suitability of water for use in industry ................................................................................................................83Tab. 5.8 Concentration limits for incrustation ..................................................................................................................84Tab. 5.9 Concentration limits for corrosion .......................................................................................................................84Tab. 6.1 Aquifers of the area .................................................................................................................................................86Tab. 6.2 Assessment of water resources of the Filtu area .............................................................................................86Tab. 6.3 Geoelectric layers from Haro Dumel area ..........................................................................................................93

Under Separate Cover (see attached CD)
Annexes:Annex 1 Field Inventory DataAnnex 2 Water ChemistryAnnex 3 Well Logs
Maps:Hydrogeological Map of Filtu NB 37–12 - full size and A3 sizeHydrochemical Map of Filtu NB 37–12 - full size and A3 size

11
Extended SummaryThe Filtu area is located in Eastern Ethiopia on the Filtu map sheet (NB 37-12) at the scale of
1:250,000, covering an area of 18,394 km2. The area is a part of the Somali and Oromia regional states and is inhabited by 0.16 million people and only small part of the area is cultivated.
The eastern part of the Filtu area is below 500 m above sea level (a.s.l.) and is represented by the flat Chereti plain. The lowlands rise to the northwest to the Filtu highlands at about 1,500 m a.s.l. and higher. The area is a part of the Genale-Dawa river basin. The rainy season is bimodal from March to May and from October to November; the annual mean rainfall was adopted in average of 420 mm for the Filtu area. Rivers, including the Weyb River are usually intermittent, but the Genale River is the only perennial river in the area. Specific surface runoff was adopted as being a value of 2.0 l/s.km2. The adopted value of specific baseflow is 0.14 l/s.km2 representing 4.5 mm/year and 1.1 % of rainfall. The Filtu area faced severe Kiremt drought in 1969, 1970 and 1987. The years when drought was most serious in the Filtu area were 1969, 1973 and 1977. The area shows high Kiremt drought probability (third highest in Ethiopia).
The aquifer system has been defined based on the hydrogeological characteristics of lithological units described by the geological maps and data from the field inventory and desk study. The characterization of the area shows the following aquifer/aquitard systems:
1. Extensive and moderately productive porous aquifers with spring and well yield Q = 0.51–5 l/s developed in unconsolidated Quaternary deposits.
2. Extensive and moderately productive fissured and karst aquifers with spring and well yield Q = 0.51–5 l/s developed in Mesozoic limestone and Quaternary basalts.
3. Extensive formation consisting of minor fissured aquifer with local and limited groundwater resources with spring and well yield less than 0.05 l/s developed in mixed Lower Kohare formation, Mustahil limestone and Amba Aradam sandstone.
4. Formation with essentially no groundwater resources consisting of gypsum dominating Upper Kohare formation.
The hydrograph separation and Kille method show that the infiltration coefficient (recharge) is about 1.1 % of the total precipitation. Part of groundwater infiltrates directly from precipitation and groundwater flows laterally to local and or regional drainage base levels represented by rivers in deep valleys where it emerges as springs or flows vertically recharging deeper aquifers. This type of front recharge is limited because the position of the aquifers in the lowlands with low precipitation depth and limited surplus of water for infiltration causes limited direct recharge of the aquifers. Recharge from areas with higher precipitation to the west of the Filtu sheet is also possible. The intermittent and ephemeral rivers and flood episodes of perennial rivers in the lowlands contribute
12
significantly to the recharge of aquifers along river banks. Bank recharge provides a relatively large amount of good quality groundwater with low TDS for development in the alluvial aquifers of the lowlands.
Chemistry of groundwater in the Filtu area is highly variable reflecting variability in the composition of the sedimentary rocks. The dominant hydrochemical type of groundwater in the western and northern parts of the Filtu area is sulphate type. The transitional Ca–SO
4 type
dominates in the northwestern part of the Filtu sheet along with some basic types. High sulphate content in groundwater is caused by its circulation in limestone with higher solubility and its contact with gypsum strata which is a part of the sedimentary sequence or gypsum material present inside the rock matrix of other sedimentary rocks (sandstone, shale, and limestone). Chloride types (Na–Cl) of groundwater occur in the southeastern part of the map sheet. The high TDS, variability of hydrochemistry of groundwater and dominant sulphate groundwater type indicates the stagnant hydrogeological regime of the lowlands area. In general, the TDS increases from the northwest to the southeast to the drainage area formed by the valleys of the Genale River and its tributaries. The general trend is highly affected by TDS and the groundwater hydrochemistry is highly affected by soluble gypsum and even rock salt which is common in some sedimentary units. Groundwater TDS varies from 94 mg/l to 24,366 mg/l and is not convenient for drinking in more than 50 % of sampled points based on drinking water standards. The use of groundwater can be limited by pollution particularly of human and animal origin and some samples show increasing concentrations of nitrates additional to high TDS.
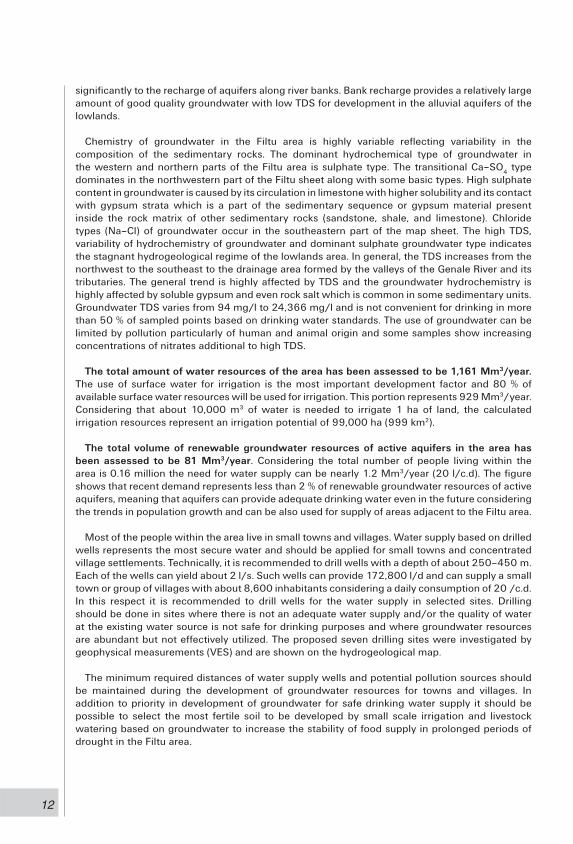
The total amount of water resources of the area has been assessed to be 1,161 Mm3/year. The use of surface water for irrigation is the most important development factor and 80 % of available surface water resources will be used for irrigation. This portion represents 929 Mm3/ year. Considering that about 10,000 m3 of water is needed to irrigate 1 ha of land, the calculated irrigation resources represent an irrigation potential of 99,000 ha (999 km2).
The total volume of renewable groundwater resources of active aquifers in the area has been assessed to be 81 Mm3/year. Considering the total number of people living within the area is 0.16 million the need for water supply can be nearly 1.2 Mm3/year (20 l/c.d). The figure shows that recent demand represents less than 2 % of renewable groundwater resources of active aquifers, meaning that aquifers can provide adequate drinking water even in the future considering the trends in population growth and can be also used for supply of areas adjacent to the Filtu area.
Most of the people within the area live in small towns and villages. Water supply based on drilled wells represents the most secure water and should be applied for small towns and concentrated village settlements. Technically, it is recommended to drill wells with a depth of about 250–450 m. Each of the wells can yield about 2 l/s. Such wells can provide 172,800 l/d and can supply a small town or group of villages with about 8,600 inhabitants considering a daily consumption of 20 /c.d. In this respect it is recommended to drill wells for the water supply in selected sites. Drilling should be done in sites where there is not an adequate water supply and/or the quality of water at the existing water source is not safe for drinking purposes and where groundwater resources are abundant but not effectively utilized. The proposed seven drilling sites were investigated by geophysical measurements (VES) and are shown on the hydrogeological map.
The minimum required distances of water supply wells and potential pollution sources should be maintained during the development of groundwater resources for towns and villages. In addition to priority in development of groundwater for safe drinking water supply it should be possible to select the most fertile soil to be developed by small scale irrigation and livestock watering based on groundwater to increase the stability of food supply in prolonged periods of drought in the Filtu area.

13
Soil erosion and protection is one of the limiting factors of sustainable development of agriculture within the area and should be addressed in all development projects, but data about soil erosion are scarce in the area.
The work which is summarized in the presented explanatory notes shows the relatively good water, agricultural, industrial, human potential of the Filtu area.

14
15
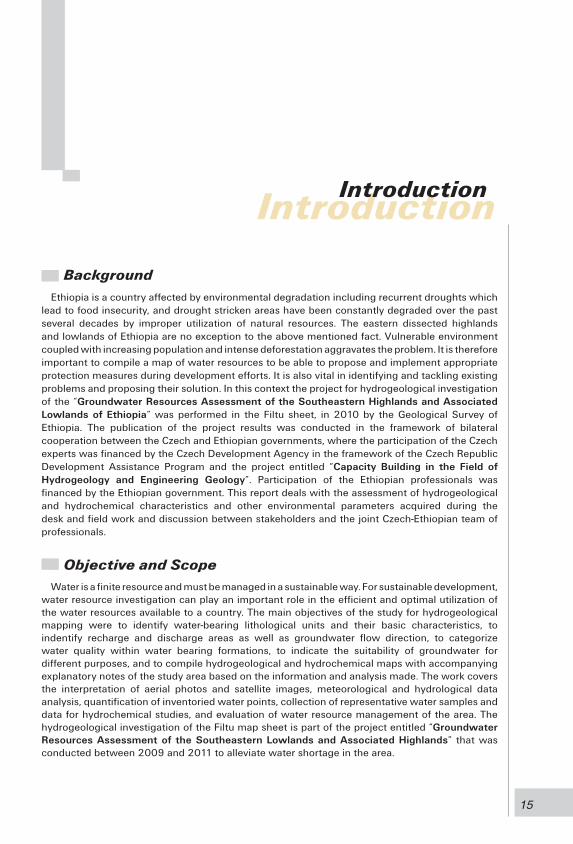
BackgroundEthiopia is a country affected by environmental degradation including recurrent droughts which
lead to food insecurity, and drought stricken areas have been constantly degraded over the past several decades by improper utilization of natural resources. The eastern dissected highlands and lowlands of Ethiopia are no exception to the above mentioned fact. Vulnerable environment coupled with increasing population and intense deforestation aggravates the problem. It is therefore important to compile a map of water resources to be able to propose and implement appropriate protection measures during development efforts. It is also vital in identifying and tackling existing problems and proposing their solution. In this context the project for hydrogeological investigation of the “Groundwater Resources Assessment of the Southeastern Highlands and Associated Lowlands of Ethiopia” was performed in the Filtu sheet, in 2010 by the Geological Survey of Ethiopia. The publication of the project results was conducted in the framework of bilateral cooperation between the Czech and Ethiopian governments, where the participation of the Czech experts was financed by the Czech Development Agency in the framework of the Czech Republic Development Assistance Program and the project entitled “Capacity Building in the Field of Hydrogeology and Engineering Geology”. Participation of the Ethiopian professionals was financed by the Ethiopian government. This report deals with the assessment of hydrogeological and hydrochemical characteristics and other environmental parameters acquired during the desk and field work and discussion between stakeholders and the joint Czech-Ethiopian team of professionals.
Objective and ScopeWater is a finite resource and must be managed in a sustainable way. For sustainable development,
water resource investigation can play an important role in the efficient and optimal utilization of the water resources available to a country. The main objectives of the study for hydrogeological mapping were to identify water-bearing lithological units and their basic characteristics, to indentify recharge and discharge areas as well as groundwater flow direction, to categorize water quality within water bearing formations, to indicate the suitability of groundwater for different purposes, and to compile hydrogeological and hydrochemical maps with accompanying explanatory notes of the study area based on the information and analysis made. The work covers the interpretation of aerial photos and satellite images, meteorological and hydrological data analysis, quantification of inventoried water points, collection of representative water samples and data for hydrochemical studies, and evaluation of water resource management of the area. The hydrogeological investigation of the Filtu map sheet is part of the project entitled “Groundwater Resources Assessment of the Southeastern Lowlands and Associated Highlands” that was conducted between 2009 and 2011 to alleviate water shortage in the area.
IntroductionIntroduction

The desk and field work was carried out by a group of Ethiopian hydrogeologists. Final assessment and publication of the map was carried out by a joint Czech-Ethiopian team of professionals. The names of participating experts are shown in the following list.
List of professionals participating in the project
Name Institution Participation field
Jiri Sima AQUATEST a.s. Editor
Ameha Atnafu Geological Survey of Ethiopia Chief compiler
Muhedin Abdela Geological Survey of Ethiopia Project coordinator
Ondrej Nol AQUATEST a.s. Hydrogeological expert
Antonin Orgon AQUATEST a.s. GIS expert
Romana Suranova AQUATEST a.s. Printing expert
Craig Hampson AQUATEST a.s. Language revision
Betseha Nahusenaye Geological Survey of Ethiopia Data acquisition and evaluation.
Aboma Abdissa Geological Survey of EthiopiaGeophysical study and field data inter-pretation
Yielak Alemu Geological Survey of EthiopiaGeophysical study and field data inter-pretation
Samson Hailu Geological Survey of EthiopiaGeophysical study and field data inter-pretation
Aklilu Hailu Geological Survey of EthiopiaGeophysical study and report compila-tion
Dana Capova Czech Geological SurveyAEGOS project expert – coordination, technical architecture, interoperability
Vladimir Ambrozek Czech Geological SurveyAEGOS project expert data conversion and processing
Petr Coupek Czech Geological SurveyAEGOS project expert – data on-line pro-vision
Shiferaw Ayele Geological Survey of Ethiopia AEGOS project country representative
17
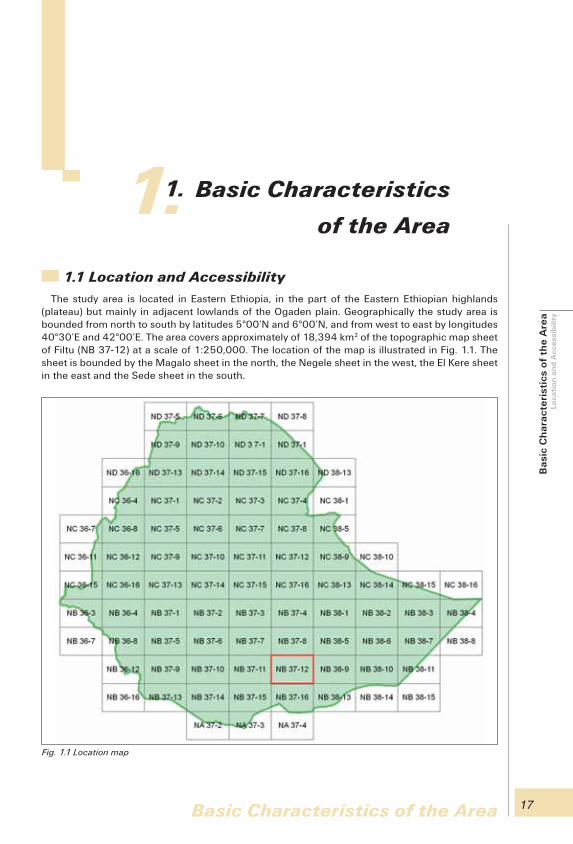
1.1 Location and AccessibilityThe study area is located in Eastern Ethiopia, in the part of the Eastern Ethiopian highlands
(plateau) but mainly in adjacent lowlands of the Ogaden plain. Geographically the study area is bounded from north to south by latitudes 5°00’N and 6°00’N, and from west to east by longitudes 40°30’E and 42°00’E. The area covers approximately of 18,394 km2 of the topographic map sheet of Filtu (NB 37-12) at a scale of 1:250,000. The location of the map is illustrated in Fig. 1.1. The sheet is bounded by the Magalo sheet in the north, the Negele sheet in the west, the El Kere sheet in the east and the Sede sheet in the south.
1. Basic Characteristics
of the Area1.
Fig. 1.1 Location map
Basic Characteristics of the Area
Ba
sic
Ch
ara
cte
rist
ics
of
the
Are
aLo
cati
on
an
d A
cce
ssib
ility

18 Basic Characteristics of the Area
The area can be accessed by a number of all weather road networks. The Addis Ababa – Awassa – Wendo Genet – Negele – Filtu and the Addis Ababa – Imi – El-Kere – Chereti roads are the main all weather roads to access the western and eastern part of the study area, respectively. Most of the trails run along or towards perennial rivers probably due to the movement of Arsie – Oromo and Somali nomads with their cattle, goats and camels. The main accessible roads and settlements are shown in Fig. 1.2.
1.2 Population, Settlements and Health StatusThe study area is mainly a part of the Somali regional state and a small part is from Oromia
regional state. The population density varies from place to place in the high and lowland areas, however population density as well as number of settlements in the study area is not high due to the lack of sustainable water resources, harsh climate conditions and the way of living (most people of the area are pastoralists). The density is higher in the highlands because of the favorable climatic and living conditions; especially where there is better access to sufficient farmland and a sustainable water supply for the community, as well as the proximity of the villages to roads and markets, etc. Population density varies from place to place in the urban areas and rural villages of the lowlands and highlands. The density is 13 inhabitants per km2 in the northwestern part of the area and 2 inhabitants per km2 in the southeastern part of the area with an average of 7 inhabitants per km2.
A relatively large number of people live in the Filtu and Chereti towns (see Fig. 1.2) and along the road from Filtu to Haliemeslo village. The climatic condition of the area is most suitable for desert
Fig. 1.2 The main road and settlements
Ba
sic
Ch
ara
cte
rist
ics
of
the
Are
aLo
cati
on
an
d A
cce
ssib
ility
Po
pu
lati
on
, Se
ttle
me
nts
an
d H
ea
lth
Sta
tus
19Basic Characteristics of the Area
animals like goats and camels. Camels play an important role for the transportation of goods. The majority of inhabitants in the study area are Somali, Oromo and Amhara people.
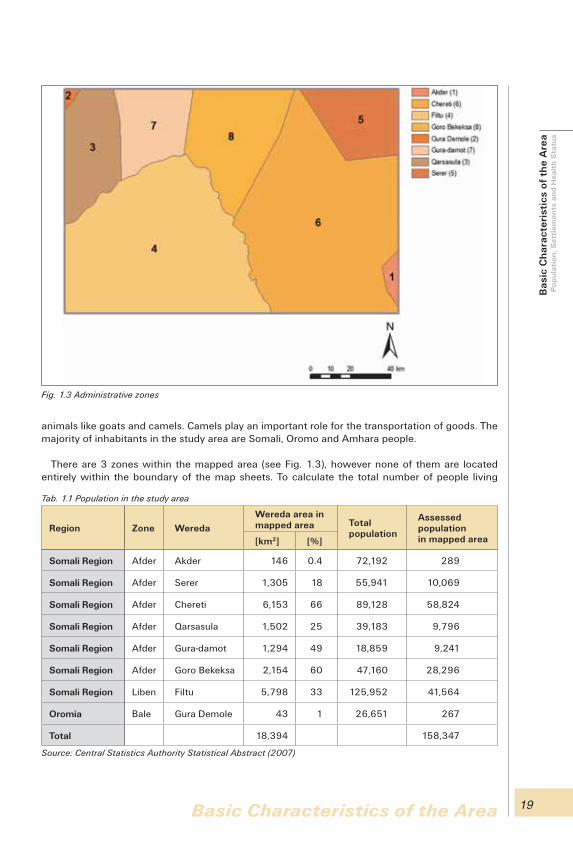
There are 3 zones within the mapped area (see Fig. 1.3), however none of them are located entirely within the boundary of the map sheets. To calculate the total number of people living
Fig. 1.3 Administrative zones
Tab. 1.1 Population in the study area
Region Zone Wereda
Wereda area in mapped area Total
population
Assessed populationin mapped area[km2] [%]
Somali Region Afder Akder 146 0.4 72,192 289
Somali Region Afder Serer 1,305 18 55,941 10,069
Somali Region Afder Chereti 6,153 66 89,128 58,824
Somali Region Afder Qarsasula 1,502 25 39,183 9,796
Somali Region Afder Gura-damot 1,294 49 18,859 9,241
Somali Region Afder Goro Bekeksa 2,154 60 47,160 28,296
Somali Region Liben Filtu 5,798 33 125,952 41,564
Oromia Bale Gura Demole 43 1 26,651 267
Total 18,394 158,347
Source: Central Statistics Authority Statistical Abstract (2007)
Ba
sic
Ch
ara
cte
rist
ics
of
the
Are
a P
op
ula
tio
n, S
ett
lem
en
ts a
nd
He
alt
h S
tatu
s
20 Basic Characteristics of the Area
within the mapped area the number of people living in Afder and Liben and a very small area in the Bale Zone was assessed from the population of all the zones and by the percentage of the area located within the map sheets. Tab. 1.1 shows the population in the different zones within the mapped area.
The total population is assumed by the Central Statistics Authority to be 158,347; however, this figure could in reality be several thousand higher. The urban population comprises only 10 % (Filtu and Chereti towns are the only urban settlements in the area) and the remaining 90 % of the population live in rural areas.
Considering the trends in population growth, access to water will become worse by 2015 in urban areas and 2025 in rural areas, respectively. People in the area could face a water scarcity i.e. less than 1,000 m3/year, and/or even water stress i.e. availability less than 500 m3/year (Tesfay Tafese, 2001).
The life expectancy at birth is 49 years for males and 51 years for females (WHO, 2006). As in most developing countries, Ethiopia‘s main health problems are communicable diseases caused by poor sanitation and malnutrition. Mortality and morbidity data are based primarily on health facility records which show that the leading causes of hospital deaths are dysentery and gastroenteritis, tuberculosis, pneumonia, malnutrition and anemia, and liver diseases including hepatitis, tetanus, and malaria. The situation is complicated by the fact that Ethiopia’s population mainly lives in rural areas (84 %) where access to healthcare is more complicated than in urban areas.
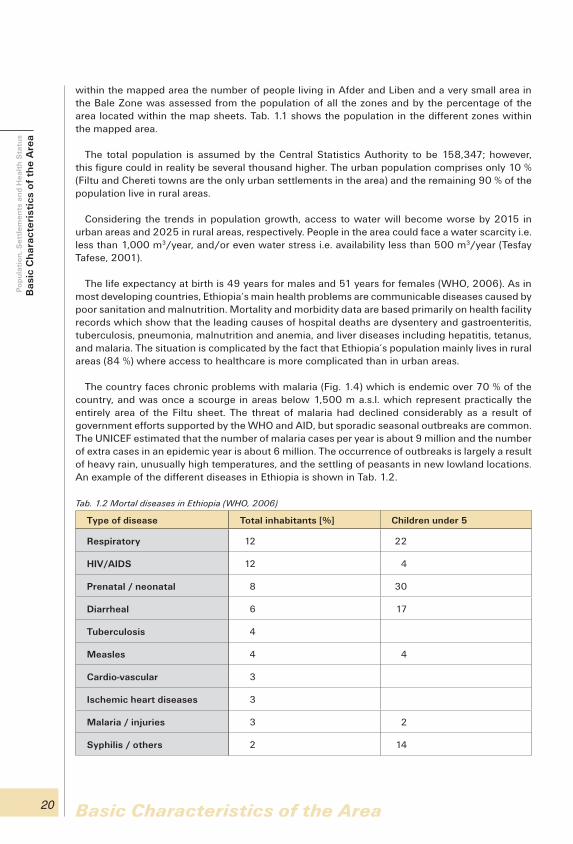
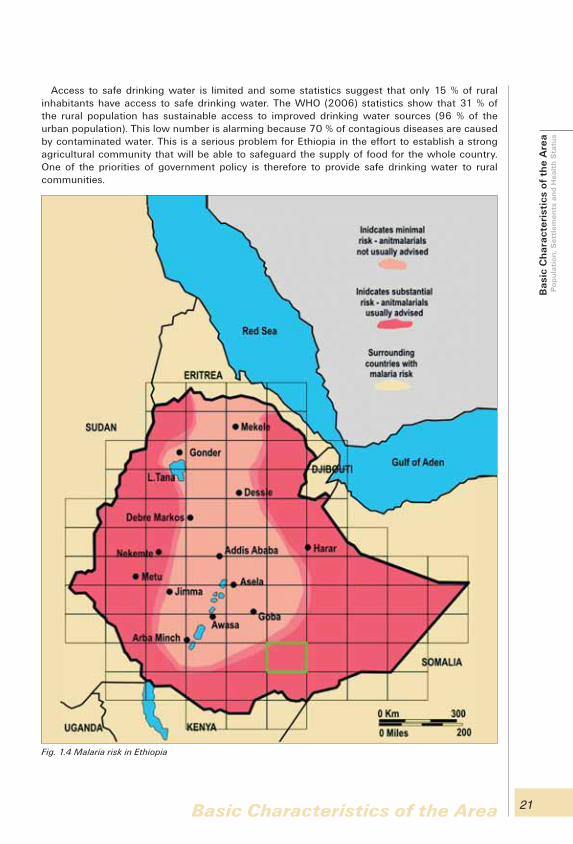
The country faces chronic problems with malaria (Fig. 1.4) which is endemic over 70 % of the country, and was once a scourge in areas below 1,500 m a.s.l. which represent practically the entirely area of the Filtu sheet. The threat of malaria had declined considerably as a result of government efforts supported by the WHO and AID, but sporadic seasonal outbreaks are common. The UNICEF estimated that the number of malaria cases per year is about 9 million and the number of extra cases in an epidemic year is about 6 million. The occurrence of outbreaks is largely a result of heavy rain, unusually high temperatures, and the settling of peasants in new lowland locations. An example of the different diseases in Ethiopia is shown in Tab. 1.2.
Tab. 1.2 Mortal diseases in Ethiopia (WHO, 2006)
Type of disease Total inhabitants [%] Children under 5
Respiratory 12 22
HIV/AIDS 12 4
Prenatal / neonatal 8 30
Diarrheal 6 17
Tuberculosis 4
Measles 4 4
Cardio-vascular 3
Ischemic heart diseases 3
Malaria / injuries 3 2
Syphilis / others 2 14
Ba
sic
Ch
ara
cte
rist
ics
of
the
Are
a P
op
ula
tio
n, S
ett
lem
en
ts a
nd
He
alt
h S
tatu
s
21Basic Characteristics of the Area
Access to safe drinking water is limited and some statistics suggest that only 15 % of rural inhabitants have access to safe drinking water. The WHO (2006) statistics show that 31 % of the rural population has sustainable access to improved drinking water sources (96 % of the urban population). This low number is alarming because 70 % of contagious diseases are caused by contaminated water. This is a serious problem for Ethiopia in the effort to establish a strong agricultural community that will be able to safeguard the supply of food for the whole country. One of the priorities of government policy is therefore to provide safe drinking water to rural communities.
Fig. 1.4 Malaria risk in Ethiopia
Ba
sic
Ch
ara
cte
rist
ics
of
the
Are
a P
op
ula
tio
n, S
ett
lem
en
ts a
nd
He
alt
h S
tatu
s

22 Basic Characteristics of the Area
The supply of safe water is not equal in all of the Zones of the region. The total number of facilities and the number of inhabitants for a single facility are shown in Tab. 1.3. Preliminarily results of the population and housing census of 2007 show that a particularly ponds serving for water supply can provide an adequate volume of water, but do not follow the requirements for safe water supply to inhabitants.
The leading causes of hospital and health center morbidity in 2008/2009 in the Somali region are shown in Tab. 1.4.
Zone / Wereda Number of facilities Number of inhabitants per facility
Liben / Filtu 16 (16 wells) 7,872
Afder / Akder none 72,192
Afder /Serer none 55,941
Afder / Chereti none 89,128
Afder / Qarsasula none 39,183
Afder / Gura-damot none 18,859
Afder / Goro Bekeksa none 47,160
Bale / Gura Demole 1 (1 pond) 28,651
Tab. 1.3 Rural water facilities by Zones and Weredas
Tab. 1.4 Leading causes of hospital and health center morbidity 2008/2009
Rank Diagnosis No. of all cases % of all cases
1 Gastro – enteritis and colitis 93,380 13.43
2 A.U.R.I 76,449 10.99
3 Other unspecified malaria 74,024 10.64
4 All forms of pneumonia 63,994 9.2
5 Gento – urinal system 54,111 7.78
6 Gastrities and duodenities 52,136 7.5
7 Anemia 34,954 5.03
8 Infection of skin and subcutaneous tissue 31,693 4.56
9 Parasitic diseases 16,218 2.33
10 Eye diseases 15,580 2.24
Total of leading diseases 512,539 73.7
Total of other diseases 182,865 26.30
Total of all diseases 695,404 100.00
Source: Somali Regional Health Bureau
Ba
sic
Ch
ara
cte
rist
ics
of
the
Are
a P
op
ula
tio
n, S
ett
lem
en
ts a
nd
He
alt
h S
tatu
s

23Basic Characteristics of the Area
Conclusions of a review made by the Ethiopian Health Sector Development Program (HSDP, 2008) show that despite the significant rise in access to water and improved sanitation, there is no data on rates of usage of these services. Ethiopia still suffers from a heavy disease burden that is directly related to poor hygiene practices and sanitation services. Each year, the average Ethiopian child has five to twelve diarrhea episodes and diarrheal illnesses kill between 50,000 to 112,000 children each year. Women and girls are most affected by inadequate sanitation services as they are forced to spend more time fetching water and caring for the sick than participating in income-generating activities or attending school.
During the last few years, there has been an increased level of political commitment to hygiene and environmental health services in Ethiopia leading to the Ministry of Health defining a Hygiene and Environmental Health Program (www.moh.gov.et). The program is based on key policies such as the National Sanitation Strategy and Protocol and the Millennium Sanitation Movement has established a framework that serves to motivate and align relevant actors to speed up sanitation coverage and hygiene behavioral change. In addition, three key ministries – Health, Water Resources and Education – have joined to launch the National WASH program, which provides a strategic framework for achieving a national vision for universal access to hygiene sanitation.
The Ministry of Health has defined the following objectives of the program: • Increase sanitation measures including latrine coverage and ensure facilities are properly
handled, sustained and utilized.• Promote communal solid waste disposal sites, including improvement of medical and other
waste management systems in public and private health institutions.• Increase drinking water quality monitoring; and monitor food safety and food processing
industries.
Health Extension Workers (HWEs) play a significant role in carrying out the key activities of the program throughout communities. HEWs promote personal and environmental hygiene and provide support to the community; increase community awareness and involvement in safe water supply and prevention of water contamination; promote behavioral change to improve food safety and control vector born diseases; build a “Healthy House Model” and work with the relevant institutions to ensure irrigation development projects and water conservation schemes.
Improving safe water supply to people living in the mapped area basin contributes to an improvement in their health which is one of the fundamental problems for the creation of strong pastoral and farm communities capable of full time engagement in agricultural activity.
1.3 Land UsePoor land use practices, improper management systems and lack of appropriate soil conservation
measures have played a major role in causing land degradation problems in the country. Because of the rugged terrain, the rates of soil erosion and land degradation in Ethiopia are high. Setegn (2010) mentions the soil depth of more than 34 % of the land area is already less than 35 cm, indicating that Ethiopia loses a large volume of fertile soil every year and the degradation of land through soil erosion is increasing at a high rate. The highlands are now so seriously eroded that they will no longer be economically productive in the foreseeable future.
The land and water resources are in danger due to the rapid growth of the population, deforestation and overgrazing, soil erosion, sediment deposition, storage capacity reduction, drainage and water logging, flooding, and pollutant transport. In recent years, there has been an increased concern over climate change caused by increasing concentrations of CO
2 and other trace gases in the
atmosphere. A major effect of climate change is alterations in the hydrologic cycles and changes
Ba
sic
Ch
ara
cte
rist
ics
of
the
Are
a P
op
ula
tio
n, S
ett
lem
en
ts a
nd
He
alt
h S
tatu
s La
nd
Use

24 Basic Characteristics of the Area
in water availability. Increased evaporation combined with changes in precipitation characteristics has the potential to affect runoff, frequency and intensity of floods and droughts, soil moisture, and water supplies for irrigation and generation of hydroelectric power.
Only small part of the Filtu area is made up of intensively and moderately cultivated land (Fig. 1.5).
Fig. 1.5 Land use
Ba
sic
Ch
ara
cte
rist
ics
of
the
Are
aLa
nd
Use

25
The entire study area is located on the eastern shoulder of the southeastern Ethiopian plateau with a general slope to the southeast. The area is predominantly composed of plain and hill domes with summits not greater than 1,600 m a.s.l. (Fig. 2.1). The Filtu highlands cover the western part of the area and the lowland plains along Weyb River, with altitude of about 500 m a.s.l. are located in the eastern part of the area, and the Genale, Melmel and Weyb river gorges with an altitude of between 500 and 275 m a.s.l. are located in the centre and southeastern parts of the area.
The most distinct physiographic units are as follows:• River gorges – Genale, Melmel and Weyb (in the northern part of the area) rivers• Plains – flat plains and gentle slopes e.g. Chereti plain• Highlands – Filtu highlands, Northeastern highlands
2. Selected Physical and Geographical Settings2.
Selected Physical and Geographical Settings
Fig. 2.1 Generalized physiographic units
Se
lect
ed
Ph
ysic
al a
nd
Ge
og
rap
hic
al S
ett
ing
sG
eom
orp
ho
log
y

26 Selected Physical and Geographical Settings
2.1 GeomorphologyThe geomorphology of the area is variable and it is generally the result of repeated tectonic
events with the associated erosion of mainly Mesozoic sedimentary rocks as well as deposition processes. The tectonic activity and lithological variation in the area also partly or wholly control the drainage density and drainage pattern. Most of the river channels follow the young lineaments. The maximum elevation is 1,562 m a.s.l. (no name peak) in the Filtu highlands about 30 km NE of Fitu town and a minimum elevation of 275 m on the bank of the Genale River in the southeastern corner of the map sheet (on the border with the Sede sheet).
One of the most important phenomena of the area results from the general slope of the eastern Ethiopian plateau to the southeast, which is a result of global tectonics and influences the recent direction of surface as well as groundwater flow.
River Gorges Deep gorges are developed along the Genale and Melmel rivers (Fig. 2.2). The valley of the Weyb
River is deep only in the northern part of the sheet; in the central and southern part the valley is wider and not so deep, only cutting alluvial sediments.
Plains The lowlands occupy a vast area of flat land around Chereti town. The elevation ranges between
400–700 m a.s.l. This geomorphic zone (bottom of river gorges and Chereti flatland) covers a total of 5,500 km2 (31 %) of the study area. The central flat plains and gentle slopes between the Weyb and Genale cover about 9,300 km2 (52 %) of the Filtu map sheet. It is mostly represented by flat plains covered by thin residual soils and gentle slopes to the Genale and Welmel river gorges. The elevation ranges between 500–800 m a.s.l. It is relatively well inhabited and farming is practiced due to the availability of water in Mesagid.
Fig. 2.2 Gorges of Genale River viewed from the SW
Se
lect
ed
Ph
ysic
al a
nd
Ge
og
rap
hic
al S
ett
ing
s G
eo
mo
rph
olo
gy
27Selected Physical and Geographical Settings
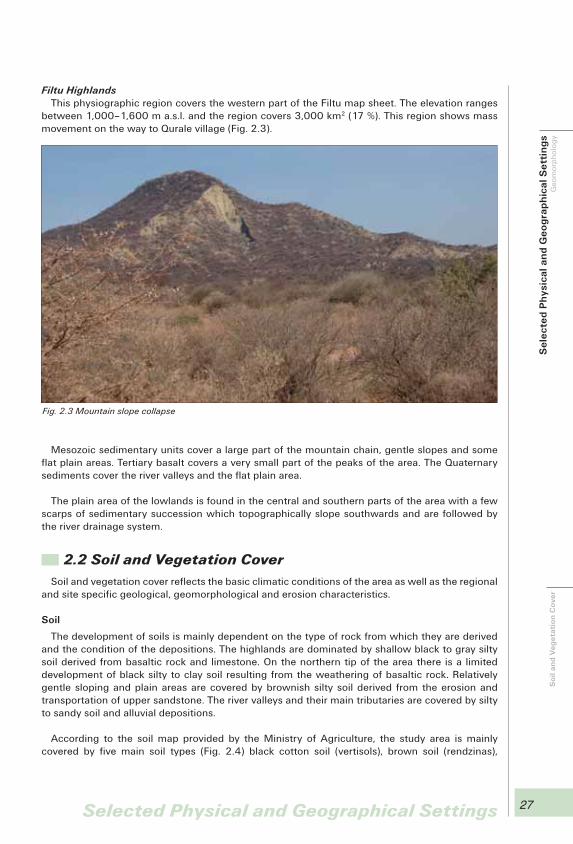
Filtu HighlandsThis physiographic region covers the western part of the Filtu map sheet. The elevation ranges
between 1,000–1,600 m a.s.l. and the region covers 3,000 km2 (17 %). This region shows mass movement on the way to Qurale village (Fig. 2.3).
Mesozoic sedimentary units cover a large part of the mountain chain, gentle slopes and some flat plain areas. Tertiary basalt covers a very small part of the peaks of the area. The Quaternary sediments cover the river valleys and the flat plain area.
The plain area of the lowlands is found in the central and southern parts of the area with a few scarps of sedimentary succession which topographically slope southwards and are followed by the river drainage system.
2.2 Soil and Vegetation CoverSoil and vegetation cover reflects the basic climatic conditions of the area as well as the regional
and site specific geological, geomorphological and erosion characteristics.
Soil
The development of soils is mainly dependent on the type of rock from which they are derived and the condition of the depositions. The highlands are dominated by shallow black to gray silty soil derived from basaltic rock and limestone. On the northern tip of the area there is a limited development of black silty to clay soil resulting from the weathering of basaltic rock. Relatively gentle sloping and plain areas are covered by brownish silty soil derived from the erosion and transportation of upper sandstone. The river valleys and their main tributaries are covered by silty to sandy soil and alluvial depositions.
According to the soil map provided by the Ministry of Agriculture, the study area is mainly covered by five main soil types (Fig. 2.4) black cotton soil (vertisols), brown soil (rendzinas),
Fig. 2.3 Mountain slope collapse
Se
lect
ed
Ph
ysic
al a
nd
Ge
og
rap
hic
al S
ett
ing
sG
eom
orp
ho
log
yS
oil
an
d V
eg
eta
tio
n C
ove
r

28 Selected Physical and Geographical Settings
lateritic soil (cambisols) and arid type of soils in eastern part of the sheet, including Chereti plain (yermosols, solonchaks). In detail, the Filtu map sheet is covered by 10 soil types.
Cambisols have limited agricultural value as they occur dominantly on slopes, are often shallow or have many stones or rock outcrops. Where cambisols are deep and not stony they are good for agriculture but available P contents can be low. Chromic Cambisols have a strong brown or red color. Eutric Cambisols are exposed around Filtu town and the ridge between Welmel and Wabe Mena rivers. Rendzic Leptosols covers a wide area in the western part of the study area.
Rendzinas are dark, grayish-brown and humus rich. They are one of the soils most closely associated with the bedrock type and an example of initial stages of soil development. Soils of this type contain a significant amount of gravel and stones. They are usually developed beneath grassland formed by weathering of soft rock types: usually carbonate rocks (dolomite, limestone, marl, chalk) but occasionally sulfate rocks (gypsum).
Lithosols are mineral soils less than 10 cm thick, developed over hard rock. These soils have no agricultural value. They are often referred to as ˝skeletal soils“ and because of their extreme shallowness and, usually, steepness and consequent high erosion hazard.
Fluvisols are soils developed from recent alluvial deposits. They are moderately deep, well to moderately drained, fine to medium textured and clay to sandy clay loam soils. The soil is found
Fig. 2.4 Distribution of soil types
Se
lect
ed
Ph
ysic
al a
nd
Ge
og
rap
hic
al S
ett
ing
s S
oil
an
d V
eg
eta
tio
n C
ove
r

29Selected Physical and Geographical Settings
in flat areas and is frequently flooded. Calcaric Fluvisols exist in the Weyb river channel in the southwestern part of the study area. They contain calcareous materials. This soil is good for agriculture and is often used.
Arenosols are soils formed from coarse textured unconsolidated material. Arenosols are excessively drained, moderately deep, coarse textured sandy clay loam to sandy loam soil derived either from alluvial/colluvial or sandstone parent material. Cambic Arenosols are exposed on the summit of Filtu Mountain and in the NE corner of the study area. These soils are very permeable with no natural fertility.
Vertisols are heavy clay soils in flat areas that have a pronounced dry season during which they shrink and have large deep cracks in a polygonal pattern. During the wet season the clay swells and causes pressure in the subsoil. Vertisols have a fairly good but limited agricultural potential because the land is rather difficult to prepare. Dry soils are hard and wet soils are sticky. There is only a short period when moisture conditions of the surface layer are favorable to prepare land. Another difficulty is that the drainage of the subsoil is very low, because of the swelling clay. Very often the soils are flooded or have stagnant water during the wet season. The organic matter content in vertisols is often not more than 1 %. The soil has high water retention but a relatively small amount of water is available for plant growth. Rooting may be restricted because of the swelling and shrinking properties of the soil. Vertisols are found in most parts of Mesagid and the Wabe Mena and Genale river channels and on the western part of the Filtu map sheet on the way from Filtu to Hargele.
Yermosoils are soils formed under an arid moisture regime and have a low level of organic matter with a silty loam and or very fine sandy loam texture. The gypsic horizon is characterized by its coarse crystalline nature and contains more that 30 % of gypsum in the C-horizon. The soil covers large areas of plains in the eastern part of the map.
Solonchaks are the saline soils formed on recent alluvial and lacustrine material, often in closed basins. The main identifying feature of solonchaks is their high soluble salt content. Orthic solonchaks lack salt crusts with either takyric or hydromorphic features in the top 50 cm of the soil, but do have a weakly developed organic A-horizon. Solonchaks are extremely difficult soils to manage due to their severe salinity. The high soluble salt content affects crop growth in two ways. First the osmotic balance of the soil solution is altered, making it extremely difficult for roots to extract nutrients from the soil. This results in stunted growth and depressed yields unless salt-tolerant crop varieties are grown. Secondly, toxic effects become important when soluble salt contents exceed about 2 %. Accumulations of chloride and boron are particularly important, while sodium only really affects the ionic balance of the soil solution. Various development strategies such as flushing out salts with irrigation water, the addition of less saline soil material, and the use of salt-tolerant crops are favorable measures for the less saline solonchaks, but where the salt content is the highest agriculture is impossible.
Vegetation
The distribution of natural vegetation in the area is almost entirely controlled by the climate conditions created by differences in altitude. In general, the study area is poorly vegetated and is almost entirely covered with bushes and dried thorny and narrow leaf trees (see acacia tree in Fig. 2.5). Palm trees are found following the course of some intermittent and perennial rivers (Fig. 2.6). These palm trees indicate the presence of saline groundwater at shallow depths. Agricultural plants cover populated areas in a higher percentage compared to unpopulated areas. Some parts of the highlands in the west the map area are deforested for farm land, energy (fire wood) and construction of houses etc.
Se
lect
ed
Ph
ysic
al a
nd
Ge
og
rap
hic
al S
ett
ing
sS
oil
an
d V
eg
eta
tio
n C
ove
r

30 Selected Physical and Geographical Settings
Fig. 2.5 Acacia tree
Fig. 2.6 Palm tree
Se
lect
ed
Ph
ysic
al a
nd
Ge
og
rap
hic
al S
ett
ing
s S
oil
an
d V
eg
eta
tio
n C
ove
r

31Selected Physical and Geographical Settings
Deep gorges are relatively densely vegetated by hard woods and coniferous forests in places. Varieties of large brood leaf trees were found following the stream channels and river valleys.
2.3 Climatic CharacteristicsThe area is mainly characterized by a wet climate in which the rainy season passes from March to
May and from October to November. The mean annual rainfall is between 350 mm in the southeastern lowlands and 600 mm in the northwestern highlands based on rainfall assessment within the Genale-Dawa basin. The mean maximum annual temperature is 28 °C and the mean minimum annual temperature is 20 °C based on the temperature – elevation relationship for the Genale-Dawa basin.
2.3.1 Climatic Zones and MeasurementsThe climatic conditions of Ethiopia are mostly dominated by altitude. According to Daniel
Gamatchu (1977) there are wide varieties in climatic zones. Climatic zones defined by Javier Gozálbez and Dulce Cebrián (2006) and Tesfaye Chernet (1993) are shown in Tab. 2.1.
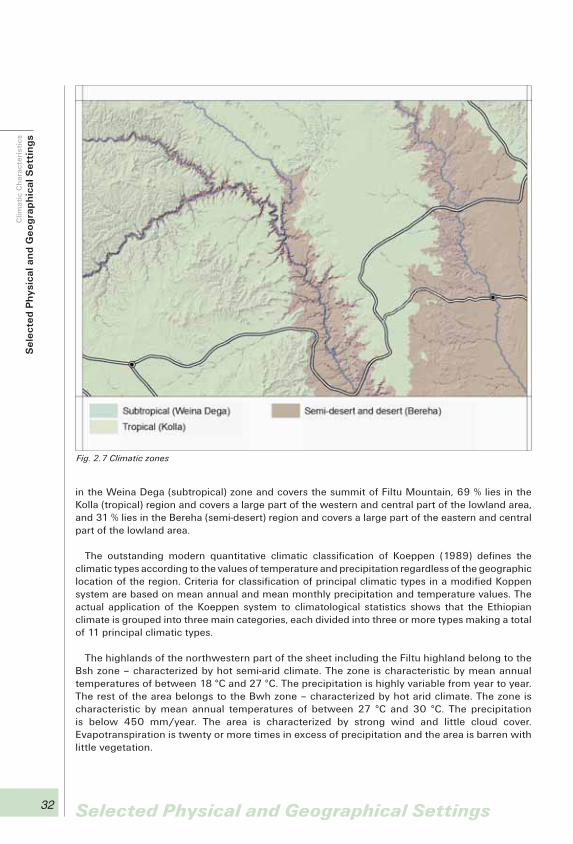
A climatic zoning map (Fig. 2.7) has been compiled based on the climatic region classification given in Tab. 2.1 and the elevation of the study area. It was found that only 0.01 % of the area lies
Tab. 2.1 Ethiopian climate classification
Remark: after Javier Gozálbez and Dulce Cebrián (2006), Tesfaye Chernet (1993)
Name / Altitude / Mean annual temperature
Precipitationbelow 900 mm
Precipitationbetween 900 and 1,400 mm
Precipitationabove 1,400 mm
High Wurch (Kur)above 3,700 mbelow 5 °C
Afro-alpinemeadows of grazing land and steppes, no farmingHelichrysum, Lobelia
Wurch (Kur)3,700–3,200 m 5–10 °C
Sub-afroalpine barleyErica, Hypericum
Sub-afroalpine barleyErica, Hypericum
Dega3,200–2,300 m10–15 °C
Afro-mountain (temperate)forest – woodlandbarley, wheat, pulsesJuniperus, Hagenia, Podo-carpus
Afro-mountain (temperate)bamboo forestbarley, wheat, nug, pulsesJuniperus, Hagenia, Podocar-pu, bamboo
Weina Dega2,300–1,500 m15–20 °C
Savannah (sub-tropical)wheat, teff, some cornacacia savannah
Shrub-savannah(sub-tropical)corn, sorghum, teff, enset, nug, wheat, barleyAcacia, Cordia, Ficus
Wooded savannah(sub-tropical)corn, teff, nug, enset, barleyAcacia, Cordia, Ficus, bam-boo
Kolla1,500–500 m above 30 °C
Tropicalsorghum and teffacacia bushes
Tropicalsorghum, teff, nug, peanutsAcacia, Cordia, Ficus
Wet tropicalmango, sugar cane, corn, coffee, orangesCyathea, Albizia
Berehabelow 500 mabove 40 °C
Semi-desert and desertcrops only with irrigationthorny acacias, Commiphora
Se
lect
ed
Ph
ysic
al a
nd
Ge
og
rap
hic
al S
ett
ing
sC
lima
tic
Ch
ara
cte
rist
ics
32 Selected Physical and Geographical Settings
in the Weina Dega (subtropical) zone and covers the summit of Filtu Mountain, 69 % lies in the Kolla (tropical) region and covers a large part of the western and central part of the lowland area, and 31 % lies in the Bereha (semi-desert) region and covers a large part of the eastern and central part of the lowland area.
The outstanding modern quantitative climatic classification of Koeppen (1989) defines the climatic types according to the values of temperature and precipitation regardless of the geographic location of the region. Criteria for classification of principal climatic types in a modified Koppen system are based on mean annual and mean monthly precipitation and temperature values. The actual application of the Koeppen system to climatological statistics shows that the Ethiopian climate is grouped into three main categories, each divided into three or more types making a total of 11 principal climatic types.
The highlands of the northwestern part of the sheet including the Filtu highland belong to the Bsh zone – characterized by hot semi-arid climate. The zone is characteristic by mean annual temperatures of between 18 °C and 27 °C. The precipitation is highly variable from year to year. The rest of the area belongs to the Bwh zone – characterized by hot arid climate. The zone is characteristic by mean annual temperatures of between 27 °C and 30 °C. The precipitation is below 450 mm/year. The area is characterized by strong wind and little cloud cover. Evapotranspiration is twenty or more times in excess of precipitation and the area is barren with little vegetation.
Fig. 2.7 Climatic zones
Se
lect
ed
Ph
ysic
al a
nd
Ge
og
rap
hic
al S
ett
ing
s C
lima
tic
Ch
ara
cte
rist
ics
33Selected Physical and Geographical Settings
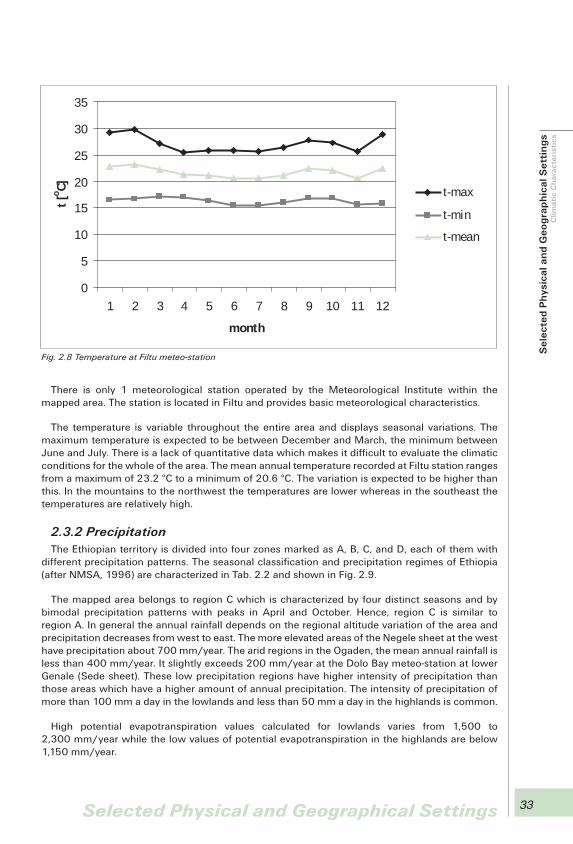
There is only 1 meteorological station operated by the Meteorological Institute within the mapped area. The station is located in Filtu and provides basic meteorological characteristics.
The temperature is variable throughout the entire area and displays seasonal variations. The maximum temperature is expected to be between December and March, the minimum between June and July. There is a lack of quantitative data which makes it difficult to evaluate the climatic conditions for the whole of the area. The mean annual temperature recorded at Filtu station ranges from a maximum of 23.2 °C to a minimum of 20.6 °C. The variation is expected to be higher than this. In the mountains to the northwest the temperatures are lower whereas in the southeast the temperatures are relatively high.
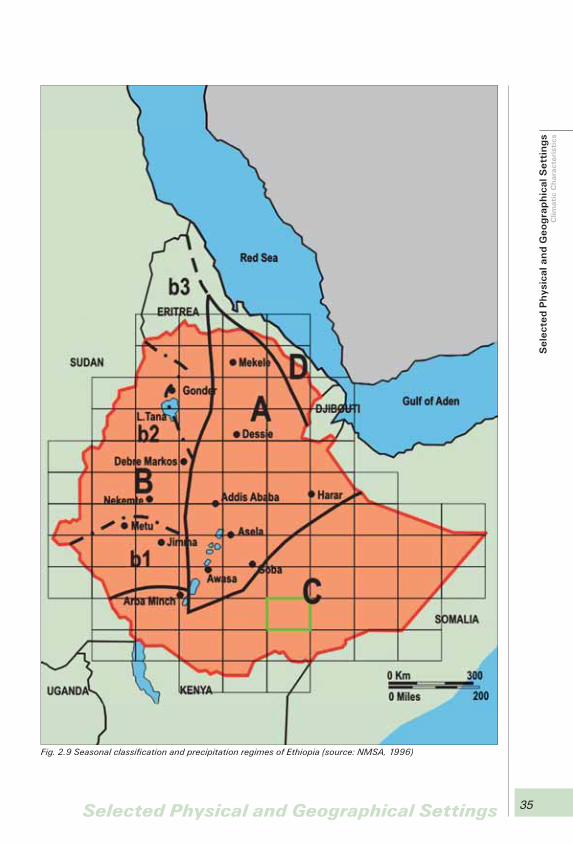
2.3.2 Precipitation The Ethiopian territory is divided into four zones marked as A, B, C, and D, each of them with
different precipitation patterns. The seasonal classification and precipitation regimes of Ethiopia (after NMSA, 1996) are characterized in Tab. 2.2 and shown in Fig. 2.9.
The mapped area belongs to region C which is characterized by four distinct seasons and by bimodal precipitation patterns with peaks in April and October. Hence, region C is similar to region A. In general the annual rainfall depends on the regional altitude variation of the area and precipitation decreases from west to east. The more elevated areas of the Negele sheet at the west have precipitation about 700 mm/year. The arid regions in the Ogaden, the mean annual rainfall is less than 400 mm/year. It slightly exceeds 200 mm/year at the Dolo Bay meteo-station at lower Genale (Sede sheet). These low precipitation regions have higher intensity of precipitation than those areas which have a higher amount of annual precipitation. The intensity of precipitation of more than 100 mm a day in the lowlands and less than 50 mm a day in the highlands is common.
High potential evapotranspiration values calculated for lowlands varies from 1,500 to 2,300 mm/ year while the low values of potential evapotranspiration in the highlands are below 1,150 mm/year.
Fig. 2.8 Temperature at Filtu meteo-station
0
5
10
15
20
25
30
35
1 2 3 4 5 6 7 8 9 10 11 12
month
t [o C] t-max
t-min
t-mean
Se
lect
ed
Ph
ysic
al a
nd
Ge
og
rap
hic
al S
ett
ing
sC
lima
tic
Ch
ara
cte
rist
ics

34 Selected Physical and Geographical Settings
There is only one climatic station within the Filtu map sheet. The basic characteristics of the stations are show in Tab. 2.3. Data from Dollo Odo meteo-station were used to demonstrate arid character of the lowest Genale-Dawa basin at Somali and Kenyan border.
Basic precipitation data from the Filtu (Tab. 2.4) meteo-station represents the typical precipitation pattern (C) of the region. A graphical presentation of precipitation pattern is shown in Fig. 2.10.
Years with a full set of data were extracted from the review of data from the period from 1973 to 1998. Long-term precipitation data is given in Tab. 2.5 and Fig. 2.11. The long-term average annual precipitation from Filtu meteo-station is 420 mm/year for the sixteen assessed years.
Tab. 2.2 Characterization of the precipitation pattern in Ethiopia
Zone Precipitation pattern
A
This region mainly covers the central and central eastern part of the country. It is characterized by three distinct seasons, and by bimodal precipitation patterns with small peaks in April and the main rainy season during mid June to mid September with peaks in July.
B
This region covers the western part of the country. It is characterized by a single pre-cipitation peak. Two distinct seasons, one being wet and the other dry, are encoun-tered in this region. The analysis of mean monthly precipitation patterns shows that this zone can be split into southwestern (b1) with the wet season during February/March to October/November, western (b2) with the wet season during April/May to October/November, and northwestern (b3) with the wet season during June to September parts.
CThis region mainly covers the southern and southeastern parts of the country. It has two distinct precipitation peaks with a dry season between. The first wet season is from March to May and the second is from September to November.
DThe Red Sea region in the extreme northeastern part of the country receives diffused precipitation with no distinct pattern; however, precipitation occurs mainly during the winter.
Tab. 2.3 Basic characteristics Fitu and Dollo Odo meteo-stations
Remark: * Sede sheet
Map ID Station Class X UTM Y UTMAltitude [m a.s.l.]
Data types Sub-basin
RF23 Filtu 1 683757 565287 1,159 P, T, E ,H, S, W Genale
RF22 Dollo Odo* 1 173328 462342 180 P, T, E ,H, S, W Genale
Tab.. 2.4 Monthly long-term average precipitation at Filtu and Dollo Odo meteo-stations [mm]
Month Jan Feb Mar Apr May Jun Jul Aug Sep Oct Nov Dec
Filtu 2.9 8.5 42.3 131.2 99.5 5.6 0.4 0.4 9.7 70.5 39.3 10.3
Dollo Odo 0.6 0.6 15.4 94.6 60.3 0.5 1.7 0.4 1.2 35.5 16.0 12.8
Se
lect
ed
Ph
ysic
al a
nd
Ge
og
rap
hic
al S
ett
ing
s C
lima
tic
Ch
ara
cte
rist
ics
35Selected Physical and Geographical Settings
Fig. 2.9 Seasonal classification and precipitation regimes of Ethiopia (source: NMSA, 1996)
Se
lect
ed
Ph
ysic
al a
nd
Ge
og
rap
hic
al S
ett
ing
sC
lima
tic
Ch
ara
cte
rist
ics

36 Selected Physical and Geographical Settings
Fig. 2.10 The Filtu meteo-station precipitation pattern
0
20
40
60
80
100
120
140
Jan Feb Mar Apr May Jun Jul Aug Sep Oct Nov Dec
month
aver
age
prec
ipit
atio
n [m
m/m
onth
]
Tab. 2.5 Long-term monthly rainfall at Filtu [mm] (fully recorded years only)
Year Jan Feb Mar Apr May Jun Jul Aug Sep Oct Nov Dec Total
1973 0.0 0.0 0.0 72.4 47.0 0.0 0.0 0.5 10.1 114.3 10.2 0.0 254.5
1974 0.3 0.0 54.1 134.1 197.6 0.0 0.0 5.6 0.3 61.6 6.5 13.7 473.8
1975 4.9 0.0 10.8 112.1 121.7 0.0 0.0 0.0 21.9 72.9 42.2 0.0 386.5
1976 0.0 0.0 0.0 119.8 90.2 0.0 0.0 0.0 18.8 108.9 32.6 3.7 374.0
1980 0.0 0.0 0.0 71.3 123.2 0.0 0.0 0.0 0.0 82.0 16.1 0.0 292.6
1981 0 .0 15.9 91.3 250.8 30.5 0.0 0.0 0.0 0.0 67.8 42.9 3.6 502.8
1985 0.0 0.0 14.7 253.1 166.5 1.0 0.0 0.0 2.3 79.5 74.6 0.0 591.7
1986 0.0 0.0 55.0 250.8 119.3 0.0 2.9 0.0 0.0 29.6 59.2 0.0 516.8
1988 0.0 2.7 22.6 178.4 1.0 0.5 0.9 0.3 19.8 70.2 8.9 4.2 309.5
1989 0.0 0.0 14.1 246.7 117.7 0.0 3.6 0.8 16.2 36.3 60.4 9.5 505.3
1990 0.0 22.8 111.4 175.8 14.0 0.0 0.5 0.0 4.4 57.8 61.5 19.6 467.8
1991 0.0 1.4 145.9 51.6 176.2 0.0 1.0 0.0 5.9 20.1 9.4 20.5 432.0
1992 0.0 0.0 0.0 79.7 19.3 1.3 0.0 0.0 1.7 45.7 65.9 89.7 303.3
1993 12.0 0.0 0.0 197.4 212.2 0.0 0.0 2.2 1.2 45.4 21.7 4.3 496.4
1994 0.0 0.0 0.0 86.4 76.6 0.0 0.0 0.0 51.9 159.0 93.5 16.6 484.0
1998 39.6 49.9 2.1 73.4 78.7 60.1 0.8 0.0 0.0 23.6 4.6 0.6 333.4
Se
lect
ed
Ph
ysic
al a
nd
Ge
og
rap
hic
al S
ett
ing
s C
lima
tic
Ch
ara
cte
rist
ics

37Selected Physical and Geographical Settings
The graph shows the high fluctuations in precipitation. Differences in precipitation can exceed 100 % in some years. The figure also shows the precipitation deficit in 1973 which was a period of serious drought in the area.
Fig. 2.11 Long-term fluctuation and average of precipitation from the Filtu meteo-station
0
100
200
300
400
500
600
70019
72
1974
1976
1978
1980
1982
1984
1986
1988
1990
1992
1994
1996
1998
Avg
year
prec
ipita
tion
[mm
/yea
r]
Fig. 2.12 The Dollo Odo meteo-station precipitation pattern
0
10
20
30
40
50
60
70
80
90
100
Jan Feb Mar Apr May Jun Jul Aug Sep Oct Nov Dec
month
aver
age
prec
ipit
atio
n [m
m/m
onth
]
Se
lect
ed
Ph
ysic
al a
nd
Ge
og
rap
hic
al S
ett
ing
sC
lima
tic
Ch
ara
cte
rist
ics

38 Selected Physical and Geographical Settings
The average annual precipitation from the Dollo Odo meteo-station is 210 mm/year for the six assessed years (Fig. 2.13) and its precipitation pattern is shown in Fig. 2.12.
The adopted average precipitation for the Filtu area is 420 mm, supposing that the long-term average of precipitation in Filtu meteo-station gives a good representation of the whole map sheet.
2.4 Hydrography and Hydrology of the AreaThe Filtu area is found within the Genale-Dawa basin. It is known as the third biggest basin in
Ethiopia and has a size of about 172,880 km2. The basin has a relatively low runoff with a mean flow of 125 m3/s. The minimum flow of the Genale and Weyb is from December to March and the maximum flow is from August to November. This is probably due to the dominant arid character of the climate. The general drainage trend in the area is from the elevated northwestern mountainous area to the southeastern lowland plain area of the Ogaden basin and the Indian Ocean. The principal river basins of the area are shown in Fig. 2.14.
2.4.1 Surface Water Network DevelopmentThe various intermittent and perennial rivers found in the study area are the middle courses
of the Weyb and Genale which form the main sub-basins of the Genale-Dava basin. The Genale is only a perennial river in drought periods. The principal tributaries of the Genale are the Wabe Mena and Welmel. Other rivers are dry or contain water only locally during the dry season. These rivers only flow during the rainy season. There is also part of the Dawa basin in the southwestern corner of the sheet.
The drainage pattern of the area is asymmetric and dendritic in the northwestern part with moderate to high drainage density. Welmel, Wabe Mena and Genale rivers drain this part. These rivers form deep and narrow gorges but become flat and wide in the southern part of the map sheet. A parallel drainage pattern is dominant in the eastern part.
Fig. 2.13 Long-term fluctuation and average of precipitation from the Dollo Odo meteo-station
0
50
100
150
200
250
300
350
400
450
1986 1987 1988 1989 1990 1991 1992 1993 1994 Avg
year
prec
ipit
atio
n [m
m/y
ear]
Se
lect
ed
Ph
ysic
al a
nd
Ge
og
rap
hic
al S
ett
ing
s C
lima
tic
Ch
ara
cte
rist
ics
Hyd
rog
rap
hy
an
d H
ydro
log
y o
f th
e A
rea

39Selected Physical and Geographical Settings
The Genale and Weyb are used for water supply for the towns of Filtu and Chereti and their surrounding villages, respectively (Fig. 2.15). The Weyb is reported to flow in its middle reaches only between May and November. It is seasonal river up to Sof Omar in the highlands and people living around the Weyb use the river water during the six wet months and dug water holes in the river bed during the dry period from December to April.
Fig. 2.14 The principal river basins of the area
Fig. 2.15 Dam on Weyb River in Chereti town (Photo taken 9th of Feb, 2010 G.C)
Se
lect
ed
Ph
ysic
al a
nd
Ge
og
rap
hic
al S
ett
ing
sH
ydro
gra
ph
y a
nd
Hyd
rolo
gy
of
the
Are
a

40 Selected Physical and Geographical Settings
2.4.2 Surface Water RegimeThere are about 38 river gauging stations within the Genale-Dawa basin. Some of them are
operational but many stations have no data. There are no river gauging stations registered on the Filtu sheet. River monitoring data representing the basic characteristics of the main rivers which can be used for characterization of the hydrological situation on the Filtu sheet were selected for assessment of surface as well as baseflow data. The selected river stations are summarized in Tab. 2.6.
Records from all stations reflect the fact that the river discharge is directly proportional to the intensity of rainfall within the basin. There is a high discharge fluctuation between the wet and dry season of the year. The highest flow period is from July to November and the peak flow for all rivers is usually recorded in September and/or October. Mean monthly flow of the Genale River at Girja (Upper Genale), Chenamasa and Halowey gauging stations is shown in Fig. 2.16.
The calculated specific runoff is 2.0 l/s.km2 based on data from flow measurements and calculated specific runoff in the gauging stations shown in Tab. 2.7 as well as the appropriate area of the pertinent river basins within the Filtu sheet. This specific runoff has been used for further calculations.
Tab. 2.6 Data on the nearest river gauging stations
Map ID River Station X UTM Y UTMAltitude[m a.s.l.]
Area [km2] Sub-basin Map sheet
RG1 Dawa Melka Guba 535132 537536 750 20,097.9 Dawa Wachile
RG2 Dawa Siftu 818049 438774 200 48,495.9 Dawa Sheet border
RG11 Genale Chenemasa 559250 630852 1,120 9,190.3 Genale Negele
RG19 Genale Kole Bridge 812770 490749 198 56,135.5 Genale Sede
RG10 Genale Halowey 821046 481599 195 56,582.9 Genale Sede
RG21 Genale Weldia/Donto 173849 472191 181 82,027.0 Genale Dolo
RG16 Welmel Melka Amana 586880 689892 1,060 1,395.8 Genale Dodola
RG37 Weyb Sof Omar 703729 763790 1175 4,546.3 Genale Megado
Tab. 2.7 Runoff data
Map ID River StationMean flow [m3/s]
Annual flow[mm]
Area [km2]
Specific runoff[l/s.km2]
Sub-basin
Aquifer
RG1 Dawa Melka Guba 27.67 43.4 20,097.9 1.38 Dawa Basement
RG2 Dawa Siftu 25.61 16.7 48,495.9 0.53 DawaBasement/limestone
RG11 Genale Chenemasa 92.12 316.3 9,190.3 10.02 GenaleBasalt/basement
RG19 Genale Kole bridge 148.22 83.3 56,135.5 2.64 Genale Sediment
RG10 Genale Halowey 157.52 87.9 56,582.9 2.78 Genale Sediment
RG 37 Weyb Sof Omar 23.46 162.8 4,546.3 5.16 Genale Limestone
Se
lect
ed
Ph
ysic
al a
nd
Ge
og
rap
hic
al S
ett
ing
s H
ydro
gra
ph
y a
nd
Hyd
rolo
gy
of
the
Are
a

41Selected Physical and Geographical Settings
2.4.3 BaseflowThe same gauging stations were used for calculation of baseflow, because these stations have
provided flow data for several years.
Baseflow represents one of the most important types of information on groundwater resources in the basin. The methods were analyzed by Bogena et al. (2005) and it was found by means of a correlation analysis that the appropriate baseflow values can be determined on the basis of daily river discharge data. The baseflow can be identified from a series of observed monthly low-water runoff values (MoLR) as the simplest assessment method. It has been shown that a long-term average of MoLR of a 20-year period is a good approximation for groundwater recharge in unconsolidated rock areas. However, in consolidated rock areas the MoLR values are often affected by interflow leading to a significant overestimation of groundwater recharge. Hence, a more sophisticated hydrograph separation method based on the Kille method is recommended in these areas.
The Kille method (see Fig. 2.17) for calculation of baseflow was used in the study together with separation of hydrographs where baseflow data is deduced from the discharge record of a stream by separating the baseflow component from the total discharge.
The application of the method can be summarized as follows:1. For each month in a year the minimum daily discharge rate (Q in m3/s) was selected. In
total, the number of Q values is n = 12 × length of the record set in years.2. Sort the n rates into ascending order and plot them against the corresponding orders (i).
In general, a subset of points of low discharge in the scatter plot fits on a straight line.3. The linear zone of the distribution curve represents the baseflow. The MoLR is calculated
by means of the gradient m, the number of values n and the axis intercept y0: MoLR = m ×
Fig. 2.16 Mean monthly flow of the Genale River at Halowey, Chenemasa and Girja gauging stations [m3/s]
0
50
100
150
200
250
300
1 2 3 4 5 6 7 8 9 10 11 12
month
aver
age
mea
n m
onth
ly fl
ow [m
3 /s]
HalowayChenemasaUpper Genale
Se
lect
ed
Ph
ysic
al a
nd
Ge
og
rap
hic
al S
ett
ing
sH
ydro
gra
ph
y a
nd
Hyd
rolo
gy
of
the
Are
a

42 Selected Physical and Geographical Settings
n / 2 + y0. If the hydrographic basin is closed (i.e. there is no water flowing in/out from/to an adjacent basin) and the aquifer is in steady state with respect to storage on an annual basis, then the average groundwater recharge rate R = MoLR.
4. Convert R into a value in mm/y, i.e. multiply the value in m3/s by 60 × 60 × 24 × 365 × 1,000 and subsequently divide the result by the drainage area of the basin in m2.
Data on baseflow assessed by the Kille method is shown in Fig. 2.18 and in Tab. 2.8 together with baseflow data assessed by the hydrograph separation method.
Assessment of baseflow using the Kille method revealed comparable results for Dawa, Genale and Weyb rivers (see Tab. 2.8). Results of the Kille method should only be considered as informative in case there is not enough data to eliminate short-term climatic variations.
For further calculation the specific baseflow for the Bedesa area has been adopted to be 2.5 l/s. km2 based on assessment by the Kille method.
Separation of the hydrograph (see Fig. 2.19) is another method that was used for assessment of baseflow. Baseflow separation techniques use the time-series record of stream flow to derive the baseflow signature. The common separation methods are either graphical which tend to focus on defining the points where the baseflow intersects the rising and falling limbs of the quickflow response, or involve filtering where data processing of the entire stream hydrograph derives a baseflow hydrograph.
The graphical method was used for assessment of baseflow for rivers of the area. The daily flow data were used to plot the baseflow component of a flood hydrograph event, including the point where the baseflow intersects the falling limb. Stream flow subsequent to this point was assumed to be entirely baseflow, until the start of the hydrographic response to the next significant rainfall event. These graphical approaches (Fig. 2.19) to partitioning baseflow vary in complexity and include (Linsley, 1958):
a) the constant discharge method (green line on the chart) assuming that baseflow is constant during the storm hydrograph; the minimum streamflow immediately prior to the rising limb is used as the constant value;
b) the constant slope method (blue line on the chart) connecting the start of the rising limb with the inflection point on the receding limb; this assumes an instant response in baseflow to the rainfall event;
Fig. 2.17 Method of Kille baseflow assessment
MoLR = 0.00060 n/2 + 0.02296
0
0,1
0,2
0,3
0,4
0,5
0,6
0 100 200 300 400 500 600 i
MoL
R [m
3 /s]
n
linear zone of the distribution curve
n/2y0
interflow
baseflow
Se
lect
ed
Ph
ysic
al a
nd
Ge
og
rap
hic
al S
ett
ing
s H
ydro
gra
ph
y a
nd
Hyd
rolo
gy
of
the
Are
a
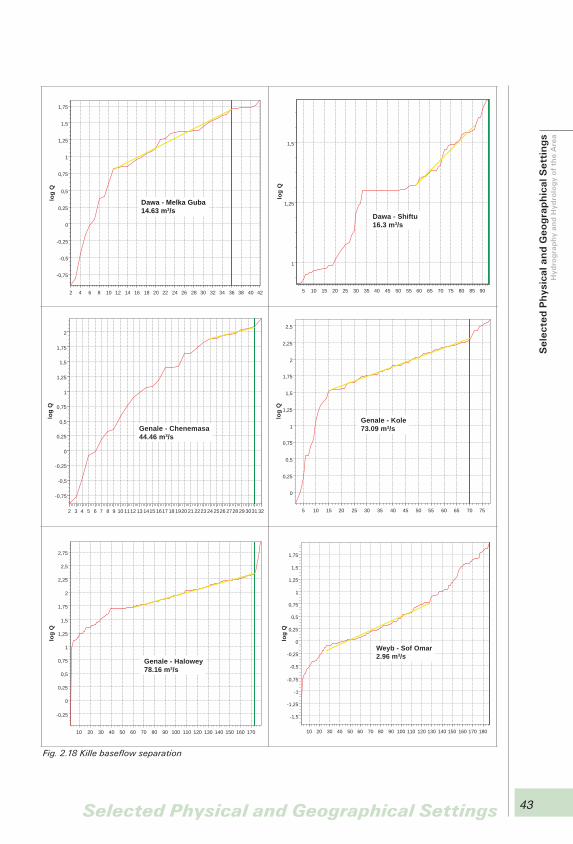
43Selected Physical and Geographical Settings
Fig. 2.18 Kille baseflow separation
42403836343230282624222018161412108642
log
Q
1,75
1,5
1,25
1
0,75
0,5
0,25
0
-0,25
-0,5
-0,75
Dawa - Melka Guba14.63 m3/s
323130292827262524232221201918171615141312111098765432
log
Q
2
1,75
1,5
1,25
1
0,75
0,5
0,25
0
-0,25
-0,5
-0,75
Genale - Chenemasa44.46 m3/s
90858075706560555045403530252015105
log
Q
1,5
1,25
1
Dawa - Shiftu16.3 m3/s
75706560555045403530252015105
log
Q
2,5
2,25
2
1,75
1,5
1,25
1
0,75
0,5
0,25
0
Genale - Kole73.09 m3/s
170160150140130120110100908070605040302010
log
Q
2,75
2,5
2,25
2
1,75
1,5
1,25
1
0,75
0,5
0,25
0
-0,25
Genale - Halowey78.16 m3/s
180170160150140130120110100908070605040302010
log
Q
1,75
1,5
1,25
1
0,75
0,5
0,25
0
-0,25
-0,5
-0,75
-1
-1,25
-1,5
Weyb - Sof Omar2.96 m3/s
Se
lect
ed
Ph
ysic
al a
nd
Ge
og
rap
hic
al S
ett
ing
sH
ydro
gra
ph
y a
nd
Hyd
rolo
gy
of
the
Are
a
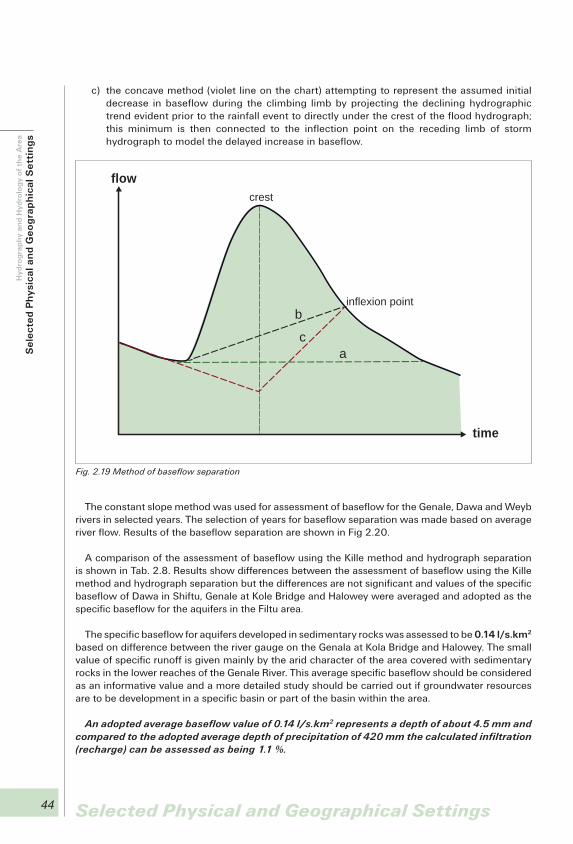
44 Selected Physical and Geographical Settings
c) the concave method (violet line on the chart) attempting to represent the assumed initial decrease in baseflow during the climbing limb by projecting the declining hydrographic trend evident prior to the rainfall event to directly under the crest of the flood hydrograph; this minimum is then connected to the inflection point on the receding limb of storm hydrograph to model the delayed increase in baseflow.
The constant slope method was used for assessment of baseflow for the Genale, Dawa and Weyb rivers in selected years. The selection of years for baseflow separation was made based on average river flow. Results of the baseflow separation are shown in Fig 2.20.
A comparison of the assessment of baseflow using the Kille method and hydrograph separation is shown in Tab. 2.8. Results show differences between the assessment of baseflow using the Kille method and hydrograph separation but the differences are not significant and values of the specific baseflow of Dawa in Shiftu, Genale at Kole Bridge and Halowey were averaged and adopted as the specific baseflow for the aquifers in the Filtu area.
The specific baseflow for aquifers developed in sedimentary rocks was assessed to be 0.14 l/s.km2 based on difference between the river gauge on the Genala at Kola Bridge and Halowey. The small value of specific runoff is given mainly by the arid character of the area covered with sedimentary rocks in the lower reaches of the Genale River. This average specific baseflow should be considered as an informative value and a more detailed study should be carried out if groundwater resources are to be development in a specific basin or part of the basin within the area.
An adopted average baseflow value of 0.14 l/s.km2 represents a depth of about 4.5 mm and compared to the adopted average depth of precipitation of 420 mm the calculated infiltration (recharge) can be assessed as being 1.1 %.
Fig. 2.19 Method of baseflow separation
b
ca
crest
inflexion point
flow
time
Se
lect
ed
Ph
ysic
al a
nd
Ge
og
rap
hic
al S
ett
ing
s H
ydro
gra
ph
y a
nd
Hyd
rolo
gy
of
the
Are
a
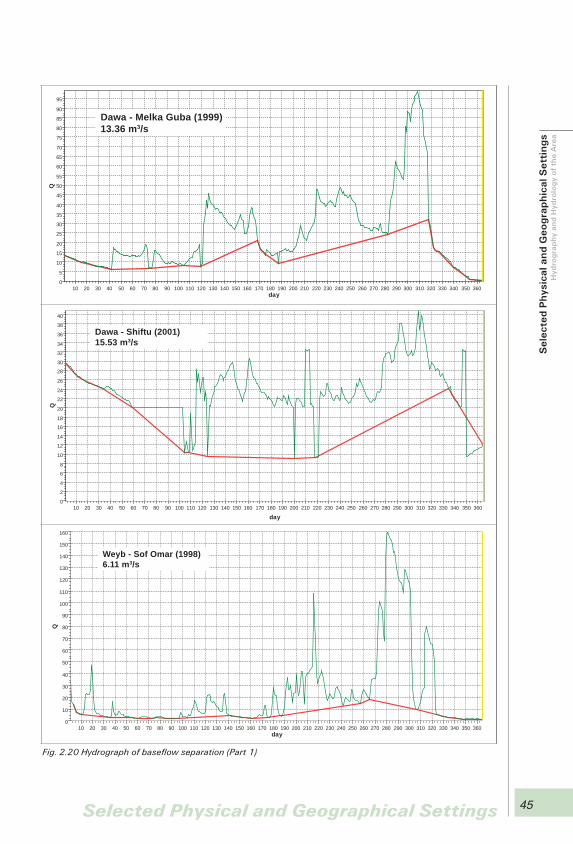
45Selected Physical and Geographical Settings
Fig. 2.20 Hydrograph of baseflow separation (Part 1)
day360350340330320310300290280270260250240230220210200190180170160150140130120110100908070605040302010
Q
95
90
85
80
75
70
65
60
55
50
45
40
35
30
25
20
15
10
5
0
Dawa - Melka Guba (1999)13.36 m3/s
day360350340330320310300290280270260250240230220210200190180170160150140130120110100908070605040302010
Q
40
38
36
34
32
30
28
26
24
22
20
18
16
14
12
10
8
6
4
2
0
Dawa - Shiftu (2001)15.53 m3/s
day360350340330320310300290280270260250240230220210200190180170160150140130120110100908070605040302010
Q
160
150
140
130
120
110
100
90
80
70
60
50
40
30
20
10
0
Weyb - Sof Omar (1998)6.11 m3/s
Se
lect
ed
Ph
ysic
al a
nd
Ge
og
rap
hic
al S
ett
ing
sH
ydro
gra
ph
y a
nd
Hyd
rolo
gy
of
the
Are
a

46 Selected Physical and Geographical Settings
Fig. 2.20 Hydrograph of baseflow separation (Part 2)
day360350340330320310300290280270260250240230220210200190180170160150140130120110100908070605040302010
Q
50048046044042040038036034032030028026024022020018016014012010080604020
0
Genale - Chenemasa (1998)45.56 m3/s
day360350340330320310300290280270260250240230220210200190180170160150140130120110100908070605040302010
Q
550
500
450
400
350
300
250
200
150
100
50
0
Genale - Kole bridge (2001)95.42 m3/s
day360350340330320310300290280270260250240230220210200190180170160150140130120110100908070605040302010
Q
1 1001 050
1 000950900850
800750700650
600550500
450400350300
250200150100
500
Genale - Halowey (1992)85.46 m3/s
Se
lect
ed
Ph
ysic
al a
nd
Ge
og
rap
hic
al S
ett
ing
s H
ydro
gra
ph
y a
nd
Hyd
rolo
gy
of
the
Are
a

47Selected Physical and Geographical Settings
2.5 Water BalancePrecipitation is partly evaporated, partly transpired and part of the water flows to rivers as
runoff (surface runoff and baseflow). The rest of the water infiltrates into aquifers. The balance was studied for Goro meteo-station, which is located on the volcanic plateau and river gauging stations on the surrounding rivers. The upper part of the aquifer developed in volcanic rocks is drained as shallow local baseflow on the plateau which is represented by the Robe river gauging stations on the Shaya River or the Goro river gauging station on the Tegona River. The aquifer developed in volcanic rocks is totally drained by deeper local drainage occurring below the escarpment and is represented either by the Delo Mena river gauging stations on the Yadot River, the Deyu Harewa river gauging station on the Deyiu River, or the Melke Amana river gauging station on the Welmel River. Deep regional drainage aquifers developed in volcanic and sedimentary rocks are totally drained by deep regional drainage which is measured between river gauging stations Chenemasa and Haloway. Data for assessment of water balance are shown in Tab. 2.9.
The water balance assessment is based on the following considerations:• The average monthly precipitation from Goro meteo-station (Tab. 2.10) represents the input
recharge for the whole plateau.• The average monthly evapotranspiration in Goba meteo-station is shown in Tab. 2.10.• Infiltration into the shallow local aquifer is represented by Shaya and Tegona baseflows.• The deficit in the water balance of Shaya or Tegona basins represents infiltration into deeper
aquifers and its value is manifested as deeper local and/or regional baseflow. Infiltration into deeper aquifers can be expressed by the equation I
deeper = P
precipitation – Et
evapotranspiration – TR
total runoff.
• Infiltration and formation of deep local baseflow was computed for the sub-basins of Yadot, Deyiu, Welmel and Halgol rivers from catchments located on the plateau and escarpment. The rate between surface and baseflow, which is higher compared to the river gauging stations represents shallow local baseflow and deep regional flow. This condition shows that the
Tab. 2.8 Baseflow data for the Filtu area
Map ID
RiverArea [km2]
Specific runoff[l/s.km2]
Kille method [m3/s]
Hydrograph separation [m3/s]
Specific baseflow[l/s.km2]
Aquifer
RG1Dawa(Melka Guba)
20,097.9 1.38 14.63 13.36 0.73/0.66 Basement
RG2 Dawa (Shiftu) 48,495.9 0.53 16.30 15.53 0.34/0.32Basement/limestone
RG11Genale(Chenemasa)
9,190.3 10.02 44.46 45.56 4.84/4.96Basalt/basement
RG19Genale(Kole bridge)
56,135.5 2.64 73.09 95.42 1.30/1.70 Sediment
RG10Genale(Haloway)
56,582.9 2.78 78.16 85.46 1.38/1.51 Sediment
RG 37Weyb(Sof Omar)
4,546.3(3,792.0)
5.16 2.69 6.11 0.60/1.30 Limestone
Se
lect
ed
Ph
ysic
al a
nd
Ge
og
rap
hic
al S
ett
ing
sH
ydro
gra
ph
y a
nd
Hyd
rolo
gy
of
the
Are
aW
ate
r B
ala
nce

48 Selected Physical and Geographical Settings
groundwater catchments of these rivers are possibly bigger than their surface catchments and groundwater infiltration on the highest parts of the plateau also participates in deep local and regional baseflows. This condition is also common in relatively homogeneous aquifers (e.g. aquifers in volcanic rocks) where the groundwater level gradient is not uniform in both directions from the groundwater divide which is caused by the steep gradient of the erosion escarpment (Harenna escarpment).
• Groundwater of deep regional baseflow is drained by the Genale River particularly in segment between river gauging stations Chenemasa and Haloway and the difference in baseflows between both river gauging stations represents deep regional base flow (calculated deep local baseflow of Welmel River was subtracted from this difference as well as deep local baseflow of Dumal, Wabera and Wabe Mena rivers which was assessed by analogy with Welmel);
• Not all components of base flow fluctuate and are stable during the year.
The highest monthly precipitation occurs in April, May and October. During these months not all water volume is consumed by either evapotranspiration or by runoff and rest of the water can infiltrate into the first aquifer developed in volcanic rocks (shallow part of aquifer). Assessment of total volume of infiltration for the Shaya basin is 137 for mm/year (Tab. 2.11) and 207 mm/year for the Tegona basin.
Comparison of infiltration into deeper aquifers from the Tegona and Shaya basins with calculated deep local baseflow of 157 mm/year and deep regional base flow of 14 mm/year revealed a difference of -34 mm/year for the Shaya basin and 36 mm/year for Tegona basin (Tab. 2.11). Calculated deeper baseflows are more or less in equivalence with balanced infiltration from the Tegona and Shaya basins into deeper aquifers.
RiverGauging station
Area[km2]
Base flow[m3/s]
Base flow
Infiltration[mm/year]
Specific runoff[l/s.km2]
Mean flow[m3/s]
Mean baseflow rate
Genale Chenemasa 9,190.3 44.46deeplocal
152.7 4.8 92.12 0.48
YadotDelo Mena
451.9 2.88deeplocal
201.1 6.4 6.67 0.43
DeyiuDeyu Harewa
111.1 0.42deeplocal
119.3 3.8 0.97 0.43
WelmelMelka Amana
1,395.8 6.80deeplocal
153.7 4.9 17.34 0.39
Shaya Robe 450.9 0.74shallow local
51.8 1.6 4.31 0.17
Tegona Goba 84.4 0.21shallow local
78.5 2.5 1.40 0.15
Genale
betweenChenemasa and Halowayminus its sinistral tributaries
47,392.6 13.30deepregional
8.9 0.3 65.40
Tab. 2.9 Water balance input data
Se
lect
ed
Ph
ysic
al a
nd
Ge
og
rap
hic
al S
ett
ing
s W
ate
r B
ala
nce
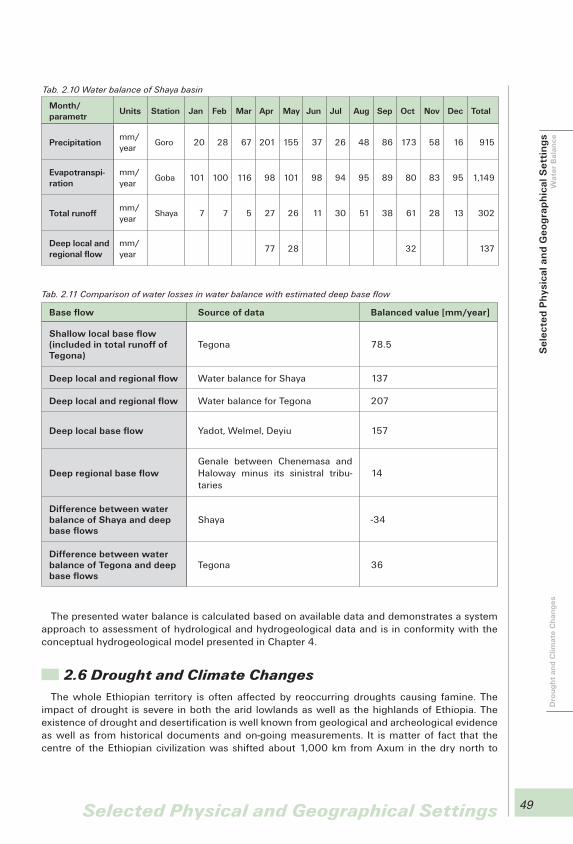
49Selected Physical and Geographical Settings
The presented water balance is calculated based on available data and demonstrates a system approach to assessment of hydrological and hydrogeological data and is in conformity with the conceptual hydrogeological model presented in Chapter 4.
2.6 Drought and Climate ChangesThe whole Ethiopian territory is often affected by reoccurring droughts causing famine. The
impact of drought is severe in both the arid lowlands as well as the highlands of Ethiopia. The existence of drought and desertification is well known from geological and archeological evidence as well as from historical documents and on-going measurements. It is matter of fact that the centre of the Ethiopian civilization was shifted about 1,000 km from Axum in the dry north to
Tab. 2.10 Water balance of Shaya basin
Month/parametr
Units Station Jan Feb Mar Apr May Jun Jul Aug Sep Oct Nov Dec Total
Precipitationmm/year
Goro 20 28 67 201 155 37 26 48 86 173 58 16 915
Evapotranspi-ration
mm/year
Goba 101 100 116 98 101 98 94 95 89 80 83 95 1,149
Total runoffmm/year
Shaya 7 7 5 27 26 11 30 51 38 61 28 13 302
Deep local and regional flow
mm/year
77 28 32 137
Base flow Source of data Balanced value [mm/year]
Shallow local base flow (included in total runoff of Tegona)
Tegona 78.5
Deep local and regional flow Water balance for Shaya 137
Deep local and regional flow Water balance for Tegona 207
Deep local base flow Yadot, Welmel, Deyiu 157
Deep regional base flowGenale between Chenemasa and Haloway minus its sinistral tribu-taries
14
Difference between water balance of Shaya and deep base flows
Shaya -34
Difference between water balance of Tegona and deep base flows
Tegona 36
Tab. 2.11 Comparison of water losses in water balance with estimated deep base flow
Se
lect
ed
Ph
ysic
al a
nd
Ge
og
rap
hic
al S
ett
ing
sW
ate
r B
ala
nce
Dro
ug
ht
an
d C
lima
te C
ha
ng
es

50 Selected Physical and Geographical Settings
Fig. 2.21 The most drought prone areas of Ethiopia (source: RRC, 1985)
Se
lect
ed
Ph
ysic
al a
nd
Ge
og
rap
hic
al S
ett
ing
s D
rou
gh
t a
nd
Clim
ate
Ch
an
ge
s

51Selected Physical and Geographical Settings
Addis Ababa located in the more humid centre of the current (modern) Ethiopia over the last 2,000 years. The northern and eastern parts of the country appeared to be highly vulnerable to reoccurring drought and famine. The most drought-prone regions of Ethiopia are shown in Fig. 2.21.
There are many causes of drought, starting with a local deficit of vapor and condensation nuclei and changes in land use causing changes in soil reflectivity etc., to global changes related to the greenhouse effect with the warming of the surface water of tropical seas. Climate change is dangerous because it can accelerate irregularities in the behavior of synoptic weather systems over the country which is one of the main reasons for the failure of the seasonal rains. Geological and historical evidence was described in detail by Brooks (draft, 2005) and Sima (2009).
The study of NMSA (1996) considers an occurrence of meteorological drought when seasonal rainfall over a region is less than 19 % of its mean. In addition, a drought is classified as moderate and severe if seasonal rainfall deficiency is between 21–25 % and more than 25 %, respectively. A year is considered to be a drought year for the country as a whole in the case the area affected by one of the above criteria for drought, either individually or collectively, is more than 20 % of the total area of the country. The study of drought incidence, intensity and frequency within the whole Ethiopian territory takes into consideration data from the period 1969 to 1987 resulting in the following:
1. Occurrence of drought in the Belg season in 1971, 1973, 1975, 1977, 1984 and 1986 affected more than half the regions. The year 1975 was the most serious, including in the Bale region. The impact is considered to be catastrophic if drought occurs continuously for three or more years.
2. Occurrence of drought in the Kiremt season has more of an effect because 95 % of crop production relies on these rains. Drought occurred in 1972, 1984 and 1987 of which the latter affected about 70 % of the country, including a part of the Sidamo region.
3. Occurrence of drought in both the Belg and Kiremt seasons (drought year) in 1973 and 1984 with failure of rain in 6 out of 14 regions.
The study revealed that Belg drought was serious in the Bale and Sidamo areas in (severe drought in bold italics) 1970, 1971, 1972, 1973, 1974, 1975, 1976, 1977, 1978, and 1984 (Sidamo), which puts the Bale area in the third place in drought probability in Ethiopia after Tigray and Wollo araes. The Kiremt drought was serious in the Bale and Sidamo areas in 1969, 1970, 1971, 1972, 1974, 1976, 1977, 1979, 1980, 1984 (Sidamo) and 1987 (Sidamo), which puts the Bale area in first place in drought probability in Ethiopia during the Kiremt season in front of the areas of Gonder and Haraghe. Drought was serious in the Bale and Sidamo areas in 1969 (Sidamo), 1973, and 1977 showing the Bale region gas the highest probability of drought during the whole year.
Climate ChangeCurrent climate change poses a significant challenge to Ethiopia by affecting food security,
water and energy supply, poverty reduction and sustainable development efforts, as well as by causing natural resource degradation and natural disasters. For example the impacts of past droughts such as those of 1972/73, 1984 and 2002/03 are still fresh in the memories of many Ethiopians. Floods in 2006 caused substantial loss to human life and property in many parts of the country. In this context, planning and implementing climate change adaptation polices, measures and strategies in Ethiopia will be necessary.
The agricultural sector is the most vulnerable to climate variability and change. In terms of livelihoods, small scale rain-fed subsistence farmers and pastoralists are the most vulnerable.
The annual minimum temperature is expressed in terms of temperature differences from the mean and averaged for 40 stations. There has been a warming trend in the annual minimum
Se
lect
ed
Ph
ysic
al a
nd
Ge
og
rap
hic
al S
ett
ing
sD
rou
gh
t a
nd
Clim
ate
Ch
an
ge
s
52 Selected Physical and Geographical Settings
temperature over the past 55 years. It has increasing by about 0.37 °C every ten years. The trend analysis of annual rainfall shows that precipitation remained more or less constant when averaged over the whole country.
For the IPCC mid-range (A1B) emission scenario, the mean annual temperature will increase in the range of 0.9–1.1 °C by 2030, in the range of 1.7–2.1 °C by 2050 and in the range of 2.7–3.4 °C by 2080 over Ethiopia compared to the 1961–1990 normal. A small increase in annual precipitation is also expected over the country.
The other climate related hazard that affects Ethiopia from time to time is flooding. Major floods occurred in different parts of the country in 1988, 1993, 1994, 1995, 1996 and 2006. All of them caused loss of life and property.
In recent years the environment has become a key issue in Ethiopia. The main environmental problems in the country include land degradation, soil erosion, and deforestation, loss of biodiversity, desertification, recurrent drought, flood and water and air pollution.
A large part of the country is dry sub-humid, semi-arid and arid, which is prone to desertification and drought. The country has also fragile highland ecosystems that are currently under stress due to population pressure and associated socio-economic practices. Ethiopia’s history is associated – more often than not – with major natural and manmade hazards that affect the population from time to time. Drought and famine, flood, malaria, land degradation, livestock disease, insect pests and earthquakes have been the main sources of risk and vulnerability in most parts of the country. Especially, recurrent drought, famine and recently floods are the main problems that affect millions of the country’s population almost every year. While the causes of most disasters are climate related, the deterioration of the natural environment due to unchecked human activities and poverty has further exacerbated the situation.
The major adverse impacts of climate variability in Ethiopia include: • Food insecurity arising from the occurrence of droughts and floods. • Outbreaks of diseases such as malaria, dengue fever, water borne diseases (such as cholera,
dysentery) associated with floods and respiratory diseases associated with droughts. • Heavy rainfalls which tend to accelerate land degradation. • Damage to communication, road and other infrastructure by floods.
For example in 2006 flooding in the main rainy season (June–September) caused the following disasters (NMA, 2006): • More than 250 fatalities and about 250 people unaccounted for in Dire Dawa flood. • More than 10,000 people in Dire Dawa became homeless. • More than 364 fatalities in Southern Omo and more than 6,000 (updated to 8,350 after August
15) people were displaced over Southern Omo, where around 14 villages were flooded. • More than 16,000 people over West Shewa were been displaced. • Similar situations also occurred over Afar, Western Tigray, Gambella Zuria and over the low
lying areas of Lake Tana.
In terms of loss in property and livestock • The DPPA estimate is about 199,000 critically affected people due to the flood in the country. • More than 900 livestock drowned over South Omo. In addition, 2,700 heads of cattle and 760
traditional silos were washed away (WFP). • About 10,000 livestock encircled by river floods in Afar. • Over Dire Dawa, the loss in property is estimated in the order of millions of dollars.
Se
lect
ed
Ph
ysic
al a
nd
Ge
og
rap
hic
al S
ett
ing
s D
rou
gh
t a
nd
Clim
ate
Ch
an
ge
s
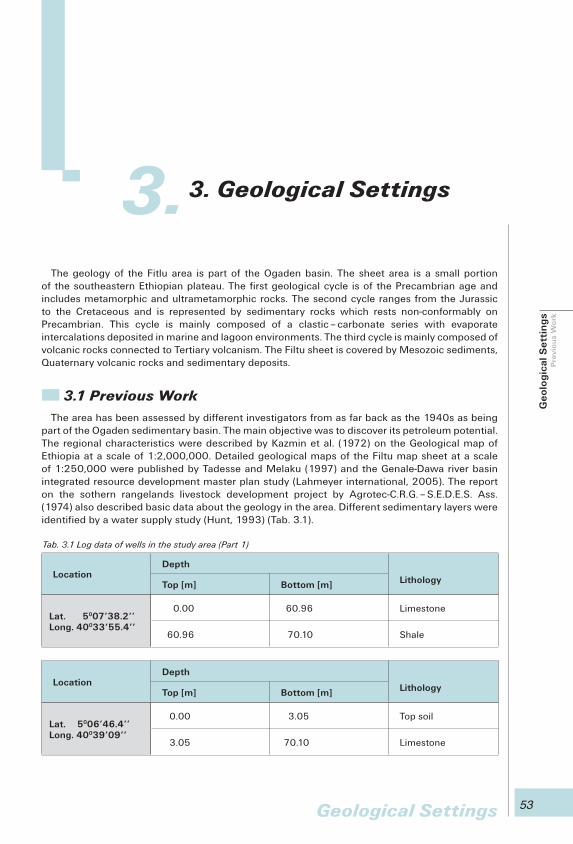
53
The geology of the Fitlu area is part of the Ogaden basin. The sheet area is a small portion of the southeastern Ethiopian plateau. The first geological cycle is of the Precambrian age and includes metamorphic and ultrametamorphic rocks. The second cycle ranges from the Jurassic to the Cretaceous and is represented by sedimentary rocks which rests non-conformably on Precambrian. This cycle is mainly composed of a clastic – carbonate series with evaporate intercalations deposited in marine and lagoon environments. The third cycle is mainly composed of volcanic rocks connected to Tertiary volcanism. The Filtu sheet is covered by Mesozoic sediments, Quaternary volcanic rocks and sedimentary deposits.
3.1 Previous WorkThe area has been assessed by different investigators from as far back as the 1940s as being
part of the Ogaden sedimentary basin. The main objective was to discover its petroleum potential. The regional characteristics were described by Kazmin et al. (1972) on the Geological map of Ethiopia at a scale of 1:2,000,000. Detailed geological maps of the Filtu map sheet at a scale of 1:250,000 were published by Tadesse and Melaku (1997) and the Genale-Dawa river basin integrated resource development master plan study (Lahmeyer international, 2005). The report on the sothern rangelands livestock development project by Agrotec-C.R.G. – S.E.D.E.S. Ass. (1974) also described basic data about the geology in the area. Different sedimentary layers were identified by a water supply study (Hunt, 1993) (Tab. 3.1).
3.
Geological Settings
3. Geological Settings
Tab. 3.1 Log data of wells in the study area (Part 1)
LocationDepth
LithologyTop [m] Bottom [m]
Lat. 5007’38.2’’Long. 40033’55.4’’
0.00 60.96 Limestone
60.96 70.10 Shale
LocationDepth
LithologyTop [m] Bottom [m]
Lat. 5006’46.4’’Long. 40039’09’’
0.00 3.05 Top soil
3.05 70.10 Limestone
Ge
olo
gic
al S
ett
ing
sP
revi
ou
s W
ork

54 Geological Settings
3.2 StratigraphyThe geology of the Filtu area consists of a variety of litho-stratigraphical units of Mesozoic
sedimentary sequences and Quaternary sedimentary and volcanic rocks. A general stratigraphy scheme of the area with the age of the formations is shown in Tab. 3.2. The thickness of formation is based on data published by Agrotec-C.R.G. – S.E.D.E.S. Ass. (1974).
3.3 LithologyThe description of the lithological units is mainly taken from 1:250,000 geological mapping
of the Genale-Dawa river basin integrated resource development master plan study (Lahmeyer international, 2005).
Tab. 3.1 Log data of wells in the study area (Part 2)
LocationDepth
LithologyTop [m] Bottom [m]
Lat. 5003’06’’Long. 40042’00’’
0.00 3.05 Top soil
3.05 18.30 Limestone
18.30 30.50 Mudstone
30.50 73.20 Limestone
Source: Hunt Oil Company water supply study (1993)
Tab. 3.2 Lithostratigraphy of the mapped area
Age FormationAverage thickness [m]
Generalized lithological description
Quaternary
Alluvial and Eluvial deposits
Gravel sand and clay
Volcanic rocks (V)Scoracious basalts and asso-ciated minor volcanic units
Me
sozo
ic
Creataceous
Amba Aradam (Ka) (Jessoma sandstone)
variousSandstone with silt stone and shale
Mustahil (Km) 100–200 Mainly limestone
Korahi (Kg1 and Kg2) (Main gypsum lower and upper part)
100–270Gypsum, shale, dolomite, sandstone
Jurassic
Gabredare limestone (Jg) ? 250Limestone intercalated with shale
Hamanlei limestone (Jh1 Lower and Jh2 Upper)
100–300Bioclastic limestone and dolomite
Ge
olo
gic
al S
ett
ing
s P
revi
ou
s W
ork
Lith
olo
gy
Str
ati
gra
ph
y
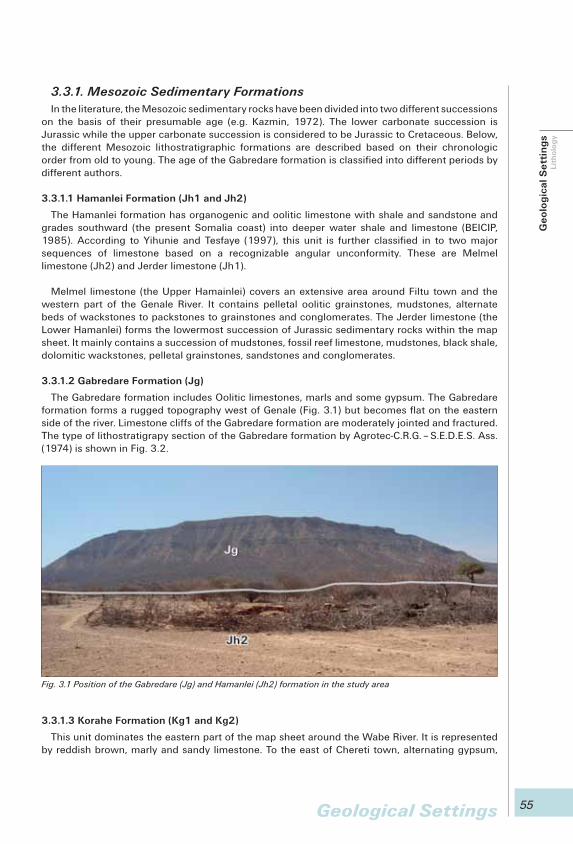
55Geological Settings
3.3.1. Mesozoic Sedimentary FormationsIn the literature, the Mesozoic sedimentary rocks have been divided into two different successions
on the basis of their presumable age (e.g. Kazmin, 1972). The lower carbonate succession is Jurassic while the upper carbonate succession is considered to be Jurassic to Cretaceous. Below, the different Mesozoic lithostratigraphic formations are described based on their chronologic order from old to young. The age of the Gabredare formation is classified into different periods by different authors.
3.3.1.1 Hamanlei Formation (Jh1 and Jh2)
The Hamanlei formation has organogenic and oolitic limestone with shale and sandstone and grades southward (the present Somalia coast) into deeper water shale and limestone (BEICIP, 1985). According to Yihunie and Tesfaye (1997), this unit is further classified in to two major sequences of limestone based on a recognizable angular unconformity. These are Melmel limestone (Jh2) and Jerder limestone (Jh1).
Melmel limestone (the Upper Hamainlei) covers an extensive area around Filtu town and the western part of the Genale River. It contains pelletal oolitic grainstones, mudstones, alternate beds of wackstones to packstones to grainstones and conglomerates. The Jerder limestone (the Lower Hamanlei) forms the lowermost succession of Jurassic sedimentary rocks within the map sheet. It mainly contains a succession of mudstones, fossil reef limestone, mudstones, black shale, dolomitic wackstones, pelletal grainstones, sandstones and conglomerates.
3.3.1.2 Gabredare Formation (Jg)
The Gabredare formation includes Oolitic limestones, marls and some gypsum. The Gabredare formation forms a rugged topography west of Genale (Fig. 3.1) but becomes flat on the eastern side of the river. Limestone cliffs of the Gabredare formation are moderately jointed and fractured. The type of lithostratigrapy section of the Gabredare formation by Agrotec-C.R.G. – S.E.D.E.S. Ass. (1974) is shown in Fig. 3.2.
3.3.1.3 Korahe Formation (Kg1 and Kg2)
This unit dominates the eastern part of the map sheet around the Wabe River. It is represented by reddish brown, marly and sandy limestone. To the east of Chereti town, alternating gypsum,
Fig. 3.1 Position of the Gabredare (Jg) and Hamanlei (Jh2) formation in the study area
Ge
olo
gic
al S
ett
ing
sLi
tho
log
y
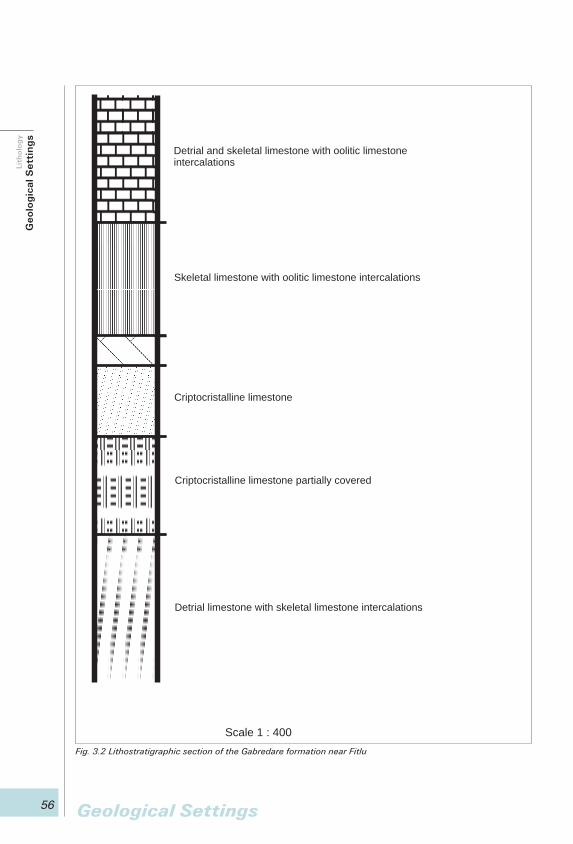
56 Geological Settings
Fig. 3.2 Lithostratigraphic section of the Gabredare formation near Fitlu
Detrial and skeletal limestone with oolitic limestoneintercalations
Skeletal limestone with oolitic limestone intercalations
Criptocristalline limestone
Criptocristalline limestone partially covered
Detrial limestone with skeletal limestone intercalations
Scale 1 : 400
Ge
olo
gic
al S
ett
ing
s Li
tho
log
y

57Geological Settings
marl and sandstone layers of Korahe formation overly the Gabredare formation. These layers seem to show a general low gradient to the southwest or to the south.
Mustahil Formation (Km)
The Mustahil formation is represented by limestone with gypsiferous marls and clays. It has dolomites, fossiliferous limestone and sandstone. This unit is exposed in the northeast corner of the map sheet along with the Amba Aradam formation.
Amba Aradam Formation (Ka)
The Amba Aradam sandstones are variegated quartzose sandstones with intercalation of variegated shale of a fluvial origin (e.g. Bosellini et al., 1995). This formation is exposed in the northeast corner of the map sheet.
3.3.2. Quaternary Volcanic and Sedimentary Rocks3.3.2.1 Quaternary Sediments (Qa, Qe)
The general distribution of the Quaternary sediments in the study area is localized to flat terrains and Wabe river channels in and around Cherati. The thickness of these deposits varies up to 3 m. The alluvium in the Wabe river channel ranges in size from fine sands to silty, clayey silty soil. The permeability of these sediments is generally fair to low. The elluvial sediment is formed by weathering of bed rocks, mainly limestone. It is relatively cultivated by the local people around Filtu and Chereti.
3.3.2.2 Quaternary Volcanic Rocks (Qv)
This unit is exposed in the study area in the lower part of the Genale river course. It covers a total area of 90 km2 within the study area. It mainly consists of olivine basalt, dark in color and reddish brown when weathered.
3.4 StructureThe Phanesozoic marine record of East Africa and the surrounding region is mainly governed by
extensional deformation related to the break up of Gondawana land, starting at Permian. It produced a northeasterly trending rift and northwesterly trending transverse fault system. The main rift gave rise to the present Indian Ocean whose major faults run along the eastern coast of Africa (Kenya and Somalia). In association with this, a triradial system of E-W, NE-SW and NW-SE trending grabbers developed. As a result of the opening of the North Atlantic and Proto-Indian oceans the triple junction of these grabens has been identified in the Southern Ogaden, Calub area.
The Ethiopian Paleozoic is known by extensive peneplanation. However, a few older continental types of sediment of fluvio-lacustrine and glacial origin reported from Eastern and Northern Ethiopia may suggest that the Paleozoic era was not merely a time of denudation.
The study area is situated in an almost stable regional tectonic setting, however different structures are observed in the field and inferred from Digital Elevation Models (DEMs) and satellite imageries. These structures include lineaments, faults, fractures and planar beddings. Lineaments and faults – the lineaments are mainly concentrated in the southern and northern part of the map sheet. They have a dominant direction of NW-SE and NE-SW. The Genale and its main tributaries on the northern part of the map sheet follow the traces of these lineaments. Fig. 3.5 shows the propagation of an early Mesozoic Karoo rift system in the Ogaden basin (Dow et al., 1971; Bosellini, 1989) and the northern part of Ethiopia (Gani et al., 2008). Limestone and gypsum units are affected by vertical and horizontal fractures (Fig. 3.3). The fractures are seldom filled by soil.
Ge
olo
gic
al S
ett
ing
sLi
tho
log
yS
tru
ctu
re
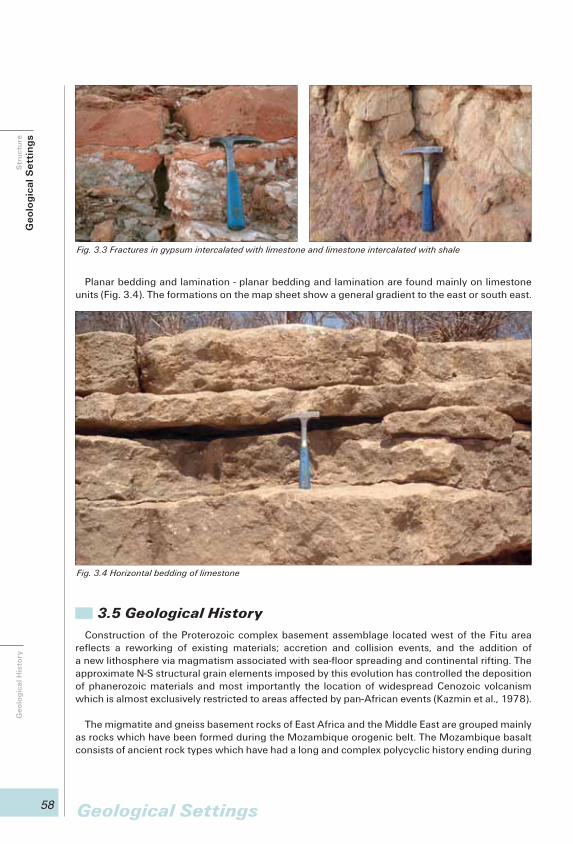
58 Geological Settings
Planar bedding and lamination - planar bedding and lamination are found mainly on limestone units (Fig. 3.4). The formations on the map sheet show a general gradient to the east or south east.
3.5 Geological HistoryConstruction of the Proterozoic complex basement assemblage located west of the Fitu area
reflects a reworking of existing materials; accretion and collision events, and the addition of a new lithosphere via magmatism associated with sea-floor spreading and continental rifting. The approximate N-S structural grain elements imposed by this evolution has controlled the deposition of phanerozoic materials and most importantly the location of widespread Cenozoic volcanism which is almost exclusively restricted to areas affected by pan-African events (Kazmin et al., 1978).
The migmatite and gneiss basement rocks of East Africa and the Middle East are grouped mainly as rocks which have been formed during the Mozambique orogenic belt. The Mozambique basalt consists of ancient rock types which have had a long and complex polycyclic history ending during
Fig. 3.3 Fractures in gypsum intercalated with limestone and limestone intercalated with shale
Fig. 3.4 Horizontal bedding of limestone
Ge
olo
gic
al H
isto
ry
Ge
olo
gic
al S
ett
ing
s S
tru
ctu
re
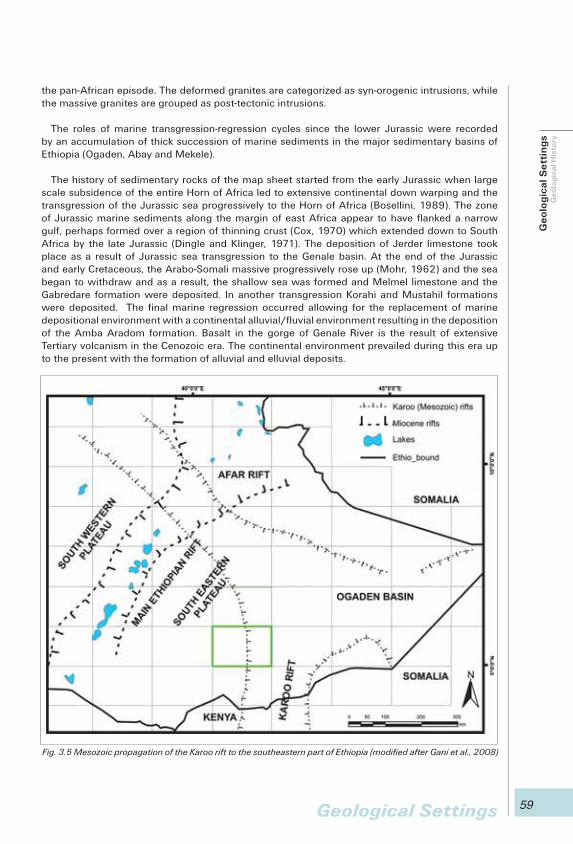
59Geological Settings
the pan-African episode. The deformed granites are categorized as syn-orogenic intrusions, while the massive granites are grouped as post-tectonic intrusions.
The roles of marine transgression-regression cycles since the lower Jurassic were recorded by an accumulation of thick succession of marine sediments in the major sedimentary basins of Ethiopia (Ogaden, Abay and Mekele).
The history of sedimentary rocks of the map sheet started from the early Jurassic when large scale subsidence of the entire Horn of Africa led to extensive continental down warping and the transgression of the Jurassic sea progressively to the Horn of Africa (Bosellini, 1989). The zone of Jurassic marine sediments along the margin of east Africa appear to have flanked a narrow gulf, perhaps formed over a region of thinning crust (Cox, 1970) which extended down to South Africa by the late Jurassic (Dingle and Klinger, 1971). The deposition of Jerder limestone took place as a result of Jurassic sea transgression to the Genale basin. At the end of the Jurassic and early Cretaceous, the Arabo-Somali massive progressively rose up (Mohr, 1962) and the sea began to withdraw and as a result, the shallow sea was formed and Melmel limestone and the Gabredare formation were deposited. In another transgression Korahi and Mustahil formations were deposited. The final marine regression occurred allowing for the replacement of marine depositional environment with a continental alluvial/fluvial environment resulting in the deposition of the Amba Aradom formation. Basalt in the gorge of Genale River is the result of extensive Tertiary volcanism in the Cenozoic era. The continental environment prevailed during this era up to the present with the formation of alluvial and elluvial deposits.
Fig. 3.5 Mesozoic propagation of the Karoo rift to the southeastern part of Ethiopia (modified after Gani et al., 2008)
Ge
olo
gic
al S
ett
ing
sG
eo
log
ica
l His
tory
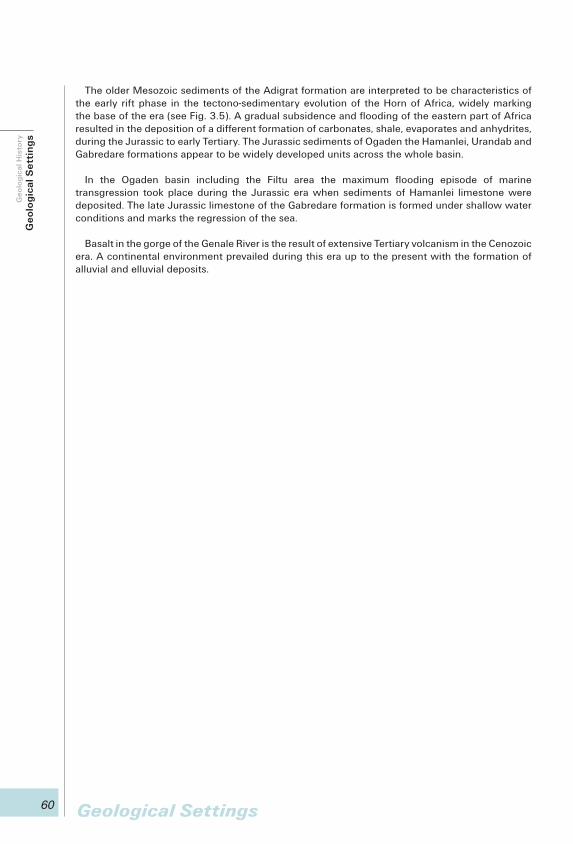
60 Geological Settings
The older Mesozoic sediments of the Adigrat formation are interpreted to be characteristics of the early rift phase in the tectono-sedimentary evolution of the Horn of Africa, widely marking the base of the era (see Fig. 3.5). A gradual subsidence and flooding of the eastern part of Africa resulted in the deposition of a different formation of carbonates, shale, evaporates and anhydrites, during the Jurassic to early Tertiary. The Jurassic sediments of Ogaden the Hamanlei, Urandab and Gabredare formations appear to be widely developed units across the whole basin.
In the Ogaden basin including the Filtu area the maximum flooding episode of marine transgression took place during the Jurassic era when sediments of Hamanlei limestone were deposited. The late Jurassic limestone of the Gabredare formation is formed under shallow water conditions and marks the regression of the sea.
Basalt in the gorge of the Genale River is the result of extensive Tertiary volcanism in the Cenozoic era. A continental environment prevailed during this era up to the present with the formation of alluvial and elluvial deposits.
Ge
olo
gic
al S
ett
ing
s G
eo
log
ica
l His
tory

61
Hydrogeology of the Filtu area is based on the assessment of a various data collected from existing reports and maps and during field work. There is no previous hydrogeological work at a scale of 1:250,000 and full data sets required for geometrical aquifer configuration are scarce. Analogy is used to assess the ground water potential of units in the study area where no data was found in the field mapping because the map sheets of Megalo, Dodola, Negele and Sede have been compiled by GSE at the same time and finding in other areas were also used for the hydrogeological assessment of the Filtu area.
4.1 Water Point InventoryThe field water point inventory was based on a desk study, during which the relevant materials
like geological and drilling reports and maps and aerial photographs were collected from the regional geology department of GSE and other organizations. Important climatic and gauging station data and topographic maps were obtained from various offices. The desk study also included preliminary data interpretation and preparation of field maps using satellite images, aerial photographs and a digital elevation model (DEM) of the terrain with the geology as a background.
The hydrogeological map of Ethiopia at a scale of 1:2,000,000 was published by Tesfaye Chernet (1993). He classified the geological units of Ethiopia into four major groups depending on the type of permeability and the extent of the aquifer. This hydrogeological map was the basic document for preparation of the field work. Tesfaye (1993) identified the following units:• Mesozoic limestone (Hamanlei series) with fissured and/or karst permeability was classified
as a highly productive aquifer; the specific yield of wells was estimated to be in the interval 0.2–7.6 l/s.m and total yield of wells with 20 m of drawdown varies in the interval 1.8–68.4 l/s in highly productive aquifers.
• Other Mesozoic sedimentary and volcanic rocks along rivers and plain areas with fissured porosity were classified as moderately or low productive (Kebri Dehar and Warandab series) aquifers; the specific yield of wells was estimated to be in the interval 0.05–1.1 l/s.m and the total yield of wells with 20 m of drawdown varies in the interval 0.45–9.9 l/s in moderately productive aquifers.
• Recharge characteristics were derived to be 50 –150 mm/year.• The lowlands were classified as an area with localized and moderate to large quantities of
water resources especially along valleys. Groundwater and surface water are of fair to poor chemical quality (TDS 1,000–3,000 mg/l), with intermittent and some permanent streams, and with a groundwater level between 0 and 270 m.
• Groundwater chemistry is characterized as being chloride (Cl) particularly in the eastern part of the area.
4. Hydrogeology4.
Hydrogeology
Hyd
rog
eo
log
yW
ater
Po
int
Inve
nto
ry

62 Hydrogeology
A geological-hydrogeological survey was carried out by COOPERAZIONE INTERNATIONALE (COOPI) (1999, 2002) as an emergency program to assist vulnerable people in Oromia and Somali regional states. Water supply wells drilled by the Hunt Oil Company (1993) identified different sedimentary layers.
A complex assessment of hydrogeological data, including water point inventory, hydrological and climatic characterization was carried out by Lahmeyer (2005) in “Genale-Dawa River Basin Integrated Master Water Plan Study Project” providing statistical assessment of boreholes (Tab. 4.1).
The authors (Lahmeyer, 2005) classified the geological formations of the Genale-Dawa basin based on observations made in the field and existing data. Examples of different levels of productivity are given in Tab. 4.2.
Comparative data from complex hydrogeological assessment, including water point inventory, hydrological and climatic characterization was compiled by WWDST (2003) in “Shebelle River Basin Integrated Master Water Plan Study Project”, which provided statistic assessment of borehole yield and average transmissivity (Tab. 4.3) and spring yield (Tab. 4.4).
Topographic maps of 1:250,000 scale were used during the field work as a base map in addition to 1:60,000 aerial photographs. Existing reports about borehole data were collected from regional water bureau and COOPI. A compass and a GPS were used for navigation and locating the water points. The water points were characterized by location, lithology, topography and field measurements of pH, temperature and EC were taken. Pictures and video sequences were captured for documentation and interpretation. Discharge of springs and rivers was measured by
Tab. 4.1 Aquifer classification based on well yield for Genale-Dawa basin
Formation (symbol)
Yield [l/s] Specific capacity [l/s.m] Numberof wellsRange Mean Median Range Mean Median
Alluvium 0.50–3.75 2.01 1.47 0.02–8.92 1.657 0.23 7
Basalt (Q) 1.70 2.39 2.00 0.05–0.38 0.160 0.12 7
Basalt (T) 1.50–4.40 3.15 3.15 0.01–1.22 0.339 0.12 10
Ju + Jh 0.83–7.00 2.58 1.50 0.01–35.00 0.04 7
Gt + Qa 0.13–6.50 2.18 1.76 0.02–0.87 0.268 0.10 6
Hm + Qa 0.20–4.67 1.56 0.93 0.02–1.33 0.232 0.08 9
Lm + Qa 1.40–5.00 2.80 2.00 0.11–36.00 0.253 0.29 3
Remark: Gt–granite, Hm–gneiss, migmatite, Ju–Urandab f., Jh–Hamanlei f, Qa–Quaternary alluvium, Lm–limestone
Tab. 4.2 Aquifer classification for Genale-Dawa basin
Classification Formation name
Low Kohare, basement
Moderate/Low Urandab/Hamanlei
Moderate Gabredare
High/Moderate Volcanic rocks (Basalt)
Hyd
rog
eo
log
y W
ater
Po
int
Inve
nto
ry

63Hydrogeology
the floating, volumetric method and by visual assessment. The static water levels of boreholes with piezometers and open hand dug wells were measured using an electrical sounding deeper. A summary of the field inventory is shown in Tab. 4.5 and an extract from the water point inventory database is shown in Annex 1. Groundwater from water points representing important parts of the area’s hydrogeological system was sampled for chemical analysis (see Chapter 6 and Annex 2). Well logs of borehole collected from COOPI are shown in Annex 3.
Data Assessment was mainly dedicated to data organization, processing, and interpretation, in the form of maps and the text of the presented explanatory notes. Aquifers are classified according to their productivity based on the yield measured in the field and hydraulic properties like
Formation AlluviumAlluvium and basement
Tertiary volcanic
Uppersandstone
Limestone and sandstone
Limestone and Lower sandstone
Mean 3.30 5.30 2.50 4.9 3.90 4.7
Median 3.30 6.00 2.10 6.0 3.90 3.7
Minimum 0.60 1.50 0.10 1.6 3.30 1.4
Maximum 5.00 8.50 6.00 7.0 4.50 10.0
Average T 3.66 47.86 2.93 92.78
Tab. 4.3 Summary of borehole yield [l/s] and transmissivity [m2/d] by WWDST (2003)
Remark: T – transmissivity, Ginir basalt T = 64.54 m2/d, Babile granite T = 116.83 m2/d
Tab. 4.4 Summary of spring yield [l/s] by WWDST (2003)
Formation Alluvium Q basaltTertiary volcanic
Uppersandstone
Limestone and sandstone
Basement
Mean 2.0 0.6 3.69 2.78 6.82 5.0
Median 2.0 0.2 1.00 1.60 0.21 5.0
Minimum 2.0 0.1 0.05 0.01 0.01 2.0
Maximum 2.0 1.5 20.10 15.00 50.00 8.0
Remark: Most of high yield springs are from Hamanlei limestone (fracture and contact types of springs).
Tab. 4.5 Summary of field inventory
Water point type Number of inventory Sampled
Borehole (BH) 8 3
Cold spring (CS) 5 5
Dug well (DW) 14 12
River water (RW/SW) and Water holes (WH)
2 2
Total 29 22
Hyd
rog
eo
log
yW
ater
Po
int
Inve
nto
ry

64 Hydrogeology
transmissivity obtained from pumping test data together with topographic settings and recharge conditions. The geographic information system (GIS) ArcGis was used for compilation of the maps.
4.2 Hydrogeological Classification/CharacterizationThe qualitative division of lithological units is based on the hydrogeological characteristics of
various rock types using water point inventory data and analogy. Since quantitative data such as permeability, aquifer thickness and yield are not adequate or evenly distributed enough to make a detailed quantitative potential classification; analogy was used for characterization of rocks without the adequate number of water points. The lithological units were divided into groups with dominant porous and fissured permeability and impermeable rocks. This division served for definition of the aquifer/aquitard system of the mapped area. Hence, the hydrogeological characterization of the study area reveals the following aquifer/aquitard systems:
Units with porous permeability; where groundwater is accumulated in and is flowing through pores of an unconsolidated or semi-consolidated material. Porous materials of Quaternary age are represented by fluvial and colluvial sediments developed in depressions and/or along valleys of existing rivers. The porous aquifers are only locally developed and scattered over the study area. The units with porous permeability forming aquifers are expressed on the hydrogeological map in blue.
Units with fissured and karst permeability; where the groundwater is stored in limestone fissures and the permeability can be enhanced by karstification. Solution phenomena and karstification in the underground drainage of carbonate rocks are controlled by the drainage base level, which may be represented by a perennially draining stream and/or an impervious formation inside the limestone (marlstone, shale, gypsum) and/or basement rocks underlying the carbonate aquifer. A carbonate rock surface, with soil or a relatively permeable, less soluble cover is more favorable for initiation of karstification than bare rock. The rock is presumably dissolved most rapidly in the zone between the highest and lowest positions occupied by the watertable. The units with fissured and karst permeability developed in limestone forming moderately productive aquifers are expressed in the hydrogeological map in light green.
Units with fissured permeability; where groundwater accumulates in and flows through the weathered, fractured, fissured and jointed parts of volcanic and sedimentary rocks. The porosity of lava flows may be high but the permeability is largely a function of a combination of the primary and secondary structures (joints and fissures) within the rock. In addition, the permeability of lava flows tends to decrease with geological time and basalt in the Genale river valley is of Quaternary age. Mesozoic sediments represented by mixed formations consist of limestone, marlstone, gypsum and other evaporites. The units with fissured permeability forming moderately productive aquifers are expressed on the hydrogeological map in light green. The units with fissured permeability forming only minor aquifers with low productivity are expressed on the hydrogeological map in light brown.
Unit with essentially no groundwater resources; and where groundwater is neither stored nor transmitted through rock under ordinary hydraulic gradients. Groundwater development for limited individual water supply is very difficult and in places even impossible. These are groundwater resources with poor or no exploitation potential.
4.3 Elements of the Hydrogeological System of the Area (Aquifers)
Geological description and qualitative division of various geological units together with their topographical position within the area lead to a definition of elements of the hydrogeological system and its conceptual hydrogeological model. The system consists of the following elements:
Hyd
rog
eo
log
y H
ydro
geo
log
ical
Cla
ssif
icat
ion
/Ch
arac
teri
zati
on
Ele
me
nts
of
the
Hyd
rog
eo
log
ica
l Sys
tem
of
the
Are
a
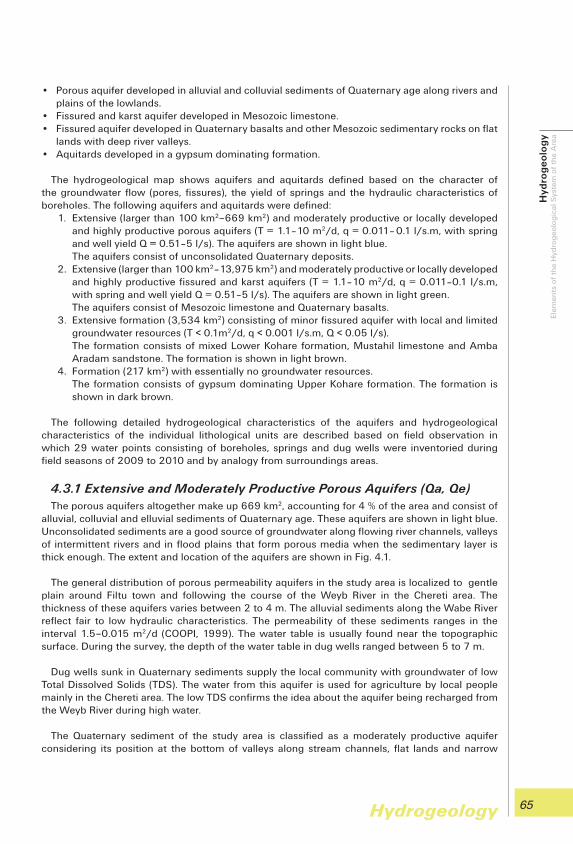
65Hydrogeology
• Porous aquifer developed in alluvial and colluvial sediments of Quaternary age along rivers and plains of the lowlands.
• Fissured and karst aquifer developed in Mesozoic limestone.• Fissured aquifer developed in Quaternary basalts and other Mesozoic sedimentary rocks on flat
lands with deep river valleys.• Aquitards developed in a gypsum dominating formation.
The hydrogeological map shows aquifers and aquitards defined based on the character of the groundwater flow (pores, fissures), the yield of springs and the hydraulic characteristics of boreholes. The following aquifers and aquitards were defined:
1. Extensive (larger than 100 km2–669 km2) and moderately productive or locally developed and highly productive porous aquifers (T = 1.1–10 m2/d, q = 0.011– 0.1 l/s.m, with spring and well yield Q = 0.51–5 l/s). The aquifers are shown in light blue.
The aquifers consist of unconsolidated Quaternary deposits.2. Extensive (larger than 100 km2 –13,975 km2) and moderately productive or locally developed
and highly productive fissured and karst aquifers (T = 1.1–10 m2/d, q = 0.011– 0.1 l/s.m, with spring and well yield Q = 0.51–5 l/s). The aquifers are shown in light green.
The aquifers consist of Mesozoic limestone and Quaternary basalts.3. Extensive formation (3,534 km2) consisting of minor fissured aquifer with local and limited
groundwater resources (T < 0.1m2/d, q < 0.001 l/s.m, Q < 0.05 l/s). The formation consists of mixed Lower Kohare formation, Mustahil limestone and Amba
Aradam sandstone. The formation is shown in light brown.4. Formation (217 km2) with essentially no groundwater resources. The formation consists of gypsum dominating Upper Kohare formation. The formation is
shown in dark brown.
The following detailed hydrogeological characteristics of the aquifers and hydrogeological characteristics of the individual lithological units are described based on field observation in which 29 water points consisting of boreholes, springs and dug wells were inventoried during field seasons of 2009 to 2010 and by analogy from surroundings areas.
4.3.1 Extensive and Moderately Productive Porous Aquifers (Qa, Qe)The porous aquifers altogether make up 669 km2, accounting for 4 % of the area and consist of
alluvial, colluvial and elluvial sediments of Quaternary age. These aquifers are shown in light blue. Unconsolidated sediments are a good source of groundwater along flowing river channels, valleys of intermittent rivers and in flood plains that form porous media when the sedimentary layer is thick enough. The extent and location of the aquifers are shown in Fig. 4.1.
The general distribution of porous permeability aquifers in the study area is localized to gentle plain around Filtu town and following the course of the Weyb River in the Chereti area. The thickness of these aquifers varies between 2 to 4 m. The alluvial sediments along the Wabe River reflect fair to low hydraulic characteristics. The permeability of these sediments ranges in the interval 1.5–0.015 m2/d (COOPI, 1999). The water table is usually found near the topographic surface. During the survey, the depth of the water table in dug wells ranged between 5 to 7 m.
Dug wells sunk in Quaternary sediments supply the local community with groundwater of low Total Dissolved Solids (TDS). The water from this aquifer is used for agriculture by local people mainly in the Chereti area. The low TDS confirms the idea about the aquifer being recharged from the Weyb River during high water.
The Quaternary sediment of the study area is classified as a moderately productive aquifer considering its position at the bottom of valleys along stream channels, flat lands and narrow
Hyd
rog
eo
log
yE
lem
ents
of
the
Hyd
rog
eolo
gic
al S
yste
m o
f th
e A
rea

66 Hydrogeology
valleys which are convenient for water storage and water well siting. The thicker cover of the Quaternary sediments can be located using simple geophysical measurements, e.g. VES.
Recharge to aquifers is mainly directly through the overlying soil. The position of the aquifer in the lowlands with low precipitation depth and a limited surplus of water for infiltration also represents a limited possibility for the direct recharge of the aquifers. Local recharge of aquifers is also possible from rivers in valleys during high waters.
4.3.2 Extensive and Moderately Productive Fissured and Karstic AquifersThe moderately productive fissured and karst aquifers make up 13,975 km2, accounting for 76 %
of the area and consist of Hamanlei and Gabredare limestone of the Mesozoic age. The limestone is well jointed and fractured; however, karst features are not common and particularly big karst springs do not exist in the Filtu area. The extent and location of the fissured aquifers are shown in Fig. 4.2.
Hamanlei Formation (Jh1, Jh2)
In the Hamanlei limestone (8,141 km2–45% of area) the groundwater accumulates in its weathered, fractured horizons and holes of solution cavities, caverns, fissures and sometimes in caves.
A total of 15 water points were inventoried from this aquifer. These aquifers have a moderate to high permeability but the depth of groundwater reaches to 200 m as observed from the Hayadimtu borehole.
Springs are fracture controlled and have a very low yield (Fig. 4.3). Static water level measurements from open dug wells range from 3 to 12 m below ground level. Ground water in this aquifer is mainly recharged from the overlying Quaternary sediment of 3–6 m thick.
Fig. 4.1 Extent and location of porous aquifers
Hyd
rog
eo
log
y E
lem
ents
of
the
Hyd
rog
eolo
gic
al S
yste
m o
f th
e A
rea
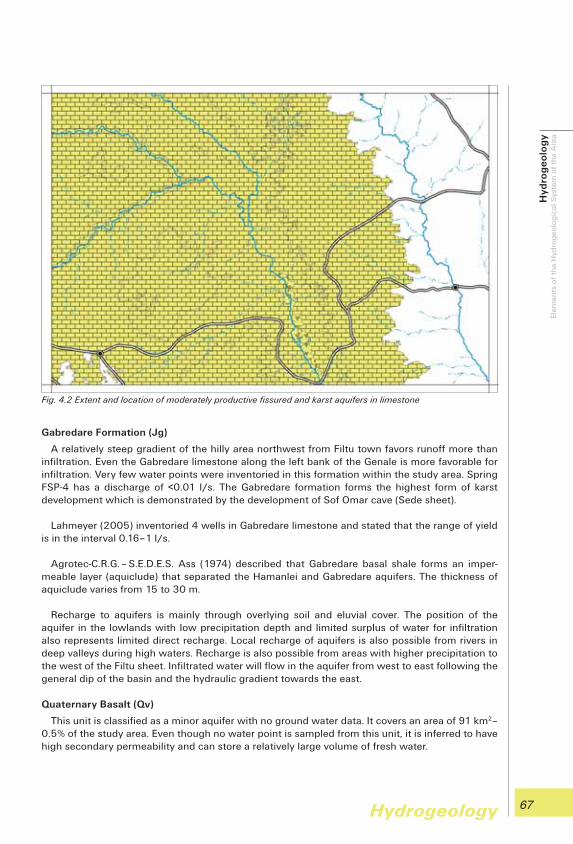
67Hydrogeology
Gabredare Formation (Jg)
A relatively steep gradient of the hilly area northwest from Filtu town favors runoff more than infiltration. Even the Gabredare limestone along the left bank of the Genale is more favorable for infiltration. Very few water points were inventoried in this formation within the study area. Spring FSP-4 has a discharge of <0.01 l/s. The Gabredare formation forms the highest form of karst development which is demonstrated by the development of Sof Omar cave (Sede sheet).
Lahmeyer (2005) inventoried 4 wells in Gabredare limestone and stated that the range of yield is in the interval 0.16–1 l/s.
Agrotec-C.R.G. – S.E.D.E.S. Ass (1974) described that Gabredare basal shale forms an imper-meable layer (aquiclude) that separated the Hamanlei and Gabredare aquifers. The thickness of aquiclude varies from 15 to 30 m.
Recharge to aquifers is mainly through overlying soil and eluvial cover. The position of the aquifer in the lowlands with low precipitation depth and limited surplus of water for infiltration also represents limited direct recharge. Local recharge of aquifers is also possible from rivers in deep valleys during high waters. Recharge is also possible from areas with higher precipitation to the west of the Filtu sheet. Infiltrated water will flow in the aquifer from west to east following the general dip of the basin and the hydraulic gradient towards the east.
Quaternary Basalt (Qv)
This unit is classified as a minor aquifer with no ground water data. It covers an area of 91 km2–0.5% of the study area. Even though no water point is sampled from this unit, it is inferred to have high secondary permeability and can store a relatively large volume of fresh water.
Fig. 4.2 Extent and location of moderately productive fissured and karst aquifers in limestone
Hyd
rog
eo
log
yE
lem
ents
of
the
Hyd
rog
eolo
gic
al S
yste
m o
f th
e A
rea

68 Hydrogeology
Recharge to the aquifer is mainly from rivers or from drainage of limestone aquifers. Limited recharge is also thought to be directly through the outcrops of the aquifer.
4.3.3 Extensive Formations Consisting of Minor Fissured Aquifers with Local and Limited Groundwater Resources (Kg1, Km, Ka)
These formations consisting of minor fissured aquifers with local and limited groundwater resources make up 3,534 km2, accounting for 19 % of the area and consist of the Lower Korahe formation, Mustahil limestone and Amba Aradam sandstone. This formation is shown on the map in light brown and its extent and location are shown in Fig. 4.4 together with the location of the formation with essentially no groundwater resources.
Fig. 4.3 FSP-1 from Melmel limestone
Hyd
rog
eo
log
y E
lem
ents
of
the
Hyd
rog
eolo
gic
al S
yste
m o
f th
e A
rea
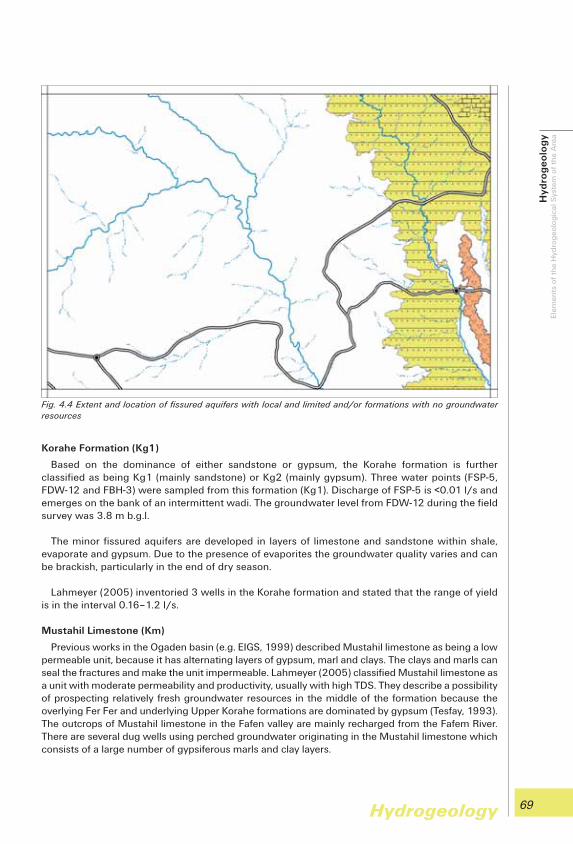
69Hydrogeology
Korahe Formation (Kg1)
Based on the dominance of either sandstone or gypsum, the Korahe formation is further classified as being Kg1 (mainly sandstone) or Kg2 (mainly gypsum). Three water points (FSP-5, FDW-12 and FBH-3) were sampled from this formation (Kg1). Discharge of FSP-5 is <0.01 l/s and emerges on the bank of an intermittent wadi. The groundwater level from FDW-12 during the field survey was 3.8 m b.g.l.
The minor fissured aquifers are developed in layers of limestone and sandstone within shale, evaporate and gypsum. Due to the presence of evaporites the groundwater quality varies and can be brackish, particularly in the end of dry season.
Lahmeyer (2005) inventoried 3 wells in the Korahe formation and stated that the range of yield is in the interval 0.16–1.2 l/s.
Mustahil Limestone (Km)
Previous works in the Ogaden basin (e.g. EIGS, 1999) described Mustahil limestone as being a low permeable unit, because it has alternating layers of gypsum, marl and clays. The clays and marls can seal the fractures and make the unit impermeable. Lahmeyer (2005) classified Mustahil limestone as a unit with moderate permeability and productivity, usually with high TDS. They describe a possibility of prospecting relatively fresh groundwater resources in the middle of the formation because the overlying Fer Fer and underlying Upper Korahe formations are dominated by gypsum (Tesfay, 1993). The outcrops of Mustahil limestone in the Fafen valley are mainly recharged from the Fafem River. There are several dug wells using perched groundwater originating in the Mustahil limestone which consists of a large number of gypsiferous marls and clay layers.
Fig. 4.4 Extent and location of fissured aquifers with local and limited and/or formations with no groundwater resources
Hyd
rog
eo
log
yE
lem
ents
of
the
Hyd
rog
eolo
gic
al S
yste
m o
f th
e A
rea

70 Hydrogeology
Amba Aradam sandstone (Ka)
Sandstone of the Amba Aradam formations has no hydrogeological data on the Filtu sheet. No water point was found directly in these formations. Previous works in the Ogaden basin (e.g. EIGS, 1999) classified Amba Aradom sandstone as a poor aquifer.
4.3.4 Formations with Essentially no Groundwater ResourcesThe gypsum dominated Upper Korahe (Kg2) forms an aquitard in the study area. It covers an
area of 217 km2, accounting for 1 % and is represented by dark brown (Fig. 4.4). This unit is intensively fractured but the fractures are filled with clays and silts which have a negative impact for groundwater circulation and storage.
4.4 Hydrogeological Conceptual Model The general concept of infiltration and groundwater circulation in the southeastern highlands
and adjacent lowlands is shown in Fig. 4. 5.
Precipitation in the highlands infiltrates into aquifers developed in outcropping volcanic rocks. Infiltrated groundwater forms shallow local groundwater flow which drained by local perennial and/or intermittent rivers of the plateau area. Some of the groundwater infiltrates to deeper aquifers developed by deeper volcanic as well sedimentary rocks. This deep groundwater flows to northwest to the rift valley and to the southeast to the adjacent lowlands. The groundwater that forms deep local groundwater flow is drained by large springs at the foot of the erosional (Harenna) escarpment and forms perennial rivers (e.g. the Yadot River). The remaining groundwater penetrates even deeper and forms deep regional groundwater flow that recharges aquifers in sedimentary rocks. The deep regional groundwater flow is drained by the main perennial rivers of the lowlands (Genale, Dawa, Wabe Shebelle rivers) and their main tributaries. Direct infiltration into aquifers developed in
Fig. 4.5 Conceptual hydrogeological model of the southeastern highlands and lowlands
Hyd
rog
eo
log
y E
lem
ents
of
the
Hyd
rog
eolo
gic
al S
yste
m o
f th
e A
rea
Hyd
rog
eo
log
ica
l Co
nce
ptu
al M
od
el
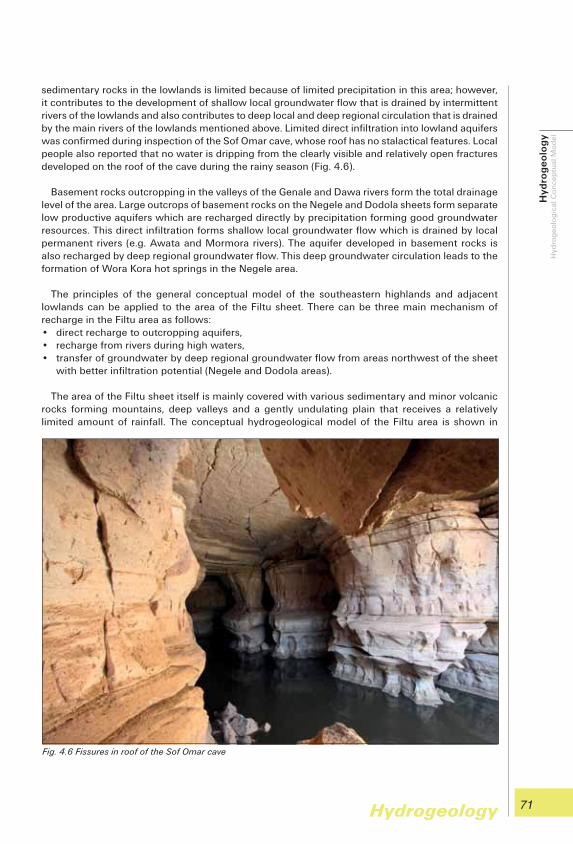
71Hydrogeology
sedimentary rocks in the lowlands is limited because of limited precipitation in this area; however, it contributes to the development of shallow local groundwater flow that is drained by intermittent rivers of the lowlands and also contributes to deep local and deep regional circulation that is drained by the main rivers of the lowlands mentioned above. Limited direct infiltration into lowland aquifers was confirmed during inspection of the Sof Omar cave, whose roof has no stalactical features. Local people also reported that no water is dripping from the clearly visible and relatively open fractures developed on the roof of the cave during the rainy season (Fig. 4.6).
Basement rocks outcropping in the valleys of the Genale and Dawa rivers form the total drainage level of the area. Large outcrops of basement rocks on the Negele and Dodola sheets form separate low productive aquifers which are recharged directly by precipitation forming good groundwater resources. This direct infiltration forms shallow local groundwater flow which is drained by local permanent rivers (e.g. Awata and Mormora rivers). The aquifer developed in basement rocks is also recharged by deep regional groundwater flow. This deep groundwater circulation leads to the formation of Wora Kora hot springs in the Negele area.
The principles of the general conceptual model of the southeastern highlands and adjacent lowlands can be applied to the area of the Filtu sheet. There can be three main mechanism of recharge in the Filtu area as follows:• direct recharge to outcropping aquifers, • recharge from rivers during high waters,• transfer of groundwater by deep regional groundwater flow from areas northwest of the sheet
with better infiltration potential (Negele and Dodola areas).
The area of the Filtu sheet itself is mainly covered with various sedimentary and minor volcanic rocks forming mountains, deep valleys and a gently undulating plain that receives a relatively limited amount of rainfall. The conceptual hydrogeological model of the Filtu area is shown in
Fig. 4.6 Fissures in roof of the Sof Omar cave
Hyd
rog
eo
log
yH
ydro
geo
log
ical
Co
nce
ptu
al M
od
el

72 Hydrogeology
Fig. 4.7. The area can be divided into two zones with different hydrogeological characteristics. Firstly, the western part of the sheet of the Filtu Mountains which consist of aquifers developed from Hamanlei and Gabredare limestone is deeply eroded by the courses of the Genale and Welmel rivers that form the main drainage level for groundwater in the area. Secondly, the eastern part on the left bank of the Genale River with outcrops of Gabredare limestone, Korahi sandstone and gypsum and a small mountainous area in the northwestern corner of the sheet with small outcrops of Mustahil limestone and Amba Aradam sandstone. The large flat area of Chereti plain, which extends onto the eastern part of the sheet, is partly covered with alluvial and elluvial sediments.
Recharge to aquifers is mainly directly through overlying soil and eluvial cover in the western part; however, the position of the aquifers in lowlands with low precipitation depth and limited surplus of water for infiltration causes limited direct recharge of the aquifers. Recharge from areas with higher precipitation westward from the Filtu sheet is also possible. Infiltrated water flows in aquifers from west to east following the general dip of the basin and the hydraulic gradient towards the east. Local recharge of aquifers is also possible from rivers in deep valleys during high waters. Infiltrated groundwater mainly forms deep regional groundwater flow and is discharged in dry periods directly to the Genale River and its main tributaries. Discharge of groundwater by springs is not common in the lowlands. Intermittent rivers receive a small amount of groundwater from shallow local groundwater flow in short periods after rainy seasons.
The eastern part has even less favorable conditions for groundwater formation and circulation. The precipitation is less than in the western part and the main aquifers developed in Hamanlei and Gabredare limestone are partly covered by the less permeable Korahi formation. Recharge to aquifers is direct through overlying soil and eluvial cover in the eastern part; however the overlying less permeable and impermeable units limit the direct recharge of aquifers. Recharge from areas with higher precipitation located northwest from Filtu sheet is also possible. Local recharge of aquifers, particularly the porous aquifer on the Chereti plain is also possible from Wayb River during high waters.
Infiltrated groundwater mainly forms shallow and deep local groundwater flows which are discharged by intermittent rivers in short periods after rainy seasons. Discharge of groundwater by springs is not common in the lowlands. Infiltrated groundwater can also contribute to the deep regional groundwater flow which is not discharged on the Filtu sheet. Deep groundwater
Fig. 4.7 Conceptual hydrogeological model of the Filtu area
Hyd
rog
eo
log
y H
ydro
ge
olo
gic
al C
on
cep
tua
l Mo
de
l
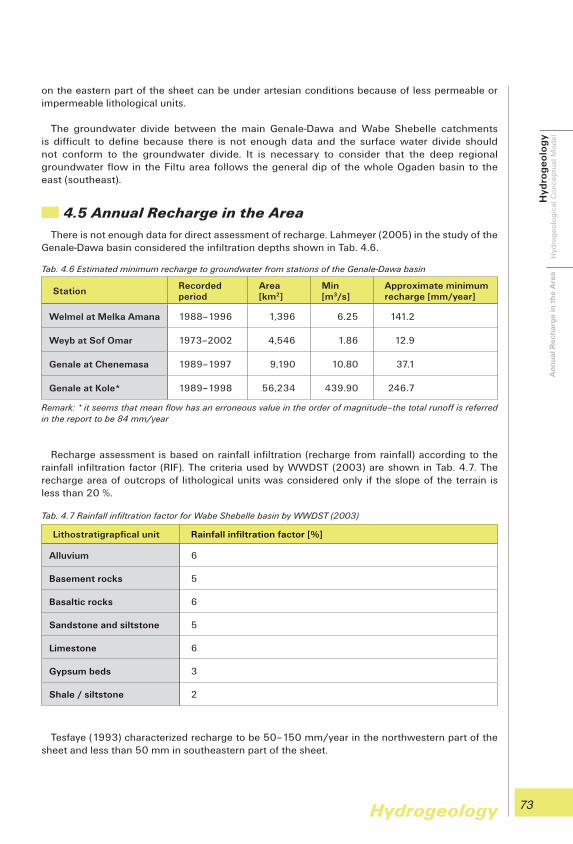
73Hydrogeology
on the eastern part of the sheet can be under artesian conditions because of less permeable or impermeable lithological units.
The groundwater divide between the main Genale-Dawa and Wabe Shebelle catchments is difficult to define because there is not enough data and the surface water divide should not conform to the groundwater divide. It is necessary to consider that the deep regional groundwater flow in the Filtu area follows the general dip of the whole Ogaden basin to the east (southeast).
4.5 Annual Recharge in the Area There is not enough data for direct assessment of recharge. Lahmeyer (2005) in the study of the
Genale-Dawa basin considered the infiltration depths shown in Tab. 4.6.
Recharge assessment is based on rainfall infiltration (recharge from rainfall) according to the rainfall infiltration factor (RIF). The criteria used by WWDST (2003) are shown in Tab. 4.7. The recharge area of outcrops of lithological units was considered only if the slope of the terrain is less than 20 %.
Tesfaye (1993) characterized recharge to be 50–150 mm/year in the northwestern part of the sheet and less than 50 mm in southeastern part of the sheet.
Tab. 4.6 Estimated minimum recharge to groundwater from stations of the Genale-Dawa basin
StationRecorded period
Area [km2]
Min[m3/s]
Approximate minimum recharge [mm/year]
Welmel at Melka Amana 1988–1996 1,396 6.25 141.2
Weyb at Sof Omar 1973–2002 4,546 1.86 12.9
Genale at Chenemasa 1989–1997 9,190 10.80 37.1
Genale at Kole* 1989–1998 56,234 439.90 246.7
Remark: * it seems that mean flow has an erroneous value in the order of magnitude–the total runoff is referred in the report to be 84 mm/year
Tab. 4.7 Rainfall infiltration factor for Wabe Shebelle basin by WWDST (2003)
Lithostratigrapfical unit Rainfall infiltration factor [%]
Alluvium 6
Basement rocks 5
Basaltic rocks 6
Sandstone and siltstone 5
Limestone 6
Gypsum beds 3
Shale / siltstone 2
Hyd
rog
eo
log
yH
ydro
geo
log
ical
Co
nce
ptu
al M
od
el
An
nu
al R
ech
arg
e in
th
e A
rea

74 Hydrogeology
Recharge calculated from mean values of baseflow shows variability from 0 mm/year to about 150 mm/year depending on precipitation depth variation in different years.
Separation of baseflow presented in Chapter 2 revealed the value of recharge of about14–50 mm/year for the southeastern part of the sheet with an average recharge of 50 mm/year for the Filtu sheet.
Hyd
rog
eo
log
y A
nn
ua
l Re
cha
rge
in t
he
Are
a

75
One of the important tasks of the water point inventory and data collection was to survey the groundwater chemistry and to assess the groundwater quality for its use within the mapped area. Therefore, a study of the groundwater quality was carried on the different aquifers (geological formations) of the area as well as various parts of the water circulation system. The results of the hydrochemical study can help to understand the groundwater circulation within the aquifers in addition to comparing the water quality with various standards.
Tesfaye Chernet (1993) identified the hydrochemical characteristics of the natural waters which were collected from different sources and the recharge/discharge conditions of the groundwater. According to Tesfaye Chernet:• the water resources in the lowlands are classified as being water with variable chemical quality
with TDS 500– 1,500 mg/l in the northwestern part, 1,500 –3,000 mg/l in the central part, and even above 3,000 mg/l in northeastern part of the sheet,
• the groundwater chemistry is characterized as being chloride type (Cl) particularly in the eastern part of the sheet.
Lahmeyer’s (2005) assessment of water quality described the Filtu area as one of the most problematic from both quantity and quality. Groundwater TDS is above 2,000 mg/l in general. It is between 1,500 mg/l and 3,000 mg/l when groundwater circulates in the limestone and above 3,000 mg/l when groundwater circulates in gypsiferrous and evaporites in the eastern part of the sheet. The study concluded that the general trend in the increase of TDS is from the northwest to the southeast lowlands within the Genale-Dawa basin.
Results of the chemical analyses were interpreted graphically and are shown on the hydroche-mical map of the area.
5.1 Sampling and Analysis A total of twenty five (25) water samples were collected from boreholes, dug wells, springs,
river water, and pond water in the study area. All of the water samples collected for laboratory analysis were submitted to the central laboratory of GSE and analyzed for chemical composition. The chemistry of the groundwater obtained from the samples incorporated into the list of chemical results shown in Annex 2. Chemical analysis of the major constituents (Mg, Ca, Na, HCO
3, SO
4, Cl) and secondary constituents (K, NO
3, F, HBO
2, CO
2, SiO
2), and measurements of
electrical conductivity (EC) and pH at room temperature were performed in the laboratory. Field measurements of pH, temperature and electrical conductivity were made at the time of sampling. The analytical results were presented graphically on a hydrochemical map to facilitate visualization of the water type and their relationship. Suitability of groundwater for drinking, industrial and agricultural purposes is assessed based on the pertinent quality standards.
5. Hydrogeochemistry5.
Hydrogeochemistry
Hyd
rog
eo
che
mis
try
Sam
plin
g a
nd
An
alys
is
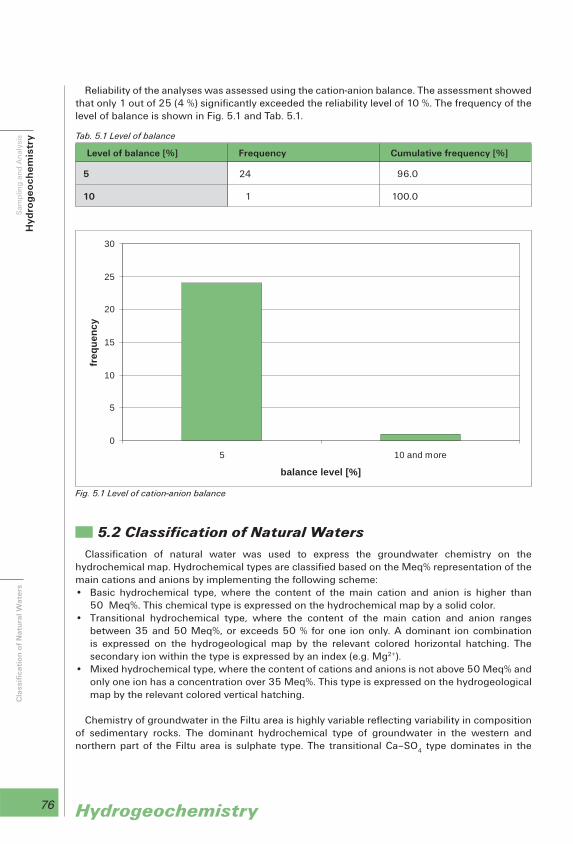
76 Hydrogeochemistry
Reliability of the analyses was assessed using the cation-anion balance. The assessment showed that only 1 out of 25 (4 %) significantly exceeded the reliability level of 10 %. The frequency of the level of balance is shown in Fig. 5.1 and Tab. 5.1.
5.2 Classification of Natural WatersClassification of natural water was used to express the groundwater chemistry on the
hydrochemical map. Hydrochemical types are classified based on the Meq% representation of the main cations and anions by implementing the following scheme: • Basic hydrochemical type, where the content of the main cation and anion is higher than
50 Meq%. This chemical type is expressed on the hydrochemical map by a solid color.• Transitional hydrochemical type, where the content of the main cation and anion ranges
between 35 and 50 Meq%, or exceeds 50 % for one ion only. A dominant ion combination is expressed on the hydrogeological map by the relevant colored horizontal hatching. The secondary ion within the type is expressed by an index (e.g. Mg2+).
• Mixed hydrochemical type, where the content of cations and anions is not above 50 Meq% and only one ion has a concentration over 35 Meq%. This type is expressed on the hydrogeological map by the relevant colored vertical hatching.
Chemistry of groundwater in the Filtu area is highly variable reflecting variability in composition of sedimentary rocks. The dominant hydrochemical type of groundwater in the western and northern part of the Filtu area is sulphate type. The transitional Ca –SO
4 type dominates in the
Level of balance [%] Frequency Cumulative frequency [%]
5 24 96.0
10 1 100.0
Tab. 5.1 Level of balance
Fig. 5.1 Level of cation-anion balance
0
5
10
15
20
25
30
5 10 and more
balance level [%]
freq
uenc
y
Hyd
rog
eo
che
mis
try
Sam
plin
g a
nd
An
alys
isC
lass
ific
ati
on
of
Na
tura
l Wa
ters

77Hydrogeochemistry
northwestern part of the Filtu sheet along with some basic types. High sulphate content in groundwater is caused by its circulation in limestone with higher solubility and its contact with gypsum strata which is a part of the sedimentary sequence or gypsum material present inside the rock matrix of other sedimentary rocks (sandstone, shale, and limestone).
There is also the randomly distributed occurrence of basic and transitional Ca –HCO3 types of
groundwater discharging water from limestone where intercalation of gypsum are not dissolute by circulating groundwater.
Chloride types (Na–Cl) of groundwater occur in the southeastern part of the map sheet.
The secondary ion constituent in transitional types of groundwater in the Filtu area can be any of cations (Ca, Mg, Na) and/or anions (SO
4, HCO
3, Cl).
The high TDS, variability of hydrochemistry of groundwater and dominant sulphate groundwater type indicates the stagnant hydrogeological regime of the lowlands area with an arid climate receiving a small volume of precipitation and where groundwater flows in lithologicaly
Tab. 5.2 Summary of hydrochemical types
Hydrochemistry Type Number of cases Percentage
Ca–HCO3
Basic 4 16
Ca–HCO3
Trans 3 12
Ca–Na–HCO3
Trans 1 4
Mg–Ca–HCO3
Trans 1 4
Na–Cl Trans 1 4
Na–Cl–HCO3
Trans 1 4
Ca–HCO3
Mixed 2 8
Ca–SO4 Basic 2 8
Ca–Mg–SO4
Basic 1 4
Ca–SO4
Trans 1 4
Na–Cl Basic 1 4
Na–Cl–SO4
Basic 1 4
Ca–Mg–SO4
Trans 1 4
Mg–Ca–SO4
Trans 1 4
Ca–SO4–Cl Trans 1 4
Ca–Cl–SO4
Trans 1 4
Na–Ca–SO4
Trans 1 4
Na–SO4
Trans 1 4
Hyd
rog
eo
che
mis
try
Cla
ssif
icat
ion
of
Nat
ura
l Wat
ers

78 Hydrogeochemistry
inhomogeneous fissured aquifers developed in various Mesozoic sedimentary rocks and unconsolidated Quaternary sediments. In general, the TDS increases from the northwest to the southeast to the drainage area formed by the valleys of the Genale River and its tributaries. This trend is shown by idealized isosalinity lines on the hydrochemical map. The general trend is highly affected by TDS and the groundwater hydrochemistry is highly affected by soluble gypsum and even rock salt which is common in some sedimentary units.
The hydrochemistry of groundwater of the area is expressed on the hydrochemical map by the relevant solid colors (for basic types) or colored hatching (for transitional and mixed types).
Fig. 5.2 Piper diagram for classification of natural waters
80 60 40 20 20 40 60 80
20
40
60
80 80
60
40
20
20
40
60
80
20
40
60
80
Ca Na HCO3 Cl
Mg SO4
Limestone Jh+JgSandstone Kg1Qa+QePondRiver
Tab. 5.3 Groundwater descriptive statistics of TDS, EC and Cl values
TDS [mg/l] EC [μS/cm] Cl [mg/l]
Average 2,996 3,895 757
Median 1,614 2,050 95
Minimum 94 101 2
Maximum 24,366 34,600 11,626
Count 25 25 25
Hyd
rog
eo
che
mis
try
Cla
ssif
icat
ion
of
Nat
ura
l Wat
ers

79Hydrogeochemistry
A general overview of the hydrochemistry of the natural water of the study area is shown in Tab. 5.2. To facilitate visualization of the classification of water types, the percentage of major cations and anions of the analyzed samples is plotted on the Piper diagram as shown in Fig. 5.2.
The basic statistical data for values of electric conductivity (EC), total dissolved solids (TDS) and concentration of chloride (Cl) are shown in Tab. 5.3.
5.2.1 Surface Water Hydrochemistry of surface water is represented by 3 samples from rivers and 2 samples from
ponds. The sampled rivers are Genale (FRV-1 and FRV-3) and Weyb (FRV-2). The Genale River was sampled at two sampling points, in the western part of study area and at Kole bridge on the way to Dolo in the east. The chemistry of the river waters in the study area is characterized by Ca –HCO
3
type. Water of the Genale River in sample (FRV-1) is of transitional Ca –Mg –HCO3 type. The TDS of
these samples ranges from 79 mg/l (FRV-1) to 707 mg/l (FRV-2). The downstream increase in TDS for the Genale River is from 79 mg/l to 254 mg/l and indicates the mixing of groundwater from sedimentary rocks to the river water. All the river sampling was made during the dry season and the chemistry shows that the typology conforms to the typology of groundwater in the aquifers and thus providing the hypothesis that surface water flow is maintained by groundwater (base flow).
Samples were taken from pond water in Kulul (FPW-1) and Filtu (FPW-2) which is used for public water supply. They show basic Ca –HCO
3 chemistry. The TDS is 321 mg/l (FPW-1) and 337.8 mg/l
(FPW-2).
The hydrochemistry of surface water is shown on the hydrochemical map by a pie chart.
5.2.2 Groundwater in Mesozoic and Quaternary SedimentsGroundwater from aquifers hosted in Mesozoic sediments represented by limestone and
sandstone and Quaternary sediments represented by alluvial and elluvial sediments occurs over
Fig. 5.3 Evaporates of Korahe formation near Chereti town
Hyd
rog
eo
che
mis
try
Cla
ssif
icat
ion
of
Nat
ura
l Wat
ers

80 Hydrogeochemistry
about 95 % of the area. Rain water infiltrates in outcrops of sedimentary rocks and flows through pores, fissures and karst opening aquifers from recharge areas into discharge areas and appears as springs particularly in deeper valleys along perennial rivers or is directly drained by rivers. Groundwater is also developed by dug wells and boreholes. The aquifers in limestone can also be recharged from an area located in the highlands west of the Filtu sheet and from rivers during high waters.
The groundwater of the Filtu map sheet is represented by 20 water samples. These samples were collected form 3 boreholes, 12 dug wells and 5 springs. The dominant chemistry is mainly of Ca–SO
4 type but Na, Mg, HCO
3 and Cl ions are also present as secondary constituents in
transitional types of groundwater. Groundwater TDS varies from 559 mg/l to 24,352 mg/l with an average value of 3,609 mg/l and the sulphate content varies from 50 mg/l to 4,604 mg/l. The extreme content of sulpahte and chloride in the groundwater indicates that groundwater circulates in gypsum or gypsum containing limestone or even in sediments containing rock salt. Fig. 5.3 shows evaporates of the Korahe formation near Chereti town.
The hydrochemistry of groundwater discharged from volcanic rocks is expressed on the hydrochemical map by the relevant solid colors.
5.3 Water QualityWater quality of the mapped area was assessed from the point of view of drinking, agriculture
and industrial use.
5.3.1 Domestic UseTo assess the suitability of water for drinking purposes, the results of the chemical analyses were
compared with the Ethiopian standards for drinking water (see Tab. 5.4) published in the Negarit Gazeta No. 12/1990 and The Guidelines of Ministry of Water Resources (MoWR, 2002).
Tab. 5.4 shows that groundwater of the mapped area is not convenient for drinking in more than 50 % of the sampled points. This situation reflects the fact that the majority of the groundwater dissolutes gypsum and even the rock salt occurring within sedimentary formations.
The content of calcium, sulphate and nitrate as well as TDS and chloride in more than 50 % of cases exceeds the highest desirable level and shows the main threats to the groundwater quality. Deterioration of groundwater quality by a high content of calcium, chloride, TDS and sulphate is caused by the natural character of the aquifers and results from dissolution of gypsum and rock salt material through which the groundwater is circulating. The high content of nitrates is caused by human factors (pollution) that add allochthonous material into the groundwater in the aquifer (human and animal waste).
Particular interest was paid to the content of nitrates in groundwater. The content of nitrates is not related to the rock composition (type) but it reflects pollution of groundwater by human and/or animal wastes. The background content of nitrates in groundwater is about 5 to 10 mg/l depending on the relevant land cover. In forest areas it can be even higher because of decomposition of various plants and other organic material. The nitrate content varies in the Filtu area from 1.8 mg/l to 195 mg/l with a mean value of 42 mg/l (Fig. 5.4).
A relative high number of water samples (13 out of 25 or more than 50 %) with a nitrate content of above 10 mg/l shows that the first (shallow) aquifers are polluted by human activity. The value of 10 mg/l is considered as the natural content of nitrates in the groundwater. The more alarming finding is that in 7 out of the 25 samples the concentrations of nitrates exceeded the maximum
Hyd
rog
eo
che
mis
try
Cla
ssif
icat
ion
of
Nat
ura
l Wat
ers
Wa
ter
Qu
alit
y

81Hydrogeochemistry
permissible level; however, the groundwater level is in a relative great depth and the quality of groundwater is protected by a thick layer of overburden. This pollution is an important factor particularly in highly vulnerable karst aquifers. This fact also has to be considered when planning for the future development and protection of groundwater resources in the area. Proper location of water points and suitable protective measures should be applied to boreholes and dug wells used for human water supply. Fig. 5.4 shows the content of nitrates in the analysis of water in the study area.
PropertyRange (min–max)[mg/l]
Ethiopian standards (1) and MoWR Guidelines (2) [mg/l]
Number of exceeding values
Highest desirable level
Maximum permissible level
Highest desirable level
Maximum permissible level
Na (2) 5–5,075 358 4
Ca (1) 5–1,050 75 200 18 11
Cl (1) 2–11,626 200 600 8 4
Cl (2) 2–11,626 533 4
HBO2
0–0 0.3 0
(free) ammonia
0.05 0.1
Fe (1) 0.1 1
Fe (2) 0.4
Mg (1) 3–1,725 50 150 14 7
Mn (1) 0.05 0.5
Mn (2) 0.5
SO4 (1) 2–4,604 200 400 13 12
SO4 (2) 2–4,604 483 12
TDS (1) 94–24,366 500 1,500 21 13
pH (1) 7.19–7.99 7.0–8.5 6.5–9.2 0 0
pH (2) 7.19–7.99 6.5–8.5 0
NO3 (1) 0.4–195 10 45 13 7
NO3 (2) 0.4–195 50 6
F (1) 0.1–3.5 1 1.5 7 4
F (2) 0.1–3.5 3 1
Tab. 5.4 Groundwater chemistry compared to drinking water standards and guidelines
Hyd
rog
eo
che
mis
try
Wat
er Q
ual
ity

82 Hydrogeochemistry
5.3.2 Irrigation UseAgricultural standards for the quality of groundwater used for irrigation purposes are determined
based on the Sodium Adsorption Ratio (SAR), total dissolved solids and United States Salinity Criteria (USSC). The Sodium Adsorption Ratio (SAR) is used to study the suitability of groundwater for irrigation purposes. It is defined by SAR = Na/[(Ca+Mg)/2] where all concentrations are expressed in mg/l.
Most of the water samples (see Tab. 5.6) from the study area are found to be suitable for irrigation since they show the SAR value within the water quality class of excellent for agricultural purposes. Groundwater classified as fair and/or poor quality water for irrigation corresponds with water points yielding Na–Cl type of water.
5.3.3 Industrial UseIndustrial water criteria establish the requirements of water quality to be used for different
industrial processes that vary widely. Thus, the composition water for high pressure boilers must meet extremely strict criteria whereas water of low quality can be used for cooling of condensers. The suitability of water for use in industry is shown in Tab. 5.7.
Fig. 5.4 Content of nitrate in analysis of water in the study area
0
50
100
150
200
250
0 3 6 9 12 15 18 21 24 27
water points
nitr
ates
[mg/
l]
DW-3
BH-2, DW-12
Tab. 5.6 Suitability of water for irrigation
Value of SAR Water class Number of samples in the range
<10 Excellent 15
10–18 Good 3
18–26 Fair 3
>26 Poor 4
Hyd
rog
eo
che
mis
try
Wat
er Q
ual
ity

83Hydrogeochemistry
Of almost equal importance for industry as quality of used water is the relative time constancy in concentration of various components. As a result, an adequate groundwater quality often becomes a primary consideration in selecting a new industrial plant location. Groundwater from the mapped area can be used for industry in general, but some specific technologies require water treatment before the water is used in the technology.
Industry or useSolids (TDS)[mg/l]
pHChlorides as Cl [mg/l]
Sulfates as SO
4[mg/l]
Number of samples in the range
Brewing 500–1,500 6.5–7.0 60–100 0
Carbonated beverages < 850 < 250 < 250 8
Confectionary 50–100 > 7.0 1
Dairy < 500 < 30 < 60 4
Food canning and freezing
< 850 > 7.0 8
Food equipment washing
< 850 < 250 8
Food processing general
< 850 8
Ice manufacture 170–1,300 11
Laundering 6.0–6.5 0
Paper and pulp fine < 200 1
Paper groundwood < 500 < 75 4
Paper bleached cardboard
< 300 < 200 2
Paper unbleached cardboard
< 500 < 200 4
Paper soda and sulfate pulps
< 250 < 75 1
Rayon and acetate fiber pulp production
< 100 1
Rayon manufacture 7.8–8.3 2
Sugar < 100 < 20 < 20 1
Tanning 6.0–8.0 25
Textile < 100 < 100 8
Tab. 5.7 Suitability of water for use in industry
Remark: Sugar requirements for TDS are in general low
Hyd
rog
eo
che
mis
try
Wat
er Q
ual
ity
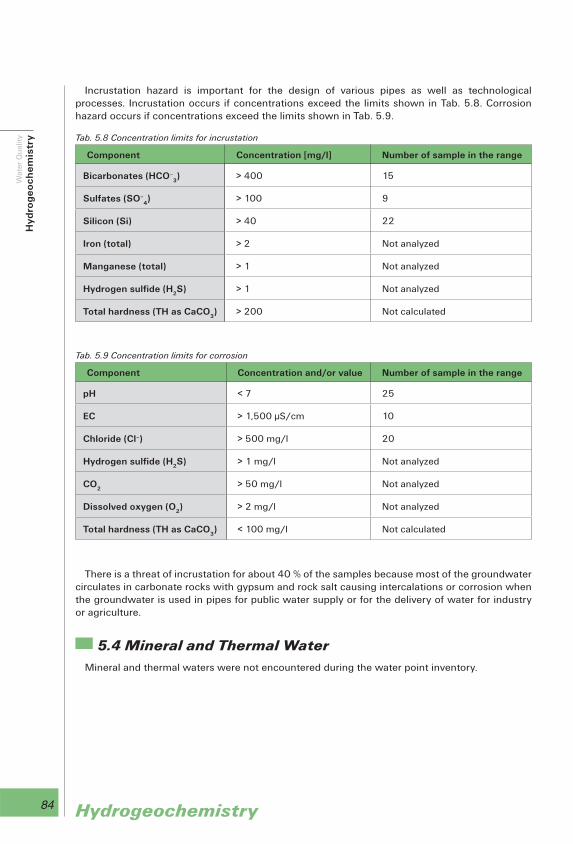
84 Hydrogeochemistry
Incrustation hazard is important for the design of various pipes as well as technological processes. Incrustation occurs if concentrations exceed the limits shown in Tab. 5.8. Corrosion hazard occurs if concentrations exceed the limits shown in Tab. 5.9.
There is a threat of incrustation for about 40 % of the samples because most of the groundwater circulates in carbonate rocks with gypsum and rock salt causing intercalations or corrosion when the groundwater is used in pipes for public water supply or for the delivery of water for industry or agriculture.
5.4 Mineral and Thermal WaterMineral and thermal waters were not encountered during the water point inventory.
Tab. 5.8 Concentration limits for incrustation
Component Concentration [mg/l] Number of sample in the range
Bicarbonates (HCO–3) > 400 15
Sulfates (SO–4) > 100 9
Silicon (Si) > 40 22
Iron (total) > 2 Not analyzed
Manganese (total) > 1 Not analyzed
Hydrogen sulfide (H2S) > 1 Not analyzed
Total hardness (TH as CaCO3) > 200 Not calculated
Tab. 5.9 Concentration limits for corrosion
Component Concentration and/or value Number of sample in the range
pH < 7 25
EC > 1,500 μS/cm 10
Chloride (Cl–) > 500 mg/l 20
Hydrogen sulfide (H2S) > 1 mg/l Not analyzed
CO2
> 50 mg/l Not analyzed
Dissolved oxygen (O2) > 2 mg/l Not analyzed
Total hardness (TH as CaCO3) < 100 mg/l Not calculated
Hyd
rog
eo
che
mis
try
Wat
er Q
ual
ity
85
Natural resources of the Filtu area vary in origin relating to the geological composition, soil conditions, water, wind and solar radiation, as well as human resources.
6.1 Economic GeologyThe reddish brown, sandy silty, residual soil and fluvial deposits can be a good source of burrow
material. The soil (Vertisols) occurs on rounded, low relief hills composed of limestone. The soil can serve as an impervious blanket in the construction of dams and other water retaining structures. As it can be seen from field observation the local people make pottery products from the residual soil.
Sand and gravel naturally occurring along the main rivers can be used for preparation of concrete and gravel for water well development (gravel packing). There are many existing quarries of sand and gravel in the project area especially in the river valleys mentioned.
Limestone, gypsum and mudstone provide potential resources for development of cement and lime as well as for the development of various products in the chemical industry (paint production, plaster of Paris, dimension stones, etc.). There are no cement factories in the area and the potential has yet to be developed on the Filtu sheet. There are many existing quarries of limestone especially along roads and crushed limestone is used for road construction.
6.2 Water ResourcesWater resources of the area depend mainly on rainfall and other climatic characteristics, as well
as the hydrological, geological and topographical settings of the study area. Detailed assessment of water resources in the area is difficult because both climatic and water flow data are scarce and the existing data series are short and incomplete or inaccessible.
There is only 1 meteorological station in Filtu town operated by the Meteorological Institute in the mapped area. The station has long-term measurements. The long-term mean annual rainfall of the area has been adopted to be about 420 mm/year for the sheet.
The area of the map was calculated from the 1:250,000 hydrogeological map and an area of 18,395 km2 is used for further calculation.
The area of active aquifers that store and transmit water was calculated based on the hydrogeological map. The active aquifers (Tab. 6.1) of porous, karst and fissured permeability cover an area of 14,644 km2.
6. Natural Resources
of the Area
6.
Natural Resources of the Area
Na
tura
l Re
sou
rce
s o
f th
e A
rea
Eco
no
mic
Geo
log
yW
ate
r R
eso
urc
es

86 Natural Resources of the Area
The runoff characteristics vary widely because of variability in climatic conditions and hydrogeological characteristics between different observation points. The Genale River is the only perennial river in the area. The Weyb, Wabe Mena and Welmel are flowing only in wet years. The surface river flow measurements are performed only on rivers outside of the Filtu sheet. Surface flow–baseflow assessment is highly affected and by short and incomplete of data series and intermittent character of rivers in some years. Data can be also highly influenced by the effect of bank groundwater storage, difficulties in flow measurements in wide and unstable river channels and unknown groundwater flow beneath gauging stations. For further calculations, the value for specific surface runoff of 2.0 l/s.km2 and specific baseflow of 0.14 l/s.km2 has been adopted for the Filtu area. The assessed water resources of the Filtu area are shown in Tab. 6.2 based on the adopted map area, values of specific runoff and specific baseflow.
6.2.1 Surface Water Resources DevelopmentRainfall distribution is strongly variable in the Filtu area with two distinct precipitation peaks
and two dry seasons in between. Most of the region is in an arid zone which in consequence has an almost total absence of surface water with the exception of prominent and large rivers that originate in the highlands with a contribution of groundwater. The inhabitants in the area rely on harvesting the rain (Fig. 6.1) to support water resources for livestock watering and possibly small irrigation schemes and basic drinking needs.
Rainwater harvesting is the simplest water development strategy and a simple calculation will show that 10 cm of rainwater collected over a surface of 1 hectare (100 x 100 m) would collect a total of 1,000 m3. The study area receives a maximum amount of rainfall of 13.2 cm in April. The construction of ponds (berka) can support local water supply within the area.
Tab. 6.1 Aquifers of the area
Aquifers Area [km2]
Porous 669
Fissured and karst in sedimentary rocks 13,975
Aquitards and aquicludes 3,751
Total of the area 18,395
Tab. 6.2 Assessment of water resources of the Filtu area
Input Area [km2] Resources total Remark
Precipitation 420 mm 18,395 7,726 Mm3/year
Total water resources – map 2.0 l/s.km2 18,395 1,161 Mm3/year 15 % rainfall
Renewable groundwater resources of active aquifers
0.14 l/s.km2 14,644 81 Mm3/year 1.1 % rainfall
Static groundwater resources of karst and fissured aquifers
5 % porosity100 m saturatedthickness
13,975 69,875 Mm3
Static groundwater resources of porous aquifers
15 % porosity30 m saturatedthickness
669 3,011 Mm3
Na
tura
l Re
sou
rce
s o
f th
e A
rea
Wa
ter
Re
sou
rce
s

87Natural Resources of the Area
Despite of the fact that river gauge measurements show very high, but logical, evapotranspiration of the arid area when only 15 % of precipitation is drained as total runoff from the area, there are good water resources to be used for irrigation, electricity generation as well as for drinking water supply of people living within the area. The total water resources of the area have been assessed to be 1,161 Mm3/year.
The surface water of the area should be used for irrigation, drinking supply (as practiced in the Filtu area) as well as for electricity generation; however, construction of dams will not be easy in areas covered by karstified limestone. The irrigation should be preferably applied on Genale, Weyb, Wabe Mena and Welmen rivers of the central and eastern parts of the sheet where deep gorge dominates together with well developed alluvial plains. Irrigation dams in other rivers should be designed in a different way respecting the intermittent character of rivers and topography of the area.
Dams for electricity generation should be constructed on the Genale where the gorge of the river is represented by less permeable basement rocks.
Considering the fact that the use of surface water for irrigation is the most important development factor for food security in the area, we can recommend about 80 % of available surface water resources to be used for irrigation. This portion represents 929 Mm3/year. Considering about 10,000 m3 of water is needed to irrigate 1 ha of land, the calculated irrigation resources represent an irrigation potential of 99,900 ha. This area represents 999 km2 which is about 5 % of the Filtu area.
It is known that the area can often be affected by drought periods and during some years irrigation dams will not be refilled by rainfall. When this will happen over several years irrigation cannot be practiced in drought stricken areas. The meteorological observations and experience from the Genale-Dawa basin area as well as other areas shows that the occurrence of drought periods is not uniformly distributed over large areas and in the case of drought in one part of the area (sheet) other areas (or adjacent sheets) can gained a volume of precipitation sufficient for filling irrigation dams. This analysis results in the recommendation that irrigation dams are highly important for agricultural development of the area. Drought periods and their spatial distribution show that agricultural production in areas of adequate rainfall can support areas stricken by drought within the region
Fig. 6.1 Pond in Filtu town used as a source of drinking water for local inhabitants
Na
tura
l Re
sou
rce
s o
f th
e A
rea
Wa
ter
Re
sou
rce
s
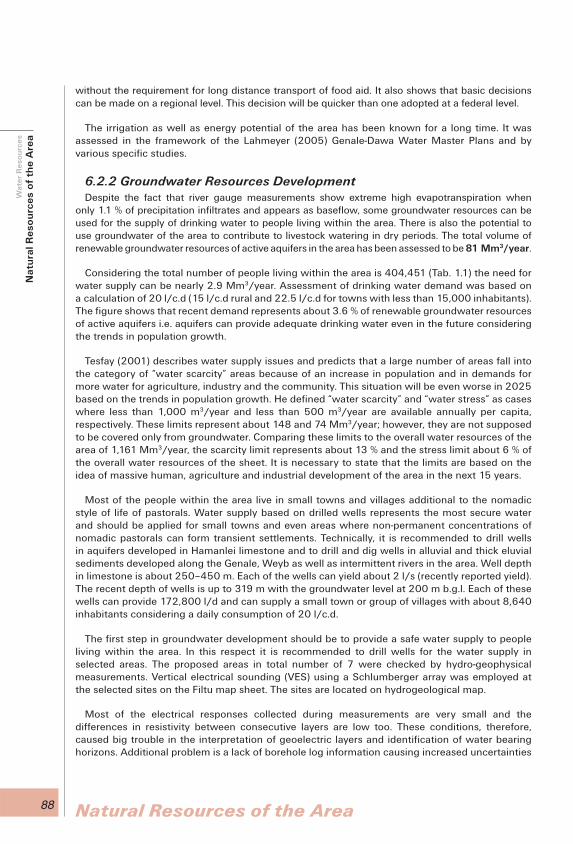
88 Natural Resources of the Area
without the requirement for long distance transport of food aid. It also shows that basic decisions can be made on a regional level. This decision will be quicker than one adopted at a federal level.
The irrigation as well as energy potential of the area has been known for a long time. It was assessed in the framework of the Lahmeyer (2005) Genale-Dawa Water Master Plans and by various specific studies.
6.2.2 Groundwater Resources DevelopmentDespite the fact that river gauge measurements show extreme high evapotranspiration when
only 1.1 % of precipitation infiltrates and appears as baseflow, some groundwater resources can be used for the supply of drinking water to people living within the area. There is also the potential to use groundwater of the area to contribute to livestock watering in dry periods. The total volume of renewable groundwater resources of active aquifers in the area has been assessed to be 81 Mm3/ year.
Considering the total number of people living within the area is 404,451 (Tab. 1.1) the need for water supply can be nearly 2.9 Mm3/year. Assessment of drinking water demand was based on a calculation of 20 l/c.d (15 l/c.d rural and 22.5 l/c.d for towns with less than 15,000 inhabitants). The figure shows that recent demand represents about 3.6 % of renewable groundwater resources of active aquifers i.e. aquifers can provide adequate drinking water even in the future considering the trends in population growth.
Tesfay (2001) describes water supply issues and predicts that a large number of areas fall into the category of “water scarcity” areas because of an increase in population and in demands for more water for agriculture, industry and the community. This situation will be even worse in 2025 based on the trends in population growth. He defined “water scarcity” and “water stress” as cases where less than 1,000 m3/year and less than 500 m3/year are available annually per capita, respectively. These limits represent about 148 and 74 Mm3/year; however, they are not supposed to be covered only from groundwater. Comparing these limits to the overall water resources of the area of 1,161 Mm3/year, the scarcity limit represents about 13 % and the stress limit about 6 % of the overall water resources of the sheet. It is necessary to state that the limits are based on the idea of massive human, agriculture and industrial development of the area in the next 15 years.
Most of the people within the area live in small towns and villages additional to the nomadic style of life of pastorals. Water supply based on drilled wells represents the most secure water and should be applied for small towns and even areas where non-permanent concentrations of nomadic pastorals can form transient settlements. Technically, it is recommended to drill wells in aquifers developed in Hamanlei limestone and to drill and dig wells in alluvial and thick eluvial sediments developed along the Genale, Weyb as well as intermittent rivers in the area. Well depth in limestone is about 250 –450 m. Each of the wells can yield about 2 l/s (recently reported yield). The recent depth of wells is up to 319 m with the groundwater level at 200 m b.g.l. Each of these wells can provide 172,800 l/d and can supply a small town or group of villages with about 8,640 inhabitants considering a daily consumption of 20 l/c.d.
The first step in groundwater development should be to provide a safe water supply to people living within the area. In this respect it is recommended to drill wells for the water supply in selected areas. The proposed areas in total number of 7 were checked by hydro-geophysical measurements. Vertical electrical sounding (VES) using a Schlumberger array was employed at the selected sites on the Filtu map sheet. The sites are located on hydrogeological map.
Most of the electrical responses collected during measurements are very small and the differences in resistivity between consecutive layers are low too. These conditions, therefore, caused big trouble in the interpretation of geoelectric layers and identification of water bearing horizons. Additional problem is a lack of borehole log information causing increased uncertainties
Na
tura
l Re
sou
rce
s o
f th
e A
rea
Wa
ter
Re
sou
rce
s
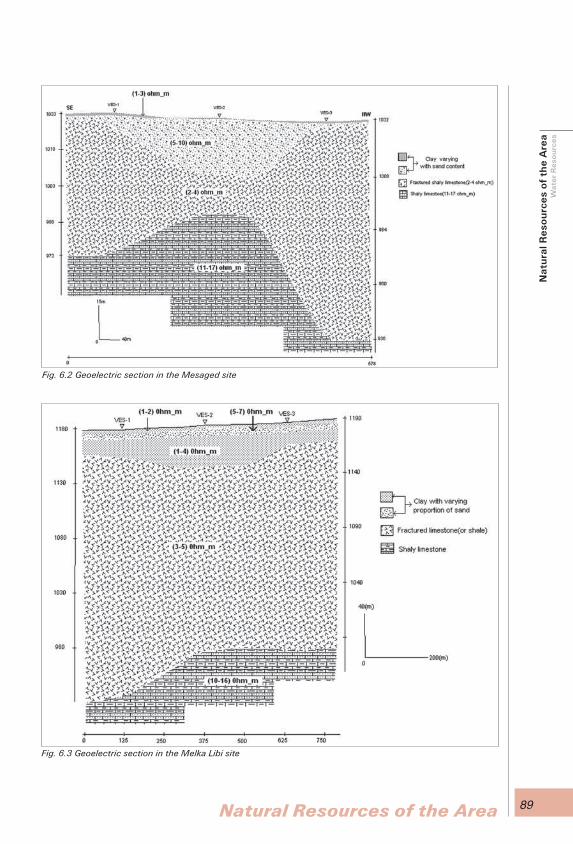
89Natural Resources of the Area
Fig. 6.2 Geoelectric section in the Mesaged site
Fig. 6.3 Geoelectric section in the Melka Libi site
Na
tura
l Re
sou
rce
s o
f th
e A
rea
Wa
ter
Re
sou
rce
s

90 Natural Resources of the Area
in geological and hydrogeological interpretation of geoelectric layers. Using the existing information about geology, hydrogeology the geophysical interperatation of geoelectric sections was prepared and results of VES measurement are discussed in following text.
Mesaged - site 1 Three VES surveys were carried out in this area and a geoelectric section which constitutes
four geoelectric layers was prepared. The layers are probably clay, sandy clay and fractured shale limestone (Fig. 6.2). Among these layers, the sandy clay with 5–10 .m resistivity and 1.6 –24.2 m thickness and the fractured shale limestone with 11 –17 .m resistivity and 17–93 m thickness could probably bear groundwater. The sandy clay is thicker near VES-2 and the fractured limestone is thicker towards the ends of the section.
Melka Libi - site 2Three VES surveys were carried out in this area and a geoelectric section that constitutes
5 resistivity layers was produced. The layers are probably clay, clay with sand, fractured shale limestone and shale intercalated with limestone (Fig. 6.3). The sandy clay with 5 –7 .m resistivity and 4.3– 6.2 m thickness and the fractured shale limestone with 3–5 .m resistivity and 164.6–255.3 m thickness are probable sources of groundwater in the area. However, the thicker third layer could hinder recharge to the fourth fractured shale limestone layer.
Chereti - site 3Five VES surveys were carried out in this area and a geoelectric section was produced (Fig. 6.4). The
geoelectric section constitutes three to four layers which are probably three soil layers varying in sand content that probably increase in depth, and the forth layer represented by shale. The third soil layer that comparatively contains a large proportion of sand could possibly (low probability) contain groundwater.
Halimeslo - site 4Two VES surveys were carried out and a geoelectric section (Fig. 6.5) was produced which
constitutes four layers that are probably dry clay, wet clay, fractured limestone or fractured shale, and limestone or shale. The fractured shale limestone probably bears groundwater if it is actually fractured limestone but not if it is decomposed shale.
Ananis - site 5 Three VES surveys were carried out and a geoelectric section which constitutes three geoelectric
layers was produced (Fig. 6.6). The layers are probably clay, fractured shale limestone, and shale limestone. The interpretation shows that the fractured shale limestone with 1–3 .m resistivity and 21.2 –53.7 m thickness probably bears groundwater.
Fig. 6.4 Geoelectric section in the Chereti site
Na
tura
l Re
sou
rce
s o
f th
e A
rea
Wa
ter
Re
sou
rce
s

91Natural Resources of the Area
Filtu - site 6The outcomes from three VES soundings were used to produce a geoelectric section that
constitutes four resistivity layers which are probably clay, wet clay, fractured shale limestone and
Fig. 6.5 Geoelectric section in the Halimeslo site
Fig. 6.6 Geoelectric section in the Ananis site
Na
tura
l Re
sou
rce
s o
f th
e A
rea
Wa
ter
Re
sou
rce
s

92 Natural Resources of the Area
shaly limestone (Fig. 6.7). Among the four layers, the third one which is fractured shale limestone with 1–2 .m resistivity and 33.3–65.8 m thickness probably bears groundwater. However, the clay layer overlying it could hinder recharge.
Dumel - site 7Measurements at the site 7 were conducted by Islamic Relief (IR) in the Afder zone. In this
geophysical study 5 geoelectric layers with low to high resistivity were identified. Tab. 6.3 shows geoelectric layers with interpreted lithology.
The proposed depth of boreholes is designed based on the optimum cost and yield of individual wells. During the final siting of each well it is necessary to consider that the final depth of the proposed wells is governed by the expected level of groundwater which is given by the drainage level (spring altitude, surface water level) and surface level of the site selected for well drilling.
The most difficult question will be supply to rural areas with a widely spread population and/or even population with nomadic system of life. This should be done from local centers where water wells will be drilled and connected to places of water use with relatively long distribution pipes. Effectiveness and cost of water supply systems for the rural population should be studied as a site specific problem in the future.
Most rural schemes, especially gravity schemes, do not have water levies. The tariff rates of schemes with water charges range from 0.10 Birr/family/month to 6 Birr/m3 of water. Schemes with a motorized borehole source have higher rates ranging from 3 to 6 Birr/m3 of water.
Potential groundwater resources developed in the area surpass the current needs of people living in the area. It is nearly in equivalent with the potential demand of water when agriculture,
Fig. 6.7 Geoelectric section in the Filtu site
Na
tura
l Re
sou
rce
s o
f th
e A
rea
Wa
ter
Re
sou
rce
s
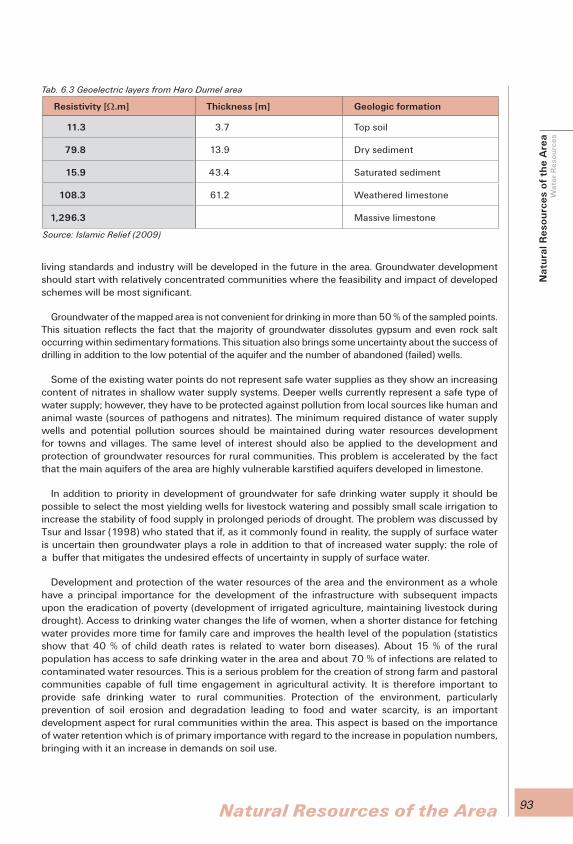
93Natural Resources of the Area
living standards and industry will be developed in the future in the area. Groundwater development should start with relatively concentrated communities where the feasibility and impact of developed schemes will be most significant.
Groundwater of the mapped area is not convenient for drinking in more than 50 % of the sampled points. This situation reflects the fact that the majority of groundwater dissolutes gypsum and even rock salt occurring within sedimentary formations. This situation also brings some uncertainty about the success of drilling in addition to the low potential of the aquifer and the number of abandoned (failed) wells.
Some of the existing water points do not represent safe water supplies as they show an increasing content of nitrates in shallow water supply systems. Deeper wells currently represent a safe type of water supply; however, they have to be protected against pollution from local sources like human and animal waste (sources of pathogens and nitrates). The minimum required distance of water supply wells and potential pollution sources should be maintained during water resources development for towns and villages. The same level of interest should also be applied to the development and protection of groundwater resources for rural communities. This problem is accelerated by the fact that the main aquifers of the area are highly vulnerable karstified aquifers developed in limestone.
In addition to priority in development of groundwater for safe drinking water supply it should be possible to select the most yielding wells for livestock watering and possibly small scale irrigation to increase the stability of food supply in prolonged periods of drought. The problem was discussed by Tsur and Issar (1998) who stated that if, as it commonly found in reality, the supply of surface water is uncertain then groundwater plays a role in addition to that of increased water supply: the role of a buffer that mitigates the undesired effects of uncertainty in supply of surface water.
Development and protection of the water resources of the area and the environment as a whole have a principal importance for the development of the infrastructure with subsequent impacts upon the eradication of poverty (development of irrigated agriculture, maintaining livestock during drought). Access to drinking water changes the life of women, when a shorter distance for fetching water provides more time for family care and improves the health level of the population (statistics show that 40 % of child death rates is related to water born diseases). About 15 % of the rural population has access to safe drinking water in the area and about 70 % of infections are related to contaminated water resources. This is a serious problem for the creation of strong farm and pastoral communities capable of full time engagement in agricultural activity. It is therefore important to provide safe drinking water to rural communities. Protection of the environment, particularly prevention of soil erosion and degradation leading to food and water scarcity, is an important development aspect for rural communities within the area. This aspect is based on the importance of water retention which is of primary importance with regard to the increase in population numbers, bringing with it an increase in demands on soil use.
Tab. 6.3 Geoelectric layers from Haro Dumel area
Resistivity [.m] Thickness [m] Geologic formation
11.3 3.7 Top soil
79.8 13.9 Dry sediment
15.9 43.4 Saturated sediment
108.3 61.2 Weathered limestone
1,296.3 Massive limestone
Source: Islamic Relief (2009)
Na
tura
l Re
sou
rce
s o
f th
e A
rea
Wa
ter
Re
sou
rce
s
94 Natural Resources of the Area
Another important task for the future development of knowledge about the groundwater resources of the area is the monitoring of fluctuations in groundwater levels and quality. It would be necessary to drill several monitoring wells within the aquifers for this purpose. It is recommended to drill these wells as additional monitoring equipment for climatic stations and conduct groundwater monitoring together with measurements of climate characteristics (Filtu Chereti, etc.). Selection of monitoring points for observation of groundwater level (quantity) and quality fluctuations in limestone aquifers should be discussed with the Wereda Water Offices.
Results of water resources assessment show that the area has surface water and groundwater providing a sufficient potential for water supply system and future development. From the point of view of food security it is highly recommended to make the use of surface water for irrigation and subsequent increase in agriculture production a priority. The Genale River can be used for hydropower schemes. Considering the surface and groundwater potential of the Filtu area:
1. Surface water is sufficient for irrigation of 5 % of the Filtu map sheet area (dominantly along Genale and Weyb rivers) considering the use of 10,000 m3/ha annually.
2. In the case of the groundwater consumption of 20 l/d of recent population the demand will represents less than 4 % of the assessed groundwater resources with potential to supply people with relatively good quality drinking water (50 % of developed water points meet requirements of drinking water standards).
The potential of the area provides feasible and environmentally sound water management.
6.3 Human and Land Use Resources and DevelopmentThere is a large human resource potential within the area. The total assessed population is
0.8 million and average urban and rural population growth in the Oromia region is 2.9 and Somali 2.6 %. Taking this into account the population of the area will double in the next 20–25 years. This represents a large potential of manpower for agricultural and livestock production as well as for developing industry using the area s natural resources. Agricultural irrigation should be practiced on the arable land and part of the area cover classified as pasture should also be used for arable land, and livestock husbandry should use more effective methods of livestock breeding.
Improvement of the health status of inhabitants using safe water supply systems and utilization of the remaining water resources for agricultural irrigation and the possibly for small hydropower schemes and industrial development (using other natural resources of the area) will improve the standard of life and help to eradicate poverty within this part of Ethiopia.
6.4 Wind and Solar Energy DevelopmentThe area has a good potential for the development of solar and wind energy. It should be feasible
to use the produced energy for local supply e.g. running pumps for groundwater development or for distribution of irrigation water. It could also be feasible to use this electricity for running local small businesses as grain mills, food processing and conservation industry etc.
6.5 Environmental Problems and their Control / ManagementAttention is paid to the eradication of poverty, protection of the environment and natural resources
as well as the increase in education in this field. The explanatory notes provide information for planning in sustainable economical development, other sectorial planning, management in the use of natural and human resources and protection against natural hazards. The study concentrates on the identification and protection of water resources, soil (particularly protection of soil against erosion), protection against natural hazards and wastewater and solid waste management.
Protection of water resources should be concentrated on better practices in sanitation within towns, villages and rural settlements. About 50 % of surface and groundwater is good in quality and
Na
tura
l Re
sou
rce
s o
f th
e A
rea
Wa
ter
Re
sou
rce
sH
um
an
an
d L
an
d U
se R
eso
urc
es
an
d D
ev.
Win
d a
nd
So
lar
En
erg
y D
ev.
En
viro
nm
en
tal P
rob
lem
s

95Natural Resources of the Area
can be used directly for drinking, agricultural and industrial purposes (see Chapter 5). Indication of improper sanitation practices is reflected in the increase of nitrates from human and animal wastes in the shallow groundwater that is used by drilled and dug wells. Water development practices should be based on basic principles of protection as follow:
1. The source of groundwater should not be drilled and/or dug directly in the center of the village/town.
2. The final design of the well and distribution system should prevent direct percolation of water from the surroundings of the well along its casing to the groundwater.
3. A well should be designed upstream from the groundwater flow direction in respect to existing and potential pollution sources.
4. The required minimal protection zones should be respected by land use development in the vicinity of wells / well fields.
5. Regular monitoring of water levels and quality should be performed.6. There should be improvements in the general application of sanitation and waste management
practices.
Soil erosion and protection is one of the limiting factors of sustainable development of agriculture within the area. The Vice-Minister (ENA) of Agriculture disclosed that Ethiopia is losing 1,900 million tons of soil through erosion every year. In the opening of a three-day workshop on soil fertility management, the Vice-Minister Ato Getachew Tekelemedhin said the country is losing 600 million Birr per annum due to reduced agricultural production triggered by the effects of soil erosion. If the current trend continues unabated, a sizeable farming community in the country would be forced to earn their livelihood from sources other than farming. The prominent factors for soil degradation in Ethiopia, according to the Vice-Minister, were population pressure, deforestation, poor agricultural techniques, overgrazing and drought. He noted that the Soil Fertility Initiative (SFI) launched by the World Bank and the UN Food and Agriculture Organization played an important role in preventing soil degradation in sub-Sahran countries including Ethiopia. Addressing the workshop, Mr. Ismail Serageldin, the Vice-President of a World Bank special program, expressed the bank’s readiness to support Ethiopia’s soil fertility initiative.
Data about soil erosion in the area are scare. The human causes of soil erosion relate mainly to ploughing, and harvesting seasons and its coincidence with the season with the heaviest rainfall when crop cover is limited. Another human factor which contributes to soil erosion is the short fallow period (one to four years). Soil burning which destroys the organic matter content of the soil is another adverse factor.
Traditional soil cultivation and conservation techniques use ditches for drainage. The ditches run diagonally across the slope, usually with a gradient of more than 5 %. These ditches are made by ploughing deep into the ground. The spacing of the drainage ditches in a field depends on the steepness of the slope, the steeper fields having more drainage ditches than fields on gentler slopes.
Anti-erosion measures consist of several techniques. Some of the most frequent techniques can be defined as follows:
1. The steep slopes of the highlands should be reforested.2. This area as well as parts of gorges, where reforestation is not possible, can be terraced
(similar to the Konso area and/or on the slopes at the northern part of the country).3. Retention of water in the countryside–construction of small dams (even on intermittent
rivers) for irrigation can help not only for the accumulation of water for irrigation, but also to slow down runoff after heavy rains and the accumulation of suspended material (eroded soil) in small dams. The accumulated material can be subsequently excavated and used as a fertilizer for arable land.
4. Wicker fascine–is a cheap and very simple anti-erosion measure that can be practiced in all parts of the area either separating agricultural fields of individual owners or implemented inside the field when the fields are big enough and highly prone to erosion.
Na
tura
l Re
sou
rce
s o
f th
e A
rea
En
viro
nm
en
tal P
rob
lem
s a
nd
th
eir
Co
ntr
ol /
Ma
na
ge
me
nt
96 Natural Resources of the Area
5. Creation of shrubs/tree rows preventing wind erosion and slowing down surface runoff.6. Covering artificial cuts (along roads and other constructions) by nets or geo-textile.7. Other technical measures and agricultural practices.
A focus on soil conservation is one of the most important factors for environmentally sound land use. Soil conservation contributes significantly to food security in the area.
Natural hazard and protection against the consequences of earthquakes, land slides, rock falls and other hazards is important for the preservation of human lives, property and arable land.
Susceptibility to exogenous risks differs both in quantity and quality between the valley and plain engineering geological provinces. The following natural hazard potentials have been identified:• Slopes of the deep erosion valleys and mountain slopes with repeated rockslides of all sizes and
small to medium sized rockfalls. • Repeated rock falls along the upper rims of the deeply cut valley sides. • River flood plains have been included into risk susceptible units because of the possibility of
floods which can be very severe in arid areas. The observed lithological-structural changes in cuts of alluvial soils indicate the occurrence of catastrophic floods carrying substantially increased volumes of coarse materials in sub-historical times.
• Generally, the clay rich soils covering sedimentary rocks are prone to high plasticity and swelling when wet. That makes them rather problematic not only for building but also as material for earth roads especially during the rainy season.
• Soil erosion and protection has been addressed above so we can say that areas especially susceptible to erosion are medium energy relief in residual and colluvial soil units. An intensive deforestation in these areas will result in a further increase in the erosion susceptibility.
Susceptibility to endogenous risks has to be taken seriously also. Earthquakes are common in Ethiopia, but there is no enough information to assess the hazard potential of the Filtu area.
Waste water and solid waste management is important for environmentally sound development of the area. Appropriate management in this field protects not only the environment and soil and water resources but also human health against exposure to harmful pathogens and chemicals.
Recent practice is to release wastewater from households directly to the environment. Wastewater is discharged directly to rivers without appropriate treatment where it is mixed with surface water and is used for drinking by people living downstream from wastewater discharge. People use this polluted water from the river without any knowledge about the potential harm to their health. There is little chance to educate a large number of people about the possible adverse health impact of using polluted water and that is why the waste water producers have the responsibility to treat the water to remove substances harmful for human health.
Infiltration of polluted water to groundwater threatens the groundwater resources of the area. It is very well documented by the increasing content of nitrates in groundwater.
Solid waste management is not practiced in any of the sites visited within the area. Increasing environmental care and protection of natural resources will contribute to better living standards of the people living within the area and also to an increase in their working output leading to an increase in food security.
6.6 Touristic Potential of the AreaThe Filtu sheet has a low touristic potential because of the climate and remoteness of the area.
En
viro
nm
en
tal P
rob
lem
s a
nd
th
eir
Co
ntr
ol /
Ma
na
ge
me
nt
Tou
rist
ic P
ote
nti
al o
f th
e A
rea

97
Over the past 40 years natural disasters on the Ethiopian territory have increased both in frequency and intensity and have led to severe social impacts, particularly in the southeastern part of the country. Evidence has long suggested that disaster risk reduction has a high cost-benefit ratio. Disasters also divert a substantial amount of national resources from development to relief, recovery and reconstruction, depriving the poor of the resources needed to escape poverty. Disasters cannot be avoided but there are ways to reduce risks and to limit their impacts. The action comprises preparedness, mitigation and prevention. It aims to enhance resilience to disasters and is underpinned by knowledge on how to manage risk, build capacity, and make use of information and communication technology as well as earth observation tools. Ethiopia is prone to natural risks like landslides, rock falls, flooding and particularly drought as reflected in geological, historical as well as recent records. Two or three subsequent periods of intense drought can cause severe crop losses, famine and population displacement in the country. The country also faces an increased risk due to climate change and more extreme weather which can be accelerated particularly in the vulnerable semi-arid part of the country. The insufficient quality of drinking water, the natural risks and the overall degradation of the environment are all fundamental problems and contribute to an increase in the rate of migration to urban areas.
These explanatory notes to the hydrogeological and hydrochemical map of the Filtu area provide the results of the joint Czech Ethiopian projects. The mapping activity was carried out by field groups of hydrogeologists of the GSE in framework of the project “Groundwater Resources Assessment of the Southeastern Highlands and Associated Lowlands of Ethiopia” in 2010. The mapped area covers 18,394 km2 and is inhabited by 0.16 million people.
Groundwater accumulates in porous aquifers of alluvial and elluvial origin and in fissured and karst aquifers hosted in sedimentary (particularly limestone), volcanic rocks. Aquitards of the area consist of sandstone of the Amba Aradam and the Lower Kohare formations and limestones of the Mustahil formation. Aquicludes of the area consist of gypsum of the Upper Kohare formation.
There is a moderate potential for development of surface water for small-scale irrigation and electricity generation in the area because the Genale and Weyb rivers and several intermittent rivers drain groundwater of limestone and alluvial aquifers. It is necessary to consider that the groundwater level in the aquifers will fall to greater depths during periods with inadequate precipitation and river flow fed by groundwater will disappear during periods of drought in most of rivers of the area.
Groundwater is relatively of good quality and about 50 % of the groundwater resources can be directly used for drinking, industrial as well as agricultural purposes. Groundwater should be primarily used for drinking water supply; it should be also used for irrigation should there be clear evidence that pumping for irrigation does not lead to over pumping of the aquifer, undermining
ConclusionsConclusions
98
of groundwater resources and causing degradation of the aquifer. Should the aquifer be used for irrigation, monitoring wells are recommended to be drilled together with the production wells for systematic observation of changes in groundwater levels, quality of pumped water and optimization of the pumping system.
Local pollution of groundwater by nitrates is common in rural as well as in urban areas. In the case of developed springs their surroundings should be protected against pollution because most of the springs have shallow groundwater circulation and human as well as animal waste (problem of watering animals directly from the spring) can easily and quickly penetrate the groundwater resources. This is also a problem in karst aquifers which are highly vulnerable to pollution because of their high permeability. The spring should be developed by a solid concrete box and it is preferable that the water will flow from the spring by a tube and distributed to people 10–20 m from the spring (lower position of water distribution point). The area of the protection box should be protected against the entry of people and animals; in particular animals should be completely prevented entry.
It is advisable to use geophysical investigation to select locations where the regolith is thick and sedimentary rocks are deeply fractured, weathered and soft for siting wells. Groundwater can be totally missing where the regional groundwater body is deep and its level is controlled by the level of surface water or the level of principal springs representing the regional drainage of the area.
The water distribution well should preferably be equipped with a system minimizing discharge of water when it is filled into containers. In the case that water is used for animal watering it should be transported by a tube and distributed to the animals about 20–30 m from the well (lower position of water distribution point – cattle bin). The area of the well head should be protected against accumulation of surface water by drainage ditches and the entrance of animals to the well’s surroundings should be completely eliminated.
The proposed development should take into consideration the protection and conservation of the vulnerable natural resources of the area with arid climate. Particular interest should be paid to soil conservation and groundwater protection using the appropriate agricultural methods to decrease soil erosion and to the implementation of water resource protection to protect groundwater against pollution and over pumping, particularly in rural and urban settlements where pollution by nitrates is increasing. Monitoring of environmental components, particularly surface water flow and sediment load, in gauging stations in the lower reaches of the river should be enhanced. Recent inappropriate wastewater and waste management has to be considerably improved.
Despite some local and regional environmental problems the Filtu area provides the potential for feasible and environmentally sound natural and human resource management.

99
Agrotec-C.R.G.-S.E.D.E.S. Ass. (1974): Report on The Sothern Rangelands Livestock Development Project.
BEICIP (1985): Petroleum potential of Ethiopia. Confidential report of Ministry of Mines and Energy, Addis Ababa.
Bogena, H.; Kunkel, R.; Schrobel, T.; Schrey, H.P.; Wendland, F. (2005): Distributed modeling of groundwater recharge at the macroscale, Ecological Modeling 187, 2005, 15-26.
Bosellini, A. (1989): The continental margins of Somalia: their structural evolution and sequence stratigraphy. Memorie di Scienze Geologische, Padova 41: 373–458.
Brooks, Nick (draft, 2005): Cultural responses to aridity in the Middle Holocene and increased social complexity, Quaternary International, April 2005.
Central Statistics Authority (2007): Statistical abstract.
COOPI (1999): Geological-Hydrogeological report about Dolo-Odo and Dolo-Bay district.
COOPI (2002): Emergency program to assist vulnerable people in Liben zone- Somali regional state, Borena zone- Oromia regional state.
Cox, K.G. (1970): Tectonics and volcanism of the Karoo period and their bearing on the postulated fragmentation of Gondwana. In: T.N. Clifford and I.G. Gass (editors), African magmatism and tectonics. Oliver and Boyd, Edinburgh, pp. 211-235.
Daniel, Gamatchu (1977): Aspects and Water budget in Ethiopia, AA University Press, Addis Ababa.
Dingle, R.V.; Klinger, H.C. (1971): Significance of Upper Jurassic sediments in the Knysna outlier (Cape province) for timing of breakup of Gondwanaland. Nature, Physical sciences, pp. 232-237.
Dow, D.B.; Beyth, M.; Hailu, T. (1971): Paleozoic rocks recently discovered in Northern Ethiopia. Geological Magazine 108: 53–59.
EIGS (1999): Hydrogeological study and water well siting in the selected zones of Somali region. Geological Survey of Ethiopia. Addis Ababa.
Gani, N.DS.; Abdelsealm, M.; Gera, S.; Gani, M.R. (2008). Stratigraphic and structural evolution of Blue Nile Basin, North Western Ethiopia. Geological Journal.
Gozálbez, Javier; Cebrián, Dulce (2006): Touching Ethiopia 2nd English edition, 2006, Shama Publisher.
HSDP (2008): Ministry of Health (MOH) [Ethiopia]. 2008. The Health Sector Strategic Plan (HSDP). Addis Ababa, Ethiopia: Ministry of Health.
http://www.moh.gov.et
Hunt Oil Company (1993): Water supply study.
Kazmin, V. (1972): Geological Map of Ethiopia. Geological Survey of Ethiopia: Addis Ababa, Ethiopia.
Kazmin, V.; Seifemichael, Berhe (1978): Geological map of Nazreth Sheet, Scale 1:250,000, Geological Survey of Ethiopia, Addis Ababa.
ReferencesReferences
100
Koeppen in NMSA (1989): Climatic and Agroclimatic Resources of Ethiopia, NMSA, AA, August 1989.
Lahmeyer International (2005): Genale-Dawa river basin integrated resource development master plan study. Ministry of Water Resources.
Linsley, R.K.; Kohler, M.A.; Paulhus, J.L.H.; Wallace, J.S. (1958): Hydrology for engineers. McGraw Hill, New York.
Mohr, Paul (1962): The Geology of Ethiopia. Addis Ababa University Press, Addis Ababa, Ethiopia: 268.
MoWR (2002): Negarit Gazeta No. 12/1990 and The Guidelines of Ministry of Water Resources.
NMA (2006): Annual Climatic Bulletin 2006, Federal Democratic Republic of Ethiopia, Ministry of Water Resources, National Meteorological Agency (NMA) Climatolocical Service Team.
NMSA (1996): Assessment of Drought in Ethiopia, Meteorological Research Reports Series No. 2, Addis Ababa, Ethiopia.
RRC (1985): The Challenges of Drought, Ethiopia’s decade of struggle in relief and rehabilitation, RRC, Addis Ababa, 280p.
Setegn, S.G. (2010): Modeling Hydrological and Hy-drodynamic Processes in Lake Tana Basin, Ethiopia, KTH. TRITA-LWR PhD Thesis 1057.
Sima, Jiri et al. (2009): Water Resources Management and Environmental Protection Studies of the Jemma River Basin for Improved Food Security. ISBN 978-80-254-5021-5. AQUATEST a.s., Prague, Czech Rep.
Tadese, Yihunie; Melaku, Tesfaye (1997): Geological map of Negele sheet 1:250,000. GSE, Addis Ababa.
Tesfay, Tafese (2001): Nile question: Hydropolitics, Legal Wrangling, Modus Vivendi and Perspectives.
Tesfaye, Chernet (1993): Hydrogeology of Ethiopia and Water Resources Development – MS EIGS, Ministry of Mines and energy, Addis Ababa (Library 880-051-17).
Tsur; Issar (1998): Custodio E, Gurgui A. Groundwater economics Developments in Water Science 39, Elsevier p. 373–379.
WHO (2006): World Health Statistics, http://www.who.int/countries/eth/eth/en/
WWDST (2003): Wabe Shebelle River Basin Integrated Development Master Plan Study, MWR, Addis Ababa.