Embed Size (px)
Citation preview
Hydrogeologic and Water-Quality Data for the Main Site, Naval Surface Warfare Center, Dahlgren Laboratory, Dahlgren, Virginia
By Clifton R Bell, Thomas P. Bolles, and George E. Harlow, Jr.
U.S. GEOLOGICAL SURVEY
Open-File Report 94-301
Prepared in cooperation with the
ENVIRONMENTAL DIVISION
NAVAL SURFACE WARFARE CENTER,
DAHLGREN LABORATORY
Richmond, Virginia
1994
U.S. DEPARTMENT OF THE INTERIOR BRUCE BABBITT, Secretary
U.S. GEOLOGICAL SURVEY GORDON P. EATON, Director
Any use of trade or product names in this report is for identification purposes only, and does not constitute endorsement by the U.S. Geological Survey, nor impute responsibility for any existing or potential resources.
UNITED STATES GOVERNMENT PRINTING OFFICE: 1994
Copies of this report can be purchased from:U.S. Geological Survey Earth Science Information Center Open-File Reports Section Box25286, MS 517 Denver Federal Center Denver, CO 80225
For additional information write to:District Chief U.S. Geological Survey 3600 West Broad Street Room 606 Richmond, VA 23230
CONTENTS
Abstract ........................................................................................... 1Introduction ........................................................................................ 1
Purpose and scope ............................................................................. 3Description of study area ....................................................................... 3Previous investigations ......................................................................... 3Acknowledgments ............................................................................. 4
Description of observation-well network ................................................................. 4Well construction .............................................................................. 4Location and numbering system of wells ........................................................... 4
Hydrogeologic data .................................................................................. 4Lithologic and geophysical logs .................................................................. 4Shelby tubes ................................................................................. 5Hydrologic data ............................................................................... 5
Ground-water levels................................................................. 5Tides............................................................................. 5Aquifer tests....................................................................... 5
Water-quality data .................................................................................... 6Location and methods of field sampling ............................................................ 6Methods of laboratory analysis ................................................................... 7
Data management.................................................................................... 7References cited..................................................................................... 7
PLATE
1. Map showing locations of observation wells, tide gage, and surface-water sampling sites in study area In pocket
FIGURES
1. Map showing location of study area at the Naval Surface Warfare Center, Dahlgren Laboratory,Dahlgren, Virginia.............................................................................. 2
2. Schematic diagram of standard construction of wells completed in (A) confined aquifer and(fi) unconfined aquifer ......................................................................... 66
3. Graphs showing natural gamma logs of wells in the Columbia aquifer .................................... 674-6. Graphs showing selected geophysical logs of well:
4. Dl ...................................................................................... 725. D2 ...................................................................................... 736. D3 ...................................................................................... 74
7-18. Hydrographs showing water levels for well:7. Dl ...................................................................................... 758. D2 ...................................................................................... 759. D3 ...................................................................................... 76
10. Ml...................................................................................... 7611. M2...................................................................................... 7712. M3...................................................................................... 7713. 4........................................................................................ 7814. 10....................................................................................... 78
Contents III
FIGURES Continued
7-18. Hydrographs showing water levels for well: continued15. 11....................................................................................... 7916. 19....................................................................................... 7917. 24....................................................................................... 8018. 30....................................................................................... 80
19. Hydrograph showing daily maximum and minimum stage from tide gage in Upper Machodoc Creek............ 81
TABLES
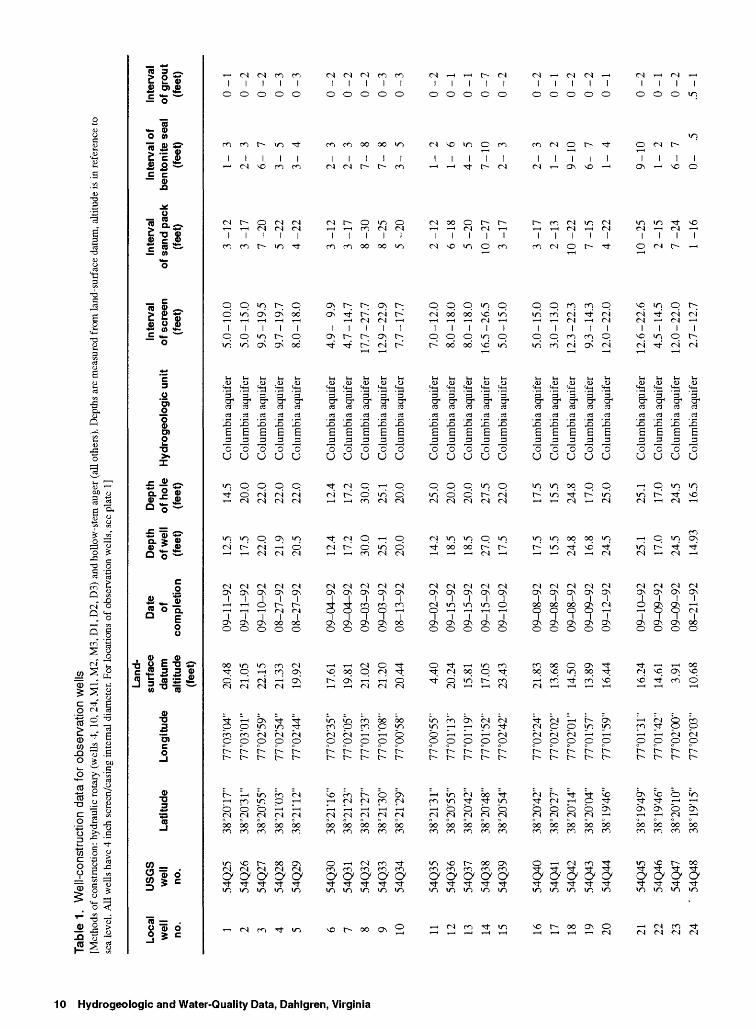
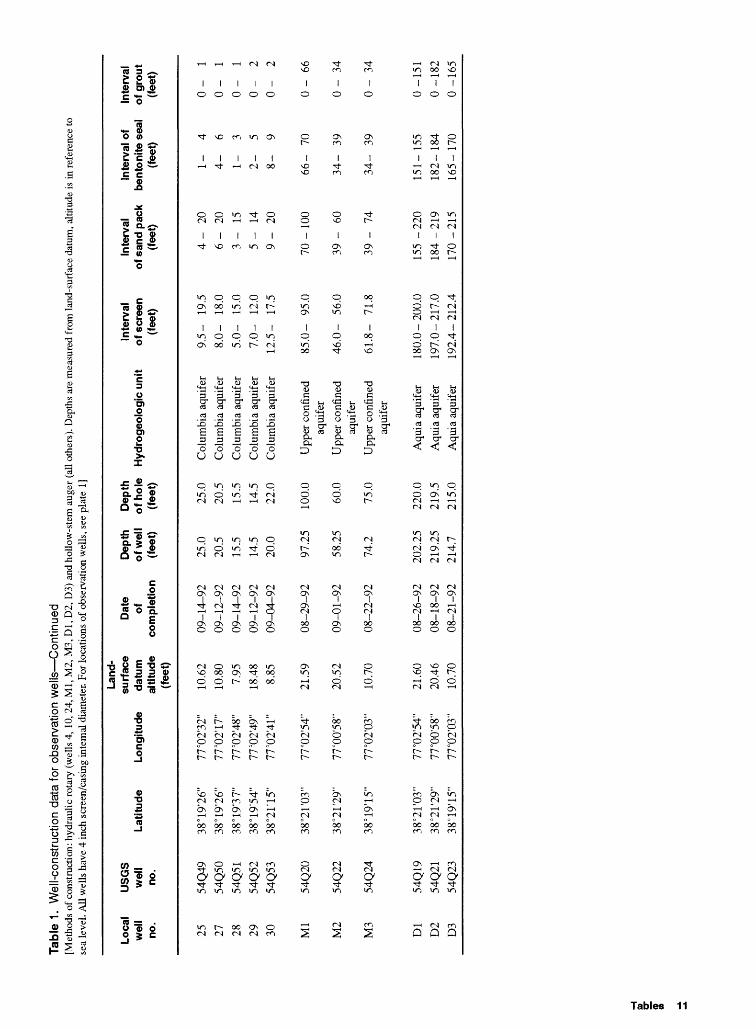
1. Well construction data for observation wells ......................................................... 102. Lithologic logs of observation wells ............................................................... 123. Depth, lithology, and vertical hydraulic conductivity measurement of selected core intervals................... 344. Relative percentage abundance of minerals in selected core intervals...................................... 355. Periodic measurements of ground-water levels at the Main Site, Naval Surface Warfare Center,
Dahlgren Laboratory, October 1992 through September 1993 ........................................... 366. Slug-test data for observation wells ................................................................ 427. Reporting units and limits for selected water-quality constituents......................................... 608. Concentrations of major dissolved constituents in surface water from the Main Site, Naval Surface
Warfare Center, Dahlgren Laboratory .............................................................. 619. Concentrations of major dissolved constituents in ground water from the Main Site, Naval Surface
Warfare Center, Dahlgren Laboratory .............................................................. 6210. Hydrogen and oxygen stable isotope ratios in ground water and surface water from the Main Site,
Naval Surface Warfare Center, Dahlgren Laboratory .................................................. 64
CONVERSION FACTORS, VERTICAL DATUM, AND ABBREVIATED WATER-QUALITY UNITS
Multiply By To obtain
foot (ft) 0.3048 meterinch (in.) 25.4 millimeter (mm)
25,4000 micron (u.)square mile (mi2) 2.590 square kilometer
mile (mi) 1.609 kilometergallon (gal) 3,785 milliliter (mL)
Water temperature is expressed in degrees Celsius (°C), which can he converted to degrees Fahrenheit (°F) by the following equation:°F= 18(°C) + 32
Sea level: In this report "sea level" refers to the National Geodetic Vertical Datum of 1929-a geodetic datum derived from a general adjustment of the first-order level nets of the United States and Canada, formerly called Sea Level Datum of 1929.
Abbreviated water-quality units: Chemical concentration and specific electrical conductance in this report are expressed in metric units. Chemical concentration is expressed in milligrams per liter (mg/L) or in mocrograms per liter (|J.g/L). Specific electrical conductance of water is expressed in microsiemens per centimeter at 25 degrees Celsius (u,S/cm). Values of the stable isotope ratios of hydrogen and oxygen (8D and 5 18O) refer to the relative difference between the ratios 2H/] H and 18O/16O, respectively, in the sample and the ratios in standard mean ocean water.
IV Contents
Hydrogeologic and Water-Quality Data for the Main Site, Naval Surface Warfare Center, Dahlgren Laboratory, Dahlgren, Virginia
By Clifton F. Bell, Thomas P. Bolles, and George E. Harlow, Jr.
Abstract
Hydrogeologic and water-quality data were collected at the Naval Surface Warfare Center, Dahlgren Laboratory at Dahlgren, Virginia, as part of a hydrogeologic assessment of the shallow aquifer system begun in 1992. The U.S. Geological Survey conducted this study to provide the Navy with hydrogeologic data to meet the requirements of a Spill Contingency Plan. This report describes the ground-water observation-well network, hydro- geologic, and water-quality data collected between August 1992 and September 1993. The report includes a description of the locations and con struction of 35 observation wells on the Main Site. Hydrogeologic data include lithologic logs, geo physical logs, and vertical hydraulic conductivity measurements of selected core intervals. Hydrologic data include synoptic and hourly measurements of ground-water levels, observation-well slug tests to determine horizontal hydraulic conductivity, and tide data. Water-quality data include analyses of major dissolved constituents in ground water and surface water.
INTRODUCTION
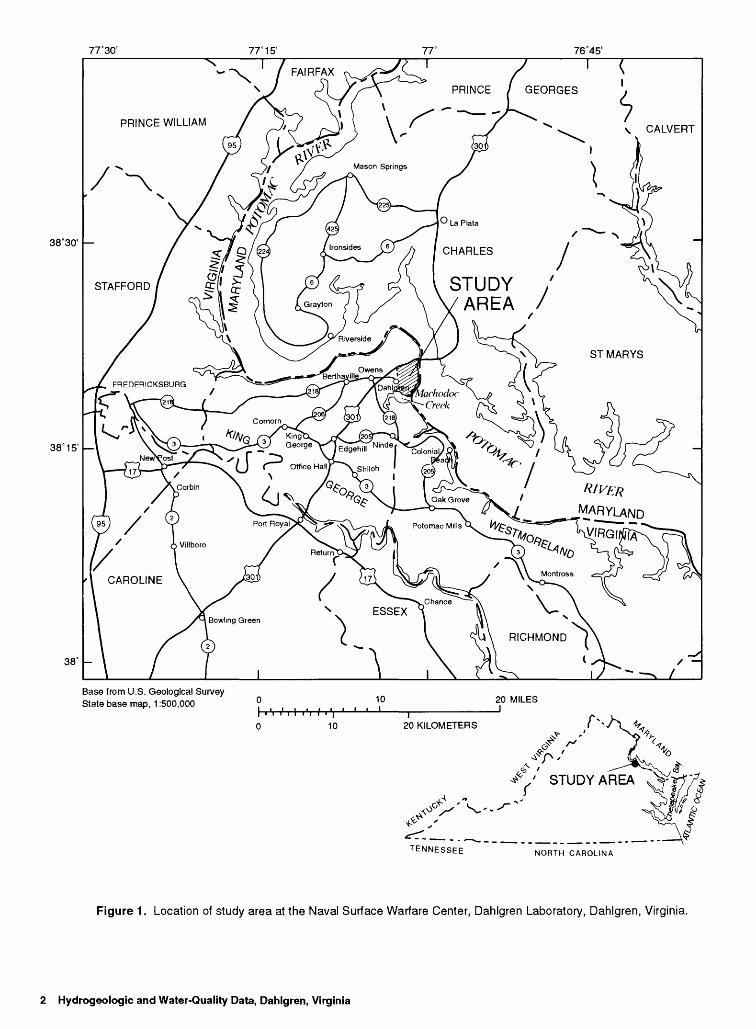
The Naval Surface Warfare Center, Dahlgren Laboratory (NSWCDL) at Dahlgren, Va., was established in 1918 as a proving ground for naval ordnance (fig. 1). At present (1994), the NSWCDL
is also involved in the development and application of computer models to naval warfare, missile flight, and artificial satellite motion. Various activities conducted at the NSWCDL have had the potential to contaminate ground water, soil, and (or) surface water. There are nine locations on the Main Site that have been identified by the Installation Restoration Program (IRP) as contaminated or potentially con taminated by different materials, including pesti cides, PCB's, heavy metals, and several chemical and municipal wastes (Halliburton NUS, 1992). The U.S. Environmental Protection Agency placed the Main Site on the National Priority List in February 1992.
The Commonwealth of Virginia requires a Spill Contingency Plan for sites having hydrocarbon storage tanks. Sites that contain storage tanks with a capacity of more than 1 million gallons require a ground-water assessment to provide information on migration pathways from a potential hydrocarbon release. At the time this study was initiated (1992), the NSWCDL had hydrocarbon storage tanks with a combined capacity of more than 1 million gallons.
In 1992, the U. S. Geological Survey (USGS), in cooperation with the NSWCDL, began an investigation of the shallow aquifer system under lying the Main Site of the installation. The USGS conducted this study to provide the Navy with information to meet the requirements of a Spill Contingency Plan. The study was designed to provide basic hydrogeologic and water-quality data describing the natural properties and characteristics
Introduction 1
77°30' 77° 15' 77° 76°45'
38°30'
38° 15'
38°
CALVERT
° La Plata
CHARLES
STUDY
Base from U.S. Geological Survey State base map, 1:500,000 10 20 MILES
10I
20 KILOMETERS
NORTH CAROLINA
Figure 1. Location of study area at the Naval Surface Warfare Center, Dahlgren Laboratory, Dahlgren, Virginia.
2 Hydrogeologic and Water-Quality Data, Dahlgren, Virginia
of the shallow aquifer system. The results of this study will also be used for the ongoing National Priority List (NPL) studies at the NSWCDL.
Purpose and Scope
The purpose of this report is to present hydro- geologic and general water-quality data collected at the Main Site of the NSWCDL, Dahlgren, Va., between August 1992 and September 1993. The report includes (1) descriptions of the observation- well network, (2) hydrogeologic data, and (3) water- quality data. Most of the hydrogeologic and water- quality data are presented in figures and tables.
Thirty-five observation wells were installed at 29 locations on the Main Site of the NSWCDL. Hydrogeologic data includes lithologic logs and geophysical logs obtained from the 35 observation wells, and mineralogic characteristics and vertical conductivity data from laboratory analysis of selected core intervals. Data are presented from slug tests of 27 water-table wells to estimate horizontal hydraulic conductivity. Hydrologic data include synoptic water-level measurements in wells and hourly water-level measurements from analog-to- digital recorders (ADR's) installed on 11 wells and on a tide-gaging station. Water samples from all 35 observation wells and from 3 surface-water sampling sites were collected and analyzed for selected water- quality constituents and selected isotopes to establish background water-quality conditions.
Description of Study Area
The NSWCDL is located in King George County, Va., and is bounded on the east by the Potomac River (fig. 1). Upper Machodoc Creek divides the installation into two areas: The Main Site to the north, which is approximately 2,678 acres (pi. 1), and the Explosive Experimental Area to the south, which is approximately 1,614 acres. Other surface-water bodies present on the NSWCDL include Gambo Creek and Williams Creek, both of which flow in a north-south direction on the Main Site, and three fresh-water impoundments. The topography is generally flat, with a maximum relief
of about 20 ft over most of the site. The land use on the installation is forest, open field, marsh, a small air field with landing strips, residential military housing, and military operations facilities.
Unconsolidated sedimentary deposits of the Atlantic Coastal Plain underlie the NSWCDL. These deposits consist of tabular bodies of interbedded sand, silt, and clay, and range in age from Cretaceous to Quaternary. Pleistocene deposits of the Poquoson, Lynnhaven, and Sedgefield members of the Tabb formation crop out at the surface of the installation (Mixon and others, 1989). In many locations on the Main Site, the surficial material is fill.
The shallow aquifer system underlying the NSWCDL, as defined in this report, consists of the unconfined Columbia aquifer and two confined aquifers. The Columbia aquifer is underlain by the upper confining unit, which overlies the upper confined aquifer. The upper confined aquifer is underlain by the Nanjemoy-Marlboro confining unit (unpublished data on file in the Virginia District office of the U.S. Geological Survey), which overlies the Aquia aquifer (Meng and Harsh, 1988).
Previous Investigations
An Initial Assessment Study (IAS) was performed at the NSWCDL in 1981 (Fred C. Hart Associates, 1983), which identified 29 potentially contaminated sites on the Main Site. The IAS recommended that 7 of the 29 sites be investigated under the Navy Assessment and Control of Installation Pollutants program. No wells were installed for the IAS. Confirmation studies con ducted at five of the seven sites and at one additional site during 1983 and 1984 found evidence of envi ronmental contamination. The confirmation studies included the installation of 20 shallow (10- to 25-ft total depth below land surface) monitoring wells at five of the sites (O'Brien and Gere, 1986). The Navy later concluded that nine sites on the Main Site warranted additional study. An IRP Remedial Investigation/Feasibility Study for these nine sites was proposed (Halliburton NUS, 1992) and began in December 1993.
Introduction 3
Acknowledgments Location and Numbering System of Wells
The authors wish to thank Ann Swope, Billie Weedon, and other members of the Environmental Division, NSWCDL for providing invaluable assist ance in project planning and implementation. The U.S. Army Corps of Engineers (COE) completed the drilling operations at the Main Site in a safe and efficient manner under the supervision of Charles Brown.
DESCRIPTION OF OBSERVATION-WELL NETWORK
The observation well locations at the Main Site were selected to obtain maximum areal coverage of the study area, to have drill sites accessible by drilling equipment, and to avoid areas of known or suspected contamination. Observation well locations are shown on plate 1.
Well Construction
All 35 observation wells installed at the NSWCDL for the hydrogeologic assessment were constructed of 4-in. inside-diameter polyvinyl chloride (PVC) casing. Twenty-nine wells were installed in the Columbia aquifer, of which 27 wells were augered and 2 wells (wells 4 and 10) were drilled by hydraulic rotary method. Three wells were installed in the upper confined aquifer and three wells were installed in the Aquia aquifer by hydraulic rotary methods. In order to avoid possible contamination of the confined aquifers from the Columbia aquifer, 10-in. inside-diameter PVC casing was set and grouted into the upper confining unit before drilling continued through this casing. Wells in the Columbia aquifer were constructed with either 5- or 10-ft screens, wells in the upper confined aquifer were constructed with 10-ft screens, and wells in the Aquia aquifer were constructed with 20-ft screens. A schematic diagram showing the standard well construction is shown in figure 2, and details on the construction of individual wells are presented in table 1.
The 29 observation wells in the Columbia aquifer are each identified with a local number (1 to 30) and a unique USGS identifier. A well was not completed at the site proposed for well 26. The three wells in the upper confined aquifer are identified by a local number preceded by the letter "M" (Ml, M2, and M3), and the three wells in the Aquia aquifer are identified by a local number preceded by the letter "D" (Dl, D2, and D3). The locations of these wells on the installation are shown on plate 1.
A unique USGS identifier was assigned to each well for the purpose of storing well information in the Ground Water Site Inventory data base main tained by the USGS. These USGS identifiers are based on the Virginia coordinate grid number of the USGS standard series 7.5-minute topographic quadrangle in which the well is located, and the chronological order in which the well was installed. For example, the USGS number 54Q 22 corresponds to the 22d well installed by the USGS in the area covered by the Dahlgren quadrangle, which has a Virginia coordinate grid number of 54Q.
The latitudes and longitudes of observation wells were determined by a Magellan (NAV 5000 PRO) portable Global Positioning System receiver, and checked on the topographic map. Elevation of land surface and measuring point was leveled in by the USGS to an accuracy of 0.01 ft
HYDROGEOLOGIC DATA
This section describes lithologic and geo physical logs for observation wells, mineralogic and vertical conductivity data from laboratory analysis of 35 Shelby tube samples, and hydrologic data from water-level measurements and aquifer tests.
Lithologic and Geophysical Logs
Lithologic samples were recovered with split-spoon samplers and logged during drilling operations at all 35 wells. Recorded characteristics include grain size according to the Wentworth scale
4 Hydrogeologic and Water-Quality Data, Dahlgren, Virginia
(Leeder, 1982); color; sedimentary structures; degree of moistness; and presence of features, such as organic material, shell material, indurated material, glauconite, or mica. In some intervals, no represent ative material could be recovered. Field descriptions of the lithologic samples are listed in table 2.
Geophysical logs were recorded at 28 of the 29 drill sites (figs. 3-6). The logging operation consisted of lowering a probe to the bottom of the borehole and recording the response as the probe was raised. Natural gamma logs were run at 25 of the 29 wells in the Columbia aquifer, and at all 3 wells in the Aquia aquifer. Spontaneous potential, single- point resistance, 16-in. normal resistivity, and 64-in. normal resistivity logs also were run at the three wells in the Aquia aquifer. Several of the electric logs were apparently affected by nearby power lines and thus are not presented in this report.
Shelby Tubes
Thirty-five Shelby tube core samples from 23 well sites were analyzed by the U.S. Army COE, Ohio River Division Laboratory, Cincinnati, Ohio, to provide measurements of vertical hydraulic con ductivity (table 3), and descriptions of mineralogy (table 4). Vertical conductivity was measured by a falling-head permeameter test. Mineralogy was determined by visual inspection and x-ray diffrac tion. The core intervals sampled were chosen to characterize vertical and areal variations in lithology found in the study area.
Hydrologic Data
Water levels in wells were monitored by collecting synoptic and hourly measurements to determine the response of ground-water levels to precipitation, tidal influence, and evapotranspira- tion. Tidal fluctuations also were monitored. Precipitation data, not shown in this report, was collected by the NSWCDL.
Ground-Water Levels
Twelve synoptic water-level measurements were recorded at each of the 35 wells installed for
the study (table 5). Measuring points were estab lished for each well on the top of the casing; the elevations of these were surveyed by the USGS from a first-order bench mark to an accuracy of 0.01 ft. Water-levels in wells were measured to an accuracy of 0.01 ft by chalked steel tape. These measurements were then subtracted from the elevation of the measuring point to obtain the elevation of the water level.
In addition to the synoptic surveys, ADR's were installed on 11 wells (Dl, D2, D3, Ml, M2, M3, 4, 10, 11, 19, and 24) to provide periodic monitoring of water levels in those wells. The ADR's on these wells record measurements every hour. These water-level data assist in the evaluation of seasonal and short-term variations in water levels, and allow comparison of the response of water levels in wells screened in different aquifers to tidal influ ences, precipitation events, and other hydrologic variables. Water-level data from ADR's are pre sented in hydrographs, showing minimum daily water levels (relative to sea level) (figs. 7-18) from August 1992 through September 1993.
Tides
A tide gage with an ADR was installed on Upper Machodoc Creek (pi. 1) to record the stage. Tidal fluctuations were recorded at 5-minute intervals. Tide-gage data from August 1992 through September 1993 are presented in figure 19.
Aquifer Tests
Slug tests, by the volume-displacement method, were conducted on all 35 wells to determine horizontal hydraulic conductivity. An In-Situ Hermit (1000B) data logger and pressure transducer were used to record water-level recovery. Prior to the introduction of the slug, the water level was moni tored for 10 minutes so that any rising or falling background trend could be subtracted from the recovery plot. A sand-filled PVC cylinder of known volume was rapidly lowered into the well, causing a temporary rise in the water level, and the data logger recorded the water level over time as it returned to equilibrium. Instantaneous water levels were
Description of Observation-Well Network 5
recorded at intervals that varied from every 0.2 seconds at the beginning of the test to every 30 seconds at the end of the test (table 6). An additional slug test was performed on some wells by recording the recovery of the water level after removal of the slug from the well.
WATER-QUALITY DATA
The concentrations of selected chemical constituents were measured in ground-water and surface-water samples from the NSWCDL. This water-quality data can be used to assess background geochemistry of ground water and surface water at the NSWCDL. Reporting limits for all water-quality constituents are given in table 7. Chemical analyses of surface-water and ground-water samples are listed in tables 8 and 9. Isotopic analyses for both ground- water and surface-water samples are listed table 10.
Location and Methods of Field Sampling
Water-quality samples were collected from all 35 observation wells and 3 surface-water sites in Gambo Creek (pi. 1) in May 1993. Ground-water samples were collected using a stainless steel sub mersible pump with a Teflon discharge line. Depth- width-integrated surface-water samples were collected with a weighted-bottle sampler. Prior to collecting water-quality samples, all equipment was cleaned thoroughly with laboratory detergent, and rinsed with tap and distilled water. The outside of the pump and Teflon tubing were rinsed with distilled water between wells, and the entire system was flushed with distilled water after each day of sampling. Each well was purged of at least three well volumes of water prior to sampling, unless the well went dry in which case the water level was allowed to recover prior to sampling.
Field parameters measured include pH, temperature, dissolved oxygen (DO), specific conductance, and alkalinity. DO and temperature were measured in ground water and surface water using a YSI (model 54A) dissolved oxygen meter
with cable and submersible stirrer. Specific conductance and pH were measured on unfiltered water samples using an Orion (model 122) specific conductance meter with glass conductivity cell and Orion (SA 250) pH meter with gel-filled pH electrode, respectively. The pH meters were calibrated each day using two solutions of known pH values (usually pH 4 and 7). The calibration of the specific conductance meter was checked each day using three solutions of known conductance. Alkalinities were determined by incremental titration of 100-mL filtered water samples with sulfuric acid.
Water-quality samples collected for dissolved inorganic constituent analyses were placed in pre- cleaned bottles and filtered immediately after collection to minimize oxidation of any unstable and chemically reduced solutes. The filtering was accomplished using a peristaltic pump and a 142- mm-diameter filter-plate assembly with 0.45-|im pore-size filter membrane. The filter membranes were flushed with 200 mL of American Society of Testing and Materials Type II water before filtration of the sample. Water-quality samples for major cations and metals were acidified to pH 2 with concentrated nitric acid. Water-quality samples for isotopic analyses were unfiltered, poured slowly into bottles, and the bottle cap was tightened and secured with adhesive tape. All water-quality samples were placed in sealed plastic bags, chilled with ice, and shipped to the laboratories overnight in high-impact plastic ice chests.
Quality-control samples included duplicate samples, an equipment blank, and a distilled water blank. Duplicate samples were collected at approxi mately 10 percent of the sampling sites, including one duplicate surface-water sample, to determine the reproducibility of water-quality data. Results of analyses of duplicate samples are presented in tables 8, 9, and 10 with results from the other samples. A distilled water blank and an equipment blank of distilled water were passed through the pump and tubing to determine the cleanliness of equipment and sample-collection procedures.
6 Hydrogeologic and Water-Quality Data, Dahlgren, Virginia
Methods of Laboratory Analysis REFERENCES CITED
All water-quality samples were sent to the USGS National Water Quality Laboratory in Arvada, Colo., for determination of inorganic constituents and organic carbon. Metals and major cations were determined using inductively coupled argon plasma. Chloride and fluoride were determined by a colori- metric method, and sulfate was determined by a turbidimetric method. Total dissolved solids were measured as residue-on-evaporation at 180°C. The analytical methods are described in Fishman and Friedman (1989) and Wershaw and others (1987). Laboratory quality-assurance procedures are described in Friedman and Erdmann (1982) and Jones (1987). Samples also were sent to the USGS Stable Isotope Laboratory in Reston, Va., for deter mination of hydrogen and oxygen isotopic ratios by mass spectrometry.
DATA MANAGEMENT
Data produced by field activities were recorded in bound notebooks and validated by the field personnel and a reviewer. Well-construction data and synoptic water-level measurements were entered into the USGS Ground-Water Site Inventory file, a ground-water data storage and retrieval system that is part of the USGS National Water Information System (NWIS). Ground-water-level and tide-gage data were entered into the USGS Automated Data Processing System (ADAPS), which also is part of NWIS. ADAPS consists of a collection of computer programs and files designed to provide a comprehensive system of up-to-date standardized water data processing procedures. All water-quality data from the USGS National Water Quality Laboratory were reviewed and verified by laboratory and project personnel, and entered into the USGS Quality of Water Data Base, which is part of NWIS. The original field notebooks and hard copies of all well-construction, water-level, and water-quality data are stored at the USGS, Virginia District office, Richmond, Va.
Halliburton NUS, 1992, Remedial Investigation/Feasibility Study Part A: Work plan for the Naval Surface Warfare Center/Dahlgren Laboratory, Dahlgren, Virginia: Chesapeake Division Naval Facilities Engineering Command, contract no. N62472-90-D-1298, contract task order 0017, 205 p.
Fishman, M.J., and Friedman, L.C., 1989, Methods for the determination of inorganic substances in water and fluvial sediments (3d ed.): U. S. Geological Survey Techniques of Water-Resources Investigations, book 5, chap. Al, 545 p.
Friedman, L.C., and Erdmann, D.E., 1982, Quality assurance practices for the chemical and biological analyses of water and fluvial sediments: U. S. Geological Survey Techniques of Water-Resources Investigations, book 5, chap. A6,181 p.
Fred C. Hart Associates, 1983, Initial Assessment Study of Naval Surface Weapons Center/Dahlgren Laboratory: Naval Energy and Environmental Support Activity, contract no. N62474-81-C-9384,68p.
Jones, B.E., 1987, Quality control manual of the U. S.Geological Survey's National Water Quality Laboratory: U.S. Geological Survey Open-File Report 87-451, 17 p.
Leeder, M.R., 1982, Sedimentology: George Alien and Unwin Ltd., London, UK, 344 p.
Mixon, R.B., Berquist, C.R. Jr., Newell, W.L., and Johnson, G.H., 1989, Geologic map and generalized cross sections of the Coastal Plain and adjacent parts of the Piedmont, Virginia:
U. S. Geological Survey Miscellaneous Investigations Series, Map 1-2033, 2 sheets.
Meng, A.A., III, and Harsh, J.F., 1988, Hydrogeologicframework of the Virginia Coastal Plain: U. S. Geological Survey Professional Paper 1404-C, 82 p.
Munsell Color, 1975, Munsell color charts: Macbeth, a division of Kollmorgen Instruments Corporation, Baltimore, Md., 21 p.
O'Brien and Gere Engineers, Inc., 1986, Confirmation Studies at Naval Surface Weapons Center, Dahlgren, Virginia: Chesapeake Division Naval Facilities Engineering Command, contract no. Pll N62477-83-C-0113, 141 p.
Wershaw, R.L., Fishman, M.J., Grabbe, R.R., and Lowe, L.E., eds., 1987, Methods for the determination of organic substances in water and fluvial sediments: U. S. Geological Survey Techniques of Water-Resources Investigations, book 5, chap. A3, 80 p.
References Cited 7

TABLES
Hydrogeologic and
Water-Q c 2L 3 f
O a; ! 5. 5'
Tabl
e 1.
Wel
l-con
stru
ctio
n da
ta fc
[Met
hods
of
cons
truc
tion:
hyd
raul
ic r
otar
} se
a le
vel.
All
wel
ls h
ave
4 in
ch s
cree
n/ca
s
Loc
al
wel
l no
. 1 2 3 4 5 6 7 8 9 10 11 12 13 14 15 16 17 18 19 20 21 22 23 24
uses
wel
l no
.
54Q
25
54Q
26
54Q
27
54Q
28
54Q
29
54Q
30
54Q
31
54Q
32
54Q
33
54Q
34
54Q
35
54Q
36
54Q
37
54Q
38
54Q
39
54Q
40
54Q
41
54Q
42
54Q
43
54Q
44
54Q
45
54Q
46
54Q
47
' 54
Q48
Lat
itud
e
38°2
0'17
"
38°2
0'31
"
38°2
0'55
"
38°2
1'03
"
38°2
1'12
"
38°2
1'16
"
38°2
1'23
"
38°2
1'27
"
38°2
1'30
"
38°2
1'29
"
38°2
1'31
"
38°2
0'55
"
38°2
0'42
"
38°2
0'48
"
38°2
0'54
"
38°2
0'42
"
38°2
0'27
"
38°2
0'14
"
38°2
0'04
"
38°1
9'46
"
38°1
9'49
"
38°1
9'46
"
38°2
0'10
"
38°1
9'15
"
)r ob
serv
atio
n! (
wel
ls 4
, 10
, 24
wel
ls. M
l. M
2. M
3. D
l. D
2. D
3^>
anin
g in
tern
al d
iam
eter
. Fo
r loc
atio
ns o
f ob
serv
ati
Lon
gitu
de
77°0
3'04
"
77°0
3'01
"
77°0
2'59
"
77°0
2'54
"
77°0
2'44
"
77°0
2'35
"
77°0
2'05
"
77°0
1'33
"
77 "0
1 '0
8"
77W
58"
77W
55"
77°0
1'13
"
77°0
1'19
"
77°0
1'52
"
77°0
2'42
"
77°0
2'24
"
77°0
2'02
"
77°0
2'01
"
77°0
1'57
"
77°0
1'59
"
77°0
1'31
"
77°0
1'42
"
77°0
2'00
"
77°0
2'03
"
Lan
d-
surf
ace
datu
m
alti
tude
(f
eet)
20.4
8
21.0
5
22.1
5
21.3
3
19.9
2
17.6
1
19.8
1
21.0
2
21.2
0
20.4
4
4.40
20.2
4
15.8
1
17.0
5
23.4
3
21.8
3
13.6
8
14.5
0
13.8
9
16.4
4
16.2
4
14.6
1
3.91
10.6
8
Dat
e of
co
mpl
etio
n
09-1
1-92
09-1
1-92
09-1
0-92
08
-27-
92
08-2
7-92
09-0
4-92
09-0
4-92
09-0
3-92
09-0
3-92
08-1
3-92
09-0
2-92
09-1
5-92
09-1
5-92
09-1
5-92
09-1
0-92
09-0
8-92
09-0
8-92
09-0
8-92
09-0
9-92
09-1
2-92
09-1
0-92
09-0
9-92
09-0
9-92
08-2
1-92
.d ho
llow
-ste
m a
uger
(al
l oth
ers)
. D
epth
s ar
e m
easu
red
from
lan
d-su
rfac
e da
tum
, alti
tude
is i
n re
fere
nce
to
on w
ells
, see
pla
te 1
]
Dep
th
of w
ell
(fee
t)
12.5
17.5
22.0
21.9
20.5
12.4
17.2
30.0
25.1
20.0
14.2
18.5
18.5
27.0
17.5
17.5
15.5
24.8
16.8
24.5
25.1
17.0
24.5
14.9
3
Dep
th
of h
ole
(fee
t)
14.5
20.0
22.0
22.0
22.0
12.4
17.2
30.0
25.1
20.0
25.0
20.0
20.0
27.5
22.0
17.5
15.5
24.8
17.0
25.0
25.1
17.0
24.5
16.5
Hyd
roge
olog
ic u
nit
Col
umbi
a aq
uife
r
Col
umbi
a aq
uife
r
Col
umbi
a aq
uife
r
Col
umbi
a aq
uife
r
Col
umbi
a aq
uife
r
Col
umbi
a aq
uife
r
Col
umbi
a aq
uife
r
Col
umbi
a aq
uife
r
Col
umbi
a aq
uife
r
Col
umbi
a aq
uife
r
Col
umbi
a aq
uife
r
Col
umbi
a aq
uife
r
Col
umbi
a aq
uife
r
Col
umbi
a aq
uife
r
Col
umbi
a aq
uife
r
Col
umbi
a aq
uife
r
Col
umbi
a aq
uife
r
Col
umbi
a aq
uife
r
Col
umbi
a aq
uife
r
Col
umbi
a aq
uife
r
Col
umbi
a aq
uife
r
Col
umbi
a aq
uife
r
Col
umbi
a aq
uife
r
Col
umbi
a aq
uife
r
Inte
rval
of
scr
een
(fee
t)
5.0
-10.0
5.0
-15.0
9.5
-19.5
9.7
-19
.7
8.0
-18
.0
4.9
- 9.
9
4.7
-14
.7
17.7
-27.
7
12.9
-22.
9
7.7
-17
.7
7.0
-12
.0
8.0
-18
.0
8.0
-18
.0
16.5
-26.
5
5.0
-15.0
5.0
-15.0
3.0
-13
.0
12.3
-22.
3
9.3
-14
.3
12.0
-22.
0
12.6
-22.
6
4.5
-14
.5
12.0
-22.
0
2.7
-12
.7
Inte
rval
of
san
d pa
ck
(fee
t)
3 -1
2
3 -1
7
7 -2
0
5 -2
24-2
2
3 -1
2
3 -1
7
8 -3
0
8 -2
5
5 -2
0
2-1
2
6 -1
8
5 -2
0
10 -
27
3 -1
7
3 -1
72
-13
10-2
2
7 -1
54
-22
10
-25
2-1
5
7-2
4
1 -1
6
Inte
rval
of
bent
onit
e se
al
(fee
t)
1-
2_
6-
3-
3-
2-
2-
7-
7_
3-
1-
1-
4-
7_
2-
2-
1-
9-
6- 1-
9-
1-
6-
0-
3 3 7 5 4 3 3 8 8 5 2 6 5 10 3 3 2 10 7 4 10 2 7
.5
Inte
rval
of
gro
ut
(fee
t)
0 0 0 0 0 0 0 0 0 0 0 0 0 0 0 0 0 0 0 0 0 0 0 .5
-1 -2 -2
-3 -3 -2 -2 -2 -3 -3 _2
-1 -1 _7
-2 -2 -1 -2 _2
-1 _2
-1 -2 -1
Tabl
e 1.
W
ell-c
onst
ruct
ion
data
for
obse
rvat
ion
we
lls C
on
tinu
ed
sea
leve
l. A
ll w
ells
hav
e 4
inch
scr
een/
casi
ng i
nter
nal
diam
eter
. Fo
r lo
catio
ns o
f ob
serv
atio
n w
ells
, se
e pl
ate
1]
Loc
al
wel
l no
.
25 27 28 29 30 Ml
M2
M3
Dl
D2
D3
uses
wel
l no
.
54Q
4954
Q50
54Q
5154
Q52
54Q
53
54Q
20
54Q
22
54Q
24
54Q
1954
Q21
54Q
23
Lat
itude
38°1
9'26
"38
°19'
26"
38°1
9'37
"38
°19'
54"
38°2
1'15
"
38°2
1'03
"
38°2
1'29
"
38°1
9'15
"
38°2
1'03
"
38°2
1'29
"38
°19'
15"
Lon
gitu
de
77°0
2'32
"77
°02'
17"
77°0
2'48
"77
°02'
49"
77°0
2'41
"
77°0
2'54
"
77°0
0'58
"
77°0
2'03
"
77°0
2'54
"
77W
58"
77°0
2'03
"
Lan
d-su
rfac
e da
tum
al
titud
e (f
eet)
10.6
210
.80
7.95
18.4
88.
85
21.5
9
20.5
2
10.7
0
21.6
020
.46
10.7
0
Dat
e of
co
mpl
etio
n
09-1
4-92
09-1
2-92
09-1
4-92
09-1
2-92
09-0
4-92
08-2
9-92
09-0
1-92
08-2
2-92
08-2
6-92
08-1
8-92
08-2
1-92
Dep
th
of w
ell
(fee
t)
25.0
20.5
15.5
14.5
20.0
97.2
5
58.2
5
74.2
202.
2521
9.25
214.
7
Dep
th
of h
ole
(fee
t)
25.0
20.5
15.5
14.5
22.0
100.
0
60.0
75.0
220.
021
9.5
215.
0
Hyd
roge
olog
ic u
nit
Col
umbi
a aq
uife
rC
olum
bia
aqui
fer
Col
umbi
a aq
uife
rC
olum
bia
aqui
fer
Col
umbi
a aq
uife
r
Upp
er c
onfi
ned
aqui
fer
Upp
er c
onfi
ned
aqui
fer
Upp
er c
onfi
ned
aqui
fer
Aqu
ia a
quif
erA
quia
aqu
ifer
Aqu
ia a
quif
er
Inte
rval
of
scr
een
(fee
t)
9.5
- 19
.58.0
- 18
.05.0
- 15
.07.0
- 12
.012
.5-
17.5
85.0
- 95
.0
46.0
- 56
.0
61.8
- 71
.8
180.
0-20
0.0
197.
0-21
7.0
192.
4-21
2.4
Inte
rval
of
san
d pa
ck
(fee
t)
4 6 3 5 9 70 39 39 155
184
170
- 20
- 20
- 15
- 14
- 20
-10
0
- 60
- 74
-22
0-2
19
-21
5
Inte
rval
of
bent
onite
sea
l (f
eet)
1-
44-
6
1-
32
- 5
8-
9
66-
70
34-
39
34-
39
151-
155
182-
184
165-
170
Inte
rval
of
gro
ut
(fee
t)
0 0 0 0 0 0 0 0 0 0 0
- 1
- 1
- 1
- 2
- 2
- 66
- 34
- 34
-151
-182
-165
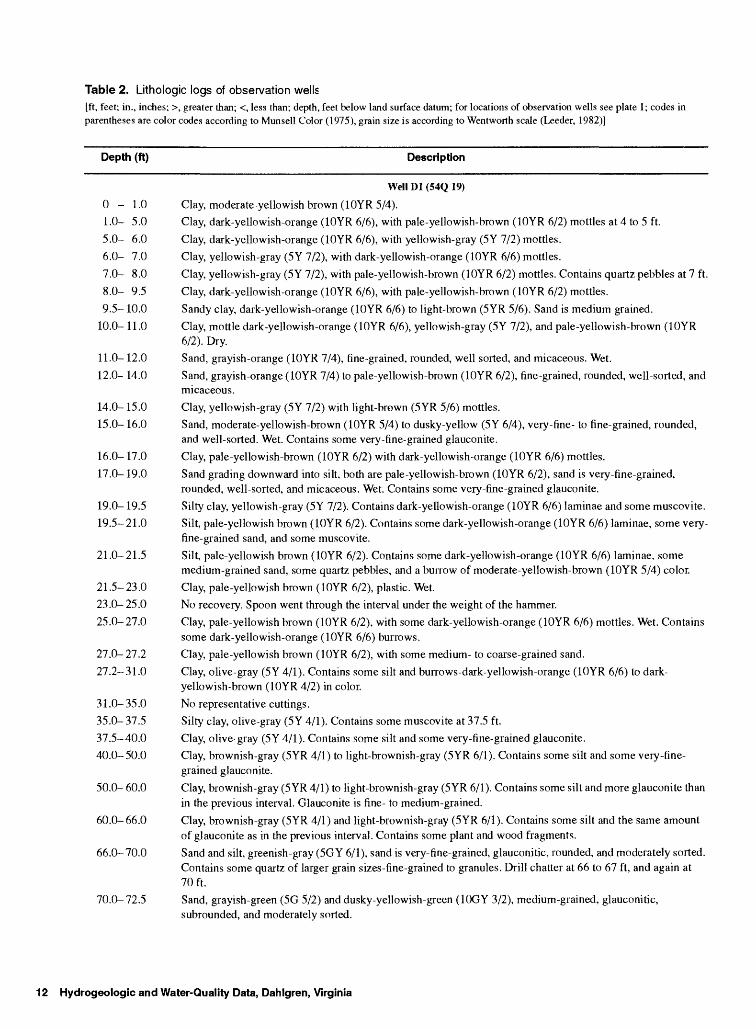
Table 2. Lithologic logs of observation wells[ft, feet; in., inches; >, greater than; <, less than; depth, feet below land surface datum; for locations of observation wells see plate 1; codes inparentheses are color codes according to Munsell Color (1975), grain size is according to Wentworth scale (Leeder, 1982)]
Depth (ft) Description
Well Dl (54Q 19)
0-1.0 Clay, moderate-yellowish brown (10YR 5/4).
1.0- 5.0 Clay, dark-yellowish-orange (10YR 6/6), with pale-yellowish-brown (10YR 6/2) mottles at 4 to 5 ft.
5.0- 6.0 Clay, dark-yellowish-orange (10YR 6/6), with yellowish-gray (5Y 7/2) mottles.
6.0- 7.0 Clay, yellowish-gray (5Y 7/2), with dark-yellowish-orange (10YR 6/6) mottles.
7.0- 8.0 Clay, yellowish-gray (5Y 7/2), with pale-yellowish-brown (10YR 6/2) mottles. Contains quartz pebbles at 7 ft.
8.0- 9.5 Clay, dark-yellowish-orange (10YR 6/6), with pale-yellowish-brown (10YR 6/2) mottles.
9.5- 10.0 Sandy clay, dark-yellowish-orange (10YR 6/6) to light-brown (SYR 5/6). Sand is medium grained.
10.0- 11.0 Clay, mottle dark-yellowish-orange (10YR 6/6), yellowish-gray (5Y 7/2), and pale-yellowish-brown (10YR 6/2). Dry.
11.0- 12.0 Sand, grayish-orange (10YR 7/4), fine-grained, rounded, well sorted, and micaceous. Wet.
12.0- 14.0 Sand, grayish-orange (10YR 7/4) to pale-yellowish-brown (10YR 6/2), fine-grained, rounded, well-sorted, and micaceous.
14.0- 15.0 Clay, yellowish-gray (5Y 7/2) with light-brown (5YR 5/6) mottles.
15.0- 16.0 Sand, moderate-yellowish-brown (10YR 5/4) to dusky-yellow (5Y 6/4), very-fine- to fine-grained, rounded, and well-sorted. Wet. Contains some very-fine-grained glauconite.
16.0- 17.0 Clay, pale-yellowish-brown (10YR 6/2) with dark-yellowish-orange (10YR 6/6) mottles.
17.0-19.0 Sand grading downward into silt, both are pale-yellowish-brown (10YR 6/2), sand is very-fine-grained, rounded, well-sorted, and micaceous. Wet. Contains some very-fine-grained glauconite.
19.0- 19.5 Silty clay, yellowish-gray (5Y 7/2). Contains dark-yellowish-orange (10YR 6/6) laminae and some muscovite.
19.5-21.0 Silt, pale-yellowish brown (10YR 6/2). Contains some dark-yellowish-orange (10YR 6/6) laminae, some very- fine-grained sand, and some muscovite.
21.0-21.5 Silt, pale-yellowish brown (10YR 6/2). Contains some dark-yellowish-orange (10YR 6/6) laminae, some medium-grained sand, some quartz pebbles, and a burrow of moderate-yellowish-brown (10YR 5/4) color.
21.5-23.0 Clay, pale-yellowish brown (10YR 6/2), plastic. Wet.
23.0- 25.0 No recovery. Spoon went through the interval under the weight of the hammer.
25.0-27.0 Clay, pale-yellowish brown (10YR 6/2), with some dark-yellowish-orange (10YR 6/6) mottles. Wet. Contains some dark-yellowish-orange (10YR 6/6) burrows.
27.0-27.2 Clay, pale-yellowish brown (10YR 6/2), with some medium- to coarse-grained sand.
27.2-31.0 Clay, olive-gray (5Y 4/1). Contains some silt and burrows-dark-yellowish-orange (10YR 6/6) to dark- yellowish-brown (10YR 4/2) in color.
31.0-35.0 No representative cuttings.
35.0- 37.5 Silty clay, olive-gray (5Y 4/1). Contains some muscovite at 37.5 ft.
37.5-40.0 Clay, olive-gray (5Y 4/1). Contains some silt and some very-fine-grained glauconite.
40.0-50.0 Clay, brownish-gray (SYR 4/1) to light-brownish-gray (SYR 6/1). Contains some silt and some very-fine grained glauconite.
50.0- 60.0 Clay, brownish-gray (SYR 4/1) to light-brownish-gray (SYR 6/1). Contains some silt and more glauconite than in the previous interval. Glauconite is fine- to medium-grained.
60.0-66.0 Clay, brownish-gray (SYR 4/1) and light-brownish-gray (5YR 6/1). Contains some silt and the same amount of glauconite as in the previous interval. Contains some plant and wood fragments.
66.0- 70.0 Sand and silt, greenish-gray (5GY 6/1), sand is very-fine-grained, glauconitic, rounded, and moderately sorted. Contains some quartz of larger grain sizes-fine-grained to granules. Drill chatter at 66 to 67 ft, and again at 70 ft.
70.0-72.5 Sand, grayish-green (5G 5/2) and dusky-yellowish-green (10GY 3/2), medium-grained, glauconitic, subrounded, and moderately sorted.
12 Hydrogeologic and Water-Quality Data, Dahlgren, Virginia
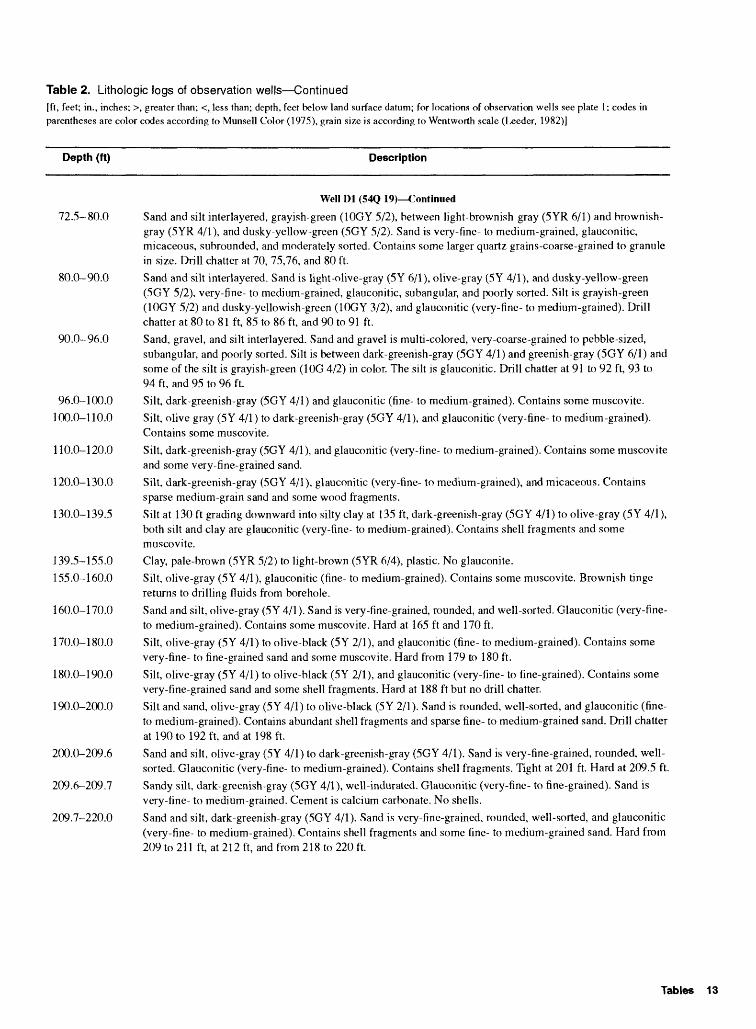
Table 2. Lithologic logs of observation wells Continued[ft, feet; in., inches; >, greater than; <, less than; depth, feet below land surface datum; for locations of observation wells see plate 1: codes in parentheses are color codes according to Munsell Color (1975), grain size is according to Wentworth scale (Leeder, 1982)]
Depth (ft) Description
Well Dl (54Q 19) Continued
72.5-80.0 Sand and silt interlayered, grayish-green (10GY 5/2), between light-brownish-gray (5YR 6/1) and brownish- gray (5YR 4/1), and dusky-yellow-green (5GY 5/2). Sand is very-fine- to medium-grained, glauconitic, micaceous, subrounded, and moderately sorted. Contains some larger quartz grains-coarse-grained to granule in size. Drill chatter at 70, 75,76, and 80 ft.
80.0-90.0 Sand and silt interlayered. Sand is light-olive-gray (5Y 6/1), olive-gray (5Y 4/1), and dusky-yellow-green (5GY 5/2), very-fine- to medium-grained, glauconitic, subangular, and poorly sorted. Silt is grayish-green (10GY 5/2) and dusky-yellowish-green (10GY 3/2), and glauconitic (very-fine- to medium-grained). Drill chatter at 80 to 81 ft, 85 to 86 ft, and 90 to 91 ft.
90.0-96.0 Sand, gravel, and silt interlayered. Sand and gravel is multi-colored, very-coarse-grained to pebble-sized,subangular, and poorly sorted. Silt is between dark-greenish-gray (5GY 4/1) and greenish-gray (5GY 6/1) and some of the silt is grayish-green (10G 4/2) in color. The silt is glauconitic. Drill chatter at 91 to 92 ft, 93 to 94 ft, and 95 to 96 ft.
96.0-100.0 Silt, dark-greenish-gray (5GY 4/1) and glauconitic (fine- to medium-grained). Contains some muscovite.
100.0-110.0 Silt, olive gray (5Y 4/1) to dark-greenish-gray (5GY 4/1), and glauconitic (very-fine- to medium-grained). Contains some muscovite.
110.0-120.0 Silt, dark-greenish-gray (5GY 4/1), and glauconitic (very-fine- to medium-grained). Contains some muscovite and some very-fine-grained sand.
120.0-130.0 Silt, dark-greenish-gray (5GY 4/1), glauconitic (very-fine- to medium-grained), and micaceous. Contains sparse medium-grain sand and some wood fragments.
130.0-139.5 Silt at 130 ft grading downward into silty clay at 135 ft, dark-greenish-gray (5GY 4/1) to olive-gray (5Y 4/1), both silt and clay are glauconitic (very-fine- to medium-grained). Contains shell fragments and some muscovite.
139.5-155.0 Clay, pale-brown (5YR 5/2) to light-brown (5YR 6/4), plastic. No glauconite.
155.0-160.0 Silt, olive-gray (5Y 4/1), glauconitic (fine- to medium-grained). Contains some muscovite. Brownish tinge returns to drilling fluids from borehole.
160.0-170.0 Sand and silt, olive-gray (5Y 4/1). Sand is very-fine-grained, rounded, and well-sorted. Glauconitic (very-fine- to medium-grained). Contains some muscovite. Hard at 165 ft and 170 ft.
170.0-180.0 Silt, olive-gray (5Y 4/1) to olive-black (5Y 2/1), and glauconitic (fine- to medium-grained). Contains some very-fine- to fine-grained sand and some muscovite. Hard from 179 to 180 ft.
180.0-190.0 Silt, olive-gray (5Y 4/1) to olive-black (5Y 2/1), and glauconitic (very-fine- to fine-grained). Contains some very-fine-grained sand and some shell fragments. Hard at 188 ft but no drill chatter.
190.0-200.0 Silt and sand, olive-gray (5Y 4/1) to olive-black (5Y 2/1). Sand is rounded, well-sorted, and glauconitic (fine- to medium-grained). Contains abundant shell fragments and sparse fine- to medium-grained sand. Drill chatter at 190 to 192ft, and at 198 ft.
200.0-209.6 Sand and silt, olive-gray (5Y 4/1) to dark-greenish-gray (5GY 4/1). Sand is very-fine-grained, rounded, well- sorted. Glauconitic (very-fine- to medium-grained). Contains shell fragments. Tight at 201 ft. Hard at 209.5 ft.
209.6-209.7 Sandy silt, dark-greenish-gray (5GY 4/1), well-indurated. Glauconitic (very-fine- to fine-grained). Sand is very-fine- to medium-grained. Cement is calcium carbonate. No shells.
209.7-220.0 Sand and silt, dark-greenish-gray (5GY 4/1). Sand is very-fine-grained, rounded, well-sorted, and glauconitic (very-fine- to medium-grained). Contains shell fragments and some fine- to medium-grained sand. Hard from 209 to 211 ft, at 212 ft, and from 218 to 220 ft.
Tables 13
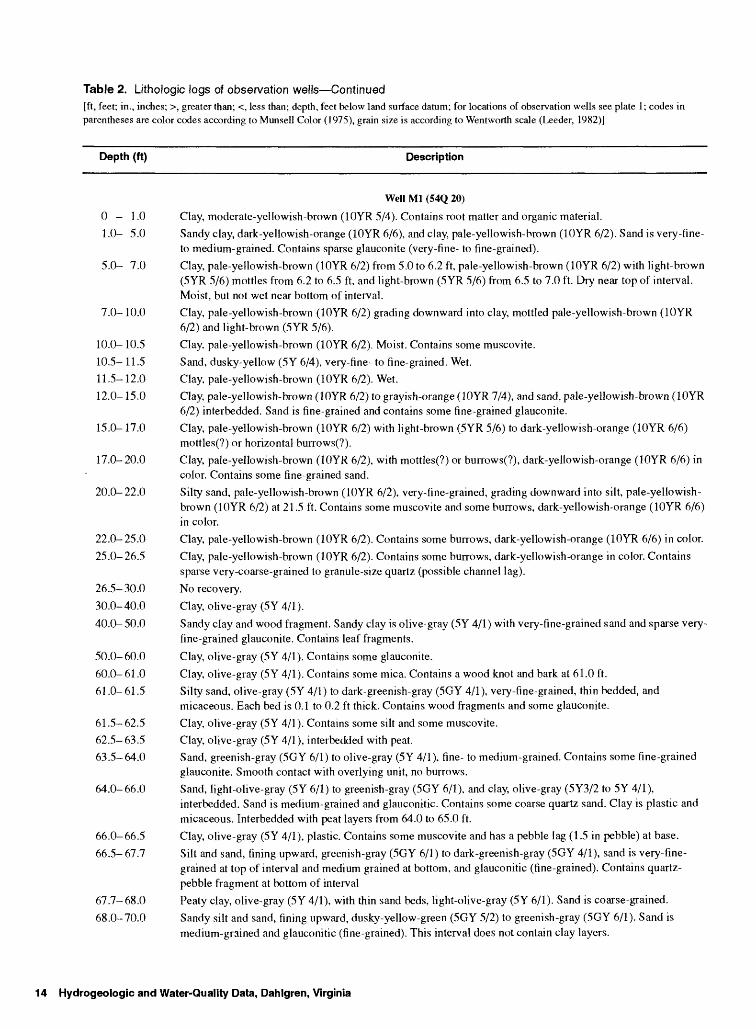
Table 2. Lithologic logs of observation wells Continued[ft, feet; in., inches; >, greater than; <, less than; depth, feet below land surface datum; for locations of observation wells see plate 1; codes in parentheses are color codes according to Munsell Color (1975), grain size is according to Wentworth scale (Leeder, 1982)]
Depth (ft) Description
Well Ml (54Q 20)
0 - 1.0 Clay, moderate-yellowish-brown (10YR 5/4). Contains root matter and organic material.
1.0- 5.0 Sandy clay, dark-yellowish-orange (10YR 6/6), and clay, pale-yellowish-brown (10YR 6/2). Sand is very-fine-to medium-grained. Contains sparse glauconite (very-fine- to fine-grained).
5.0- 7.0 Clay, pale-yellowish-brown (10YR 6/2) from 5.0 to 6.2 ft, pale-yellowish-brown (10YR 6/2) with light-brown (5YR 5/6) mottles from 6.2 to 6.5 ft, and light-brown (5YR 5/6) from 6.5 to 7.0 ft. Dry near top of interval. Moist, but not wet near bottom of interval.
7.0- 10.0 Clay, pale-yellowish-brown (10YR 6/2) grading downward into clay, mottled pale-yellowish-brown (10YR 6/2) and light-brown (5YR 5/6).
10.0-10.5 Clay, pale-yellowish-brown (10YR 6/2). Moist. Contains some muscovite.
10.5- 11.5 Sand, dusky-yellow (5Y 6/4), very-fine- to fine-grained. Wet.
11.5- 12.0 Clay, pale-yellowish-brown (10YR 6/2). Wet.
12.0-15.0 Clay, pale-yellowish-brown (10YR 6/2) to grayish-orange (10YR 7/4), and sand, pale-yellowish-brown (10YR 6/2) interbedded. Sand is fine-grained and contains some fine-grained glauconite.
15.0- 17.0 Clay, pale-yellowish-brown (10YR 6/2) with light-brown (5YR 5/6) to dark-yellowish-orange (10YR 6/6) mottles(?) or horizontal burrows(?).
17.0- 20.0 Clay, pale-yellowish-brown (10YR 6/2), with mottles(?) or burrows(?), dark-yellowish-orange (10YR 6/6) in color. Contains some fine-grained sand.
20.0-22.0 Silty sand, pale-yellowish-brown (10YR 6/2), very-fine-grained, grading downward into silt, pale-yellowish- brown (10YR 6/2) at 21.5 ft. Contains some muscovite and some burrows, dark-yellowish-orange (10YR 6/6) in color.
22.0-25.0 Clay, pale-yellowish-brown (10YR 6/2). Contains some burrows, dark-yellowish-orange (10YR 6/6) in color.
25.0-26.5 Clay, pale-yellowish-brown (10YR 6/2). Contains some burrows, dark-yellowish-orange in color. Contains sparse very-coarse-grained to granule-size quartz (possible channel lag).
26.5-30.0 No recovery.
30.0-40.0 Clay, olive-gray (5Y 4/1).
40.0-50.0 Sandy clay and wood fragment. Sandy clay is olive-gray (5Y 4/1) with very-fine-grained sand and sparse very- fine-grained glauconite. Contains leaf fragments.
50.0-60.0 Clay, olive-gray (5Y 4/1). Contains some glauconite.
60.0-61.0 Clay, olive-gray (5Y 4/1). Contains some mica. Contains a wood knot and bark at 61.0 ft.
61.0-61.5 Silty sand, olive-gray (5Y 4/1) to dark-greenish-gray (5GY 4/1), very-fine-grained, thin bedded, and micaceous. Each bed is 0.1 to 0.2 ft thick. Contains wood fragments and some glauconite.
61.5- 62.5 Clay, olive-gray (5Y 4/1). Contains some silt and some muscovite.
62.5- 63.5 Clay, olive-gray (5Y 4/1), interbedded with peat.
63.5-64.0 Sand, greenish-gray (5GY 6/1) to olive-gray (5Y 4/1), fine- to medium-grained. Contains some fine-grained glauconite. Smooth contact with overlying unit, no burrows.
64.0-66.0 Sand, light-olive-gray (5Y 6/1) to greenish-gray (5GY 6/1), and clay, olive-gray (5Y3/2 to 5Y 4/1),interbedded. Sand is medium-grained and glauconitic. Contains some coarse quartz sand. Clay is plastic and micaceous. Interbedded with peat layers from 64.0 to 65.0 ft.
66.0-66.5 Clay, olive-gray (5Y 4/1), plastic. Contains some muscovite and has a pebble lag (1.5 in pebble) at base.
66.5- 67.7 Silt and sand, fining upward, greenish-gray (5GY 6/1) to dark-greenish-gray (5GY 4/1), sand is very-fine grained at top of interval and medium grained at bottom, and glauconitic (fine-grained). Contains quartz- pebble fragment at bottom of interval
67.7- 68.0 Peaty clay, olive-gray (5Y 4/1), with thin sand beds, light-olive-gray (5Y 6/1). Sand is coarse-grained.
68.0-70.0 Sandy silt and sand, fining upward, dusky-yellow-green (5GY 5/2) to greenish-gray (5GY 6/1). Sand is medium-grained and glauconitic (fine-grained). This interval does not contain clay layers.
14 Hydrogeologic and Water-Quality Data, Dahlgren, Virginia
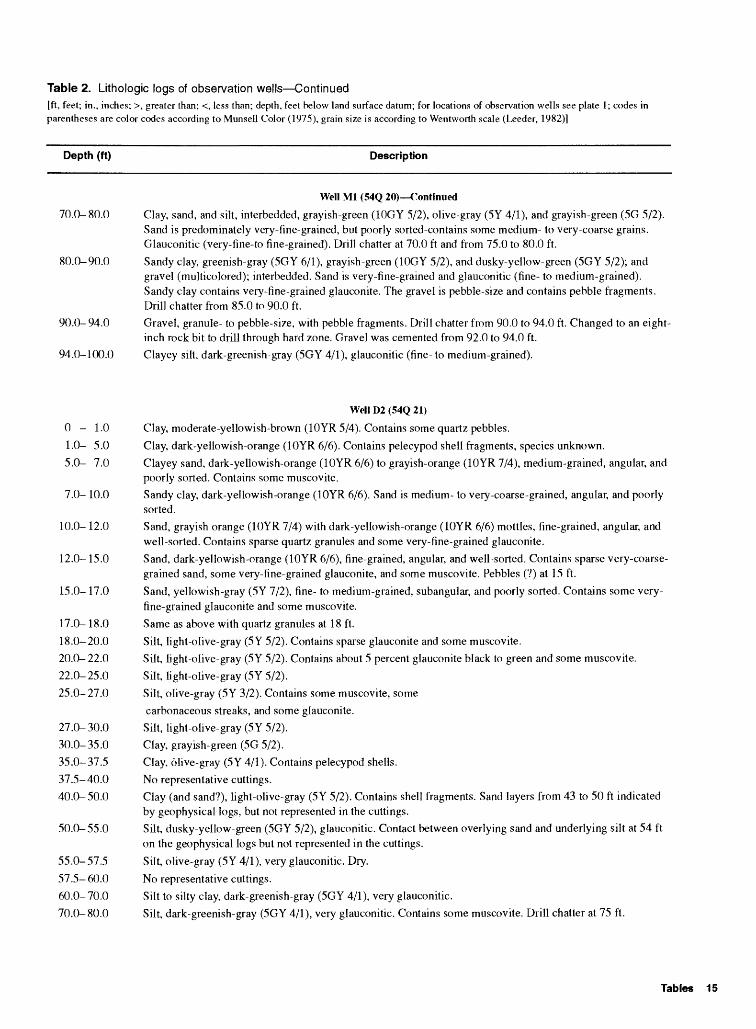
Table 2. Lithologic logs of observation wells Continued[ft, feet; in., inches; >, greater than; <, less than; depth, feet below land surface datum; for locations of observation wells see plate 1; codes in parentheses are color codes according to Munsell Color (1975), grain size is according to Wentworth scale (Leeder, 1982)]
Depth (ft) Description
Well Ml (54Q 20) Continued
70.0-80.0 Clay, sand, and silt, interbedded, grayish-green (10GY 5/2), olive-gray (5Y 4/1), and grayish-green (5G 5/2). Sand is predominately very-fine-grained, but poorly sorted-contains some medium- to very-coarse grains. Glauconitic (very-fine-to fine-grained). Drill chatter at 70.0 ft and from 75.0 to 80.0 ft.
80.0-90.0 Sandy clay, greenish-gray (5GY 6/1), grayish-green (10GY 5/2), and dusky-yellow-green (5GY 5/2); and gravel (multicolored); interbedded. Sand is very-fine-grained and glauconitic (fine- to medium-grained). Sandy clay contains very-fine-grained glauconite. The gravel is pebble-size and contains pebble fragments. Drill chatter from 85.0 to 90.0 ft.
90.0-94.0 Gravel, granule- to pebble-size, with pebble fragments. Drill chatter from 90.0 to 94.0 ft. Changed to an eight- inch rock bit to drill through hard zone. Gravel was cemented from 92.0 to 94.0 ft.
94.0-100.0 Clayey silt, dark-greenish-gray (5GY 4/1), glauconitic (fine- to medium-grained).
Well D2 (54Q 21)
0-1.0 Clay, moderate-yellowish-brown (10YR 5/4). Contains some quartz pebbles.
1.0- 5.0 Clay, dark-yellowish-orange (10YR 6/6). Contains pelecypod shell fragments, species unknown.
5.0- 7.0 Clayey sand, dark-yellowish-orange (10YR 6/6) to grayish-orange (10YR 7/4), medium-grained, angular, andpoorly sorted. Contains some muscovite.
7.0- 10.0 Sandy clay, dark-yellowish-orange (10YR 6/6). Sand is medium- to very-coarse-grained, angular, and poorly sorted.
10.0- 12.0 Sand, grayish orange (10YR 7/4) with dark-yellowish-orange (10YR 6/6) mottles, fine-grained, angular, and well-sorted. Contains sparse quartz granules and some very-fine-grained glauconite.
12.0- 15.0 Sand, dark-yellowish-orange (10YR 6/6), fine-grained, angular, and well-sorted. Contains sparse very-coarse grained sand, some very-fine-grained glauconite, and some muscovite. Pebbles (?) at 15 ft.
15.0- 17.0 Sand, yellowish-gray (5Y 7/2), fine- to medium-grained, subangular, and poorly sorted. Contains some very- fine-grained glauconite and some muscovite.
17.0- 18.0 Same as above with quartz granules at 18 ft.
18.0-20.0 Silt, light-olive-gray (5Y 5/2). Contains sparse glauconite and some muscovite.
20.0- 22.0 Silt, light-olive-gray (5Y 5/2). Contains about 5 percent glauconite black to green and some muscovite.
22.0-25.0 Silt, light-olive-gray (5Y 5/2).
25.0-27.0 Silt, olive-gray (5Y 3/2). Contains some muscovite, some
carbonaceous streaks, and some glauconite.
27.0-30.0 Silt, light-olive-gray (5Y 5/2).
30.0-35.0 Clay, grayish-green (5G 5/2).
35.0-37.5 Clay, olive-gray (5Y 4/1). Contains pelecypod shells.
37.5-40.0 No representative cuttings.
40.0-50.0 Clay (and sand?), light-olive-gray (5Y 5/2). Contains shell fragments. Sand layers from 43 to 50 ft indicated by geophysical logs, but not represented in the cuttings.
50.0-55.0 Silt, dusky-yellow-green (5GY 5/2), glauconitic. Contact between overlying sand and underlying silt at 54 ft on the geophysical logs but not represented in the cuttings.
55.0-57.5 Silt, olive-gray (5Y 4/1), very glauconitic. Dry.
57.5- 60.0 No representative cuttings.
60.0-70.0 Silt to silty clay, dark-greenish-gray (5GY 4/1), very glauconitic.
70.0-80.0 Silt, dark-greenish-gray (5GY 4/1), very glauconitic. Contains some muscovite. Drill chatter at 75 ft.
Tables 15
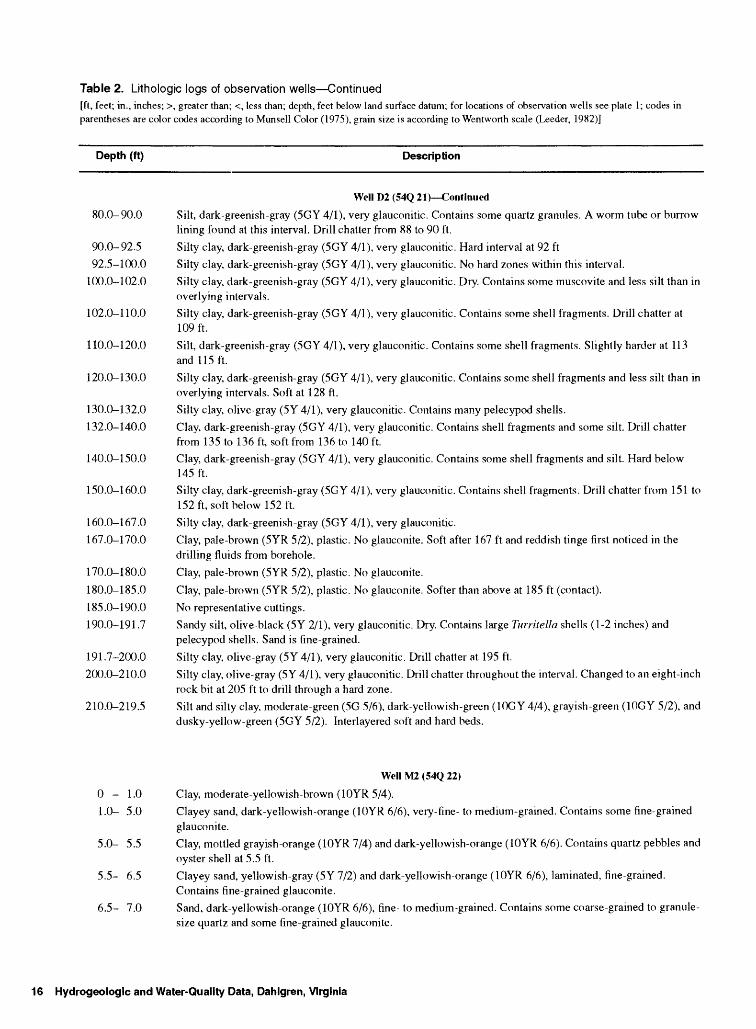
Table 2. Lithologic logs of observation wells Continued[ft, feet; in., inches; >, greater than; <, less than; depth, feet below land surface datum; for locations of observation wells see plate 1; codes in parentheses are color codes according to Munsell Color (1975), grain size is according to Wentworth scale (Leeder, 1982)]
Depth (ft) Description
Well D2 (54Q 21) Continued
80.0-90.0 Silt, dark-greenish-gray (5GY 4/1), very glauconitic. Contains some quartz granules. A worm tube or burrowlining found at this interval. Drill chatter from 88 to 90 ft.
90.0-92.5 Silty clay, dark-greenish-gray (5GY 4/1), very glauconitic. Hard interval at 92 ft
92.5-100.0 Silty clay, dark-greenish-gray (5GY 4/1), very glauconitic. No hard zones within this interval.
100.0-102.0 Silty clay, dark-greenish-gray (5GY 4/1), very glauconitic. Dry. Contains some muscovite and less silt than inoverlying intervals.
102.0-110.0 Silty clay, dark-greenish-gray (5GY 4/1), very glauconitic. Contains some shell fragments. Drill chatter at109 ft.
110.0-120.0 Silt, dark-greenish-gray (5GY 4/1), very glauconitic. Contains some shell fragments. Slightly harder at 113and 115 ft.
120.0-130.0 Silty clay, dark-greenish-gray (5GY 4/1), very glauconitic. Contains some shell fragments and less silt than inoverlying intervals. Soft at 128 ft.
130.0-132.0 Silty clay, olive-gray (5Y 4/1), very glauconitic. Contains many pelecypod shells.
132.0-140.0 Clay, dark-greenish-gray (5GY 4/1), very glauconitic. Contains shell fragments and some silt. Drill chatterfrom 135 to 136 ft, soft from 136 to 140 ft.
140.0-150.0 Clay, dark-greenish-gray (5GY 4/1), very glauconitic. Contains some shell fragments and silt. Hard below145 ft.
150.0-160.0 Silty clay, dark-greenish-gray (5GY 4/1), very glauconitic. Contains shell fragments. Drill chatter from 151 to152ft, soft below 152ft.
160.0-167.0 Silty clay, dark-greenish-gray (5GY 4/1), very glauconitic.
167.0-170.0 Clay, pale-brown (5YR 5/2), plastic. No glauconite. Soft after 167 ft and reddish tinge first noticed in thedrilling fluids from borehole.
170.0-180.0 Clay, pale-brown (SYR 5/2), plastic. No glauconite.
180.0-185.0 Clay, pale-brown (5YR 5/2), plastic. No glauconite. Softer than above at 185 ft (contact).
185.0-190.0 No representative cuttings.
190.0-191.7 Sandy silt, olive-black (5Y 2/1), very glauconitic. Dry. Contains large Turritella shells (1-2 inches) andpelecypod shells. Sand is fine-grained.
191.7-200.0 Silty clay, olive-gray (5Y 4/1), very glauconitic. Drill chatter at 195 ft.
200.0-210.0 Silty clay, olive-gray (5Y 4/1), very glauconitic. Drill chatter throughout the interval. Changed to an eight-inchrock bit at 205 ft to drill through a hard zone.
210.0-219.5 Silt and silty clay, moderate-green (5G 5/6), dark-yellowish-green (10GY 4/4), grayish-green (10GY 5/2), anddusky-yellow-green (5GY 5/2). Interlayered soft and hard beds.
Well M2 (54Q 22)
0-1.0 Clay, moderate-yellowish-brown (10YR 5/4).
1.0- 5.0 Clayey sand, dark-yellowish-orange (10YR 6/6), very-fine- to medium-grained. Contains some fine-grained glauconite.
5.0- 5.5 Clay, mottled grayish-orange (10YR 7/4) and dark-yellowish-orange (10YR 6/6). Contains quartz pebbles and oyster shell at 5.5 ft.
5.5- 6.5 Clayey sand, yellowish-gray (5Y 7/2) and dark-yellowish-orange (10YR 6/6), laminated, fine-grained. Contains fine-grained glauconite.
6.5- 7.0 Sand, dark-yellowish-orange (10YR 6/6), fine- to medium-grained. Contains some coarse-grained to granule- size quartz and some fine-grained glauconite.
16 Hydrogeologic and Water-Quality Data, Dahlgren, Virginia
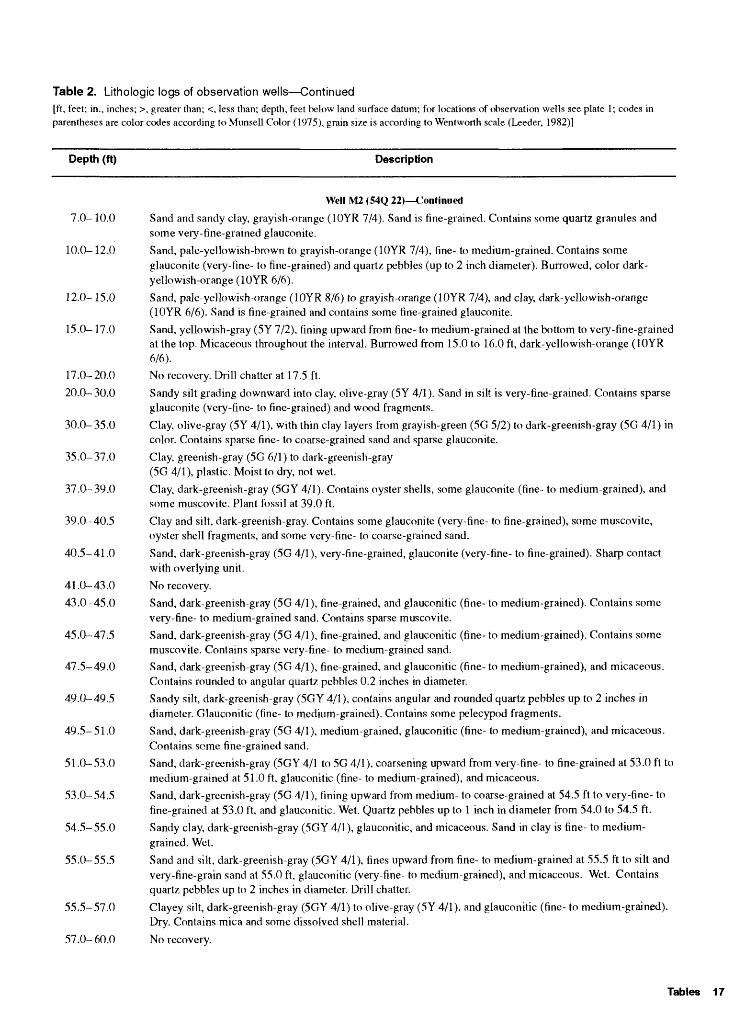
Table 2. Lithologic logs of observation wells Continued[ft, feet; in., inches; >, greater than; <, less than; depth, feet below land surface datum; for locations of observation wells see plate 1; codes in parentheses are color codes according to Munsell Color (1975), grain si/e is according to Wentworth scale (Leeder, 1982)]
Depth (ft) Description
Well M2 (54Q 22) Continued
7.0- 10.0 Sand and sandy clay, grayish-orange (10YR 7/4). Sand is fine-grained. Contains some quartz granules and some very-fine-grained glauconite.
10.0- 12.0 Sand, pale-yellowish-brown to grayish-orange (10YR 7/4), fine- to medium-grained. Contains someglauconite (very-fine- to fine-grained) and quartz pebbles (up to 2 inch diameter). Burrowed, color dark- yellowish-orange (10YR 6/6).
12.0- 15.0 Sand, pale-yellowish-orange (10YR 8/6) to grayish-orange (10YR 7/4), and clay, dark-yellowish-orange (10YR 6/6). Sand is fine-grained and contains some fine-grained glauconite.
15.0- 17.0 Sand, yellowish-gray (5Y 7/2), fining upward from fine- to medium-grained at the bottom to very-fine-grained at the top. Micaceous throughout the interval. Burrowed from 15.0 to 16.0 ft, dark-yellowish-orange (10YR 6/6).
17.0-20.0 No recovery. Drill chatter at 17.5 ft.
20.0-30.0 Sandy silt grading downward into clay, olive-gray (5Y 4/1). Sand in silt is very-fine-grained. Contains sparseglauconite (very-fine- to fine-grained) and wood fragments.
30.0-35.0 Clay, olive-gray (5Y 4/1), with thin clay layers from grayish-green (5G 5/2) to dark-greenish-gray (5G 4/1) incolor. Contains sparse fine- to coarse-grained sand and sparse glauconite.
35.0-37.0 Clay, greenish-gray (5G 6/1) to dark-greenish-gray(5G 4/1), plastic. Moist to dry, not wet.
37.0-39.0 Clay, dark-greenish-gray (5GY 4/1). Contains oyster shells, some glauconite (fine- to medium-grained), and some muscovite. Plant fossil at 39.0 ft.
39.0-40.5 Clay and silt, dark-greenish-gray. Contains some glauconite (very-fine- to fine-grained), some muscovite, oyster shell fragments, and some very-fine- to coarse-grained sand.
40.5-41.0 Sand, dark-greenish-gray (5G 4/1), very-fine-grained, glauconite (very-fine- to fine-grained). Sharp contactwith overlying unit.
41.0- 43.0 No recovery.
43.0-45.0 Sand, dark-greenish-gray (5G 4/1), fine-grained, and glauconitic (fine- to medium-grained). Contains somevery-fine- to medium-grained sand. Contains sparse muscovite.
45.0-47.5 Sand, dark-greenish-gray (5G 4/1), fine-grained, and glauconitic (fine- to medium-grained). Contains somemuscovite. Contains sparse very-fine- to medium-grained sand.
47.5-49.0 Sand, dark-greenish-gray (5G 4/1), fine-grained, and glauconitic (fine- to medium-grained), and micaceous.Contains rounded to angular quartz pebbles 0.2 inches in diameter.
49.0-49.5 Sandy silt, dark-greenish-gray (5GY 4/1), contains angular and rounded quartz pebbles up to 2 inches indiameter. Glauconitic (fine- to medium-grained). Contains some pelecypod fragments.
49.5-51.0 Sand, dark-greenish-gray (5G 4/1), medium-grained, glauconitic (fine- to medium-grained), and micaceous.Contains some fine-grained sand.
51.0-53.0 Sand, dark-greenish-gray (5GY 4/1 to 5G 4/1), coarsening upward from very-fine- to fine-grained at 53.0 ft tomedium-grained at 51.0 ft, glauconitic (fine- to medium-grained), and micaceous.
53.0-54.5 Sand, dark-greenish-gray (5G 4/1), fining upward from medium- to coarse-grained at 54.5 ft to very-fine- tofine-grained at 53.0 ft, and glauconitic. Wet. Quartz pebbles up to 1 inch in diameter from 54.0 to 54.5 ft.
54.5-55.0 Sandy clay, dark-greenish-gray (5GY 4/1), glauconitic, and micaceous. Sand in clay is fine- to medium- grained. Wet.
55.0-55.5 Sand and silt, dark-greenish-gray (5GY 4/1), fines upward from fine- to medium-grained at 55.5 ft to silt andvery-fine-grain sand at 55.0 ft, glauconitic (very-fine- to medium-grained), and micaceous. Wet. Containsquartz pebbles up to 2 inches in diameter. Drill chatter.
55.5-57.0 Clayey silt, dark-greenish-gray (5GY 4/1) to olive-gray (5Y 4/1), and glauconitic (fine- to medium-grained).Dry. Contains mica and some dissolved shell material.
57.0-60.0 No recovery.
Tables 17
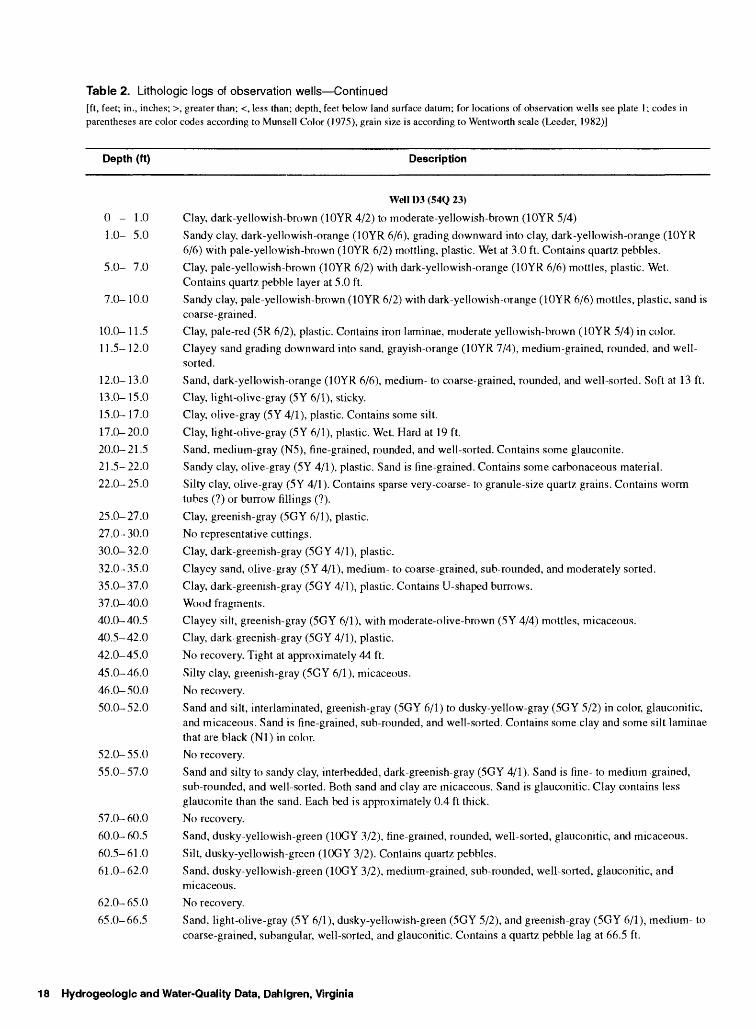
Table 2. Lithologic logs of observation wells Continued[ft, feet; in., inches; >, greater than; <, less than; depth, feet below land surface datum; for locations of observation wells see plate 1; codes in parentheses are color codes according to Munsell Color (1975), grain size is according to Wentworth scale (Leeder, 1982)]
Depth (ft) Description
Well D3 (54Q 23)
0 - 1.0 Clay, dark-yellowish-brown (10YR 4/2) to moderate-yellowish-brown (10YR 5/4)
1.0- 5.0 Sandy clay, dark-yellowish-orange (10YR 6/6), grading downward into clay, dark-yellowish-orange (10YR6/6) with pale-yellowish-brown (10YR 6/2) mottling, plastic. Wet at 3.0 ft. Contains quartz pebbles.
5.0- 7.0 Clay, pale-yellowish-brown (10YR 6/2) with dark-yellowish-orange (10YR 6/6) mottles, plastic. Wet.Contains quartz pebble layer at 5.0 ft.
7.0- 10.0 Sandy clay, pale-yellowish-brown (10YR 6/2) with dark-yellowish-orange (10YR 6/6) mottles, plastic, sand iscoarse-grained.
10.0- 11.5 Clay, pale-red (5R 6/2), plastic. Contains iron laminae, moderate yellowish-brown (10YR 5/4) in color.
11.5- 12.0 Clayey sand grading downward into sand, grayish-orange (10YR 7/4), medium-grained, rounded, and well- sorted.
12.0- 13.0 Sand, dark-yellowish-orange (10YR 6/6), medium- to coarse-grained, rounded, and well-sorted. Soft at 13 ft.
13.0- 15.0 Clay, light-olive-gray (5Y 6/1), sticky.
15.0- 17.0 Clay, olive-gray (5Y 4/1), plastic. Contains some silt.
17.0- 20.0 Clay, light-olive-gray (5Y 6/1), plastic. Wet. Hard at 19 ft.
20.0-21.5 Sand, medium-gray (N5), fine-grained, rounded, and well-sorted. Contains some glauconite.
21.5-22.0 Sandy clay, olive-gray (5Y 4/1), plastic. Sand is fine-grained. Contains some carbonaceous material.
22.0- 25.0 Silty clay, olive-gray (5Y 4/1). Contains sparse very-coarse- to granule-size quartz grains. Contains wormtubes (?) or burrow fillings (?).
25.0-27.0 Clay, greenish-gray (5GY 6/1), plastic.
27.0- 30.0 No representative cuttings.
30.0- 32.0 Clay, dark-greenish-gray (5GY 4/1), plastic.
32.0-35.0 Clayey sand, olive-gray (5Y 4/1), medium- to coarse-grained, sub-rounded, and moderately sorted.
35.0-37.0 Clay, dark-greenish-gray (5GY 4/1), plastic. Contains U-shaped burrows.
37.0-40.0 Wood fragments.
40.0-40.5 Clayey silt, greenish-gray (5GY 6/1), with moderate-olive-brown (5Y 4/4) mottles, micaceous.
40.5-42.0 Clay, dark-greenish-gray (5GY 4/1), plastic.
42.0-45.0 No recovery. Tight at approximately 44 ft.
45.0-46.0 Silty clay, greenish-gray (5GY 6/1), micaceous.
46.0-50.0 No recovery.
50.0-52.0 Sand and silt, interlaminated, greenish-gray (5GY 6/1) to dusky-yellow-gray (5GY 5/2) in color, glauconitic,and micaceous. Sand is fine-grained, sub-rounded, and well-sorted. Contains some clay and some silt laminaethat are black (Nl) in color.
52.0-55.0 No recovery.
55.0-57.0 Sand and silty to sandy clay, interbedded, dark-greenish-gray (5GY 4/1). Sand is fine- to medium-grained,sub-rounded, and well-sorted. Both sand and clay are micaceous. Sand is glauconitic. Clay contains lessglauconite than the sand. Each bed is approximately 0.4 ft thick.
57.0-60.0 No recovery.
60.0-60.5 Sand, dusky-yellowish-green (10GY 3/2), fine-grained, rounded, well-sorted, glauconitic, and micaceous.
60.5-61.0 Silt, dusky-yellowish-green (10GY 3/2). Contains quartz pebbles.
61.0-62.0 Sand, dusky-yellowish-green (10GY 3/2), medium-grained, sub-rounded, well-sorted, glauconitic, andmicaceous.
62.0- 65.0 No recovery.
65.0-66.5 Sand, light-olive-gray (5Y 6/1), dusky-yellowish-green (5GY 5/2), and greenish-gray (5GY 6/1), medium- tocoarse-grained, subangular, well-sorted, and glauconitic. Contains a quartz pebble lag at 66.5 ft.
18 Hydrogeologic and Water-Quality Data, Dahlgren, Virginia
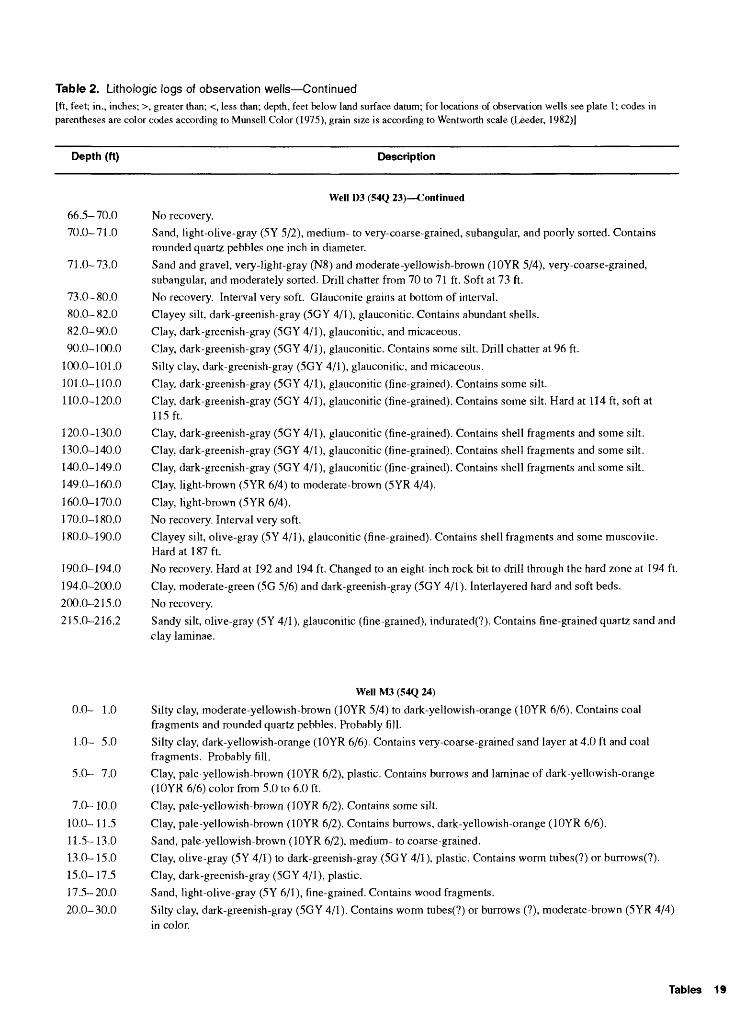
Table 2. Lithologic logs of observation wells Continued[ft, feet; in., inches; >, greater than; <, less than; depth, feet below land surface datum; for locations of observation wells see plate 1; codes in parentheses are color codes according to Munsell Color (1975), grain size is according to Wentworth scale (Leeder, 1982)]
Depth (ft) Description
Well D3 (54Q 23) Continued
66.5- 70.0 No recovery.
70.0-71.0 Sand, light-olive-gray (5Y 5/2), medium- to very-coarse-grained, subangular, and poorly sorted. Containsrounded quartz pebbles one inch in diameter.
71.0-73.0 Sand and gravel, very-light-gray (N8) and moderate-yellowish-brown (10YR 5/4), very-coarse-grained,subangular, and moderately sorted. Drill chatter from 70 to 71 ft. Soft at 73 ft.
73.0-80.0 No recovery. Interval very soft. Glauconite grains at bottom of interval.
80.0-82.0 Clayey silt, dark-greenish-gray (5GY 4/1), glauconitic. Contains abundant shells.
82.0-90.0 Clay, dark-greenish-gray (5GY 4/1), glauconitic, and micaceous.
90.0-100.0 Clay, dark-greenish-gray (5GY 4/1), glauconitic. Contains some silt. Drill chatter at 96 ft.
100.0-101.0 Silly clay, dark-greenish-gray (5GY 4/1), glauconitic, and micaceous.
101.0-110.0 Clay, dark-greenish-gray (5GY 4/1), glauconitic (fine-grained). Contains some silt.
110.0-120.0 Clay, dark-greenish-gray (5GY 4/1), glauconitic (fine-grained). Contains some silt. Hard at 114 ft, soft at115ft.
120.0-130.0 Clay, dark-greenish-gray (5GY 4/1), glauconitic (fine-grained). Contains shell fragments and some silt.
130.0-140.0 Clay, dark-greenish-gray (5GY 4/1), glauconitic (fine-grained). Contains shell fragments and some silt.
140.0-149.0 Clay, dark-greenish-gray (5GY 4/1), glauconitic (fine-grained). Contains shell fragments and some silt.
149.0-160.0 Clay, light-brown (5YR 6/4) to moderate-brown (SYR 4/4).
160.0-170.0 Clay, light-brown (5YR 6/4).
170.0-180.0 No recovery. Interval very soft.
180.0-190.0 Clayey silt, olive-gray (5Y 4/1), glauconitic (fine-grained). Contains shell fragments and some muscovite.Hard at 187 ft.
190.0-194.0 No recovery. Hard at 192 and 194 ft. Changed to an eight-inch rock bit to drill through the hard zone at 194 ft.
194.0-200.0 Clay, moderate-green (5G 5/6) and dark-greenish-gray (5GY 4/1). Interlayered hard and soft beds.
200.0-215.0 No recovery.
215.0-216.2 Sandy silt, olive-gray (5Y 4/1), glauconitic (fine-grained), indurated(?). Contains fine-grained quartz sand and clay laminae.
Well M3 (54Q 24)
0.0- 1.0 Silty clay, moderate-yellowish-brown (10YR 5/4) to dark-yellowish-orange (10YR 6/6). Contains coalfragments and rounded quartz pebbles. Probably fill.
1.0- 5.0 Silty clay, dark-yellowish-orange (10YR 6/6). Contains very-coarse-grained sand layer at 4.0 ft and coalfragments. Probably fill.
5.0- 7.0 Clay, pale-yellowish-brown (10YR 6/2), plastic. Contains burrows and laminae of dark-yellowish-orange(10YR 6/6) color from 5.0 to 6.0 ft.
7.0- 10.0 Clay, pale-yellowish-brown (10YR 6/2). Contains some silt.
10.0-11.5 Clay, pale-yellowish-brown (10YR 6/2). Contains burrows, dark-yellowish-orange (10YR 6/6).
11.5- 13.0 Sand, pale-yellowish-brown (10YR 6/2), medium- to coarse-grained.
13.0- 15.0 Clay, olive-gray (5Y 4/1) to dark-greenish-gray (5GY 4/1), plastic. Contains worm tubes(?) or burrows(?).
15.0-17.5 Clay, dark-greenish-gray (5GY 4/1), plastic.
17.5-20.0 Sand, light-olive-gray (5Y 6/1), fine-grained. Contains wood fragments.
20.0-30.0 Silty clay, dark-greenish-gray (5GY 4/1). Contains worm tubes(?) or burrows (?), moderate-brown (5YR 4/4) in color.
Tables 19
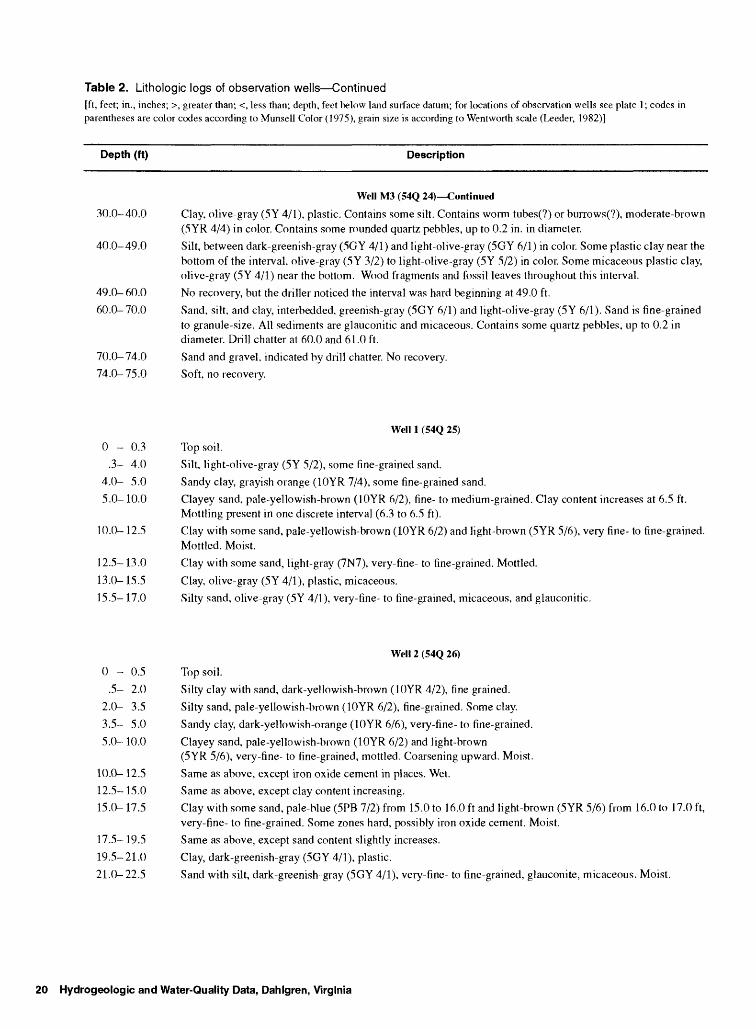
Table 2. Lithologic logs of observation wells Continued[ft, feet; in., inches; >, greater than; <, less than; depth, feet below land surface datum; for locations of observation wells see plate 1; codes in parentheses are color codes according to Munsell Color (1975), grain size is according to Wentworth scale (Leeder, 1982)]
Depth (ft) Description
Well M3 (54Q 24) Continued
30.0-40.0 Clay, olive-gray (5Y 4/1), plastic. Contains some silt. Contains worm tubes(?) or burrows(?), moderate-brown (5YR 4/4) in color. Contains some rounded quartz pebbles, up to 0.2 in. in diameter.
40.0-49.0 Silt, between dark-greenish-gray (5GY 4/1) and light-olive-gray (5GY 6/1) in color. Some plastic clay near the bottom of the interval, olive-gray (5Y 3/2) to light-olive-gray (5Y 5/2) in color. Some micaceous plastic clay, olive-gray (5Y 4/1) near the bottom. Wood fragments and fossil leaves throughout this interval.
49.0- 60.0 No recovery, but the driller noticed the interval was hard beginning at 49.0 ft.
60.0-70.0 Sand, silt, and clay, interbedded, greenish-gray (5GY 6/1) and light-olive-gray (5Y 6/1). Sand is fine-grained to granule-size. All sediments are glauconitic and micaceous. Contains some quartz pebbles, up to 0.2 in diameter. Drill chatter at 60.0 and 61.0 ft.
70.0-74.0 Sand and gravel, indicated by drill chatter. No recovery.
74.0-75.0 Soft, no recovery.
Well 1 (54Q 25)
0 - 0.3 Top soil.
.3- 4.0 Silt, light-olive-gray (5Y 5/2), some fine-grained sand.
4.0- 5.0 Sandy clay, grayish orange (10YR 7/4), some fine-grained sand.
5.0- 10.0 Clayey sand, pale-yellowish-brown (10YR 6/2), fine- to medium-grained. Clay content increases at 6.5 ft.Mottling present in one discrete interval (6.3 to 6.5 ft).
10.0-12.5 Clay with some sand, pale-yellowish-brown (10YR 6/2) and light-brown (5YR 5/6), very fine- to fine-grained.Mottled. Moist.
12.5- 13.0 Clay with some sand, light-gray (7N7), very-fine- to fine-grained. Mottled.
13.0- 15.5 Clay, olive-gray (5Y 4/1), plastic, micaceous.
15.5- 17.0 Silty sand, olive-gray (5Y 4/1), very-fine- to fine-grained, micaceous, and glauconitic.
Well 2 (54Q 26)
0 - 0.5 Top soil.
.5- 2.0 Silty clay with sand, dark-yellowish-brown (10YR 4/2), fine grained.
2.0- 3.5 Silty sand, pale-yellowish-brown (10YR 6/2), fine-grained. Some clay.
3.5- 5.0 Sandy clay, dark-yellowish-orange (10YR 6/6), very-fine- to fine-grained.
5.0- 10.0 Clayey sand, pale-yellowish-brown (10YR 6/2) and light-brown(5YR 5/6), very-fine- to fine-grained, mottled. Coarsening upward. Moist.
10.0- 12.5 Same as above, except iron oxide cement in places. Wet.
12.5- 15.0 Same as above, except clay content increasing.
15.0- 17.5 Clay with some sand, pale-blue (5PB 7/2) from 15.0 to 16.0 ft and light-brown (5YR 5/6) from 16.0 to 17.0 ft,very-fine- to fine-grained. Some zones hard, possibly iron oxide cement. Moist.
17.5- 19.5 Same as above, except sand content slightly increases.
19.5-21.0 Clay, dark-greenish-gray (5GY 4/1), plastic.
21.0-22.5 Sand with silt, dark-greenish-gray (5GY 4/1), very-fine- to fine-grained, glauconite, micaceous. Moist.
20 Hydrogeologic and Water-Quality Data, Dahlgren, Virginia
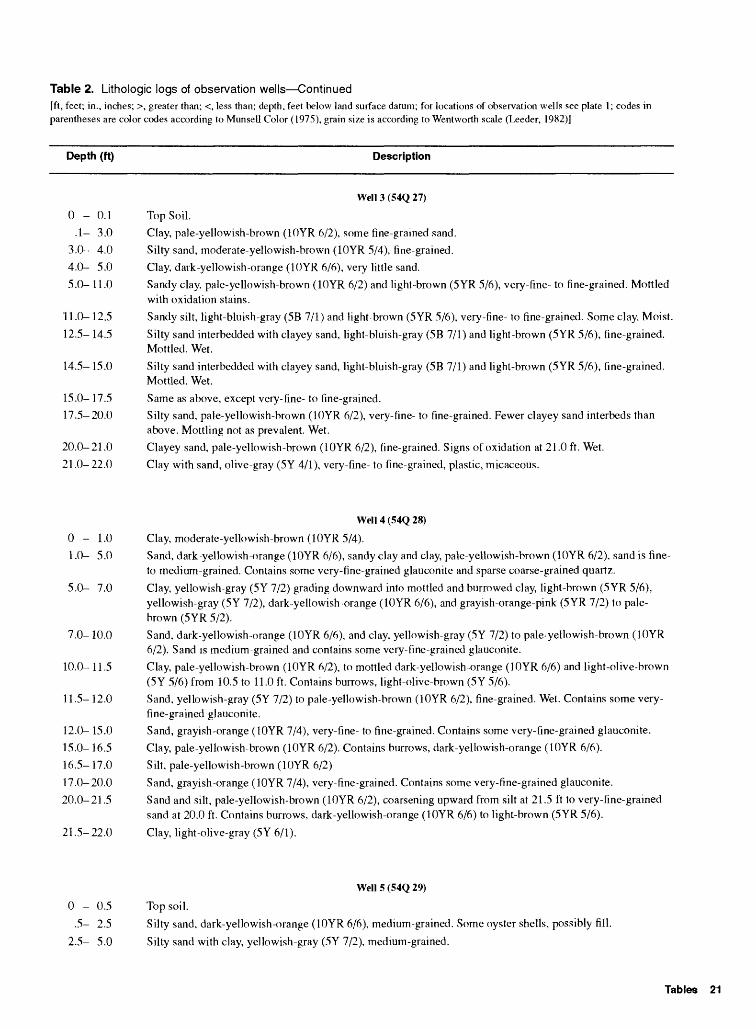
Table 2. Lithologic logs of observation wells Continued[ft, feet; in., inches; >, greater than; <, less than; depth, feet below land surface datum; for locations of observation wells see plate 1; codes in parentheses are color codes according to Munsell Color (1975), grain size is according to Wentworth scale (Leeder, 1982)]
Depth (ft) Description
Well 3 (54Q 27)
0-0.1 Top Soil.
.1- 3.0 Clay, pale-yellowish-brown (10YR 6/2), some fine-grained sand.
3.0- 4.0 Silly sand, moderate-yellowish-brown (10YR 5/4), fine-grained.
4.0- 5.0 Clay, dark-yellowish-orange (10YR 6/6), very little sand.
5.0- 11.0 Sandy clay, pale-yellowish-brown (10YR 6/2) and light-brown (SYR 5/6), very-fine- to fine-grained. Mottledwith oxidation stains.
11.0- 12.5 Sandy silt, light-bluish-gray (5B 7/1) and light-brown (SYR 5/6), very-fine- to fine-grained. Some clay. Moist.
12.5- 14.5 Silty sand interbedded with clayey sand, light-bluish-gray (5B 7/1) and light-brown (SYR 5/6), fine-grained.Mottled. Wet.
14.5- 15.0 Silty sand interbedded with clayey sand, light-bluish-gray (5B 7/1) and light-brown (5YR 5/6), fine-grained.Mottled. Wet.
15.0- 17.5 Same as above, except very-fine- to fine-grained.
17.5-20.0 Silty sand, pale-yellowish-brown (10YR 6/2), very-fine- to fine-grained. Fewer clayey sand interbeds thanabove. Mottling not as prevalent. Wet.
20.0-21.0 Clayey sand, pale-yellowish-brown (10YR 6/2), fine-grained. Signs of oxidation at 21.0 ft. Wet.
21.0-22.0 Clay with sand, olive-gray (5Y 4/1), very-fine- to fine-grained, plastic, micaceous.
Well 4 (54Q 28)
0-1.0 Clay, moderate-yellowish-brown (10YR 5/4).
I.0- 5.0 Sand, dark-yellowish-orange (10YR 6/6), sandy clay and clay, pale-yellowish-brown (10YR 6/2), sand is fine- to medium-grained. Contains some very-fine-grained glauconite and sparse coarse-grained quartz.
5.0- 7.0 Clay, yellowish-gray (5Y 7/2) grading downward into mottled and burrowed clay, light-brown (SYR 5/6), yellowish-gray (5Y 7/2), dark-yellowish-orange (10YR 6/6), and grayish-orange-pink (SYR 7/2) to pale- brown (SYR 5/2).
7.0- 10.0 Sand, dark-yellowish-orange (10YR 6/6), and clay, yellowish-gray (5Y 7/2) to pale-yellowish-brown (10YR6/2). Sand is medium-grained and contains some very-fine-grained glauconite.
10.0- 11.5 Clay, pale-yellowish-brown (10YR 6/2), to mottled dark-yellowish-orange (10YR 6/6) and light-olive-brown (5Y 5/6) from 10.5 to 11.0 ft. Contains burrows, light-olive-brown (5Y 5/6).
II.5- 12.0 Sand, yellowish-gray (5Y 7/2) to pale-yellowish-brown (10YR 6/2), fine-grained. Wet. Contains some very- fine-grained glauconite.
12.0- 15.0 Sand, grayish-orange (10YR 7/4), very-fine- to fine-grained. Contains some very-fine-grained glauconite.
15.0- 16.5 Clay, pale-yellowish-brown (10YR 6/2). Contains burrows, dark-yellowish-orange (10YR 6/6).
16.5-17.0 Silt, pale-yellowish-brown (10YR 6/2)
17.0-20.0 Sand, grayish-orange (10YR 7/4), very-fine-grained. Contains some very-fine-grained glauconite.
20.0-21.5 Sand and silt, pale-yellowish-brown (10YR 6/2), coarsening upward from silt at 21.5 ft to very-fine-grained sand at 20.0 ft. Contains burrows, dark-yellowish-orange (10YR 6/6) to light-brown (5YR 5/6).
21.5- 22.0 Clay, light-olive-gray (5Y 6/1).
Well 5 (54Q 29)
0 - 0.5 Top soil.
.5- 2.5 Silty sand, dark-yellowish-orange (10YR 6/6), medium-grained. Some oyster shells, possibly fill.
2.5- 5.0 Silty sand with clay, yellowish-gray (5Y 7/2), medium-grained.
Tables 21
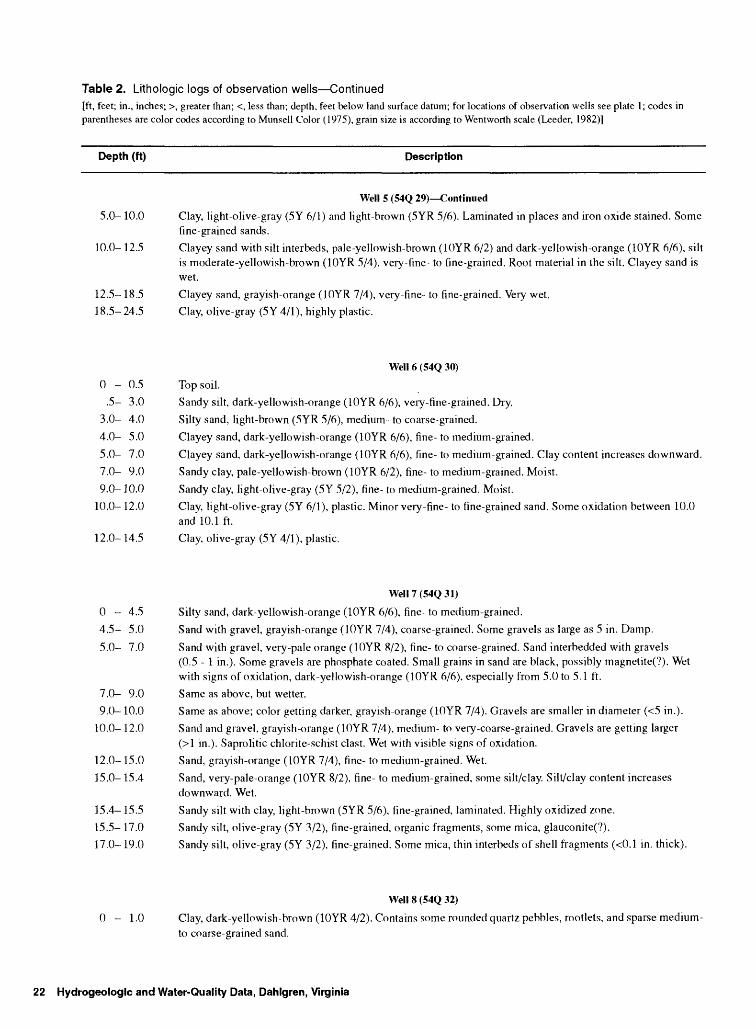
Table 2. Lithologic logs of observation wells Continued[ft, feet; in., inches; >, greater than; <, less than; depth, feet below land surface datum; for locations of observation wells see plate 1; codes in parentheses are color codes according to Munsell Color (1975), grain size is according to Wentworth scale (Leeder, 1982)]
Depth (ft) Description
Well 5 (54Q 29) Continued
5.0-10.0 Clay, light-olive-gray (5Y 6/1) and light-brown (5YR 5/6). Laminated in places and iron oxide stained. Somefine-grained sands.
10.0- 12.5 Clayey sand with silt interbeds, pale-yellowish-brown (10YR 6/2) and dark-yellowish-orange (10YR 6/6), siltis moderate-yellowish-brown (10YR 5/4), very-fine to fine-grained. Root material in the silt. Clayey sand iswet.
12.5-18.5 Clayey sand, grayish-orange (10YR 7/4), very-fine- to fine-grained. Very wet.
18.5-24.5 Clay, olive-gray (5Y 4/1), highly plastic.
Well 6 (54Q 30)
0 - 0.5 Top soil.
.5- 3.0 Sandy silt, dark-yellowish-orange (10YR 6/6), very-fine-grained. Dry.
3.0- 4.0 Silty sand, light-brown (5YR 5/6), medium- to coarse-grained.
4.0- 5.0 Clayey sand, dark-yellowish-orange (10YR 6/6), fine- to medium-grained.
5.0- 7.0 Clayey sand, dark-yellowish-orange (10YR 6/6), fine- to medium-grained. Clay content increases downward.
7.0- 9.0 Sandy clay, pale-yellowish-brown (10YR 6/2), fine- to medium-grained. Moist.
9.0- 10.0 Sandy clay, light-olive-gray (5Y 5/2), fine- to medium-grained. Moist.
10.0- 12.0 Clay, light-olive-gray (5Y 6/1), plastic. Minor very-fine- to fine-grained sand. Some oxidation between 10.0and 10.1 ft.
12.0- 14.5 Clay, olive-gray (5Y 4/1), plastic.
Well 7 (54Q 31)
0 - 4.5 Silty sand, dark-yellowish-orange (10YR 6/6), fine- to medium-grained.
4.5- 5.0 Sand with gravel, grayish-orange (10YR 7/4), coarse-grained. Some gravels as large as 5 in. Damp.
5.0- 7.0 Sand with gravel, very-pale orange (10YR 8/2), fine- to coarse-grained. Sand interbedded with gravels(0.5 - 1 in.). Some gravels are phosphate coated. Small grains in sand are black, possibly magnetite(?). Wet with signs of oxidation, dark-yellowish-orange (10YR 6/6), especially from 5.0 to 5.1 ft.
7.0- 9.0 Same as above, but wetter.
9.0- 10.0 Same as above; color getting darker, grayish-orange (10YR 7/4). Gravels are smaller in diameter (<5 in.).
10.0- 12.0 Sand and gravel, grayish-orange (10YR 7/4), medium- to very-coarse-grained. Gravels are getting larger(>1 in.). Saprolitic chlorite-schist clast. Wet with visible signs of oxidation.
12.0- 15.0 Sand, grayish-orange (10YR 7/4), fine- to medium-grained. Wet.
15.0- 15.4 Sand, very-pale-orange (10YR 8/2), fine- to medium-grained, some silt/clay. Silt/clay content increases downward. Wet.
15.4- 15.5 Sandy silt with clay, light-brown (5YR 5/6), fine-grained, laminated. Highly oxidized zone.
15.5- 17.0 Sandy silt, olive-gray (5Y 3/2), fine-grained, organic fragments, some mica, glauconite(?).
17.0- 19.0 Sandy silt, olive-gray (5Y 3/2), fine-grained. Some mica, thin interbeds of shell fragments (<0.1 in. thick).
Well 8 (54Q 32)
0 - 1.0 Clay, dark-yellowish-brown (10YR 4/2). Contains some rounded quartz pebbles, rootlets, and sparse medium- to coarse-grained sand.
22 Hydrogeologic and Water-Quality Data, Dahlgren, Virginia
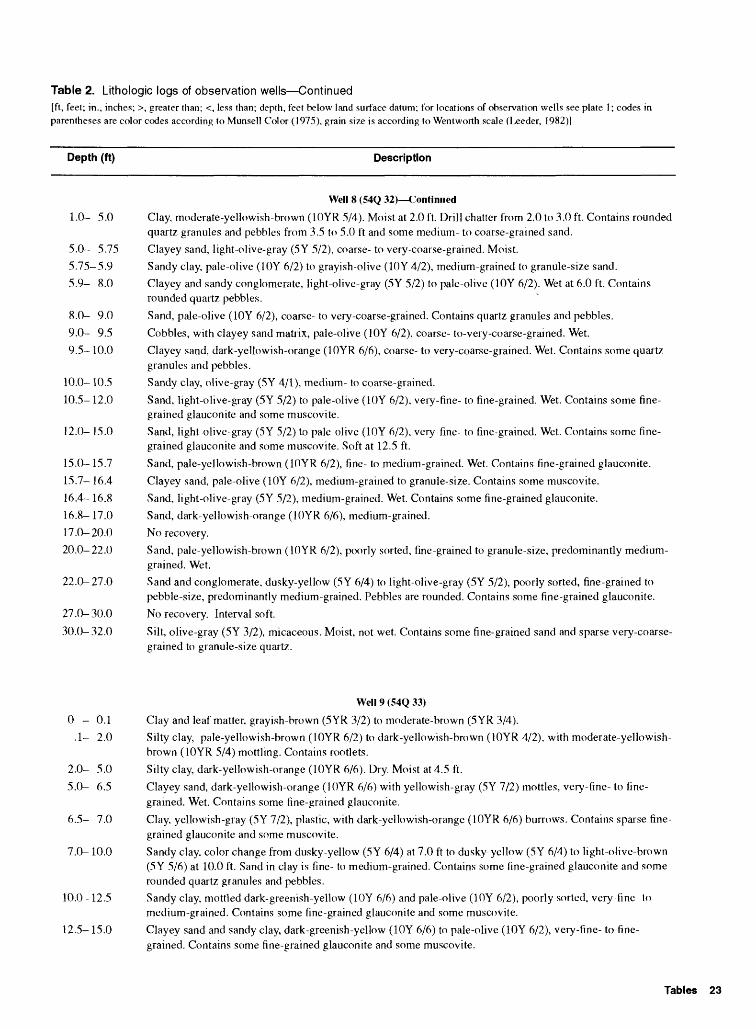
Table 2. Lithologic logs of observation wells Continued[ft, feet; in., inches; >, greater than; <, less than; depth, feet below land surface datum; for locations of observation wells see plate 1; codes in parentheses are color codes according to Munsell Color (1975), grain size is according to Wentworth scale (Leeder, 1982)]
Depth (ft) Description
Well 8 (54Q 32) Continued
1.0- 5.0 Clay, moderate-yellowish-brown (10YR 5/4). Moist at 2.0 ft. Drill chatter from 2.0 to 3.0 ft. Contains rounded quartz granules and pebbles from 3.5 to 5.0 ft and some medium- to coarse-grained sand.
5.0- 5.75 Clayey sand, light-olive-gray (5Y 5/2), coarse- to very-coarse-grained. Moist.
5.75-5.9 Sandy clay, pale-olive (10Y 6/2) to grayish-olive (10Y 4/2), medium-grained to granule-size sand.
5.9- 8.0 Clayey and sandy conglomerate, light-olive-gray (5Y 5/2) to pale-olive (10Y 6/2). Wet at 6.0 ft. Contains rounded quartz pebbles.
8.0- 9.0 Sand, pale-olive (10Y 6/2), coarse- to very-coarse-grained. Contains quartz granules and pebbles.
9.0- 9.5 Cobbles, with clayey sand matrix, pale-olive (10Y 6/2), coarse- to-very-coarse-grained. Wet.
9.5- 10.0 Clayey sand, dark-yellowish-orange (10YR 6/6), coarse- to very-coarse-grained. Wet. Contains some quartzgranules and pebbles.
10.0- 10.5 Sandy clay, olive-gray (5Y 4/1), medium- to coarse-grained.
10.5- 12.0 Sand, light-olive-gray (5Y 5/2) to pale-olive (10Y 6/2), very-fine- to fine-grained. Wet. Contains some fine grained glauconite and some muscovite.
12.0- 15.0 Sand, light-olive-gray (5Y 5/2) to pale-olive (10Y 6/2), very-fine- to fine-grained. Wet. Contains some fine grained glauconite and some muscovite. Soft at 12.5 ft.
15.0- 15.7 Sand, pale-yellowish-brown (10YR 6/2), fine- to medium-grained. Wet. Contains fine-grained glauconite.
15.7- 16.4 Clayey sand, pale-olive (10Y 6/2), medium-grained to granule-size. Contains some muscovite.
16.4- 16.8 Sand, light-olive-gray (5Y 5/2), medium-grained. Wet. Contains some fine-grained glauconite.
16.8- 17.0 Sand, dark-yellowish-orange (10YR 6/6), medium-grained.
17.0-20.0 No recovery.
20.0-22.0 Sand, pale-yellowish-brown (10YR 6/2), poorly sorted, fine-grained to granule-size, predominantly medium- grained. Wet.
22.0-27.0 Sand and conglomerate, dusky-yellow (5Y 6/4) to light-olive-gray (5Y 5/2), poorly sorted, fine-grained to pebble-size, predominantly medium-grained. Pebbles are rounded. Contains some fine-grained glauconite.
27.0-30.0 No recovery. Interval soft.
30.0-32.0 Silt, olive-gray (5Y 3/2), micaceous. Moist, not wet. Contains some fine-grained sand and sparse very-coarse grained to granule-size quartz.
Well 9 (54Q 33)
0-0.1 Clay and leaf matter, grayish-brown (5YR 3/2) to moderate-brown (5YR 3/4).
.1- 2.0 Silry clay, pale-yellowish-brown (10YR 6/2) to dark-yellowish-brown (10YR 4/2), with moderate-yellowish- brown (10YR 5/4) mottling. Contains rootlets.
2.0- 5.0 Silty clay, dark-yellowish-orange (10YR 6/6). Dry. Moist at 4.5 ft.
5.0- 6.5 Clayey sand, dark-yellowish-orange (10YR 6/6) with yellowish-gray (5Y 7/2) mottles, very-fine- to fine grained. Wet. Contains some fine-grained glauconite.
6.5- 7.0 Clay, yellowish-gray (5Y 7/2), plastic, with dark-yellowish-orange (10YR 6/6) burrows. Contains sparse fine grained glauconite and some muscovite.
7.0- 10.0 Sandy clay, color change from dusky-yellow (5Y 6/4) at 7.0 ft to dusky-yellow (5Y 6/4) to light-olive-brown (5Y 5/6) at 10.0 ft. Sand in clay is fine- to medium-grained. Contains some fine-grained glauconite and some rounded quartz granules and pebbles.
10.0- 12.5 Sandy clay, mottled dark-greenish-yellow (10Y 6/6) and pale-olive (10Y 6/2), poorly sorted, very-fine- tomedium-grained. Contains some fine-grained glauconite and some muscovite.
12.5-15.0 Clayey sand and sandy clay, dark-greenish-yellow (10Y 6/6) to pale-olive (10Y 6/2), very-fine- to fine grained. Contains some fine-grained glauconite and some muscovite.
Tables 23
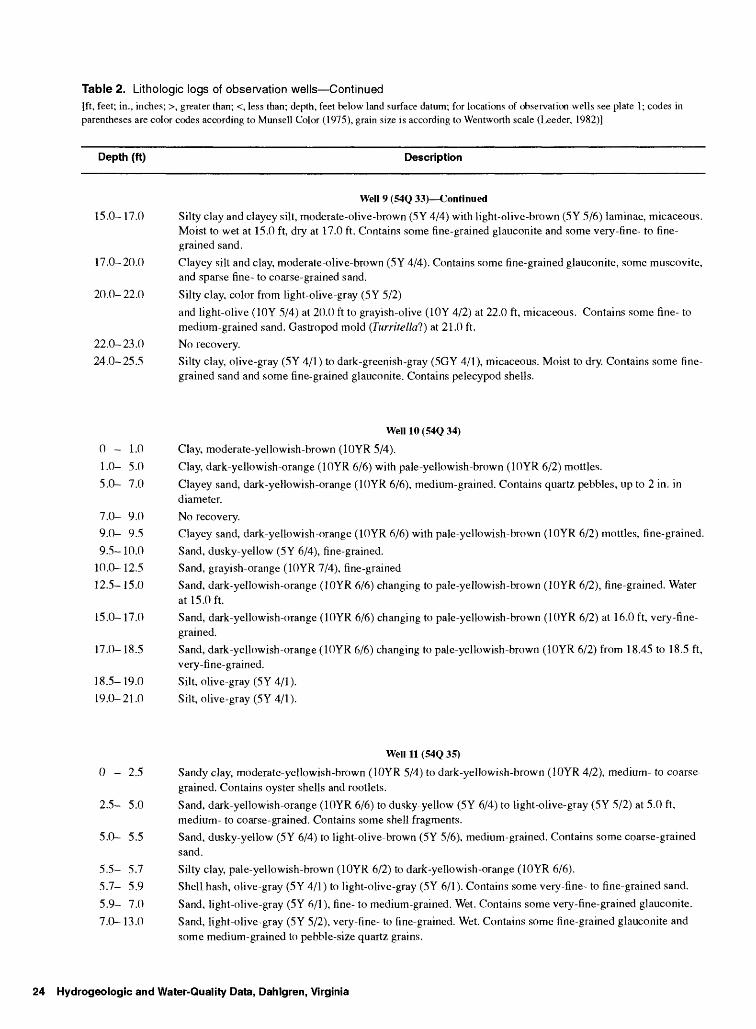
Table 2. Lithologic logs of observation wells Continued[ft, feet; in., inches; >, greater than; <, less than; depth, feet below land surface datum; for locations of observation wells see plate 1; codes in parentheses are color codes according to Munsell Color (1975), grain size is according to Wentworth scale (Leeder, 1982)]
Depth (ft) Description
Well 9 (54Q 33) Continued
15.0-17.0 Silty clay and clayey silt, moderate-olive-brown (5Y 4/4) with light-olive-brown (5Y 5/6) laminae, micaceous. Moist to wet at 15.0 ft, dry at 17.0 ft. Contains some fine-grained glauconite and some very-fine- to fine grained sand.
17.0-20.0 Clayey silt and clay, moderate-olive-brown (5Y 4/4). Contains some fine-grained glauconite, some muscovite, and sparse fine- to coarse-grained sand.
20.0- 22.0 Silty clay, color from light-olive-gray (5Y 5/2)
and light-olive (10Y 5/4) at 20.0 ft to grayish-olive (10Y 4/2) at 22.0 ft, micaceous. Contains some fine- to medium-grained sand. Gastropod mold (Turritellal) at 21.0 ft.
22.0-23.0 No recovery.
24.0-25.5 Silty clay, olive-gray (5Y 4/1) to dark-greenish-gray (5GY 4/1), micaceous. Moist to dry. Contains some fine grained sand and some fine-grained glauconite. Contains pelecypod shells.
Well 10 (54Q 34)
0 - 1.0 Clay, moderate-yellowish-brown (10YR 5/4).
1.0- 5.0 Clay, dark-yellowish-orange (10YR 6/6) with pale-yellowish-brown (10YR 6/2) mottles.
5.0- 7.0 Clayey sand, dark-yeHowish-orange (10YR 6/6), medium-grained. Contains quartz pebbles, up to 2 in. indiameter.
7.0- 9.0 No recovery.
9.0- 9.5 Clayey sand, dark-yellowish-orange (10YR 6/6) with pale-yellowish-brown (10YR 6/2) mottles, fine-grained.
9.5- 10.0 Sand, dusky-yellow (5Y 6/4), fine-grained.
10.0- 12.5 Sand, grayish-orange (10YR 7/4), fine-grained
12.5- 15.0 Sand, dark-yellowish-orange (10YR 6/6) changing to pale-yellowish-brown (10YR 6/2), fine-grained. Waterat 15.0 ft.
15.0-17.0 Sand, dark-yellowish-orange (10YR 6/6) changing to pale-yellowish-brown (10YR 6/2) at 16.0 ft, very-fine grained.
17.0- 18.5 Sand, dark-yellowish-orange (10YR 6/6) changing to pale-yellowish-brown (10YR 6/2) from 18.45 to 18.5 ft,very-fine-grained.
18.5- 19.0 Silt, olive-gray (5Y 4/1).
19.0-21.0 Silt, olive-gray (5Y 4/1).
Well 11 (54Q 35)
0 - 2.5 Sandy clay, moderate-yellowish-brown (10YR 5/4) to dark-yellowish-brown (10YR 4/2), medium- to coarse grained. Contains oyster shells and rootlets.
2.5- 5.0 Sand, dark-yellowish-orange (10YR 6/6) to dusky-yellow (5Y 6/4) to light-olive-gray (5Y 5/2) at 5.0 ft, medium- to coarse-grained. Contains some shell fragments.
5.0- 5.5 Sand, dusky-yellow (5Y 6/4) to light-olive-brown (5Y 5/6), medium-grained. Contains some coarse-grained sand.
5.5- 5.7 Silty clay, pale-yellowish-brown (10YR 6/2) to dark-yellowish-orange (10YR 6/6).
5.7- 5.9 Shell hash, olive-gray (5Y 4/1) to light-olive-gray (5Y 6/1). Contains some very-fine- to fine-grained sand.
5.9- 7.0 Sand, light-olive-gray (5Y 6/1), fine- to medium-grained. Wet. Contains some very-fine-grained glauconite.
7.0- 13.0 Sand, light-olive-gray (5Y 5/2), very-fine- to fine-grained. Wet. Contains some fine-grained glauconite and some medium-grained to pebble-size quartz grains.
24 Hydrogeologic and Water-Quality Data, Dahlgren, Virginia
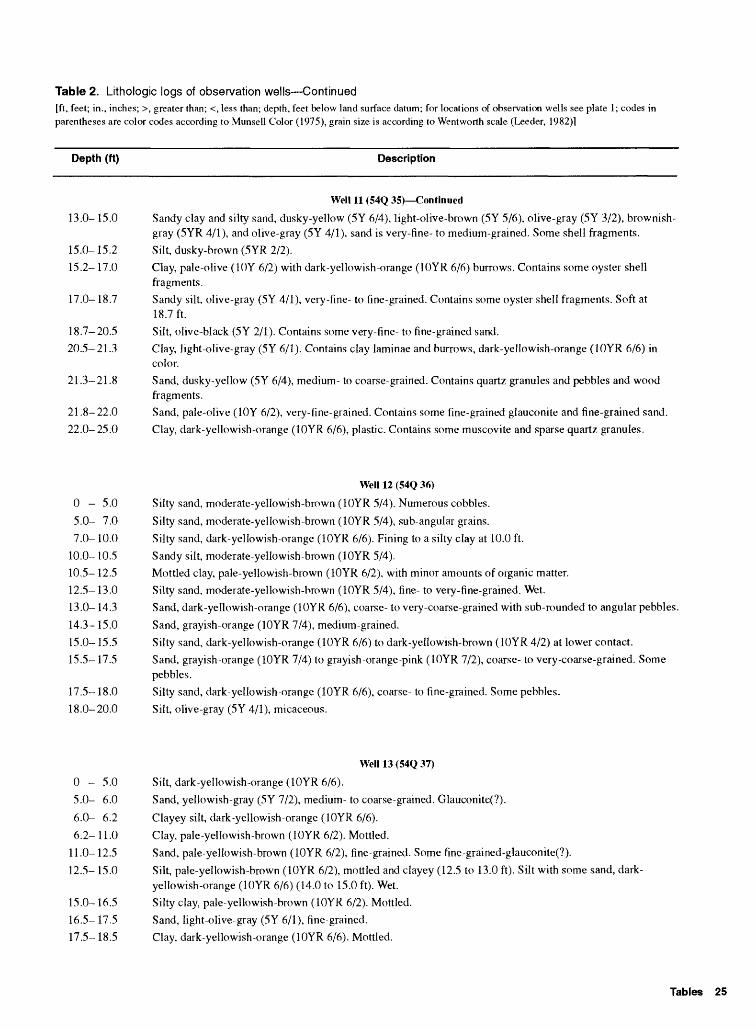
Table 2. Lithologic logs of observation wells Continued[ft, feet; in., inches; >, greater than; <, less than; depth, feet below land surface datum; for locations of observation wells see plate 1; codes in parentheses are color codes according to Munsell Color (1975), grain size is according to Wentworth scale (Leeder, 1982)]
Depth (ft) Description
Well 11 (54Q 35) Continued
13.0- 15.0 Sandy clay and silty sand, dusky-yellow (5Y 6/4), light-olive-brown (5Y 5/6), olive-gray (5Y 3/2), brownish- gray (5YR 4/1), and olive-gray (5Y 4/1), sand is very-fine- to medium-grained. Some shell fragments.
15.0-15.2 Silt, dusky-brown (5YR 2/2).
15.2- 17.0 Clay, pale-olive (10Y 6/2) with dark-yellowish-orange (10YR 6/6) burrows. Contains some oyster shell fragments.
17.0- 18.7 Sandy silt, olive-gray (5Y 4/1), very-fine- to fine-grained. Contains some oyster shell fragments. Soft at 18.7 ft.
18.7- 20.5 Silt, olive-black (5Y 2/1). Contains some very-fine- to fine-grained sand.
20.5-21.3 Clay, light-olive-gray (5Y 6/1). Contains clay laminae and burrows, dark-yellowish-orange (10YR 6/6) in color.
21.3-21.8 Sand, dusky-yellow (5Y 6/4), medium- to coarse-grained. Contains quartz granules and pebbles and wood fragments.
21.8-22.0 Sand, pale-olive (10Y 6/2), very-fine-grained. Contains some fine-grained glauconite and fine-grained sand.
22.0-25.0 Clay, dark-yellowish-orange (10YR 6/6), plastic. Contains some muscovite and sparse quartz granules.
Well 12 (54Q 36)
0 - 5.0 Silty sand, moderate-yellowish-brown (10YR 5/4). Numerous cobbles.
5.0- 7.0 Silty sand, moderate-yellowish-brown (10YR 5/4), sub-angular grains.
7.0- 10.0 Silty sand, dark-yellowish-orange (10YR 6/6). Fining to a silty clay at 10.0 ft.
10.0- 10.5 Sandy silt, moderate-yellowish-brown (10YR 5/4).
10.5- 12.5 Mottled clay, pale-yellowish-brown (10YR 6/2), with minor amounts of organic matter.
12.5- 13.0 Silty sand, moderate-yellowish-brown (10YR 5/4), fine- to very-fine-grained. Wet.
13.0-14.3 Sand, dark-yellowish-orange (10YR 6/6), coarse- to very-coarse-grained with sub-rounded to angular pebbles.
14.3- 15.0 Sand, grayish-orange (10YR 7/4), medium-grained.
15.0-15.5 Silty sand, dark-yellowish-orange (10YR 6/6) to dark-yellowish-brown (10YR 4/2) at lower contact.
15.5- 17.5 Sand, grayish-orange (10YR 7/4) to grayish-orange-pink (10YR 7/2), coarse- to very-coarse-grained. Somepebbles.
17.5- 18.0 Silty sand, dark-yellowish-orange (10YR 6/6), coarse- to fine-grained. Some pebbles.
18.0-20.0 Silt, olive-gray (5Y 4/1), micaceous.
Well 13 (54Q 37)
0 - 5.0 Silt, dark-yellowish-orange (10YR 6/6).
5.0- 6.0 Sand, yellowish-gray (5Y 7/2), medium- to coarse-grained. Glauconite(?).
6.0- 6.2 Clayey silt, dark-yellowish-orange (10YR 6/6).
6.2- 11.0 Clay, pale-yellowish-brown (10YR 6/2). Mottled.
11.0- 12.5 Sand, pale-yellowish-brown (10YR 6/2), fine-grained. Some fine-grained-glauconite(?).
12.5- 15.0 Silt, pale-yellowish-brown (10YR 6/2), mottled and clayey (12.5 to 13.0 ft). Silt with some sand, dark- yellowish-orange (10YR 6/6) (14.0 to 15.0 ft). Wet.
15.0- 16.5 Silty clay, pale-yellowish-brown (10YR 6/2). Mottled.
16.5- 17.5 Sand, light-olive-gray (5Y 6/1), fine-grained.
17.5- 18.5 Clay, dark-yellowish-orange (10YR 6/6). Mottled.
Tables 25
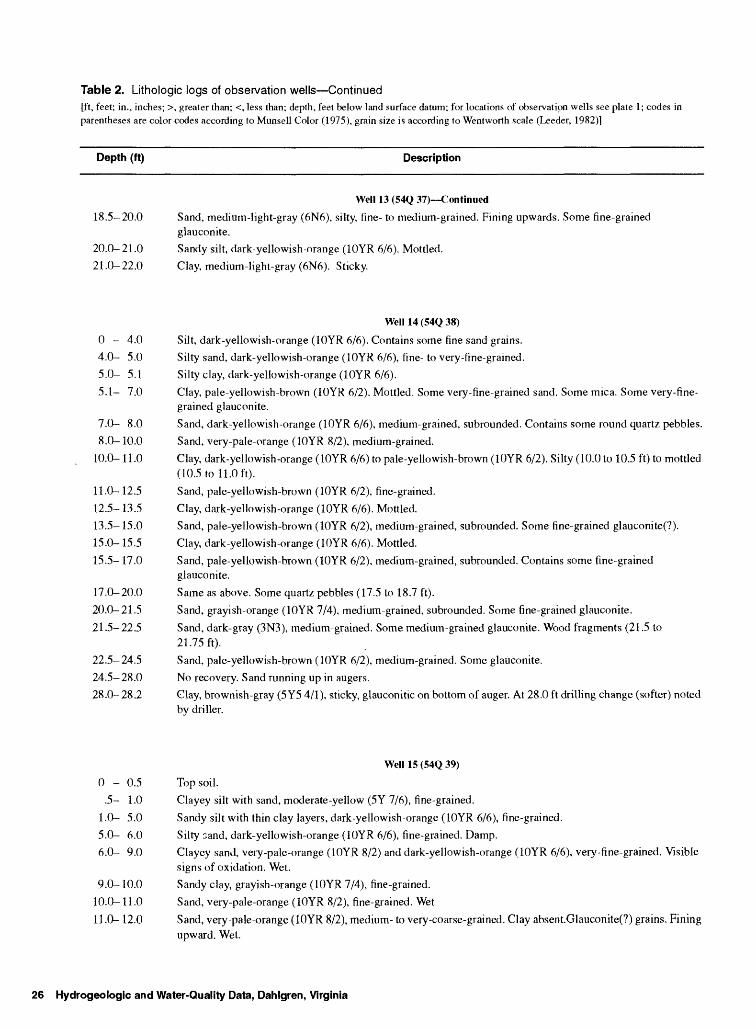
Table 2. Lithologic logs of observation wells Continued[ft, feet; in., inches; >, greater than; <, less than; depth, feet below land surface datum; for locations of observation wells see plate 1; codes in parentheses are color codes according to Munsell Color (1975), grain size is according to Wentworth scale (Leeder, 1982)]
Depth (ft) Description
Well 13 (54Q 37) Continued
18.5-20.0 Sand, medium-light-gray (6N6), silty, fine- to medium-grained. Fining upwards. Some fine-grainedglauconite.
20.0- 21.0 Sandy silt, dark-yellowish-orange (10YR 6/6). Mottled.
21.0-22.0 Clay, medium-light-gray (6N6). Sticky.
Well 14 (54Q 38)
0 - 4.0 Silt, dark-yellowish-orange (10YR 6/6). Contains some fine sand grains.
4.0- 5.0 Silty sand, dark-yellowish-orange (10YR 6/6), fine- to very-fine-grained.
5.0- 5.1 Silty clay, dark-yellowish-orange (10YR 6/6).
5.1- 7.0 Clay, pale-yellowish-brown (10YR 6/2). Mottled. Some very-fine-grained sand. Some mica. Some very-fine grained glauconite.
7.0- 8.0 Sand, dark-yellowish-orange (10YR 6/6), medium-grained, subrounded. Contains some round quartz pebbles.
8.0-10.0 Sand, very-pale-orange (10YR 8/2), medium-grained.
10.0- 11.0 Clay, dark-yellowish-orange (10YR 6/6) to pale-yellowish-brown (10YR 6/2). Silty (10.0 to 10.5 ft) to mottled(10.5 to 11.0ft).
11.0- 12.5 Sand, pale-yellowish-brown (10YR 6/2), fine-grained.
12.5- 13.5 Clay, dark-yellowish-orange (10YR 6/6). Mottled.
13.5 15.0 Sand, pale-yellowish-brown (10YR 6/2), medium-grained, subrounded. Some fine-grained glauconite(?).
15.0- 15.5 Clay, dark-yellowish-orange (10YR 6/6). Mottled.
15.5- 17.0 Sand, pale-yellowish-brown (10YR 6/2), medium-grained, subrounded. Contains some fine-grainedglauconite.
17.0-20.0 Same as above. Some quartz pebbles (17.5 to 18.7 ft).
20.0-21.5 Sand, grayish-orange (10YR 7/4), medium-grained, subrounded. Some fine-grained glauconite.
21.5-22.5 Sand, dark-gray (3N3), medium-grained. Some medium-grained glauconite. Wood fragments (21.5 to21.75 ft).
22.5-24.5 Sand, pale-yellowish-brown (10YR 6/2), medium-grained. Some glauconite.
24.5-28.0 No recovery. Sand running up in augers.
28.0- 28.2 Clay, brownish-gray (5 Y5 4/1), sticky, glauconitic on bottom of auger. At 28.0 ft drilling change (softer) notedby driller.
Well 15 (54Q 39)
0 - 0.5 Top soil.
.5- 1.0 Clayey silt with sand, moderate-yellow (5Y 7/6), fine-grained.
I.0- 5.0 Sandy silt with thin clay layers, dark-yellowish-orange (10YR 6/6), fine-grained.
5.0- 6.0 Silty sand, dark-yellowish-orange (10YR 6/6), fine-grained. Damp.
6.0- 9.0 Clayey sand, very-pale-orange (10YR 8/2) and dark-yellowish-orange (10YR 6/6), very-fine-grained. Visiblesigns of oxidation. Wet.
9.0-10.0 Sandy clay, grayish-orange (10YR 7/4), fine-grained.
10.0-11.0 Sand, very-pale-orange (10YR 8/2), fine-grained. Wet
II.0- 12.0 Sand, very-pale-orange (10YR 8/2), medium- to very-coarse-grained. Clay absent.Glauconite(?) grains. Fining upward. Wet.
26 Hydrogeologic and Water-Quality Data, Dahlgren, Virginia
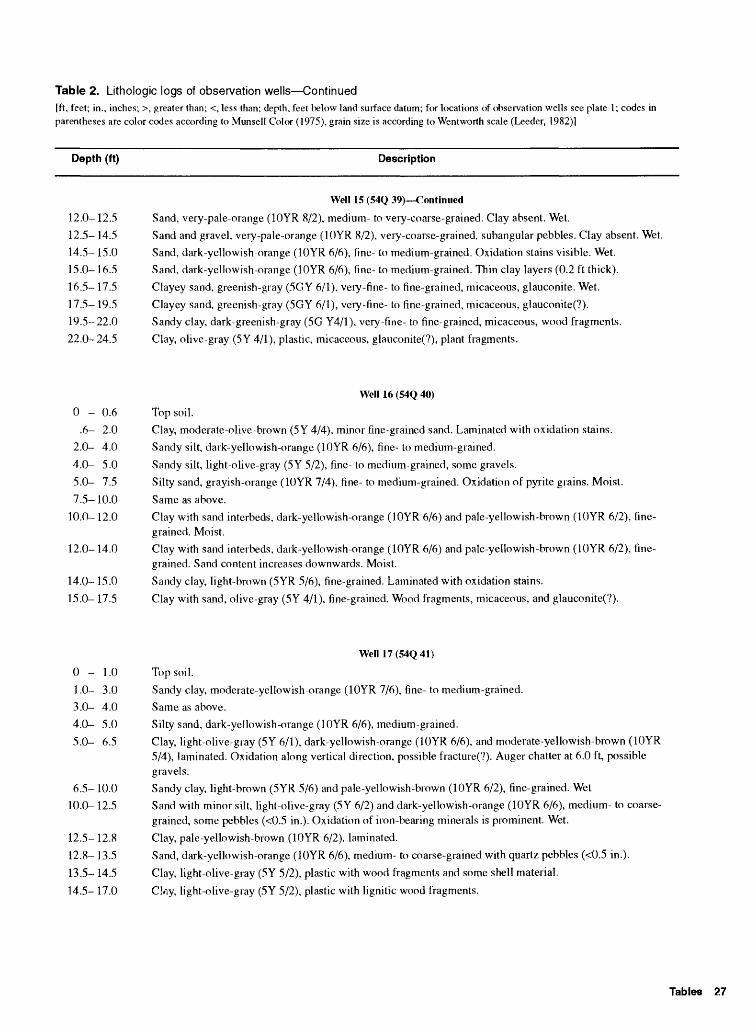
Table 2. Lithologic logs of observation wells Continued[ft, feet; in., inches; >, greater than; <, less than; depth, feet below land surface datum; for locations of observation wells see plate 1; codes in parentheses are color codes according to Munsell Color (1975), grain size is according to Wentworth scale (Leeder, 1982)]
Depth (ft) Description
Well 15 (54Q 39) Continued
12.0- 12.5 Sand, very-pale-orange (10YR 8/2), medium- to very-coarse-grained. Clay absent. Wet.
12.5-14.5 Sand and gravel, very-pale-orange (10YR 8/2), very-coarse-grained, subangular pebbles. Clay absent. Wet.
14.5-15.0 Sand, dark-yellowish-orange (10YR 6/6), fine- to medium-grained. Oxidation stains visible. Wet.
15.0- 16.5 Sand, dark-yellowish-orange (10YR 6/6), fine- to medium-grained. Thin clay layers (0.2 ft thick).
16.5- 17.5 Clayey sand, greenish-gray (5GY 6/1), very-fine- to fine-grained, micaceous, glauconite. Wet.
17.5- 19.5 Clayey sand, greenish-gray (5GY 6/1), very-fine- to fine-grained, micaceous, glauconite(?).
19.5-22.0 Sandy clay, dark-greenish-gray (5G Y4/1), very-fine- to fine-grained, micaceous, wood fragments.
22.0-24.5 Clay, olive-gray (5Y 4/1), plastic, micaceous, glauconite(?), plant fragments.
Well 16 (54Q 40)
0 - 0.6 Top soil.
.6- 2.0 Clay, moderate-olive-brown (5Y 4/4), minor fine-grained sand. Laminated with oxidation stains.
2.0- 4.0 Sandy silt, dark-yellowish-orange (10YR 6/6), fine- to medium-grained.
4.0- 5.0 Sandy silt, light-olive-gray (5Y 5/2), fine- to medium-grained, some gravels.
5.0- 7.5 Silty sand, grayish-orange (10YR 7/4), fine- to medium-grained. Oxidation of pyrite grains. Moist.
7.5- 10.0 Same as above.
10.0- 12.0 Clay with sand interbeds, dark-yellowish-orange (10YR 6/6) and pale-yellowish-brown (10YR 6/2), fine grained. Moist.
12.0- 14.0 Clay with sand interbeds, dark-yellowish-orange (10YR 6/6) and pale-yellowish-brown (10YR 6/2), fine grained. Sand content increases downwards. Moist.
14.0- 15.0 Sandy clay, light-brown (5YR 5/6), fine-grained. Laminated with oxidation stains.
15.0- 17.5 Clay with sand, olive-gray (5Y 4/1), fine-grained. Wood fragments, micaceous, and glauconite(?).
Well 17 (54Q 41)
0-1.0 Top soil.
1.0 3.0 Sandy clay, moderate-yellowish-orange (10YR 7/6), fine- to medium-grained.
3.0- 4.0 Same as above.
4.0- 5.0 Silty sand, dark-yellowish-orange (10YR 6/6), medium-grained.
5.0- 6.5 Clay, light-olive-gray (5Y 6/1), dark-yellowish-orange (10YR 6/6), and moderate-yellowish-brown (10YR 5/4), laminated. Oxidation along vertical direction, possible fracture(?). Auger chatter at 6.0 ft, possible gravels.
6.5- 10.0 Sandy clay, light-brown (5YR 5/6) and pale-yellowish-brown (10YR 6/2), fine-grained. Wet
10.0-12.5 Sand with minor silt, light-olive-gray (5Y 6/2) and dark-yellowish-orange (10YR 6/6), medium- to coarse grained, some pebbles (<0.5 in.). Oxidation of iron-bearing minerals is prominent. Wet.
12.5- 12.8 Clay, pale-yellowish-brown (10YR 6/2), laminated.
12.8- 13.5 Sand, dark-yellowish-orange (10YR 6/6), medium- to coarse-grained with quartz pebbles (<0.5 in.).
13.5- 14.5 Clay, light-olive-gray (5Y 5/2), plastic with wood fragments and some shell material.
14.5- 17.0 Cky, light-olive-gray (5Y 5/2), plastic with lignitic wood fragments.
Tables 27
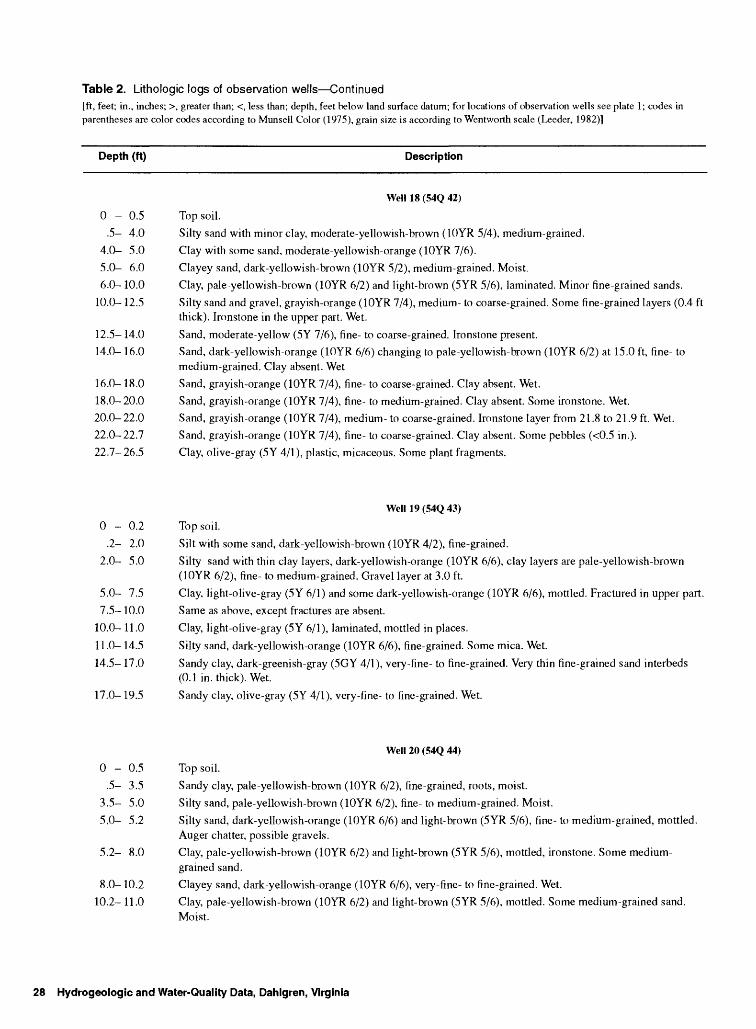
Table 2. Lithologic logs of observation wells Continued[ft, feet; in., inches; >, greater than; <, less than; depth, feet below land surface datum; for locations of observation wells see plate 1; codes in parentheses are color codes according to Munsell Color (1975), grain size is according to Wentworth scale (Leeder, 1982)]
Depth (ft) Description
Well 18 (54Q 42)
0 - 0.5 Top soil.
.5- 4.0 Silty sand with minor clay, moderate-yellowish-brown (10YR 5/4), medium-grained.
4.0- 5.0 Clay with some sand, moderate-yellowish-orange (10YR 7/6).
5.0- 6.0 Clayey sand, dark-yellowish-brown (10YR 5/2), medium-grained. Moist.
6.0- 10.0 Clay, pale-yellowish-brown (10YR 6/2) and light-brown (5YR 5/6), laminated. Minor fine-grained sands.
10.0- 12.5 Silty sand and gravel, grayish-orange (10YR 7/4), medium- to coarse-grained. Some fine-grained layers (0.4 ft thick). Ironstone in the upper part. Wet.
12.5-14.0 Sand, moderate-yellow (5Y 7/6), fine- to coarse-grained. Ironstone present.
14.0- 16.0 Sand, dark-yellowish-orange (10YR 6/6) changing to pale-yellowish-brown (10YR 6/2) at 15.0 ft, fine- tomedium-grained. Clay absent. Wet
16.0- 18.0 Sand, grayish-orange (10YR 7/4), fine- to coarse-grained. Clay absent. Wet.
18.0-20.0 Sand, grayish-orange (10YR 7/4), fine- to medium-grained. Clay absent. Some ironstone. Wet.
20.0-22.0 Sand, grayish-orange (10YR 7/4), medium- to coarse-grained. Ironstone layer from 21.8 to 21.9 ft. Wet.
22.0-22.7 Sand, grayish-orange (10YR 7/4), fine- to coarse-grained. Clay absent. Some pebbles (<0.5 in.).
22.7-26.5 Clay, olive-gray (5Y 4/1), plastic, micaceous. Some plant fragments.
Well 19 (54Q 43)
0 - 0.2 Top soil.
.2- 2.0 Silt with some sand, dark-yellowish-brown (10YR 4/2), fine-grained.
2.0- 5.0 Silty sand with thin clay layers, dark-yellowish-orange (10YR 6/6), clay layers are pale-yellowish-brown(10YR 6/2), fine- to medium-grained. Gravel layer at 3.0 ft.
5.0- 7.5 Clay, light-olive-gray (5Y 6/1) and some dark-yellowish-orange (10YR 6/6), mottled. Fractured in upper part.
7.5- 10.0 Same as above, except fractures are absent.
10.0- 11.0 Clay, light-olive-gray (5Y 6/1), laminated, mottled in places.
11.0- 14.5 Silty sand, dark-yellowish-orange (10YR 6/6), fine-grained. Some mica. Wet.
14.5- 17.0 Sandy clay, dark-greenish-gray (5GY 4/1), very-fine- to fine-grained. Very thin fine-grained sand interbeds (0.1 in. thick). Wet.
17.0- 19.5 Sandy clay, olive-gray (5Y 4/1), very-fine- to fine-grained. Wet.
Well 20 (54Q 44)
0 - 0.5 Top soil.
.5- 3.5 Sandy clay, pale-yellowish-brown (10YR 6/2), fine-grained, roots, moist.
3.5- 5.0 Silty sand, pale-yellowish-brown (10YR 6/2), fine- to medium-grained. Moist.
5.0- 5.2 Silty sand, dark-yellowish-orange (10YR 6/6) and light-brown (5YR 5/6), fine- to medium-grained, mottled. Auger chatter, possible gravels.
5.2- 8.0 Clay, pale-yellowish-brown (10YR 6/2) and light-brown (5YR 5/6), mottled, ironstone. Some medium- grained sand.
8.0- 10.2 Clayey sand, dark-yellowish-orange (10YR 6/6), very-fine- to fine-grained. Wet.
10.2- 11.0 Clay, pale-yellowish-brown (10YR 6/2) and light-brown (5YR 5/6), mottled. Some medium-grained sand. Moist.
28 Hydrogeologic and Water-Quality Data, Dahlgren, Virginia
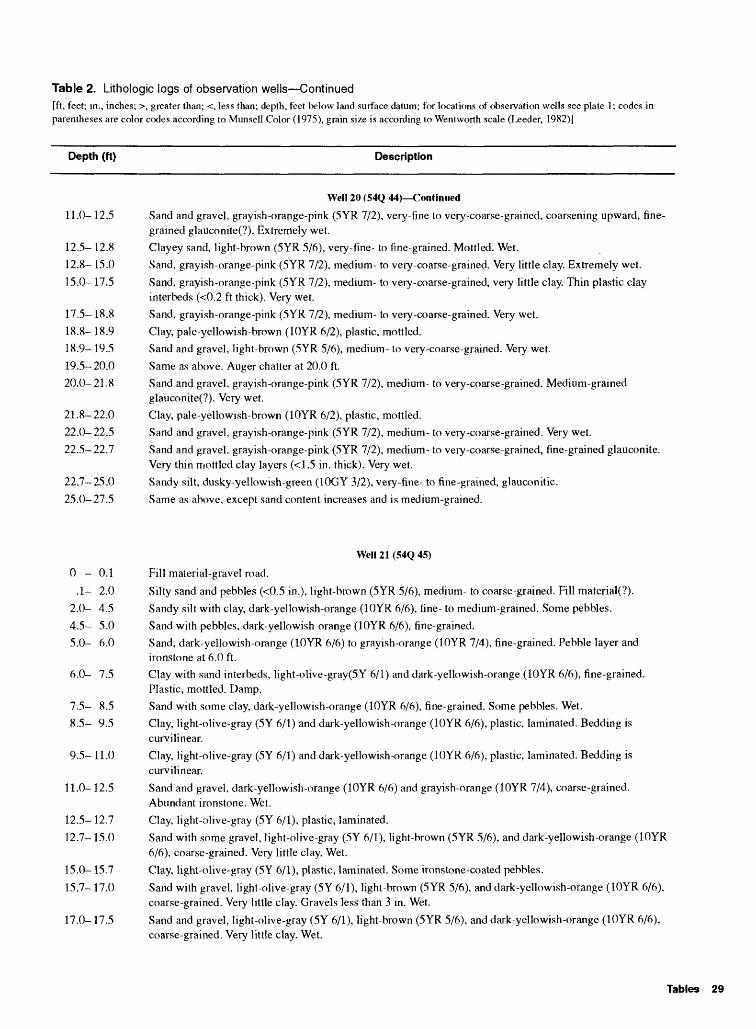
Table 2. Lithologic logs of observation wells Continuedfft, feet; in., inches; >, greater than; <, less than; depth, feet below land surface datum; for locations of observation wells see plate 1; codes in parentheses are color codes according to Munsell Color (1975), grain size is according to Wentworth scale (Leeder, 1982)]
Depth (ft) Description
Well 20 (54Q 44) Continued
11.0-12.5 Sand and gravel, grayish-orange-pink (SYR 7/2), very-fine to very-coarse-grained, coarsening upward, fine grained glauconite(?). Extremely wet.
12.5- 12.8 Clayey sand, light-brown (5YR 5/6), very-fine- to fine-grained. Mottled. Wet.
12.8- 15.0 vSand, grayish-orange-pink (5YR 7/2), medium- to very-coarse-grained. Very little clay. Extremely wet.
15.0-17.5 Sand, grayish-orange-pink (5YR 7/2), medium- to very-coarse-grained, very little clay. Thin plastic clay interbeds (<0.2 ft thick). Very wet.
17.5-18.8 Sand, grayish-orange-pink (5YR 7/2), medium- to very-coarse-grained. Very wet.
18.8- 18.9 Clay, pale-yellowish-brown (10YR 6/2), plastic, mottled.
18.9- 19.5 Sand and gravel, light-brown (SYR 5/6), medium- to very-coarse-grained. Very wet.
19.5- 20.0 Same as above. Auger chatter at 20.0 ft.
20.0-21.8 Sand and gravel, grayish-orange-pink (5YR 7/2), medium- to very-coarse-grained. Medium-grainedglauconite(?). Very wet.
21.8- 22.0 Clay, pale-yellowish-brown (10YR 6/2), plastic, mottled.
22.0-22.5 Sand and gravel, grayish-orange-pink (5YR 7/2), medium- to very-coarse-grained. Very wet.
22.5-22.7 Sand and gravel, grayish-orange-pink (5YR 7/2), medium- to very-coarse-grained, fine-grained glauconite.Very thin mottled clay layers (<1.5 in. thick). Very wet.
22.7-25.0 Sandy silt, dusky-yellowish-green (10GY 3/2), very-fine- to fine-grained, glauconitic.
25.0-27.5 Same as above, except sand content increases and is medium-grained.
Well 21 (54Q 45)
0 - 0.1 Fill material-gravel road.
.1- 2.0 Silty sand and pebbles (<0.5 in.), light-brown (5YR 5/6), medium- to coarse-grained. Fill material(?).
2.0- 4.5 Sandy silt with clay, dark-yellowish-orange (10YR 6/6), fine- to medium-grained. Some pebbles.
4.5- 5.0 Sand with pebbles, dark-yellowish-orange (10YR 6/6), fine-grained.
5.0- 6.0 Sand, dark-yellowish-orange (10YR 6/6) to grayish-orange (10YR 7/4), fine-grained. Pebble layer andironstone at 6.0 ft.
6.0- 7.5 Clay with sand interbeds, light-olive-gray(5Y 6/1) and dark-yellowish-orange (10YR 6/6), fine-grained.Plastic, mottled. Damp.
7.5- 8.5 Sand with some clay, dark-yellowish-orange (10YR 6/6), fine-grained. Some pebbles. Wet.
8.5- 9.5 Clay, light-olive-gray (5Y 6/1) and dark-yellowish-orange (10YR 6/6), plastic, laminated. Bedding iscurvilinear.
9.5- 11.0 Clay, light-olive-gray (5Y 6/1) and dark-yellowish-orange (10YR 6/6), plastic, laminated. Bedding iscurvilinear.
11.0- 12.5 Sand and gravel, dark-yellowish-orange (10YR 6/6) and grayish-orange (10YR 7/4), coarse-grained.Abundant ironstone. Wet.
12.5- 12.7 Clay, light-olive-gray (5Y 6/1), plastic, laminated.
12.7- 15.0 Sand with some gravel, light-olive-gray (5Y 6/1), light-brown (5YR 5/6), and dark-yellowish-orange (10YR6/6), coarse-grained. Very little clay. Wet.
15.0-15.7 Clay, light-olive-gray (5Y 6/1), plastic, laminated. Some ironstone-coated pebbles.
15.7- 17.0 Sand with gravel, light-olive-gray (5Y 6/1), light-brown (5YR 5/6), and dark-yellowish-orange (10YR 6/6),coarse-grained. Very little clay. Gravels less than 3 in. Wet.
17.0- 17.5 Sand and gravel, light-olive-gray (5Y 6/1), light-brown (5YR 5/6), and dark-yellowish-orange (10YR 6/6), coarse-grained. Very little clay. Wet.
Tables 29
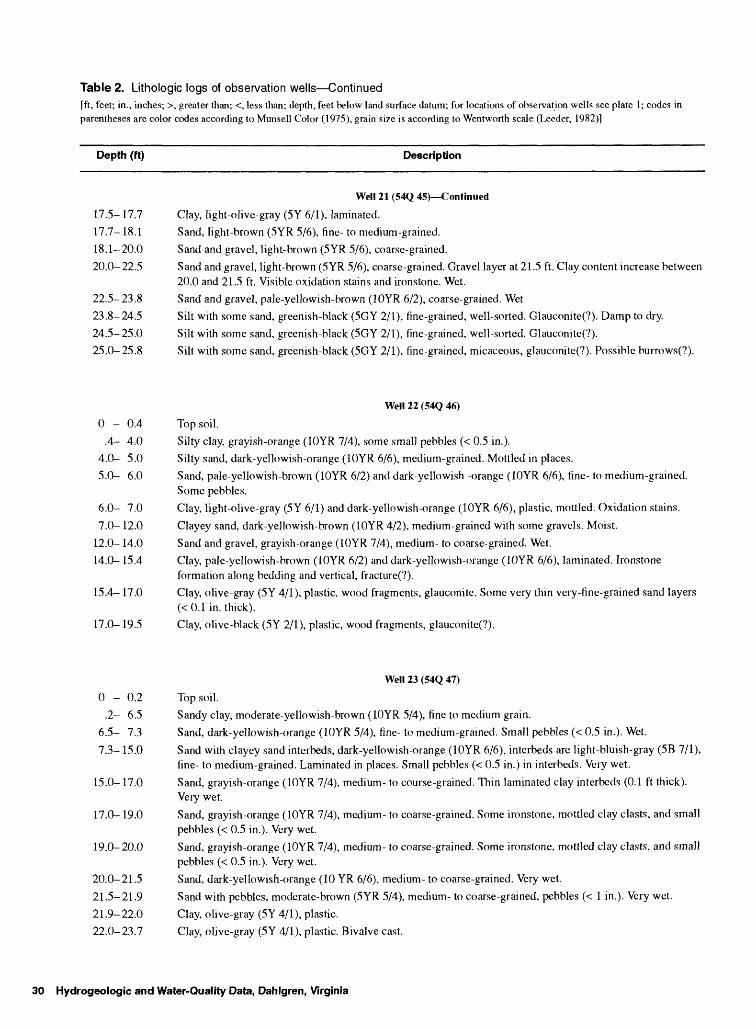
Table 2. Lithologic logs of observation wells Continuedfft, feet; in., inches; >, greater than; <, less than; depth, feet below land surface datum; for locations of observation wells see plate 1; codes in parentheses are color codes according to Munsell Color (1975), grain si/e is according to Wentworth scale (Leeder, 1982)]
Depth (ft) Description
Well 21 (54Q 45) Continued
17.5- 17.7 Clay, light-olive-gray (5Y 6/1), laminated.
17.7-18.1 Sand, light-brown (5YR 5/6), fine- to medium-grained.
18.1-20.0 Sand and gravel, light-brown (5YR 5/6), coarse-grained.
20.0-22.5 Sand and gravel, light-brown (SYR 5/6), coarse-grained. Gravel layer at 21.5 ft. Clay content increase between20.0 and 21.5 ft. Visible oxidation stains and ironstone. Wet.
22.5-23.8 Sand and gravel, pale-yellowish-brown (10YR 6/2), coarse-grained. Wet
23.8-24.5 Silt with some sand, greenish-black (5GY 2/1), fine-grained, well-sorted. Glauconite(?). Damp to dry.
24.5-25.0 Silt with some sand, greenish-black (5GY 2/1), fine-grained, well-sorted. Glauconite(?).
25.0-25.8 Silt with some sand, greenish-black (5GY 2/1), fine-grained, micaceous, glauconite(?). Possible burrows(?).
Well 22 (54Q 46)
0 - 0.4 Top soil.
.4- 4.0 Silty clay, grayish-orange (10YR 7/4), some small pebbles (< 0.5 in.).
4.0- 5.0 Silty sand, dark-yellowish-orange (10YR 6/6), medium-grained. Mottled in places.
5.0- 6.0 Sand, pale-yellowish-brown (10YR 6/2) and dark-yellowish -orange (10YR 6/6), fine- to medium-grained.Some pebbles.
6.0- 7.0 Clay, light-olive-gray (5Y 6/1) and dark-yellowish-orange (10YR 6/6), plastic, mottled. Oxidation stains.
7.0-12.0 Clayey sand, dark-yellowish-brown (10YR 4/2), medium-grained with some gravels. Moist.
12.0- 14.0 Sand and gravel, grayish-orange (10YR 7/4), medium- to coarse-grained. Wet.
14.0- 15.4 Clay, pale-yellowish-brown (10YR 6/2) and dark-yellowish-orange (10YR 6/6), laminated. Ironstoneformation along bedding and vertical, fracture(?).
15.4-17.0 Clay, olive-gray (5Y 4/1), plastic, wood fragments, glauconite. Some very thin very-fine-grained sand layers(<0.1 in. thick).
17.0-19.5 Clay, olive-black (5Y 2/1), plastic, wood fragments, glauconite(?).
Well 23 (54Q 47)
0 - 0.2 Top soil.
.2- 6.5 Sandy clay, moderate-yellowish-brown (10YR 5/4), fine to medium grain.
6.5- 7.3 Sand, dark-yellowish-orange (10YR 5/4), fine- to medium-grained. Small pebbles (< 0.5 in.). Wet.
7.3- 15.0 Sand with clayey sand interbeds, dark-yellowish-orange (10YR 6/6), interbeds are light-bluish-gray (5B 7/1),fine- to medium-grained. Laminated in places. Small pebbles (< 0.5 in.) in interbeds. Very wet.
15.0-17.0 Sand, grayish-orange (10YR 7/4), medium- to course-grained. Thin laminated clay interbeds (0.1 ft thick).Very wet.
17.0-19.0 Sand, grayish-orange (10YR 7/4), medium- to coarse-grained. Some ironstone, mottled clay clasts, and smallpebbles (< 0.5 in.). Very wet.
19.0-20.0 Sand, grayish-orange (10YR 7/4), medium- to coarse-grained. Some ironstone, mottled clay clasts, and smallpebbles (< 0.5 in.). Very wet.
20.0-21.5 Sand, dark-yellowish-orange (10 YR 6/6), medium- to coarse-grained. Very wet.
21.5-21.9 Sand with pebbles, moderate-brown (5YR 5/4), medium- to coarse-grained, pebbles (< 1 in.). Very wet.
21.9- 22.0 Clay, olive-gray (5Y 4/1), plastic.
22.0-23.7 Clay, olive-gray (5Y 4/1), plastic. Bivalve cast.
30 Hydrogeologic and Water-Quality Data, Dahlgren, Virginia
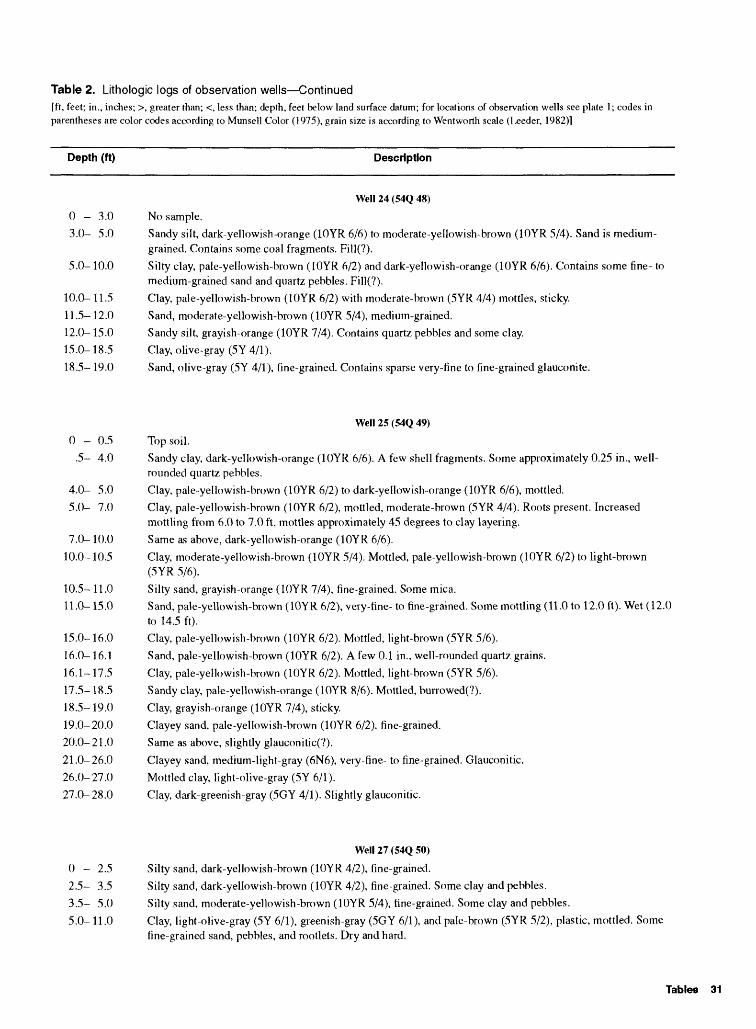
Table 2. Lithologic logs of observation wells Continued[ft, feet; in., inches; >, greater than; <, less than; depth, feet below land surface datum; for locations of observation wells see plate 1; codes in parentheses are color codes according to Munsell Color (1975), grain size is according to Wentworth scale (Leeder, 1982)]
Depth (ft) Description
Well 24 (54Q 48)
0-3.0 No sample.
3.0- 5.0 Sandy silt, dark-yellowish-orange (10YR 6/6) to moderate-yellowish-brown (10YR 5/4). Sand is medium- grained. Contains some coal fragments. Fill(?).
5.0- 10.0 Silty clay, pale-yellowish-brown (10YR 6/2) and dark-yellowish-orange (10YR 6/6). Contains some fine- tomedium-grained sand and quartz pebbles. Fill(?).
10.0- 11.5 Clay, pale-yellowish-brown (10YR 6/2) with moderate-brown (5YR 4/4) mottles, sticky.
11.5- 12.0 Sand, moderate-yellowish-brown (10YR 5/4), medium-grained.
12.0- 15.0 Sandy silt, grayish-orange (10YR 7/4). Contains quartz pebbles and some clay.
15.0- 18.5 Clay, olive-gray (5Y 4/1).
18.5- 19.0 Sand, olive-gray (5Y 4/1), fine-grained. Contains sparse very-fine to fine-grained glauconite.
Well 25 (54Q 49)
0 - 0.5 Top soil.
.5- 4.0 Sandy clay, dark-yellowish-orange (10YR 6/6). A few shell fragments. Some approximately 0.25 in., well- rounded quartz pebbles.
4.0- 5.0 Clay, pale-yellowish-brown (10YR 6/2) to dark-yellowish-orange (10YR 6/6), mottled.
5.0- 7.0 Clay, pale-yellowish-brown (10YR 6/2), mottled, moderate-brown (5YR 4/4). Roots present. Increasedmottling from 6.0 to 7.0 ft, mottles approximately 45 degrees to clay layering.
7.0- 10.0 Same as above, dark-yellowish-orange (10YR 6/6).
10.0- 10.5 Clay, moderate-yellowish-brown (10YR 5/4). Mottled, pale-yellowish-brown (10YR 6/2) to light-brown(5YR 5/6).
10.5- 11.0 Silty sand, grayish-orange (10YR 7/4), fine-grained. Some mica.
11.0- 15.0 Sand, pale-yellowish-brown (10YR 6/2), very-fine- to fine-grained. Some mottling (11.0 to 12.0 ft). Wet (12.0to 14.5 ft).
15.0- 16.0 Clay, pale-yellowish-brown (10YR 6/2). Mottled, light-brown (5YR 5/6).
16.0- 16.1 Sand, pale-yellowish-brown (10YR 6/2). A few 0.1 in., well-rounded quartz grains.
16.1- 17.5 Clay, pale-yellowish-brown (10YR 6/2). Mottled, light-brown (5YR 5/6).
17.5- 18.5 Sandy clay, pale-yellowish-orange (10YR 8/6). Mottled, burrowed(?).
18.5- 19.0 Clay, grayish-orange (10YR 7/4), sticky.
19.0-20.0 Clayey sand, pale-yellowish-brown (10YR 6/2), fine-grained.
20.0-21.0 Same as above, slightly glauconitic(?).
21.0-26.0 Clayey sand, medium-light-gray (6N6), very-fine- to fine-grained. Glauconitic.
26.0- 27.0 Mottled clay, light-olive-gray (5Y 6/1).
27.0-28.0 Clay, dark-greenish-gray (5GY 4/1). Slightly glauconitic.
Well 27 (54Q 50)
0 - 2.5 Silty sand, dark-yellowish-brown (10YR 4/2), fine-grained.
2.5- 3.5 Silty sand, dark-yellowish-brown (10YR 4/2), fine-grained. Some clay and pebbles.
3.5- 5.0 Silty sand, moderate-yellowish-brown (10YR 5/4), fine-grained. Some clay and pebbles.
5.0- 11.0 Clay, light-olive-gray (5Y 6/1), greenish-gray (5GY 6/1), and pale-brown (5YR 5/2), plastic, mottled. Some fine-grained sand, pebbles, and rootlets. Dry and hard.
Tables 31
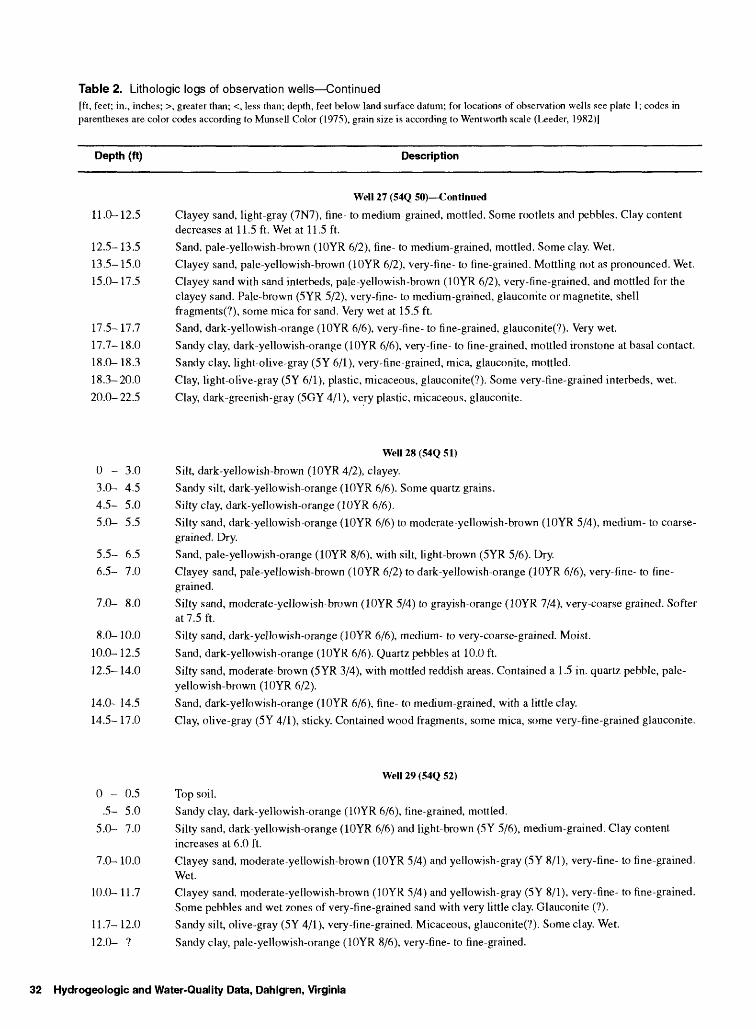
Table 2. Lithologic logs of observation wells Continued[ft, feet; in., inches; >, greater than; <, less than; depth, feet below land surface datum; for locations of observation wells see plate 1; codes in parentheses are color codes according to Munsell Color (1975), grain size is according to Wentworth scale (Leeder, 1982)]
Depth (ft) Description
Well 27 (54Q 50) Continued
11.0- 12.5 Clayey sand, light-gray (7N7), fine- to medium-grained, mottled. Some rootlets and pebbles. Clay contentdecreases at 11.5 ft. Wet at 11.5 ft.
12.5- 13.5 Sand, pale-yellowish-brown (10YR 6/2), fine- to medium-grained, mottled. Some clay. Wet.
13.5- 15.0 Clayey sand, pale-yellowish-brown (10YR 6/2), very-fine- to fine-grained. Mottling not as pronounced. Wet.
15.0- 17.5 Clayey sand with sand interbeds, pale-yellowish-brown (10YR 6/2), very-fine-grained, and mottled for theclayey sand. Pale-brown (5YR 5/2), very-fine- to medium-grained, glauconite or magnetite, shellfragments(?), some mica for sand. Very wet at 15.5 ft.
17.5- 17.7 Sand, dark-yellowish-orange (10YR 6/6), very-fine- to fine-grained, glauconite(?). Very wet.
17.7- 18.0 Sandy clay, dark-yellowish-orange (10YR 6/6), very-fine- to fine-grained, mottled ironstone at basal contact.
18.0- 18.3 Sandy clay, light-olive-gray (5Y 6/1), very-fine-grained, mica, glauconite, mottled.
18.3-20.0 Clay, light-olive-gray (5Y 6/1), plastic, micaceous, glauconite(?). Some very-fine-grained interbeds, wet.
20.0- 22.5 Clay, dark-greenish-gray (5GY 4/1), very plastic, micaceous, glauconite.
Well 28 (54Q 51)
0 - 3.0 Silt, dark-yellowish-brown (10YR 4/2), clayey.
3.0- 4.5 Sandy silt, dark-yellowish-orange (10YR 6/6). Some quartz grains.
4.5- 5.0 Silty clay, dark-yellowish-orange (10YR 6/6).
5.0- 5.5 Silty sand, dark-yellowish-orange (10YR 6/6) to moderate-yellowish-brown (10YR 5/4), medium- to coarse grained. Dry.
5.5- 6.5 Sand, pale-yellowish-orange (10YR 8/6), with silt, light-brown (5YR 5/6). Dry.
6.5- 7.0 Clayey sand, pale-yellowish-brown (10YR 6/2) to dark-yellowish-orange (10YR 6/6), very-fine- to fine grained.
7.0- 8.0 Silty sand, moderate-yellowish-brown (10YR 5/4) to grayish-orange (10YR 7/4), very-coarse grained. Softerat 7.5 ft.
8.0- 10.0 Silty sand, dark-yellowish-orange (10YR 6/6), medium- to very-coarse-grained. Moist.
10.0- 12.5 Sand, dark-yellowish-orange (10YR 6/6). Quartz pebbles at 10.0 ft.
12.5- 14.0 Silty sand, moderate-brown (5YR 3/4), with mottled reddish areas. Contained a 1.5 in. quartz pebble, pale- yellowish-brown (10YR 6/2).
14.0- 14.5 Sand, dark-yellowish-orange (10YR 6/6), fine- to medium-grained, with a little clay.
14.5- 17.0 Clay, olive-gray (5Y 4/1), sticky. Contained wood fragments, some mica, some very-fine-grained glauconite.
Well 29 (54Q 52)
0 - 0.5 Top soil.
.5- 5.0 Sandy clay, dark-yellowish-orange (10YR 6/6), fine-grained, mottled.
5.0- 7.0 Silty sand, dark-yellowish-orange (10YR 6/6) and light-brown (5Y 5/6), medium-grained. Clay contentincreases at 6.0 ft.
7.0- 10.0 Clayey sand, moderate-yellowish-brown (10YR 5/4) and yellowish-gray (5Y 8/1), very-fine- to fine-grained.Wet.
10.0- 11.7 Clayey sand, moderate-yellowish-brown (10YR 5/4) and yellowish-gray (5Y 8/1), very-fine- to fine-grained.Some pebbles and wet zones of very-fine-grained sand with very little clay. Glauconite (?).
11.7- 12.0 Sandy silt, olive-gray (5Y 4/1), very-fine-grained. Micaceous, glauconite(?). Some clay. Wet.
12.0- ? Sandy clay, pale-yellowish-orange (10YR 8/6), very-fine- to fine-grained.
32 Hydrogeologic and Water-Quality Data, Dahlgren, Virginia
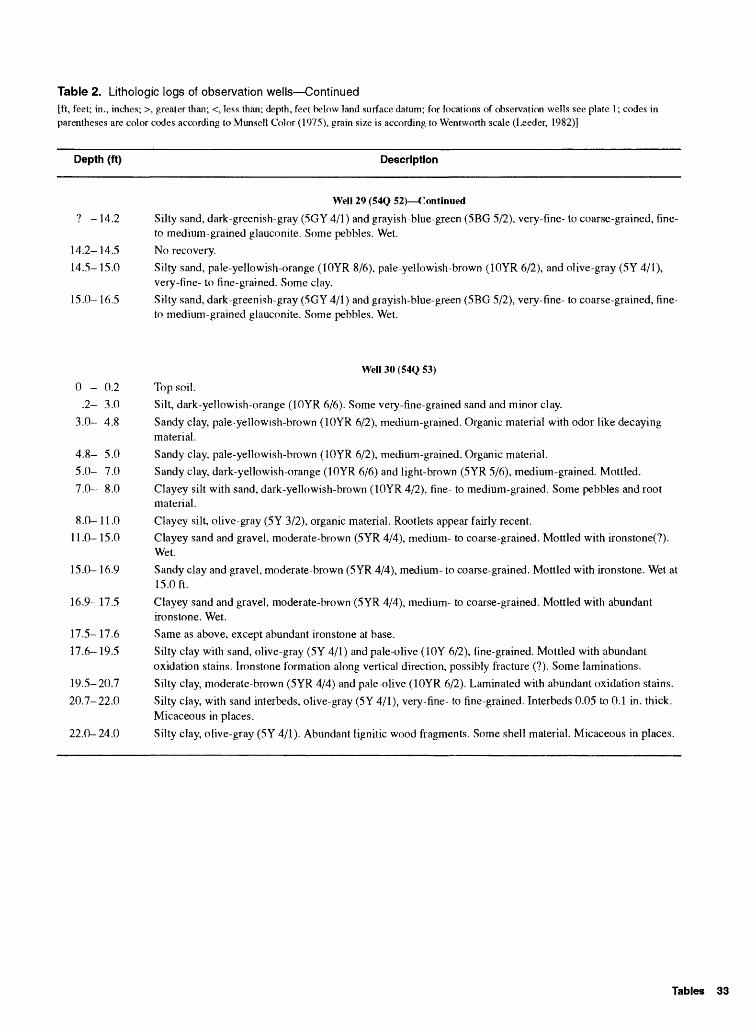
Table 2. Lithologic logs of observation wells Continued[ft, feet; in., inches; >, greater than; <, less than; depth, feet below land surface datum; for locations of observation wells see plate 1; codes in parentheses are color codes according to Munsell Color (1975), grain size is according to Wentworth scale (I^eeder, 1982)]
Depth (ft) Description
Well 29 (54Q 52) Continued
? - 14.2 Silty sand, dark-greenish-gray (5GY 4/1) and grayish-blue-green (5BG 5/2), very-fine- to coarse-grained, fine- to medium-grained glauconite. Some pebbles. Wet.
14.2- 14.5 No recovery.
14.5- 15.0 Silty sand, pale-yellowish-orange (10YR 8/6), pale-yellowish-brown (10YR 6/2), and olive-gray (5Y 4/1), very-fine- to fine-grained. Some clay.
15.0- 16.5 Silty sand, dark-greenish-gray (5GY 4/1) and grayish-blue-green (5BG 5/2), very-fine- to coarse-grained, fine- to medium-grained glauconite. Some pebbles. Wet.
Well 30 (54Q 53)
0 - 0.2 Top soil.
.2- 3.0 Silt, dark-yellowish-orange (10YR 6/6). Some very-fine-grained sand and minor clay.
3.0- 4.8 Sandy clay, pale-yellowish-brown (10YR 6/2), medium-grained. Organic material with odor like decayingmaterial.
4.8- 5.0 Sandy clay, pale-yellowish-brown (10YR 6/2), medium-grained. Organic material.
5.0- 7.0 Sandy clay, dark-yellowish-orange (10YR 6/6) and light-brown (5YR 5/6), medium-grained. Mottled.
7.0- 8.0 Clayey silt with sand, dark-yellowish-brown (10YR 4/2), fine- to medium-grained. Some pebbles and root material.
8.0- 11.0 Clayey silt, olive-gray (5Y 3/2), organic material. Rootlets appear fairly recent.
11.0- 15.0 Clayey sand and gravel, moderate-brown (5YR 4/4), medium- to coarse-grained. Mottled with ironstone(?).Wet.
15.0- 16.9 Sandy clay and gravel, moderate-brown (5YR 4/4), medium- to coarse-grained. Mottled with ironstone. Wet at15.0ft.
16.9- 17.5 Clayey sand and gravel, moderate-brown (5YR 4/4), medium- to coarse-grained. Mottled with abundantironstone. Wet.
17.5- 17.6 Same as above, except abundant ironstone at base.
17.6- 19.5 Silty clay with sand, olive-gray (5Y 4/1) and pale-olive (10Y 6/2), fine-grained. Mottled with abundant oxidation stains. Ironstone formation along vertical direction, possibly fracture (?). Some laminations.
19.5-20.7 Silty clay, moderate-brown (5YR 4/4) and pale-olive (10YR 6/2). Laminated with abundant oxidation stains.
20.7-22.0 Silty clay, with sand interbeds, olive-gray (5Y 4/1), very-fine- to fine-grained. Interbeds 0.05 to 0.1 in. thick. Micaceous in places.
22.0-24.0 Silty clay, olive-gray (5Y 4/1). Abundant lignitic wood fragments. Some shell material. Micaceous in places.
Tables 33
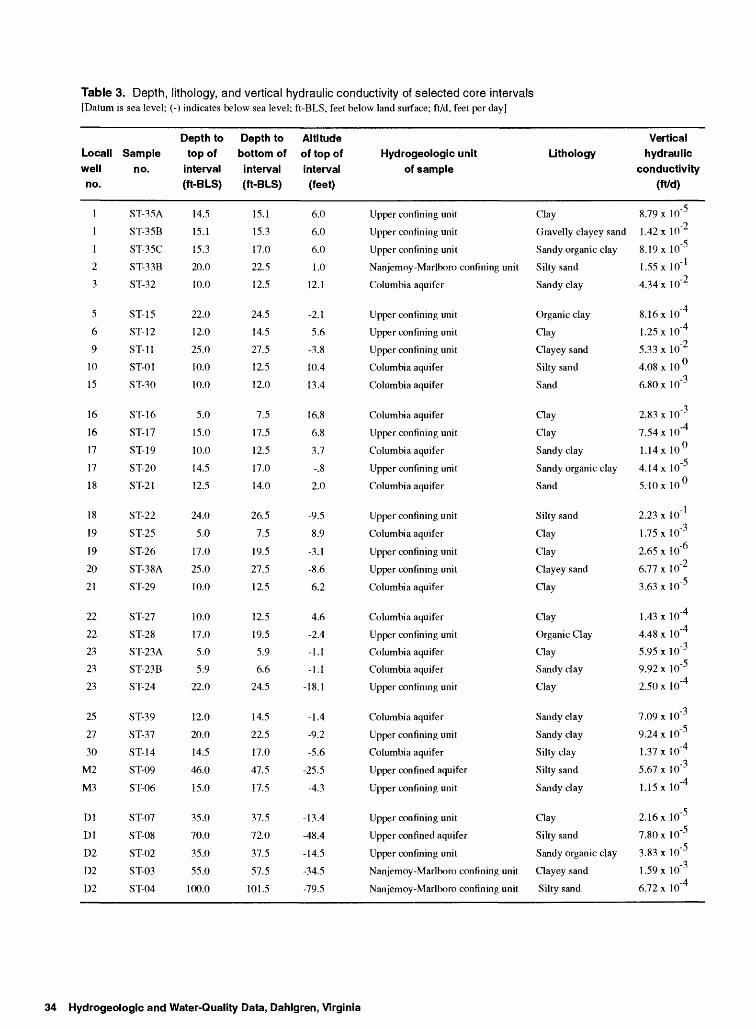
Table 3. Depth, lithology, and vertical hydraulic conductivity of selected core intervalsIDatum is sea level; (-) indicates below sea level; ft-BLS, feet below land surface; ft/d, feet per day]
Local! well no.
1
1
1
2
3
5
6
9
10
15
16
16
17
17
18
18
19
19
20
21
22
22
23
23
23
25
27
30
M2
M3
Dl
Dl
D2
D2
D2
Sample no.
ST-35A
ST-35B
ST-35C
ST-33B
ST-32
ST-15
ST-12
ST-11
ST-01
ST-30
ST-16
ST-17
ST-19
ST-20
ST-21
ST-22
ST-25
ST-26
ST-38A
ST-29
ST-27
ST-28
ST-23A
ST-23B
ST-24
ST-39
ST-37
ST-14
ST-09
ST-06
ST-07
ST-08
ST-02
ST-03
ST-04
Depth to top of
interval (ft-BLS)
14.5
15.1
15.3
20.0
10.0
22.0
12.0
25.0
10.0
10.0
5.0
15.0
10.0
14.5
12.5
24.0
5.0
17.0
25.0
10.0
10.0
17.0
5.0
5.9
22.0
12.0
20.0
14.5
46.0
15.0
35.0
70.0
35.0
55.0
100.0
Depth to bottom of interval (ft-BLS)
15.1
15.3
17.0
22.5
12.5
24.5
14.5
27.5
12.5
12.0
7.5
17.5
12.5
17.0
14.0
26.5
7.5
19.5
27.5
12.5
12.5
19.5
5.9
6.6
24.5
14.5
22.5
17.0
47.5
17.5
37.5
72.0
37.5
57.5
101.5
Altitude of top of interval (feet)
6.0
6.0
6.0
1.0
12.1
-2.1
5.6
-3.8
10.4
13.4
16.8
6.8
3.7
-.8
2.0
-9.5
8.9
-3.1
-8.6
6.2
4.6
-2.4
-1.1
-1.1
-18.1
-1.4
-9.2
-5.6
-25.5
-4.3
-13.4
-48.4
-14.5
-34.5
-79.5
Hydrogeologic unit of sample
Upper confining unit
Upper confining unit
Upper confining unit
Nanjemoy-Marlboro confining unit
Columbia aquifer
Upper confining unit
Upper confining unit
Upper confining unit
Columbia aquifer
Columbia aquifer
Columbia aquifer
Upper confining unit
Columbia aquifer
Upper confining unit
Columbia aquifer
Upper confining unit
Columbia aquifer
Upper confining unit
Upper confining unit
Columbia aquifer
Columbia aquifer
Upper confining unit
Columbia aquifer
Columbia aquifer
Upper confining unit
Columbia aquifer
Upper confining unit
Columbia aquifer
Upper confined aquifer
Upper confining unit
Upper confining unit
Upper confined aquifer
Upper confining unit
Nanjemoy-Marlboro confining unit
Nanjemoy-Marlboro confining unit
Lithology
Clay
Gravelly clayey sand
Sandy organic clay
Silty sand
Sandy clay
Organic clay
Clay
Clayey sand
Silty sand
Sand
Clay
Clay
Sandy clay
Sandy organic clay
Sand
Silty sand
Clay
Clay
Clayey sand
Clay
Clay
Organic Clay
Clay
Sandy clay
Clay
Sandy clay
Sandy clay
Silty clay
Silty sand
Sandy clay
Clay
Silty sand
Sandy organic clay
Clayey sand
Silty sand
Vertical hydraulic
conductivity (ft/d)
8.79 x 10~5
1.42xlO~2
8.19 x 10"5
1.55 xlO' 1
4.34 x 10"2
8.16 x 10"4
1.25xlO~4
5.33 x 10"2
4.08 x 10°
6.80 x 10"3
2.83 x 10~3
7.54 xlO"4
l.Hx 10°
4.14 x 10"5
5.10 x 10°
2.23 x 10" 1
1.75xlO~3
2.65 x 10"6
6.77 x 10"2
3.63 x 10"5
1.43 x 10"4
4.48 x 10"4
5.95 x 10"3
9.92 x 10"5
2.50 x 10"4
7.09 x 10"3
9.24x 10"5
1.37x 10"4
5.67 x 10"3
1.15x 10"4
2.16 x 10"5
7.80 x 10"5
3.83 x 10"5
1.59x 10" 3
6.72 x 10"4
34 Hydrogeologic and Water-Quality Data, Dahlgren, Virginia
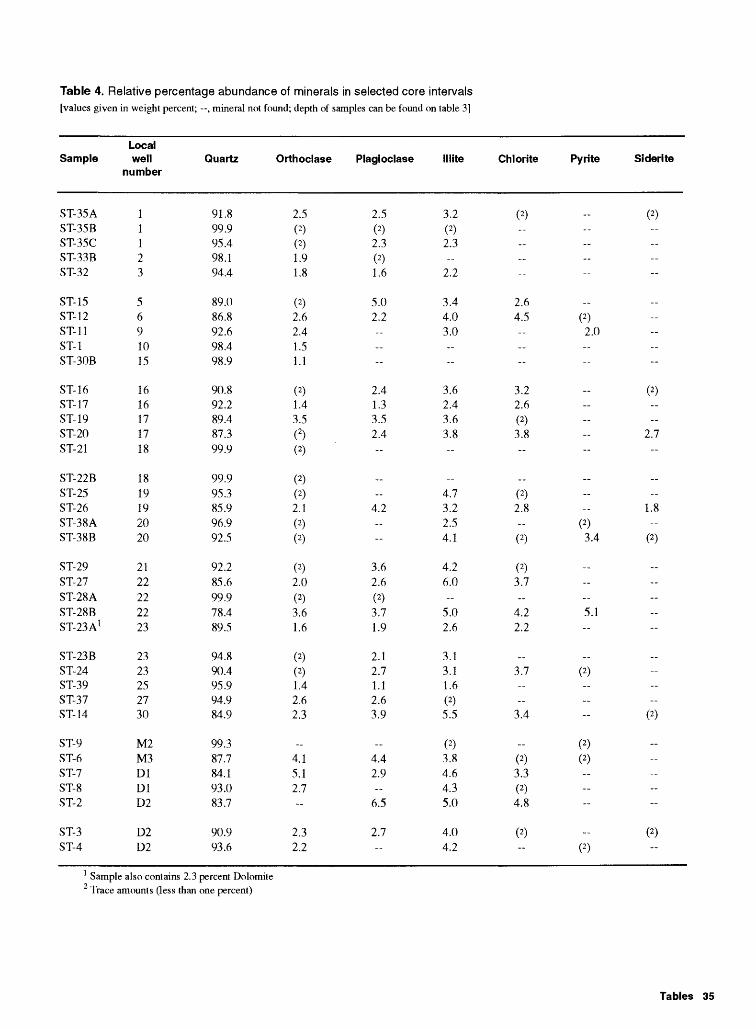
Table 4. Relative percentage abundance of minerals in selected core intervals[values given in weight percent; , mineral not found; depth of samples can be found on table 3]
Sample
ST-35AST-35BST-35CST-33BST-32
ST-15ST-1 2ST-11ST-1ST-30B
ST-1 6ST-17ST-19ST-20ST-21
ST-22BST-25ST-26ST-38AST-38B
ST-29ST-27ST-28AST-28BST-23A 1
ST-23BST-24ST-39ST-37ST-14
ST-9ST-6ST-7ST-8ST-2
ST-3ST-4
Local well
number
11123
5691015
1616171718
1819192020
2122222223
2323252730
M2M3DlDlD2
D2D2
Quartz
91.899.995.498.194.4
89.086.892.698.498.9
90.892.289.487.399.9
99.995.385.996.992.5
92.285.699.978.489.5
94.890.495.994.984.9
99.387.784.193.083.7
90.993.6
Orthoclase
2.5(2)
(2)
1.91.8
(2)2.62.41.51.1
(2)1.43.5(2)
( 2)
(2)
(2)
2.1(2)
(2)
(2)
2.0(2)
3.61.6
(2)(2)
1.42.62.3
__4.15.12.7-
2.32.2
Plagioclase
2.5(2)2.3(2)1.6
5.02.2 -
2.41.33.52.4-
_-
4.2--
3.62.6(2)
3.71.9
2.12.71.12.63.9
_4.42.9
6.5
2.7--
Illite
3.2(2)
2.3
2.2
3.44.03.0 --
3.62.43.63.8-
_4.73.22.54.1
4.26.0
5.02.6
3.13.11.6(2)
5.5
(2)
3.84.64.35.0
4.04.2
Chlorite Pyrite
(2)
-
2.64.5 (2)
2.0__-
3.22.6(2)
3.8--
_(2)
2.8(2)
(2) 3.4
(2)
3.7
4.2 5.12.2
__3.7 (2) ._
3.4
(2)
(2) (2)
3.3(2)
4.8
(2)
(2)
Siderite
(2)--- --
__ -
(2)
2.7-
_
1.8-
(2)
- -.-
_-
(2)
-
(2)
1 Sample also contains 2.3 percent Dolomite Trace amounts (less than one percent)
Tables 35
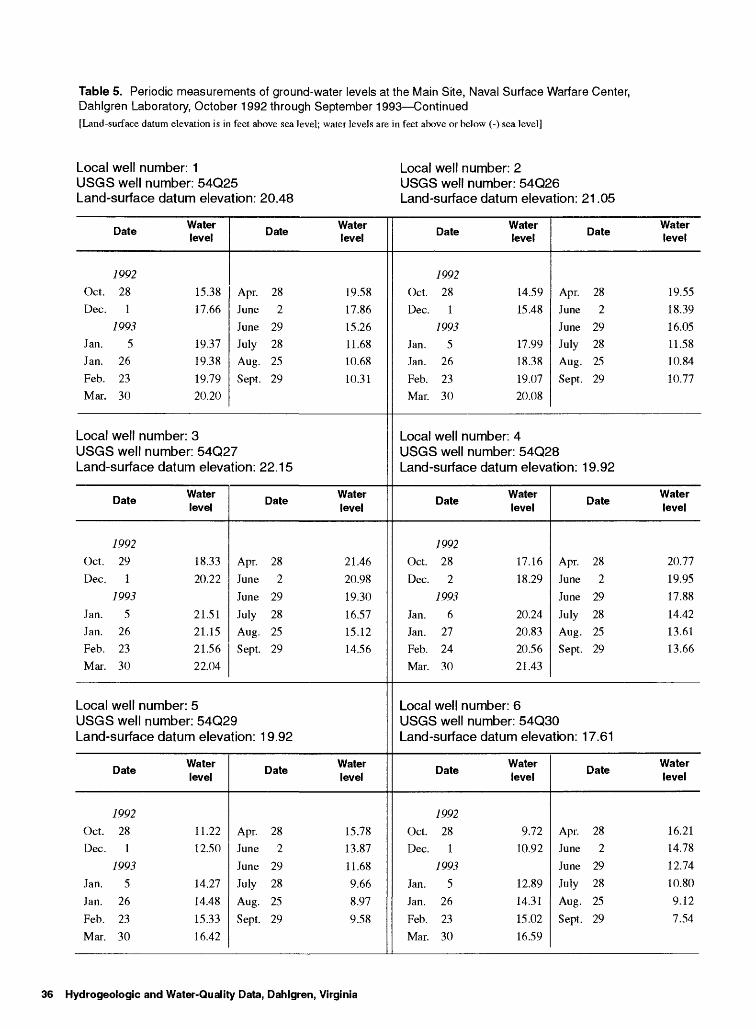
Table 5. Periodic measurements of ground-water levels at the Main Site, Naval Surface Warfare Center, Dahlgren Laboratory, October 1992 through September 1993 Continued[Land-surface datum elevation is in feet above sea level; water levels are in feet above or below (-) sea level]
Local well number: 1 USGS well number: 54Q25 Land-surface datum elevation: 20.48
Local well number: 2 USGS well number: 54Q26 Land-surface datum elevation: 21.05
Date
1992Oct. 28Dec. 1
1993Jan. 5Jan. 26
Feb. 23Mar. 30
Water level
15.3817.66
19.3719.38
19.7920.20
Date
Apr. 28June 2June 29July 28Aug. 25
Sept. 29
Water level
19.5817.8615.2611.6810.68
10.31
Local well number: 3USGS well number: 54Q27Land-surface datum elevation: 22.15
Date
1992
Oct. 29
Dec. 11993
Jan. 5Jan. 26Feb. 23Mar. 30
Water level
18.33
20.22
21.5121.1521.5622.04
Date
Apr. 28June 2
June 29
July 28Aug. 25Sept. 29
Water level
21.4620.9819.30
16.5715.1214.56
Local well number: 5USGS well number: 54Q29Land-surface datum elevation: 1 9.92
Date
1992
Oct. 28Dec. 1
1993
Jan. 5
Jan. 26
Feb. 23
Mar. 30
Water level
11.2212.50
14.27
14.48
15.3316.42
Date
Apr. 28June 2
June 29July 28
Aug. 25
Sept. 29
Water level
15.7813.87
11.689.668.97
9.58
Date
7992Oct. 28Dec. 1
7993Jan. 5Jan. 26
Feb. 23Mar. 30
Local well
Water level
14.5915.48
17.9918.38
19.0720.08
Date
Apr. 28June 2June 29July 28Aug. 25Sept. 29
number: 4
Water level
19.5518.3916.0511.5810.84
10.77
USGS well number: 54Q28Land-surface datum elevation: 19.92
Date
7992Oct. 28
Dec. 27993
Jan. 6Jan. 27Feb. 24Mar. 30
Local well
Water level
17.16
18.29
20.2420.8320.5621.43
Date
Apr. 28
June 2June 29
July 28Aug. 25Sept. 29
number: 6
Water level
20.77
19.9517.88
14.4213.6113.66
USGS well number: 54Q30Land-surface datum elevation: 17.61
Date
7992Oct. 28Dec. 1
1993
Jan. 5Jan. 26
Feb. 23Mar. 30
Water level
9.7210.92
12.8914.31
15.02
16.59
Date
Apr. 28June 2
June 29July 28Aug. 25
Sept. 29
Water level
16.2114.78
12.7410.80
9.12
7.54
36 Hydrogeologic and Water-Quality Data, Dahlgren, Virginia
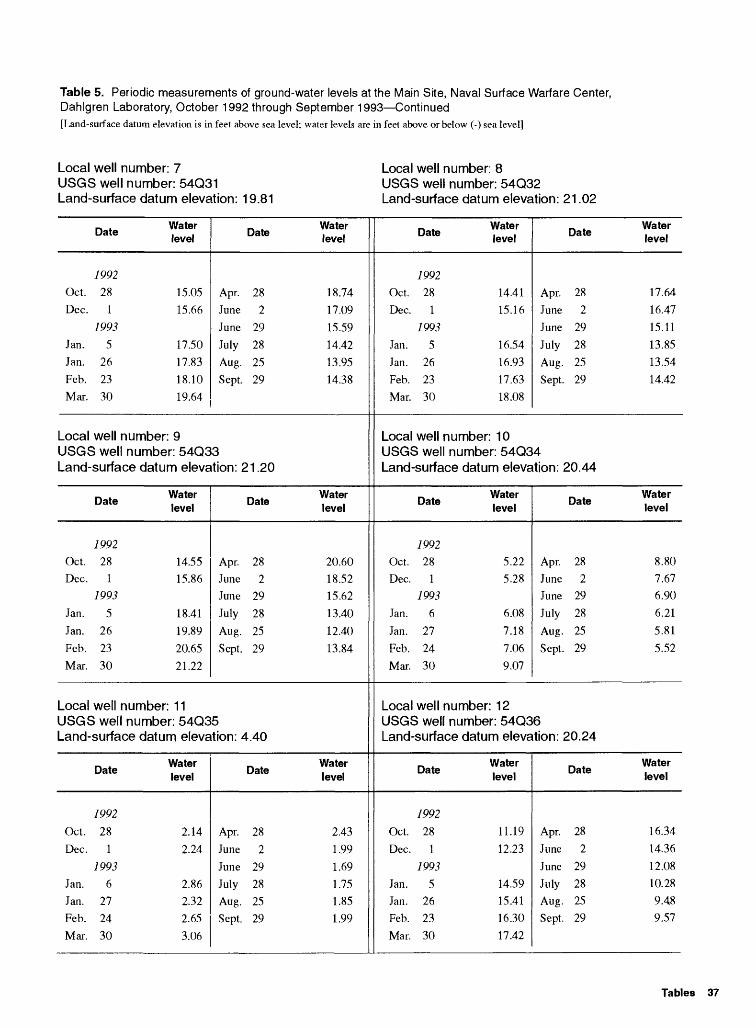
Table 5. Periodic measurements of ground-water levels at the Main Site, Naval Surface Warfare Center, Dahlgren Laboratory, October 1992 through September 1993 Continued[Land-surface datum elevation is in feet above sea level; water levels are in feet above or below (-) sea level]
Local well number: 7 USGS well number: 54Q31 Land-surface datum elevation: 19.81
Local well number: 8 USGS well number: 54Q32 Land-surface datum elevation: 21.02
Date
7992Oct. 28Dec. 1
7993Jan. 5Jan. 26Feb. 23Mar. 30
Local well number
Water level
15.0515.66
17.5017.8318.1019.64
Apr.JuneJune
JulyAug.Sept.
:9
Date
282
2928
2529
Water level
18.7417.0915.59
14.4213.9514.38
USGS well number: 54Q33Land-surface datum elevation: 21 .20
Date
7992Oct. 28Dec. 1
7993Jan. 5
Jan. 26Feb. 23Mar. 30
Local well number
Water level
14.5515.86
18.4119.8920.6521.22
Apr.JuneJuneJuly
Aug.Sept.
11
Date
282
2928
25
29
Water level
20.6018.5215.62
13.40
12.4013.84
USGS well number: 54Q35Land-surface datum elevation: 4.40
Date
7992
Oct. 28Dec. 1
7993Jan. 6Jan. 27Feb. 24Mar. 30
Water level
2.142.24
2.862.322.65
3.06
Apr.June
JuneJulyAug.Sept.
Date
28
229282529
Water level
2.43
1.991.691.751.851.99
Date
7992Oct. 28Dec. 1
7993Jan. 5Jan. 26Feb. 23Mar. 30
Local well
Water level
14.4115.16
16.5416.9317.6318.08
Apr.JuneJuneJulyAugSept
number: 10
Date
282
29282529
Water level
17.6416.4715.11
13.8513.5414.42
USGS well number: 54Q34Land-surface datum elevation:
Date
7992Oct. 28Dec. 1
7993
Jan. 6
Jan. 27Feb. 24Mar. 30
Local well
Water level
5.225.28
6.08
7.187.069.07
Apr.JuneJune
July
20.44
Date
282
2928
Aug. 25Sept
number: 12
29
Water level
8.807.676.90
6.215.815.52
USGS well number: 54Q36Land-surface datum elevation:
Date
7992
Oct. 28Dec. 1
7993Jan. 5Jan. 26Feb. 23Mar. 30
Water level
11.1912.23
14.5915.4116.3017.42
Apr.JuneJuneJulyAug
20.24
Date
282
292825
Sept. 29
Water level
16.3414.3612.0810.289.489.57
Tables 37
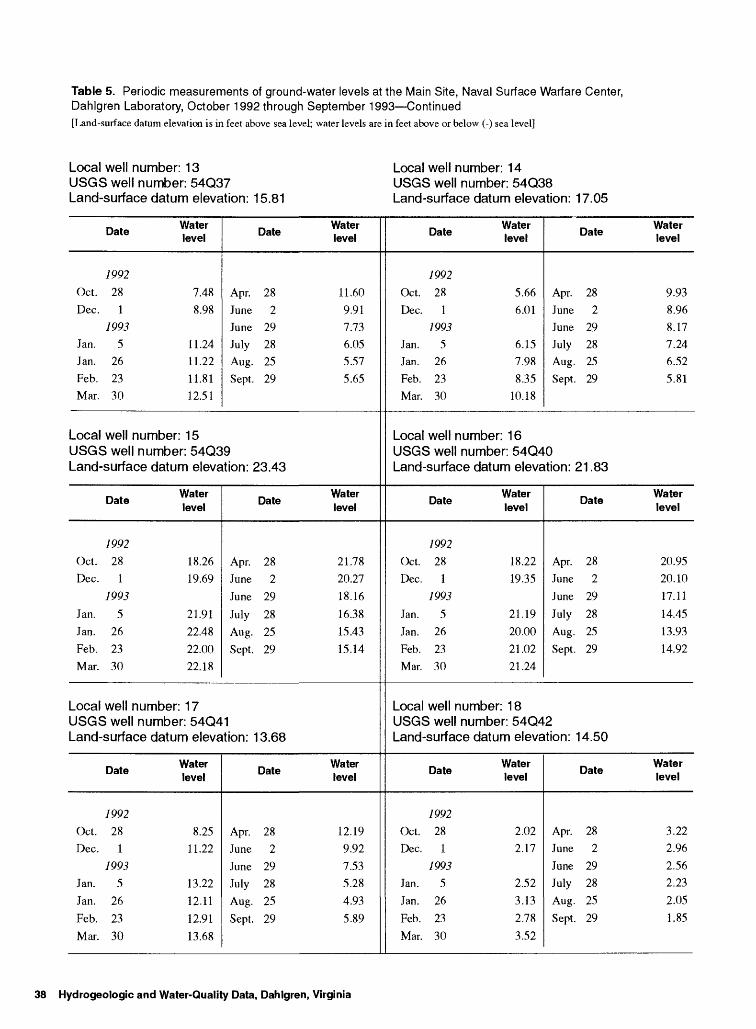
Table 5. Periodic measurements of ground-water levels at the Main Site, Naval Surface Warfare Center, Dahlgren Laboratory, October 1992 through September 1993 Continued[Land-surface datum elevation is in feet above sea level; water levels are in feet above or below (-) sea level]
Local well number: 13 USGS well number: 54Q37 Land-surface datum elevation: 15.81
Local well number: 14 USGS well number: 54Q38 Land-surface datum elevation: 17.05
Date
7992Oct. 28Dec. 1
7995Jan. 5Jan. 26Feb. 23Mar. 30
Water level
7.488.98
11.2411.2211.8112.51
Date
Apr. 28June 2June 29July 28Aug. 25Sept. 29
Water level
11.609.917.736.055.575.65
Local well number: 1 5USGS well number: 54Q39Land-surface datum elevation: 23.43
Date
7992Oct. 28Dec. 1
7995
Jan. 5Jan. 26Feb. 23Mar. 30
Water level
18.2619.69
21.9122.48
22.0022.18
Date
Apr. 28June 2June 29
July 28Aug. 25
Sept. 29
Water level
21.7820.2718.16
16.3815.4315.14
Local well number: 17USGS well number: 54Q41Land-surface datum elevation: 13.68
Date
7992Oct. 28Dec. 1
7993Jan. 5Jan. 26
Feb. 23
Mar. 30
Water level
8.2511.22
13.2212.11
12.91
13.68
Date
Apr. 28June 2June 29July 28Aug. 25
Sept. 29
Water level
12.199.927.535.284.935.89
Date
7992Oct. 28Dec. 1
7995Jan. 5Jan. 26Feb. 23Mar. 30
Water level
5.666.01
6.157.988.35
10.18
Date
Apr. 28June 2June 29July 28Aug. 25Sept. 29
Water level
9.938.968.177.246.525.81
Local well number: 16USGS well number: 54Q40Land-surface datum elevation: 21 .83
Date
7992Oct. 28Dec. 1
7993
Jan. 5Jan. 26Feb. 23Mar. 30
Water level
18.2219.35
21.1920.0021.0221.24
Date
Apr. 28June 2
June 29
July 28Aug. 25
Sept. 29
Water level
20.9520.1017.11
14.4513.9314.92
Local well number: 18USGS well number: 54Q42Land-surface datum elevation: 14.50
Date
7992Oct. 28Dec. 1
7993Jan. 5Jan. 26
Feb. 23Mar. 30
Water level
2.022.17
2.523.132.78
3.52
Date
Apr. 28June 2
June 29July 28Aug. 25
Sept. 29
Water level
3.222.96
2.562.232.05
1.85
38 Hydrogeologic and Water-Quality Data, Dahlgren, Virginia
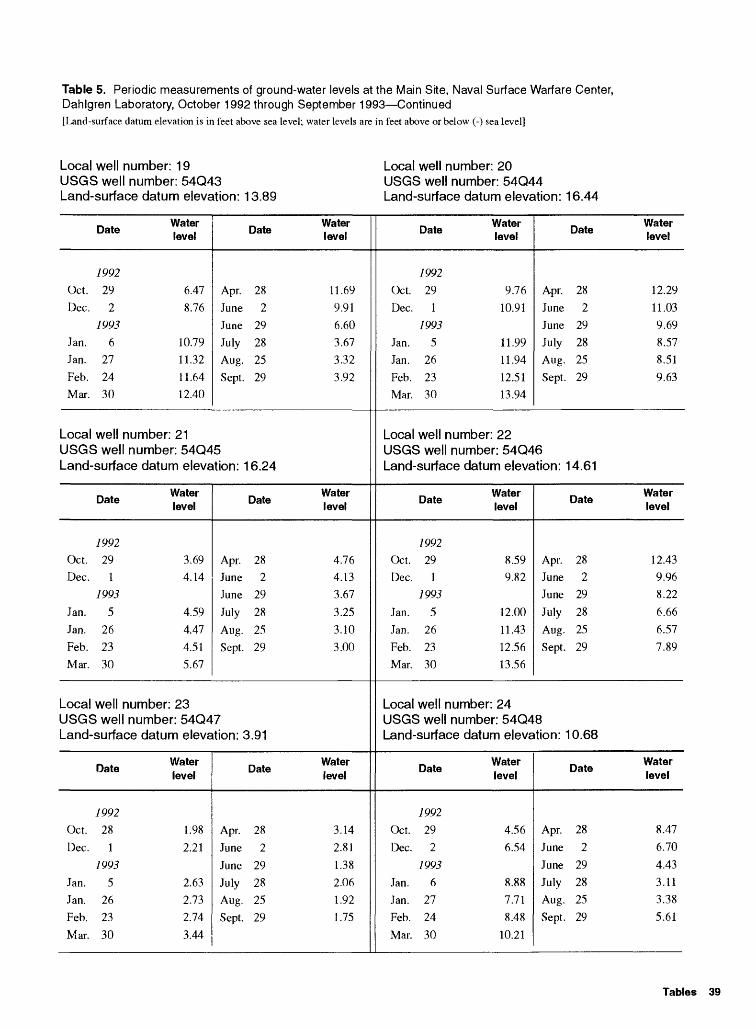
Table 5. Periodic measurements of ground-water levels at the Main Site, Naval Surface Warfare Center, Dahlgren Laboratory, October 1992 through September 1993 Continued[Land-surface datum elevation is in feet above sea level; water levels are in feet above or below (-) sea level]
Local well number: 19 USGS well number: 54Q43 Land-surface datum elevation: 13.89
Local well number: 20 USGS well number: 54Q44 Land-surface datum elevation: 16.44
_ . Water Date . . level
1992
Oct. 29 6.47Dec. 2 8.76
1993
Jan. 6 10.79Jan. 27 11.32Feb. 24 11.64Mar. 30 12.40
Date
Apr. 28June 2June 29
July 28
Aug. 25Sept. 29
Local well number: 21USGS well number: 54Q45Land-surface datum elevation: 16.24
Water Date . . level
1992
Oct. 29 3.69Dec. 1 4.14
1993
Jan. 5 4.59Jan. 26 4.47Feb. 23 4.51Mar. 30 5.67
Date
Apr. 28June 2June 29
July 28
Aug. 25Sept. 29
Local well number: 23USGS well number: 54Q47Land-surface datum elevation: 3.91
_ . Water Date level
1992
Oct. 28 1.98
Dec. 1 2.211993
Jan. 5 2.63Jan. 26 2.73Feb. 23 2.74
Mar. 30 3.44
Date
Apr. 28June 2
June 29July 28Aug. 25Sept. 29
Water level
11.699.916.603.673.323.92
Water level
4.764.133.67
3.25
3.103.00
Water level
3.142.81
1.382.061.921.75
Date
1992
Oct. 29Dec. 1
1993
Jan. 5Jan. 26Feb. 23Mar. 30
Water level
9.7610.91
11.9911.9412.5113.94
Date
Apr. 28June 2June 29July 28Aug. 25Sept. 29
Water level
12.2911.039.698.578.519.63
Local well number: 22USGS well number: 54Q46Land-surface
Date
7992Oct. 29Dec. 1
7993
Jan. 5Jan. 26Feb. 23Mar. 30
datum elevation: 14.61
Water level
8.599.82
12.0011.4312.5613.56
Date
Apr. 28June 2June 29
July 28Aug. 25Sept. 29
Water level
12.439.968.22
6.66
6.577.89
Local well number: 24USGS well number: 54Q48Land-surface
Date
7992Oct. 29Dec. 2
7993Jan. 6Jan. 27Feb. 24Mar. 30
datum elevation: 10.68
Water level
4.566.54
8.887.718.48
10.21
Date
Apr. 28June 2
June 29July 28Aug. 25Sept. 29
Water level
8.476.70
4.433.113.385.61
Tables 39
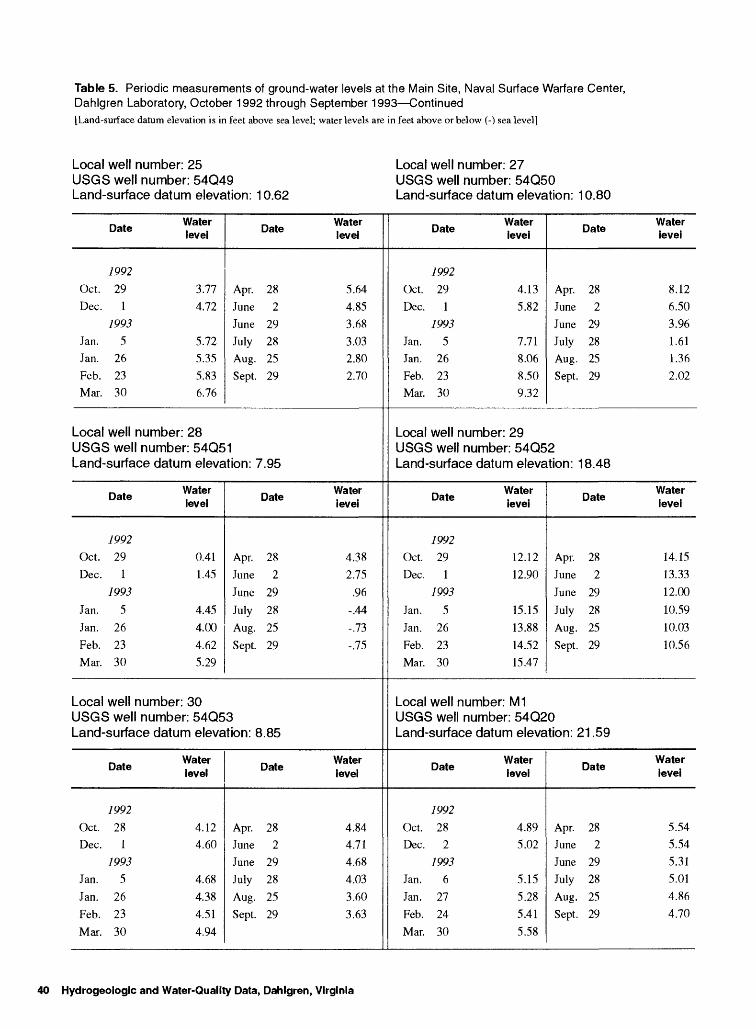
Table 5. Periodic measurements of ground-water levels at the Main Site, Naval Surface Warfare Center, Dahlgren Laboratory, October 1992 through September 1993 Continued[Land-surface datum elevation is in feet above sea level; water levels are in feet above or below (-) sea level]
Local well number: 25 USGS well number: 54Q49 Land-surface datum elevation: 10.62
Local well number: 27 USGS well number: 54Q50 Land-surface datum elevation: 10.80
Date
1992
Oct. 29Dec. 1
7993Jan. 5Jan. 26Feb. 23Mar. 30
Water level
3.774.72
5.725.355.836.76
Apr.JuneJuneJulyAug.Sept.
Date
282
29282529
Water level
5.644.853.683.032.802.70
Local well number: 28USGS well number: 54Q51Land-surface datum elevation: 7.95
Date
7992Oct. 29Dec. 1
1993
Jan. 5Jan. 26Feb. 23Mar. 30
Water level
0.411.45
4.454.004.625.29
Apr.JuneJune
JulyAug.Sept.
Date
282
29
282529
Water level
4.382.75
.96-.44-.73-.75
Local well number: 30USGS well number: 54Q53Land-surface datum elevation: 8.85
Date
7992
Oct. 28Dec. 1
7993Jan. 5Jan. 26Feb. 23
Mar. 30
Water level
4.124.60
4.68
4.384.51
4.94
Apr.JuneJuneJulyAug.Sept.
Date
282
29282529
Water level
4.844.714.684.03
3.603.63
Oct.Dec.
Jan.Jan.Feb.Mar.
Local
Date
7992
291
79935
262330
Water level
4.135.82
7.718.068.509.32
Apr.JuneJuneJulyAug.Sept
Date
282
29282529
Water level
8.126.503.961.611.362.02
well number: 29USGS well number: 54Q52Land-surface datum elevation:
Oct.Dec.
Jan.
Jan.Feb.Mar.
Local
Date
799229
17993
5262330
Water level
12.1212.90
15.15
13.8814.5215.47
Apr.JuneJune
JulyAug.Sept
18.48
Date
282
29
2825
29
Water level
14.1513.3312.00
10.59
10.0310.56
well number: M1USGS well number: 54Q20Land-surface datum elevation: 21 .59
Oct.Dec.
Jan.Jan.Feb.Mar.
Date
799228
27993
62724
30
Water level
4.895.02
5.155.285.41
5.58
Apr.JuneJuneJuly
Aug.Sept.
Date
282
29282529
Water level
5.545.545.315.014.864.70
40 Hydrogeologic and Water-Quality Data, Dahlgren, Virginia
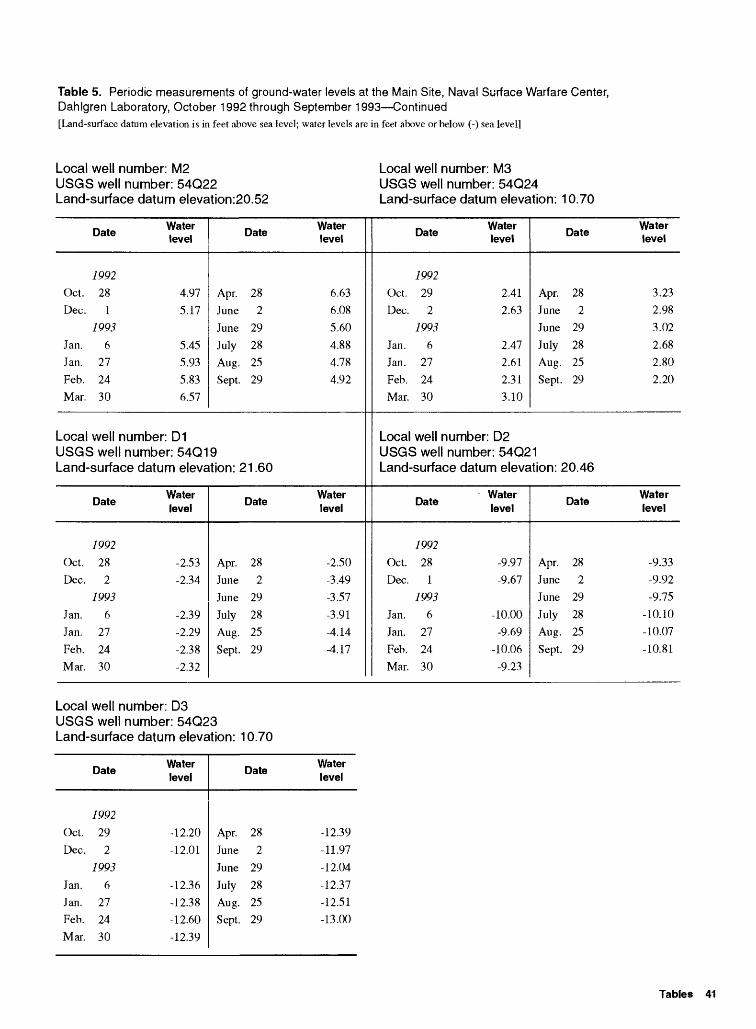
Table 5. Periodic measurements of ground-water levels at the Main Site, Naval Surface Warfare Center, Dahlgren Laboratory, October 1992 through September 1993 Continued[Land-surface datum elevation is in feet above sea level; water levels are in feet above or below (-) sea level]
Local well number: M2 USGS well number: 54Q22 Land-surface datum elevation:20.52
Local well number: M3 USGS well number: 54Q24 Land-surface datum elevation: 10.70
Oct.
Dec.
Jan.
Jan.
Feb.
Mar.
Local
Date
7992
28
1
7995
6
27
24
30
well
Water level
4.97
5.17
5.45
5.93
5.83
6.57
Apr.
June
June
July
Aug.
Sept.
number: D1
Date
28
2
29
28
25
29
Water level
6.63
6.08
5.60
4.88
4.78
4.92
USGS well number: 54Q19Land-surface datum elevation: 21 .60
Oct.
Dec.
Jan.
Jan.
Feb.
Mar.
Date
7992
28
2
7995
6
27
24
30
Water level
-2.53
-2.34
-2.39
-2.29
-2.38
-2.32
Apr.
June
June
July
Aug.
Sept.
Date
28
2
29
28
25
29
Water level
-2.50
-3.49
-3.57
-3.91
-4.14
-4.17
Oct.
Dec.
Jan.
Jan.
Feb.
Mar.
Local
Date
7992
29
2
7995
6
27
24
30
Water level
2.41
2.63
2.47
2.61
2.31
3.10
Apr.
June
June
July
Aug
Sept
Date
28
2
29
28
25
29
Water level
3.23
2.98
3.02
2.68
2.80
2.20
well number: D2USGS well number: 54Q21Land-surface datum elevation:
Oct.
Dec.
Jan.
Jan.
Feb.
Mar.
Date
7992
28
1
7995
6
27
24
30
Water level
-9.97
-9.67
-10.00
-9.69
-10.06
-9.23
Apr.
June
June
July
Aug
Sept
20.46
Date
28
2
29
28
25
29
Water level
-9.33
-9.92
-9.75
-10.10
-10.07
-10.81
Local well number: D3 USGS well number: 54Q23Land-surface datum elevation: 10.70
Oct.
Dec.
Jan.
Jan.
Feb.
Mar.
Date
7992
29
2
7995
6
27
24
30
Water level
-12.20
-12.01
-12.36
-12.38
-12.60
-12.39
Apr.
June
June
July
Aug.
Sept.
Date
28
2
29
28
25
29
Water level
-12.39
-11.97
-12.04
-12.37
-12.51
-13.00
Tables 41
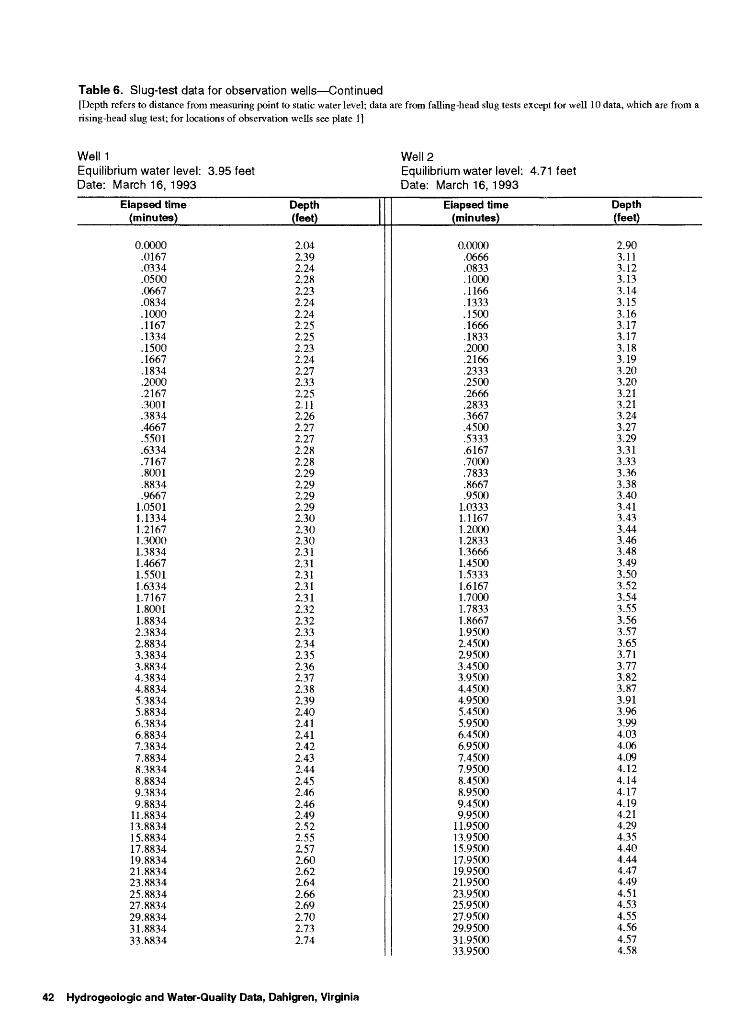
Table 6. Slug-test data for observation wells Continued[Depth refers to distance from measuring point to static water level; data are from falling-head slug tests except tor well 10 data, which are from a rising-head slug test; for locations of observation wells see plate 1]
WelMEquilibrium water level: 3.95 feetDate: March 16, 1993
Well 2Equilibrium water level: 4.71 feetDate: March 16, 1993
Elapsed time (minutes)
0.0000.0167.0334.0500.0667.0834.1000.1167.1334.1500.1667.1834.2000.2167.3001.3834.4667.5501.6334.7167.8001.8834.96671.05011.13341.21671.30001.38341.46671.55011.63341.71671.80011.88342.38342.88343.38343.88344.38344.88345.38345.88346.38346.88347.38347.88348.38348.88349.38349.883411.883413.883415.883417.883419.883421.883423.883425.883427.883429.883431.883433.8834
Depth (feet)
2.042.392.242.282.232.242.242.252.252.232.242.272.332.252.112.262.272.272.282.282.292.292.292.292.302.302.302.312.312.312.312.312.322.322.332.342.352.362.372.382.392.402.412.412.422.432.442.452.462.462.492.522.552.572.602.622.642.662.692.702.732.74
Elapsed time (minutes)
0.0000.0666.0833.1000.1166.1333.1500.1666.1833.2000.2166.2333.2500.2666.2833.3667.4500.5333.6167.7000.7833.8667.95001.03331.11671.20001.28331.36661.45001.53331.61671.70001.78331.86671.95002.45002.95003.45003.95004.45004.95005.45005.95006.45006.95007.45007.95008.45008.95009.45009.950011.950013.950015.950017.950019.950021.950023.950025.950027.950029.950031.950033.9500
Depth (feet)
2.903.113.123.133.143.153.163.173.173.183.193.203.203.213.213.243.273.293.313.333.363.383.403.413.433.443.463.483.493.503.523.543.553.563.573.653.713.773.823.873.913.963.994.034.064.094.124.144.174.194.214.294.354.404.444.474.494.514.534.554.564.574.58
42 Hydrogeologic and Water-Quality Data, Dahlgren, Virginia
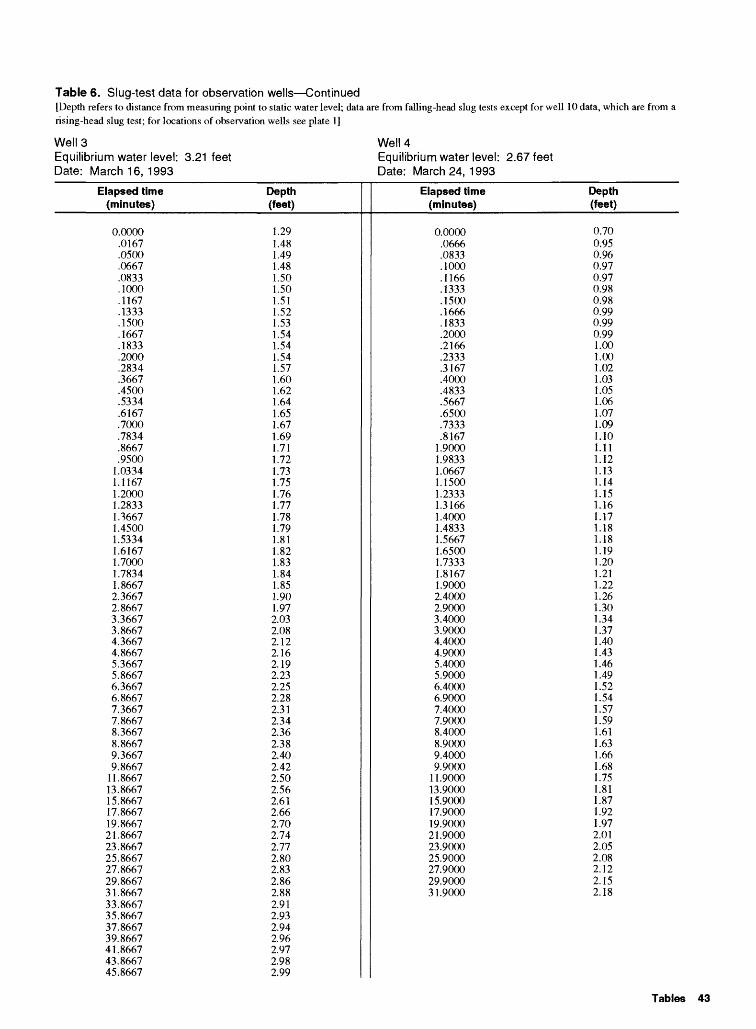
Table 6. Slug-test data for observation wells Continued[Depth refers to distance from measuring point to static water level; data are from falling-head slug tests except for well 10 data, which are from a rising-head slug test; for locations of observation wells see plate 1]
Well 3Equilibrium water level: 3.21 feetDate: March 16, 1993
Well 4Equilibrium water level: 2.67 feetDate: March 24, 1993
Elapsed time (minutes)
0.0000.0167.0500.0667.0833.1000.1167.1333.1500.1667.1833.2000.2834.3667.4500.5334.6167.7000.7834.8667.9500
1.03341.11671.20001.28331.36671.45001.53341.61671.70001.78341.86672.36672.86673.36673.86674.36674.86675.36675.86676.36676.86677.36677.86678.36678.86679.36679.866711.866713.866715.866717.866719.866721.866723.866725.866727.866729.866731.866733.866735.866737.866739.866741.866743.866745.8667
Depth (feet)
1.291.481.491.481.501.501.511.521.531.541.541.541.571.601.621.641.651.671.691.711.721.731.751.761.771.781.791.811.821.831.841.851.901.972.032.082.122.162.192.232.252.282.312.342.362.382.402.422.502.562.612.662.702.742.772.802.832.862.882.912.932.942.962.972.982.99
Elapsed time (minutes)
0.0000.0666.0833.1000.1166.1333.1500.1666.1833.2000.2166.2333.3167.4000.4833.5667.6500.7333.81671.90001.98331.06671.1500.2333.3166.4000.4833.56671.65001.73331.81671.90002.40002.90003.40003.90004.40004.90005.40005.90006.40006.90007.40007.90008.40008.90009.40009.900011.900013.900015.900017.900019.900021.900023.900025.900027.900029.900031.9000
Depth (feet)
0.700.950.960.970.970.980.980.990.990.991.001.001.021.031.051.061.071.091.101.111.121.131.141.151.161.171.181.181.191.201.211.221.261.301.341.371.401.431.461.491.521.541.571.591.611.631.661.681.751.811.871.921.972.012.052.082.122.152.18
Tables 43
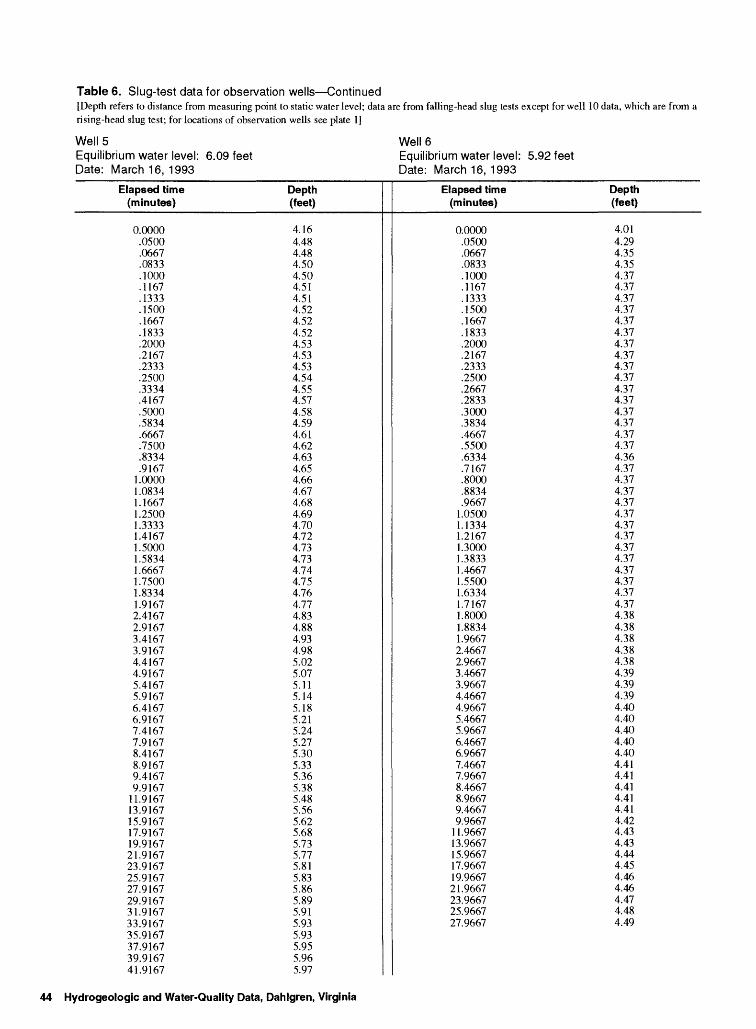
Table 6. Slug-test data for observation wells Continued[Depth refers to distance from measuring point to static water level; data are from falling-head slug tests except for well 10 data, which are from a rising-head slug test; for locations of observation wells see plate 1]
WellSEquilibrium water level: 6.09 feetDate: March 16, 1993
Well6Equilibrium water level: 5.92 feetDate: March 16, 1993
Elapsed time (minutes)
0.0000.0500.0667.0833.1000.1167.1333.1500.1667.1833.2000.2167.2333.2500.3334.4167.5000.5834.6667.7500.8334.9167
1.00001.08341.16671.25001.33331.41671.50001.58341.66671.75001.83341.91672.41672.91673.41673.91674.41674.91675.41675.91676.41676.91677.41677.91678.41678.91679.41679.916711.916713.916715.916717.916719.916721.916723.916725.916727.916729.916731.916733.916735.916737.916739.916741.9167
Depth (feet)
4.164.484.484.504.504.514.514.524.524.524.534.534.534.544.554.574.584.594.614.624.634.654.664.674.684.694.704.724.734.734.744.754.764.774.834.884.934.985.025.075.115.145.185.215.245.275.305.335.365.385.485.565.625.685.735.775.815.835.865.895.915.935.935.955.965.97
Elapsed time (minutes)
0.0000.0500.0667.0833.1000.1167.1333.1500.1667.1833.2000.2167.2333.2500.2667.2833.3000.3834.4667.5500.6334.7167.8000.8834.96671.05001.13341.21671.30001.38331.46671.55001.63341.71671.80001.88341.96672.46672.96673.46673.96674.46674.96675.46675.96676.46676.96677.46677.96678.46678.96679.46679.966711.966713.966715.966717.966719.966721.966723.966725.966727.9667
Depth (feet)
4.014.294.354.354.374.374.374.374.374.374.374.374.374.374.374.374.374.374.374.374.364.374.374.374.374.374.374.374.374.374.374.374.374.374.384.384.384.384.384.394.394.394.404.404.404.404.404.414.414.414.414.414.424.434.434.444.454.464.464.474.484.49
44 Hydrogeologic and Water-Quality Data, Dahlgren, Virginia
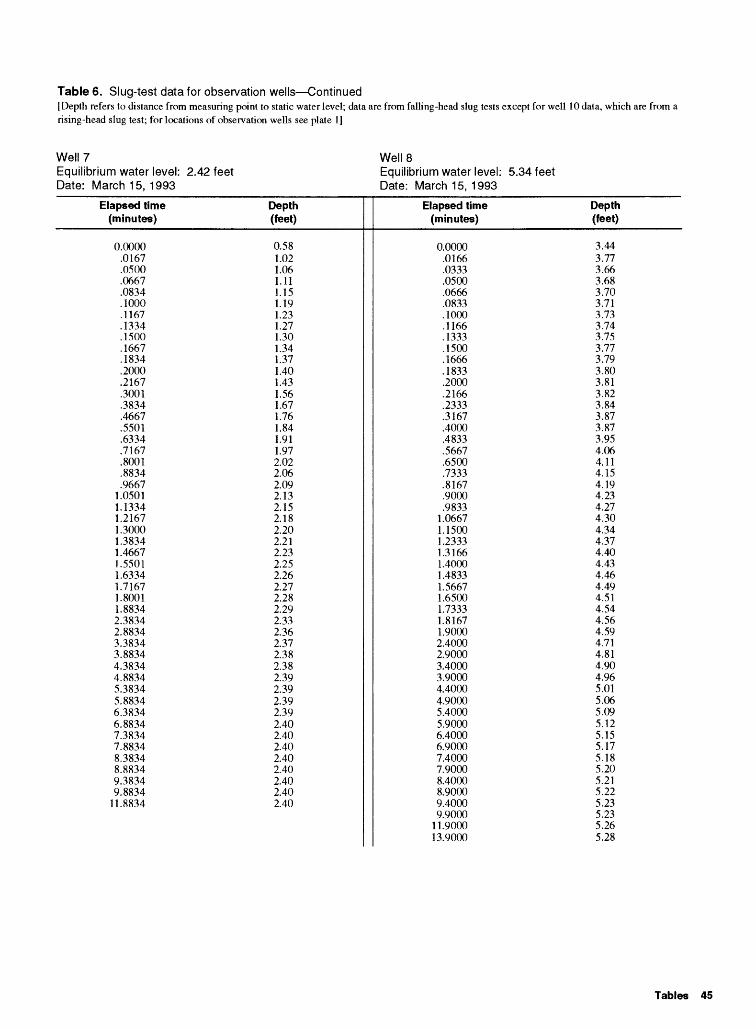
Table 6. Slug-test data for observation wells Continued[Depth refers to distance from measuring point to static water level; data are from falling-head slug tests except for well 10 data, which are from a rising-head slug test; for locations of observation wells see plate 1]
Well?Equilibrium water level: 2.42 feetDate: March 15, 1993
WellSEquilibrium water level: 5.34 feetDate: March 15, 1993
Elapsed time (minutes)
0.0000.0167.0500.0667.0834.1000.1167.1334.1500.1667.1834.2000.2167.3001.3834.4667.5501.6334.7167.8001.8834.96671.05011.13341.21671.30001.38341.46671.55011.63341.71671.80011.88342.38342.88343.38343.88344.38344.88345.38345.88346.38346.88347.38347.88348.38348.88349.38349.883411.8834
Depth (feet)
0.581.021.061.111.151.191.231.271.301.341.371.401.431.561.671.761.841.911.972.022.062.092.132.152.182.202.212.232.252.262.272.282.292.332.362.372.382.382.392.392.392.392.402.402.402.402.402.402.402.40
Elapsed time (minutes)
0.0000.0166.0333.0500.0666.0833.1000.1166.1333.1500.1666.1833.2000.2166.2333.3167.4000.4833.5667.6500.7333.8167.9000.98331.06671.15001.23331.31661.40001.48331.56671.65001.73331.81671.90002.40002.90003.40003.90004.40004.90005.40005.90006.40006.90007.40007.90008.40008.90009.40009.900011.900013.9000
Depth (feet)
3.443.773.663.683.703.713.733.743.753.773.793.803.813.823.843.873.873.954.064.114.154.194.234.274.304.344.374.404.434.464.494.514.544.564.594.714.814.904.965.015.065.095.125.155.175.185.205.215.225.235.235.265.28
Tables 45
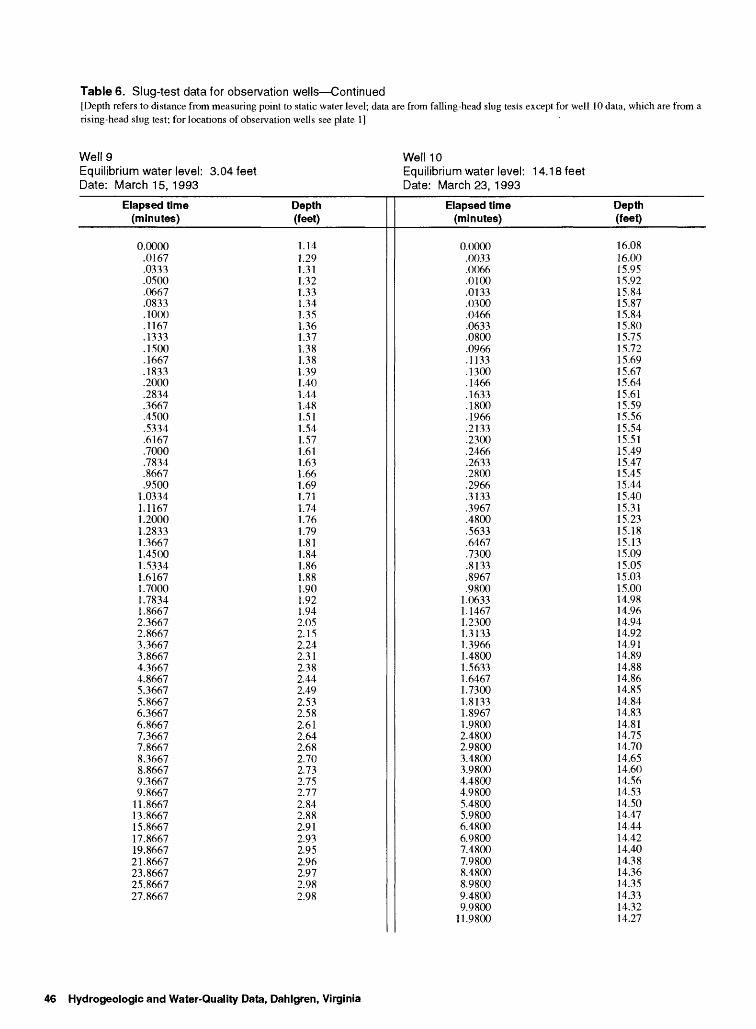
Table 6. Slug-test data for observation wells Continued[Depth refers to distance from measuring point to static water level; data are from falling-head slug tests except for well 10 data, which are from a rising-head slug test; for locations of observation wells see plate 1]
Well 9Equilibrium water level: 3.04 feetDate: March 15, 1993
Well 10Equilibrium water level: 14.18 feetDate: March 23, 1993
Elapsed time (minutes)
0.0000.0167.0333.0500.0667.0833.1000.1167.1333.1500.1667.1833.2000.2834.3667.4500.5334.6167.7000.7834.8667.9500
1.03341.11671.20001.28331.36671.45001.53341.61671.70001.78341.86672.36672.86673.36673.86674.36674.86675.36675.86676.36676.86677.36677.86678.36678.86679.36679.866711.866713.866715.866717.866719.866721.866723.866725.866727.8667
Depth (feet)
1.141.291.311.321.331.341.351.361.371.381.381.391.401.441.48.51.54.57.61.63.66.69.71.74.76.79.81.84.86
1.881.901.921.942.052.152.242.312.382.442.492.532.582.612.642.682.702.732.752.772.842.882.912.932.952.962.972.982.98
Elapsed time (minutes)
0.0000.0033.0066.0100.0133.0300.0466.0633.0800.0966.1133.1300.1466.1633.1800.1966.2133.2300.2466.2633.2800.2966.3133.3967.4800.5633.6467.7300.8133.8967.9800.0633.1467.2300.3133.3966.4800.56331.64671.73001.81331.89671.98002.48002.98003.48003.98004.48004.98005.48005.98006.48006.98007.48007.98008.48008.98009.48009.980011.9800
Depth (feet)
16.0816.0015.9515.9215.8415.8715.8415.8015.7515.7215.6915.6715.6415.6115.5915.5615.5415.5115.4915.4715.4515.4415.4015.3115.2315.1815.1315.0915.0515.0315.0014.9814.9614.9414.9214.9114.8914.8814.8614.8514.8414.8314.8114.7514.7014.6514.6014.5614.5314.5014.4714.4414.4214.4014.3814.3614.3514.3314.3214.27
46 Hydrogeologic and Water-Quality Data, Dahlgren, Virginia
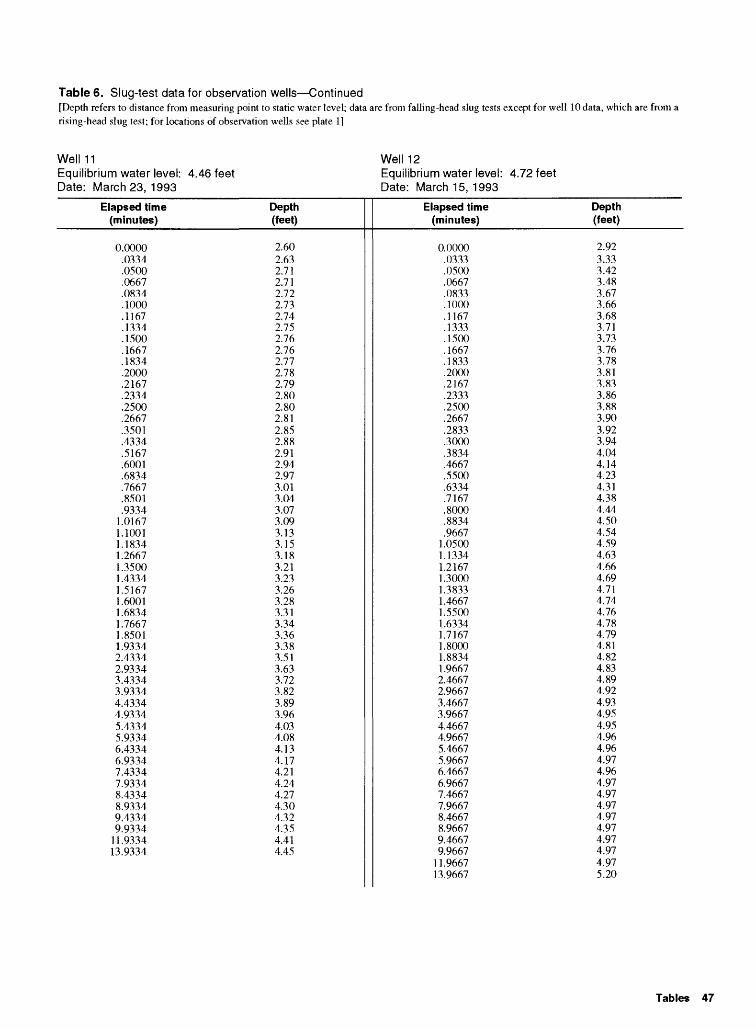
Table 6. Slug-test data for observation wells Continued[Depth refers to distance from measuring point to static water level; data are from falling-head slug tests except for well 10 data, which are from a rising-head slug test; for locations of observation wells see plate 1]
Well 11Equilibrium water level: 4.46 feetDate: March 23, 1993
Well 12Equilibrium water level: 4.72 feetDate: March 15, 1993
Elapsed time (minutes)
0.0000.0334.0500.0667.0834.1000.1167.1334.1500.1667.1834.2000.2167.2334.2500.2667.3501.4334.5167.6001.6834.7667.8501.93341.01671.10011.18341.26671.35001.43341.51671.60011.68341.76671.85011.93342.43342.93343.43343.93344.43344.93345.43345.93346.43346.93347.43347.93348.43348.93349.43349.933411.933413.9334
Depth (feet)
2.602.632.712.712.722.732.742.752.762.762.772.782.792.802.802.812.852.882.912.942.973.013.043.073.093.133.153.183.213.233.263.283.313.343.363.383.513.633.723.823.893.964.034.084.134.174.214.244.274.304.324.354.414.45
Elapsed time (minutes)
0.0000.0333.0500.0667.0833.1000.1167.1333.1500.1667.1833.2000.2167.2333.2500.2667.2833.3000.3834.4667.5500.6334.7167.8000.8834.96671.05001.13341.21671.30001.38331.46671.55001.63341.71671.80001.88341.96672.46672.96673.46673.96674.46674.96675.46675.96676.46676.96677.46677.96678.46678.96679.46679.966711.966713.9667
Depth (feet)
2.923.333.423.483.673.663.683.713.733.763.783.813.833.863.883.903.923.944.044.144.234.314.384.444.504.544.594.634.664.694.714.744.764.784.794.814.824.834.894.924.934.954.954.964.964.974.964.974.974.974.974.974.974.974.975.20
Tables 47
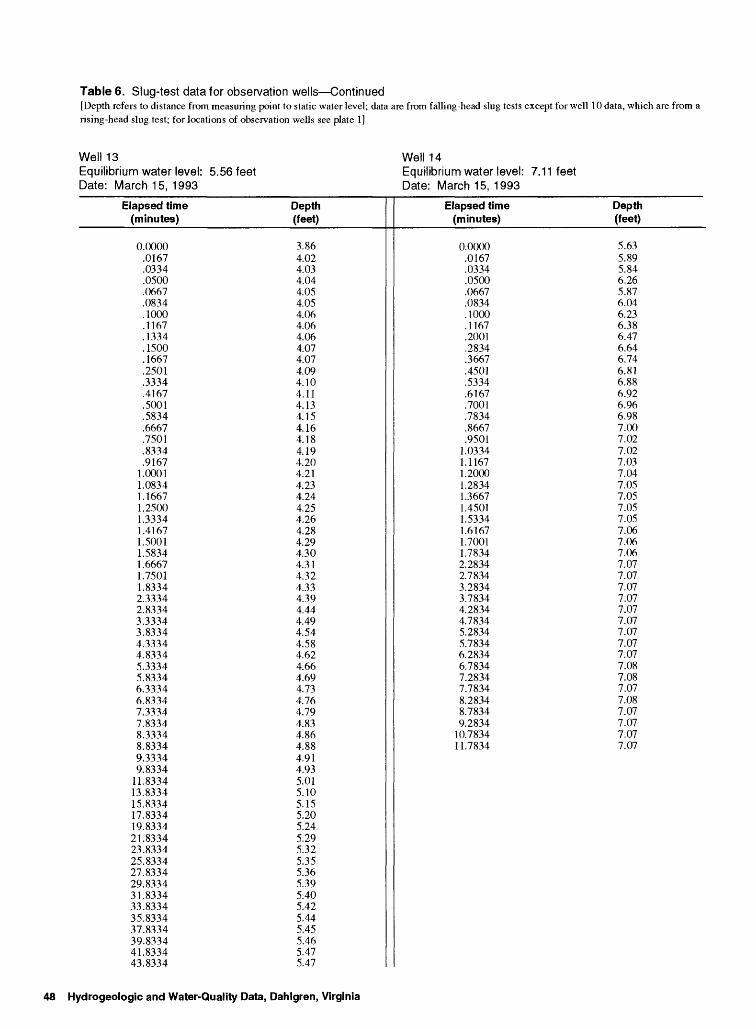
Table 6. Slug-test data for observation wells Continued[Depth refers to distance from measuring point to static water level; data are from falling-head slug tests except for well 10 data, which are from a rising-head slug test; for locations of observation wells see plate 1]
Well 13Equilibrium water level: 5.56 feetDate: March 15, 1993
Well 14Equilibrium water level: 7.11 feetDate: March 15, 1993
Elapsed time (minutes)
0.0000.0167.0334.0500.0667.0834.1000.1167.1334.1500.1667.2501.3334.4167.5001.5834.6667.7501.8334.91671.00011.08341.16671.25001.33341.41671.50011.58341.66671.75011.83342.33342.83343.33343.83344.33344.83345.33345.83346.33346.83347.33347.83348.33348.83349.33349.833411.833413.833415.833417.833419.833421.833423.833425.833427.833429.833431.833433.833435.833437.833439.833441.833443.8334
Depth (feet)
3.864.024.034.044.054.054.064.064.064.074.074.094.104.114.134.154.164.184.194.204.214.234.244.254.264.284.294.304.314.324.334.394.444.494.544.584.624.664.694.734.764.794.834.864.884.914.935.015.105.155.205.245.295.325.355.365.395.405.425.445.455.465.475.47
Elapsed time (minutes)
0.0000.0167.0334.0500.0667.0834.1000.1167.2001.2834.3667.4501.5334.6167.7001.7834.8667.95011.03341.11671.20001.28341.36671.45011.53341.61671.70011.78342.28342.78343.28343.78344.28344.78345.28345.78346.28346.78347.28347.78348.28348.78349.283410.783411.7834
Depth (feet)
5.635.895.846.265.876.046.236.386.476.646.746.816.886.926.966.987.007.027.027.037.047.057.057.057.057.067.067.067.077.077.077.077.077.077.077.077.077.087.087.077.087.077.077.077.07
48 Hydrogeologic and Water-Quality Data, Dahlgren, Virginia
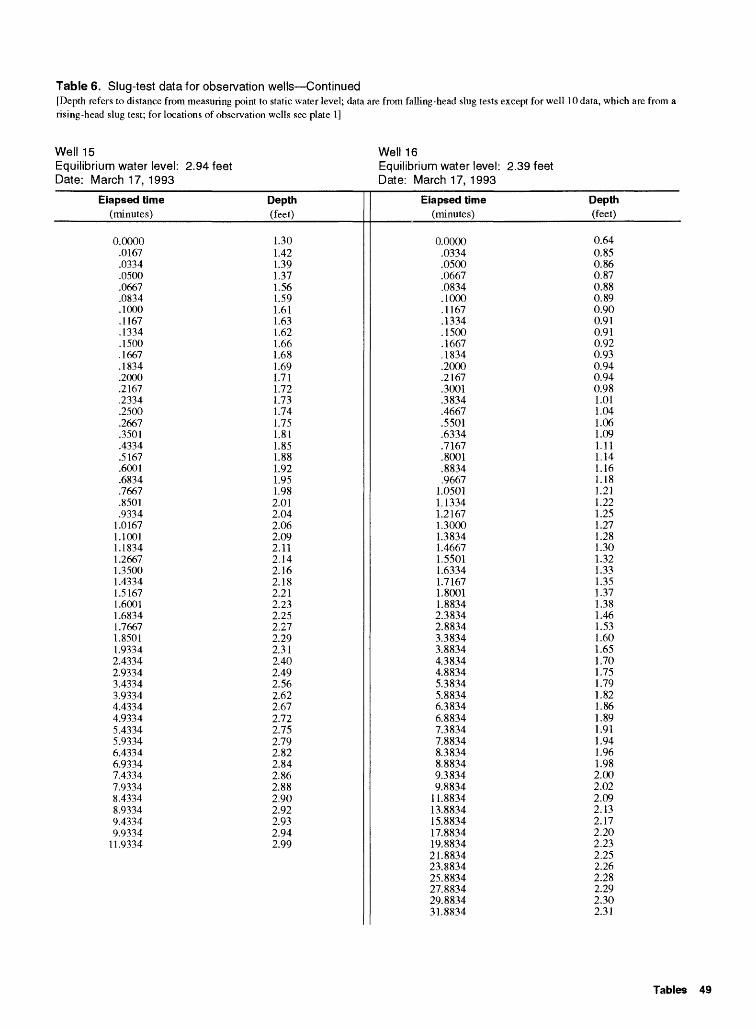
Table 6. Slug-test data for observation wells Continued[Depth refers to distance from measuring point to static water level; data are from falling-head slug tests except for well 10 data, which are from a rising-head slug test; for locations of observation wells see plate 1]
Well 15Equilibrium water level: 2.94 feetDate: March 17, 1993
Well 16Equilibrium water level: 2.39 feetDate: March 17, 1993
Elapsed time(minutes)
0.0000.0167.0334.0500.0667.0834.1000.1167.1334.1500.1667.1834.2000.2167.2334.2500.2667.3501.4334.5167.6001.6834.7667.8501.93341.01671.10011.18341.26671.35001.4334.5167.6001.6834.7667.8501
1.93342.43342.93343.43343.93344.43344.93345.43345.93346.43346.93347.43347.93348.43348.93349.43349.933411.9334
Depth(feet)
1.301.421.391.371.561.591.611.631.621.661.681.691.711.721.731.741.751.811.851.881.921.951.982.012.042.062.092.112.142.162.182.212.232.252.272.292.312.402.492.562.622.672.722.752.792.822.842.862.882.902.922.932.942.99
Elapsed time(minutes)
0.0000.0334.0500.0667.0834.1000.1167.1334.1500.1667.1834.2000.2167.3001.3834.4667.5501.6334.7167.8001.8834.9667
1.05011.13341.21671.30001.38341.46671.55011.63341.71671.80011.88342.38342.88343.38343.88344.38344.88345.38345.88346.38346.88347.38347.88348.38348.88349.38349.883411.883413.883415.883417.883419.883421.883423.883425.883427.883429.883431.8834
Depth(feet)
0.640.850.860.870.880.890.900.910.910.920.930.940.940.981.011.041.061.091.111.141.161.181.211.221.251.271.281.301.321.331.351.371.381.461.531.601.651.701.751.791.821.861.891.911.941.961.982.002.022.092.132.172.202.232.252.262.282.292.302.31
Tables 49
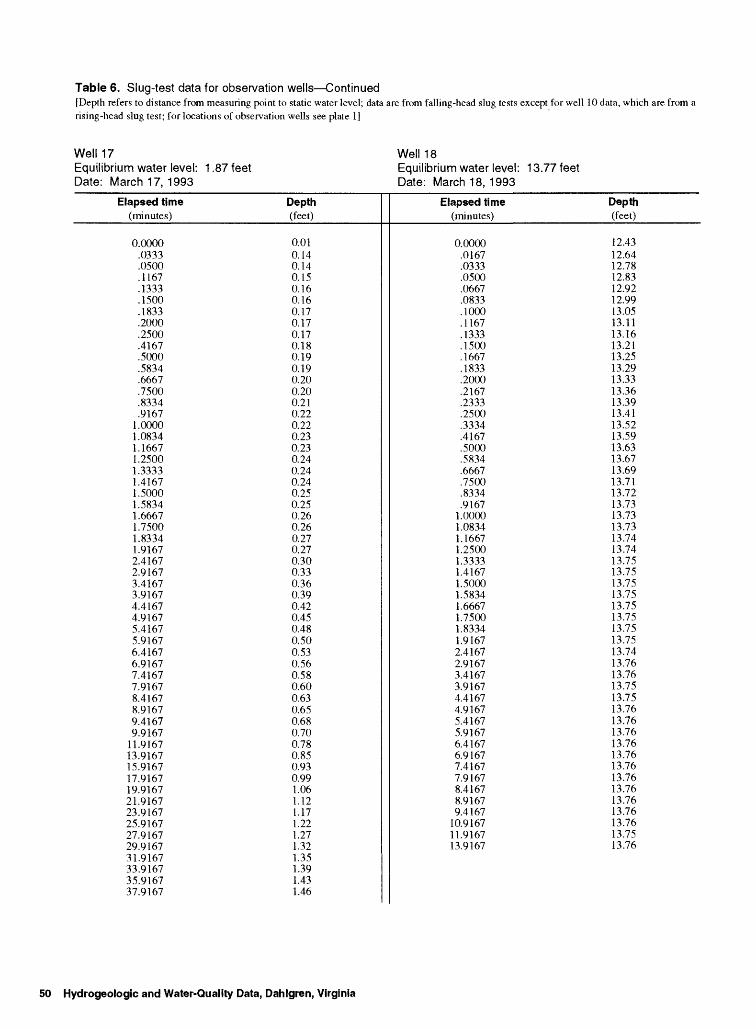
Table 6. Slug-test data for observation wells Continued[Depth refers to distance from measuring point to static water level; data are from falling-head slug tests except for well 10 data, which are from a rising-head slug test; for locations of observation wells see plate 1]
Well 17Equilibrium water level: 1.87 feetDate: March 17, 1993
Well 18Equilibrium water level: 13.77 feetDate: March 18, 1993
Elapsed time(minutes)
0.0000.0333.0500.1167.1333.1500.1833.2000.2500.4167.5000.5834.6667.7500.8334.91671.00001.08341.16671.25001.33331.41671.50001.58341.66671.75001.83341.91672.41672.91673.41673.91674.41674.91675.41675.91676.41676.91677.41677.91678.41678.91679.41679.916711.916713.916715.916717.916719.916721.916723.916725.916727.916729.916731.916733.916735.916737.9167
Depth(feet)
0.010.140.140.150.160.160.170.170.170.180.190.190.200.200.210.220.220.230.230.240.240.240.250.250.260.260.270.270.300.330.360.390.420.450.480.500.530.560.580.600.630.650.680.700.780.850.930.991.061.121.171.221.271.321.351.391.431.46
Elapsed time(minutes)
0.0000.0167.0333.0500.0667.0833.1000.1167.1333.1500.1667.1833.2000.2167.2333.2500.3334.4167.5000.5834.6667.7500.8334.91671.00001.08341.16671.25001.33331.41671.50001.58341.66671.75001.83341.91672.41672.91673.41673.91674.41674.91675.41675.91676.41676.91677.41677.91678.41678.91679.416710.916711.916713.9167
Depth(feet)
12.4312.6412.7812.8312.9212.9913.0513.1113.1613.2113.2513.2913.3313.3613.3913.4113.5213.5913.6313.6713.6913.7113.7213.7313.7313.7313.7413.7413.7513.7513.7513.7513.7513.7513.7513.7513.7413.7613.7613.7513.7513.7613.7613.7613.7613.7613.7613.7613.7613.7613.7613.7613.7513.76
50 Hydrogeologic and Water-Quality Data, Dahlgren, Virginia
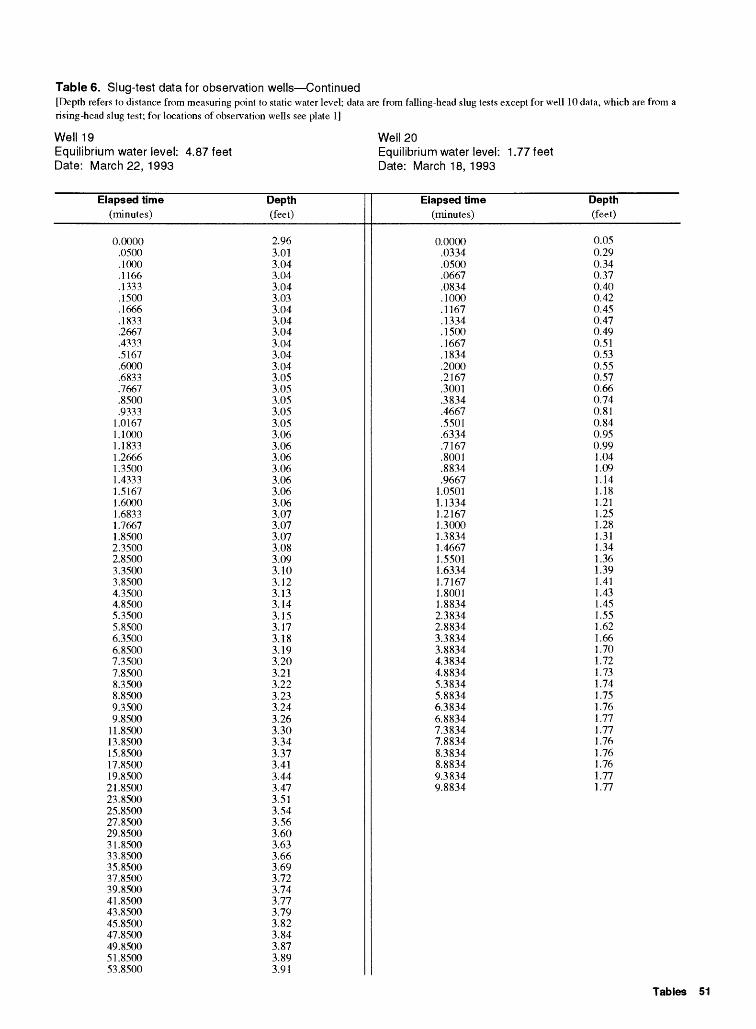
Table 6. Slug-test data for observation wells Continued[Depth refers to distance from measuring point to static water level; data are from falling-head slug tests except for well 10 data, which are from rising-head slug test; for locations of observation wells see plate 1]
Well 19Equilibrium water level: 4.87 feetDate: March 22, 1993
Well 20Equilibrium water level: 1.77 feetDate: March 18, 1993
Elapsed time(minutes)
0.0000.0500.1000.1166.1333.1500.1666.1833.2667.4333.5167.6000.6833.7667.8500.9333
1.01671.10001.18331.26661.35001.43331.51671.60001.68331.76671.85002.35002.85003.35003.85004.35004.85005.35005.85006.35006.85007.35007.85008.35008.85009.35009.850011.850013.850015.850017.850019.850021.850023.850025.850027.850029.850031.850033.850035.850037.850039.850041.850043.850045.850047.850049.850051.850053.8500
Depth(feet)
2.963.013.043.043.043.033.043.043.043.043.043.043.053.053.053.053.053.063.063.063.063.063.063.063.073.073.073.083.093.103.123.133.143.153.173.183.193.203.213.223.233.243.263.303.343.373.413.443.473.513.543.563.603.633.663.693.723.743.773.793.823.843.873.893.91
Elapsed time(minutes)
0.0000.0334.0500.0667.0834.1000.1167.1334.1500.1667.1834.2000.2167.3001.3834.4667.5501.6334.7167.8001.8834.96671.05011.13341.21671.30001.38341.46671.55011.63341.71671.80011.88342.38342.88343.38343.88344.38344.88345.38345.88346.38346.88347.38347.88348.38348.88349.38349.8834
Depth(feet)
0.050.290.340.370.400.420.450.470.490.510.530.550.570.660.740.810.840.950.991.041.091.141.181.211.251.281.311.341.361.391.411.431.451.551.621.661.701.721.731.741.751.761.771.771.761.761.761.771.77
Tables 51
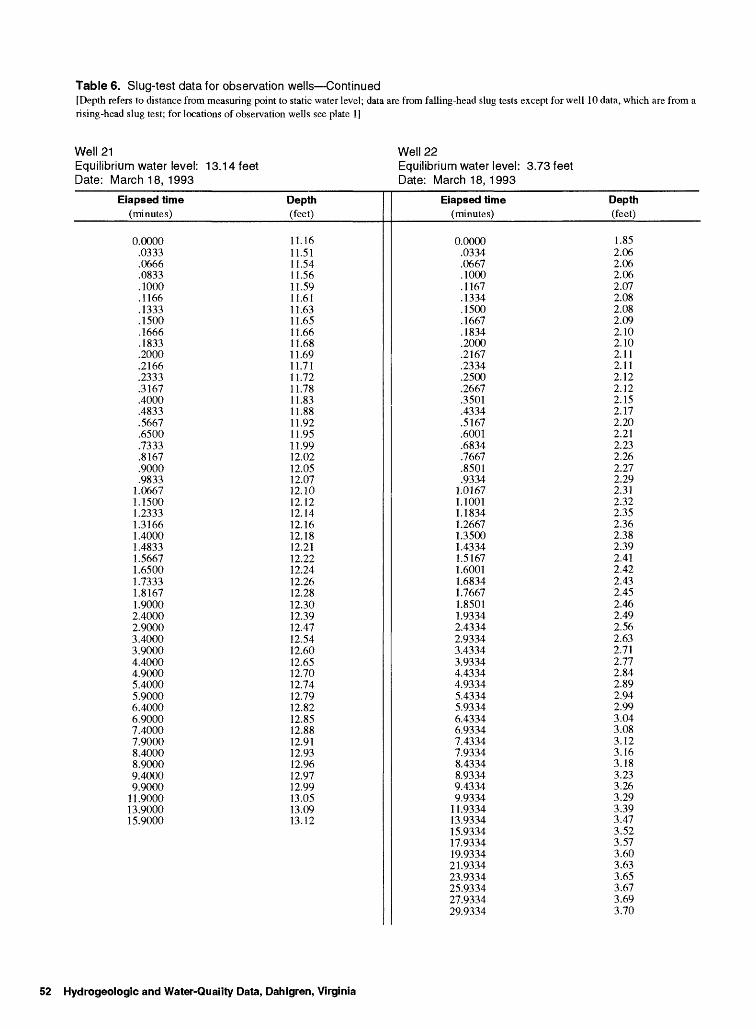
Table 6. Slug-test data for observation wells Continued[Depth refers to distance from measuring point to static water level; data are from falling-head slug tests except for well 10 data, which are from a rising-head slug test; for locations of observation wells see plate 1]
Well 21Equilibrium water level: 13.14 feetDate: March 18, 1993
Well 22Equilibrium water level: 3.73 feetDate: March 18, 1993
Elapsed time(minutes)
0.0000.0333.0666.0833.1000.1166.1333.1500.1666.1833.2000.2166.2333.3167.4000.4833.5667.6500.7333.8167.9000.9833
1.06671.15001.23331.31661.40001.48331.56671.65001.73331.81671.90002.40002.90003.40003.90004.40004.90005.40005.90006.40006.90007.40007.90008.40008.90009.40009.900011.900013.900015.9000
Depth(feet)
11.1611.5111.5411.5611.5911.6111.6311.6511.6611.6811.6911.7111.7211.7811.8311.8811.9211.9511.9912.0212.0512.0712.1012.1212.1412.1612.1812.2112.2212.2412.2612.2812.3012.3912.4712.5412.6012.6512.7012.7412.7912.8212.8512.8812.9112.9312.9612.9712.9913.0513.0913.12
Elapsed time(minutes)
0.0000.0334.0667.1000.1167.1334.1500.1667.1834.2000.2167.2334.2500.2667.3501.4334.5167.6001.6834.7667.8501.9334
1.01671.10011.18341.26671.35001.43341.51671.60011.68341.76671.85011.93342.43342.93343.43343.93344.43344.93345.43345.93346.43346.93347.43347.93348.43348.93349.43349.933411.933413.933415.933417.933419.933421.933423.933425.933427.933429.9334
Depth(feet)
1.852.062.062.062.072.082.082.092.102.102.112.112.122.122.152.172.202.212.232.262.272.292.312.322.352.362.382.392.412.422.432.452.462.492.562.632.712.772.842.892.942.993.043.083.123.163.183.233.263.293.393.473.523.573.603.633.653.673.693.70
52 Hydrogeologic and Water-Quality Data, Dahlgren, Virginia
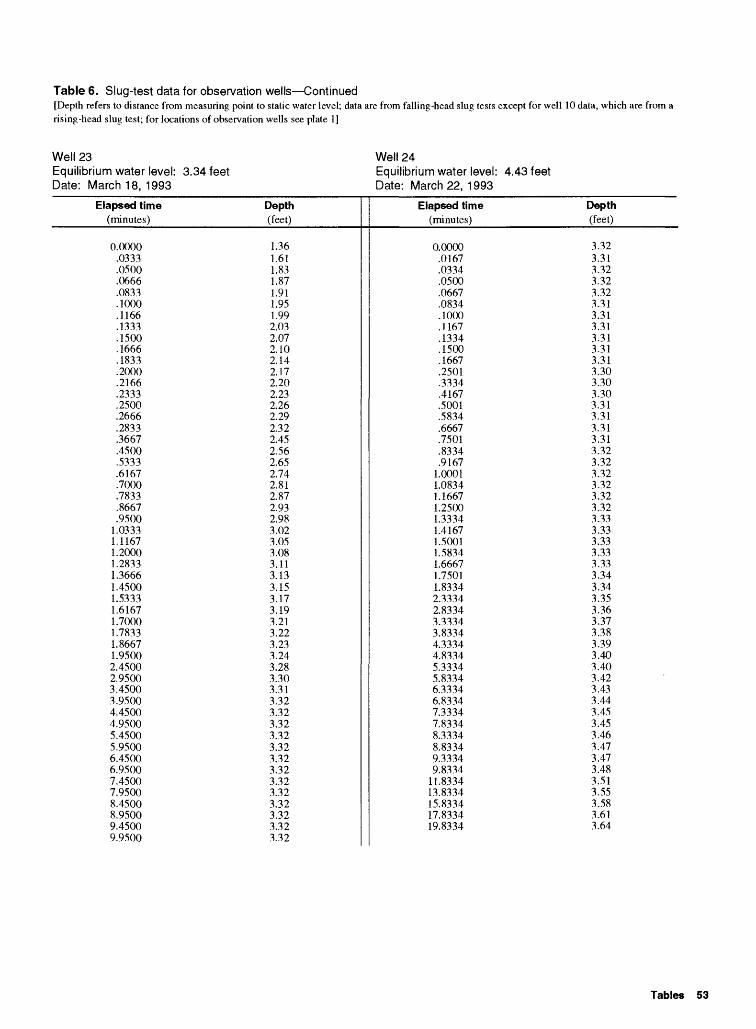
Table 6. Slug-test data for observation wells Continued[Depth refers to distance from measuring point to static water level; data are from falling-head slug tests except for well 10 data, which are from a rising-head slug test; for locations of observation wells see plate 1]
Well 23Equilibrium water level: 3.34 feetDate: March 18, 1993
Well 24Equilibrium water level: 4.43 feetDate: March 22, 1993
Elapsed time(minutes)
0.0000.0333.0500.0666.0833.1000.1166.1333.1500.1666.1833.2000.2166.2333.2500.2666.2833.3667.4500.5333.6167.7000.7833.8667.95001.03331.11671.20001.28331.36661.45001.53331.61671.70001.78331.86671.95002.45002.95003.45003.95004.45004.95005.45005.95006.45006.95007.45007.95008.45008.95009.45009.9500
Depth(feet)
1.361.611.831.871.911.951.992.032.072.102.142.172.202.232.262.292.322.452.562.652.742.812.872.932.983.023.053.083.113.133.153.173.193.213.223.233.243.283.303.313.323.323.323.323.323.323.323.323.323.323.323.323.32
Elapsed time(minutes)
0.0000.0167.0334.0500.0667.0834.1000.1167.1334.1500.1667.2501.3334.4167.5001.5834.6667.7501.8334.91671.00011.08341.16671.25001.33341.41671.50011.58341.66671.75011.83342.33342.83343.33343.83344.33344.83345.33345.83346.33346.83347.33347.83348.33348.83349.33349.833411.833413.833415.833417.833419.8334
Depth(feet)
3.323.313.323.323.323.313.313.313.313.313.313.303.303.303.313.313.313.313.323.323.323.323.323.323.333.333.333.333.333.343.343.353.363.373.383.393.403.403.423.433.443.453.453.463.473.473.483.513.553.583.613.64
Tables 53
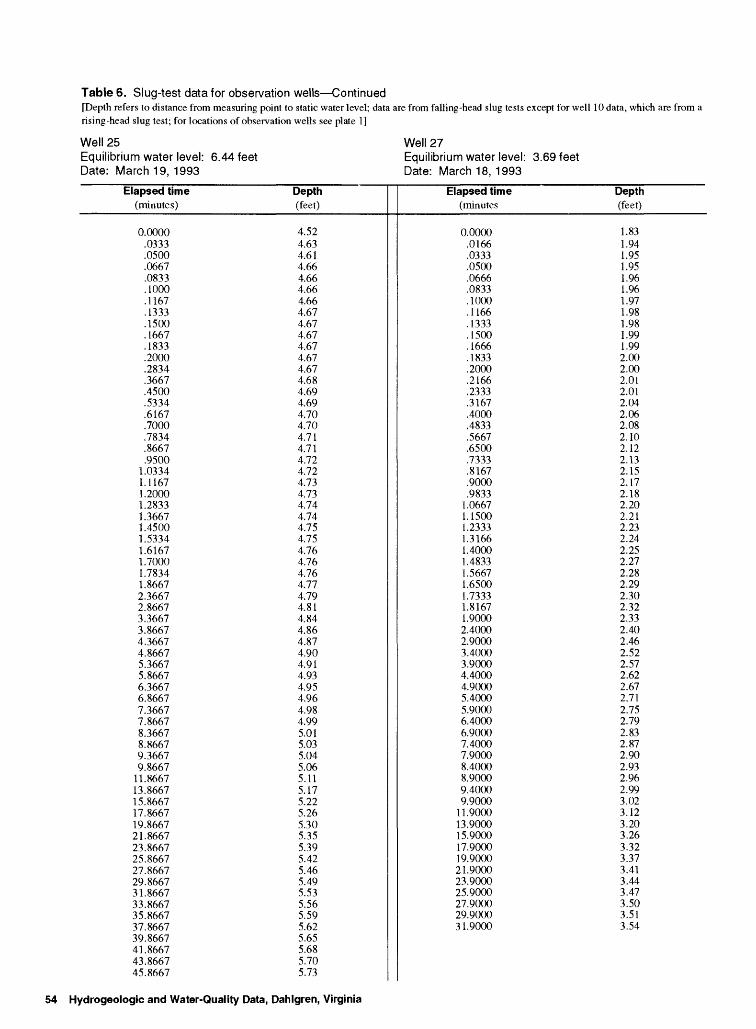
Table 6. Slug-test data for observation wells Continued[Depth refers to distance from measuring point to static water level; data are from falling-head slug tests except for well 10 data, which are from a rising-head slug test; for locations of observation wells see plate 1]
Well 25Equilibrium water level: 6.44 feetDate: March 19, 1993
Well 27Equilibrium water level: 3.69 feetDate: March 18, 1993
Elapsed time(minutes)
0.0000.0333.0500.0667.0833.1000.1167.1333.1500.1667.1833.2000.2834.3667.4500.5334.6167.7000.7834.8667.9500
1.03341.11671.20001.28331.36671.45001.53341.61671.70001.78341.86672.36672.86673.36673.86674.36674.86675.36675.86676.36676.86677.36677.86678.36678.86679.36679.866711.866713.866715.866717.866719.866721.866723.866725.866727.866729.866731.866733.866735.866737.866739.866741.866743.866745.8667
Depth(feet)
4.524.634.614.664.664.664.664.674.674.674.674.674.674.684.694.694.704.704.714.714.724.724.734.734.744.744.754.754.764.764.764.774.794.814.844.864.874.904.914.934.954.964.984.995.015.035.045.065.115.175.225.265.305.355.395.425.465.495.535.565.595.625.655.685.705.73
Elapsed time(minutes
0.0000.0166.0333.0500.0666.0833.1000.1166.1333.1500.1666.1833.2000.2166.2333.3167.4000.4833.5667.6500.7333.8167.9000.98331.06671.15001.23331.31661.40001.48331.56671.65001.73331.81671.90002.40002.90003.40003.90004.40004.90005.40005.90006.40006.90007.40007.90008.40008.90009.40009.900011.900013.900015.900017.900019.900021.900023.900025.900027.900029.900031.9000
Depth(feet)
1.831.941.951.951.961.961.971.981.981.991.992.002.002.012.012.042.062.082.102.122.132.152.172.182.202.212.232.242.252.272.282.292.302.322.332.402.462.522.572.622.672.712.752.792.832.872.902.932.962.993.023.123.203.263.323.373.413.443.473.503.513.54
54 Hydrogeologic and Water-Quality Data, Dahlgren, Virginia

Table 6. Slug-test data for observation wells Continued[Depth refers to distance from measuring point to static water level; data are from falling-head slug tests except for well 10 data, which are from a rising-head slug test; for locations of observation wells see plate 1]
Well 28Equilibrium water level: 5.38 feetDate: March 19, 1993
Well 29Equilibrium water level: 5.88 feetDate: March 19, 1993
Elapsed time(minutes)
0.0000.0166.0333.0500.0666.0833.1667.2500.3333.4167.5000.5833.6667.7500.8333.91671.00001.08331.16661.25001.33331.41671.50001.58331.66671.75002.25002.75003.25003.75004.25004.75005.25005.75006.25006.75007.25007.75008.25008.75009.25009.750011.750013.750015.750017.750019.750021.750023.750025.750027.750029.750031.750033.750035.7500
Depth(feet)
3.723.723.723.733.723.733.743.753.773.783.793.803.813.823.833.843.853.863.873.883.893.903.913.923.923.933.984.024.064.104.144.174.204.244.274.304.334.364.394.414.444.474.564.654.724.794.844.904.955.005.035.075.105.135.16
Elapsed time(minutes)
0.0000.0334.0500.0667.0834.1000.1167.1334.1500.1667.1834.2000.2167.2334.2500.2667.3501.4334.5167.6001.6834.7667.8501.93341.01671.10011.18341.26671.35001.43341.51671.60011.68341.76671.85011.93342.43342.93343.43343.93344.43344.93345.43345.93346.43346.93347.43347.93348.43348.93349.43349.933411.9334
Depth(feet)
4.124.194.204.214.234.244.264.264.284.294.304.324.334.344.354.364.414.454.504.544.584.624.664.704.734.774.804.834.864.894.924.954.985.005.035.065.205.315.405.485.555.605.645.685.715.745.755.775.795.805.815.825.84
Tables 55
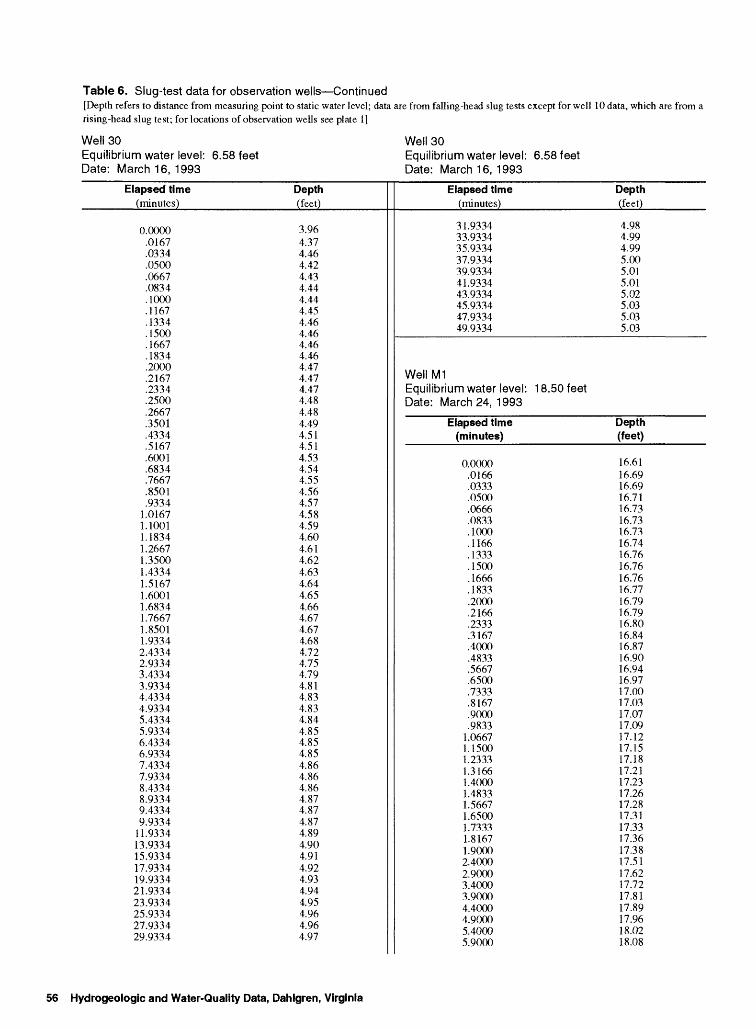
Table 6. Slug-test data for observation wells Continued[Depth refers to distance from measuring point to static water level; data are from falling-head slug tests except for well 10 data, which are from arising-head slug test; for locations of observation wells see plate 1]
Well 30Equilibrium water level: 6.58 feetDate: March 16, 1993
Well 30Equilibrium water level: 6.58 feetDate: March 16, 1993
Elapsed time(minutes)
0.0000 .0167 .0334 .0500 .0667 .0834 .1000 .1167 .1334 .1500 .1667 .1834 .2000 .2167 .2334 .2500 .2667 .3501 .4334 .5167 .6001 .6834 .7667 .8501 .9334
1.0167 1.1001 1.1834 1.2667 1.3500 1.4334 1.5167 1.6001 1.6834 1.7667 1.8501 1.9334 2.4334 2.9334 3.4334 3.9334 4.4334 4.9334 5.4334 5.9334 6.4334 6.9334 7.4334 7.9334 8.4334 8.9334 9.4334 9.9334
11.9334 13.9334 15.9334 17.9334 19.9334 21.9334 23.9334 25.9334 27.9334 29.9334
Depth(feet)
3.96 4.37 4.46 4.42 4.43 4.44 4.44 4.45 4.46 4.46 4.46 4.46 4.47 4.47 4.47 4.48 4.48 4.49 4.51 4.51 4.53 4.54 4.55 4.56 4.57 4.58 4.59 4.60 4.61 4.62 4.63 4.64 4.65 4.66 4.67 4.67 4.68 4.72 4.75 4.79 4.81 4.83 4.83 4.84 4.85 4.85 4.85 4.86 4.86 4.86 4.87 4.87 4.87 4.89 4.90 4.91 4.92 4.93 4.94 4.95 4.96 4.96 4.97
Elapsed time(minutes)
31.9334 33.9334 35.9334 37.9334 39.9334 41.9334 43.9334 45.9334 47.9334 49.9334
Depth(feet)
4.98 4.99 4.99 5.00 5.01 5.01 5.02 5.03 5.03 5.03
Well M1 Equilibrium water level: 18. 50 feet Date: March 24, 1 993
Elapsed time (minutes)
0.0000 .0166 .0333 .0500 .0666 .0833 .1000 .1166 .1333 .1500 .1666 .1833 .2000 .2166 .2333 .3167 .4000 .4833 .5667 .6500 .7333 .8167 .9000 .9833
1.0667 1.1500 1.2333 1.3166 1.4000 1.4833 1.5667 1.6500 1.7333 1.8167 1.9000 2.4000 2.9000 3.4000 3.9000 4.4000 4.9000 5.4000 5.9000
Depth (feet)
16.61 16.69 16.69 16.71 16.73 16.73 16.73 16.74 16.76 16.76 16.76 16.77 16.79 16.79 16.80 16.84 16.87 16.90 16.94 16.97 17.00 17.03 17.07 17.09 17.12 17.15 17.18 17.21 17.23 17.26 17.28 17.31 17.33 17.36 17.38 17.51 17.62 17.72 17.81 17.89 17.96 18.02 18.08
56 Hydrogeologic and Water-Quality Data, Dahlgren, Virginia

Table 6. Slug-test data for observation wells Continued[Depth refers to distance from measuring point to static water level; data are from falling-head slug tests except for well 10 data, which are from a rising-head slug test; for locations of observation wells see plate 1]
Well M1Equilibrium water level: 18.50 feetDate: March 24, 1993
Well M2Equilibrium water level: 16.86 feetDate: March 23, 1993
Elapsed time (minutes)
6.40006.90007.40007.90008.40008.90009.40009.9000
11.900013.900015.900017.900019.9000
Well M2Equilibrium water level: 16.86 feet Date: March 23, 1993
Elapsed time (minutes)
0.0000.0167.0500.1000.1167.1333.1500.1667.1833.2000.2167.2333.2500.3334.4167.5000.5834.6667.7500.8334.9167
1.00001.08341.16671.25001.33331.41671.50001.58341.66671.75001.83341.91672.41672.91673.41673.91674.4167
Depth (feet)
18.1318.1718.2118.2518.2818.3118.3318.3618.4318.4718.5018.5218.53
Depth (feet)
15.0115.0415.0415.0515.0515.0615.0615.0615.0615.0615.0615.0615.0615.0715.0715.0715.0715.0815.0815.0815.0815.0815.0815.0915.0915.1015.1015.1015.1015.1115.1115.1115.1115.1215.1415.1515.1615.17
Elapsed time (minutes)
4.91675.41675.91676.41676.91677.41677.91678.41678.91679.41679.9167
11.916713.916715.9167 17.916719.916721.916723.9167 25.9167 27.916729.9167 31.9167 33.916735.916737.916739.916741.916743.916745.916747.916749.916751.916753.916755.916757.916759.9167
Depth (feet)
15.1815.1915.2015.2115.2215.2315.2415.2515.2615.2715.2815.3215.3615.39 15.4215.4515.4815.51 15.54 15.5715.60 15.63 15.6515.6815.7015.7215.7515.7615.7915.8115.8315.8515.8715.8915.9015.92
Tables 57
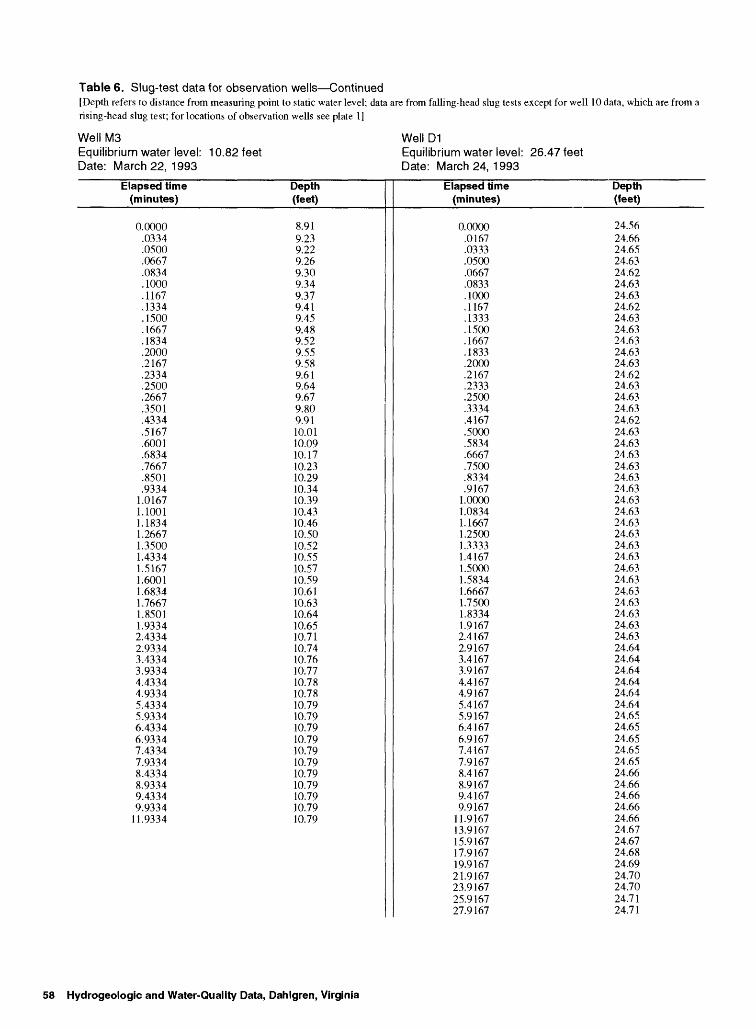
Table 6. Slug-test data for observation wells Continued[Depth refers to distance from measuring point to static water level; data are from falling-head slug tests except for well 10 data, which are from a rising-head slug test; for locations of observation wells see plate 1]
Well M3Equilibrium water level: 10.82 feetDate: March 22, 1993
Well D1Equilibrium water level: 26.47 feetDate: March 24, 1993
Elapsed time (minutes)
0.0000.0334.0500.0667.0834.1000.1167.1334.1500.1667.1834.2000.2167.2334.2500.2667.3501.4334.5167.6001.6834.7667.8501.9334
1.01671.10011.18341.26671.35001.43341.51671.60011.68341.76671.85011.93342.43342.93343.43343.93344.43344.93345.43345.93346.43346.93347.43347.93348.43348.93349.43349.9334
11.9334
Depth (feet)
8.919.239.229.269.309.349.379.419.459.489.529.559.589.619.649.679.809.9110.0110.0910.1710.2310.2910.3410.3910.4310.4610.5010.5210.5510.5710.5910.6110.6310.6410.6510.7110.7410.7610.7710.7810.7810.7910.7910.7910.7910.7910.7910.7910.7910.7910.7910.79
Elapsed time (minutes)
0.0000.0167.0333.0500.0667.0833.1000.1167.1333.1500.1667.1833.2000.2167.2333.2500.3334.4167.5000.5834.6667.7500.8334.9167
1.00001.08341.16671.25001.33331.41671.50001.58341.66671.75001.83341.91672.41672.91673.41673.91674.41674.91675.41675.91676.41676.91677.41677.91678.41678.91679.41679.9167
11.916713.916715.916717.916719.916721.916723.916725.916727.9167
Depth (feet)
24.5624.6624.6524.6324.6224.6324.6324.6224.6324.6324.6324.6324.6324.6224.6324.6324.6324.6224.6324.6324.6324.6324.6324.6324.6324.6324.6324.6324.6324.6324.6324.6324.6324.6324.6324.6324.6324.6424.6424.6424.6424.6424.6424.6524.6524.6524.6524.6524.6624.6624.6624.6624.6624.6724.6724.6824.6924.7024.7024.7124.71
58 Hydrogeologic and Water-Quality Data, Dahlgren, Virginia
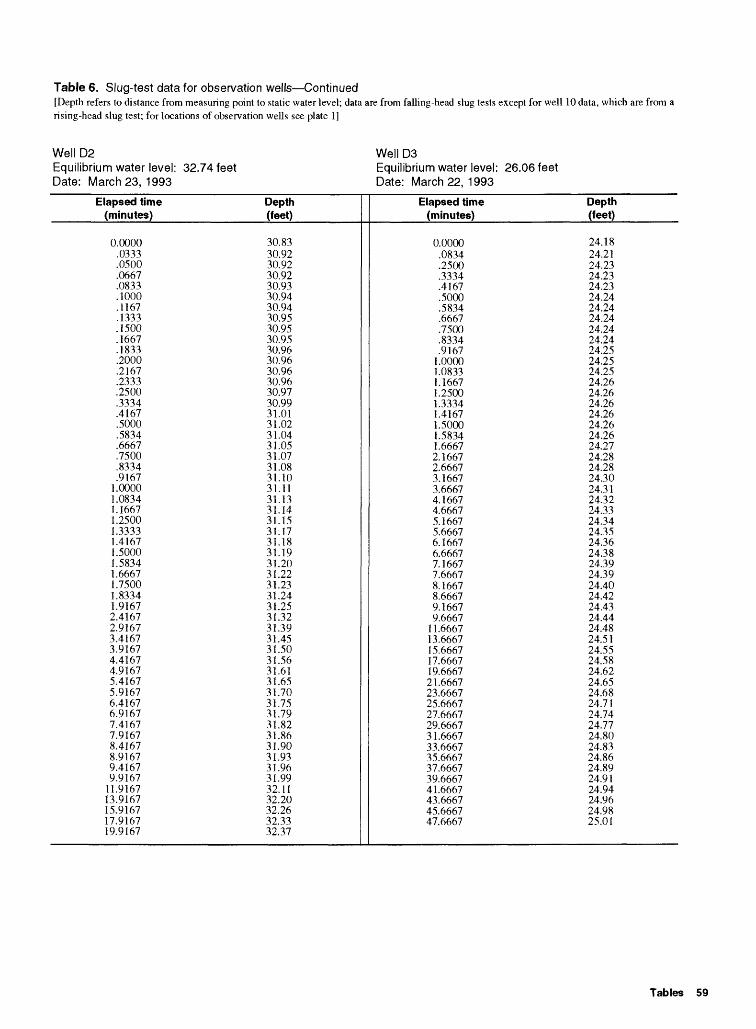
Table 6. Slug-test data for observation wells Continued[Depth refers to distance from measuring point to static water level; data are from falling-head slug tests except for well 10 data, which are from a rising-head slug test; for locations of observation wells see plate 1]
Well D2Equilibrium water level: 32.74 feetDate: March 23, 1993
Well D3Equilibrium water level: 26.06 feetDate: March 22, 1993
Elapsed time (minutes)
0.0000.0333.0500.0667.0833.1000.1167.1333.1500.1667.1833.2000.2167.2333.2500.3334.4167.5000.5834.6667.7500.8334.91671.00001.08341.16671.25001.33331.41671.50001.58341.66671.75001.83341.91672.41672.91673.41673.91674.41674.91675.41675.91676.41676.91677.41677.91678.41678.91679.41679.916711.916713.916715.916717.916719.9167
Depth (feet)
30.8330.9230.9230.9230.9330.9430.9430.9530.9530.9530.9630.9630.9630.9630.9730.9931.0131.0231.0431.0531.0731.0831.1031.1131.1331.1431.1531.1731.1831.1931.2031.2231.2331.2431.2531.3231.3931.4531.5031.5631.6131.6531.7031.7531.7931.8231.8631.9031.9331.9631.9932.1132.2032.2632.3332.37
Elapsed time (minutes)
0.0000.0834.2500.3334.4167.5000.5834.6667.7500.8334.91671.00001.08331.16671.25001.33341.41671.50001.58341.66672.16672.66673.16673.66674.16674.66675.16675.66676.16676.66677.16677.66678.16678.66679.16679.666711.666713.666715.666717.666719.666721.666723.666725.666727.666729.666731.666733.666735.666737.666739.666741.666743.666745.666747.6667
Depth (feet)
24.1824.2124.2324.2324.2324.2424.2424.2424.2424.2424.2524.2524.2524.2624.2624.2624.2624.2624.2624.2724.2824.2824.3024.3124.3224.3324.3424.3524.3624.3824.3924.3924.4024.4224.4324.4424.4824.5124.5524.5824.6224.6524.6824.7124.7424.7724.8024.8324.8624.8924.9124.9424.9624.9825.01
Tables 59
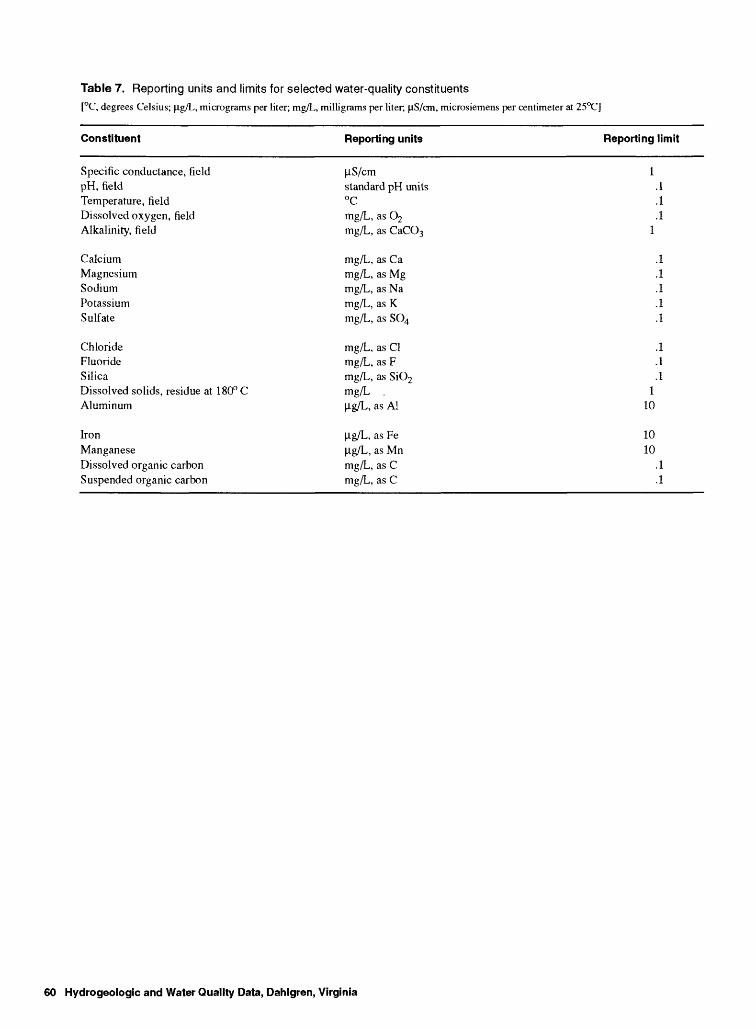
Table 7. Reporting units and limits for selected water-quality constituents
[°C, degrees Celsius; ug/L, micrograms per liter; mg/L, milligrams per liter, uS/cm, microsiemens per centimeter at 25°C]
Constituent Reporting units Reporting limit
Specific conductance, field pH, fieldTemperature, field Dissolved oxygen, field Alkalinity, field
CalciumMagnesiumSodiumPotassiumSulfate
ChlorideFluorideSilicaDissolved solids, residue at 180° CAluminum
IronManganeseDissolved organic carbonSuspended organic carbon
(iS/cmstandard pH units°C
mg/L, as O2mg/L, as CaCO3
mg/L, as Ca mg/L, as Mg mg/L, as Na mg/L, as K mg/L, as SO4
mg/L, as Cl mg/L, as F mg/L, as SiO2 mg/L . (j.g/L, as Al
iig/L, as Fe iig/L, as Mn mg/L, as C mg/L, as C
110
1010
60 Hydrogeologic and Water Quality Data, Dahlgren, Virginia
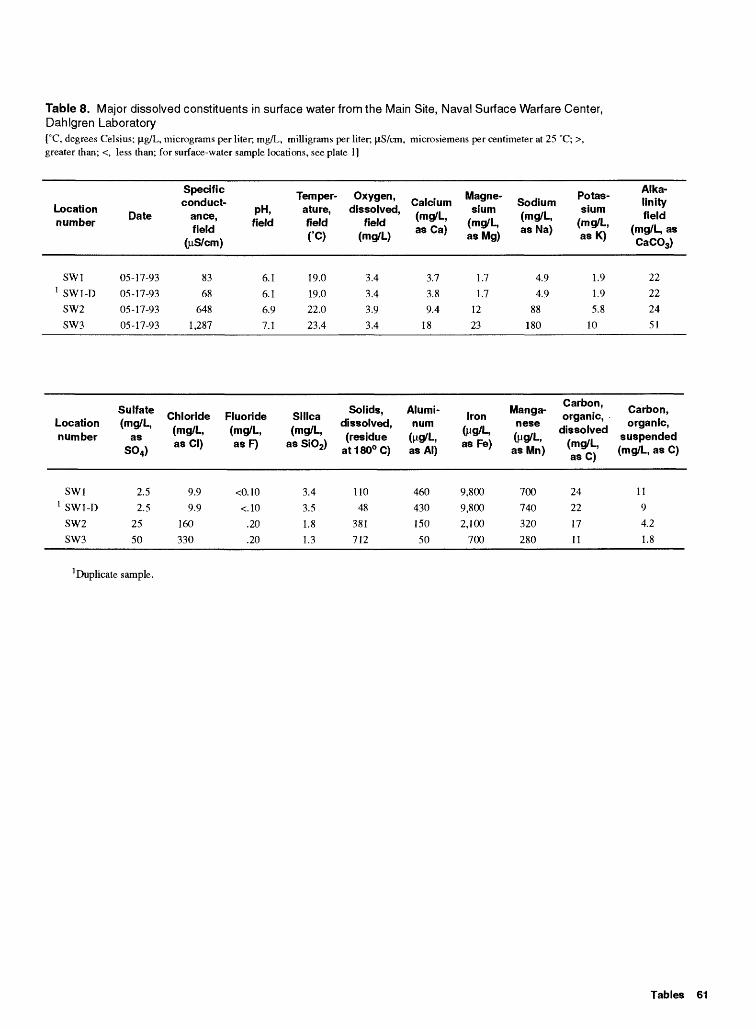
Table 8. Major dissolved constituents in surface water from the Main Site, Naval Surface Warfare Center, Dahlgren Laboratory[°C, degrees Celsius; (ig/L, micrograms per liter, mg/L, milligrams per liter, |J.S/cm, microsiemens per centimeter at 25 °C; >, greater than; <, less than; for surface-water sample locations, see plate 1]
Location number
SW1 1 SW1-D
SW2
SW3
Date
05-17-93 05-17-93
05-17-93
05-17-93
Specificconduct- .,
pH, ance, J7 'field fleld
(uS/cm)
83 6.1
68 6.1
648 6.9
1,287 7.1
Temper ature, field
19.0
19.0
22.0
23.4
Oxygen, dissolved,
field (mg/L)
3.4
3.4
3.9
3.4
Calcium (mg/L, as Ca)
3.7
3.8
9.4
18
Magne sium
(mg/L, asMg)
1.7
1.7
12
23
Sodium (mg/L, asNa)
4.9
4.9
88
180
Potas sium
(mg/L, asK)
1.9
1.9
5.8
10
Alka linity field
(mg/L, as CaC03)
22
22
24
51
Location number
SW1 1 SW1-D
SW2
SW3
Sulfate (mg/L,
as S04)
2.5
2.5
25
50
Chloride Fluoride (mg/L, (mg/L, as Cl) as F)
9.9 <0.10
9.9 <.10
160 .20
330 .20
Silica (mg/L,
as SiO2)
3.4
3.5
1.8
1.3
Solids, dissolved, (residue
at180°C)
110
48
381
712
Alumi num
as Alj
460
430
150
50
Iron(M9/U as Fe)
9,800
9,800
2,100
700
Manga nese (M9/U as Mn)
700
740
320
280
Carbon, organic,
dissolved (mg/L, asC)
24
22
17
11
Carbon, organic,
suspended (mg/L, as C)
11
94.2
1.8
'Duplicate sample.
Tables 61
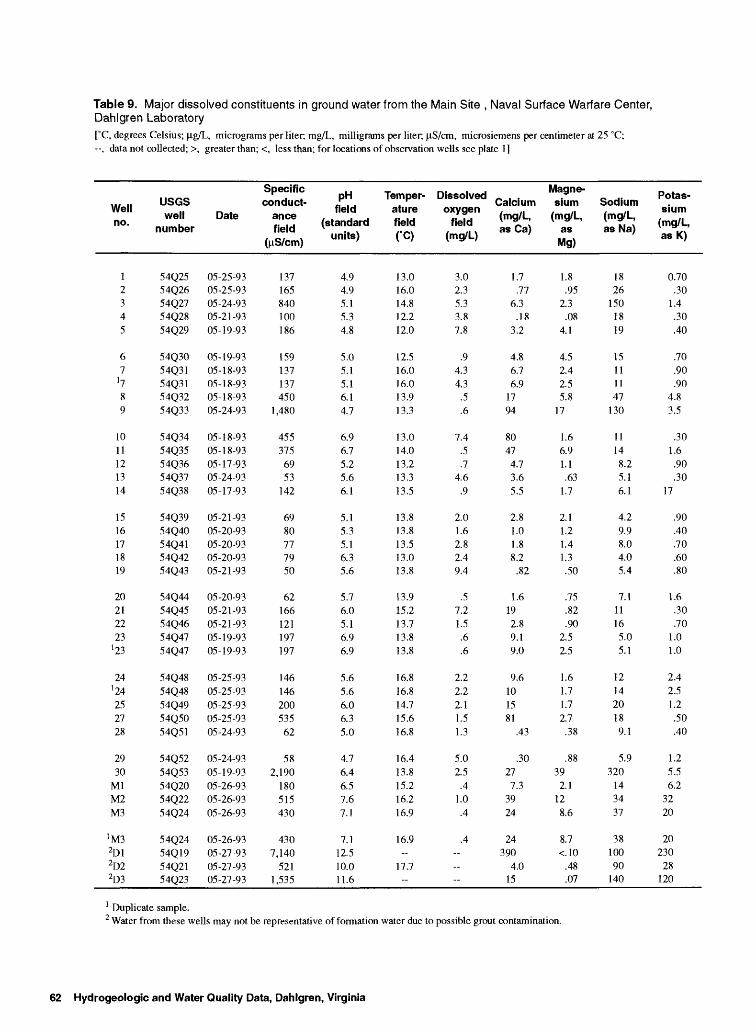
Table 9. Major dissolved constituents in ground water from the Main Site , Naval Surface Warfare Center, Dahlgren Laboratory[°C, degrees Celsius; Jlg/L, micrograms per liter, mg/L, milligrams per liter; jo,S/cm, microsiemens per centimeter at 25 °C; , data not collected; >, greater than; <, less than; for locations of observation wells see plate 1]
Well no.
12345
67
] 7
89
1011121314
1516171819
20212223
] 23
24'24
252728
2930
MlM2M3
'M32D12D22D3
USGS well
number
54Q2554Q2654Q2754Q2854Q29
54Q3054Q3154Q3154Q3254Q33
54Q3454Q3554Q3654Q3754Q38
54Q3954Q4054Q4154Q4254Q43
54Q4454Q4554Q4654Q4754Q47
54Q4854Q4854Q4954Q5054Q51
54Q5254Q5354Q2054Q2254Q24
54Q2454Q1954Q2154Q23
Date
05-25-9305-25-9305-24-9305-21-9305-19-93
05-19-9305-18-9305-18-9305-18-9305-24-93
05-18-9305-18-9305-17-9305-24-9305-17-93
05-21-9305-20-9305-20-9305-20-9305-21-93
05-20-9305-21-9305-21-9305-19-9305-19-93
05-25-9305-25-9305-25-9305-25-9305-24-93
05-24-9305-19-9305-26-9305-26-9305-26-93
05-26-9305-27-9305-27-9305-27-93
Specific conduct
ance field
ftiS/cm)
137165840100186
159137137450
1,480
4553756953
142
6980777950
62166121197197
14614620053562
582,190
180515430
4307,140
5211,535
pH field
(standard units)
4.94.95.15.34.8
5.05.15.16.14.7
6.96.75.25.66.1
5.15.35.16.35.6
5.76.05.16.96.9
5.65.66.06.35.0
4.76.46.57.67.1
7.112.510.011.6
Temper ature field (°C)
13.016.014.812.212.0
12.516.016.013.913.3
13.014.013.213.313.5
13.813.813.513.013.8
13.915.213.713.813.8
16.816.814.715.616.8
16.413.815.216.216.9
16.9-
17.7-
Dissolved oxygen
field (mg/L)
3.02.35.33.87.8
.94.34.3
.5
.6
7.4.5.7
4.6.9
2.01.62.82.49.4
.57.21.5.6.6
2.22.22.11.51.3
5.02.5
.41.0.4
.4---
Calcium (mg/L, as Ca)
1.7.77
6.3.18
3.2
4.86.76.9
1794
80474.73.65.5
2.81.01.88.2
.82
1.6192.89.19.0
9.6101581
.43
.30277.3
3924
24390
4.015
Magne sium
(mg/L, as
Mg)
1.8.95
2.3.08
4.1
4.52.42.55.8
17
1.66.91.1.63
1.7
2.11.21.41.3.50
.75
.82
.902.52.5
1.61.71.72.7
.38
.8839
2.1128.6
8.7<.10
.48
.07
Sodium (mg/L, asNa)
1826
1501819
15111147
130
11148.25.16.1
4.29.98.04.05.4
7.111165.05.1
121420189.1
5.9320
143437
3810090
140
Potas sium
(mg/L, asK)
0.70.30
1.4.30.40
.70
.90
.904.83.5
.301.6.90.30
17
.90
.40
.70
.60
.80
1.6.30.70
1.01.0
2.42.51.2.50.40
1.25.56.2
3220
20230
28120
1 Duplicate sample.2 Water from these wells may not be representative of formation water due to possible grout contamination.
62 Hydrogeologic and Water Quality Data, Dahlgren, Virginia
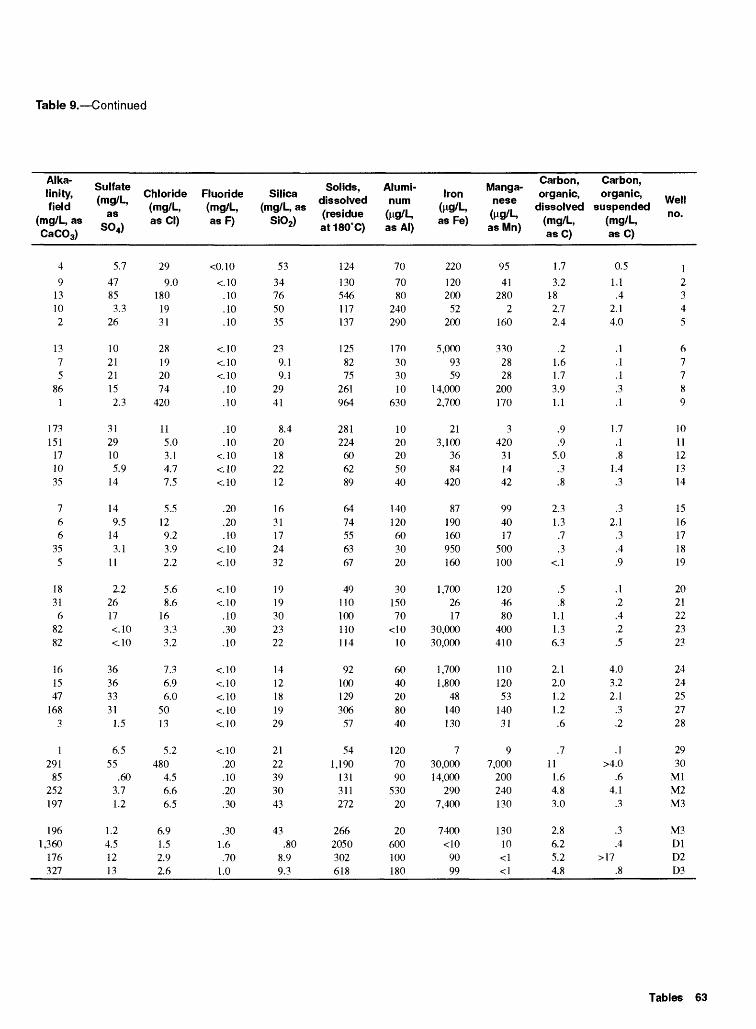
Table 9. Continued
Alka linity, field
(mg/L, as CaC03)
4
913102
1375
861
173151
171035
766
355
18316
8282
161547
1683
1291
85252197
1961,360
176327
Sulfate (mg/L,
as S04)
5.7
4785
3.326
102121152.3
3129105.9
14
149.5
143.1
11
2.22617<.10<.10
36363331
1.5
6.555
.603.71.2
1.24.51213
Chloride (mg/L, asCI)
29
9.0180
1931
28192074
420
115.03.14.77.5
5.5129.23.92.2
5.68.6
163.33.2
7.36.96.0
5013
5.2480
4.56.66.5
6.91.52.92.6
Fluoride (mg/L, asF)
<0.10
<.10.10.10.10
<.]0<.10<.10
.10
.10
.10
.10<.10<.10<.10
.20
.20
.10<.10<.10
<.10<.10
.10
.30
.10
<.10<.10<.10<.10<.10
<.10.20.10.20.30
.301.6.70
1.0
Silica (mg/L, as
Si02)
53
34765035
239.19.1
2941
8.420182212
1631172432
1919302322
1412181929
2122393043
43.80
8.99.3
Solids, dissolved (residue at180°C)
124
130546117137
1258275
261964
281224
606289
6474556367
49110100110114
92100129306
57
541,190
131311272
2662050302618
Alumi num
(MJ/L, as Al)
70
7080
240290
170303010
630
1020205040
140120603020
3015070
<1010
6040208040
1207090
53020
20600100180
Iron(^g/L,asFe)
220
120200
52200
5,0009359
14,0002,700
213,100
3684
420
87190160950160
1,7002617
30,00030,000
1,7001,800
48140130
730,00014,000
2907,400
7400<10
9099
Manga neseWU as Mn)
95
41280
2160
3302828
200170
3420
311442
994017
500100
1204680
400410
11012053
14031
97,000
200240130
13010<1<1
Carbon, organic,
dissolved (mg/L, asC)
1.7
3.2182.72.4
.21.61.73.91.1
.9
.95.0
.3
.8
2.31.3
.7
.3<.l
.5
.81.11.36.3
2.12.01.21.2.6
.711
1.64.83.0
2.86.25.24.8
Carbon, organic,
suspended (mg/L, asC)
0.5
l.l.4
2.14.0
.1
.1
.1
.3
.1
1.7.1.8
1.4.3
.32.1
.3
.4
.9
.1
.2
.4
.2
.5
4.03.22.1
.3
.2
.1>4.0
.64.1
.3
.3
.4>17
.8
Well no.
12345
67789
1011121314
1516171819
2021222323
2424252728
2930
MlM2M3
M3DlD2D3
Tables 63
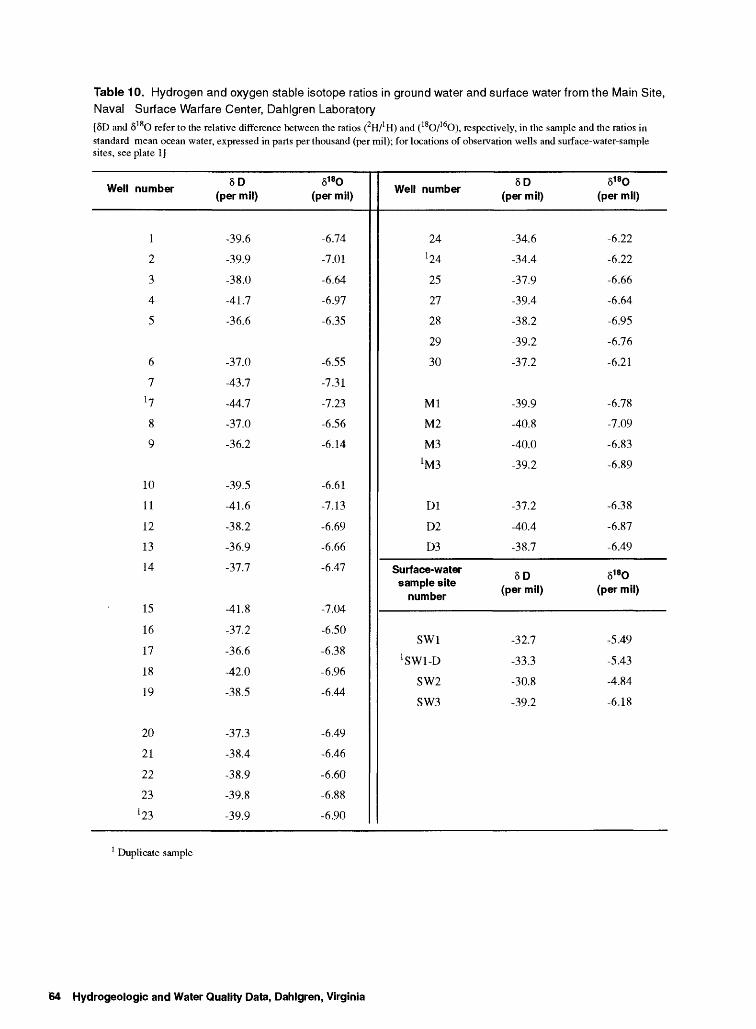
Table 10. Hydrogen and oxygen stable isotope ratios in ground water and surface water from the Main Site, Naval Surface Warfare Center, Dahlgren Laboratory
[8D and 8 O refer to the relative difference between the ratios (2H/1 H) and (18O/16O), respectively, in the sample and the ratios in standard mean ocean water, expressed in parts per thousand (per mil); for locations of observation wells and surface-water-sample sites, see plate 1]
Well number
1
2
3
4
5
6
7*7
8
9
10
11
12
13
14
15
16
17
18
19
20
21
22
231 73
5D (per mil)
-39.6
-39.9
-38.0
-41.7
-36.6
-37.0
-43.7
-44.7
-37.0
-36.2
-39.5
-41.6
-38.2
-36.9
-37.7
-41.8
-37.2
-36.6
-42.0
-38.5
-37.3
-38.4
-38.9
-39.8
-39.9
6180
(per mil)
-6.74
-7.01
-6.64
-6.97
-6.35
-6.55
-7.31
-7.23
-6.56
-6.14
-6.61
-7.13
-6.69
-6.66
-6.47
-7.04
-6.50
-6.38
-6.96
-6.44
-6.49
-6.46
-6.60
-6.88
-6.90
Well number
241 24
25
27
28
29
30
Ml
M2
M31M3
Dl
D2
D3
Surface-water sample site
number
SW1
^Wl-D
SW2
SW3
6D (per mil)
-34.6
-34.4
-37.9
-39.4
-38.2
-39.2
-37.2
-39.9
-40.8
-40.0
-39.2
-37.2
-40.4
-38.7
8D (per mil)
-32.7
-33.3
-30.8
-39.2
6180
(per mil)
-6.22
-6.22
-6.66
-6.64
-6.95
-6.76
-6.21
-6.78
-7.09
-6.83
-6.89
-6.38
-6.87
-6.49
6180
(per mil)
-5.49
-5.43
-4.84
-6.18
1 Duplicate sample
64 Hydrogeologic and Water Quality Data, Dahlgren, Virginia
ILLUSTRATIONS
(o ^
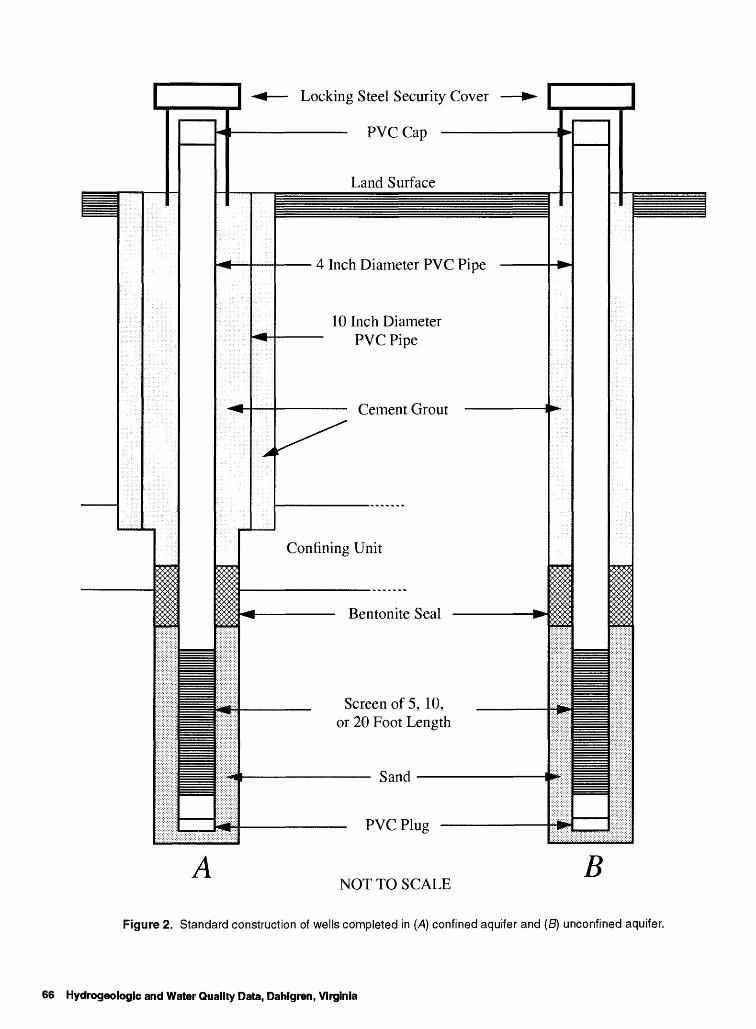
1
1^^^^^^^m
4
^
^s888888 ^
^ Locking Steel Security Cover -
r>\r/~* /-* 1
^f-
*& >vs >vs KxAAR8xXRP>vS iii
li
:fji
L \ \-s v-^ap
Land Surface
XI IV 11 JL-'lCllllV^lA^A i T \_^ i IL'V'
10 Inch DiameterPVC Pipe
Cement Grout I
^
Confining Unit
^ Bentonite Seal
Screen of 5. 10. or 20 Foot Length
1 Sand 1
PVC Pluc
1H
-1
^-
*
*
1
m
i
1
1
ANOT TO SCALE
B
Figure 2. Standard construction of wells completed in (A) confined aquifer and (B) unconfined aquifer.
66 Hydrogeologic and Water Quality Data, Dahlgren, Virginia
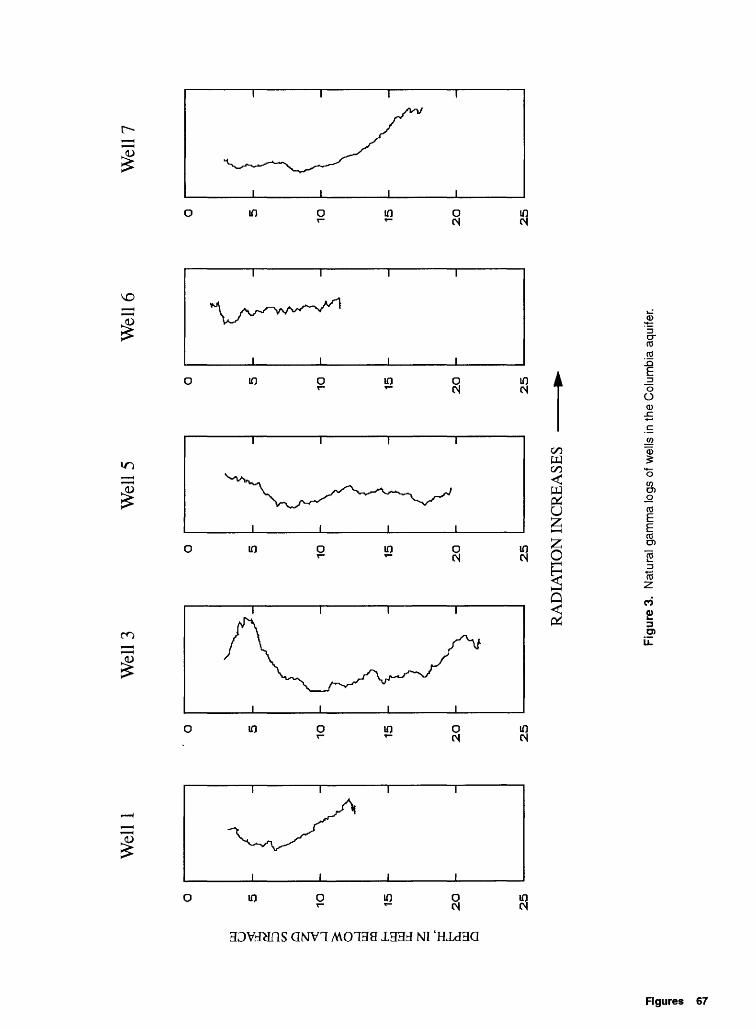
Wel
llW
ell 3
Wel
l 5W
ell 6
Wel
l?
en
Q w OQ E-
W LU Q
1O 15 25
1O 15 25
1O 15 2O 25
5 1O 15 2O
25
1O 15
2O 25
RA
DIA
TIO
N I
NC
RE
ASE
S
Figu
re 3
. N
atur
al g
amm
a lo
gs o
f wel
ls in
the
Col
umbi
a aq
uife
r.
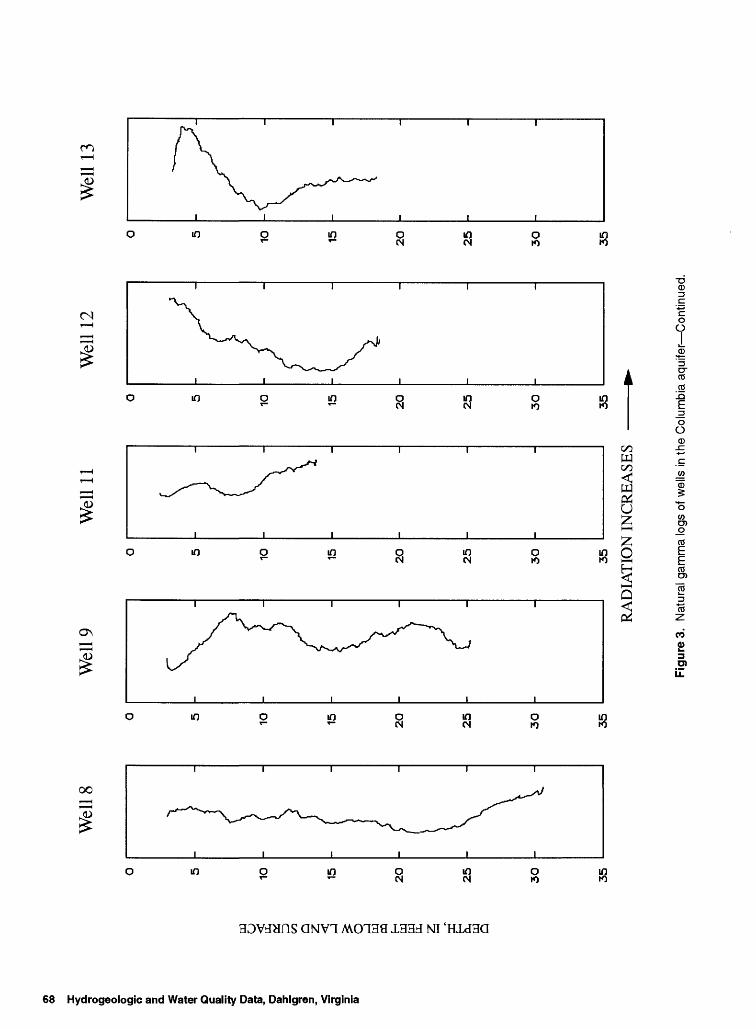
g,W
ellS
Wel
l 9W
ell
11W
ell
12W
ell
13
o to o'
to a
f O 0) a 0) to" i
CO Q 2 I PQ
H 1 2
10 15 2O 25
3O 35
1O 15 2O 25
3d
35
1O 15 2O 25
3O 35
1O 15 2O 25
3O 35
1O 15 2O 25
3O 35
RA
DIA
TIO
N I
NC
RE
ASE
S
Figu
re 3
. N
atur
al g
amm
a lo
gs o
f wel
ls in
the
Col
umbi
a aq
uife
r C
ontin
ued.
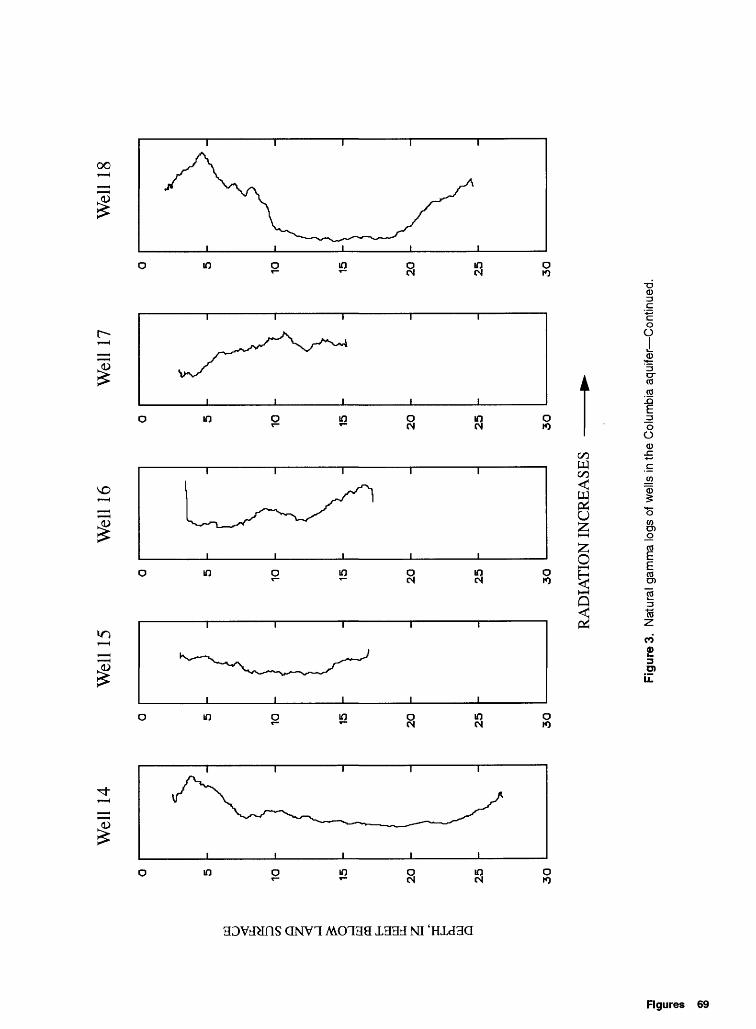
Wel
l 14
Wel
l 15
W
ell
16W
ell
17W
ell
18
en
Q ,-J 1 CQ
H i §
10 15 20 25
30
1O 15 2O 25
3O
10 15 20
25
30
1O 15 2O 25
3O
10 15 2O 25
30
RA
DIA
TIO
N I
NC
RE
ASE
S
Figu
re 3
. N
atur
al g
amm
a lo
gs o
f wel
ls in
the
Col
umbi
a aq
uife
r C
ontin
ued.
8
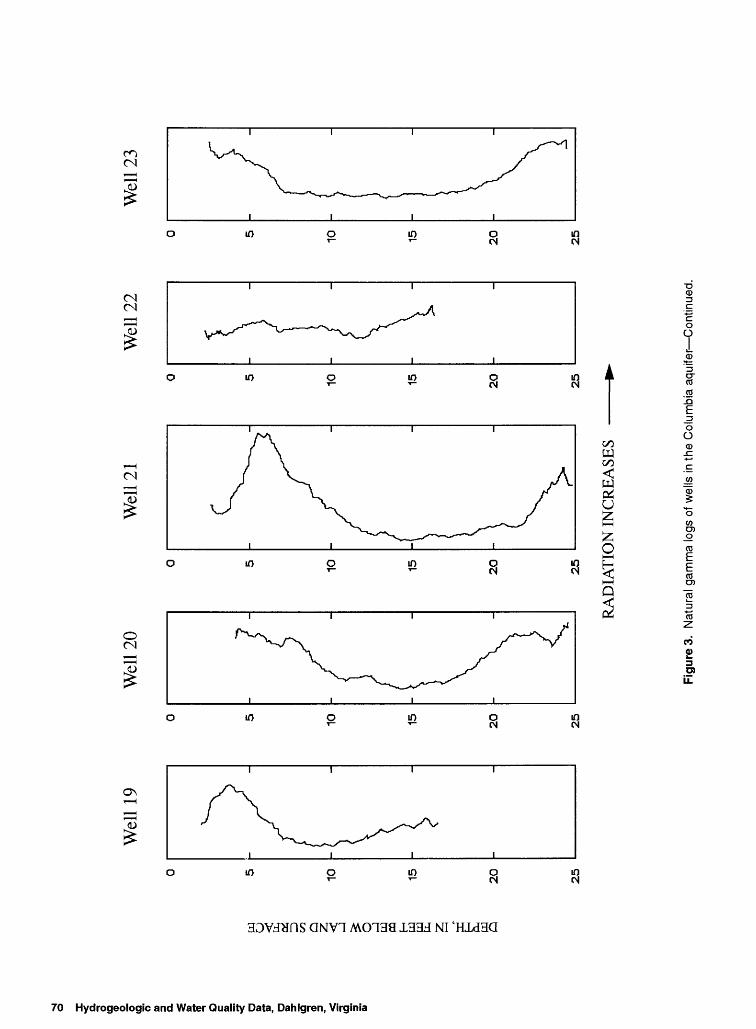
o,
o (Q
O
0) Q. I
C/3 Q 2 I J w CO
H
10 15
Wel
l 19
20
25
10 15 20
25
Wel
l 20
Wel
l 21
10 15 2O 25
Wel
l 22
10 15 20 25
Wel
l 23
10 15 20
25
RA
DIA
TIO
N I
NC
RE
ASE
S
Figu
re 3
. N
atur
al g
amm
a lo
gs o
f wel
ls in
the
Col
umbi
a aq
uife
r C
ontin
ued.
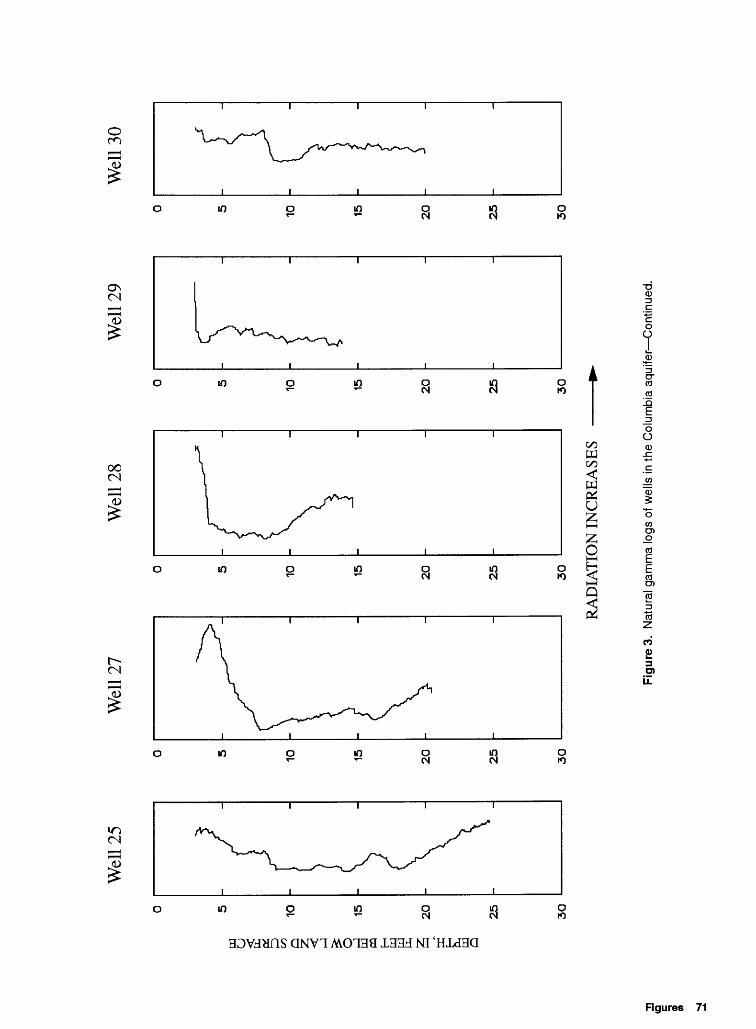
Wel
l 25
Wel
l 27
Wel
l 28
Wel
l 29
Wel
l 30
10
w
1503 H
pq e £
2
0X fc a
25
3O
10 15 20
25
30
10 15 20
25
30
10 15 20
25
30
10 15 20
25
30
RA
DIA
TIO
N I
NC
RE
ASE
S
inFi
gure
3.
Nat
ural
gam
ma
logs
of
wel
ls in
the
Col
umbi
a aq
uife
r C
ontin
ued.
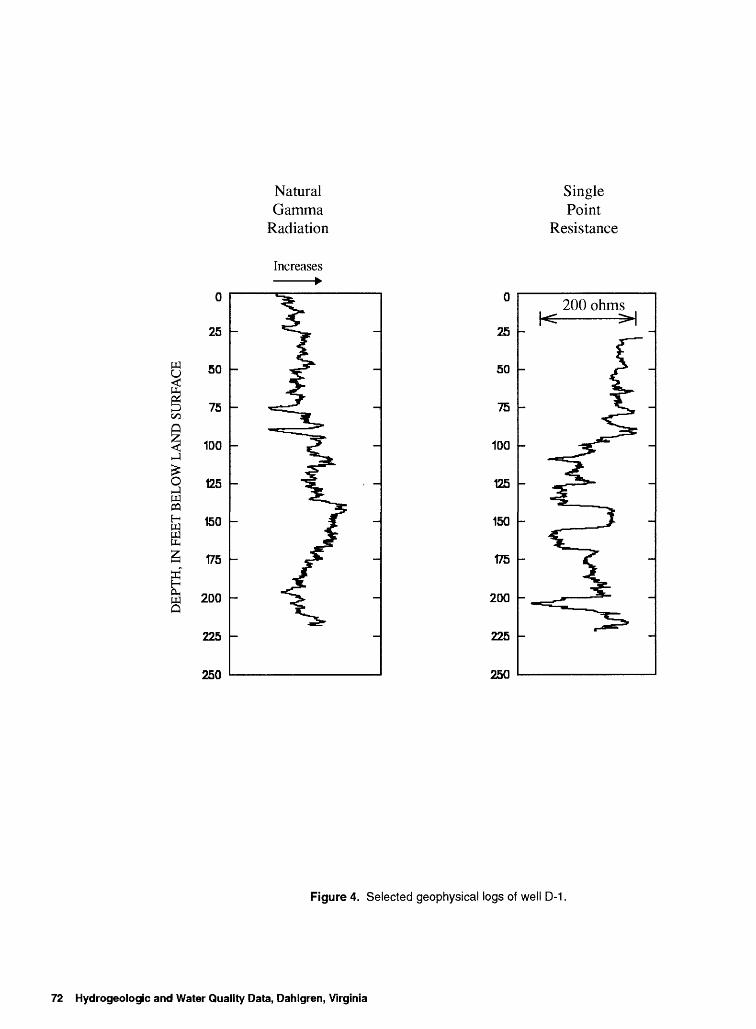
0
25
S 50
B 75
§ 100
3 tt5PQ
e150
175
200
225
250
NaturalGamma
Radiation
Increases
0
25
50
75
100
125
150
175
200
225
250
SinglePoint
Resistance
200 ohms
Figure 4. Selected geophysical logs of well D-1.
72 Hydrogeologic and Water Quality Data, Dahlgren, Virginia
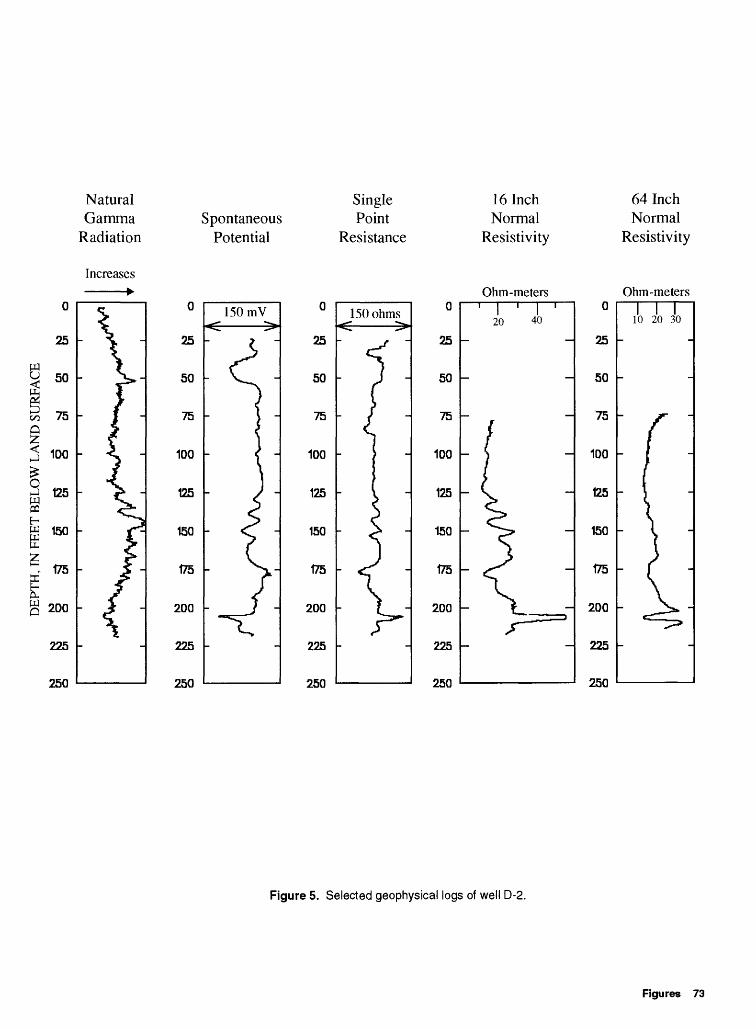
NaturalGamma
Radiation
Increases
25
Wy
75
100
175
g 200
225
250
Spontaneous Potential
SinglePoint
Resistance
25 -
16 InchNormal
Resistivity
Ohm-meters
64 InchNormal
Resistivity
Ohm-meters
20I
40
25
50
75
100
125
150
175
200
225
250
I I I10 20 30
Figure 5. Selected geophysical logs of well D-2.
Figures 73
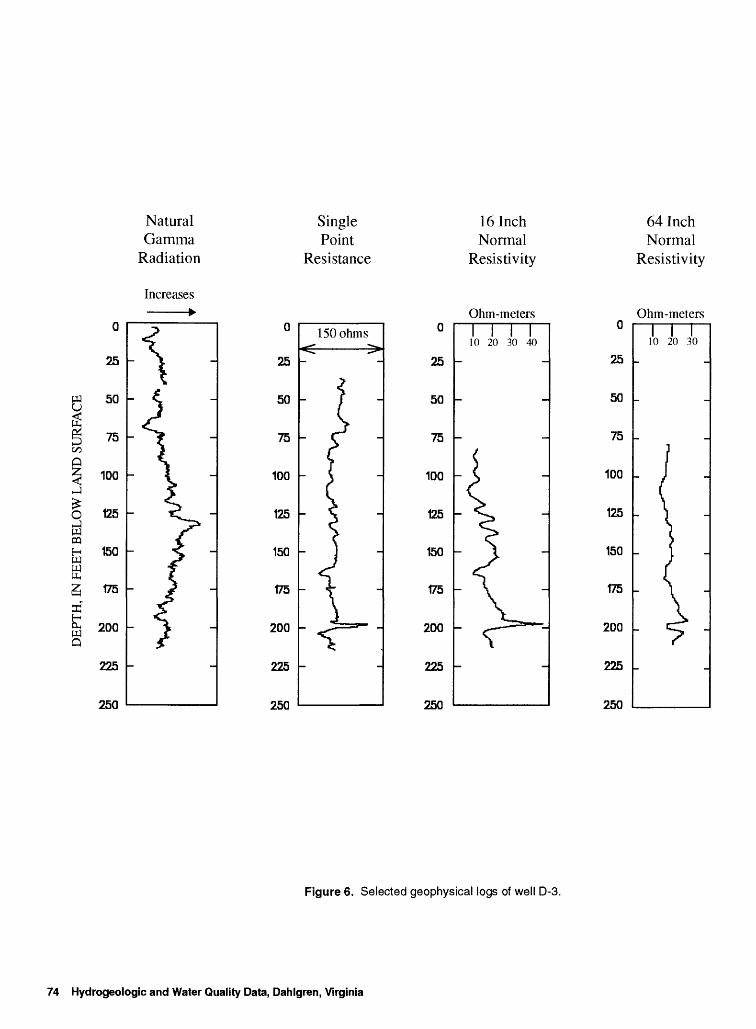
NaturalGamma
Radiation
Increases
SinglePoint
Resistance
0
25
W 50
g 75
^ 100
O 125
PQH 150Weg 175
§ 200Q
225
250
0
25
50
75
100
125
150
175
200
225
250
150 ohms
16 InchNormal
Resistivity
Ohm-meters0
25
50
75
100
125
150
175
200
225
250
Till10 20 30 40
64 InchNormal
Resistivity
Ohm-meters
25
50
75
100
125
150
175
200
225
250
I I I10 20 30
Figure 6. Selected geophysical logs of well D-3.
74 Hydrogeologic and Water Quality Data, Dahlgren, Virginia
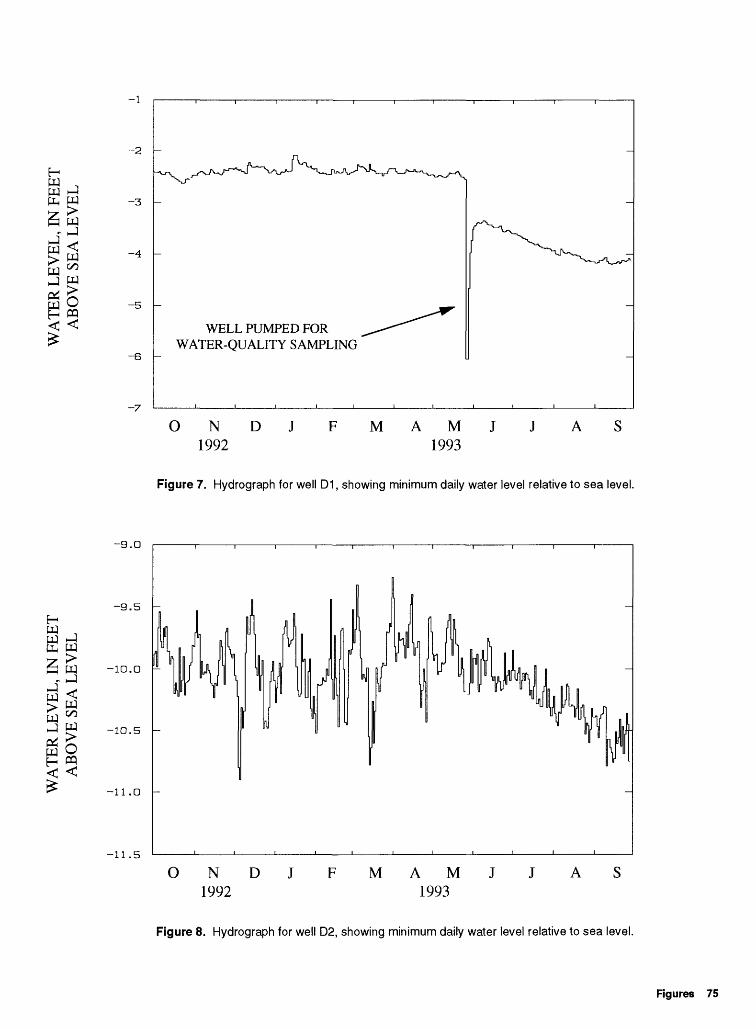
W
-1
-2
-3
-4
-5
-6
-7
WELL PUMPED FOR WATER-QUALITY SAMPLING
ONDJFMAMJJAS1992 1993
Figure 7. Hydrograph for well D1, showing minimum daily water level relative to sea level.
-9.O
E-
s w5.3
-9.5 -
-10.0 -
-10.5
-11.O -
-11.5
ONDJFMAMJJAS
Figure 8. Hydrograph for well D2, showing minimum daily water level relative to sea level.
Figures 75
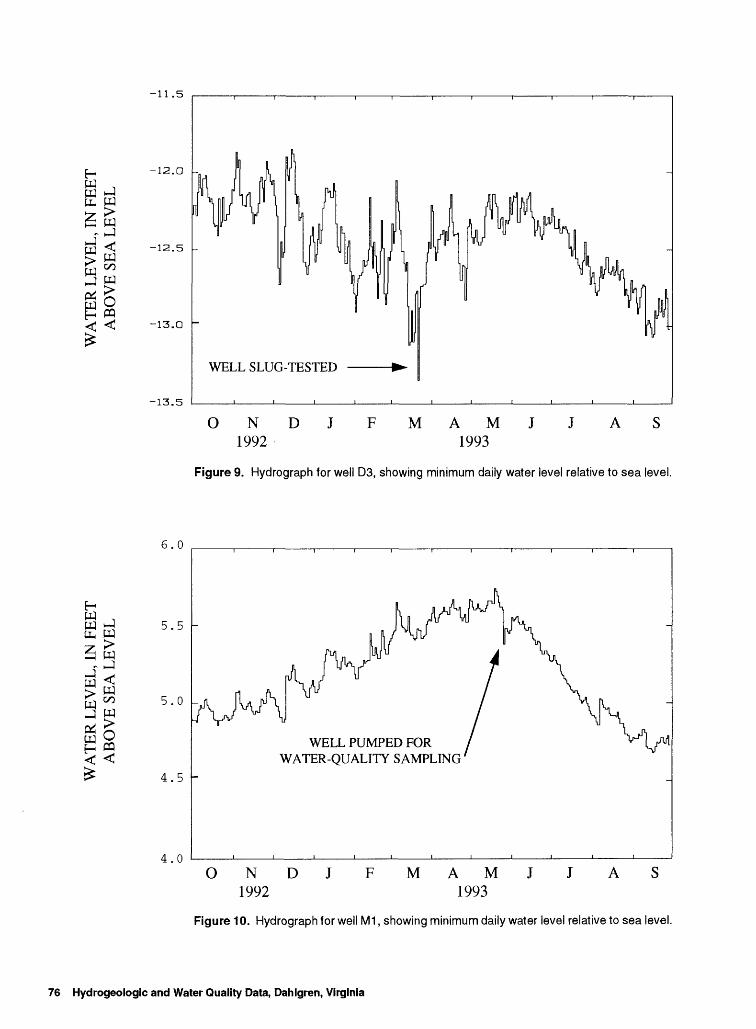
-11.5
E-W ,w HPH W *7 ^
3~
§PQ
-12.0 -,
-12.5 -
-13.O -
-13.5
WELL SLUG-TESTED
O N D J1992
FMAMJJAS 1993
Figure 9. Hydrograph for well D3, showing minimum daily water level relative to sea level.
6.0
E- W
W^W
s
5.5
5.0
4.5
4.0
WELL PUMPED FOR WATER-QUALITY SAMPLING
ONDJ FMAMJJAS1992 1993
Figure 10. Hydrograph for well M1, showing minimum daily water level relative to sea level.
7B Hydrogeologic and Water Quality Data, Dahlgren, Virginia
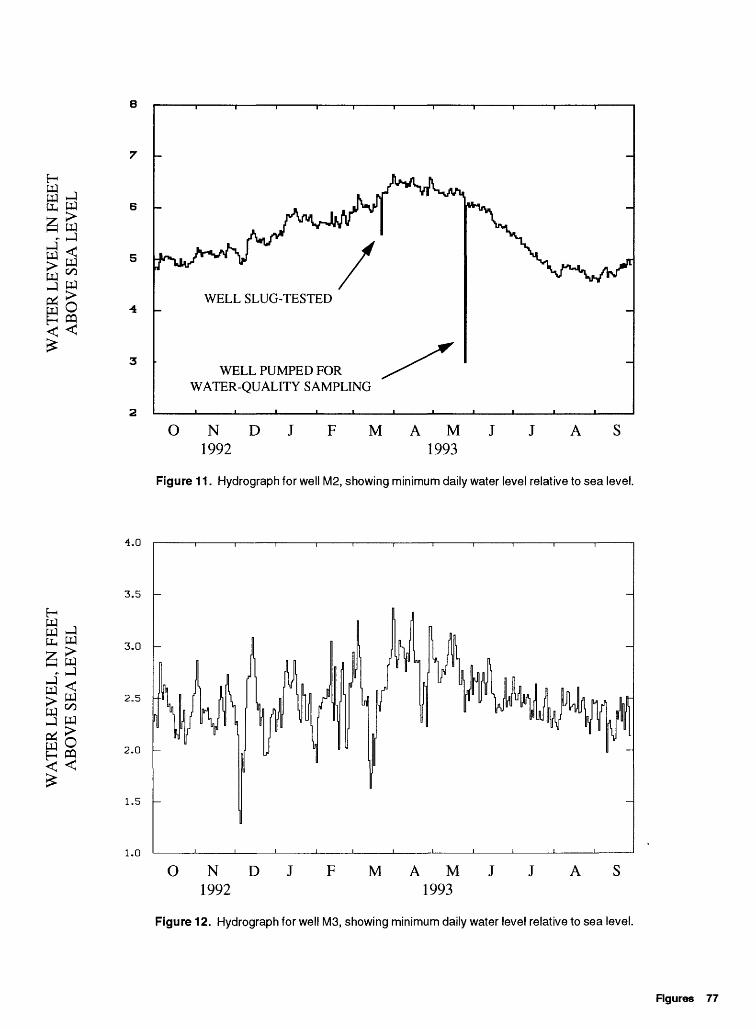
E- W W
W>W
_i .<*
I<* nnj LPp
E- W W
wCO
PQ
WELL SLUG-TESTED
WELL PUMPED FOR WATER-QUALITY SAMPLING
ONDJFMAMJJAS1992 1993
Figure 11 . Hydrograph for well M2, showing minimum daily water level relative to sea level.
4.0
3.5
3.0
2.5
2.0
1.5
1.0
ONDJFMAMJJAS 1992 1993
Figure 12. Hydrograph for well M3, showing minimum daily water level relative to sea level.
Figures 77
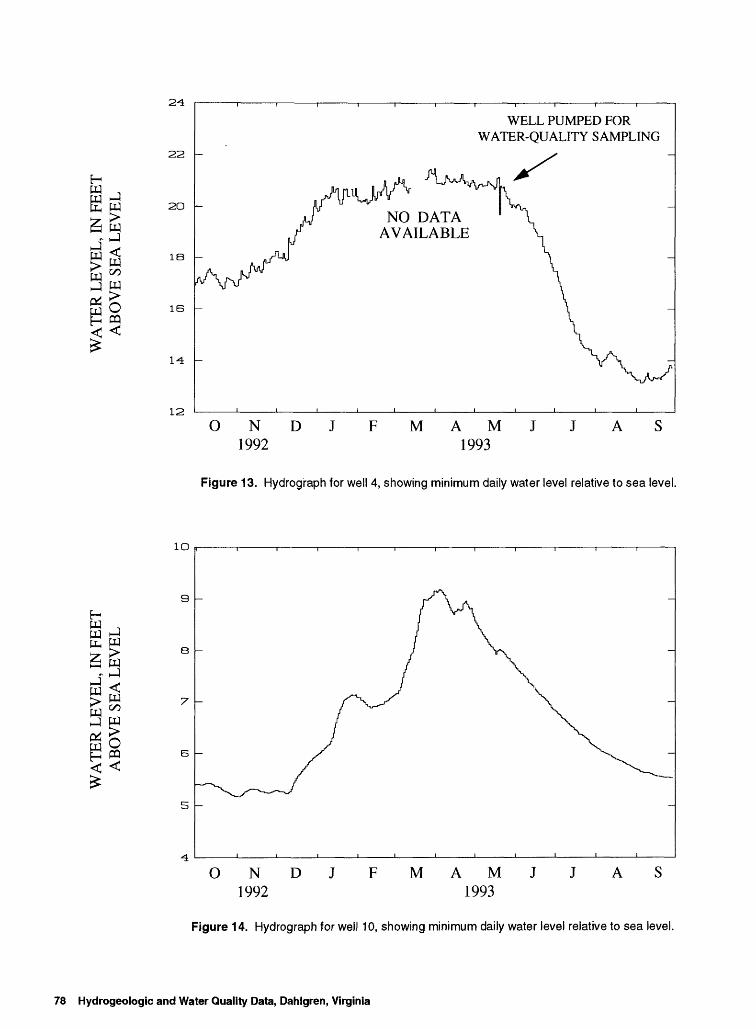
W ,PJ H-l
E wS w
w w
H W
a w
w < :> w
22
2O
18
16
12
WELL PUMPED FOR WATER-QUALITY SAMPLING
NO DATA AVAILABLE
ONDJFMAMJJAS1992 1993
Figure 13. Hydrograph for well 4, showing minimum daily water level relative to sea level.
10
ONDJFMAMJJAS1992 1993
Figure 14. Hydrograph for well 10, showing minimum daily water level relative to sea level.
78 Hydrogeologic and Water Quality Data, Dahlgren, Virginia
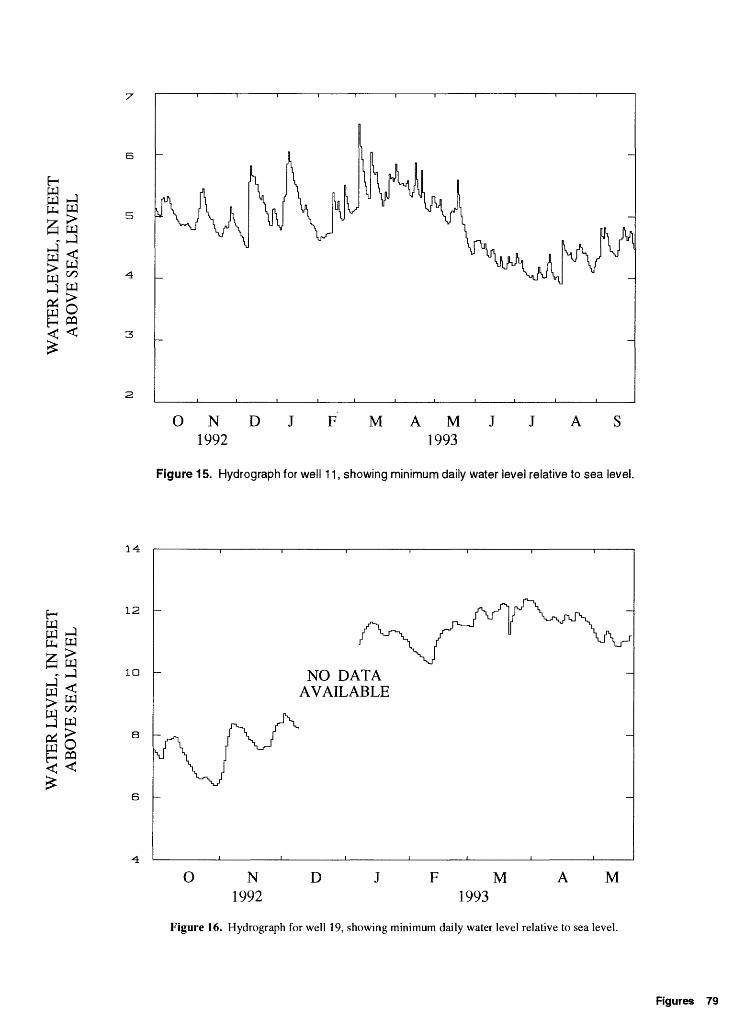
Hpq , W j-J pu W ^ >
oo
H Ww pq
pq
00
O PQ
B
ONDJFMAMJJAS1992 1993
Figure 15. Hydrograph for well 11, showing minimum daily water level relative to sea level.
14
12
ID NO DATA AVAILABLE
O N 1992
D F M1993
A M
Figure 16. Hydrograph for well 19, showing minimum daily water level relative to sea level.
Figures 79
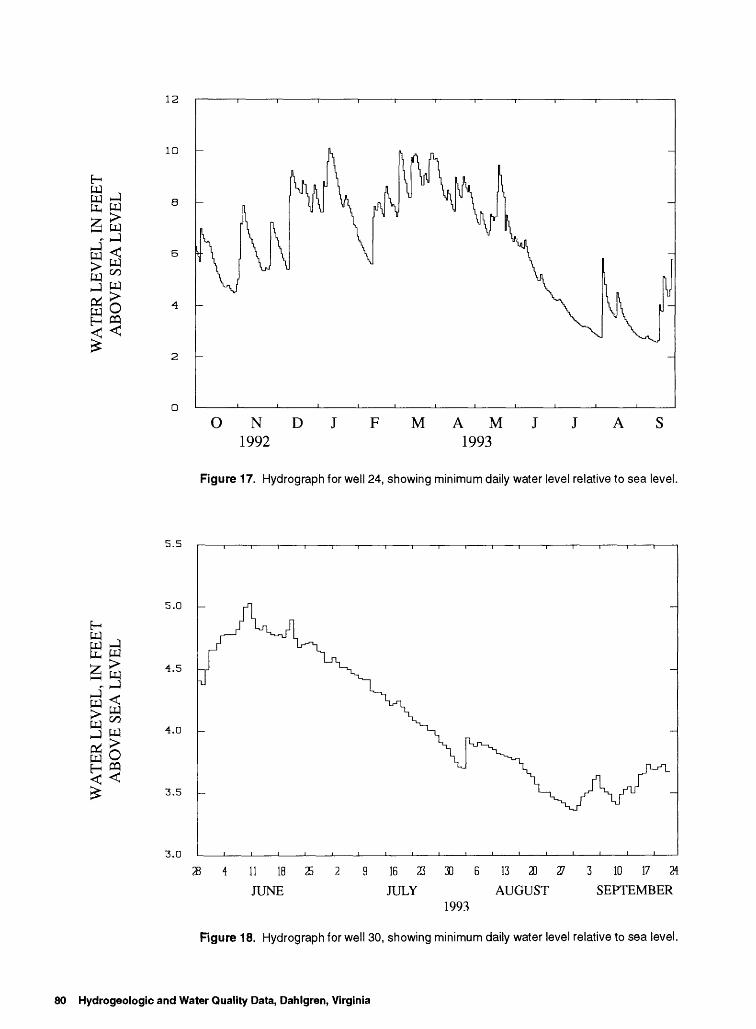
H W WPH
J <+issIS
ffle
m
12
1O
ONDJFMAMJJAS1992 1993
Figure 17. Hydrograph for well 24, showing minimum daily water level relative to sea level.
5.5
5.0
4.5
4.0
3.5
3.0 i___i___i___i___i___i___i___i___i___i___i i i
8 4 11 IB 25 2 9 16 23 30 6 13 20 27 3 10 17 24
JUNE JULY AUGUST SEPTEMBER1993
Figure 18. Hydrograph for well 30, showing minimum daily water level relative to sea level.
80 Hydrogeologic and Water Quality Data, Dahlgren, Virginia
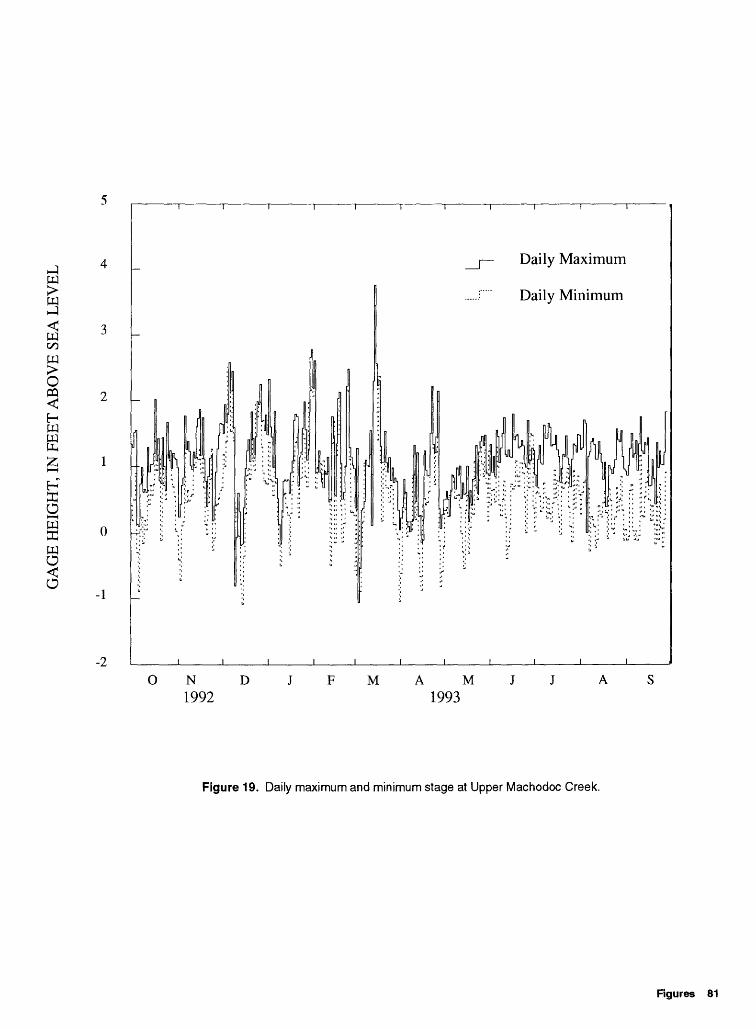
H-l
wH-l
<
W00
W >O PQ
wez
o> i W T1H-4
Wo < o
Daily Maximum
Daily Minimum
-1
-2ON D
1992M A M
1993
Figure 19. Daily maximum and minimum stage at Upper Machodoc Creek.
Figures 81