Embed Size (px)
Citation preview
Proceedings World Geothermal Congress 2015
Melbourne, Australia, 19-25 April 2015
1
Hydrogen Sulphide Removal from Geothermal Power Station Cooling Water using a Biofilm
Reactor
1Emily Bierre,
2Rob Fullerton
1Contact Energy Ltd, New Zealand, 2Beca Ltd, New Zealand
1 [email protected] [email protected]
Keywords:biofilm, tubular bioreactor, hydrogen sulphide oxidizing bacteria, geothermal power station, cooling water.
ABSTRACT
The Wairakei geothermal power station situated in Taupo in the North Island of New Zealand was commissioned in 1958. Cooling
water and geothermal steam condensate containing hydrogen sulphide are discharged from the power station to the Waikato River.
Environmental concerns over sulphide aquatic toxicity in the river were key considerations during the discharge permit conditions
renewal process which ran from 2001 to 2007. New discharge limits for the power station were proposed by Contact Energy and
came into effect in August 2012, requiring the mass emission of hydrogen sulphide in the cooling water to be reduced from current
levels of approximately 10,300 kg/week to 2,800 kg/week, with a further reduction to 630 kg/week from 2016. This required a
hydrogen sulphide concentration reduction from 1000 mg/m3 to less than 60 mg/m3 in a cooling water flow of 17 m3/s. An
innovative tubular biofilm reactor was developed, leading to construction of a full scale plant in 2012. The full scale bioreactor
consists of 1890 parallel 100 mm diameter x 200 m length pipes with a total length of 378 km, believed to be the largest tubular
biofilm reactor in the world at the time of construction. The paper backgrounds the pilot plant investigations, development of
design parameters, construction of the full scale bioreactor and reviews performance since commissioning in August 2012.
1. INTRODUCTION
The Contact Energy Ltd Wairakei geothermal power station situated in Taupo in the North Island of New Zealand was
commissioned in 1958. The station employs the standard cooling technology of the time by utilising once-through cooling water,
taken from the adjacent Waikato River.The water and steam condensate is discharged directly back to the river through an outfall
structure. The cooling water flow is up to 17.2 m3/s (about 1,500,000 m3/d) when the station is operating at peak generating
capacity of 157 MW. Hydrogen sulphide (H2S) is naturally present in the geothermal steam feed to the power station and a portion
is dissolved into the cooling water flow, resulting in sulphide concentrations of 800 - 1000 mg/m3 H2S discharged to the river.
As early as 2000, Contact Energy Ltd recognised that environmental concerns over sulphide toxicity in the river would be a
significant issue to address when the discharge permits for the power station were due for renewal in 2007. Pilot studies were
commissioned to find a viable solution to mitigate the amount of H2S entering the river. Contact Energy voluntarily agreed to
reduce the levels of H2S in the power station’s cooling water discharge to the Waikato River by 80 per cent of existing levels. The
new discharge consent standards for the discharge to came into effect in August 2012, requiring the mass emission of H2S in the
cooling water discharge to be reduced from approximately 10,300 kg/week to 2,800 kg/week, with a further reduction to 630
kg/week from August 2016. This latter limit represents a target sulphide concentration reduction of approximately 95% from 1000
mg/m3 H2S to 60 mg/m3 H2S in a cooling water flow of 13 m3/s to the river.
2. INITIAL STUDIES
Naturally occurring sulphur oxidising bacteria (SOB) are endemic to the geothermal region and biofilms were observed on the
submerged portions of the existing cooling water discharge structures. Studies carried out over the 2000 – 2005 period by Contact
Energy Ltd and Beca Consultants investigated biological oxidation of H2S as a potential process for treating the cooling water.
The chemotrophic sulphur bacteria obtain energy from the aerobic oxidation of reduced sulphur compounds. Carbon for growth is
provided by inorganic carbon. The power station cooling water discharge quality is conducive to the establishment of autotrophic
SOB in the presence of H2S. Dissolved CO2 provides a suitable inorganic carbon source while dissolved organic carbon and other
nutrients are low in the river water, which limits heterotrophic growth. Table 1 shows the typical cooling water quality.
Table 1: Cooling Water Discharge Quality
7/9/2007 TO
18/2/2010
DO
(mg/L) pH
Temp
(oC)
H2S
(Total)
(mg/m3)
CO2
(mg/L)
NH4+
(mg/L-N)
Mean 3.2 6.2* 29.0 804 101 0.07
Max 4.7 6.7 35.6 1163
Min 1.8 5.6 20.9 421
* pH value is median
Bierre and Fullerton.
2
2.1 Media Trials
Initial experimentation with various types of media configurations found that naturally seeded SOB could be established as a
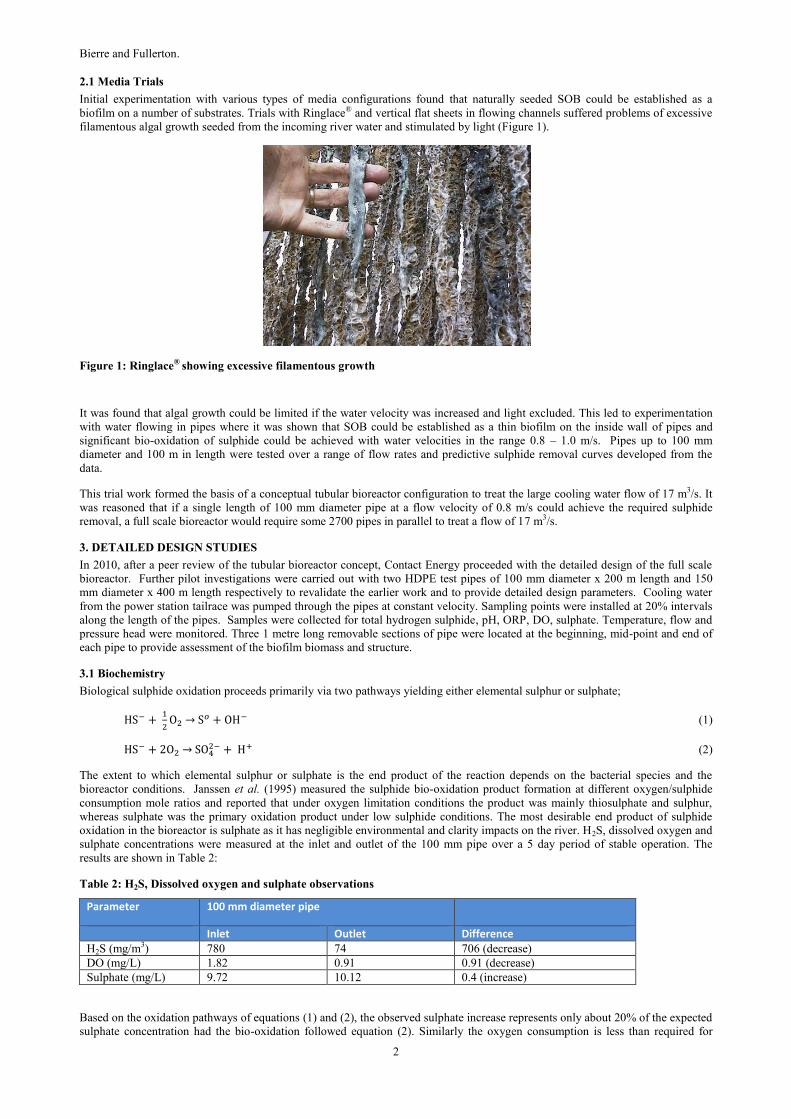
biofilm on a number of substrates. Trials with Ringlace® and vertical flat sheets in flowing channels suffered problems of excessive
filamentous algal growth seeded from the incoming river water and stimulated by light (Figure 1).
Figure 1: Ringlace® showing excessive filamentous growth
It was found that algal growth could be limited if the water velocity was increased and light excluded. This led to experimentation
with water flowing in pipes where it was shown that SOB could be established as a thin biofilm on the inside wall of pipes and
significant bio-oxidation of sulphide could be achieved with water velocities in the range 0.8 – 1.0 m/s. Pipes up to 100 mm
diameter and 100 m in length were tested over a range of flow rates and predictive sulphide removal curves developed from the
data.
This trial work formed the basis of a conceptual tubular bioreactor configuration to treat the large cooling water flow of 17 m3/s. It
was reasoned that if a single length of 100 mm diameter pipe at a flow velocity of 0.8 m/s could achieve the required sulphide
removal, a full scale bioreactor would require some 2700 pipes in parallel to treat a flow of 17 m3/s.
3. DETAILED DESIGN STUDIES
In 2010, after a peer review of the tubular bioreactor concept, Contact Energy proceeded with the detailed design of the full scale
bioreactor. Further pilot investigations were carried out with two HDPE test pipes of 100 mm diameter x 200 m length and 150
mm diameter x 400 m length respectively to revalidate the earlier work and to provide detailed design parameters. Cooling water
from the power station tailrace was pumped through the pipes at constant velocity. Sampling points were installed at 20% intervals
along the length of the pipes. Samples were collected for total hydrogen sulphide, pH, ORP, DO, sulphate. Temperature, flow and
pressure head were monitored. Three 1 metre long removable sections of pipe were located at the beginning, mid-point and end of
each pipe to provide assessment of the biofilm biomass and structure.
3.1 Biochemistry
Biological sulphide oxidation proceeds primarily via two pathways yielding either elemental sulphur or sulphate;
HS− + 1
2O2 → S𝑜 + OH− (1)
HS− + 2O2 → SO42− + H+ (2)
The extent to which elemental sulphur or sulphate is the end product of the reaction depends on the bacterial species and the
bioreactor conditions. Janssen et al. (1995) measured the sulphide bio-oxidation product formation at different oxygen/sulphide
consumption mole ratios and reported that under oxygen limitation conditions the product was mainly thiosulphate and sulphur,
whereas sulphate was the primary oxidation product under low sulphide conditions. The most desirable end product of sulphide
oxidation in the bioreactor is sulphate as it has negligible environmental and clarity impacts on the river. H2S, dissolved oxygen and
sulphate concentrations were measured at the inlet and outlet of the 100 mm pipe over a 5 day period of stable operation. The
results are shown in Table 2:
Table 2: H2S, Dissolved oxygen and sulphate observations
Parameter 100 mm diameter pipe
Inlet Outlet Difference H2S (mg/m3) 780 74 706 (decrease)
DO (mg/L) 1.82 0.91 0.91 (decrease)
Sulphate (mg/L) 9.72 10.12 0.4 (increase)
Based on the oxidation pathways of equations (1) and (2), the observed sulphate increase represents only about 20% of the expected
sulphate concentration had the bio-oxidation followed equation (2). Similarly the oxygen consumption is less than required for
Bierre and Fullerton
3
complete bio-oxidation to sulphate. This suggests that a portion of the sulphide is oxidised to elemental sulphur. While no direct
measurements of elemental sulphur in the discharge were made, the whitish-grey appearance of the biomass suggests that sulphur
granules are likely present in the SOB.
3.2 Trial Pipe Performance
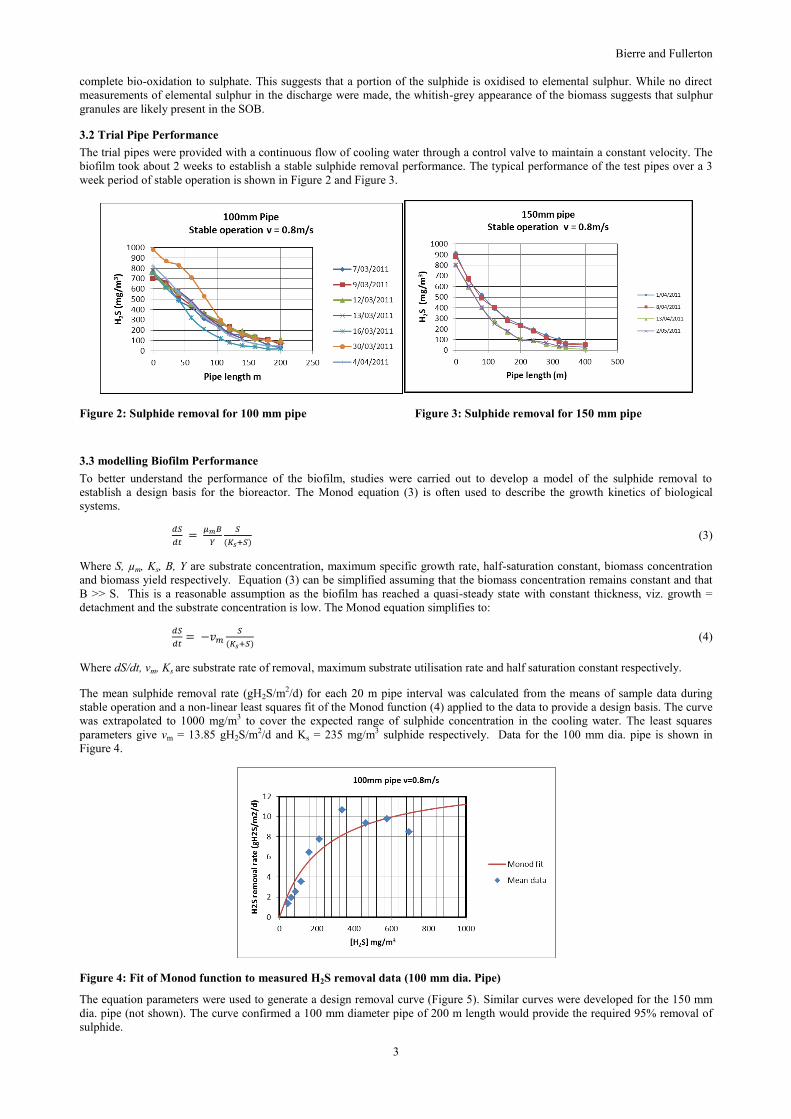
The trial pipes were provided with a continuous flow of cooling water through a control valve to maintain a constant velocity. The
biofilm took about 2 weeks to establish a stable sulphide removal performance. The typical performance of the test pipes over a 3
week period of stable operation is shown in Figure 2 and Figure 3.
Figure 2: Sulphide removal for 100 mm pipe Figure 3: Sulphide removal for 150 mm pipe
3.3 modelling Biofilm Performance
To better understand the performance of the biofilm, studies were carried out to develop a model of the sulphide removal to
establish a design basis for the bioreactor. The Monod equation (3) is often used to describe the growth kinetics of biological
systems.
𝑑𝑆
𝑑𝑡 =
𝜇𝑚𝐵
𝑌
𝑆
(𝐾𝑠+𝑆) (3)
Where S, µm, Ks, B, Y are substrate concentration, maximum specific growth rate, half-saturation constant, biomass concentration
and biomass yield respectively. Equation (3) can be simplified assuming that the biomass concentration remains constant and that
B >> S. This is a reasonable assumption as the biofilm has reached a quasi-steady state with constant thickness, viz. growth =
detachment and the substrate concentration is low. The Monod equation simplifies to:
𝑑𝑆
𝑑𝑡= −𝑣𝑚
𝑆
(𝐾𝑠+𝑆) (4)
Where dS/dt, vm, Ks are substrate rate of removal, maximum substrate utilisation rate and half saturation constant respectively.
The mean sulphide removal rate (gH2S/m2/d) for each 20 m pipe interval was calculated from the means of sample data during
stable operation and a non-linear least squares fit of the Monod function (4) applied to the data to provide a design basis. The curve
was extrapolated to 1000 mg/m3 to cover the expected range of sulphide concentration in the cooling water. The least squares
parameters give vm = 13.85 gH2S/m2/d and Ks = 235 mg/m3 sulphide respectively. Data for the 100 mm dia. pipe is shown in
Figure 4.
Figure 4: Fit of Monod function to measured H2S removal data (100 mm dia. Pipe)
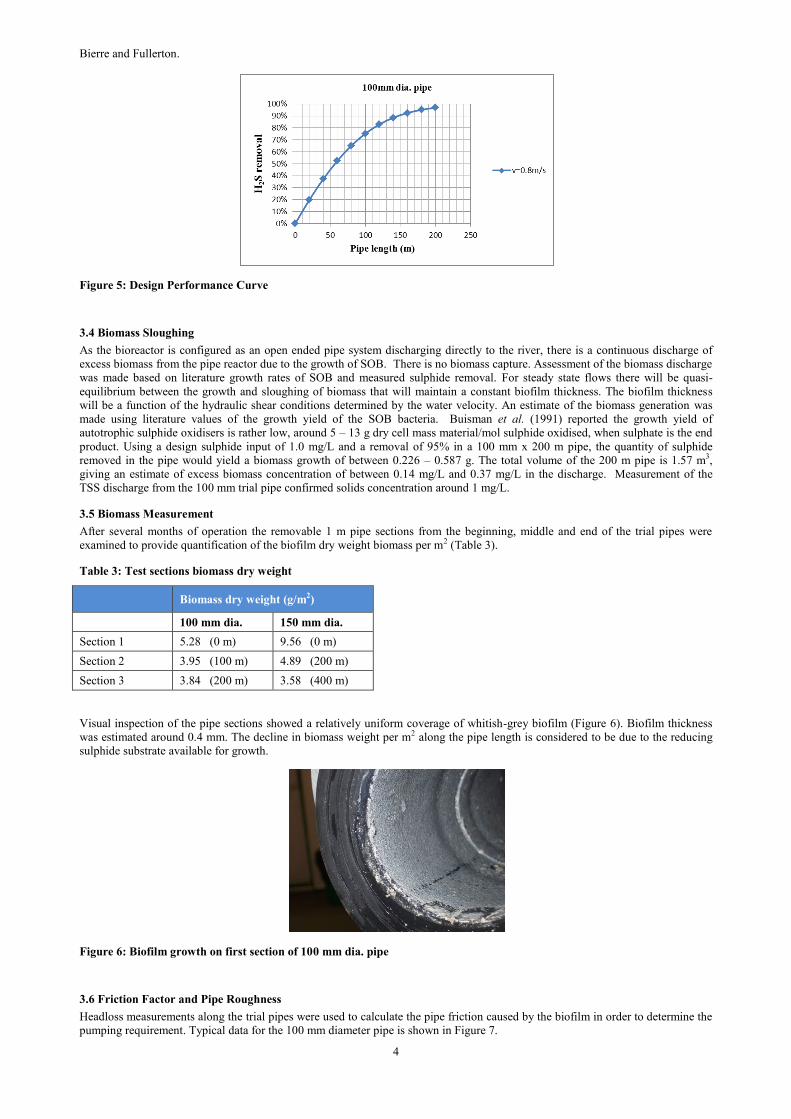
The equation parameters were used to generate a design removal curve (Figure 5). Similar curves were developed for the 150 mm
dia. pipe (not shown). The curve confirmed a 100 mm diameter pipe of 200 m length would provide the required 95% removal of
sulphide.
Bierre and Fullerton.
4
Figure 5: Design Performance Curve
3.4 Biomass Sloughing
As the bioreactor is configured as an open ended pipe system discharging directly to the river, there is a continuous discharge of
excess biomass from the pipe reactor due to the growth of SOB. There is no biomass capture. Assessment of the biomass discharge
was made based on literature growth rates of SOB and measured sulphide removal. For steady state flows there will be quasi-
equilibrium between the growth and sloughing of biomass that will maintain a constant biofilm thickness. The biofilm thickness
will be a function of the hydraulic shear conditions determined by the water velocity. An estimate of the biomass generation was
made using literature values of the growth yield of the SOB bacteria. Buisman et al. (1991) reported the growth yield of
autotrophic sulphide oxidisers is rather low, around 5 – 13 g dry cell mass material/mol sulphide oxidised, when sulphate is the end
product. Using a design sulphide input of 1.0 mg/L and a removal of 95% in a 100 mm x 200 m pipe, the quantity of sulphide
removed in the pipe would yield a biomass growth of between 0.226 – 0.587 g. The total volume of the 200 m pipe is 1.57 m3,
giving an estimate of excess biomass concentration of between 0.14 mg/L and 0.37 mg/L in the discharge. Measurement of the
TSS discharge from the 100 mm trial pipe confirmed solids concentration around 1 mg/L.
3.5 Biomass Measurement
After several months of operation the removable 1 m pipe sections from the beginning, middle and end of the trial pipes were
examined to provide quantification of the biofilm dry weight biomass per m2 (Table 3).
Table 3: Test sections biomass dry weight
Biomass dry weight (g/m2)
100 mm dia. 150 mm dia.
Section 1 5.28 (0 m) 9.56 (0 m)
Section 2 3.95 (100 m) 4.89 (200 m)
Section 3 3.84 (200 m) 3.58 (400 m)
Visual inspection of the pipe sections showed a relatively uniform coverage of whitish-grey biofilm (Figure 6). Biofilm thickness
was estimated around 0.4 mm. The decline in biomass weight per m2 along the pipe length is considered to be due to the reducing
sulphide substrate available for growth.
Figure 6: Biofilm growth on first section of 100 mm dia. pipe
3.6 Friction Factor and Pipe Roughness
Headloss measurements along the trial pipes were used to calculate the pipe friction caused by the biofilm in order to determine the
pumping requirement. Typical data for the 100 mm diameter pipe is shown in Figure 7.

Bierre and Fullerton
5
Figure 7: Headloss for 100 mm diameter pipe
The friction factor and pipe roughness attributed to the biofilm is not a constant value but changes both with the biofilm thickness
and with the fluid velocity. Lambert et al. (2009) investigated the impact of a biofilm on pipe hydraulics and reported that the
variation of friction factor with the Reynolds number did not follow the traditional pipe friction equations. They found that biofilms
grown under higher velocity conditions were less rough than those grown under lower velocities and proposed a modified
Colebrook-White friction equation (5) to account for the impact of the biofilm.
1
√𝑓= −
1
√8𝑘𝑙𝑛 (
𝜖
0.85𝐷+
2.51
𝑅𝑒√𝑓) (5)
Where f, D, Re, ε, κ are friction factor (dimensionless), pipe diameter (m), Reynolds number, equivalent sand roughness (mm), and
Von Karman factor (dependent on Re) respectively.The friction and roughness factors derived for the measured headloss of the 100
mm dia. pipe using equation (5) are shown in Table 4.The results are consistent with the observations of Lambert et al., (2009) that
the friction factor decreases with higher velocity as the biofilm becomes smoother and thinner within the pipe.
Table 3 - Pipe Friction and Roughness (Modified Colebrook-White)
Velocity
0.8 m/s
Velocity
1 m/s
100 mm pipe
Reynolds number 96,000 120,000
κ 0.319 0.334
Friction factor f 0.053 0.038
Equivalent Roughness
ε mm
2.4 0.94
For the purposes of pump design the following roughness factors were proposed for the 100 mm dia. pipe:
ε = 2 mm for pipes with a velocity of 0.8 m/s
ε = 1 mm for pipes with a velocity of 1.0 m/s.
In addition to the pipe headloss, additional headloss associated with static lift and bioreactor entry and exit losses were factored into
the pump performance selection.
3.7 Final Bioreactor Design Selection
Using the results of all the study data the selection of an optimal pipe diameter and length was made considering a balance between
water velocity (affecting headloss, residence time and pumping energy) against sulphide removal performance and practicality of
construction. A 200 m length of 100 mm diameter HDPE pipe at a water velocity of 0.8 m/s was shown to achieve the required
sulphide residual H2S of <60 mg/m3 and was selected for the full scale biofilm reactor configuration.
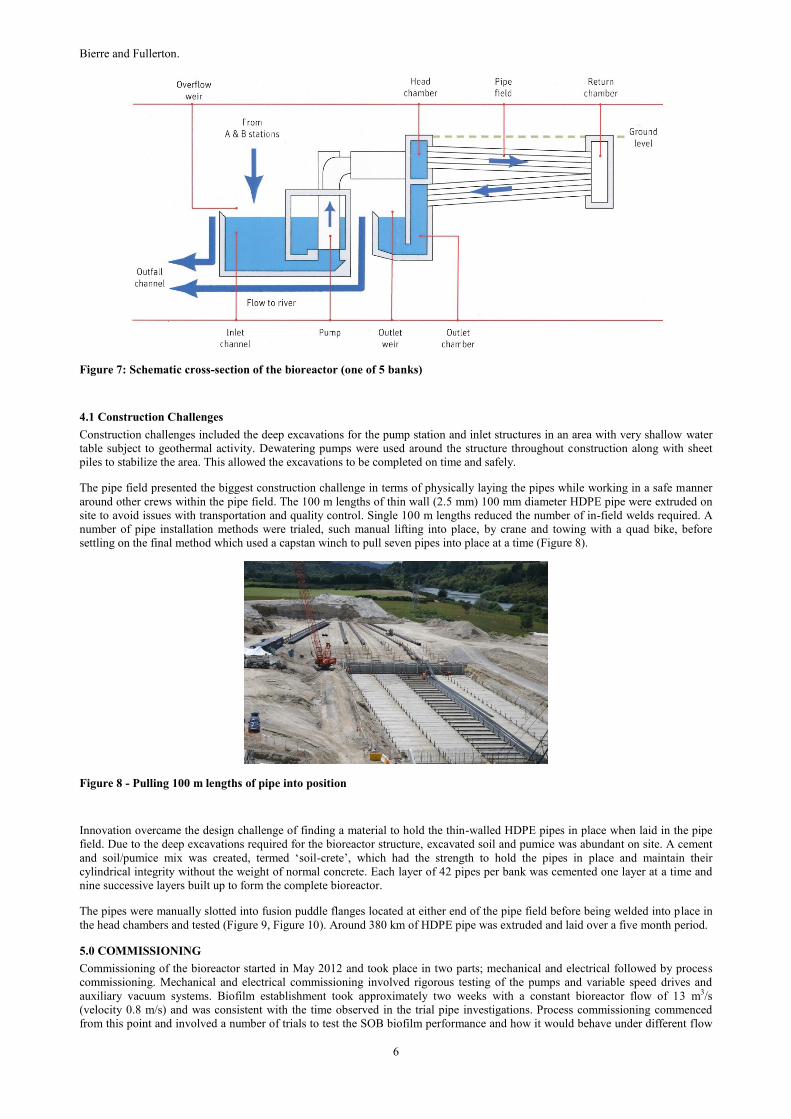
One of the main design constraints of the bioreactor was the need to minimise power usage. An innovative hydraulic design was
developed whereby the 200 m pipe length was split into two 100 m pipe fields in a novel ‘over and under’ configuration to create a
hydraulic siphon which reduced pumping head (Figure 7). The water flow maintains the syphon prime, however, a supplementary
vacuum system is provided for priming if required. The bioreactor is physically split into five independent banks of 378 pipes
configured as 9 layers of 42 pipes. Each bank is connected to an axial flow pump drawing from the common inlet channel.
Independent flow meters on each bank coupled to variable frequency drives enable the flow to be precisely controlled.
4.0 CONSTRUCTION
The timeline imposed by the new consent requirements was one of the largest challenges of the project and the bioreactor was
constructed from start to finish in 12 months. The bioreactor was a unique construction for a number of reasons but primarily due to
it being a world first and hence there were no previous benchmarks to work from.
Bierre and Fullerton.
6
Figure 7: Schematic cross-section of the bioreactor (one of 5 banks)
4.1 Construction Challenges
Construction challenges included the deep excavations for the pump station and inlet structures in an area with very shallow water
table subject to geothermal activity. Dewatering pumps were used around the structure throughout construction along with sheet
piles to stabilize the area. This allowed the excavations to be completed on time and safely.
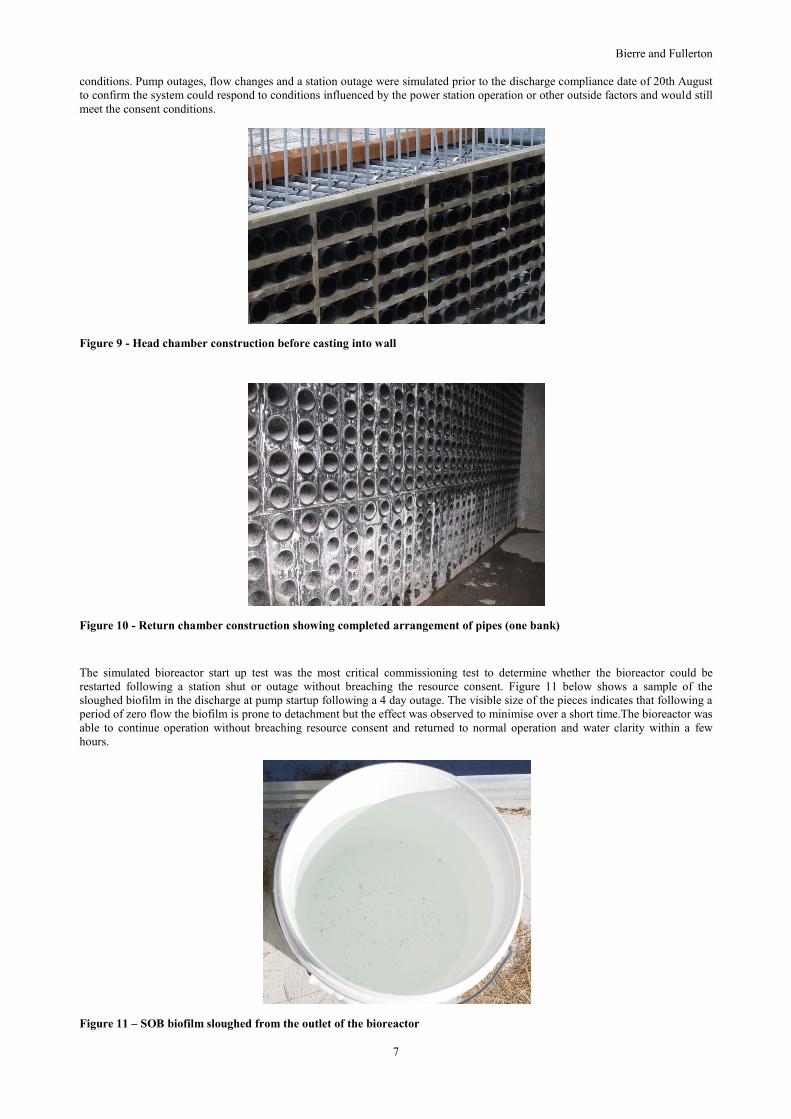
The pipe field presented the biggest construction challenge in terms of physically laying the pipes while working in a safe manner
around other crews within the pipe field. The 100 m lengths of thin wall (2.5 mm) 100 mm diameter HDPE pipe were extruded on
site to avoid issues with transportation and quality control. Single 100 m lengths reduced the number of in-field welds required. A
number of pipe installation methods were trialed, such manual lifting into place, by crane and towing with a quad bike, before
settling on the final method which used a capstan winch to pull seven pipes into place at a time (Figure 8).
Figure 8 - Pulling 100 m lengths of pipe into position
Innovation overcame the design challenge of finding a material to hold the thin-walled HDPE pipes in place when laid in the pipe
field. Due to the deep excavations required for the bioreactor structure, excavated soil and pumice was abundant on site. A cement
and soil/pumice mix was created, termed ‘soil-crete’, which had the strength to hold the pipes in place and maintain their
cylindrical integrity without the weight of normal concrete. Each layer of 42 pipes per bank was cemented one layer at a time and
nine successive layers built up to form the complete bioreactor.
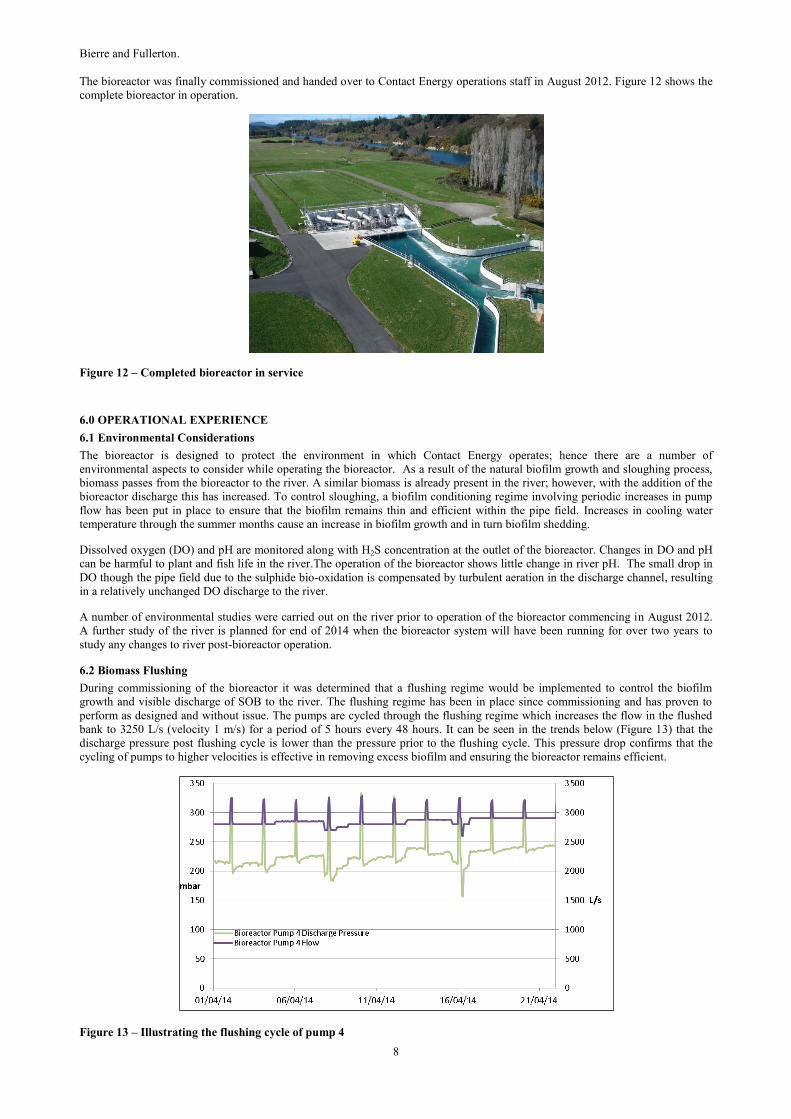
The pipes were manually slotted into fusion puddle flanges located at either end of the pipe field before being welded into place in
the head chambers and tested (Figure 9, Figure 10). Around 380 km of HDPE pipe was extruded and laid over a five month period.
5.0 COMMISSIONING
Commissioning of the bioreactor started in May 2012 and took place in two parts; mechanical and electrical followed by process
commissioning. Mechanical and electrical commissioning involved rigorous testing of the pumps and variable speed drives and
auxiliary vacuum systems. Biofilm establishment took approximately two weeks with a constant bioreactor flow of 13 m3/s
(velocity 0.8 m/s) and was consistent with the time observed in the trial pipe investigations. Process commissioning commenced
from this point and involved a number of trials to test the SOB biofilm performance and how it would behave under different flow
Bierre and Fullerton
7
conditions. Pump outages, flow changes and a station outage were simulated prior to the discharge compliance date of 20th August
to confirm the system could respond to conditions influenced by the power station operation or other outside factors and would still
meet the consent conditions.
Figure 9 - Head chamber construction before casting into wall
Figure 10 - Return chamber construction showing completed arrangement of pipes (one bank)
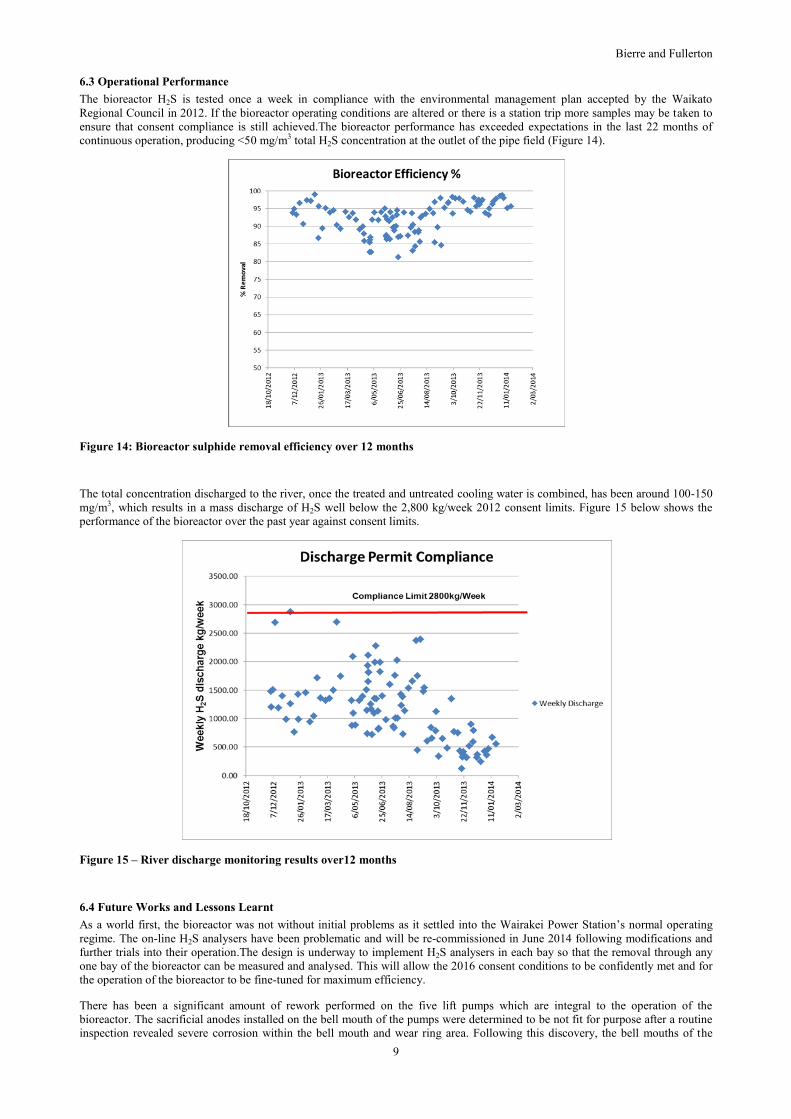
The simulated bioreactor start up test was the most critical commissioning test to determine whether the bioreactor could be
restarted following a station shut or outage without breaching the resource consent. Figure 11 below shows a sample of the
sloughed biofilm in the discharge at pump startup following a 4 day outage. The visible size of the pieces indicates that following a
period of zero flow the biofilm is prone to detachment but the effect was observed to minimise over a short time.The bioreactor was
able to continue operation without breaching resource consent and returned to normal operation and water clarity within a few
hours.
Figure 11 – SOB biofilm sloughed from the outlet of the bioreactor
Bierre and Fullerton.
8
The bioreactor was finally commissioned and handed over to Contact Energy operations staff in August 2012. Figure 12 shows the
complete bioreactor in operation.
Figure 12 – Completed bioreactor in service
6.0 OPERATIONAL EXPERIENCE
6.1 Environmental Considerations
The bioreactor is designed to protect the environment in which Contact Energy operates; hence there are a number of
environmental aspects to consider while operating the bioreactor. As a result of the natural biofilm growth and sloughing process,
biomass passes from the bioreactor to the river. A similar biomass is already present in the river; however, with the addition of the
bioreactor discharge this has increased. To control sloughing, a biofilm conditioning regime involving periodic increases in pump
flow has been put in place to ensure that the biofilm remains thin and efficient within the pipe field. Increases in cooling water
temperature through the summer months cause an increase in biofilm growth and in turn biofilm shedding.
Dissolved oxygen (DO) and pH are monitored along with H2S concentration at the outlet of the bioreactor. Changes in DO and pH
can be harmful to plant and fish life in the river.The operation of the bioreactor shows little change in river pH. The small drop in
DO though the pipe field due to the sulphide bio-oxidation is compensated by turbulent aeration in the discharge channel, resulting
in a relatively unchanged DO discharge to the river.
A number of environmental studies were carried out on the river prior to operation of the bioreactor commencing in August 2012.
A further study of the river is planned for end of 2014 when the bioreactor system will have been running for over two years to
study any changes to river post-bioreactor operation.
6.2 Biomass Flushing
During commissioning of the bioreactor it was determined that a flushing regime would be implemented to control the biofilm
growth and visible discharge of SOB to the river. The flushing regime has been in place since commissioning and has proven to
perform as designed and without issue. The pumps are cycled through the flushing regime which increases the flow in the flushed
bank to 3250 L/s (velocity 1 m/s) for a period of 5 hours every 48 hours. It can be seen in the trends below (Figure 13) that the
discharge pressure post flushing cycle is lower than the pressure prior to the flushing cycle. This pressure drop confirms that the
cycling of pumps to higher velocities is effective in removing excess biofilm and ensuring the bioreactor remains efficient.
Figure 13 – Illustrating the flushing cycle of pump 4
Bierre and Fullerton
9
6.3 Operational Performance
The bioreactor H2S is tested once a week in compliance with the environmental management plan accepted by the Waikato
Regional Council in 2012. If the bioreactor operating conditions are altered or there is a station trip more samples may be taken to
ensure that consent compliance is still achieved.The bioreactor performance has exceeded expectations in the last 22 months of
continuous operation, producing <50 mg/m3 total H2S concentration at the outlet of the pipe field (Figure 14).
Figure 14: Bioreactor sulphide removal efficiency over 12 months
The total concentration discharged to the river, once the treated and untreated cooling water is combined, has been around 100-150
mg/m3, which results in a mass discharge of H2S well below the 2,800 kg/week 2012 consent limits. Figure 15 below shows the
performance of the bioreactor over the past year against consent limits.
Figure 15 – River discharge monitoring results over12 months
6.4 Future Works and Lessons Learnt
As a world first, the bioreactor was not without initial problems as it settled into the Wairakei Power Station’s normal operating
regime. The on-line H2S analysers have been problematic and will be re-commissioned in June 2014 following modifications and
further trials into their operation.The design is underway to implement H2S analysers in each bay so that the removal through any
one bay of the bioreactor can be measured and analysed. This will allow the 2016 consent conditions to be confidently met and for
the operation of the bioreactor to be fine-tuned for maximum efficiency.
There has been a significant amount of rework performed on the five lift pumps which are integral to the operation of the
bioreactor. The sacrificial anodes installed on the bell mouth of the pumps were determined to be not fit for purpose after a routine
inspection revealed severe corrosion within the bell mouth and wear ring area. Following this discovery, the bell mouths of the

Bierre and Fullerton.
10
pumps were refurbished sequentially and new anodes were fitted. Further erosion in the pump wear ring area has also been recently
discovered and further refurbishment is underway.
Leading up to 2016 the Wairakei Station generation load will decrease due to the operation of the recently commissioned Te Mihi
geothermal power station by Contact Energy using the same Wairakei geothermal reservoir. The current 17 m3/s cooling water flow
will be scaled back to 13 m3/s with the untreated cooling water bypass flow reducing to zero, and the operating regime will change
to accommodate this. After 2016 when the sulphide limit drops to 630 kg/week, all cooling water will pass through the bioreactor
for treatment. Power optimization will be one of the main drivers in terms of bioreactor operation as not all five banks will be
required to treat the reduced water flow. Work is underway to devise a new operating strategy and determine how to run the
bioreactor in the most efficient manner.
7.0 CONCLUSIONS
The Wairakei bioreactor project was an innovative solution to a unique problem resulting in a world first large scale tubular biofilm
reactor.
The bioreactor performance has exceeded expectations in its first years of continuous operation, producing <50 mg/m3 total H2S
concentration at the outlet of the pipe field. The total concentration discharged to the river, once the treated and untreated water is
combined, has been around 100-150 mg/m3 which, at a flow of 17 m3/s, is well below the current consent limit of 2,800 kg/week
H2S discharge to the river.
As with any new system there have been some steep learning curves in regards how to operate the bioreactor. Monitoring will
continue and the effect of varying flow regimes to optimize the biofilm condition to minimize biomass discharge and to minimize
power usage will be further investigated, however, the performance of the bioreactor to date gives confidence that the 2016 consent
limit of 630 kg/week H2S will be achieved.
8.0 ACKNOWLEDGEMENTS
In the early stages of the project Lew Bacon, Wayne Christie, and Philip Kidson were instrumental in the development and testing
of the bioreactor trial plant.
REFERENCES
Busiman C. J. N., IJspeert P., Hof A., Janssen A. J. H., Hagen R., Lettinga G., Kinetic Parameters of a Mixed Culture Oxidizing
Sulfide and Sulfur with Oxygen, Biotechnology and Bioengineering, Vol 38, (1991),
Janssen A. J. H., Sleyster R., van der Kaa C., Jochemsen A., Biological Sulphide Oxidation in a Fed-Batch Reactor, Biotechnology
and Bioengineering, Vol. 47, (1995),
Lambert, M.F., Edwards, R. W. J., Howie, S, J., De Gilio, B. B., Quinn, S. P. The Impact of Biofilm Development on Pipe
Roughness and Velocity Profile,World Environmental and Water Resources Congress (2009),
Nelson D. C., Jorgensen B. B., Revsbech N. P., Growth Pattern and Yield of a Chemoautotrophic Beggiatoa sp. In Oxygen-Sulfide
Micro gradients, Applied and Environmental Microbiology, Aug. (1986).