Embed Size (px)
Citation preview
A SUSTAINABLE PATHWAY FOR THE EUROPEAN ENERGY TRANSITION
HYDROGEN ROADMAPEUROPE

This report was prepared for the Fuel Cells and Hydrogen 2 Joint Undertaking. Copies of this document can be downloaded from fch.europa.eu.
The report represents the view of the industry represented by Hydrogen Europe. It was developed with input from 17 companies and organizations: Air Liquide S.A., BMW Group, Deutscher Wasserstoff- und Brennstoffzellenverband, Enagás, Engie, Equinor ASA, N.V. Nederlandse Gasunie, Hydrogenics, ITM Power, Michelin, NEL Hydrogen, Plastic Omnium, Salzgitter AG, Solid Power, Total SA, Toyota Motor Europe, and Verbund.
The information and views set out do not necessarily reflect the official opinion of the FCH 2 JU. The FCH 2 JU does not guarantee the accuracy of the data included in this study. Neither the FCH 2 JU nor any person acting on the FCH 2 JU’s behalf may be held responsible for the use which may be made of the information contained therein.
McKinsey & Company provided analytical support.
fch.europa.eu © Fuel Cells and Hydrogen 2 Joint Undertaking, 2019
Printed by Bietlot in Belgium Manuscript completed in January 2019 1st edition
Neither the Fuel Cells and Hydrogen 2 Joint Undertaking nor any person acting on behalf of the Fuel Cells and Hydrogen 2 Joint Undertaking is responsible for the use that might be made of the following information.
Luxembourg: Publications Office of the European Union, 2019
Print ISBN 978-92-9246-332-8 doi:10.2843/249013 EG-06-18-327-EN-C PDF ISBN 978-92-9246-331-1 doi:10.2843/341510 EG-06-18-327-EN-N
Reproduction is authorized provided the source is acknowledged. For any use or reproduction of photos or other material that is not under the FCH 2 JU copyright, permission must be sought directly from the copyright holders.
Copyrights photographs
© Getty Images, Inc. (title page, pages 20-21, 64-65) © Sandvik Materials Technology AB (pages 48-49)
FUEL CELLS AND HYDROGENJOINT UNDERTAKING
Executive summary ............................................................................................... 4Vision: Hydrogen is required for Europe’s energy transition ...................................................................................... 4Ramping up: A roadmap to realize Hydrogen’s potential for Europe .......................................................................... 8Acting now: Regulators, industry, and investors must launch the EU’s hydrogen roadmap together .......................... 12
Methodology ......................................................................................................... 15
The vision: Exploiting Hydrogen’s unmatched versatility to empower Europe’s energy transition .................................................................................... 17Objective: Making Europe’s clean energy transition efficient and economically attractive ....................................... 18Renewables and power: As an enabler, hydrogen plays a systemic role in the transformation of the energy system ................ 20Transportation: Hydrogen and batteries will work hand in hand to electrify transport ........................................................... 25Buildings: Hydrogen can decarbonize Europe’s gas network ................................................................................... 33Industry heat: Hydrogen can help industries with few alternative decarbonization options ..................................... 37Industry feedstock: A major decarbonization opportunity today and a long-term carbon capture enabler ................ 40
Ramping up: Hydrogen solutions are scalable and benefit Europe’s economy and environment ................................................................................................. 44Overview of deployment in the ambitious and business-as-usual scenarios............................................................ 45Supply perspective .............................................................................................................................................. 51Impact analysis ................................................................................................................................................... 54
Acting now: Industry, investors, and policymakers must act together to realize the hydrogen roadmap in the EU ............................................................ 59Motivation .......................................................................................................................................................... 60Roadmap ............................................................................................................................................................ 62Actionable steps to start the roadmap ................................................................................................................. 64
Glossary .............................................................................................................. 66
Abbreviations ....................................................................................................... 67
Bibliography ........................................................................................................ 68
01
02
03
CONTENTS
3
4
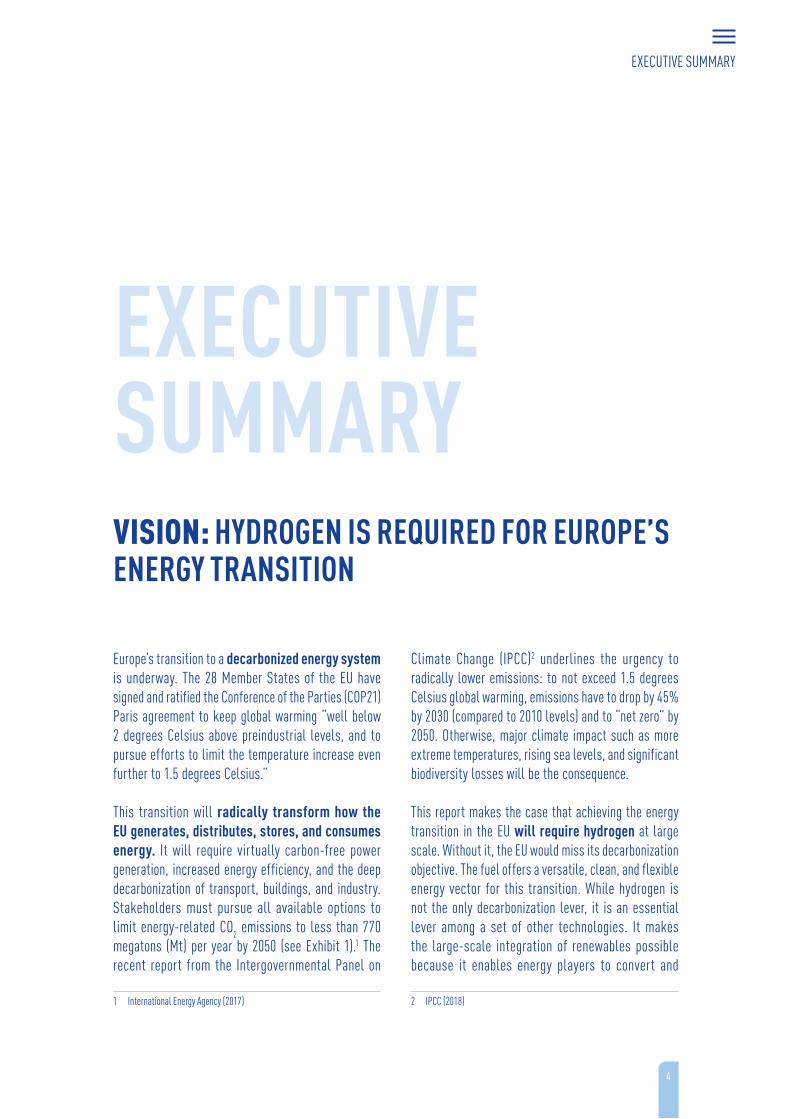
Europe’s transition to a decarbonized energy system is underway. The 28 Member States of the EU have signed and ratified the Conference of the Parties (COP21) Paris agreement to keep global warming “well below 2 degrees Celsius above preindustrial levels, and to pursue efforts to limit the temperature increase even further to 1.5 degrees Celsius.”
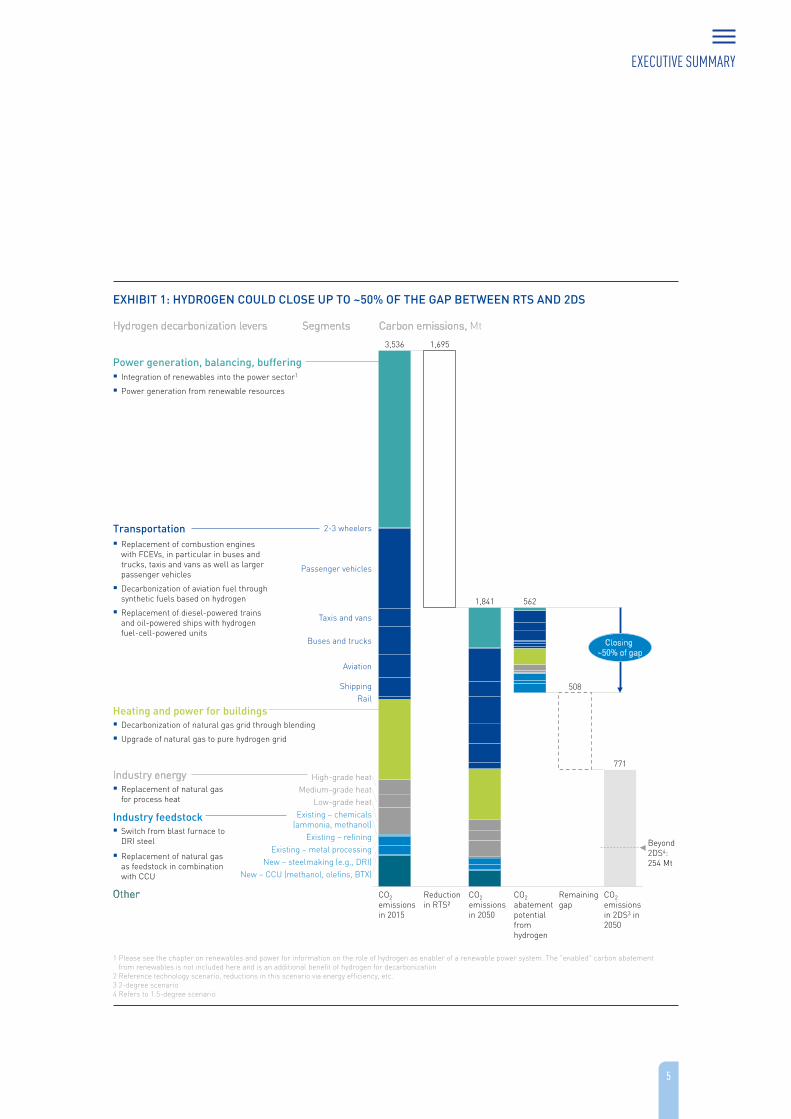
This transition will radically transform how the EU generates, distributes, stores, and consumes energy. It will require virtually carbon-free power generation, increased energy efficiency, and the deep decarbonization of transport, buildings, and industry. Stakeholders must pursue all available options to limit energy-related CO2 emissions to less than 770 megatons (Mt) per year by 2050 (see Exhibit 1).1 The recent report from the Intergovernmental Panel on
1 International Energy Agency (2017)
Climate Change (IPCC)2 underlines the urgency to radically lower emissions: to not exceed 1.5 degrees Celsius global warming, emissions have to drop by 45% by 2030 (compared to 2010 levels) and to “net zero” by 2050. Otherwise, major climate impact such as more extreme temperatures, rising sea levels, and significant biodiversity losses will be the consequence.
This report makes the case that achieving the energy transition in the EU will require hydrogen at large scale. Without it, the EU would miss its decarbonization objective. The fuel offers a versatile, clean, and flexible energy vector for this transition. While hydrogen is not the only decarbonization lever, it is an essential lever among a set of other technologies. It makes the large-scale integration of renewables possible because it enables energy players to convert and
2 IPCC (2018)
VISION: HYDROGEN IS REQUIRED FOR EUROPE’S ENERGY TRANSITION
EXECUTIVE SUMMARY
EXECUTIVESUMMARY
5
1 Please see the chapter on renewables and power for information on the role of hydrogen as enabler of a renewable power system. The "enabled" carbon abatement from renewables is not included here and is an additional benefit of hydrogen for decarbonization
2 Reference technology scenario, reductions in this scenario via energy efficiency, etc.3 2-degree scenario 4 Refers to 1.5-degree scenario
771
508
Aviation
ShippingRail
Medium-grade heat
CO2abatementpotential fromhydrogen
CO2 emissionsin 2015
Low-grade heat
Existing – metal processing
Existing – chemicals(ammonia, methanol)
Reductionin RTS²
Existing – refining
2-3 wheelers
CO2 emissionsin 2050
CO2 emissionsin 2DS3 in 2050
Remaininggap
New – CCU (methanol, olefins, BTX)
1,695
Passenger vehicles
3,536
High-grade heat
New – steelmaking (e.g., DRI)
Taxis and vans
1,841 562
Buses and trucks Closing ~50% of gap
Power generation, balancing, buffering
SegmentsHydrogen decarbonization levers Carbon emissions, Mt
Beyond 2DS4:254 Mt
Integration of renewables into the power sector1
Power generation from renewable resources
Transportation Replacement of combustion engines
with FCEVs, in particular in buses and trucks, taxis and vans as well as larger passenger vehicles
Decarbonization of aviation fuel through synthetic fuels based on hydrogen
Replacement of diesel-powered trains and oil-powered ships with hydrogen fuel-cell-powered units
Heating and power for buildings Decarbonization of natural gas grid through blending
Upgrade of natural gas to pure hydrogen grid
Industry energy Replacement of natural gas
for process heat
Industry feedstock Switch from blast furnace to
DRI steel
Replacement of natural gas as feedstock in combination with CCU
Other
EXHIBIT 1: HYDROGEN COULD CLOSE UP TO ~50% OF THE GAP BETWEEN RTS AND 2DS
EXECUTIVE SUMMARY
6
store energy as a renewable gas. It can be used for energy distribution across sectors and regions and as a buffer for renewables. It provides a way to decarbonize segments in power, transport, buildings, and industry, which would otherwise be difficult to decarbonize.
The conviction that hydrogen is required is based on three fundamental arguments:
First, hydrogen is the best (or only) choice for at-scale decarbonization of selected segments in transport, industry, and buildings. Specifically:
� The decarbonization of the gas grid that connects Europe’s industry and delivers more than 40% of heating in EU households and 15% of EU power generation requires hydrogen. Biogas, while an important lever, will not be available at the required scale. Electrification with heat pumps can replace natural gas to heat new buildings, but requires costly or even impossible retrofits in old buildings, which account for 90% of buildings’ CO2 emissions. Full direct electrification would also lead to major seasonal imbalances in power demand that would, in turn, require a power storage mechanism at large scale. Hydrogen does not suffer from these shortcomings and can act as a complement to heat pumps. Producers can distribute some hydrogen by blending it into the existing grid without the need for major upgrades, but it is possible to go much further than this. Ultimately, energy suppliers can convert grids to run on pure hydrogen. Alternatively, natural gas can be replaced with synthetic natural gas (SNG) produced from hydrogen and CO2. All gas-based heating systems can increase energy efficiency through the use of fuel cell-based combined heat and power (CHP) technology.
� In transport, hydrogen is the most promising decarbonization option for trucks, buses, ships, trains, large cars, and commercial vehicles, where the lower energy density (hence lower range), high initial costs, and slow recharging performance of batteries are major disadvantages. Fuel cells also require significantly less raw materials compared to batteries and combustion engines. Because the transport segment makes up about one-third of all CO2 emissions in the EU, its decarbonization represents a key element in achieving the energy transition. In addition, hydrogen refueling infrastructure has significant advantages: it requires only about one-tenth of the space in cities and along highways compared to fast charging. Likewise, suppliers can provide hydrogen flexibly, while at-scale fast charging infrastructure would require significant grid upgrades. Lastly, once minimum rollout takes place, hydrogen provides an attractive business case for operators. In aviation, hydrogen and synthetic fuels based on hydrogen are the only at-scale option for direct decarbonization.
� Industry can burn hydrogen to produce high-grade heat and use the fuel in several processes as feedstock, either directly or together with CO2 as synfuel/electrofuel. In steelmaking, e.g., hydrogen can work as a reductant, substituting for coal-based blast furnaces. When used as a feedstock for ammonia production and hydrotreating in refineries, it could be produced from low carbon sources in future. Together with CO2, hydrogen can also displace hydrocarbons, such as natural gas, in chemical processes such as the production of olefins and hydrocarbon solvents (BTX), which make up a substantial part of feedstock uses. This provides a carbon sink, i.e., an opportunity for CO2 to be used instead of emitted.
EXECUTIVE SUMMARY
7
Second, hydrogen will play a systemic role in the transition to renewable energy sources by providing a mechanism to flexibly transfer energy across sectors, time, and place.
� Sectors. The EU’s energy transition requires almost completely decarbonized power generation, which implies the need to integrate renewables into the grid. Hydrogen is the only at-scale technology for “sector coupling”, allowing to convert generated power into a usable form, to store it, and to channel it to end use sectors to meet demand. Electrolyzers can convert renewable electricity into a gas that has all the flexibility but none of the carbon emissions of natural gas.
� Time. As electricity satisfies higher energy demand and increased amounts of energy come from renewables, both short and long duration supply/demand imbalances will increase. This creates the need for increased balancing across the year and seasonal energy storage. While batteries and demand-side measures can provide short-term flexibility, hydrogen is the only at-scale technology available for long-term energy storage. It can make use of existing gas grids, salt caverns, and depleted gas fields to store energy for longer periods of time at low cost.
� Place. Hydrogen provides a link between regions with low-cost renewables and those that are centers of demand – e.g., connecting regions with abundant geothermal and wind energy in the north of Europe to the main continent, or as a means of importing renewable energy from northern Africa. Hydrogen enables the long-distance transportation of energy in pipelines, ships, or trucks, whether gaseous, liquified, or stored in other forms, which costs much less than power transmission lines.
Third, the transition to hydrogen is aligned with customer preferences and convenience. This is key since low carbon alternatives that do not meet customer preferences will likely face adoption difficulties. In transport, hydrogen offers the same range and refueling speed as combustion-engine vehicles. Energy companies can blend hydrogen or synthetic methane into the gas grid via power-to-gas plants using current piping, making the switch “invisible” to consumers. While a later switch to 100% hydrogen requires upgrading appliances and piping, it still leaves the current heating infrastructure within buildings intact.
EXECUTIVE SUMMARY
8
This report describes an ambitious scenario for hydrogen deployment in the EU to achieve the 2-degree target.3 This scenario is based on the perspective of the global Hydrogen Council, input from Hydrogen Europe
3 As part of the Paris agreement, EU member states have committed to achieving the 2-degree scenario and making efforts towards achieving a 1.5-degree scenario.
(representing the European hydrogen and fuel cells industry), and, more specifically, data from 17 member companies active in hydrogen and fuel cell technologies.
This study anchors on achieving the 2-degree scenario – the necessity for hydrogen and the amount of deployment would be even greater in a 1.5-degree scenario.
RAMPING UP: A ROADMAP TO REALIZE HYDROGEN’S POTENTIAL FOR EUROPE
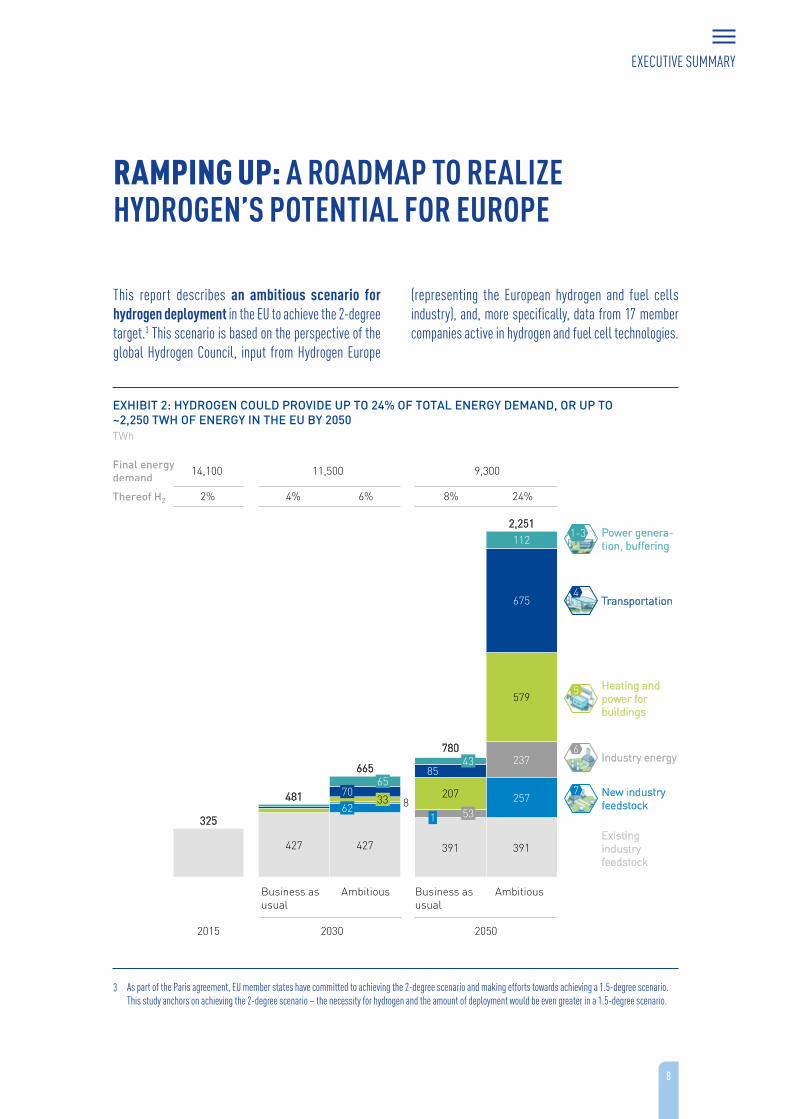
EXHIBIT 2: HYDROGEN COULD PROVIDE UP TO 24% OF TOTAL ENERGY DEMAND, OR UP TO ~2,250 TWH OF ENERGY IN THE EU BY 2050
Existing industryfeedstock
325
427 427
862481
65
33
665
70
391 391
257
23785
675
112
579
43
2,251
780
207
531
AmbitiousBusiness as usual
AmbitiousBusiness as usual
205020302015
7 New industry feedstock
6Industry energy
5 Heating and power for buildings
4Transportation
1-3 Power genera-tion, buffering
Final energy demand
14,100 11,500 9,300
Thereof H2 24%6%4%2% 8%
TWh
As part of the Paris agreement, EU member states have committed to achieving the 2-degree scenario and making efforts towards achieving a 1.5-degree scenario. This study anchors on achieving the 2-degree scenario – the necessity for hydrogen and the amount of deployment would be even greater in a 1.5-degree scenario.
EXECUTIVE SUMMARY
9
Across sectors, we see the potential for generating approximately 2,250 terawatt hours (TWh) of hydrogen in Europe in 2050, representing roughly a quarter of the EU’s total energy demand (see Exhibit 2). This amount would fuel about 42 million large cars, 1.7 million trucks, approximately a quarter of a million buses, and more than 5,500 trains. It would heat more than the equivalent of 52 million households (about 465 TWh) and provide as much as 10% of building power demand. In industry, approximately 160 TWh of hydrogen would produce high-grade heat and another 140 TWh would replace coal in steelmaking processes in the form of direct reduced iron (DRI). 120 TWh of hydrogen combined with captured carbon or carbon from biomass would also produce synthetic feedstock for 40 Mt of chemicals in 2050.
Achieving this vision puts the EU on a path to reducing about 560 Mt of CO2 emissions by 2050 – as much as half of the required abatements needed to achieve the 2-degree scenario (see Exhibit 1). The EU needs to reduce its CO2 emissions from 3,500 Mt today to 770 Mt in 2050. Deploying available technologies and existing energy- and climate-related commitments from European countries would close approximately 60% of the gap (approximately 1,700 Mt in the Reference Technology Scenario). The use of hydrogen in end sectors could help to reduce half of the remaining 1,100 Mt and achieve the 2-degree scenario. In addition, it could enable deep decarbonization of the power sector and hence indirectly reduce carbon emissions.
Besides reducing carbon emissions, the deployment of hydrogen and fuel cell technologies would remove local emissions. In transportation, NOX emissions could be reduced by 0.5 Mt per year in 2050. Rivers, lakes, and ports would be less polluted, steel and other industrial
plants would avoid dust and tar exhaust, and noise from diesel trains and trucks would drop significantly.
The projected deployment of hydrogen would create an estimated EUR 130 billion industry for the fuel and associated equipment for EU companies by 2030, reaching EUR 820 billion by 2050. It would create a local market for EU industry to use as a springboard for competing globally in the new hydrogen economy. The export potential in 2030 should reach an estimated EUR 70 billion, with net exports of EUR 50 billion. Altogether, the EU hydrogen industry could provide employment for about 1.0 million highly-skilled workers by 2030, reaching 5.4 million by 2050.
Realizing this ambition will require a significant step-up of activities along the whole value chain. The ramp-up should start now as hydrogen and fuel cell technologies are technically ready for most segments and the EU industry must scale up to reduce costs and gain a leading position in the global energy transition economy (see Exhibit 3). Towards 2030, deployment should focus on priority segments such as the blending of hydrogen into the natural gas grid and use in commercial transportation fleets, larger passenger vehicles, heavy transport (trucks, trains, ships), material handling, and the decarbonization of existing hydrogen production. We propose the following concrete milestones:
� In transport, by 2030 fuel cell electric vehicles (FCEVs) could account for 1 in 22 passenger vehicles and 1 in 12 of light commercial vehicles (LCVs) sold, leading to a fleet of 3.7 million fuel cell passenger vehicles and 500,000 fuel cell LCVs. In addition, about 45,000 fuel cell trucks and buses could be on the road by 2030. Fuel cell trains could also replace roughly 570 diesel trains by 2030.
EXECUTIVE SUMMARY
10
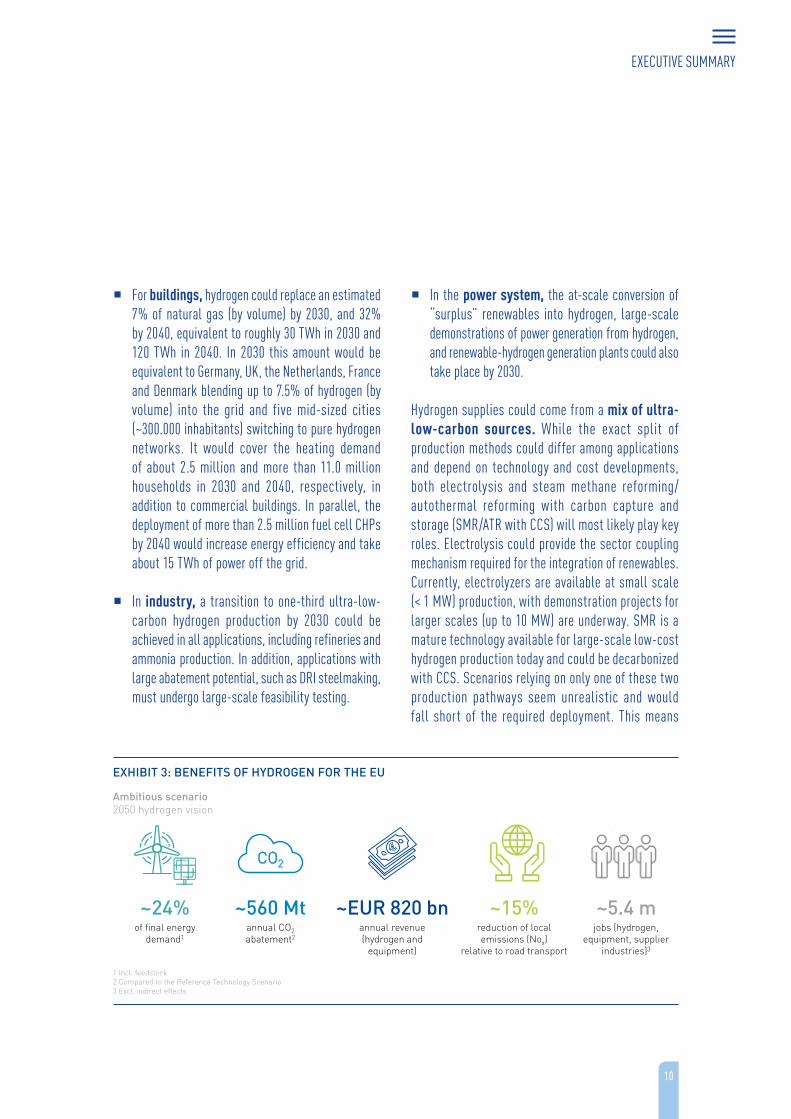
� For buildings, hydrogen could replace an estimated 7% of natural gas (by volume) by 2030, and 32% by 2040, equivalent to roughly 30 TWh in 2030 and 120 TWh in 2040. In 2030 this amount would be equivalent to Germany, UK, the Netherlands, France and Denmark blending up to 7.5% of hydrogen (by volume) into the grid and five mid-sized cities (~300.000 inhabitants) switching to pure hydrogen networks. It would cover the heating demand of about 2.5 million and more than 11.0 million households in 2030 and 2040, respectively, in addition to commercial buildings. In parallel, the deployment of more than 2.5 million fuel cell CHPs by 2040 would increase energy efficiency and take about 15 TWh of power off the grid.
� In industry, a transition to one-third ultra-low-carbon hydrogen production by 2030 could be achieved in all applications, including refineries and ammonia production. In addition, applications with large abatement potential, such as DRI steelmaking, must undergo large-scale feasibility testing.
� In the power system, the at-scale conversion of “surplus” renewables into hydrogen, large-scale demonstrations of power generation from hydrogen, and renewable-hydrogen generation plants could also take place by 2030.
Hydrogen supplies could come from a mix of ultra-low-carbon sources. While the exact split of production methods could differ among applications and depend on technology and cost developments, both electrolysis and steam methane reforming/autothermal reforming with carbon capture and storage (SMR/ATR with CCS) will most likely play key roles. Electrolysis could provide the sector coupling mechanism required for the integration of renewables. Currently, electrolyzers are available at small scale (< 1 MW) production, with demonstration projects for larger scales (up to 10 MW) are underway. SMR is a mature technology available for large-scale low-cost hydrogen production today and could be decarbonized with CCS. Scenarios relying on only one of these two production pathways seem unrealistic and would fall short of the required deployment. This means
EXHIBIT 3: BENEFITS OF HYDROGEN FOR THE EU
1 Incl. feedstock 2 Compared to the Reference Technology Scenario 3 Excl. indirect effects
Ambitious scenario2050 hydrogen vision
~24%of final energy
demand1
~15%reduction of local emissions (Nox)
relative to road transport
~560 Mtannual CO2abatement2
~EUR 820 bnannual revenue (hydrogen and
equipment)
~5.4 mjobs (hydrogen,
equipment, supplier industries)3
CO2
EXECUTIVE SUMMARY

11
that policymakers and industry must focus on the development and scale-up of both pathways.
Realizing these ambitious milestones will require a coordinated approach by policymakers, industry, and investors. If this level of cooperation does not emerge and current policies remain in place, hydrogen will see much lower deployment levels and decarbonization targets will remain unmet. This report describes such a development, the business-as-usual (BAU) scenario. In this scenario, hydrogen demand would amount to only about 780 TWh in 2050 (compared with 2,250 TWh in the ambitious scenario). The use of hydrogen would abate about 100 Mt of CO2 by 2050, leaving a gap of approximately 960 Mt to the 2-degree scenario.
The deep decarbonization of sectors such as steel, heavy duty transport, and buildings would not happen, putting the 2-degree scenario out of reach. In transport, the deployment of FCEVs could fail altogether, especially if insufficient momentum is gained, leaving FCEVs and hydrogen refueling stations (HRS) as niche solutions, and policymakers and industry underfunding their further development. Since EU industry would lack a strong home market and would not have developed its hydrogen industries on a large scale, it would likely remain uncompetitive internationally. Even if development does not falter but tracks our BAU scenario, we estimate revenues would remain approximately 80% lower than in the ambitious scenario, with about 4.4 million fewer jobs related to hydrogen and fuel cells created by 2050.
EXECUTIVE SUMMARY
12
ACTING NOW: REGULATORS, INDUSTRY, AND INVESTORS MUST LAUNCH THE EU’S HYDROGEN ROADMAP TOGETHER
Materializing the clearly impressive benefits of the hydro-gen roadmap will require substantial but achievable investment. During the scale-up of industry towards 2030, we estimate annual investments of about EUR 8 billion across the EU in the ambitious scenario. This is equivalent to only a third of the renewable feed-in tariffs (FiTs) paid in Germany, less than one-tenth of the investments the International Energy Agency (IEA) expects for the energy transition in Europe, or less than 5% of the total annual investments in energy and automotive assets in Europe.
Financing the required infrastructure is also possible: to give an order of magnitude, a tax of 1 cent on every liter of gasoline and diesel for three years would easily fund the construction of basic EU-wide hydrogen refueling infrastructure, which would cost approximately EUR 8 billion until 2030. Through smart planning and industry participation, this requisite initial financing could be reduced even further. In addition, adequate policy frameworks for market uptake are required to enable and accelerate investment in the different value chains.
The EU has several assets that make it particularly well-suited to lead in hydrogen and fuel cell technology. First, it has world-class players along the hydrogen and fuel cell value chains that can drive the development and deployment of hydrogen solutions. Second, it has strong research institutions in hydrogen and well-developed programs to support research, development, and deployment (RD&D) at the EU, national, and regional levels. Third, the EU is committed to achieving environmental targets, such as increasing renewables, decreasing carbon emissions, and cutting local emissions, and environmental consciousness and awareness is high among its citizens. Fourth, it has an extensive natural gas network, which it can rely on to decarbonize households
and industry. To start deployment, we propose strategic prioritization of segments. For each segment, we consider the anticipated commercialization timeline, the certainty of commercialization, and the impact on carbon emissions. From this logic, we derive several no-regret moves – segments in need of development no matter what; big opportunities – segments that promise a big impact but should be de-risked; and options – segments that could become attractive but are risky. From this prioritization, we derive a set of actions, summarized as follows:
Overarching recommendations
1. Regulators and industry should jointly set out clear, long-term, realistic, and holistic decarbonization pathways for all sectors and segments. Such pathways should not only set targets for end applications (e.g., emission targets for vehicles or targets for the decarbonization of houses), but also consider the requisite infrastructure for energy generation and distribution. They should also provide credible, long-term guidance for the industry to unlock investments in product development and infrastructure.
2. The European industry should invest in hydrogen and fuel cell technology to remain competitive and positioned to capture emerging opportunities. This would require a long-term perspective on hydrogen and decarbonization, and horizontal as well as vertical alliances to overcome barriers. In the same vein, industry should work closely with regulators to develop a strong home market and value chains within the EU. It should also develop industrial cooperation with players in the fast-accelerating hydrogen and fuel cell markets in Asia (e.g., China, Japan, Korea) to hedge market risk.
EXECUTIVE SUMMARY
13
Kickstarting deployment across four sectors
3. Regulators and gas companies should begin to decarbonize the gas grid. As forcing mechanisms, they could use binding targets for renewable content in the gas grid or other instruments such as contracts-for-difference (CfDs), feed-in tariffs (FiTs) or investment supports for ultra-low-carbon hydrogen (like e.g., those for biogas). Such a policy faces few significant barriers: blending hydrogen at modest concentrations is compatible with current infrastructure and appliances, would not increase gas prices substantially, reduces the global warming potential of the gas grid and runs no risk of CO2 leakage. However, there is a need to modernize and harmonize regulations that concern hydrogen blending into the natural gas grids, which currently differ across Member States.
4. In the power system, regulators should encourage the use of electrolyzers to balance the grid, e.g., by exempting them from grid fees and ensuring competitive access to renewable power on the market. Similar to the use of FiTs in regular power markets, power balancing markets should include mechanisms to displace CO2-emitting balancing mechanisms (e.g., spinning reserves provided by gas turbines) with green alternatives such as flexible hydrogen production. Regulators and industry should kickstart the development of a decentralized power-to-gas market in Europe, significantly bringing down costs of production while creating a sector coupling mechanism that will benefit the power system by stabilizing prices and dealing with seasonal imbalances. This would also reduce the extent to which required renewables must be curtailed. In the medium- to long-term, stakeholders should develop
a framework for seasonal and long-term energy storage.
5. In transport, regulators should overcome the chicken-and-egg problem by setting out a clear and credible roadmap, developing policies for zero-emission mobility with corresponding funding and guarantee mechanisms to unlock investment in refueling infrastructure. Such a roadmap towards basic coverage across the EU would provide the signal to car companies and their suppliers to scale up the production of FCEVs, leading to significant cost reductions and greater consumer choice. It would also industrialize the manufacturing of HRS, leading to lower costs for hydrogen at the pump.
In parallel to developing the refueling infrastructure, industry should invest in product development and start offering a broader range of FCEVs in the segments most suitable for the technology: trucks, buses, vans, and larger passenger vehicles. Here, industry should cooperate beyond traditional industry barriers and offer solutions, bundling infrastructure, equipment, and maintenance. Regulators should encourage such investments by providing incentives, such as the public procurement of FCEV buses, the implementation of fleet regulations for truck, coach, and taxi operators, and nonmonetary incentives for FCEV drivers.
6. In industry, stakeholders should kickstart the transition from grey to low-carbon hydrogen and further substitution of fossil fuels with new hydrogen usages. Regulators should ensure carbon-free hydrogen production counts towards renewable targets (e.g., as set out by Renewable Energy Directive II for refining) and low carbon targets are set across all major uses of hydrogen (e.g., in ammonia production).
EXECUTIVE SUMMARY
14
Such a transition would create a significant step-change in hydrogen production technology in terms of scale and costs, making hydrogen solutions more attractive not only for industry, but also in other sectors.
Building the ultra-low-carbon hydrogen production supply system
7. To produce ultra-low-carbon hydrogen on a large scale, companies should enlarge their electrolysis operations to commercial levels and prove CCS can produce hydrogen of very low carbon intensity on a large scale within the next ten years. The above-mentioned targets for carbon-free hydrogen in the gas grid or CfDs/FiTs (see recommendation three) would create the incentive to generate the required investments in the electrolysis industry. Both central production of hydrogen from electrolysis and decentralized solutions providing stability to the grid should be adequately incentivized. Guarantees of Origin (GOs), such as those from the CertifHy project, should be used and embraced by regulation and national policymakers. For SMR with CCS technology, stakeholders should consider supporting industry-scale demonstration projects followed by developing a roadmap for their future deployment.
Supporting and enabling additional hydrogen applications
8. Industry and regulatory stakeholders should continue to develop additional hydrogen and fuel cell applications and plans to scale up successfully proven ones. The recent successes with hydrogen trains, e.g., should be the start of a Europe-wide replacement of diesel trains. In shipping, regulators
should establish decarbonization targets for ports, rivers, and lakes in addition to the International Maritime Organization’s target for ocean shipping and support the rollout of hydrogen refueling capacities. Boosting the deployment of mCHPs (micro combined heat and power) and CHPs for residential and commercial properties should improve energy efficiency in buildings and make the best use of hydrogen and natural gas.
This report aims to demonstrate that hydrogen is a key pillar for the energy transition and that Europe can lead the way in the hydrogen industry. Reaping these benefits will require significant scaling up of activities along the entire value chain, but, with targeted interventions, we believe the EU can achieve a virtuous cycle of reinforcement.
EXECUTIVE SUMMARY
15
METHODOLOGYOur goal is to create a comprehensive roadmap for the deployment of hydrogen and fuel cell solutions in Europe. To that end, we developed a three-step process built atop a baseline established from multiple EU-specific sources, combined with adoption rates derived from the coalition consisting of the Fuel Cells and Hydrogen Joint Undertaking (FCH JU) and multiple industry players. We pressure-tested and quality-checked this model using external forecasts and interviews with coalition members.
The first step involves modeling the general EU energy system of the future based on multiple sources. These include using the “2-degree Celsius scenario” energy system from the International Energy Agency as a main baseline for all segments. The used power mix was based on Enerdata’s “green scenario” compared with the European Commission’s PRIMES model. Enerdata provides projections of renewable electricity and total production on country level until 2040. The EU Commission’s PRIMES model, which offers a reference scenario and detailed forecasts per country until 2050, was then used as a comparison to Enerdata’s model. To model granular developments within sectors, we used McKinsey Energy Insights, industry perspectives, and expert interviews, including segment level data in transportation, industry perspectives on chemicals, refining and petrochemical industry, and other data. The model also
reflects external studies for sector, country and regional level analyses (the text explicitly mentions sources; see bibliography for a full list).
In step two, we estimated the market potential for hydrogen, defined segment-specific adoption rates and modeled fleets and energy demand. The adoption rates result from a combination of external studies, e.g., Pöyry, the expert opinions of the coalition members, and the results of the Hydrogen Council report “Scaling up” adapted to EU countries. We modeled hydrogen adoption according to two different scenarios:
� An ambitious scenario showing the full potential of hydrogen in a 2-degree world and with a coordinated effort of industry, investors, and policymakers. We based this scenario on the Hydrogen Council Roadmap, adapted it to Europe and refined it with industry members of the coalition. In this scenario, the EU achieves the 2-degree target.
� A business-as-usual (BAU) scenario in which current policies continue, but no step-up of activities takes place, based on interviews with industry members of the coalition. In this case, the EU fails to reach the 2-degree target in 2050.
METHODOLOGY
16
METHODOLOGY
To simulate the supply of the required hydrogen for these adoption rates, we modeled two scenarios with similar CO2 abatement potential. These scenarios were used as a pressure test of the required scale-up and investment. In the “water-electrolysis-dominant scenario”, new hydrogen demand is met to a large degree from electrolysis, with natural gas-based production methods as a bridge until 2030. Existing hydrogen demand (i.e., hydrogen that is already in use today) is converted, where feasible, to electrolysis in the long term. The “SMR-/ATR-dominant scenario” describes a world in which new hydrogen demand is met partially from decentral electrolysis, with the majority of demand coming from natural gas reforming. In this world, steam methane reforming/autothermal reforming (SMR/ATR)4 remains the lowest cost option and dominates the production mix and will be combined with carbon capture and storage to produce decarbonized hydrogen. Both scenarios achieve similar carbon abatement by 2030 and almost complete decarbonization of hydrogen production by 2050.
4 In the process of steam methane reforming (SMR), methane (natural gas) and water in the form of steam react to hydrogen and carbon dioxide in a steam methane reformer. Compared to SMR, autothermal reforming (ATR) partially combusts methane to produce hydrogen and carbon monoxide, being more efficient than SMR.
In step three, after combining baseline and adoption scenarios, we performed multiple quality and feasibility tests on the developed scenarios. We compared results against other published studies and identified and analyzed the bottlenecks to deployment. We validated the short-term ramp-up with current developments in industry, compared to a bottom-up simulation of value chains by the FCH JU, and reviewed results with industry experts both from the companies participating in this study as well as third parties.
17
01THE VISIONExploiting Hydrogen’s unmatched versatility to empower Europe’s energy transition
18
OBJECTIVE: MAKING EUROPE’S CLEAN ENERGY TRANSITION EFFICIENT AND ECONOMICALLY ATTRACTIVE
Europe is going green, and hydrogen will lead the way. The region has committed to transitioning its energy system to a more climate-friendly footing. Its target is to remove approximately 2,800 megatons (Mt) of carbon dioxide (CO2) emissions by 2050; an amount equal to 78% of 2014 CO2 emissions.5 Existing energy- and climate-related commitments by European countries, including national contributions under the Paris Agreement and energy efficiency improvements should cut about 1,700 Mt of CO2 emissions. Abating the other 1,100 Mt of CO2 emissions would require additional efforts beyond current plans. We believe hydrogen will play a major and irreplaceable role in making both the committed and additional efforts succeed.
The success of this transformation could not just reduce carbon emissions; it could also boost industrial competitiveness in the region, reduce resource dependency, cut energy costs, and improve citizens’ lives as air quality improves. The transition could increase the EU’s overall GDP growth of 40%6 due to higher industrial output and increasing energy demand.
However, reaching this objective will require a radical transformation in how we generate, distribute, store, and consume energy with four specific challenges to overcome:
1. End use sectors such as transportation, buildings, and industry need to achieve deep decarbonization, including segments that are hard to electrify (e.g., heavy transport, building heating, high-grade industry heat).
2. As power generation will be to a large degree from renewables, the energy system needs to be able to cope with intermittency and seasonal imbalances.
5 International Energy Agency (2017)
6 European Commission (2012)
3. The transformation should achieve its objectives while meeting customer preferences, and decarbonized technologies need to provide convenient solutions in order to gain mass appeal.
4. The EU wants to retain its technological leadership by developing an energy system that strengthens its businesses and uses the EU’s skills and strengths.
We believe hydrogen represents a versatile, clean, and flexible energy vector (see Exhibit 4). By analyzing its potential segment by segment, we are convinced that hydrogen is needed to achieve the energy transition in an efficient and economically attractive manner in the EU.
Specifically, we see the following key benefits of hydrogen for the EU’s energy transition:
� Hydrogen will offer the only feasible route for at-scale decarbonization in selected end use segments: it can employ existing assets and infrastructure, such as Europe’s extensive natural gas network, existing heaters, industrial assets, and fuel retail networks to decarbonize the gas grid, heavy transport, and high-grade heat. Low carbon hydrogen is, besides CCS, the only at-scale path to reduce the carbon footprint of industry feedstock, especially in the production of steel and chemicals. With the long-term cost of renewables expected to decline, it could become the most cost-competitive means of producing steel and ammonia. In aviation, synthetic fuels produced from hydrogen are the only option to reduce carbon on a large scale. For ships and nonelectrified trains, hydrogen-powered fuel cells can provide energy for long distances.
01 THE VISION
19
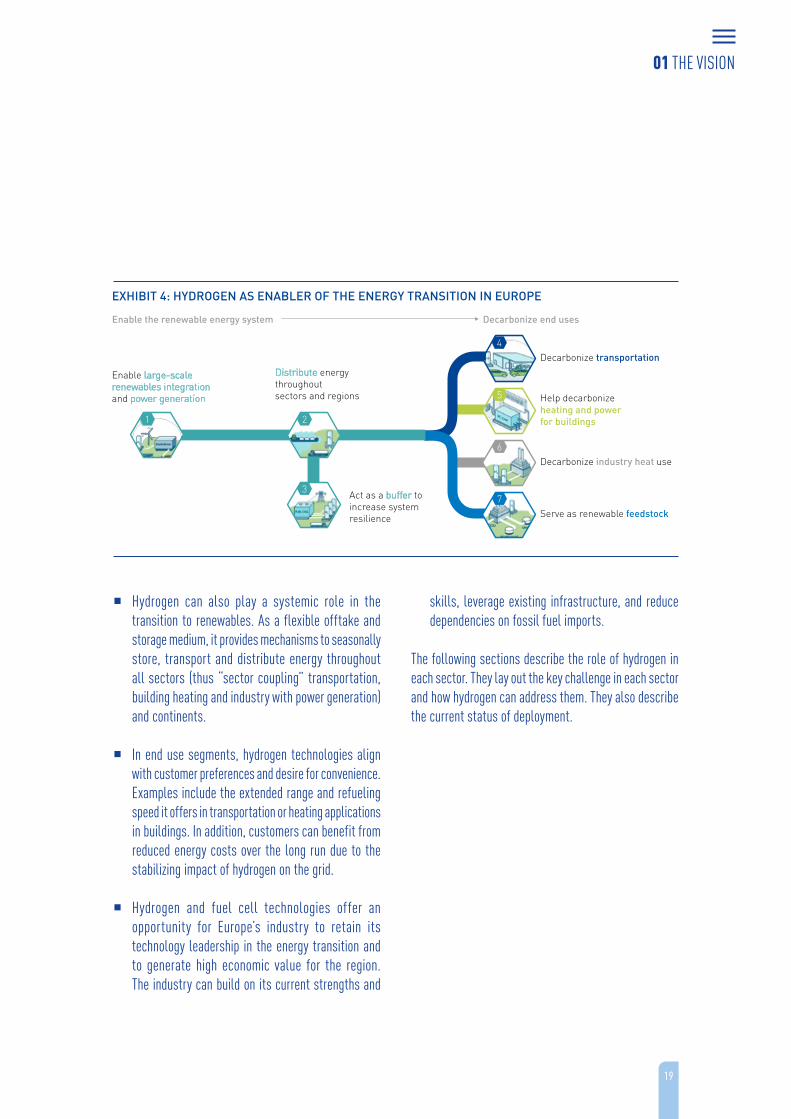
� Hydrogen can also play a systemic role in the transition to renewables. As a flexible offtake and storage medium, it provides mechanisms to seasonally store, transport and distribute energy throughout all sectors (thus “sector coupling” transportation, building heating and industry with power generation) and continents.
� In end use segments, hydrogen technologies align with customer preferences and desire for convenience. Examples include the extended range and refueling speed it offers in transportation or heating applications in buildings. In addition, customers can benefit from reduced energy costs over the long run due to the stabilizing impact of hydrogen on the grid.
� Hydrogen and fuel cell technologies offer an opportunity for Europe’s industry to retain its technology leadership in the energy transition and to generate high economic value for the region. The industry can build on its current strengths and
skills, leverage existing infrastructure, and reduce dependencies on fossil fuel imports.
The following sections describe the role of hydrogen in each sector. They lay out the key challenge in each sector and how hydrogen can address them. They also describe the current status of deployment.
Enable large-scalerenewables integration and power generation
Enable the renewable energy system
Serve as renewable feedstock
Decarbonize transportation4
7
Decarbonize industry heat use6
Help decarbonizeheating and power for buildings
5
Decarbonize end uses
EXHIBIT 4: HYDROGEN AS ENABLER OF THE ENERGY TRANSITION IN EUROPE
Act as a buffer to increase system resilience
Distribute energy throughout sectors and regions
1 2
3
01 THE VISION
20
THE CHALLENGE
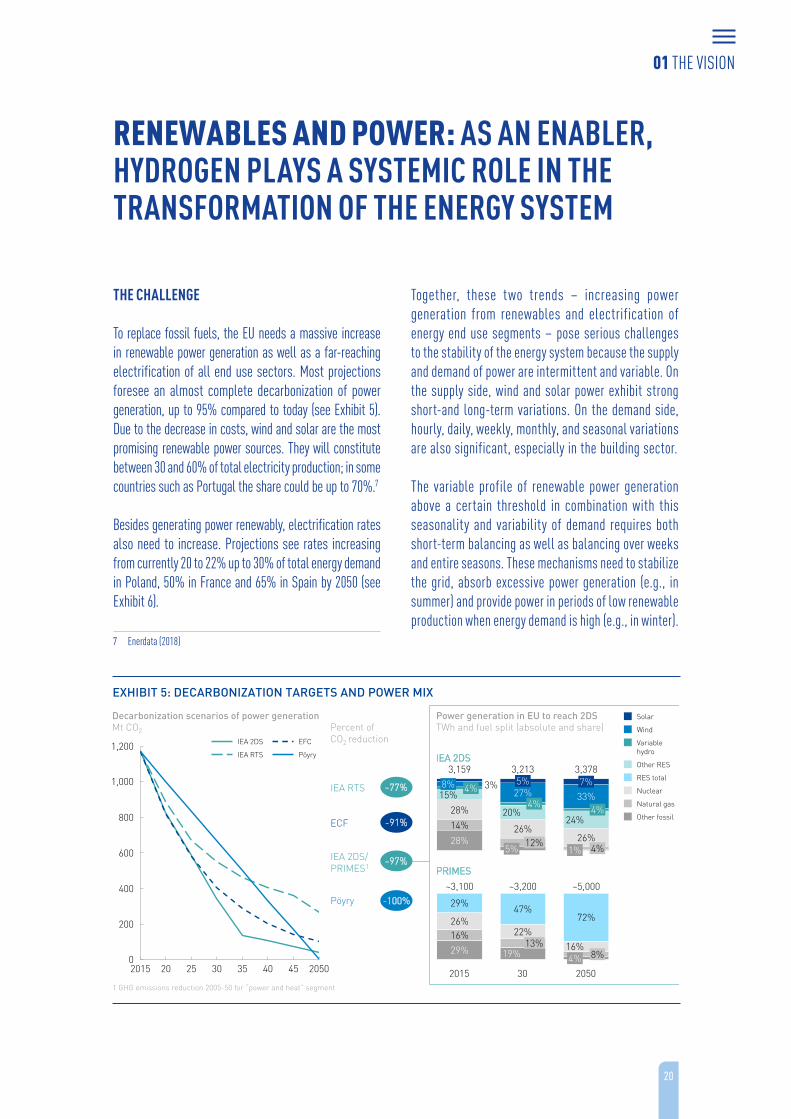
To replace fossil fuels, the EU needs a massive increase in renewable power generation as well as a far-reaching electrification of all end use sectors. Most projections foresee an almost complete decarbonization of power generation, up to 95% compared to today (see Exhibit 5). Due to the decrease in costs, wind and solar are the most promising renewable power sources. They will constitute between 30 and 60% of total electricity production; in some countries such as Portugal the share could be up to 70%.7
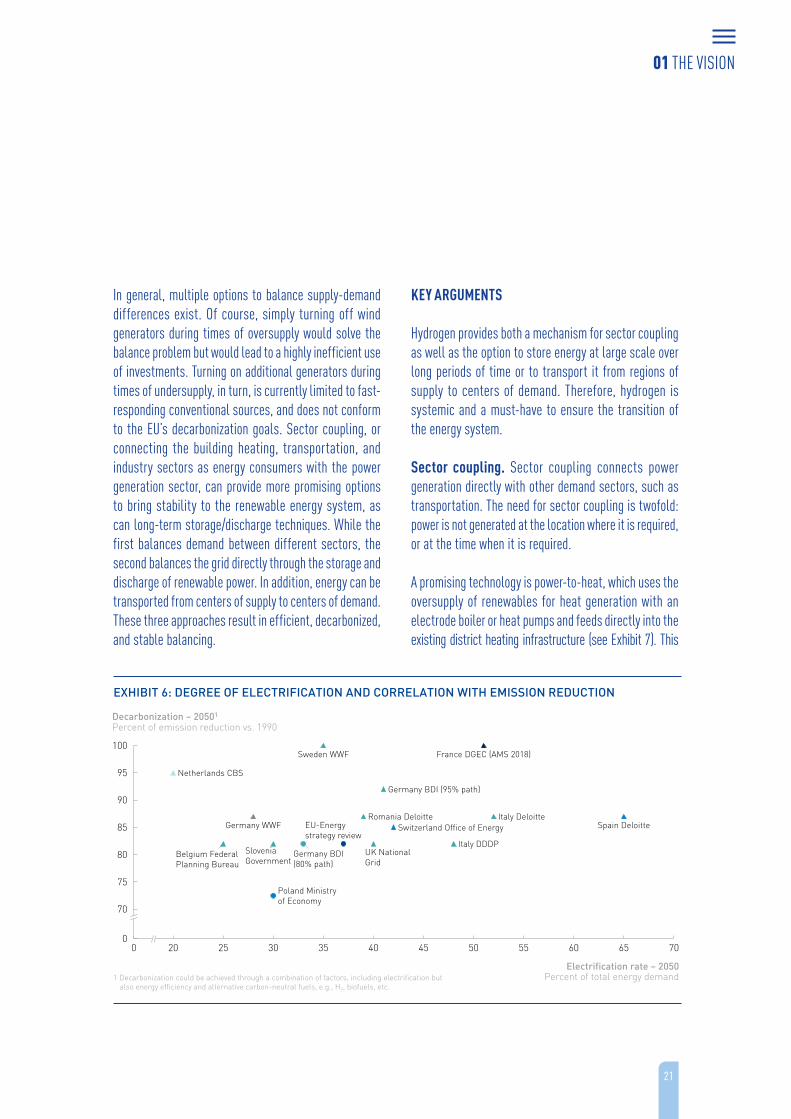
Besides generating power renewably, electrification rates also need to increase. Projections see rates increasing from currently 20 to 22% up to 30% of total energy demand in Poland, 50% in France and 65% in Spain by 2050 (see Exhibit 6).
7 Enerdata (2018)
Together, these two trends – increasing power generation from renewables and electrification of energy end use segments – pose serious challenges to the stability of the energy system because the supply and demand of power are intermittent and variable. On the supply side, wind and solar power exhibit strong short-and long-term variations. On the demand side, hourly, daily, weekly, monthly, and seasonal variations are also significant, especially in the building sector.
The variable profile of renewable power generation above a certain threshold in combination with this seasonality and variability of demand requires both short-term balancing as well as balancing over weeks and entire seasons. These mechanisms need to stabilize the grid, absorb excessive power generation (e.g., in summer) and provide power in periods of low renewable production when energy demand is high (e.g., in winter).
RENEWABLES AND POWER: AS AN ENABLER, HYDROGEN PLAYS A SYSTEMIC ROLE IN THE TRANSFORMATION OF THE ENERGY SYSTEM
20
400
2015 25 30 35 40
1,200
450
2050
200
600
800
1,000
1 GHG emissions reduction 2005-50 for “power and heat” segment
-100%Pöyry
-77%IEA RTS
-91%ECF
IEA 2DS/PRIMES1
-97%
Decarbonization scenarios of power generation Mt CO2
47%26%16%
29%
29%
2015
22%13%
19%
30
~3,200
72%
16%8%4%
2050
~3,100 ~5,000
Power generation in EU to reach 2DSTWh and fuel split (absolute and share)
IEA 2DS
PRIMES
IEA 2DS EFC
IEA RTS Pöyry
28%
14%
28%
26%26%
20%24%
15% 27% 33%3% 7%
3,213
4%1%
3,159 3,378
4%
5%12%
5%
4%
4%8%
Variablehydro
Solar
Wind
Other RES
RES total
Nuclear
Natural gas
Other fossil
Percent of CO2 reduction
EXHIBIT 5: DECARBONIZATION TARGETS AND POWER MIX
01 THE VISION
21
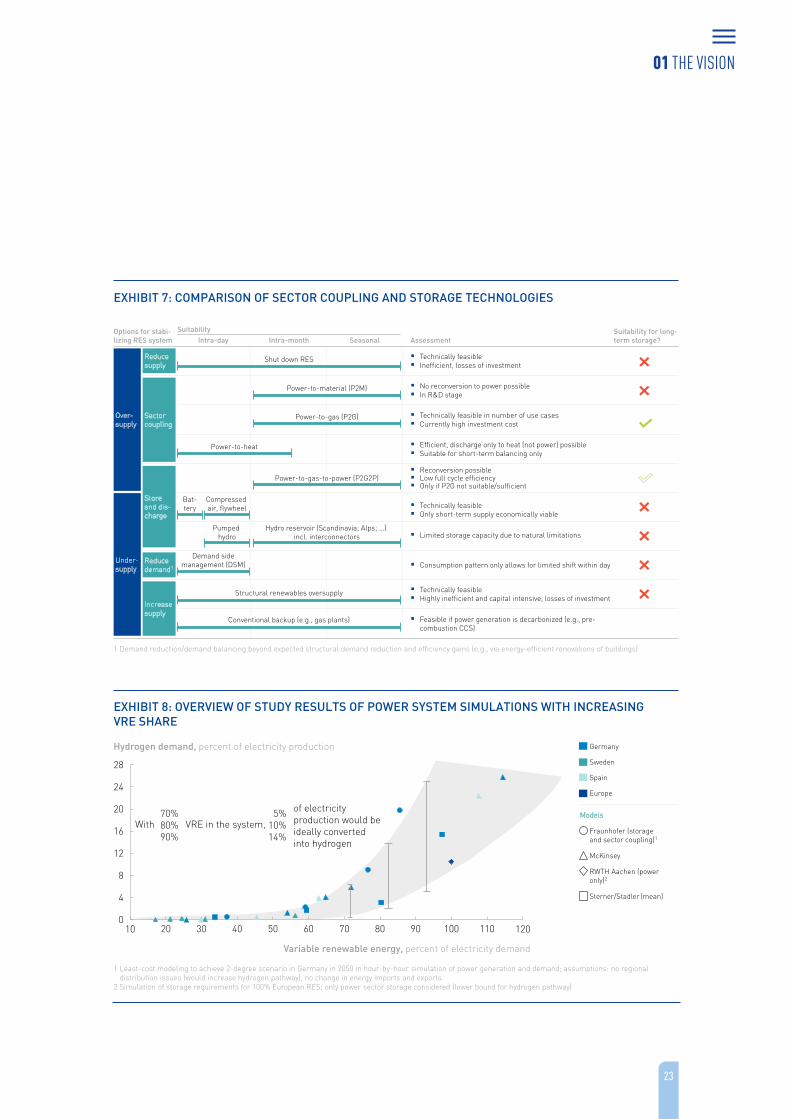
In general, multiple options to balance supply-demand differences exist. Of course, simply turning off wind generators during times of oversupply would solve the balance problem but would lead to a highly inefficient use of investments. Turning on additional generators during times of undersupply, in turn, is currently limited to fast-responding conventional sources, and does not conform to the EU’s decarbonization goals. Sector coupling, or connecting the building heating, transportation, and industry sectors as energy consumers with the power generation sector, can provide more promising options to bring stability to the renewable energy system, as can long-term storage/discharge techniques. While the first balances demand between different sectors, the second balances the grid directly through the storage and discharge of renewable power. In addition, energy can be transported from centers of supply to centers of demand. These three approaches result in efficient, decarbonized, and stable balancing.
KEY ARGUMENTS
Hydrogen provides both a mechanism for sector coupling as well as the option to store energy at large scale over long periods of time or to transport it from regions of supply to centers of demand. Therefore, hydrogen is systemic and a must-have to ensure the transition of the energy system.
Sector coupling. Sector coupling connects power generation directly with other demand sectors, such as transportation. The need for sector coupling is twofold: power is not generated at the location where it is required, or at the time when it is required.
A promising technology is power-to-heat, which uses the oversupply of renewables for heat generation with an electrode boiler or heat pumps and feeds directly into the existing district heating infrastructure (see Exhibit 7). This
0
95
6020 25 553530 40
70
50
80
650
70
75
85
90
100
45
Germany BDI(80% path)
Romania DeloitteSpain Deloitte
Poland Ministry of Economy
Germany WWF
Decarbonization – 20501
Percent of emission reduction vs. 1990
UK NationalGrid
Electrification rate – 2050Percent of total energy demand
Sweden WWF
EU-Energy strategy review
SloveniaGovernment
Belgium Federal Planning Bureau
Italy DDDP
Switzerland Office of EnergyItaly Deloitte
Netherlands CBS
Germany BDI (95% path)
France DGEC (AMS 2018)
1 Decarbonization could be achieved through a combination of factors, including electrification but also energy efficiency and alternative carbon-neutral fuels, e.g., H2, biofuels, etc.
EXHIBIT 6: DEGREE OF ELECTRIFICATION AND CORRELATION WITH EMISSION REDUCTION
01 THE VISION
22
technique is highly efficient and enables the simultaneous decarbonization of the building segment. However, the generated heat can only be used for heating buildings and does not provide much stabilization to the energy system because the oversupply of renewable power and heating demand usually do not coincide. Moreover, heat cannot easily be stored for long periods without degrading.
Power-to-gas provides more flexibility to couple sectors for stabilization purposes. Compared to other gas forms, converting power to hydrogen by means of electrolysis can be a cost-efficient option if abundant renewable power is available as projected for Europe’s energy system. The system can be stabilized year-round with one conversion step enabling very high distribution of renewables combined with minimized curtailment. Hydrogen offers the same flexibility as natural gas, but without any CO2 emissions, and it allows rapid scale-up, storage, and efficient power distribution to other segments by making use of existing infrastructure and technologies.
Storage and discharge. Directly balancing the grid requires the storage and discharge of power in addition to sector coupling. Batteries can provide a highly efficient method for storing energy for short periods of time. They are, however, expensive for the amount of energy stored and have low energy density. This implies that they are ill-suited for storing large amounts of energy and for storing energy over long periods of time.
Pumped hydro storage is an option for long-term energy storage. Its capacity in the EU is limited, however – while technical potential is estimated between 30 and 80 TWh8, there are additional natural, regulatory, and societal restrictions. Furthermore, these capacities are not readily available across Europe, but only in selected areas.
8 Gimeno-Gutiérrez and Lacal-Arántegui (2015)
Hydrogen can be stored for long periods of time and at large scale at competitive cost, compared to conventional large-scale energy storage, such as pumped hydro.9 While reconversion suffers from a lower efficiency of approximately 50 to 60%, it is less costly than to easily store alternative solutions. Moreover, in most instances, reconversion will not be required, as the stored hydrogen can be directly used as a fuel for transport, heating, and industry. In the long run, the benefits of a less balancing and a more stable grid can also reach end customers by reducing their energy costs.
Europe already has sizable storage capacities for hydrogen. Its gas grid has a capacity of 36 billion m³ and, assuming 10% blending, could thereby immediately store up to 100 TWh of hydrogen.10 In the future, salt caverns and depleted gas fields could also serve as storage. Assuming an available capacity of 80%, Europe’s 18 billion m³ of salt caverns11 offer storage for about 40 TWh of hydrogen. Technical feasibility for such storage has also already been proven: six projects storing hydrogen in salt cavern are in operation today – three in the Northeast of England and three in Texas.
Transportation of energy. Next to the seasonality of supply, the location of supply is also decisive. Particularly with renewables, power is often not generated close to centers of demand. Northern Africa or Southern Europe, e.g., have renewable capacities far outstripping the energy demand of those regions. While transporting power via transmission lines to areas of demand is possible, it is both costly and difficult to establish due to local and planning issues. As an alternative, electricity can be converted into hydrogen and transported in gaseous, liquid, or stored in other forms via pipelines or ships.
9 Schoenung (2011)
10 Eurogas (2015)
11 Gillhaus (2007)
01 THE VISION
23
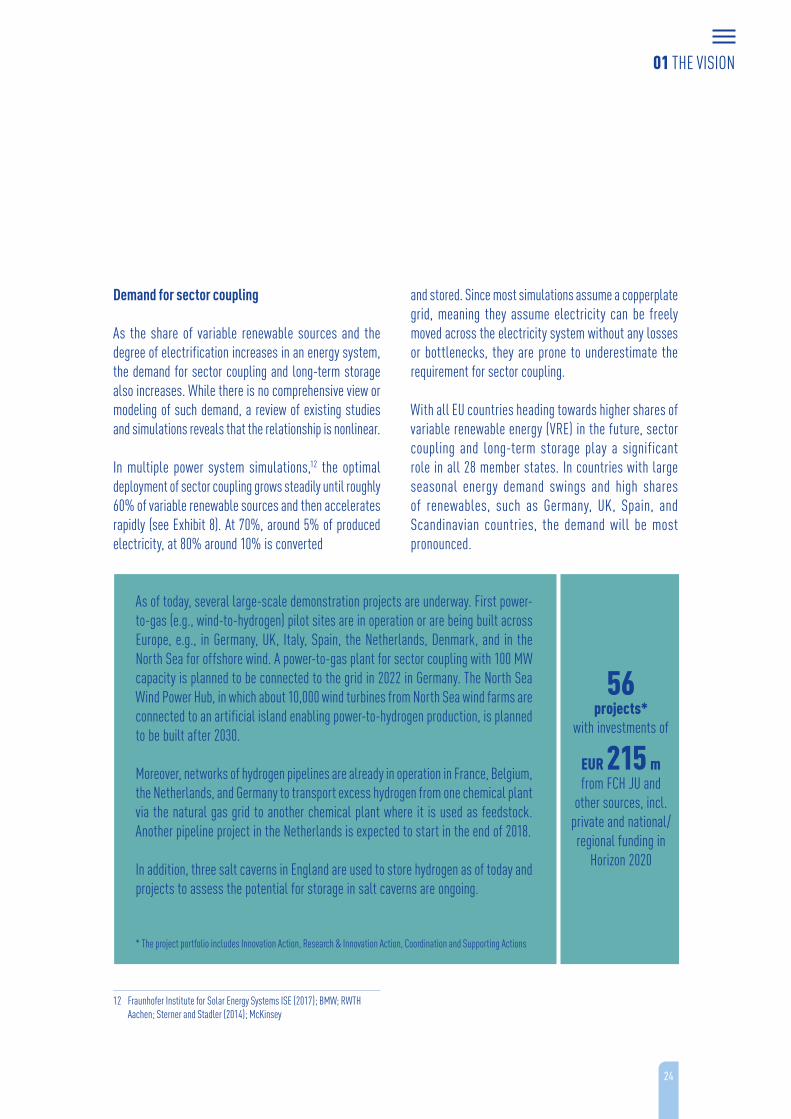
1 Least-cost modeling to achieve 2-degree scenario in Germany in 2050 in hour-by-hour simulation of power generation and demand; assumptions: no regional distribution issues (would increase hydrogen pathway), no change in energy imports and exports
2 Simulation of storage requirements for 100% European RES; only power sector storage considered (lower bound for hydrogen pathway)
10 80 1204030 11020 50 7060 90 1000
12
4
8
16
20
24
28
Variable renewable energy, percent of electricity demand
Hydrogen demand, percent of electricity production
Fraunhofer (storage and sector coupling)1
Sterner/Stadler (mean)
RWTH Aachen (power only)2
McKinsey
Germany
Models
Sweden
Spain
Europe
of electricity production would be ideally converted into hydrogen
With70%80%90%
VRE in the system,5%
10%14%
EXHIBIT 8: OVERVIEW OF STUDY RESULTS OF POWER SYSTEM SIMULATIONS WITH INCREASING VRE SHARE
EXHIBIT 7: COMPARISON OF SECTOR COUPLING AND STORAGE TECHNOLOGIES
1 Demand reduction/demand balancing beyond expected structural demand reduction and efficiency gains (e.g., via energy-efficient renovations of buildings)
Assessment
Technically feasible in number of use cases Currently high investment cost
Technically feasible Inefficient, losses of investment
Technically feasible Only short-term supply economically viable
Limited storage capacity due to natural limitations
Consumption pattern only allows for limited shift within day
Reconversion possible Low full cycle efficiency Only if P2G not suitable/sufficient
Technically feasible Highly inefficient and capital intensive, losses of investment
Feasible if power generation is decarbonized (e.g., pre-combustion CCS)
No reconversion to power possible In R&D stage
Efficient, discharge only to heat (not power) possible Suitable for short-term balancing only
Intra-month SeasonalIntra-day
Power-to-gas-to-power (P2G2P)
Shut down RES
Power-to-material (P2M)
Power-to-gas (P2G)
Power-to-heat
Hydro reservoir (Scandinavia; Alps; …) incl. interconnectors
Structural renewables oversupply
Conventional backup (e.g., gas plants)
Compressed air, flywheel
Pumped hydro
Demand sidemanagement (DSM)
Bat-tery
Suitability Suitability for long-term storage?
Options for stabi-lizing RES system
Under-supply
Over-supply
Sector coupling
Reduce demand1
Store and dis-charge
Increase supply
Reduce supply
01 THE VISION
24
Demand for sector coupling
As the share of variable renewable sources and the degree of electrification increases in an energy system, the demand for sector coupling and long-term storage also increases. While there is no comprehensive view or modeling of such demand, a review of existing studies and simulations reveals that the relationship is nonlinear.
In multiple power system simulations,12 the optimal deployment of sector coupling grows steadily until roughly 60% of variable renewable sources and then accelerates rapidly (see Exhibit 8). At 70%, around 5% of produced electricity, at 80% around 10% is converted
12 Fraunhofer Institute for Solar Energy Systems ISE (2017); BMW; RWTH Aachen; Sterner and Stadler (2014); McKinsey
and stored. Since most simulations assume a copperplate grid, meaning they assume electricity can be freely moved across the electricity system without any losses or bottlenecks, they are prone to underestimate the requirement for sector coupling.
With all EU countries heading towards higher shares of variable renewable energy (VRE) in the future, sector coupling and long-term storage play a significant role in all 28 member states. In countries with large seasonal energy demand swings and high shares of renewables, such as Germany, UK, Spain, and Scandinavian countries, the demand will be most pronounced.
As of today, several large-scale demonstration projects are underway. First power-to-gas (e.g., wind-to-hydrogen) pilot sites are in operation or are being built across Europe, e.g., in Germany, UK, Italy, Spain, the Netherlands, Denmark, and in the North Sea for offshore wind. A power-to-gas plant for sector coupling with 100 MW capacity is planned to be connected to the grid in 2022 in Germany. The North Sea Wind Power Hub, in which about 10,000 wind turbines from North Sea wind farms are connected to an artificial island enabling power-to-hydrogen production, is planned to be built after 2030.
Moreover, networks of hydrogen pipelines are already in operation in France, Belgium, the Netherlands, and Germany to transport excess hydrogen from one chemical plant via the natural gas grid to another chemical plant where it is used as feedstock. Another pipeline project in the Netherlands is expected to start in the end of 2018.
In addition, three salt caverns in England are used to store hydrogen as of today and projects to assess the potential for storage in salt caverns are ongoing.
* The project portfolio includes Innovation Action, Research & Innovation Action, Coordination and Supporting Actions
56 projects*
with investments of
EUR 215 m from FCH JU and
other sources, incl. private and national/regional funding in
Horizon 2020
01 THE VISION
25
TRANSPORTATION: HYDROGEN AND BATTERIES WILL WORK HAND IN HAND TO ELECTRIFY TRANSPORT
THE CHALLENGE
Transportation is a major contributor to climate change, emitting 32% of CO2 emissions in the EU.13 To achieve the 2-degree scenario, the region needs to eliminate about 72% of CO2 from the EU transportation fleet by 2050, equal to roughly 825 Mt. This order of magnitude requires a paradigm shift in scoping the issue. Transitioning the transportation system from oil to renewables not only requires new powertrains in vehicles but will fundamentally alter value chains.
A key technological question is how to store large amounts of energy at low weight and in a restricted space within the vehicle. While for some modes of transportation the battery will be the energy storage of choice, other applications require higher energy density for lightweight energy storage or longer driving ranges and faster recharging times.
The second key issue revolves around recharging/refu- eling infrastructure. Energy needs to be efficiently distributed from renewable sources to vehicles. While a small share of EVs can be served with the current power grid, meaningful decarbonization requires either a different way of distributing energy, or massive upgrades to power grids.
KEY ARGUMENTS
Hydrogen is the most promising decarbonization option for trucks, buses, ships, trains, large cars, and commercial vehicles for four reasons. First, hydrogen provides a pathway to full decarbonization, where other technologies can only act as bridge technologies. Second, hydrogen provides sufficient power for long
13 International Energy Agency (2017)
ranges and high payloads due to its superior energy density. Third, hydrogen infrastructure, while initially a barrier, has significant benefits at scale compared to fast charging: faster refueling, more flexible load, less space requirements and similar investment costs. Lastly, in addition to road transport, hydrogen is the best option for trains and ships, and hydrogen-based synthetic fuels (synfuels) can decarbonize aviation.
A PATHWAY TO FULL DECARBONIZATION
Fuel cell electric vehicles do not generate local emissions such as NOX and do not emit any CO2 from the vehicles. On such a tank-to-wheel basis, only FCEVs and battery- electric vehicles (BEVs) are fully CO2 emission free, unlike other decarbonization options such as biofuels, compressed or liquified natural gas (CNG/LNG), and hybrids. These technologies can therefore only serve as bridge technologies until BEVs and FCEVs are ready in large numbers, which is not an attractive value proposition for investors.
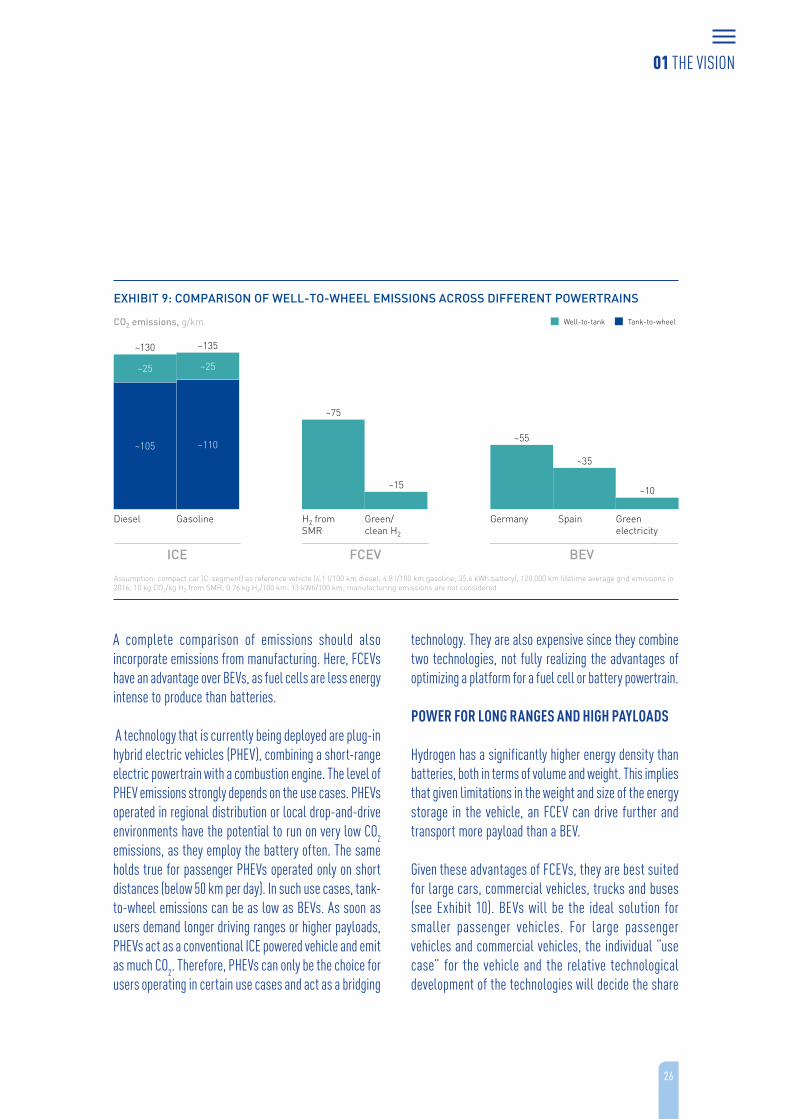
For a fair comparison with diesel and gasoline vehicles, not only tank-to-wheel, but also well-to-tank emissions should be considered – i.e., the emissions from fuel production. Well-to-tank emissions for diesel and gasoline include the emissions from oil extraction, transport, refining and processing, and distribution to the fuel station. For BEVs, well-to-tank emissions depend on the power mix and hence on the country where the vehicle is charged. For FCEVs, well-to-tank emissions depend on the hydrogen production technology (see Exhibit 9). When hydrogen is produced from natural gas with CCS, FCEVs emit 40 to 45% less emissions than vehicles with internal combustion engines (ICEs). As production from hydrogen shifts to full decarbonization, FCEVs will fall in emissions until they are virtually CO2 free.
01 THE VISION
26
A complete comparison of emissions should also incorporate emissions from manufacturing. Here, FCEVs have an advantage over BEVs, as fuel cells are less energy intense to produce than batteries.
A technology that is currently being deployed are plug-in hybrid electric vehicles (PHEV), combining a short-range electric powertrain with a combustion engine. The level of PHEV emissions strongly depends on the use cases. PHEVs operated in regional distribution or local drop-and-drive environments have the potential to run on very low CO2 emissions, as they employ the battery often. The same holds true for passenger PHEVs operated only on short distances (below 50 km per day). In such use cases, tank-to-wheel emissions can be as low as BEVs. As soon as users demand longer driving ranges or higher payloads, PHEVs act as a conventional ICE powered vehicle and emit as much CO2. Therefore, PHEVs can only be the choice for users operating in certain use cases and act as a bridging
technology. They are also expensive since they combine two technologies, not fully realizing the advantages of optimizing a platform for a fuel cell or battery powertrain.
POWER FOR LONG RANGES AND HIGH PAYLOADS
Hydrogen has a significantly higher energy density than batteries, both in terms of volume and weight. This implies that given limitations in the weight and size of the energy storage in the vehicle, an FCEV can drive further and transport more payload than a BEV.
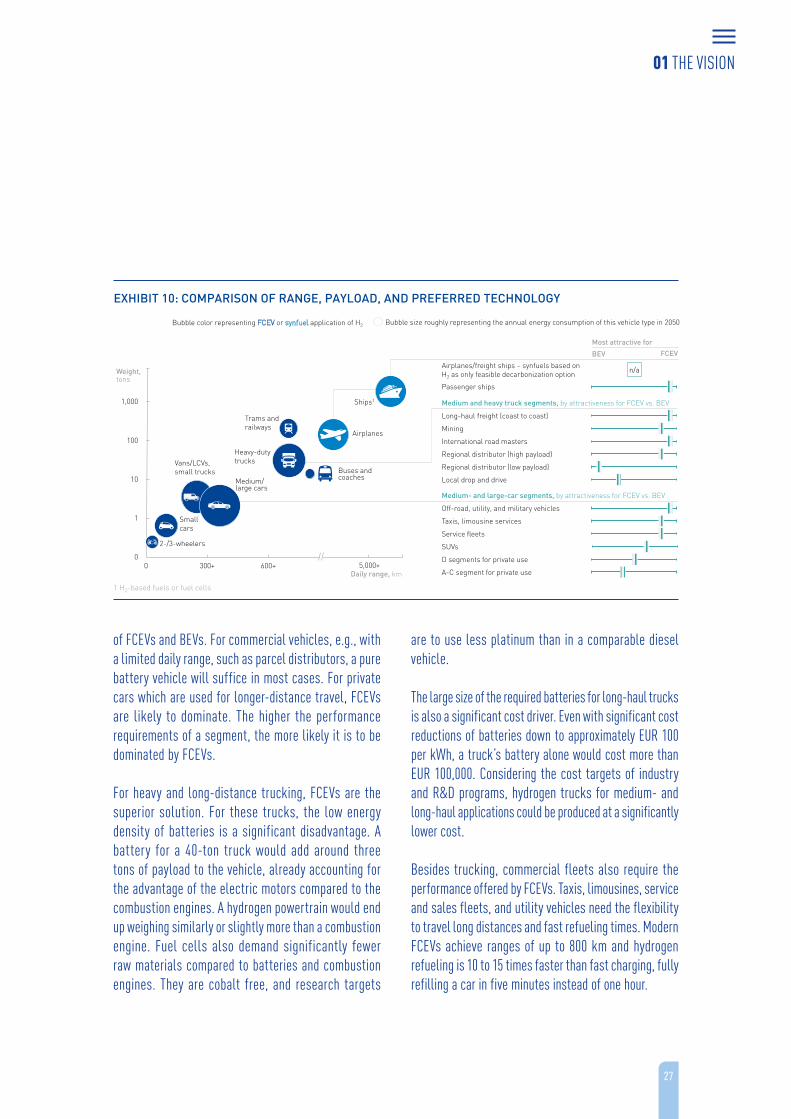
Given these advantages of FCEVs, they are best suited for large cars, commercial vehicles, trucks and buses (see Exhibit 10). BEVs will be the ideal solution for smaller passenger vehicles. For large passenger vehicles and commercial vehicles, the individual “use case” for the vehicle and the relative technological development of the technologies will decide the share
Assumption: compact car (C-segment) as reference vehicle (4.1 l/100 km diesel; 4.8 l/100 km gasoline; 35.6 kWh battery), 120,000 km lifetime average grid emissions in 2016; 10 kg CO2/kg H2 from SMR; 0.76 kg H2/100 km; 13 kWh/100 km; manufacturing emissions are not considered
FCEVICE BEV
EXHIBIT 9: COMPARISON OF WELL-TO-WHEEL EMISSIONS ACROSS DIFFERENT POWERTRAINS
CO2 emissions, g/km
~110~105
~10
~25
Diesel Gasoline
~25
H2 fromSMR
Green/ clean H2
Germany Spain Green electricity
~130 ~135
~75
~15
~55
~35
Well-to-tank Tank-to-wheel
01 THE VISION
27
of FCEVs and BEVs. For commercial vehicles, e.g., with a limited daily range, such as parcel distributors, a pure battery vehicle will suffice in most cases. For private cars which are used for longer-distance travel, FCEVs are likely to dominate. The higher the performance requirements of a segment, the more likely it is to be dominated by FCEVs.
For heavy and long-distance trucking, FCEVs are the superior solution. For these trucks, the low energy density of batteries is a significant disadvantage. A battery for a 40-ton truck would add around three tons of payload to the vehicle, already accounting for the advantage of the electric motors compared to the combustion engines. A hydrogen powertrain would end up weighing similarly or slightly more than a combustion engine. Fuel cells also demand significantly fewer raw materials compared to batteries and combustion engines. They are cobalt free, and research targets
are to use less platinum than in a comparable diesel vehicle.
The large size of the required batteries for long-haul trucks is also a significant cost driver. Even with significant cost reductions of batteries down to approximately EUR 100 per kWh, a truck’s battery alone would cost more than EUR 100,000. Considering the cost targets of industry and R&D programs, hydrogen trucks for medium- and long-haul applications could be produced at a significantly lower cost.
Besides trucking, commercial fleets also require the performance offered by FCEVs. Taxis, limousines, service and sales fleets, and utility vehicles need the flexibility to travel long distances and fast refueling times. Modern FCEVs achieve ranges of up to 800 km and hydrogen refueling is 10 to 15 times faster than fast charging, fully refilling a car in five minutes instead of one hour.
01 THE VISION
Medium- and large-car segments, by attractiveness for FCEV vs. BEV
Medium and heavy truck segments, by attractiveness for FCEV vs. BEV
FCEV
Long-haul freight (coast to coast)
International road masters
Regional distributor (low payload)
Off-road, utility, and military vehicles
Taxis, limousine services
Service fleets
SUVs
D segments for private use
A-C segment for private use
Most attractive for
BEV
Mining
Regional distributor (high payload)
Local drop and drive
1 H2-based fuels or fuel cells
Bubble size roughly representing the annual energy consumption of this vehicle type in 2050Bubble color representing FCEV or synfuel application of H2
10
300+0
100
600+
1,000
1
0
Daily range, km
Airplanes
Heavy-duty trucks
Trams and railways
Vans/LCVs,small trucks
Weight, tons
5,000+
Small cars
2-/3-wheelers
Medium/large cars
Buses and coaches
Ships1
EXHIBIT 10: COMPARISON OF RANGE, PAYLOAD, AND PREFERRED TECHNOLOGY
Airplanes/freight ships – synfuels based on H2 as only feasible decarbonization option n/a
Passenger ships
28
For passenger cars, FCEVs offer similar ranges and refueling times as ICE vehicles. With a hydrogen refueling station (HRS) infrastructure in place, consumers would not need to adjust their behavior. Surveys today indicate that only a quarter of customers consider charging times longer than 30 minutes acceptable. This means that even if fast-charging time could be halved, 75% of customers would not be satisfied.
Consumer preferences are vital to take into consider-ation. For the decarbonization of transport to succeed, consumers must be willing to purchase and drive the offered vehicles. Only if the range of models meet the requirements of consumers will their adoption increase, triggering a further scale-up and acceleration of investment into new models.
Looking forward, sharing of vehicles, platooning, and autonomous driving will further increase the attractiveness of hydrogen. While today, in some use cases recharging can be managed to fall during periods of low use, it will become a barrier once vehicles are used almost uninterruptedly. Autonomous technology will also require more power for video, image processing, and communication, increasing the demand of energy from the batteries or fuel cells.
HYDROGEN INFRASTRUCTURE AT SCALE HAS SIGNIFICANT BENEFITS
Hydrogen infrastructure has mainly three advantages compared to fast-charging infrastructure in a large-scale transport decarbonization scenario: firstly, hydrogen infrastructure can play a systemic role in the future energy ecosystem. It can balance the grid by producing hydrogen from surplus electricity and it provides a technical solution for seasonal storage of variable
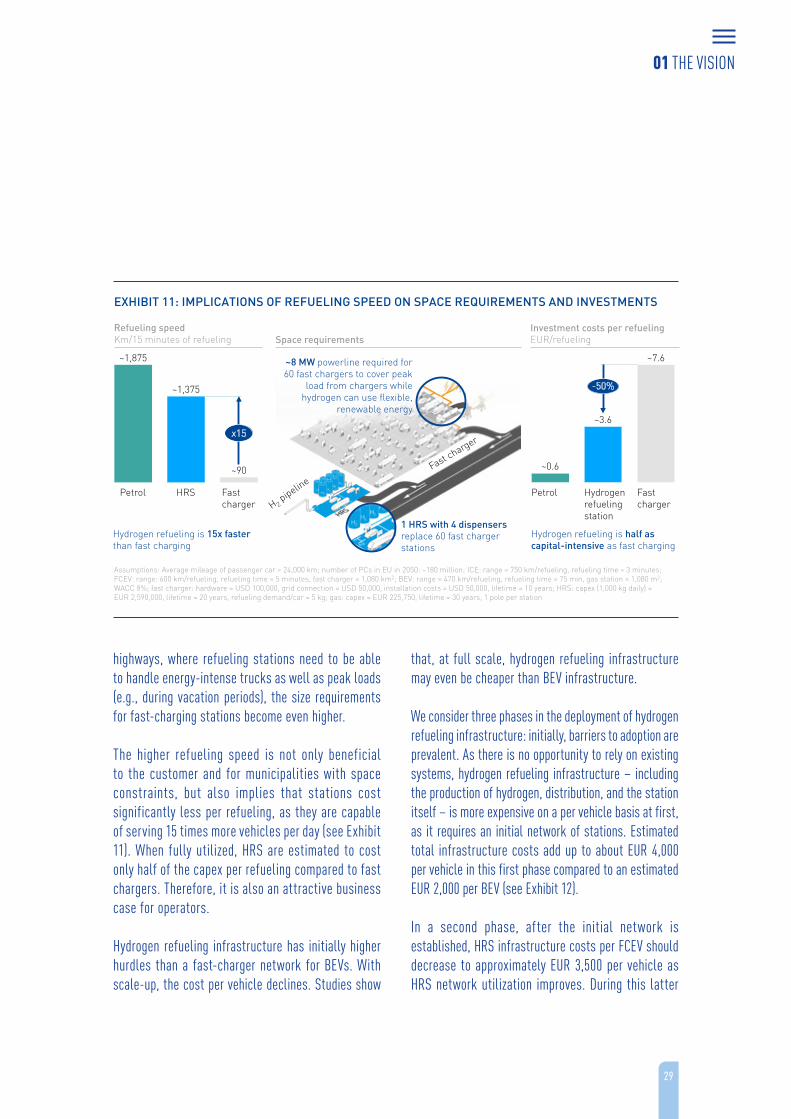
renewable energy. Secondly, hydrogen refueling takes one tenth to one fifteenth of the time fast charging requires. That means the HRS infrastructure requires about 10 to 15 times less space to fuel the same number of vehicles. Thirdly, one HRS can serve 10 to 15 times more vehicles as one fast charger, which makes the expansion of the hydrogen infrastructure become less costly with an increasing FCEV fleet compared to a fast-charging infrastructure.
The crucial advantage of HRS is that they act as balancer to the grid in a geographically spread manner, while fast chargers do just the opposite – they add peak demand. In peak times, e.g., when people drive to work, return from work or go on vacation, fast charging will push up grid load. This requires both costly upgrades to the distribution infrastructure as well as additional peak generation capacity. HRS instead have a built-in energy storage, can produce hydrogen opportunistically from the electricity grid, receive hydrogen through pipelines, or in compressed or liquid form from trucks. Beyond the short-time balancing, seasonal balancing is also feasible with hydrogen infrastructure as large energy storage capacities are less capital intense compared to batteries.
The differences in required space for HRS, associated to the higher refueling speed, are particularly important in European cities and along highways. Fast-charging stations handling the same number of vehicles need 10 to 15 times the space of a comparable HRS. This would require a significant expansion of charging places, which in turn requires significant upgrades of the power grid in cities to be able to handle peak loads. While slow charging will reduce the load somewhat, a large share of consumers in cities does not have access to fixed parking spots. This implies the need for many recharging poles and further grid upgrades. Along
01 THE VISION
29
highways, where refueling stations need to be able to handle energy-intense trucks as well as peak loads (e.g., during vacation periods), the size requirements for fast-charging stations become even higher.
The higher refueling speed is not only beneficial to the customer and for municipalities with space constraints, but also implies that stations cost significantly less per refueling, as they are capable of serving 15 times more vehicles per day (see Exhibit 11). When fully utilized, HRS are estimated to cost only half of the capex per refueling compared to fast chargers. Therefore, it is also an attractive business case for operators.
Hydrogen refueling infrastructure has initially higher hurdles than a fast-charger network for BEVs. With scale-up, the cost per vehicle declines. Studies show
that, at full scale, hydrogen refueling infrastructure may even be cheaper than BEV infrastructure.
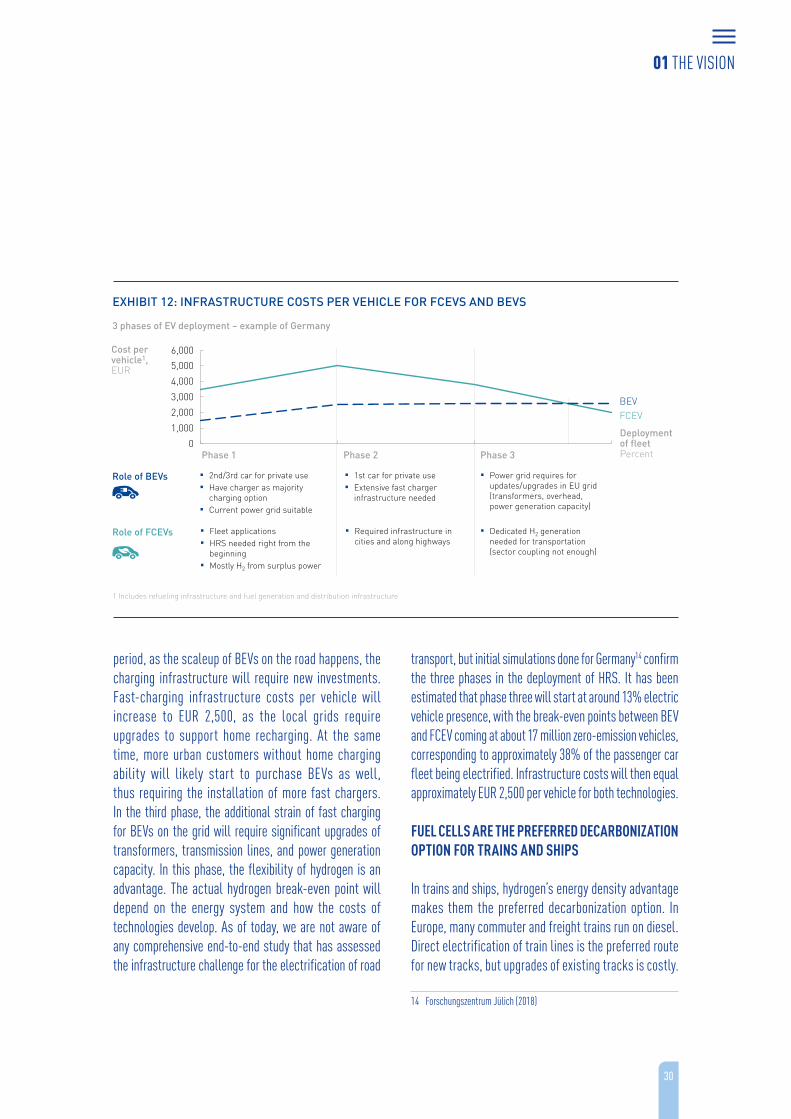
We consider three phases in the deployment of hydrogen refueling infrastructure: initially, barriers to adoption are prevalent. As there is no opportunity to rely on existing systems, hydrogen refueling infrastructure – including the production of hydrogen, distribution, and the station itself – is more expensive on a per vehicle basis at first, as it requires an initial network of stations. Estimated total infrastructure costs add up to about EUR 4,000 per vehicle in this first phase compared to an estimated EUR 2,000 per BEV (see Exhibit 12).
In a second phase, after the initial network is established, HRS infrastructure costs per FCEV should decrease to approximately EUR 3,500 per vehicle as HRS network utilization improves. During this latter
~1,375
Petrol HRS Fastcharger
~1,875
~90
x15
~0.6
Petrol Hydrogen refuelingstation
Fast charger
~3.6
~7.6
-50%
Assumptions: Average mileage of passenger car = 24,000 km; number of PCs in EU in 2050: ~180 million; ICE: range = 750 km/refueling, refueling time = 3 minutes; FCEV: range: 600 km/refueling, refueling time = 5 minutes, fast charger = 1,080 km2; BEV: range = 470 km/refueling, refueling time = 75 min, gas station = 1,080 m2; WACC 8%; fast charger: hardware = USD 100,000, grid connection = USD 50,000, installation costs = USD 50,000, lifetime = 10 years; HRS: capex (1,000 kg daily) = EUR 2,590,000, lifetime = 20 years, refueling demand/car = 5 kg; gas: capex = EUR 225,750, lifetime = 30 years, 1 pole per station
Hydrogen refueling is half as capital-intensive as fast charging
Hydrogen refueling is 15x faster than fast charging
Refueling speedKm/15 minutes of refueling
Investment costs per refuelingEUR/refuelingSpace requirements
EXHIBIT 11: IMPLICATIONS OF REFUELING SPEED ON SPACE REQUIREMENTS AND INVESTMENTS
~8 MW powerline required for 60 fast chargers to cover peak
load from chargers while hydrogen can use flexible,
renewable energy
1 HRS with 4 dispensersreplace 60 fast chargerstations
01 THE VISION
30
period, as the scaleup of BEVs on the road happens, the charging infrastructure will require new investments. Fast-charging infrastructure costs per vehicle will increase to EUR 2,500, as the local grids require upgrades to support home recharging. At the same time, more urban customers without home charging ability will likely start to purchase BEVs as well, thus requiring the installation of more fast chargers. In the third phase, the additional strain of fast charging for BEVs on the grid will require significant upgrades of transformers, transmission lines, and power generation capacity. In this phase, the flexibility of hydrogen is an advantage. The actual hydrogen break-even point will depend on the energy system and how the costs of technologies develop. As of today, we are not aware of any comprehensive end-to-end study that has assessed the infrastructure challenge for the electrification of road
transport, but initial simulations done for Germany14 confirm the three phases in the deployment of HRS. It has been estimated that phase three will start at around 13% electric vehicle presence, with the break-even points between BEV and FCEV coming at about 17 million zero-emission vehicles, corresponding to approximately 38% of the passenger car fleet being electrified. Infrastructure costs will then equal approximately EUR 2,500 per vehicle for both technologies.
FUEL CELLS ARE THE PREFERRED DECARBONIZATION OPTION FOR TRAINS AND SHIPS
In trains and ships, hydrogen’s energy density advantage makes them the preferred decarbonization option. In Europe, many commuter and freight trains run on diesel. Direct electrification of train lines is the preferred route for new tracks, but upgrades of existing tracks is costly.
14 Forschungszentrum Jülich (2018)
Role of BEVs
4,000
2,000
0
3,000
1,000
5,000
6,000
Deployment of fleetPercent
FCEV
Cost per vehicle1,EUR
BEV
Phase 1 Phase 3
3 phases of EV deployment – example of Germany
Phase 2
▪ Power grid requires for updates/upgrades in EU grid (transformers, overhead, power generation capacity)
▪ 2nd/3rd car for private use▪ Have charger as majority
charging option▪ Current power grid suitable
▪ 1st car for private use▪ Extensive fast charger
infrastructure needed
Role of FCEVs ▪ Dedicated H2 generation needed for transportation (sector coupling not enough)
▪ Fleet applications▪ HRS needed right from the
beginning▪ Mostly H2 from surplus power
▪ Required infrastructure in cities and along highways
EXHIBIT 12: INFRASTRUCTURE COSTS PER VEHICLE FOR FCEVS AND BEVS
1 Includes refueling infrastructure and fuel generation and distribution infrastructure
01 THE VISION
31
To accommodate catenary, tunnels need to be widened and bridges adjusted. Given the required performance, batteries are not an option for electrification.
Hydrogen trains have no CO2 emissions, reduce noise, and eliminate local emissions such as particulates. Since trains refuel large amounts of hydrogen at a limited number of different locations within a predefined railway network, the required infrastructure can be developed quickly and cost-efficiently. Pilots are already operating in Germany and further projects have been announced in Austria and France.
For water transport, fuel cells are most relevant for larger passenger ships such as river cruise ships and ferries, and possibly also for ocean cruise ships requiring longer autonomy. Passengers will value lower local emissions, less noise, and less water pollution. Political pressure on river, lake, and port authorities to ban ships with high local emissions of CO2 and other air pollutants, such as soot and NOX, is expected to increase once viable low- or zero-emission alternatives to power the marine sector become available. Besides propulsion, fuel cells can provide auxiliary power on ships, replacing diesel-based units. Prototypes for fuel-cell-powered passenger ships are already in operation, including the MS Innogy in Germany or the Energy Observer under the French flag. In Norway, Viking Cruises is planning to build the world’s first cruise ships powered by liquid hydrogen and fuel cells.
HYDROGEN-BASED SYNFUELS CAN BE DROPPED INTO THE CURRENT FUEL POOL AND ARE THE BEST LONG-TERM DECARBONIZATION OPTION FOR AVIATION
In addition to being converted into energy in a fuel cell, hydrogen can also be converted into synthetic fuel by adding
CO2 from the atmosphere or CO2 that would otherwise be put into the atmosphere. While not reducing local emissions, these fuels reduce CO2 output significantly.
Synfuels have two main advantages: they achieve the energy density of current fuels and they can be used as a “drop in” to the current fuel pool. Given their requirements regarding volumetric and gravimetric energy density, synthetic fuels derived from hydrogen represent the only viable direct decarbonization solution for aviation.
Synfuels are chemically very similar to existing fuels, which means current infrastructure, and in some segments, current engines, can be directly used with synthetic fuels. This significantly reduces the barrier to adoption. The biggest challenge for synfuels is their lower conversion efficiency, which means synthetic fuels would require higher amounts of hydrogen production for the same amount of final energy and thus must be developed only in areas without any direct hydrogen use.
Biofuels and CNG/LNG are complementary decarbonization options but have drawbacks and limited availability. Biofuels are a decarbonization option that stakeholders should pursue in parallel, although their limited availability and inability to solve local air quality issues are strikes against them. CNG/LNG can serve as bridging technologies since they do not offer a route to full decarbonization. Hence, it is doubtful whether an investment into CNG/LNG infrastructure, powertrains, and the associated development of vehicle models makes sense, given the limited payback period. Since this development is not synergetic with hydrogen or battery development, these investments would also not serve as a building block towards a fully decarbonized transport sector.
01 THE VISION
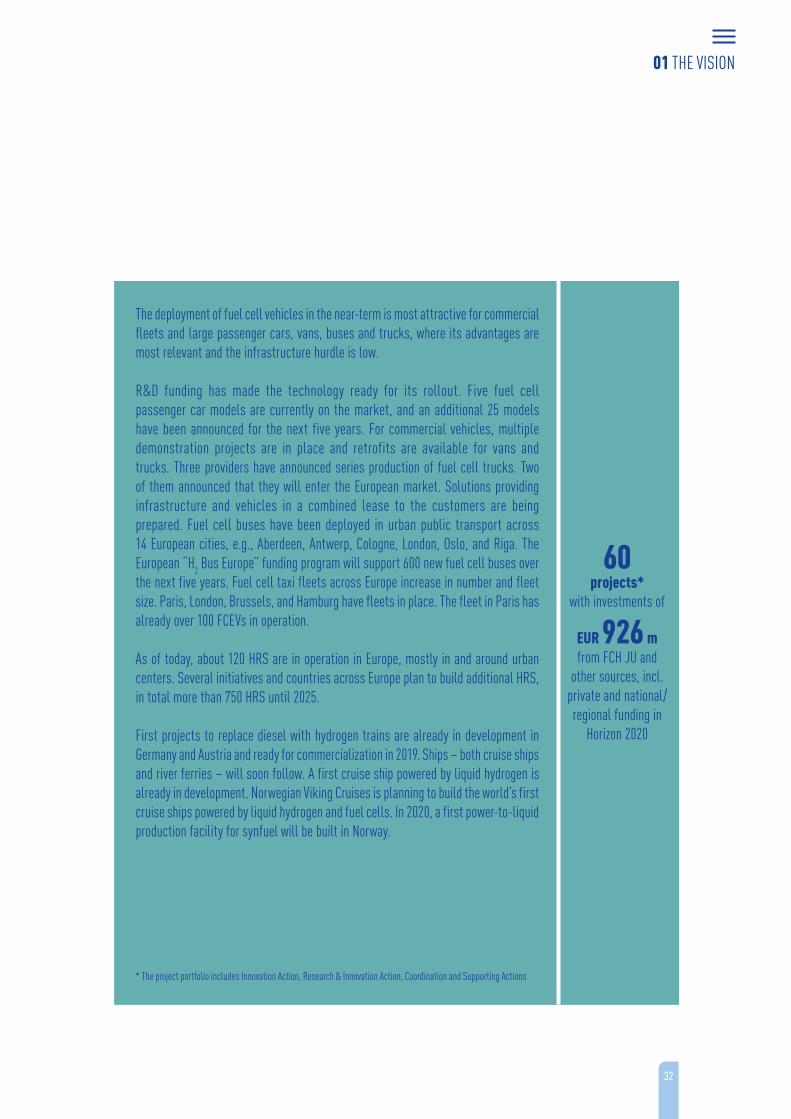
32
The deployment of fuel cell vehicles in the near-term is most attractive for commercial fleets and large passenger cars, vans, buses and trucks, where its advantages are most relevant and the infrastructure hurdle is low.
R&D funding has made the technology ready for its rollout. Five fuel cell passenger car models are currently on the market, and an additional 25 models have been announced for the next five years. For commercial vehicles, multiple demonstration projects are in place and retrofits are available for vans and trucks. Three providers have announced series production of fuel cell trucks. Two of them announced that they will enter the European market. Solutions providing infrastructure and vehicles in a combined lease to the customers are being prepared. Fuel cell buses have been deployed in urban public transport across 14 European cities, e.g., Aberdeen, Antwerp, Cologne, London, Oslo, and Riga. The European “H2 Bus Europe” funding program will support 600 new fuel cell buses over the next five years. Fuel cell taxi fleets across Europe increase in number and fleet size. Paris, London, Brussels, and Hamburg have fleets in place. The fleet in Paris has already over 100 FCEVs in operation.
As of today, about 120 HRS are in operation in Europe, mostly in and around urban centers. Several initiatives and countries across Europe plan to build additional HRS, in total more than 750 HRS until 2025.
First projects to replace diesel with hydrogen trains are already in development in Germany and Austria and ready for commercialization in 2019. Ships – both cruise ships and river ferries – will soon follow. A first cruise ship powered by liquid hydrogen is already in development. Norwegian Viking Cruises is planning to build the world’s first cruise ships powered by liquid hydrogen and fuel cells. In 2020, a first power-to-liquid production facility for synfuel will be built in Norway.
* The project portfolio includes Innovation Action, Research & Innovation Action, Coordination and Supporting Actions
60 projects*
with investments of
EUR 926 m from FCH JU and
other sources, incl. private and national/regional funding in
Horizon 2020
01 THE VISION
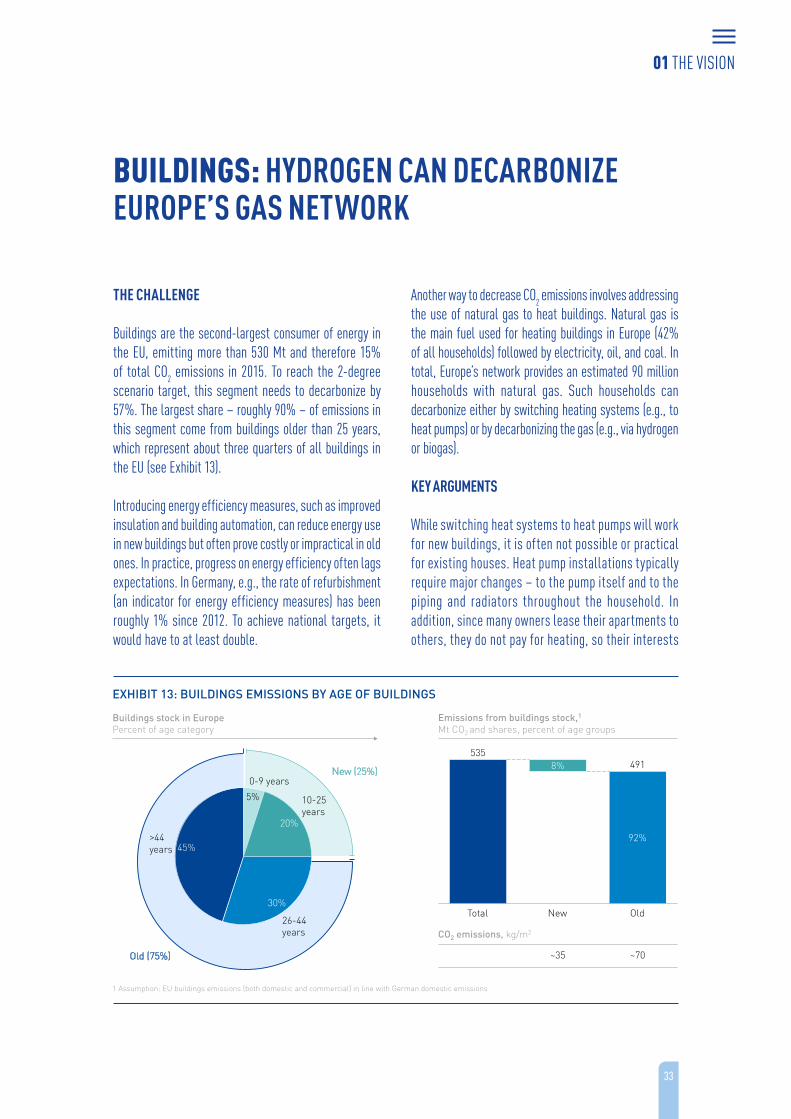
33
BUILDINGS: HYDROGEN CAN DECARBONIZE EUROPE’S GAS NETWORK
THE CHALLENGE
Buildings are the second-largest consumer of energy in the EU, emitting more than 530 Mt and therefore 15% of total CO2 emissions in 2015. To reach the 2-degree scenario target, this segment needs to decarbonize by 57%. The largest share – roughly 90% – of emissions in this segment come from buildings older than 25 years, which represent about three quarters of all buildings in the EU (see Exhibit 13).
Introducing energy efficiency measures, such as improved insulation and building automation, can reduce energy use in new buildings but often prove costly or impractical in old ones. In practice, progress on energy efficiency often lags expectations. In Germany, e.g., the rate of refurbishment (an indicator for energy efficiency measures) has been roughly 1% since 2012. To achieve national targets, it would have to at least double.
Another way to decrease CO2 emissions involves addressing the use of natural gas to heat buildings. Natural gas is the main fuel used for heating buildings in Europe (42% of all households) followed by electricity, oil, and coal. In total, Europe’s network provides an estimated 90 million households with natural gas. Such households can decarbonize either by switching heating systems (e.g., to heat pumps) or by decarbonizing the gas (e.g., via hydrogen or biogas).
KEY ARGUMENTS
While switching heat systems to heat pumps will work for new buildings, it is often not possible or practical for existing houses. Heat pump installations typically require major changes – to the pump itself and to the piping and radiators throughout the household. In addition, since many owners lease their apartments to others, they do not pay for heating, so their interests
EXHIBIT 13: BUILDINGS EMISSIONS BY AGE OF BUILDINGS
5%
20%
30%
45%
0-9 years
26-44years
10-25years
>44years
Total Old
8%
New
535
92%
491
CO2 emissions, kg/m2
1 Assumption: EU buildings emissions (both domestic and commercial) in line with German domestic emissions
Buildings stock in EuropePercent of age category
New (25%)
Old (75%)
Emissions from buildings stock,1
Mt CO2 and shares, percent of age groups
~35 ~70
01 THE VISION
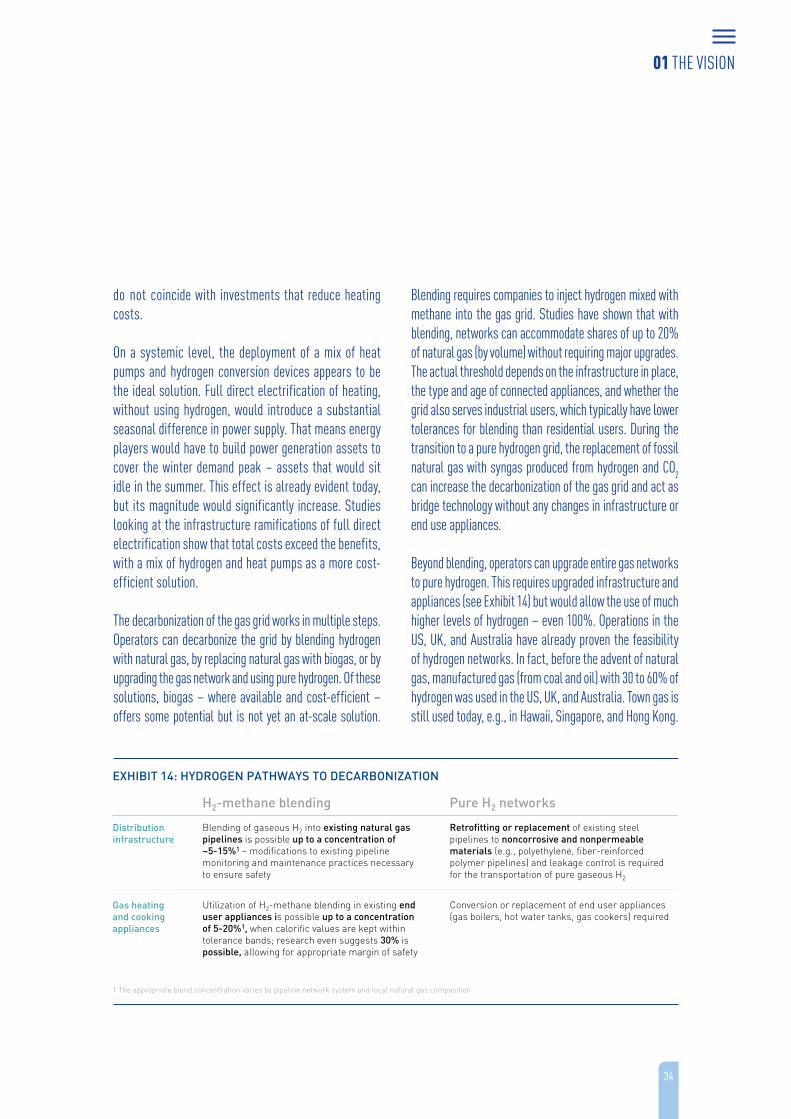
34
do not coincide with investments that reduce heating costs.
On a systemic level, the deployment of a mix of heat pumps and hydrogen conversion devices appears to be the ideal solution. Full direct electrification of heating, without using hydrogen, would introduce a substantial seasonal difference in power supply. That means energy players would have to build power generation assets to cover the winter demand peak – assets that would sit idle in the summer. This effect is already evident today, but its magnitude would significantly increase. Studies looking at the infrastructure ramifications of full direct electrification show that total costs exceed the benefits, with a mix of hydrogen and heat pumps as a more cost-efficient solution.
The decarbonization of the gas grid works in multiple steps. Operators can decarbonize the grid by blending hydrogen with natural gas, by replacing natural gas with biogas, or by upgrading the gas network and using pure hydrogen. Of these solutions, biogas – where available and cost-efficient – offers some potential but is not yet an at-scale solution.
Blending requires companies to inject hydrogen mixed with methane into the gas grid. Studies have shown that with blending, networks can accommodate shares of up to 20% of natural gas (by volume) without requiring major upgrades. The actual threshold depends on the infrastructure in place, the type and age of connected appliances, and whether the grid also serves industrial users, which typically have lower tolerances for blending than residential users. During the transition to a pure hydrogen grid, the replacement of fossil natural gas with syngas produced from hydrogen and CO2 can increase the decarbonization of the gas grid and act as bridge technology without any changes in infrastructure or end use appliances.
Beyond blending, operators can upgrade entire gas networks to pure hydrogen. This requires upgraded infrastructure and appliances (see Exhibit 14) but would allow the use of much higher levels of hydrogen – even 100%. Operations in the US, UK, and Australia have already proven the feasibility of hydrogen networks. In fact, before the advent of natural gas, manufactured gas (from coal and oil) with 30 to 60% of hydrogen was used in the US, UK, and Australia. Town gas is still used today, e.g., in Hawaii, Singapore, and Hong Kong.
H2-methane blending Pure H2 networks
Distribution infrastructure
Blending of gaseous H2 into existing natural gas pipelines is possible up to a concentration of~5-15%1 – modifications to existing pipeline monitoring and maintenance practices necessary to ensure safety
Retrofitting or replacement of existing steel pipelines to noncorrosive and nonpermeablematerials (e.g., polyethylene, fiber-reinforced polymer pipelines) and leakage control is required for the transportation of pure gaseous H2
Gas heating and cooking appliances
Utilization of H2-methane blending in existing end user appliances is possible up to a concentration of 5-20%1, when calorific values are kept within tolerance bands; research even suggests 30% is possible, allowing for appropriate margin of safety
Conversion or replacement of end user appliances (gas boilers, hot water tanks, gas cookers) required
1 The appropriate blend concentration varies by pipeline network system and local natural gas composition
EXHIBIT 14: HYDROGEN PATHWAYS TO DECARBONIZATION
01 THE VISION
35
In addition, significant upgrades to gas networks are feasible. The Netherlands, e.g., has transitioned its gas network from low-calorific gas (from Groningen) to high-calorific gas (from Russia, Norway, and LNG). This switch essentially requires upgrades to infrastructure very similar to those required for a hydrogen network. In this case, the Netherlands levied the costs for the upgrade onto the energy price – a similar approach could help finance the current transition.
Hydrogen offers three major advantages over other decarbonization solutions:
First, it is compatible with existing building stock. When blended into the gas grid, households do not need to upgrade appliances. However, the conversion to pure hydrogen grids requires upgrades, but those costs are significantly lower than switching to heat pumps. A study for the UK put the conversion costs in households at about GBP 270 to 320 for heat pumps, and the conversion to pure hydrogen heating at an estimated GBP 100 to 120. That means hydrogen could cost-efficiently provide the solution for the largest share of the CO2 emissions from buildings.
Second, it uses existing infrastructure, avoiding the potential for stranding new assets while guaranteeing future investments, thus making it accessible for
storage and/or buffering. In addition, a hydrogen gas grid would be compatible with current regulations, business requirements, jobs, and know-how.
Finally, hydrogen makes it possible to determine decarbonization issues centrally and act on them directly. Stakeholders such as utilities can decide decarbonization strategies centrally and manage the transition, providing convenience for end customers and ensuring a speedy transition. Insulation and electrification strategies would require each household to respond individually and decide autonomously.
Decarbonizing the gas grid will create synergies with another decarbonization opportunity: the switch from burners and boilers to combined heat and power (CHP) fuel cell systems. These systems increase energy efficiency by producing both heating and power for buildings. This reduces CO2 emissions, primary energy consumption, and simultaneously decreases pollutants such as nitrogen oxides (NOX), sulfur oxides (SOX), volatile organic compounds (VOC), and particulate matter (PM). Most modern CHPs are capable of processing both natural gas or hydrogen, making it possible to upgrade to CHPs today and move toward decarbonization via hydrogen in the future.
Hydrogen is an inevitable component of the decarbonization of buildings, deeply and at scale. Deployment will likely start first and grow most steadily in countries that have high seasonal heating demand, extensive existing natural gas networks, and substantial older building stocks (see Exhibit 15). Germany, France, the UK, and the Netherlands all fall into this category. As Exhibit 15 shows, the leading countries account for 58% of total final energy and over 71% of gas demand in building heat, thereby creating a huge market for hydrogen.
01 THE VISION
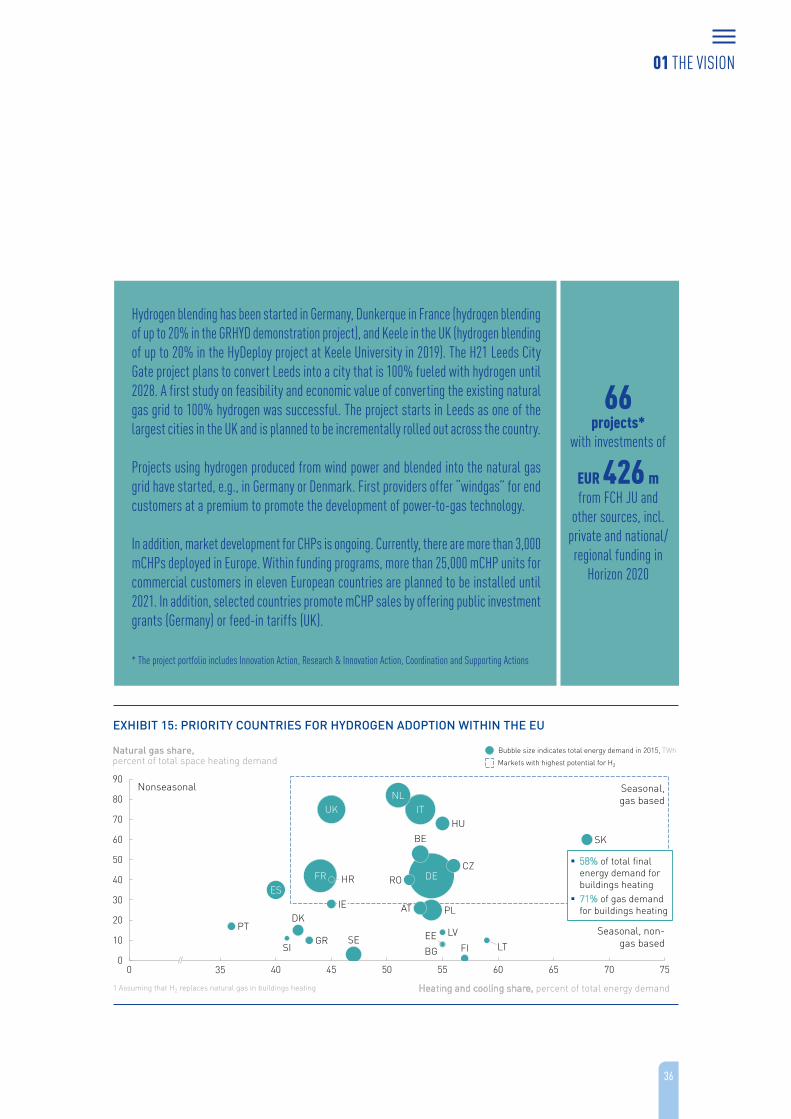
36
Nonseasonal
1 Assuming that H2 replaces natural gas in buildings heating
Seasonal, non-gas based
Seasonal, gas based
Markets with highest potential for H2
Bubble size indicates total energy demand in 2015, TWh
EXHIBIT 15: PRIORITY COUNTRIES FOR HYDROGEN ADOPTION WITHIN THE EU
30
60350 40 65 7045 50 7555
60
0
40
10
20
50
70
80
90
AT
SK
IE
HU
BG
Heating and cooling share, percent of total energy demand
Natural gas share, percent of total space heating demand
UK
PT
NL
GR
HRES
IT
SE
BE
SI
CZ
DK
EEFI
FR DE
LVLT
PL
RO
58% of total final energy demand for buildings heating
71% of gas demand for buildings heating
Hydrogen blending has been started in Germany, Dunkerque in France (hydrogen blending of up to 20% in the GRHYD demonstration project), and Keele in the UK (hydrogen blending of up to 20% in the HyDeploy project at Keele University in 2019). The H21 Leeds City Gate project plans to convert Leeds into a city that is 100% fueled with hydrogen until 2028. A first study on feasibility and economic value of converting the existing natural gas grid to 100% hydrogen was successful. The project starts in Leeds as one of the largest cities in the UK and is planned to be incrementally rolled out across the country.
Projects using hydrogen produced from wind power and blended into the natural gas grid have started, e.g., in Germany or Denmark. First providers offer “windgas” for end customers at a premium to promote the development of power-to-gas technology.
In addition, market development for CHPs is ongoing. Currently, there are more than 3,000 mCHPs deployed in Europe. Within funding programs, more than 25,000 mCHP units for commercial customers in eleven European countries are planned to be installed until 2021. In addition, selected countries promote mCHP sales by offering public investment grants (Germany) or feed-in tariffs (UK).
* The project portfolio includes Innovation Action, Research & Innovation Action, Coordination and Supporting Actions
66 projects*
with investments of
EUR 426 m from FCH JU and
other sources, incl. private and national/regional funding in
Horizon 2020
01 THE VISION
37
INDUSTRY HEAT: HYDROGEN CAN HELP INDUSTRIES WITH FEW ALTERNATIVE DECARBONIZATION OPTIONS
THE CHALLENGE
With an estimated 3,200 TWh in annual final energy demand, the European industry heat segment is the region’s third-largest consumer of energy, emitting more than 390 Mt of direct CO2 annually. Six energy-intensive industries consume 60% of all final energy: aluminum, cement, (petro)chemicals, refining, iron and steel, and pulp and paper. High-grade heat is the largest segment among these industries, with about 40% of energy demand; electricity has the lowest share.
To reach the decarbonization target, industry heat would have to reduce its CO2 emissions by 56% or an equivalent of approximately 220 Mt by 2050.
KEY ARGUMENTS
There are seven ways to decarbonize industry heat.
1. Demand side measures: lowering the demand for primary resources by increasing circularity (reuse, recycling, or replacement of products)
2. Energy efficiency measures: adapting production equipment and deploying the best available technologies to lower energy use per production volume
3. Electrification: where technically feasible and affordable, replacing fossil fuel with renewable electricity heating
4. Biomass: where available in sufficient quantities, replacing fossil fuel with sustainably produced biomass
5. Hydrogen: replacing fossil fuel with ultra-low-carbon hydrogen
6. Carbon capture: equipping current processes with carbon capture and storage (CCS) and carbon capture and utilization (CCU)
7. Other innovation: developing innovative processes (e.g., electrochemical production processes) to reduce emissions.
Among the fuel substitution options (numbers 3 to 5 above) electrification is the primary way to decarbonize industrial processes in the low- and medium-grade heat segments. However, electric heaters, boilers, and furnaces become less efficient as requirements for higher temperatures increase, and their use may necessitate major adaptations in current production processes. For industrial processes in the high-grade heat segment, hydrogen may therefore offer benefits regarding its ability to generate high temperatures using process setups similar to today’s. As more than 30% of the industry’s CO2 emissions stem from high-grade heat (in industries such as cement and chemicals), these uses have an essential role to play for decarbonization, provided CCS or other innovations are not competitive (see Exhibit 16).
Given that each industrial sector requires specific, cascaded heat and pressure ranges, they all need to assess decarbonization technologies individually. In the end, expense often emerges as an important determinant of decarbonization decisions, which are strongly dependent on electricity prices in relation to the costs of producing hydrogen. Local conditions such as the availability of carbon-free hydrogen in relation to the availability of CCS or biomass are also critical decision factors.
01 THE VISION
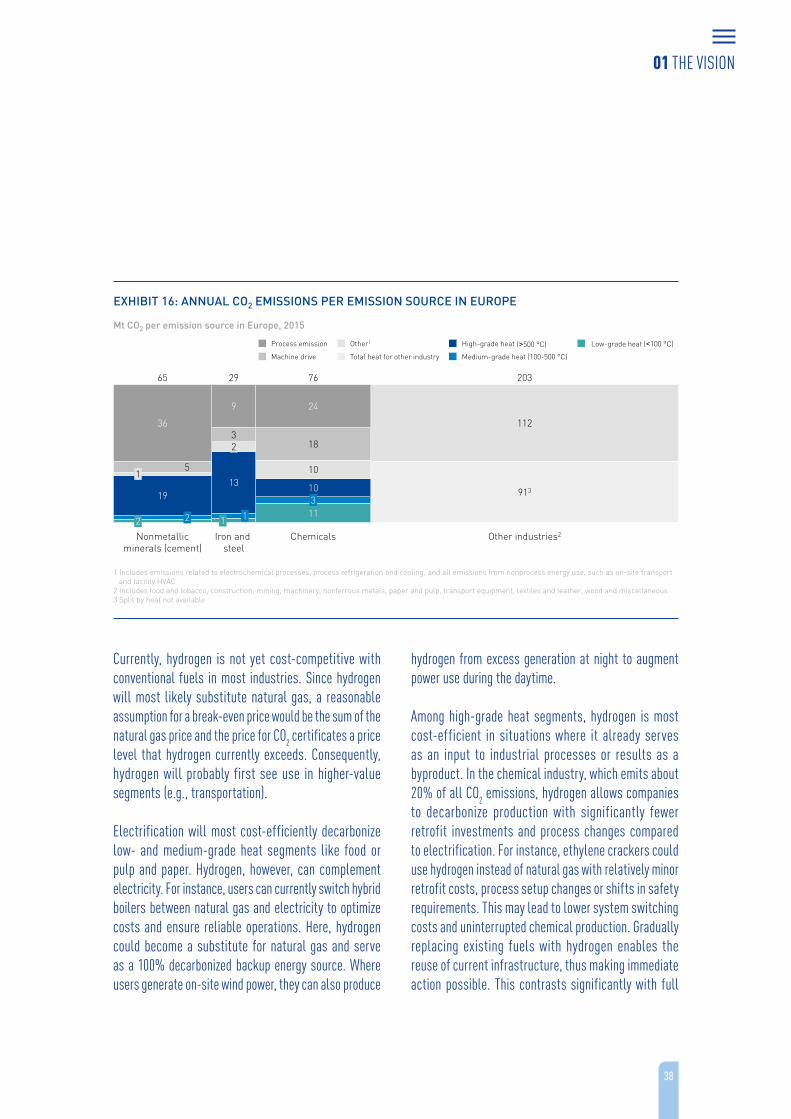
38
Currently, hydrogen is not yet cost-competitive with conventional fuels in most industries. Since hydrogen will most likely substitute natural gas, a reasonable assumption for a break-even price would be the sum of the natural gas price and the price for CO2 certificates a price level that hydrogen currently exceeds. Consequently, hydrogen will probably first see use in higher-value segments (e.g., transportation).
Electrification will most cost-efficiently decarbonize low- and medium-grade heat segments like food or pulp and paper. Hydrogen, however, can complement electricity. For instance, users can currently switch hybrid boilers between natural gas and electricity to optimize costs and ensure reliable operations. Here, hydrogen could become a substitute for natural gas and serve as a 100% decarbonized backup energy source. Where users generate on-site wind power, they can also produce
hydrogen from excess generation at night to augment power use during the daytime.
Among high-grade heat segments, hydrogen is most cost-efficient in situations where it already serves as an input to industrial processes or results as a byproduct. In the chemical industry, which emits about 20% of all CO2 emissions, hydrogen allows companies to decarbonize production with significantly fewer retrofit investments and process changes compared to electrification. For instance, ethylene crackers could use hydrogen instead of natural gas with relatively minor retrofit costs, process setup changes or shifts in safety requirements. This may lead to lower system switching costs and uninterrupted chemical production. Gradually replacing existing fuels with hydrogen enables the reuse of current infrastructure, thus making immediate action possible. This contrasts significantly with full
913
2
2
36
13
24
3
1
1
18
1
Iron and steel
65
10
10
19
5
Chemicals
2
76
11
Nonmetallicminerals (cement)
9
Other industries2
29 203
3112
Mt CO2 per emission source in Europe, 2015
1 Includes emissions related to electrochemical processes, process refrigeration and cooling, and all emissions from nonprocess energy use, such as on-site transport and facility HVAC
2 Includes food and tobacco, construction, mining, machinery, nonferrous metals, paper and pulp, transport equipment, textiles and leather, wood and miscellaneous 3 Split by heat not available
EXHIBIT 16: ANNUAL CO2 EMISSIONS PER EMISSION SOURCE IN EUROPE
Process emission Other1
Machine drive Total heat for other industry
High-grade heat (>500 °C)
Medium-grade heat (100-500 °C)
Low-grade heat (<100 °C)Low-grade heat (<100 °C)(>500 °C)
01 THE VISION

39
electrification: in high-grade heat segments, a fully electrified furnace may require major investments in transmission infrastructure.
For all sectors, independent of heat requirements, hydrogen is well-suited as a backup energy provider as it guarantees uninterrupted, reliable, clean power and heat whenever needed, independent of weather conditions or imports.
Hydrogen is already used widely in industry to produce heat when it is available as a by product. Given that most industries with high-grade heat compete internationally, they are highly cost sensitive. Wider deployment will take place when hydrogen costs fall, hydrogen is more readily available, and incentives for decarbonization for industry exist.
* The project portfolio includes Innovation Action projects; basic research projects included in chapter on heating and power of buildings due to overlaps
4 projects*
with investments of
EUR 43 m from FCH JU and
other sources, incl. private and national/regional funding in
Horizon 2020
01 THE VISION
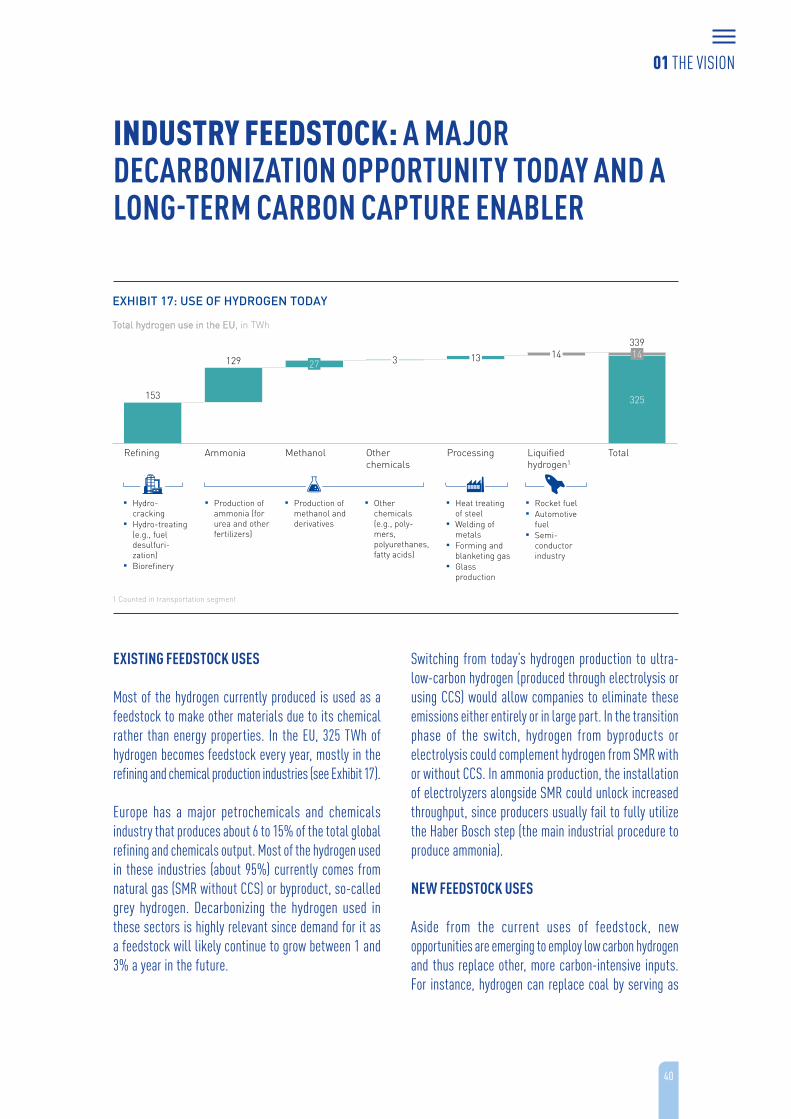
40
INDUSTRY FEEDSTOCK: A MAJOR DECARBONIZATION OPPORTUNITY TODAY AND A LONG-TERM CARBON CAPTURE ENABLER
EXISTING FEEDSTOCK USES
Most of the hydrogen currently produced is used as a feedstock to make other materials due to its chemical rather than energy properties. In the EU, 325 TWh of hydrogen becomes feedstock every year, mostly in the refining and chemical production industries (see Exhibit 17).
Europe has a major petrochemicals and chemicals industry that produces about 6 to 15% of the total global refining and chemicals output. Most of the hydrogen used in these industries (about 95%) currently comes from natural gas (SMR without CCS) or byproduct, so-called grey hydrogen. Decarbonizing the hydrogen used in these sectors is highly relevant since demand for it as a feedstock will likely continue to grow between 1 and 3% a year in the future.
Switching from today’s hydrogen production to ultra-low-carbon hydrogen (produced through electrolysis or using CCS) would allow companies to eliminate these emissions either entirely or in large part. In the transition phase of the switch, hydrogen from byproducts or electrolysis could complement hydrogen from SMR with or without CCS. In ammonia production, the installation of electrolyzers alongside SMR could unlock increased throughput, since producers usually fail to fully utilize the Haber Bosch step (the main industrial procedure to produce ammonia).
NEW FEEDSTOCK USES
Aside from the current uses of feedstock, new opportunities are emerging to employ low carbon hydrogen and thus replace other, more carbon-intensive inputs. For instance, hydrogen can replace coal by serving as
Total hydrogen use in the EU, in TWh
▪ Hydro-cracking
▪ Hydro-treating (e.g., fuel desulfuri-zation)
▪ Biorefinery
▪ Production of ammonia (for urea and other fertilizers)
▪ Production of methanol and derivatives
▪ Other chemicals (e.g., poly-mers, polyurethanes, fatty acids)
▪ Heat treating of steel
▪ Welding of metals
▪ Forming and blanketing gas
▪ Glass production
▪ Rocket fuel▪ Automotive
fuel▪ Semi-
conductor industry
EXHIBIT 17: USE OF HYDROGEN TODAY
1 Counted in transportation segment
153 325
129 13
339
27
Refining Ammonia Methanol
3
Other chemicals
Processing
14
Liquified hydrogen1
14
Total
01 THE VISION
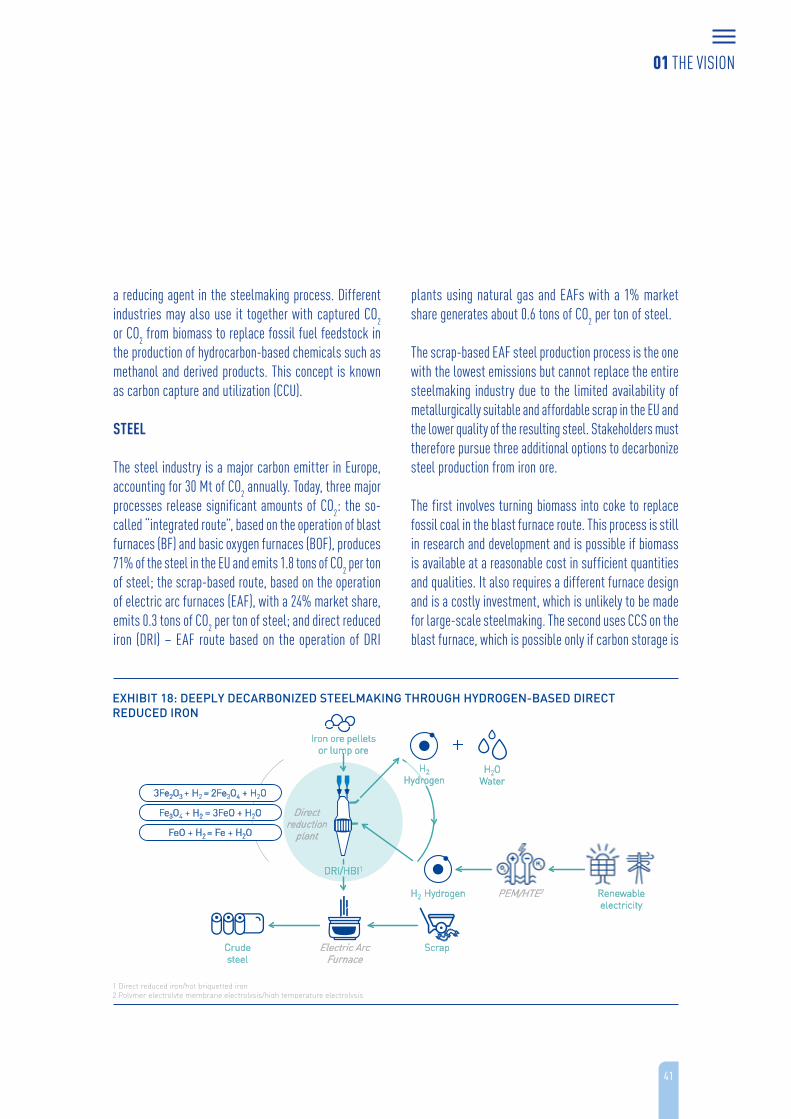
41
a reducing agent in the steelmaking process. Different industries may also use it together with captured CO2 or CO2 from biomass to replace fossil fuel feedstock in the production of hydrocarbon-based chemicals such as methanol and derived products. This concept is known as carbon capture and utilization (CCU).
STEEL
The steel industry is a major carbon emitter in Europe, accounting for 30 Mt of CO2 annually. Today, three major processes release significant amounts of CO2: the so- called “integrated route”, based on the operation of blast furnaces (BF) and basic oxygen furnaces (BOF), produces 71% of the steel in the EU and emits 1.8 tons of CO2 per ton of steel; the scrap-based route, based on the operation of electric arc furnaces (EAF), with a 24% market share, emits 0.3 tons of CO2 per ton of steel; and direct reduced iron (DRI) – EAF route based on the operation of DRI
plants using natural gas and EAFs with a 1% market share generates about 0.6 tons of CO2 per ton of steel.
The scrap-based EAF steel production process is the one with the lowest emissions but cannot replace the entire steelmaking industry due to the limited availability of metallurgically suitable and affordable scrap in the EU and the lower quality of the resulting steel. Stakeholders must therefore pursue three additional options to decarbonize steel production from iron ore.
The first involves turning biomass into coke to replace fossil coal in the blast furnace route. This process is still in research and development and is possible if biomass is available at a reasonable cost in sufficient quantities and qualities. It also requires a different furnace design and is a costly investment, which is unlikely to be made for large-scale steelmaking. The second uses CCS on the blast furnace, which is possible only if carbon storage is
1 Direct reduced iron/hot briquetted iron2 Polymer electrolyte membrane electrolysis/high temperature electrolysis
EXHIBIT 18: DEEPLY DECARBONIZED STEELMAKING THROUGH HYDROGEN-BASED DIRECT REDUCED IRON
Iron ore pelletsor lump ore
Direct reduction
plant
DRI/HBI1
H2OWater
Renewable electricity
3Fe2O3 + H2 = 2Fe3O4 + H2O
FeO + H2 = Fe + H2O
Fe3O4 + H2 = 3FeO + H2O
PEM/HTE2H2 Hydrogen
Crude steel
ScrapElectric ArcFurnace
H2 Hydrogen
01 THE VISION
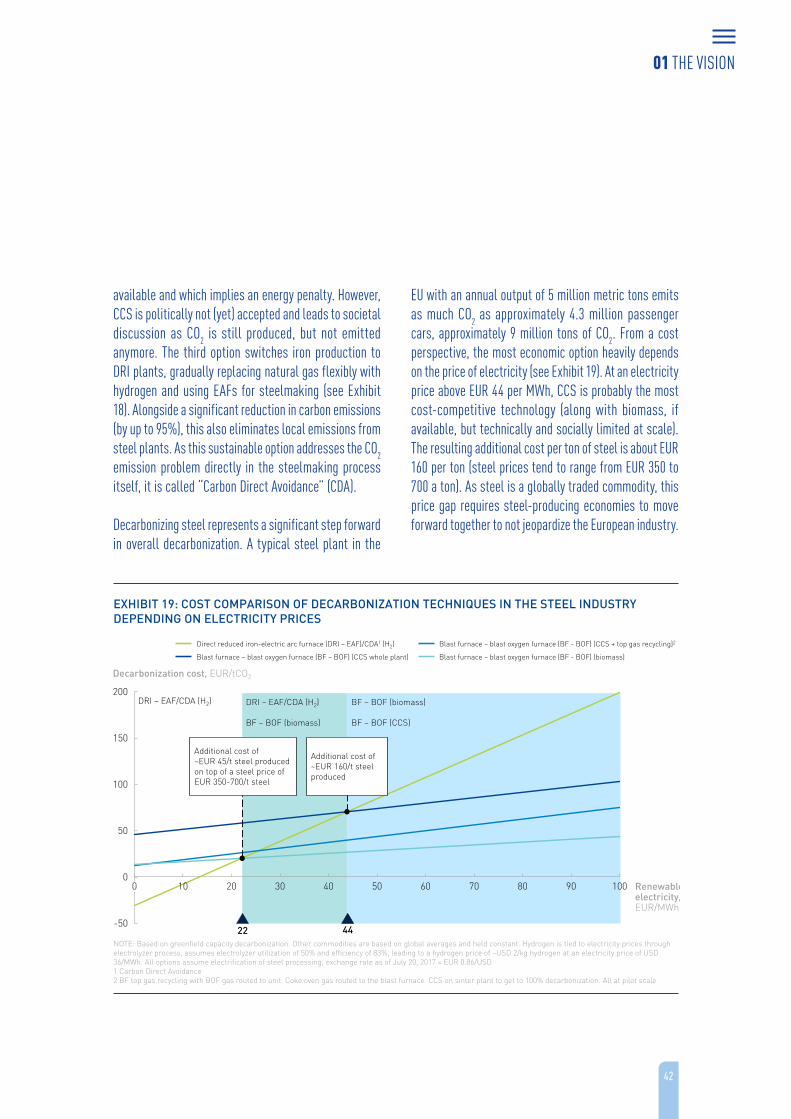
42
available and which implies an energy penalty. However, CCS is politically not (yet) accepted and leads to societal discussion as CO2 is still produced, but not emitted anymore. The third option switches iron production to DRI plants, gradually replacing natural gas flexibly with hydrogen and using EAFs for steelmaking (see Exhibit 18). Alongside a significant reduction in carbon emissions (by up to 95%), this also eliminates local emissions from steel plants. As this sustainable option addresses the CO2 emission problem directly in the steelmaking process itself, it is called “Carbon Direct Avoidance” (CDA).
Decarbonizing steel represents a significant step forward in overall decarbonization. A typical steel plant in the
EU with an annual output of 5 million metric tons emits as much CO2 as approximately 4.3 million passenger cars, approximately 9 million tons of CO2. From a cost perspective, the most economic option heavily depends on the price of electricity (see Exhibit 19). At an electricity price above EUR 44 per MWh, CCS is probably the most cost-competitive technology (along with biomass, if available, but technically and socially limited at scale). The resulting additional cost per ton of steel is about EUR 160 per ton (steel prices tend to range from EUR 350 to 700 a ton). As steel is a globally traded commodity, this price gap requires steel-producing economies to move forward together to not jeopardize the European industry.
DRI – EAF/CDA (H2) BF – BOF (biomass)
BF – BOF (CCS)
DRI – EAF/CDA (H2)
BF – BOF (biomass)
0 10 4020 30 50 60 70 80 90 100
-50
0
50
100
150
200
Renewable electricity,EUR/MWh
Decarbonization cost, EUR/tCO2
4422
Direct reduced iron-electric arc furnace (DRI – EAF)/CDA1 (H2)
Blast furnace – blast oxygen furnace (BF - BOF) (biomass)
Blast furnace – blast oxygen furnace (BF - BOF) (CCS + top gas recycling)2
Blast furnace – blast oxygen furnace (BF – BOF) (CCS whole plant)
NOTE: Based on greenfield capacity decarbonization. Other commodities are based on global averages and held constant. Hydrogen is tied to electricity prices through electrolyzer process, assumes electrolyzer utilization of 50% and efficiency of 83%, leading to a hydrogen price of ~USD 2/kg hydrogen at an electricity price of USD 36/MWh. All options assume electrification of steel processing; exchange rate as of July 20, 2017 = EUR 0.86/USD1 Carbon Direct Avoidance 2 BF top gas recycling with BOF gas routed to unit. Coke oven gas routed to the blast furnace. CCS on sinter plant to get to 100% decarbonization. All at pilot scale
EXHIBIT 19: COST COMPARISON OF DECARBONIZATION TECHNIQUES IN THE STEEL INDUSTRY DEPENDING ON ELECTRICITY PRICES
Additional cost of ~EUR 160/t steel produced
Additional cost of ~EUR 45/t steel produced on top of a steel price of EUR 350-700/t steel
01 THE VISION
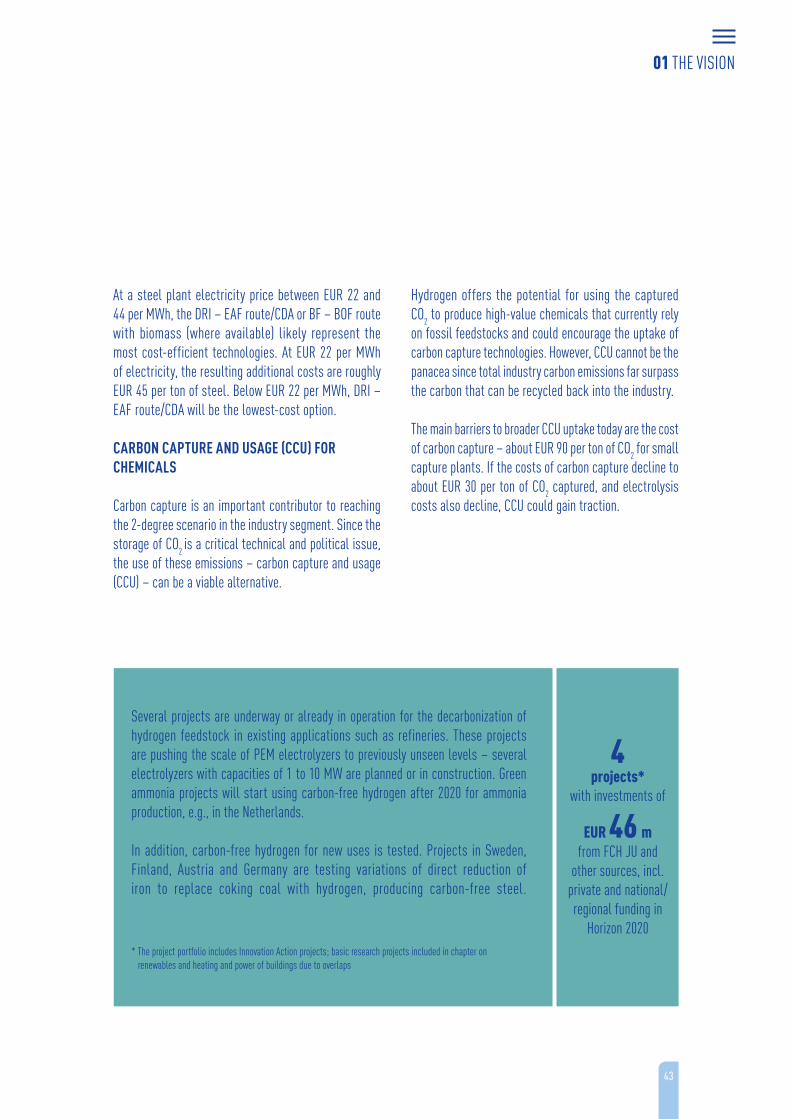
43
At a steel plant electricity price between EUR 22 and 44 per MWh, the DRI – EAF route/CDA or BF – BOF route with biomass (where available) likely represent the most cost-efficient technologies. At EUR 22 per MWh of electricity, the resulting additional costs are roughly EUR 45 per ton of steel. Below EUR 22 per MWh, DRI – EAF route/CDA will be the lowest-cost option.
CARBON CAPTURE AND USAGE (CCU) FOR CHEMICALS
Carbon capture is an important contributor to reaching the 2-degree scenario in the industry segment. Since the storage of CO2 is a critical technical and political issue, the use of these emissions – carbon capture and usage (CCU) – can be a viable alternative.
Hydrogen offers the potential for using the captured CO2 to produce high-value chemicals that currently rely on fossil feedstocks and could encourage the uptake of carbon capture technologies. However, CCU cannot be the panacea since total industry carbon emissions far surpass the carbon that can be recycled back into the industry.
The main barriers to broader CCU uptake today are the cost of carbon capture – about EUR 90 per ton of CO2 for small capture plants. If the costs of carbon capture decline to about EUR 30 per ton of CO2 captured, and electrolysis costs also decline, CCU could gain traction.
Several projects are underway or already in operation for the decarbonization of hydrogen feedstock in existing applications such as refineries. These projects are pushing the scale of PEM electrolyzers to previously unseen levels – several electrolyzers with capacities of 1 to 10 MW are planned or in construction. Green ammonia projects will start using carbon-free hydrogen after 2020 for ammonia production, e.g., in the Netherlands.
In addition, carbon-free hydrogen for new uses is tested. Projects in Sweden, Finland, Austria and Germany are testing variations of direct reduction of iron to replace coking coal with hydrogen, producing carbon-free steel.
* The project portfolio includes Innovation Action projects; basic research projects included in chapter on renewables and heating and power of buildings due to overlaps
4 projects*
with investments of
EUR 46 m from FCH JU and
other sources, incl. private and national/regional funding in
Horizon 2020
01 THE VISION
44
02RAMPING UPHydrogen solutions are scalable and benefit Europe’s economy and environment
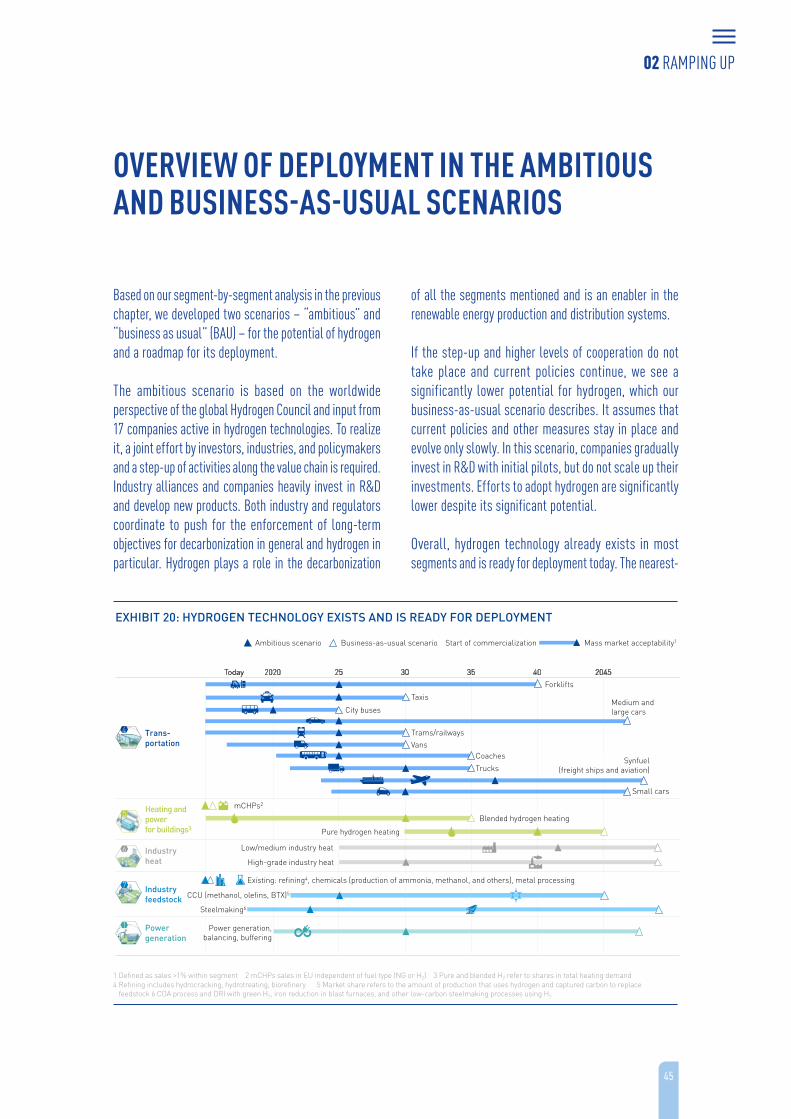
45
OVERVIEW OF DEPLOYMENT IN THE AMBITIOUS AND BUSINESS-AS-USUAL SCENARIOS
Based on our segment-by-segment analysis in the previous chapter, we developed two scenarios – “ambitious” and “business as usual” (BAU) – for the potential of hydrogen and a roadmap for its deployment.
The ambitious scenario is based on the worldwide perspective of the global Hydrogen Council and input from 17 companies active in hydrogen technologies. To realize it, a joint effort by investors, industries, and policymakers and a step-up of activities along the value chain is required. Industry alliances and companies heavily invest in R&D and develop new products. Both industry and regulators coordinate to push for the enforcement of long-term objectives for decarbonization in general and hydrogen in particular. Hydrogen plays a role in the decarbonization
of all the segments mentioned and is an enabler in the renewable energy production and distribution systems.
If the step-up and higher levels of cooperation do not take place and current policies continue, we see a significantly lower potential for hydrogen, which our business-as-usual scenario describes. It assumes that current policies and other measures stay in place and evolve only slowly. In this scenario, companies gradually invest in R&D with initial pilots, but do not scale up their investments. Efforts to adopt hydrogen are significantly lower despite its significant potential.
Overall, hydrogen technology already exists in most segments and is ready for deployment today. The nearest-
Business-as-usual scenarioAmbitious scenario Start of commercialization Mass market acceptability1
1 Defined as sales >1% within segment 2 mCHPs sales in EU independent of fuel type (NG or H2) 3 Pure and blended H2 refer to shares in total heating demand 4 Refining includes hydrocracking, hydrotreating, biorefinery 5 Market share refers to the amount of production that uses hydrogen and captured carbon to replace
feedstock 6 CDA process and DRI with green H2, iron reduction in blast furnaces, and other low-carbon steelmaking processes using H2
4
7
6
5
1
Trans-portation
Industry feedstock
Industry heat
Heating and power for buildings3
Power generation
CCU (methanol, olefins, BTX)5
Today 2020 25 30 35 40 2045
Medium and large cars
Small cars
Steelmaking6
Trams/railways
VansCoaches
City buses
Taxis
Low/medium industry heat
High-grade industry heat
Existing: refining4, chemicals (production of ammonia, methanol, and others), metal processing
Pure hydrogen heating
Blended hydrogen heating
mCHPs2
Forklifts
TrucksSynfuel
(freight ships and aviation)
Power generation,balancing, buffering
EXHIBIT 20: HYDROGEN TECHNOLOGY EXISTS AND IS READY FOR DEPLOYMENT
02 RAMPING UP
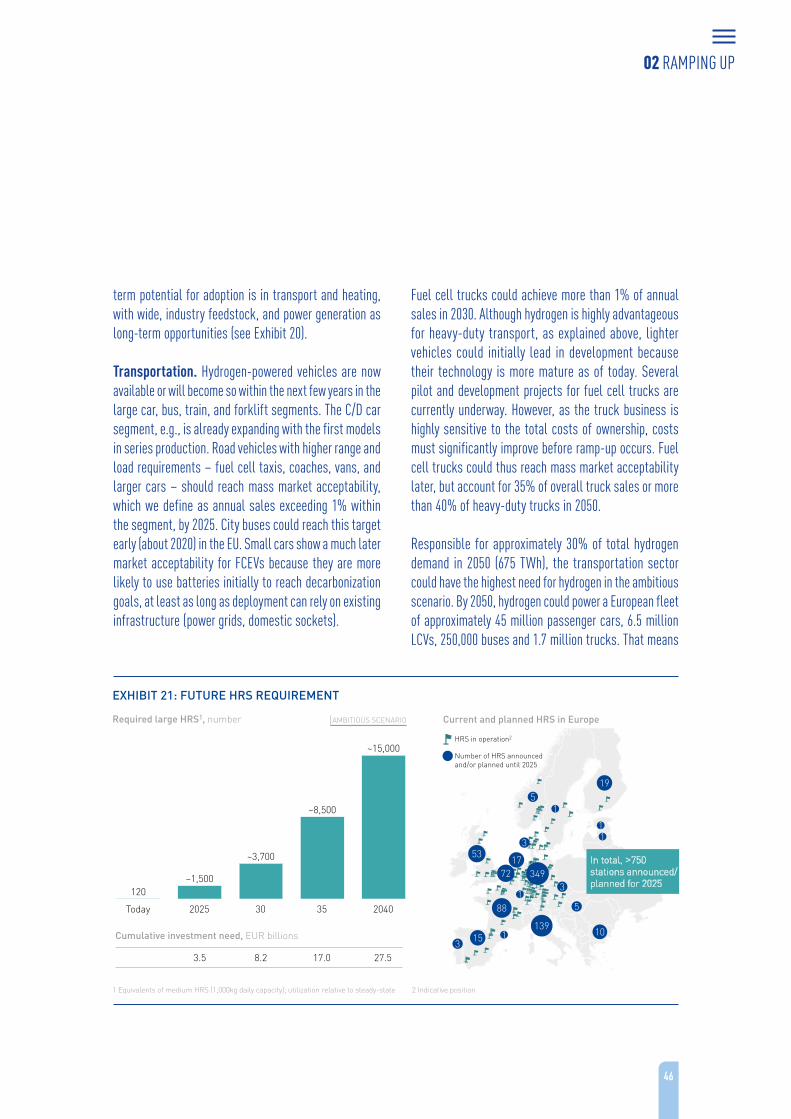
4646
term potential for adoption is in transport and heating, with wide, industry feedstock, and power generation as long-term opportunities (see Exhibit 20).
Transportation. Hydrogen-powered vehicles are now available or will become so within the next few years in the large car, bus, train, and forklift segments. The C/D car segment, e.g., is already expanding with the first models in series production. Road vehicles with higher range and load requirements – fuel cell taxis, coaches, vans, and larger cars – should reach mass market acceptability, which we define as annual sales exceeding 1% within the segment, by 2025. City buses could reach this target early (about 2020) in the EU. Small cars show a much later market acceptability for FCEVs because they are more likely to use batteries initially to reach decarbonization goals, at least as long as deployment can rely on existing infrastructure (power grids, domestic sockets).
Fuel cell trucks could achieve more than 1% of annual sales in 2030. Although hydrogen is highly advantageous for heavy-duty transport, as explained above, lighter vehicles could initially lead in development because their technology is more mature as of today. Several pilot and development projects for fuel cell trucks are currently underway. However, as the truck business is highly sensitive to the total costs of ownership, costs must significantly improve before ramp-up occurs. Fuel cell trucks could thus reach mass market acceptability later, but account for 35% of overall truck sales or more than 40% of heavy-duty trucks in 2050.
Responsible for approximately 30% of total hydrogen demand in 2050 (675 TWh), the transportation sector could have the highest need for hydrogen in the ambitious scenario. By 2050, hydrogen could power a European fleet of approximately 45 million passenger cars, 6.5 million LCVs, 250,000 buses and 1.7 million trucks. That means
AMBITIOUS SCENARIO
1 Equivalents of medium HRS (1,000kg daily capacity); utilization relative to steady-state 2 Indicative position
120
35
~8,500
Today 20402025 30
~1,500
~3,700
~15,000
EXHIBIT 21: FUTURE HRS REQUIREMENT
Required large HRS1, number
Cumulative investment need, EUR billions
27.517.08.23.5
5
88
17
3
11
1
1
10
5
139
19
1
3
3
53
15
72 349
HRS in operation2
Number of HRS announced and/or planned until 2025
Current and planned HRS in Europe
In total, >750stations announced/ planned for 2025
02 RAMPING UP
47
FCEVs could make up 20 to 25% of these segments’ fleets. For larger vehicles with long-range requirements, adoption rates could be higher since hydrogen has clear range advantages. Adoption rates could reach 30% for large cars and vans and 55% for taxis, while small FCEVs make up only 15% of the 2050 small cars fleet.
The infrastructure to fuel this fleet needs to ramp up in line with the number of vehicles on the road. With about 3,700 large refueling stations in 2030, FCEVs could provide “full mobility” across Europe (see Exhibit 21). This is equivalent to an investment of roughly EUR 8 billion. Today, roughly 120 HRS are in operation, and there are intentions and plans to build more than 750 by 2025, but the deployment would still require a significant step-up of activities to ensure this initial infrastructure is put in place.
What’s more, hydrogen could play an essential role in the sector beyond road transport. From 2030 onwards, hydrogen and synthetic fuels derived from hydrogen could be increasingly used to fuel freight ships and aviation if the prevailing government policies oblige them to do so. Consequently, these segments, which consume more than 20% of all energy related to transportation, can effectively become decarbonized if the carbon source is biomass. As synthetic fuel, hydrogen could replace about 4% of the EU’s fuel supply for airplanes and freighters.
For nonelectrified trains, 50% of sales in 2050 could involve fuel-cell-powered trains, replacing almost 20% of EU-wide diesel trains in the fleet. The fleet could thereby reach about 5,500 hydrogen-powered trains in 2050.
If no consolidated efforts occur and the business-as-usual scenario applies, the adoption rates for hydrogen-fueled vehicles – both FCEVs and synthetic fuel – would drop significantly compared to the ambitious scenario,
diminishing the achievement of the EU’s climate goals and the EU industry’s position in the global economy. In road transportation, adoption rates would total less than 1% for small cars, 2% for taxis, and 5% for busses and trucks by 2050.
This means that only about 1.4 million passenger cars, 700,000 LCVs, 60,000 buses, and 380,000 hydrogen-powered trucks would be on Europe’s streets. For aviation and freighters, market shares would remain between 0 and 1%. In the business-as-usual scenario, hydrogen would not play a role in the European mobility transition and FCEVs would remain a transportation niche.
Heating and power for buildings. Blending hydrogen into the current natural gas grid represents an immediate opportunity for decarbonization. In our roadmap, blending accounts for the first ramp-up of hydrogen in building heat with a blending ratio increasing to 7% by volume until 2030. An estimated 25 TWh of hydrogen could be blended into the natural gas network by 2030, representing about 1% of the energy demand for heating in commercial and residential buildings. This development could be driven by Germany, UK, the Netherlands, France and Denmark as frontrunners in blending hydrogen into the grid and could heat 2.5 million residential households in addition to commercial buildings there. In addition, five mid-sized cities with roughly 300.000 inhabitants could switch to pure hydrogen networks. Between 2030 and 2040, pure hydrogen grids could emerge beyond pilot projects. Whole cities and regions would switch to these zero-emission pure networks. These transitions would require effective planning and the creation of a new infrastructure, leading to market acceptability in 2040.
By 2050, hydrogen could provide about 18% of the energy required by European households for heating. We see the
02 RAMPING UP
48
potential to replace up to 44% of natural-gas-sourced building heat with 465 TWh of hydrogen. In such a scenario, the leading countries would have transformed 80% of their natural gas grid to pure hydrogen, while other countries will blend 10% hydrogen energy content into their natural gas grids.
As a result, 52 million European households would receive either blended or pure hydrogen instead of natural gas in 2050, accounting for 58% of all households connected to the natural gas grid.
In parallel, households could switch to mCHPs instead of natural gas boilers. Their market share could grow from currently 1% to more than 10% by 2030 and to 50% by 2050.
In the business-as-usual scenario, hydrogen only provides about 7% of the heating of buildings needed in 2050, leading to a hydrogen demand of about 190 TWh.
Industry heat. Substituting fossil fuels provides an essential way to decarbonize the industry heat segment. By 2030, this technique could reach market acceptability within the high-grade heat segment, equal to a demand of 8 TWh. 10 to 15 years later, it could also find acceptance in the low- to medium-grade heat segments such as pulp and paper.
While total hydrogen distribution may not be as high as in other segments (on average, 10% across different heat grades), the large amount of energy consumption for industrial purposes (more than 3,000 TWh per year) implies substantial potential for hydrogen demand.
By 2050, hydrogen could fuel more than 20% of Euro- pean high-grade heat processes, about 8% of medium-
grade processes, and roughly 5% of low-grade processes. Especially in high-grade heat, hydrogen could play a significant role, leading to a hydrogen demand of approximately 160 TWh. In total, hydrogen could cover 240 TWh by 2050.
In the business-as-usual scenario, hydrogen will be of only minor importance. In the high-grade heat segment, it would gain a maximum market share of 7% in 2050, leading to only about 50 TWh of hydrogen demand. With a market share of 1% or less, the other two heat segments would not play an important role in 2050 at all.
Industry feedstock. Companies already use hydrogen as feedstock for refining, chemicals (ammonia and methanol), and metal processing (approximately 325 TWh). Currently, roughly 70% of hydrogen feedstock is produced from natural gas through reforming. The decarbonization of the hydrogen source requires no changes to these industrial processes and offers an opportunity to scale up electrolysis and/or CCS. By 2030, we believe that 10% of hydrogen from SMR could feature CCS. Another 20% of hydrogen could come in the form of byproducts. By 2050, hydrogen for existing feedstock uses could be fully decarbonized, with more than 75% of hydrogen from SMR with CCS. This could allow a reduction in CO2 emissions of 70 Mt.
New uses of hydrogen for feedstock will contribute significantly to additional demand. They could be piloted until 2025 to 2030 and can be scaled once technologically ready and a proper regulatory framework is in place. In our roadmap, steel would be the leading sector for new feedstock applications of hydrogen, with more than 1% of European steel produced from DRI by 2025 growing to 20% in 2050 (140 TWh of hydrogen).
02 RAMPING UP
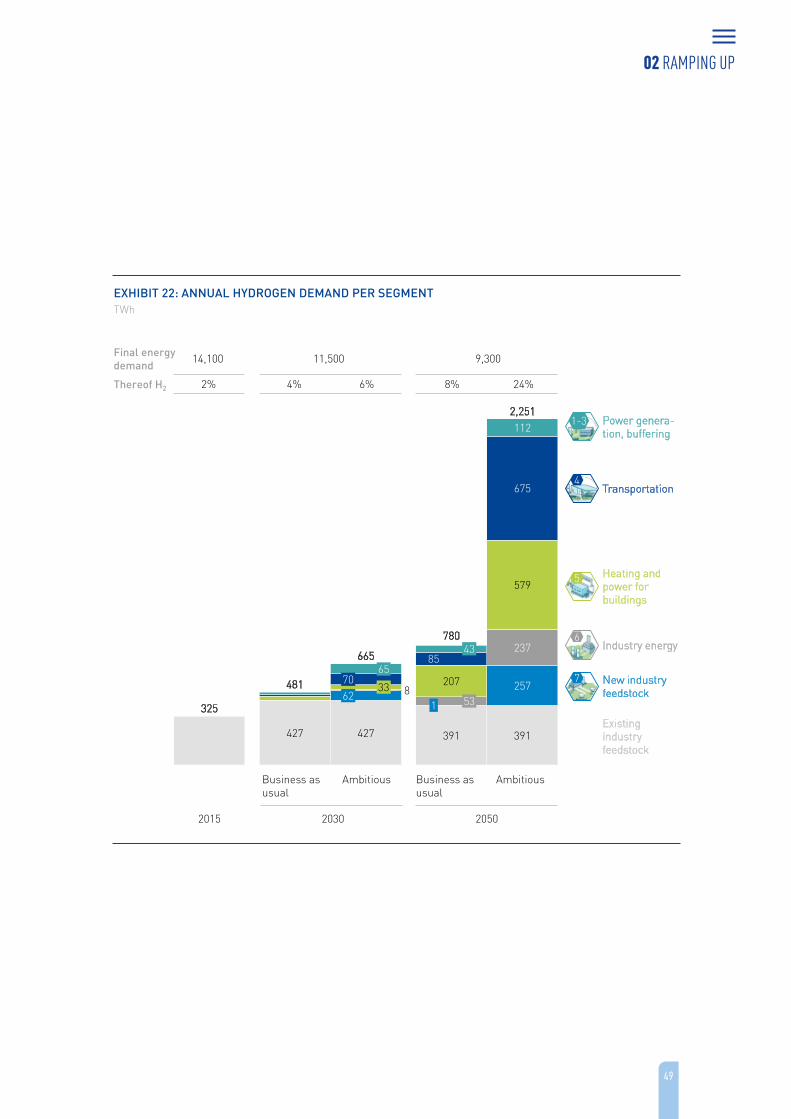
49
EXHIBIT 22: ANNUAL HYDROGEN DEMAND PER SEGMENT
Existing industryfeedstock
325
427 427
862481
65
33
665
70
391 391
257
23785
675
112
579
43
2,251
780
207
531
AmbitiousBusiness as usual
AmbitiousBusiness as usual
205020302015
7 New industry feedstock
6Industry energy
5 Heating and power for buildings
4Transportation
1-3 Power genera-tion, buffering
Final energy demand
14,100 11,500 9,300
Thereof H2 24%6%4%2% 8%
TWh
02 RAMPING UP
50
Additionally, 30% of methanol, olefins, and BTX from captured carbon could be produced by hydrogen instead of methane by 2050. This would create additional demand for up to 120 TWh of hydrogen. These steps could lead to a reduction in CO2 emissions of 60 Mt of CO2.
Without regulatory action, in a business-as-usual scenario, hydrogen would not see significant uptake in new industrial usages.
Power generation. As the energy system relies more heavily on renewables, hydrogen will also play a growing role in the storage of renewables-generated electricity and the production and supply of clean electricity. By 2030, power companies could store approximately 25 TWh of surplus renewable electricity in the form of hydrogen for use in other end use segments. By 2050, this number could more than double to about 58 TWh. In addition, large power plants could generate approximately 40 TWh from about 64 TWh of hydrogen to accompany the transition to more renewable electricity in 2030. In 2050, the generated power could increase to 70 TWh, produced from about 100 TWh of hydrogen.
In the business-as-usual scenario, hydrogen demand for power generation remains significantly lower, at approximately 35 TWh. Thereby, only 25 TWh in electricity would be generated.
Total hydrogen demand. In total, the annual demand for hydrogen will increase sevenfold, from about 325 TWh in 2015 to 2,250 TWh in 2050 (see Exhibit 22) – enough to meet the EU’s current energy demand for approximately two months. In the business-as-usual scenario, demand would reach only about 780 TWh in 2050. In each case, the increased hydrogen demand will stem from new uses in the power, transportation, industry (heat and feedstock), and building segments.
02 RAMPING UP
51
SUPPLY PERSPECTIVE
Different hydrogen production methods are available today, most commonly clustered into three groups: production of hydrogen as the byproduct from processes in the chemical industry, reforming of natural gas or biogas and water electrolysis.
Currently, the most common method to produce large volumes of hydrogen is natural gas reforming into H2 and CO or CO2 in a steam methane reformer (SMR). The remaining CO2 steam can be very pure and is therefore well suited for carbon capture and storage (CCS). SMR is currently the cheapest available hydrogen production method and will in any case be an integral part of the transition to a hydrogen economy. Autothermal reforming (ATR) is another process for producing hydrogen from hydrocarbon feedstock, such as natural gas. ATR produces syngas, composed of hydrogen and carbon monoxide, by partially oxidizing a hydrocarbon feed with oxygen and steam and subsequent catalytic reforming. The syngas can be used as feedstock for hydrogen by separation into pure hydrogen, carbon monoxide, and carbon dioxide. In case of tight emission targets, SMR and ATR need to be equipped with CCS to remain viable. As renewable power prices come down, water electrolysis can become more cost-efficient in the future because it does not rely on feedstock other than water.
Water electrolysis produces high-purity hydrogen by using electricity to split water. Alkaline electrolysis is the more established technology today, while proton exchange membrane (PEM) water electrolysis has higher potential for further improvements. If electrolysis from renewable energy sources is used, it is a carbon-free hydrogen production method and both central and decentral hydrogen production is possible. That makes water electrolysis in combination with wind or solar power a well-suited technology to drive
decarbonization of the energy system. In locations where CCS is technically not feasible, biomethane reforming, water electrolysis, and longer-term biomass gasification will be the only ultra-low-carbon hydrogen production methods.
Ideally, a mix of ultra-low-carbon sources will produce hydrogen in the future. The exact split of production methods will depend on technology and cost development. To test feasibility, impact on costs, and required investments, we have developed two scenarios that represent two possible, but extreme outcomes (see Exhibit 23). Both scenarios provide similar CO2 abatement potential in order to be comparable.
Water-electrolysis-dominant scenario. This production scenario relies to a major degree on water electrolysis. It assumes sufficient renewable capacity to power electrolyzers and a significant drop in the costs of both electrolysis and renewable electricity. Also, the benefits of decentral production for selected applications support this scenario. In cases where electrolysis players cannot obtain enough renewable energy from the grid, the import of liquid hydrogen from regions with excess renewable energy capacity could be a viable option. This scenario assumes that political acceptance of CCS is low and that CCS is not a large-scale option to decarbonize hydrogen production from SMR.
In this scenario, water electrolysis will almost exclusively supply transportation demand from the start. Other industries will rely on water electrolysis and SMR in equal parts until about 2030. After 2030, no new SMR capacity is installed as electrolysis becomes the source of hydrogen with the lowest costs. All existing reforming capacity is gradually retrofitted with CCS.
02 RAMPING UP
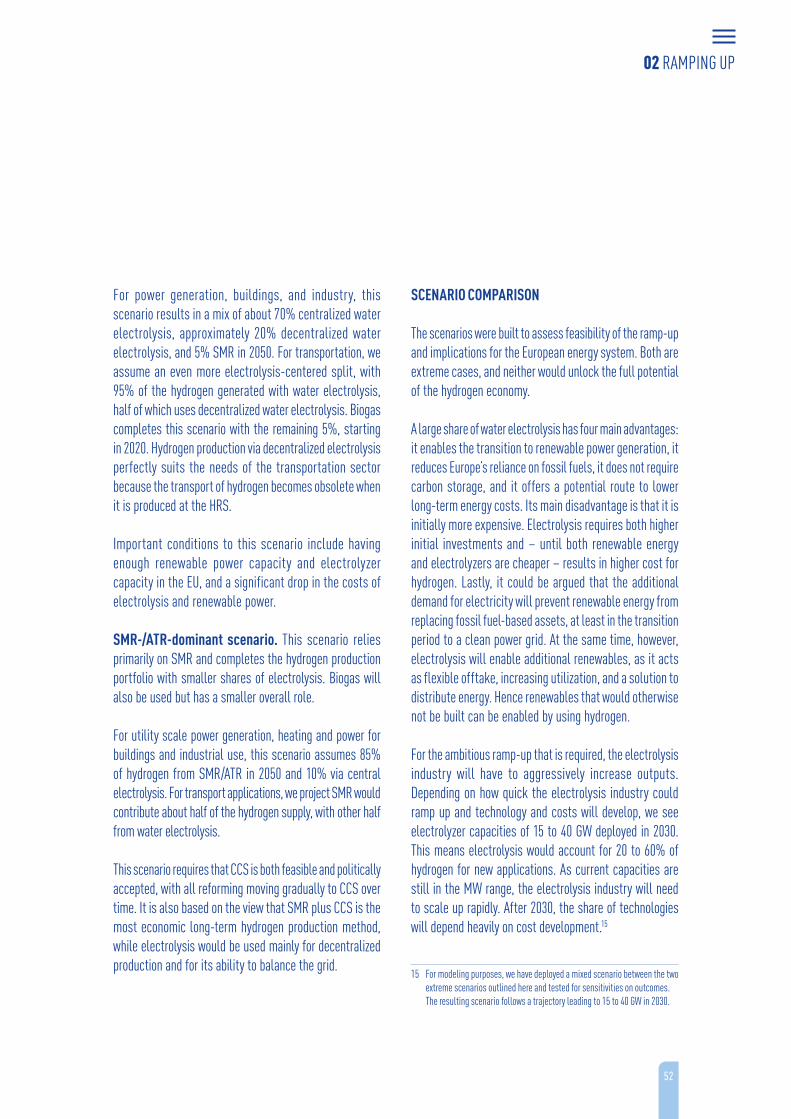
52
For power generation, buildings, and industry, this scenario results in a mix of about 70% centralized water electrolysis, approximately 20% decentralized water electrolysis, and 5% SMR in 2050. For transportation, we assume an even more electrolysis-centered split, with 95% of the hydrogen generated with water electrolysis, half of which uses decentralized water electrolysis. Biogas completes this scenario with the remaining 5%, starting in 2020. Hydrogen production via decentralized electrolysis perfectly suits the needs of the transportation sector because the transport of hydrogen becomes obsolete when it is produced at the HRS.
Important conditions to this scenario include having enough renewable power capacity and electrolyzer capacity in the EU, and a significant drop in the costs of electrolysis and renewable power.
SMR-/ATR-dominant scenario. This scenario relies primarily on SMR and completes the hydrogen production portfolio with smaller shares of electrolysis. Biogas will also be used but has a smaller overall role.
For utility scale power generation, heating and power for buildings and industrial use, this scenario assumes 85% of hydrogen from SMR/ATR in 2050 and 10% via central electrolysis. For transport applications, we project SMR would contribute about half of the hydrogen supply, with other half from water electrolysis.
This scenario requires that CCS is both feasible and politically accepted, with all reforming moving gradually to CCS over time. It is also based on the view that SMR plus CCS is the most economic long-term hydrogen production method, while electrolysis would be used mainly for decentralized production and for its ability to balance the grid.
SCENARIO COMPARISON
The scenarios were built to assess feasibility of the ramp-up and implications for the European energy system. Both are extreme cases, and neither would unlock the full potential of the hydrogen economy.
A large share of water electrolysis has four main advantages: it enables the transition to renewable power generation, it reduces Europe’s reliance on fossil fuels, it does not require carbon storage, and it offers a potential route to lower long-term energy costs. Its main disadvantage is that it is initially more expensive. Electrolysis requires both higher initial investments and – until both renewable energy and electrolyzers are cheaper – results in higher cost for hydrogen. Lastly, it could be argued that the additional demand for electricity will prevent renewable energy from replacing fossil fuel-based assets, at least in the transition period to a clean power grid. At the same time, however, electrolysis will enable additional renewables, as it acts as flexible offtake, increasing utilization, and a solution to distribute energy. Hence renewables that would otherwise not be built can be enabled by using hydrogen.
For the ambitious ramp-up that is required, the electrolysis industry will have to aggressively increase outputs. Depending on how quick the electrolysis industry could ramp up and technology and costs will develop, we see electrolyzer capacities of 15 to 40 GW deployed in 2030. This means electrolysis would account for 20 to 60% of hydrogen for new applications. As current capacities are still in the MW range, the electrolysis industry will need to scale up rapidly. After 2030, the share of technologies will depend heavily on cost development.15
15 For modeling purposes, we have deployed a mixed scenario between the two extreme scenarios outlined here and tested for sensitivities on outcomes. The resulting scenario follows a trajectory leading to 15 to 40 GW in 2030.
02 RAMPING UP
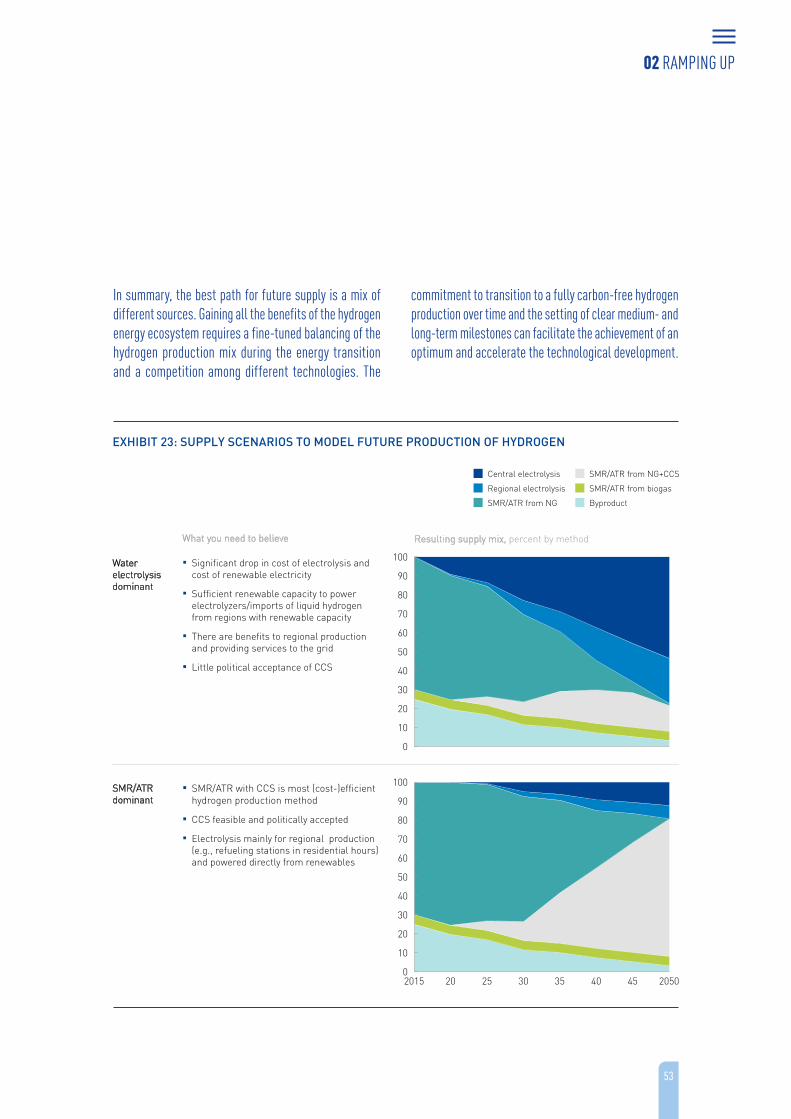
53
70
60
20
10
0
100
30
40
50
80
90
452015 20 25 3530 40 2050
Central electrolysis
SMR/ATR from NG
Regional electrolysis
SMR/ATR from NG+CCS
SMR/ATR from biogas
Byproduct
70
60
0
40
10
30
20
50
80
90
100
What you need to believe
▪ SMR/ATR with CCS is most (cost-)efficient hydrogen production method
▪ CCS feasible and politically accepted
▪ Electrolysis mainly for regional production (e.g., refueling stations in residential hours) and powered directly from renewables
▪ Significant drop in cost of electrolysis and cost of renewable electricity
▪ Sufficient renewable capacity to power electrolyzers/imports of liquid hydrogen from regions with renewable capacity
▪ There are benefits to regional production and providing services to the grid
▪ Little political acceptance of CCS
Resulting supply mix, percent by method
EXHIBIT 23: SUPPLY SCENARIOS TO MODEL FUTURE PRODUCTION OF HYDROGEN
Water electrolysis dominant
SMR/ATR dominant
In summary, the best path for future supply is a mix of different sources. Gaining all the benefits of the hydrogen energy ecosystem requires a fine-tuned balancing of the hydrogen production mix during the energy transition and a competition among different technologies. The
commitment to transition to a fully carbon-free hydrogen production over time and the setting of clear medium- and long-term milestones can facilitate the achievement of an optimum and accelerate the technological development.
02 RAMPING UP
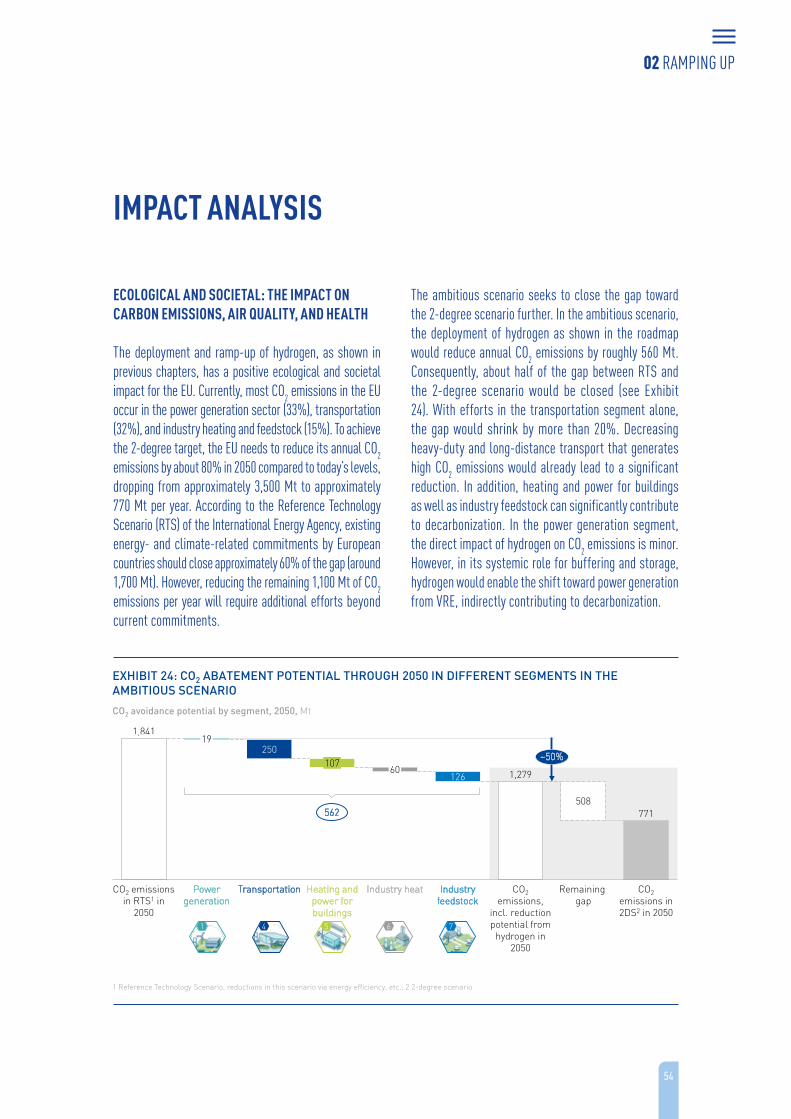
54
ECOLOGICAL AND SOCIETAL: THE IMPACT ON CARBON EMISSIONS, AIR QUALITY, AND HEALTH
The deployment and ramp-up of hydrogen, as shown in previous chapters, has a positive ecological and societal impact for the EU. Currently, most CO2 emissions in the EU occur in the power generation sector (33%), transportation (32%), and industry heating and feedstock (15%). To achieve the 2-degree target, the EU needs to reduce its annual CO2 emissions by about 80% in 2050 compared to today’s levels, dropping from approximately 3,500 Mt to approximately 770 Mt per year. According to the Reference Technology Scenario (RTS) of the International Energy Agency, existing energy- and climate-related commitments by European countries should close approximately 60% of the gap (around 1,700 Mt). However, reducing the remaining 1,100 Mt of CO2 emissions per year will require additional efforts beyond current commitments.
The ambitious scenario seeks to close the gap toward the 2-degree scenario further. In the ambitious scenario, the deployment of hydrogen as shown in the roadmap would reduce annual CO2 emissions by roughly 560 Mt. Consequently, about half of the gap between RTS and the 2-degree scenario would be closed (see Exhibit 24). With efforts in the transportation segment alone, the gap would shrink by more than 20%. Decreasing heavy-duty and long-distance transport that generates high CO2 emissions would already lead to a significant reduction. In addition, heating and power for buildings as well as industry feedstock can significantly contribute to decarbonization. In the power generation segment, the direct impact of hydrogen on CO2 emissions is minor. However, in its systemic role for buffering and storage, hydrogen would enable the shift toward power generation from VRE, indirectly contributing to decarbonization.
250
126
Industry heatCO2 emissions in RTS1 in
2050
CO2emissions in 2DS2 in 2050
60
19
508
Power generation
Transportation
107
Heating and power for buildings
Industry feedstock
CO2emissions,
incl. reduction potential from
hydrogen in 2050
Remaining gap
1,841
1,279
771
~50%
CO2 avoidance potential by segment, 2050, Mt
562
4 65 71
1 Reference Technology Scenario, reductions in this scenario via energy efficiency, etc.; 2 2-degree scenario
EXHIBIT 24: CO2 ABATEMENT POTENTIAL THROUGH 2050 IN DIFFERENT SEGMENTS IN THE AMBITIOUS SCENARIO
IMPACT ANALYSIS
02 RAMPING UP
250
126
Industry heatCO2 emissions in RTS1 in
2050
CO2emissions in 2DS2 in 2050
60
19
508
Power generation
Transportation
107
Heating and power for buildings
Industry feedstock
CO2emissions,
incl. reduction potential from
hydrogen in 2050
Remaining gap
1,841
1,279
771
~50%
CO2 avoidance potential by segment, 2050, Mt
562
4 65 71
1 Reference Technology Scenario, reductions in this scenario via energy efficiency, etc.; 2 2-degree scenario
EXHIBIT 24: CO2 ABATEMENT POTENTIAL THROUGH 2050 IN DIFFERENT SEGMENTS IN THE AMBITIOUS SCENARIO
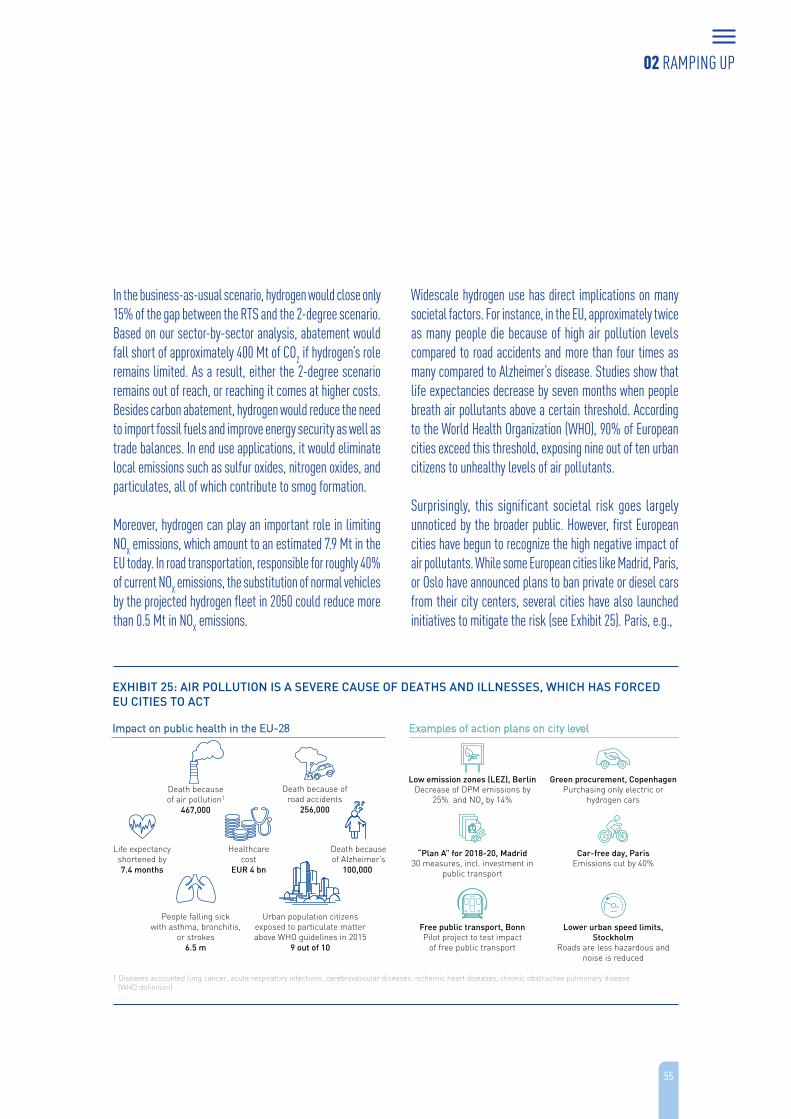
55
In the business-as-usual scenario, hydrogen would close only 15% of the gap between the RTS and the 2-degree scenario. Based on our sector-by-sector analysis, abatement would fall short of approximately 400 Mt of CO2 if hydrogen’s role remains limited. As a result, either the 2-degree scenario remains out of reach, or reaching it comes at higher costs. Besides carbon abatement, hydrogen would reduce the need to import fossil fuels and improve energy security as well as trade balances. In end use applications, it would eliminate local emissions such as sulfur oxides, nitrogen oxides, and particulates, all of which contribute to smog formation.
Moreover, hydrogen can play an important role in limiting NOX emissions, which amount to an estimated 7.9 Mt in the EU today. In road transportation, responsible for roughly 40% of current NOX emissions, the substitution of normal vehicles by the projected hydrogen fleet in 2050 could reduce more than 0.5 Mt in NOX emissions.
Widescale hydrogen use has direct implications on many societal factors. For instance, in the EU, approximately twice as many people die because of high air pollution levels compared to road accidents and more than four times as many compared to Alzheimer’s disease. Studies show that life expectancies decrease by seven months when people breath air pollutants above a certain threshold. According to the World Health Organization (WHO), 90% of European cities exceed this threshold, exposing nine out of ten urban citizens to unhealthy levels of air pollutants.
Surprisingly, this significant societal risk goes largely unnoticed by the broader public. However, first European cities have begun to recognize the high negative impact of air pollutants. While some European cities like Madrid, Paris, or Oslo have announced plans to ban private or diesel cars from their city centers, several cities have also launched initiatives to mitigate the risk (see Exhibit 25). Paris, e.g.,
1 Diseases accounted lung cancer, acute respiratory infections, cerebrovascular diseases, ischemic heart diseases, chronic obstructive pulmonary disease (WHO definition)
Death because of road accidents
256,000
Death because of air pollution1
467,000
Death because of Alzheimer’s
100,000
Green procurement, Copenhagen Purchasing only electric or
hydrogen cars
Low emission zones (LEZ), Berlin Decrease of DPM emissions by
25% and NOx by 14%
People falling sick with asthma, bronchitis,
or strokes6.5 m
Healthcarecost
EUR 4 bn
Car-free day, Paris Emissions cut by 40%
“Plan A” for 2018-20, Madrid 30 measures, incl. investment in
public transport
Life expectancyshortened by7.4 months
Urban population citizens exposed to particulate matter above WHO guidelines in 2015
9 out of 10
Lower urban speed limits, Stockholm
Roads are less hazardous and noise is reduced
Free public transport, Bonn Pilot project to test impact
of free public transport
EXHIBIT 25: AIR POLLUTION IS A SEVERE CAUSE OF DEATHS AND ILLNESSES, WHICH HAS FORCED EU CITIES TO ACT
Impact on public health in the EU-28 Examples of action plans on city level
02 RAMPING UP
56
02 RAMPING UP
has declared one day each year “car free,” thus cutting NOX emissions by 40% that day. Also, Madrid and Bonn are currently rolling out projects to foster public transportation and its positive effects on traffic, emission, and air pollution reduction.
Substituting hydrogen for more conventional fuels would also reduce other nuisances, such as noise pollution in cities and water pollution in lakes, rivers, and ports.
ECONOMICS: THE ROLE OF HYDROGEN AND FUEL CELL TECHNOLOGY IN THE GLOBAL COMPETITIVENESS OF EUROPE’S INDUSTRY
Besides the ecological and societal impact, the deployment of hydrogen will create additional revenues and jobs for the European market. Moreover, the EU could retain its position as a leader in technology if it focuses on its industries’ strengths and capabilities.
The energy transition will fundamentally alter value chains in all industries. New skills, capital, and raw materials will be required. While some of these shifts are new economic opportunities, others pose serious threats to the European industrial landscape.
One shift of particular importance is happening in the automotive industry. The automotive industry currently employs around 2.5 million people in Europe directly and 10.8 million people indirectly.16 As the value creation in automotive shifts away from the powertrain towards energy storage – 30% of a passenger car’s value – so do jobs and investments. As Europe lags behind in battery technology, it faces a serious threat to lose a major part of its competitive position in the automotive industry.
16 ACEA (2018)
In hydrogen and fuel cells, the European industry consists of world-class players along the value chain. European companies have strongly invested in research and development, provide leading technology solutions and are renowned for their fuel cells across the world. If Europe remains at the forefront of this development, European players will be able to retain global market shares.
REQUIRED INVESTMENTS
To realize the roadmap laid out in the ambitious scenario, an investment of roughly EUR 60 billion would be required by 2030 (see Exhibit 26). This includes both investments in infrastructure, as well as investments into RD&D and new production facilities along the value chain, including component suppliers, specialized materials, and end use applications, such as the development of fuel cell vehicles and CHPs or retrofitting of industry heat equipment.
About 40% of these investments would flow into the setup of infrastructure and equipment for hydrogen production and distribution, mostly into hydrogen production plants such as electrolyzers and SMR plants. Approximately 25% of the investments through 2030 would be required for hydrogen distribution and retail in transportation, heating for buildings and industry, with approximately EUR 8 billion for hydrogen refueling infrastructure for transport.
About 15% of investments would go to the development of new fuel cell electric vehicles and nonroad trans-portation as well as the respective capex for production lines. In addition, aftermarket services and new businesses would require 7% of the investments through 2030 to set up equipment and processes.
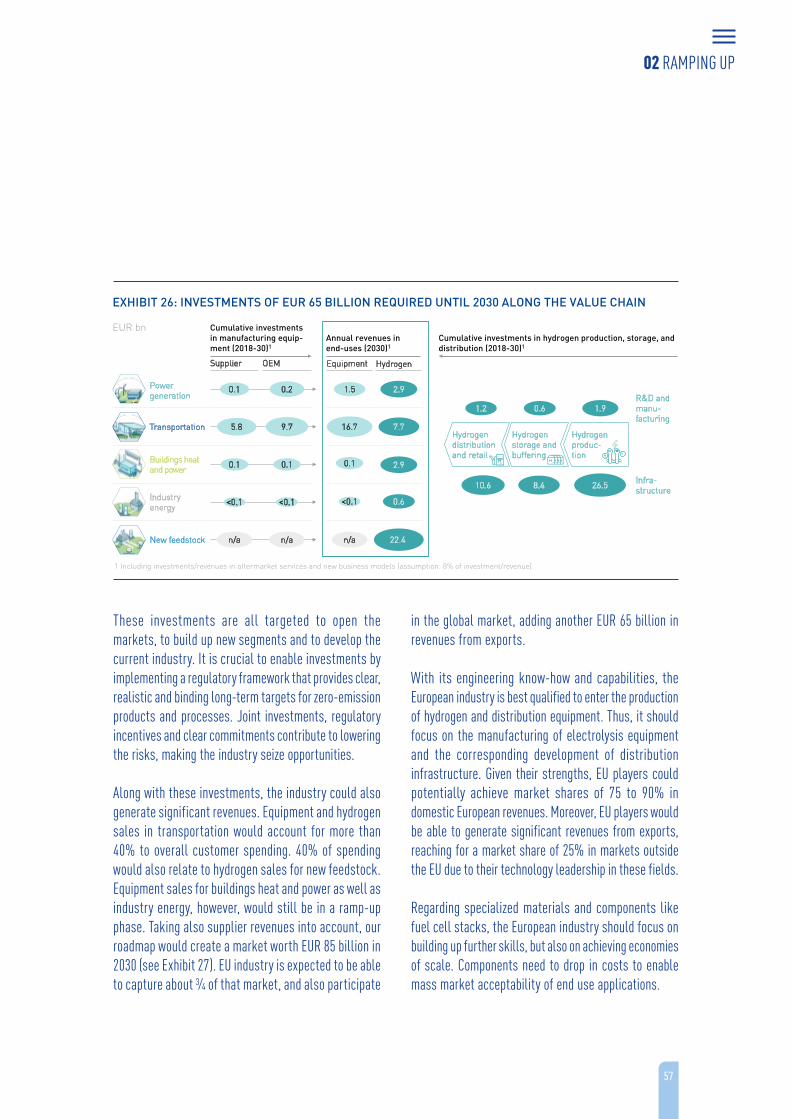
57
These investments are all targeted to open the markets, to build up new segments and to develop the current industry. It is crucial to enable investments by implementing a regulatory framework that provides clear, realistic and binding long-term targets for zero-emission products and processes. Joint investments, regulatory incentives and clear commitments contribute to lowering the risks, making the industry seize opportunities.
Along with these investments, the industry could also generate significant revenues. Equipment and hydrogen sales in transportation would account for more than 40% to overall customer spending. 40% of spending would also relate to hydrogen sales for new feedstock. Equipment sales for buildings heat and power as well as industry energy, however, would still be in a ramp-up phase. Taking also supplier revenues into account, our roadmap would create a market worth EUR 85 billion in 2030 (see Exhibit 27). EU industry is expected to be able to capture about ¾ of that market, and also participate
in the global market, adding another EUR 65 billion in revenues from exports.
With its engineering know-how and capabilities, the European industry is best qualified to enter the production of hydrogen and distribution equipment. Thus, it should focus on the manufacturing of electrolysis equipment and the corresponding development of distribution infrastructure. Given their strengths, EU players could potentially achieve market shares of 75 to 90% in domestic European revenues. Moreover, EU players would be able to generate significant revenues from exports, reaching for a market share of 25% in markets outside the EU due to their technology leadership in these fields.
Regarding specialized materials and components like fuel cell stacks, the European industry should focus on building up further skills, but also on achieving economies of scale. Components need to drop in costs to enable mass market acceptability of end use applications.
Annual revenues in end-uses (2030)1
OEMSupplier
Cumulative investments in manufacturing equip-ment (2018-30)1
Equipment Hydrogen
5.8 9.7Transportation 16.7 7.7
n/a n/aNew feedstock n/a 22.4
Industry energy
0.6<0.1<0.1 <0.1
2.90.10.1 0.1Buildings heat and power
1.5 2.90.1 0.2Power generation
Cumulative investments in hydrogen production, storage, and distribution (2018-30)1
EUR bn
1 Including investments/revenues in aftermarket services and new business models (assumption: 8% of investment/revenue)
EXHIBIT 26: INVESTMENTS OF EUR 65 BILLION REQUIRED UNTIL 2030 ALONG THE VALUE CHAIN
Hydrogen distributionand retail
Hydrogen produc-tion
Hydrogen storage and buffering
R&D and manu-facturing
1.2 1.9
Infra-structure10.6 26.58.4
0.6
02 RAMPING UP
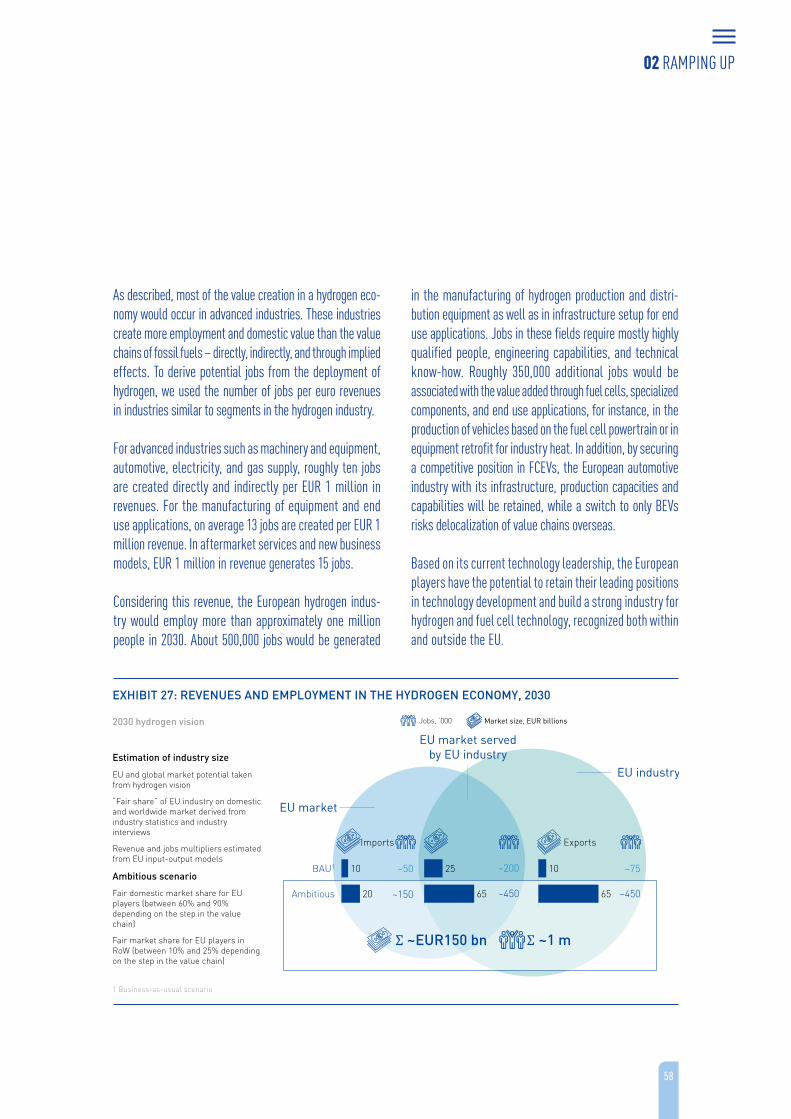
58
As described, most of the value creation in a hydrogen eco-nomy would occur in advanced industries. These industries create more employment and domestic value than the value chains of fossil fuels – directly, indirectly, and through implied effects. To derive potential jobs from the deployment of hydrogen, we used the number of jobs per euro revenues in industries similar to segments in the hydrogen industry.
For advanced industries such as machinery and equipment, automotive, electricity, and gas supply, roughly ten jobs are created directly and indirectly per EUR 1 million in revenues. For the manufacturing of equipment and end use applications, on average 13 jobs are created per EUR 1 million revenue. In aftermarket services and new business models, EUR 1 million in revenue generates 15 jobs.
Considering this revenue, the European hydrogen indus- try would employ more than approximately one million people in 2030. About 500,000 jobs would be generated
in the manufacturing of hydrogen production and distri- bution equipment as well as in infrastructure setup for end use applications. Jobs in these fields require mostly highly qualified people, engineering capabilities, and technical know-how. Roughly 350,000 additional jobs would be associated with the value added through fuel cells, specialized components, and end use applications, for instance, in the production of vehicles based on the fuel cell powertrain or in equipment retrofit for industry heat. In addition, by securing a competitive position in FCEVs, the European automotive industry with its infrastructure, production capacities and capabilities will be retained, while a switch to only BEVs risks delocalization of value chains overseas.
Based on its current technology leadership, the European players have the potential to retain their leading positions in technology development and build a strong industry for hydrogen and fuel cell technology, recognized both within and outside the EU.
02 RAMPING UP
Exports
EU market
Imports
EU industry
BAU1
Ambitious
10
20
25
65 65
10
Estimation of industry size
Market size, EUR billionsJobs, ‘000
EU market served by EU industry
~150 ~450 ~450
~200 ~75~50
Σ ~EUR150 bn Σ ~1 m
2030 hydrogen vision
1 Business-as-usual scenario
EXHIBIT 27: REVENUES AND EMPLOYMENT IN THE HYDROGEN ECONOMY, 2030
EU and global market potential taken from hydrogen vision
“Fair share” of EU industry on domestic and worldwide market derived from industry statistics and industry interviews
Revenue and jobs multipliers estimated from EU input-output models
Ambitious scenario
Fair domestic market share for EU players (between 60% and 90% depending on the step in the value chain)
Fair market share for EU players in RoW (between 10% and 25% depending on the step in the value chain)
59
03ACTING NOWIndustry, investors, and policymakers must act together to realize the hydrogen roadmap in the EU
60
MOTIVATION
The hydrogen vision outlined in this report offers many economic, environmental, and societal benefits to the EU. Making it a reality will require a major transition in how the EU produces, transports, and consumes energy, implying major changes across sectors. This transition will not happen by itself as it will require joint, synchronized efforts by policymakers, industry players, and investors, and substantial yet achievable investments. During the scale-up of the industry in the years leading to 2030, we estimate annual investments of about EUR 8 billion across the EU.
As of today, there is no comprehensive “masterplan of decarbonization” for the EU. Industry players believe this is an urgent item that the EU must address to coordinate the different activities, achieve a clear agreement, and consider the interdependencies of different elements in such a strategy.
The region has unique assets that position the EU in the pole position with just a few other economies (Japan, Korea, the US, China). First, it has world-class players along the hydrogen and fuel cell value chains that can lead the development and deployment of hydrogen solutions. In the automotive space, in trucks and buses, but also in stationary fuel cell applications, domestic technology is readily available. Several large industry players possess leading technology for HRS and infrastructure as well as hydrogen production and distribution equipment. Another asset is the already growing fuel cell market in the EU. The industry shipped twice as many fuel cells (in terms of capacity) in 2016 as in 2015. In 2016, it shipped 500 MW of FCs with the majority targeting stationary and transportation applications. Leading hydrogen technologies have a large potential to boost the economy, create jobs, and strengthen Europe’s competitiveness.
Second, the region has a strong EU-wide research program with the FCH JU, which has invested EUR 844 million in more than 220 research and educational projects between
2008 and today.17 Also, individual countries are implementing effective national programs, most notably the German NIP2, which aims to invest EUR 250 million from 2017 to 2019.18
Third, the EU is committed to achieving its environmental targets. Cutting its emissions substantially by 2050 – by 80 to 95% compared to 1990 levels19 – is a priority communicated by the European Commission and considered part of the efforts required by developed countries as a group. The EU aims to turn the region into a highly energy-efficient and low-carbon economy. Environmental consciousness tops the political agenda and environmental awareness is high among citizens.
Fourth, the EU has another asset that is key to a large, immediate scaleup: its extensive natural gas network, which powers 90 million households and stores as much as 4,400 TWh of energy. When blended at 5% energy content, it already provides a buffer of 220 TWh, without major upgrades. The EU also has an established sector of gas infrastructure developers and operators that employ over 500,000 people.
At the same time, the region faces barriers, most notably the lack of a coherent, explicit, and long-term strategy for the role of hydrogen in the energy transition; a lack of awareness of its potential; and a lack of instruments to secure early, large-scale deployment investments leading to the hesitation of investors to commit capital.
Other countries are aggressively pursuing hydrogen and fuel cell technologies. China, Japan, and South Korea have established national plans for the development of markets and an industry and have made significant advances. For instance, the three countries issue far more patents every
17 FCH JU (2018)
18 NOW (2017)
19 EU Commission (2011)
03 ACTING NOW
61
year concerning hydrogen and fuel cell technologies than the EU. While EU countries issue only about 16% of the total patents, these three countries account for more than 55% of all worldwide patents regarding fuel cells and over 65% of all hydrogen-related patents.
China has explicitly defined hydrogen and fuel cells as key technologies for development, which means it supports hydrogen not only for environmental reasons, but also with the specific objective of building a leading hydrogen economy, targeting exports of products and services as well. By 2050, China wants to produce 10 million FC passenger cars, trams, and buses and create a comprehensive HRS network. Its aims for 2030 include erecting more than 1,000 HRS across the country. The nation’s commitment to this goal includes the installation of the world’s largest PEM electrolyzer plant, slated for producing carbon-free hydrogen from renewable sources.
Driven by subsidies, thanks to ambitious support of deployment as part of an industrial policy to develop a competitive domestic industry, China already has the largest market for hydrogen vehicles today, producing roughly 80% of global fuel cell trucks and buses. It also offers the largest subsidies to customers, which range from approximately EUR 37,000 to 75,000 for hydrogen trucks and buses. Furthermore, three municipalities (Shanghai, Wuhan, and Suzhou) have explicit regional hydrogen development plans that supplement the national ones.
South Korea has also set ambitious goals for eventually dominating the FCEV market. To reach this target, the government and other public and private actors are investing approximately EUR 2 billion to bring 15,000 FCEVs and 1,000 fuel cell buses to the streets, building over 300 HRS and creating 3,800 jobs, all by 2022. In
addition, the country supports pilot projects to convert excess power from renewables into carbon-free hydrogen.
Japan is pursuing the vision of a hydrogen society with a strategic roadmap that runs through 2040 to be consistently rolled out. This comprehensive approach includes all the segments addressed in this study – power systems, transportation, buildings, and industry. The country aims to put in place more than 900 HRS, 800,000 FCEVs on the streets and 5.3 million CHP units in homes by 2030.
In the US, California is taking a rather pragmatic short-term approach. With the California Fuel Cell Partnership, it established a collaboration of organizations that include auto manufacturers, energy providers, government agencies and fuel cell technology companies. The organizations work together to promote the commercialization of hydrogen fuel cell vehicles, with the ambition to eliminate the chicken-and-egg dilemma between HRS investments and hydrogen demand from road transport.
Consequently, if the EU fails to act now to capitalize on its unique advantages and strong international brands, it will fall behind, risking large market potentials and future jobs. The EU could soon find itself excluded from this relatively interconnected global economy, and the rise of Asian countries could threaten the position and market share of all EU industrial players, most prominently automakers and their local suppliers.
The following recommendations prioritize the most attractive hydrogen applications and tackle the key barriers to their adoption to build a master plan – and an EU-wide roadmap – for the transition to a hydrogen ecosystem. The goal is to start virtuous cycles that can reduce costs and accelerate deployment of hydrogen applications across sectors.
03 ACTING NOW
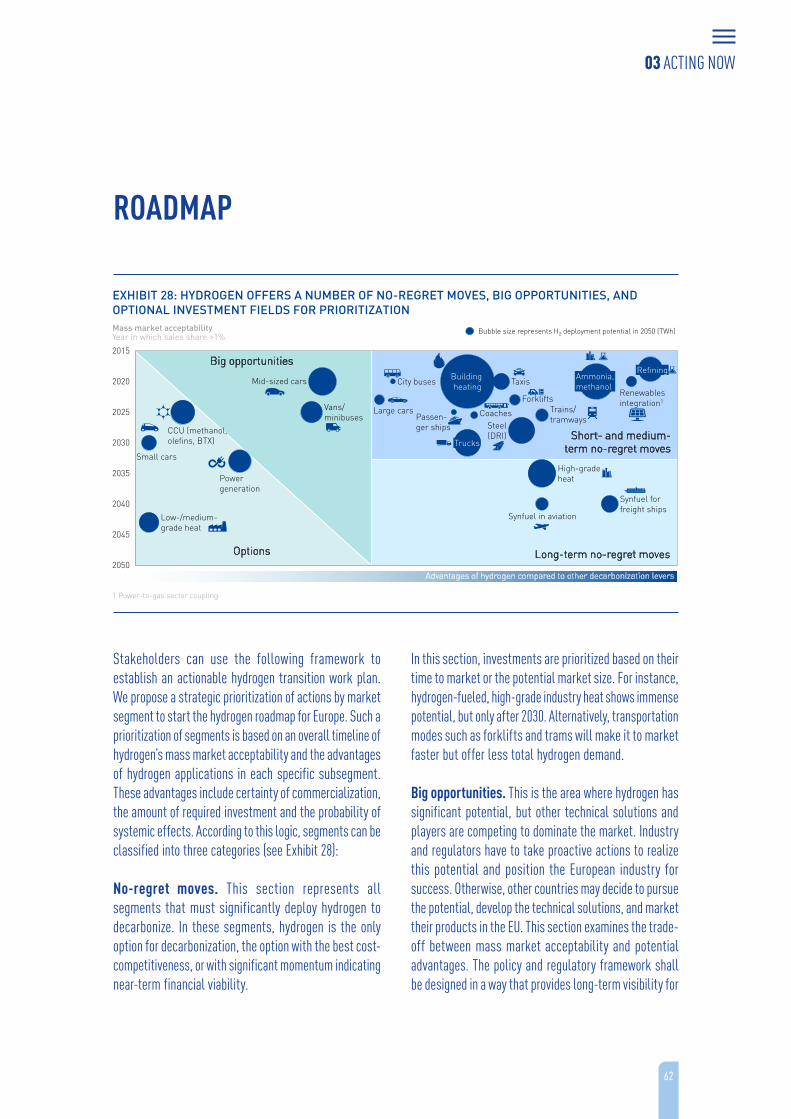
62
Stakeholders can use the following framework to establish an actionable hydrogen transition work plan. We propose a strategic prioritization of actions by market segment to start the hydrogen roadmap for Europe. Such a prioritization of segments is based on an overall timeline of hydrogen’s mass market acceptability and the advantages of hydrogen applications in each specific subsegment. These advantages include certainty of commercialization, the amount of required investment and the probability of systemic effects. According to this logic, segments can be classified into three categories (see Exhibit 28):
No-regret moves. This section represents all segments that must significantly deploy hydrogen to decarbonize. In these segments, hydrogen is the only option for decarbonization, the option with the best cost-competitiveness, or with significant momentum indicating near-term financial viability.
In this section, investments are prioritized based on their time to market or the potential market size. For instance, hydrogen-fueled, high-grade industry heat shows immense potential, but only after 2030. Alternatively, transportation modes such as forklifts and trams will make it to market faster but offer less total hydrogen demand.
Big opportunities. This is the area where hydrogen has significant potential, but other technical solutions and players are competing to dominate the market. Industry and regulators have to take proactive actions to realize this potential and position the European industry for success. Otherwise, other countries may decide to pursue the potential, develop the technical solutions, and market their products in the EU. This section examines the trade-off between mass market acceptability and potential advantages. The policy and regulatory framework shall be designed in a way that provides long-term visibility for
ROADMAP
EXHIBIT 28: HYDROGEN OFFERS A NUMBER OF NO-REGRET MOVES, BIG OPPORTUNITIES, AND OPTIONAL INVESTMENT FIELDS FOR PRIORITIZATION
1 Power-to-gas sector coupling
Bubble size represents H2 deployment potential in 2050 (TWh)Mass market acceptabilityYear in which sales share >1%
Options
Big opportunities
Advantages of hydrogen compared to other decarbonization levers
Long-term no-regret moves
Short- and medium-term no-regret moves
2020
2025
2050
2045
2040
2035
2030
2015
Powergeneration
Synfuel for freight ships
Small cars
Renewablesintegration1
Steel(DRI)
Trains/tramways
Forklifts
Trucks
Mid-sized cars
Large cars
Taxis
Coaches
City buses
Vans/minibuses
Synfuel in aviation
High-gradeheat
CCU (methanol,olefins, BTX)
Low-/medium-grade heat
Building heating
RefiningAmmonia,methanol
Passen-ger ships
03 ACTING NOW

63
market demand for zero-emission products so that fuel cell and hydrogen market players can decide to invest to develop and seize these opportunities. The market for mid-sized cars, e.g., promises huge potential with large positive spillover effects in other subsegments such as small cars. However, with intense competition from Asian OEMs and high investment requirements to provide model variety and availability, automakers need to manage the risk of falling behind international competition very carefully.
Options. This section represents those subsegments in which hydrogen has fewer advantages than competing decarbonization solutions, less total potential in a reasonable timeframe, and a higher risk of having negative spillover effects. Examples include the small car subsegment, where BEVs will offer the main decarbonization choice due to current cost advantages, more mature states of development, governmental support (subsidies), and public acceptance. However, discounting this option would be a great mistake, since it covers substantial European markets.
03 ACTING NOW
64
To make the most out of the roadmap, we recommend that each type of key player begin with the following overarching steps before working on specific subsegment measures. The previous chapters presented a range of hydrogen activities that are already ongoing in the seven segments in the EU. While these projects demonstrate the momentum of hydrogen today, a significant step-up is required to achieve mass market deployment and realize our roadmap. We propose the following actions that involve all stakeholders – regulators, industrial players, and investors.
Overarching recommendations
1. Regulators and industry should jointly set out clear, long-term, realistic, and holistic decarbonization pathways for all sectors and segments. Such pathways should not only set targets for end applications (e.g., emission targets for vehicles or targets for the decarbonization of houses), but also consider the requisite infrastructure for energy generation and distribution. They should also provide credible, long-term guidance for the industry to unlock investments in product development and infrastructure.
2. The European industry should invest in hydrogen and fuel cell technology to remain competitive and positioned to capture emerging opportunities. This would require a long-term perspective on hydrogen and decarbonization, and horizontal as well as vertical alliances to overcome barriers. In the same vein, industry should work closely with regulators to develop a strong home market and value chains within the EU. It should also develop industrial cooperation with players in the fast-accelerating hydrogen and fuel cell markets in Asia (e.g., China, Japan, Korea) to hedge market risk.
Kickstarting deployment across four sectors
3. Regulators and gas companies should begin to decarbonize the gas grid. As forcing mechanisms, they could use binding targets for renewable content in the gas grid or other instruments such as contracts-for-difference (CfDs), feed-in tariffs (FiTs) or investment supports for ultra-low-carbon hydrogen (like e.g., those for biogas). Such a policy faces few significant barriers: blending hydrogen at modest concentrations is compatible with current infrastructure and appliances, would not increase gas prices substantially, reduces the global warming potential of the gas grid and runs no risk of CO2 leakage. However, there is a need to modernize and harmonize regulations that concern hydrogen blending into the natural gas grids, which currently differ across Member States.
4. In the power system, regulators should encourage the use of electrolyzers to balance the grid, e.g., by exempting them from grid fees and ensuring competitive access to renewable power on the market. Similar to the use of FiTs in regular power markets, power balancing markets should include mechanisms to displace CO2-emitting balancing mechanisms (e.g., spinning reserves provided by gas turbines) with green alternatives such as flexible hydrogen production. Regulators and industry should kickstart the development of a decentralized power-to-gas market in Europe, significantly bringing down costs of production while creating a sector coupling mechanism that will benefit the power system by stabilizing prices and dealing with seasonal imbalances. This would also reduce the extent to which required renewables must be curtailed. In the medium- to long-term, stakeholders should develop a framework for seasonal and long-term energy storage.
ACTIONABLE STEPS TO START THE ROADMAP
03 ACTING NOW
6565
5. In transport, regulators should overcome the chicken-and-egg problem by setting out a clear and credible roadmap, developing policies for zero-emission mobility with corresponding funding and guarantee mechanisms to unlock investment in refueling infrastructure. Such a roadmap towards basic coverage across the EU would provide the signal to car companies and their suppliers to scale up the production of FCEVs, leading to significant cost reductions and greater consumer choice. It would also industrialize the manufacturing of HRS, leading to lower costs for hydrogen at the pump.
In parallel to developing the refueling infrastructure, industry should invest in product development and start offering a broader range of FCEVs in the segments most suitable for the technology: trucks, buses, vans, and larger passenger vehicles. Here, industry should cooperate beyond traditional industry barriers and offer solutions, bundling infrastructure, equipment, and maintenance. Regulators should encourage such investments by providing incentives, such as the public procurement of FCEV buses, the implementation of fleet regulations for truck, coach, and taxi operators, and nonmonetary incentives for FCEV drivers.
6. In industry, stakeholders should kickstart the transition from grey to low-carbon hydrogen and further substitution of fossil fuels with new hydrogen usages. Regulators should ensure carbon-free hydrogen production counts towards renewable targets (e.g., as set out by Renewable Energy Directive II for refining) and low carbon targets are set across all major uses of hydrogen (e.g., in ammonia production). Such a transition would create a significant step-change in hydrogen production technology in terms of scale and costs, making hydrogen solutions more attractive not only for industry, but also in other sectors.
Building the ultra-low-carbon hydrogen production supply system
7. To produce ultra-low-carbon hydrogen on a large scale, companies should enlarge their electrolysis operations to commercial levels and prove CCS can produce hydrogen of very low carbon intensity on a large scale within the next ten years. The above-mentioned targets for carbon-free hydrogen in the gas grid or CfDs/FiTs (see recommendation three) would create the incentive to generate the required investments in the electrolysis industry. Both central production of hydrogen from electrolysis and decentralized solutions providing stability to the grid should be adequately incentivized. Guarantees of Origin (GOs), such as those from the CertifHy project, should be used and embraced by regulation and national policymakers. For SMR with CCS technology, stakeholders should consider supporting industry-scale demonstration projects followed by developing a roadmap for their future deployment.
Supporting and enabling additional hydrogen applications
8. Industry and regulatory stakeholders should continue to develop additional hydrogen and fuel cell applications and plans to scale up successfully proven ones. The recent successes with hydrogen trains, e.g., should be the start of a Europe-wide replacement of diesel trains. In shipping, regulators should establish decarbonization targets for ports, rivers, and lakes in addition to the International Maritime Organization’s target for ocean shipping and support the rollout of hydrogen refueling capacities. Boosting the deployment of mCHPs and CHPs for residential and commercial properties should improve energy efficiency in buildings and make the best use of hydrogen and natural gas.
03 ACTING NOW
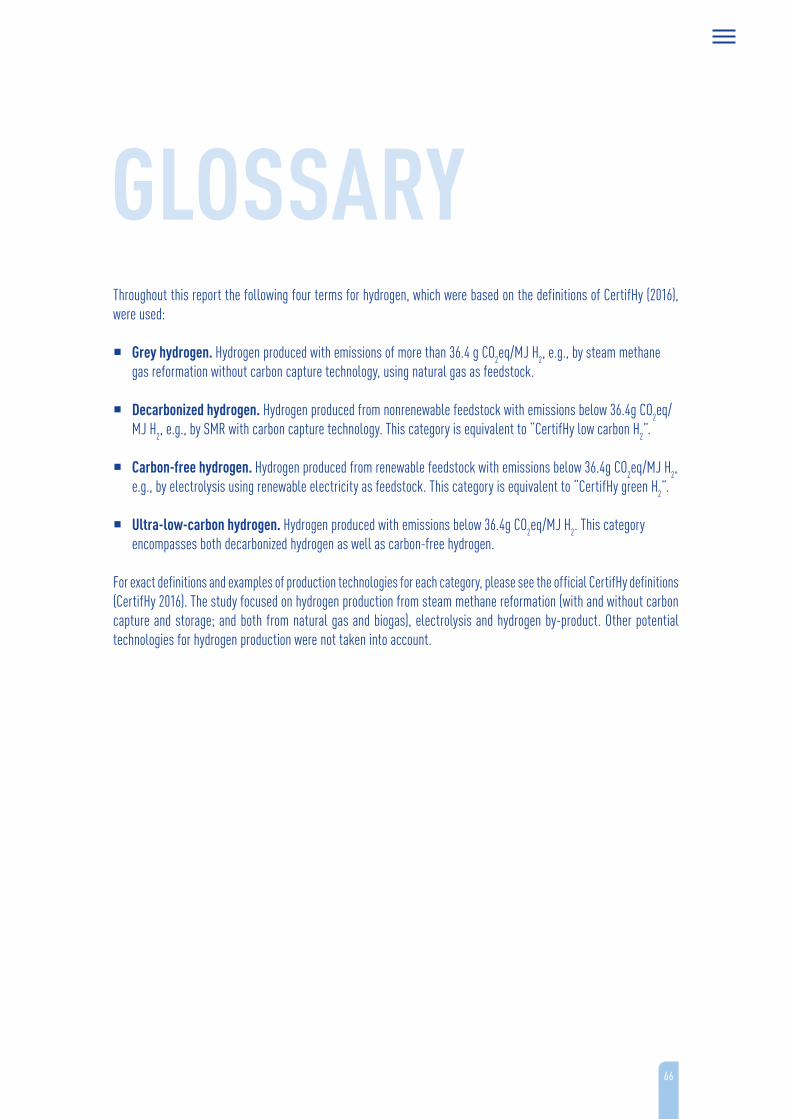
66
Throughout this report the following four terms for hydrogen, which were based on the definitions of CertifHy (2016), were used:
� Grey hydrogen. Hydrogen produced with emissions of more than 36.4 g CO2eq/MJ H2, e.g., by steam methane gas reformation without carbon capture technology, using natural gas as feedstock.
� Decarbonized hydrogen. Hydrogen produced from nonrenewable feedstock with emissions below 36.4g CO2eq/MJ H2, e.g., by SMR with carbon capture technology. This category is equivalent to “CertifHy low carbon H2”.
� Carbon-free hydrogen. Hydrogen produced from renewable feedstock with emissions below 36.4g CO2eq/MJ H2, e.g., by electrolysis using renewable electricity as feedstock. This category is equivalent to “CertifHy green H2”.
� Ultra-low-carbon hydrogen. Hydrogen produced with emissions below 36.4g CO2eq/MJ H2. This category encompasses both decarbonized hydrogen as well as carbon-free hydrogen.
For exact definitions and examples of production technologies for each category, please see the official CertifHy definitions (CertifHy 2016). The study focused on hydrogen production from steam methane reformation (with and without carbon capture and storage; and both from natural gas and biogas), electrolysis and hydrogen by-product. Other potential technologies for hydrogen production were not taken into account.
GLOSSARY
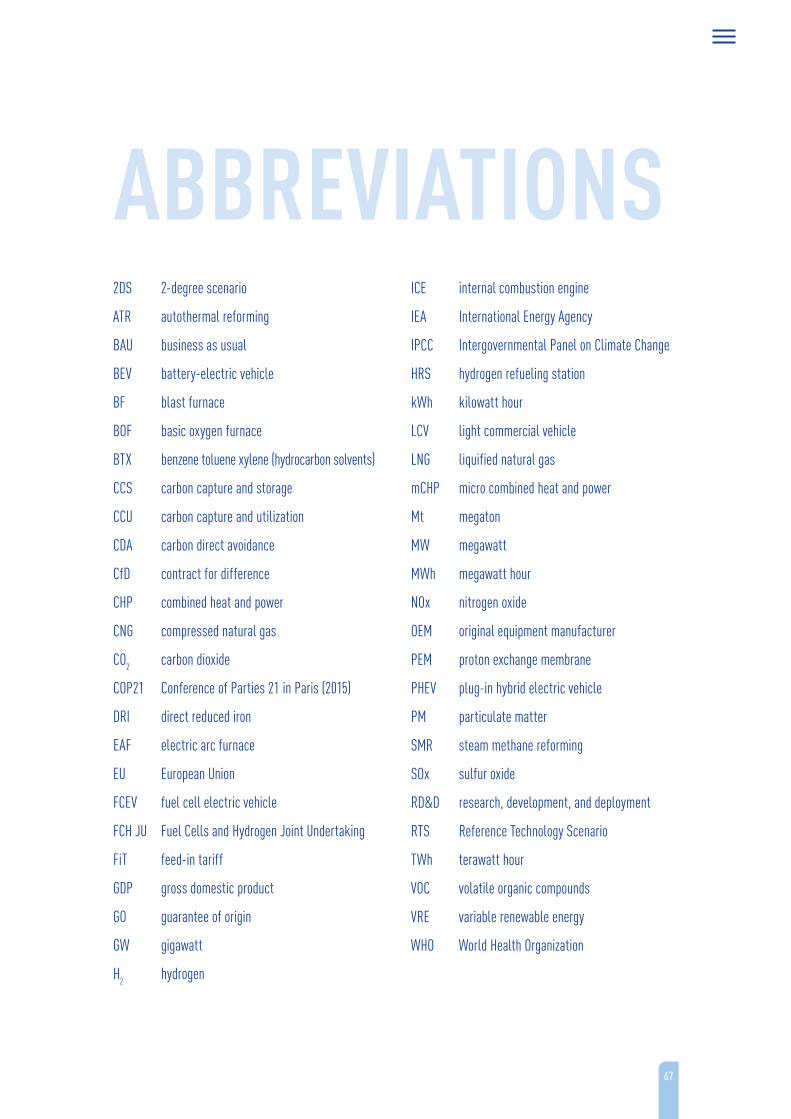
67
ABBREVIATIONS2DS 2-degree scenario
ATR autothermal reforming
BAU business as usual
BEV battery-electric vehicle
BF blast furnace
BOF basic oxygen furnace
BTX benzene toluene xylene (hydrocarbon solvents)
CCS carbon capture and storage
CCU carbon capture and utilization
CDA carbon direct avoidance
CfD contract for difference
CHP combined heat and power
CNG compressed natural gas
CO2 carbon dioxide
COP21 Conference of Parties 21 in Paris (2015)
DRI direct reduced iron
EAF electric arc furnace
EU European Union
FCEV fuel cell electric vehicle
FCH JU Fuel Cells and Hydrogen Joint Undertaking
FiT feed-in tariff
GDP gross domestic product
GO guarantee of origin
GW gigawatt
H2 hydrogen
ICE internal combustion engine
IEA International Energy Agency
IPCC Intergovernmental Panel on Climate Change
HRS hydrogen refueling station
kWh kilowatt hour
LCV light commercial vehicle
LNG liquified natural gas
mCHP micro combined heat and power
Mt megaton
MW megawatt
MWh megawatt hour
NOx nitrogen oxide
OEM original equipment manufacturer
PEM proton exchange membrane
PHEV plug-in hybrid electric vehicle
PM particulate matter
SMR steam methane reforming
SOx sulfur oxide
RD&D research, development, and deployment
RTS Reference Technology Scenario
TWh terawatt hour
VOC volatile organic compounds
VRE variable renewable energy
WHO World Health Organization

68
BIBLIOGRAPHYAalborg Universitet (2018): Heat Roadmap Europe 4: Quantifying the Impact of Low-Carbon Heating and Cooling Roadmaps
ACEA (2018): Employment Trends in the EU Auto Industry
Ausfelder, F.; Bazzanella, A. (2016): Hydrogen in the Chemical Industry, published in Hydrogen Science and Engineering: Materials, Processes, Systems and Technology
CertifHy (2016): Developing a European Framework for the Generation of Origin for Green Hydrogen
D’Agostino, D.; Zangheri, P.; Castellazzi L. (2017): Towards Nearly Zero Energy Buildings in Europe: A Focus on Retrofit in Non-Residential Buildings
Dodds, P. et al. (2015): H2 and Fuel Cell Technologies for Heating: A Review
Enerdata (2017): Global Energy & CO2 Database
Enerdata (2018): Prospective Outlook on Long-term Energy Systems (POLES) Model
Enerdata (2018): EnerFuture Global Energy Forecasts Scenarios
Eurogas (2015): Statistical Report
European Commission (2011): A Roadmap for Moving to a Competitive Low Carbon Economy in 2050
European Commission (2012): Global Europe 2050
European Commission (2016): EU Reference Scenario 2016 Energy, Transport and GHG Emissions Trends to 2050
European Commission (2017): Towards the Broadest Use of Alternative Fuels – an Action Plan on Alternative Fuels Infrastructure under Article 10(6) of Directive 2014/94/EU, including the Assessment of National Policy Frameworks under Article 10(2) of Directive 2014/94/EU
European Environment Agency (2018): European Union Emission Inventory Report 1990-2016
Eurostat (2018): Statistics
FCH JU (2010): A Portfolio of Power-Trains for Europe
FCH JU (2018): Beneficiaries and Budget Horizon 2020 (2014-2017)
Forschungszentrum Jülich (2018): Comparative Analysis of Infrastructures: Hydrogen Fueling and Electric Charging of Vehicles
Gillhaus, A. (2007): Natural Gas Storage in Salt Caverns – Present Status, Developments and Future Trends in Europe
Gimeno-Gutiérrez, M.; Lacal-Arántegui, R. (2015): Assessment of the European Potential for Pumped Hydropower Energy Storage Based on Two Existing Reservoirs
69
Gomez Vilchez, J. et al. (2017): Quantifying the Factors Influencing People’s Car Type Choices in Europe
H2stations.org (2018)
Hydrogen Council (2017): Hydrogen Scaling Up – A Sustainable Pathway for the Global Energy Transition
ING (2017): Breakthrough of Electric Vehicle Threatens European Car Industry
International Energy Agency (2017): Energy Technology Perspectives 2017
International Energy Agency (2015): Technology Roadmap Hydrogen and Fuel Cells
IPCC (2018): Global Warming of 1.5 °C
Jones, D. et al. (2018): Hydrogen-enriched Natural Gas as a Domestic fuel: An Analysis Based on Flash-back and Blow-off Limits for Domestic Natural Gas Appliances Within the UK
KPMG (2016): 2050 Energy Scenarios – The UK Gas Networks Role in a 2050 Whole Energy System
Nationale Plattform Elektromobilität (NPE)
National Renewable Energy Laboratory (2013): Blending Hydrogen into Natural Gas Pipeline Networks: A Review of Key Issues
NOW (2017): 250 Million for Hydrogen and Fuel Cells – BMVI Launches New Funding Programme in Transport Area; now-gmbh.de/en/news/press/nip-2
Pöyry (2018): Fully Decarbonising Europe’s Energy System by 2050
Primes (2018): EU Energy System Model to Simulate Energy Consumption and the Energy Supply System
Sansom, R. (2014): Decarbonising Low-Grade Heat for a Low-Carbon Future
Schoenung, S. (2011): Economic Analysis of Large-Scale Hydrogen Storage for Renewable Utility Applications
Sterner, M.; Stadler, I. (2014): Energiespeicher – Bedarf, Technologien, Integration
SusChem (2013): Innovative Chemistry for Energy Efficiency of Buildings in Smart Cities
Stratego (2015): Quantifying the Heating and Cooling Demand in Europe
US Department of Energy (2017): Technical Targets for Hydrogen Production from Electrolysis

Getting in touch with the EU
In person All over the European Union there are hundreds of Europe Direct information centres. You can find the address of the centre nearest you at: europa.eu/european-union/contact_en
On the phone or by email Europe Direct is a service that answers your questions about the European Union. You can contact this service by freephone: 00 800 6 7 8 9 10 11 (certain operators may charge for these calls), at the following standard number: +32 22999696, or by email via: europa.eu/european-union/contact_en
Finding information about the EU
Online Information about the European Union in all the official languages of the EU is available on the Europa website at: europa.eu/european-union/index_en
EU publications You can download or order free and priced EU publications at: publications.europa.eu/en/publications. Multiple copies of free publications may be obtained by contacting Europe Direct or your local information centre (see europa.eu/european-union/contact_en).
EU law and related documents For access to legal information from the EU, including all EU law since 1952 in all the official language versions, go to EUR-Lex at: eur-lex.europa.eu
Open data from the EU The EU Open Data Portal (data.europa.eu/euodp/en) provides access to datasets from the EU. Data can be downloaded and reused for free, for both commercial and noncommercial purposes.