Embed Size (px)
Citation preview
Hydrogen Release BehaviorSandia National Laboratories, Livermore, CA
C. D. MoenW. Houf, G. Evans, R. Schefer, A. Ruggles, J. Zhang,
J. LaChance, W. Winters, S. James, J. Keller,A. Agrawal (U. Alabama), F. Dryer (Princeton)
Vehicle Technologies Annual Merit ReviewMay 22, 2009
Project ID: scs_06_moen
This presentation does not contain any proprietary, confidential, or otherwise restricted information
Sandia is a multiprogram laboratory operated by Sandia Corporation, a Lockheed Martin Company, for the United States Department of Energy under contract DE-AC04-94AL85000
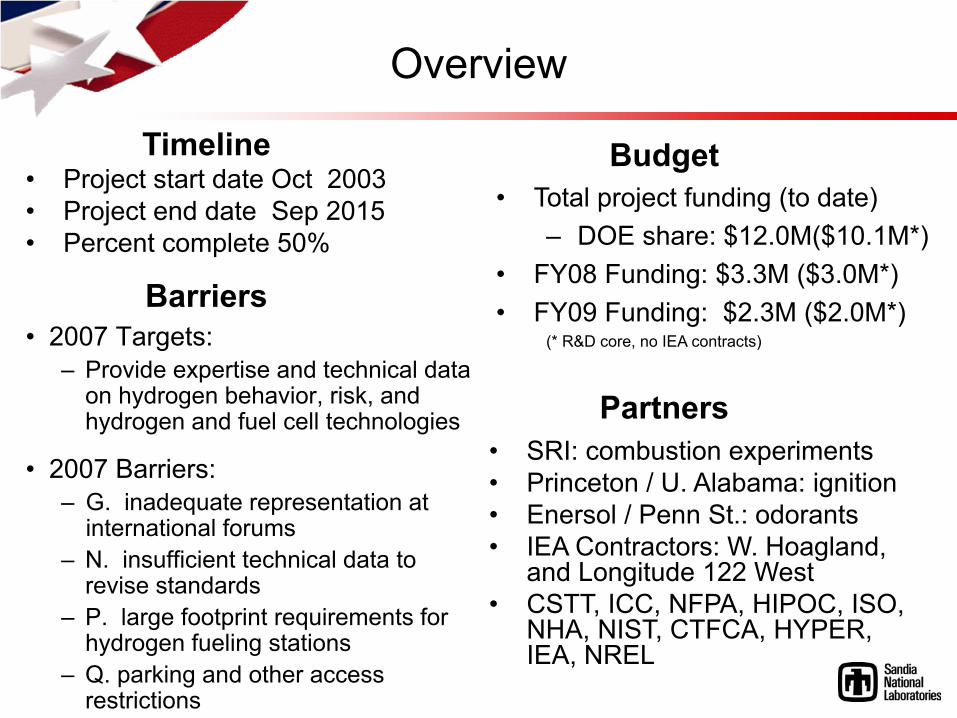
Overview
• Project start date Oct 2003• Project end date Sep 2015• Percent complete 50%
• 2007 Targets:– Provide expertise and technical data
on hydrogen behavior, risk, and hydrogen and fuel cell technologies
• 2007 Barriers:– G. inadequate representation at
international forums – N. insufficient technical data to
revise standards– P. large footprint requirements for
hydrogen fueling stations– Q. parking and other access
restrictions
• Total project funding (to date) – DOE share: $12.0M($10.1M*)
• FY08 Funding: $3.3M ($3.0M*)• FY09 Funding: $2.3M ($2.0M*)
(* R&D core, no IEA contracts)
Timeline Budget
Barriers
• SRI: combustion experiments• Princeton / U. Alabama: ignition• Enersol / Penn St.: odorants• IEA Contractors: W. Hoagland,
and Longitude 122 West• CSTT, ICC, NFPA, HIPOC, ISO,
NHA, NIST, CTFCA, HYPER, IEA, NREL
Partners
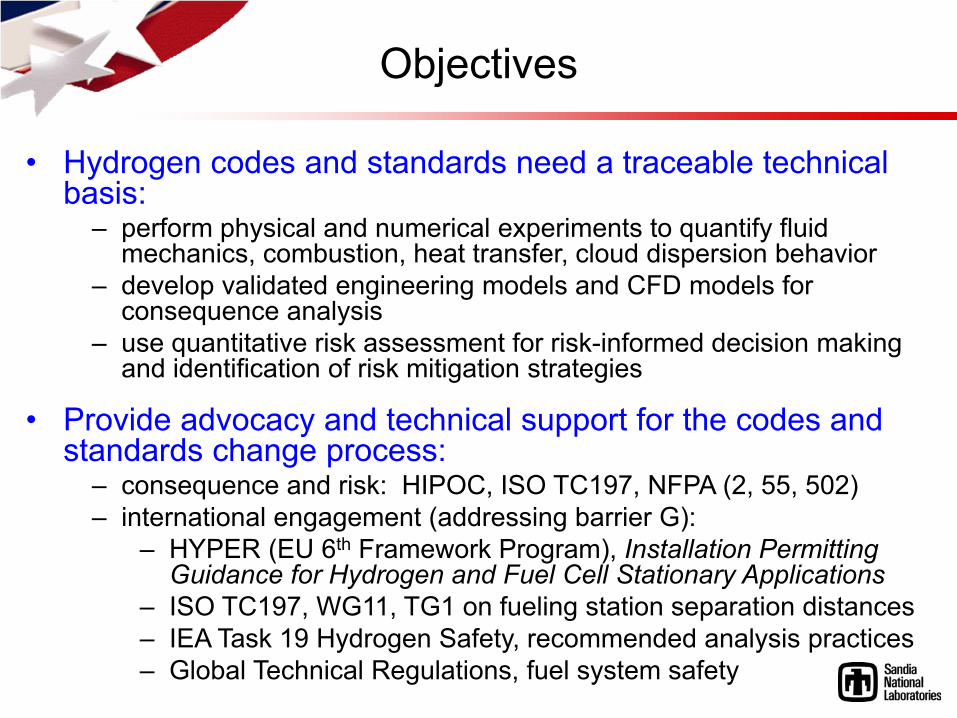
Objectives
• Hydrogen codes and standards need a traceable technical basis:
– perform physical and numerical experiments to quantify fluid mechanics, combustion, heat transfer, cloud dispersion behavior
– develop validated engineering models and CFD models for consequence analysis
– use quantitative risk assessment for risk-informed decision making and identification of risk mitigation strategies
• Provide advocacy and technical support for the codes and standards change process:
– consequence and risk: HIPOC, ISO TC197, NFPA (2, 55, 502)– international engagement (addressing barrier G):
– HYPER (EU 6th Framework Program), Installation Permitting Guidance for Hydrogen and Fuel Cell Stationary Applications
– ISO TC197, WG11, TG1 on fueling station separation distances– IEA Task 19 Hydrogen Safety, recommended analysis practices– Global Technical Regulations, fuel system safety
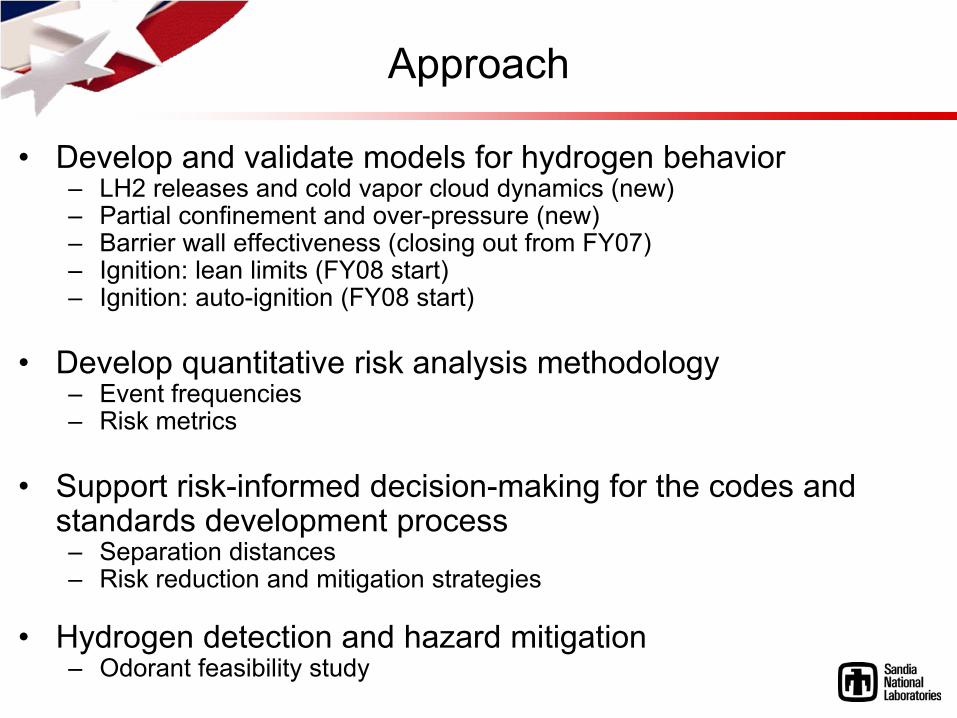
Approach
• Develop and validate models for hydrogen behavior– LH2 releases and cold vapor cloud dynamics (new)– Partial confinement and over-pressure (new)– Barrier wall effectiveness (closing out from FY07)– Ignition: lean limits (FY08 start)– Ignition: auto-ignition (FY08 start)
• Develop quantitative risk analysis methodology– Event frequencies– Risk metrics
• Support risk-informed decision-making for the codes and standards development process– Separation distances– Risk reduction and mitigation strategies
• Hydrogen detection and hazard mitigation– Odorant feasibility study
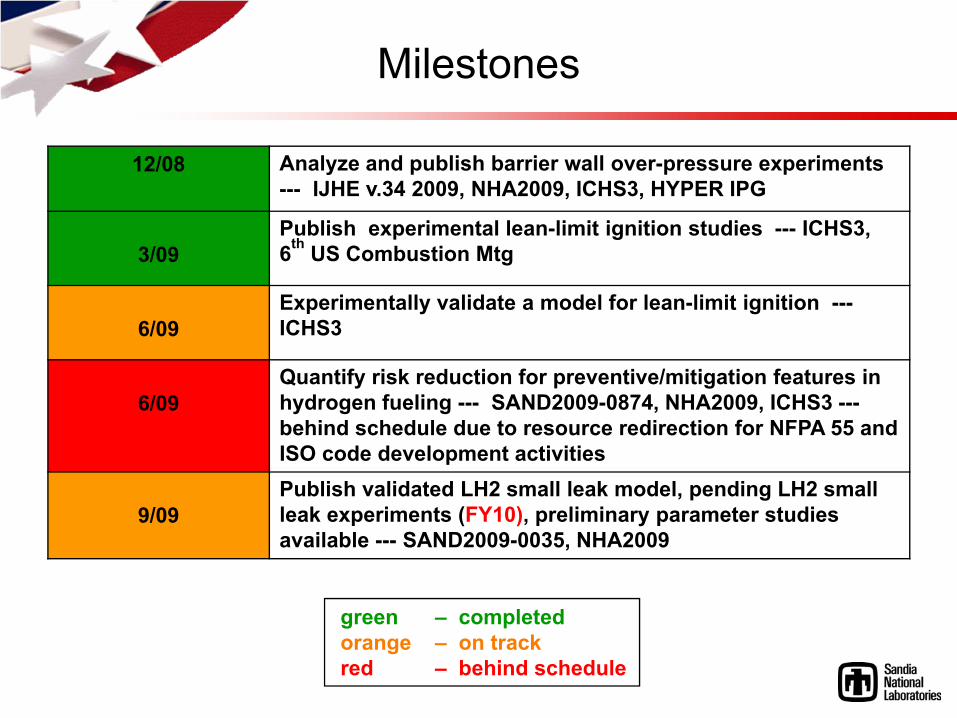
Milestones
12/08 Analyze and publish barrier wall over-pressure experiments --- IJHE v.34 2009, NHA2009, ICHS3, HYPER IPG
3/09Publish experimental lean-limit ignition studies --- ICHS3, 6th US Combustion Mtg
6/09Experimentally validate a model for lean-limit ignition ---ICHS3
6/09Quantify risk reduction for preventive/mitigation features in hydrogen fueling --- SAND2009-0874, NHA2009, ICHS3 ---behind schedule due to resource redirection for NFPA 55 and ISO code development activities
9/09Publish validated LH2 small leak model, pending LH2 small leak experiments (FY10), preliminary parameter studies available --- SAND2009-0035, NHA2009
green – completedorange – on trackred – behind schedule
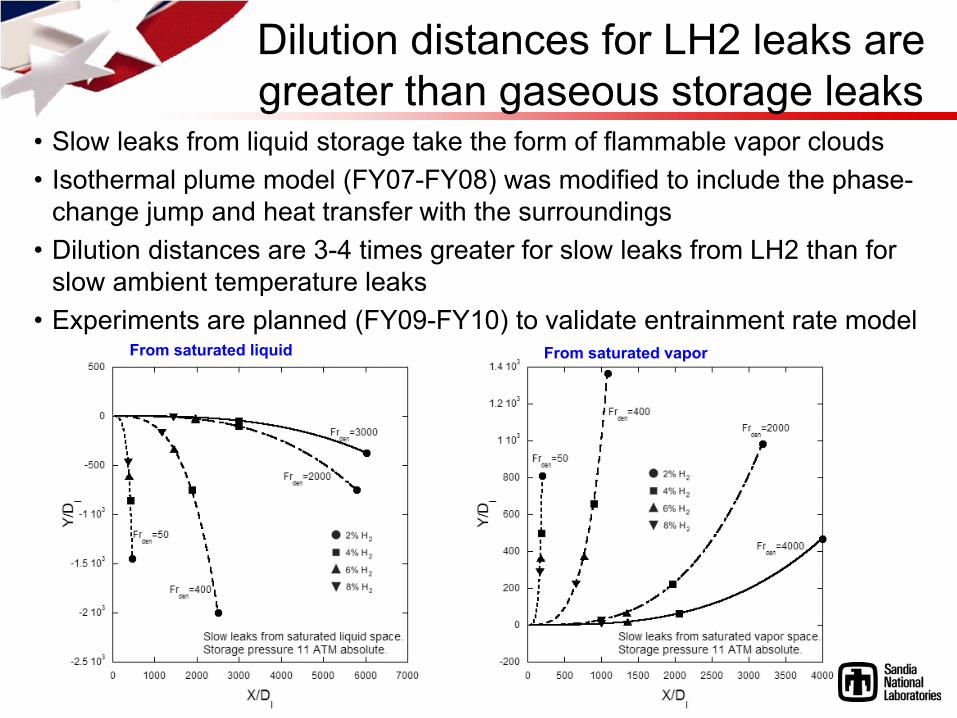
Dilution distances for LH2 leaks are greater than gaseous storage leaks
• Slow leaks from liquid storage take the form of flammable vapor clouds• Isothermal plume model (FY07-FY08) was modified to include the phase-
change jump and heat transfer with the surroundings• Dilution distances are 3-4 times greater for slow leaks from LH2 than for
slow ambient temperature leaks• Experiments are planned (FY09-FY10) to validate entrainment rate model
From saturated liquid From saturated vapor
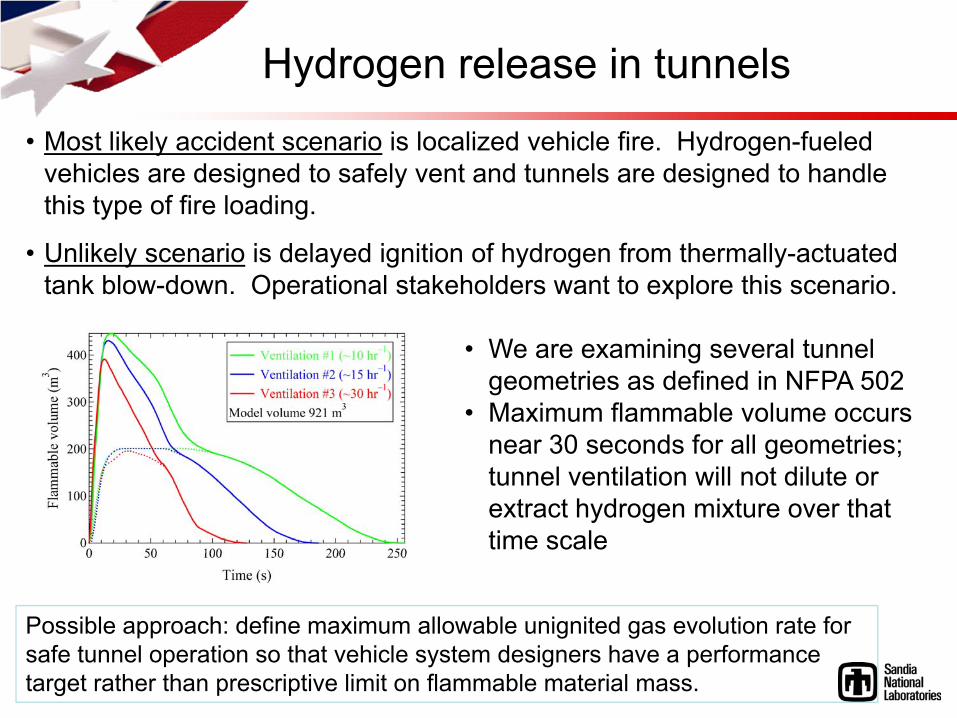
Hydrogen release in tunnels
• Most likely accident scenario is localized vehicle fire. Hydrogen-fueled vehicles are designed to safely vent and tunnels are designed to handle this type of fire loading.
• Unlikely scenario is delayed ignition of hydrogen from thermally-actuated tank blow-down. Operational stakeholders want to explore this scenario.
• We are examining several tunnel geometries as defined in NFPA 502
• Maximum flammable volume occurs near 30 seconds for all geometries; tunnel ventilation will not dilute or extract hydrogen mixture over that time scale
Possible approach: define maximum allowable unignited gas evolution rate for safe tunnel operation so that vehicle system designers have a performance target rather than prescriptive limit on flammable material mass.
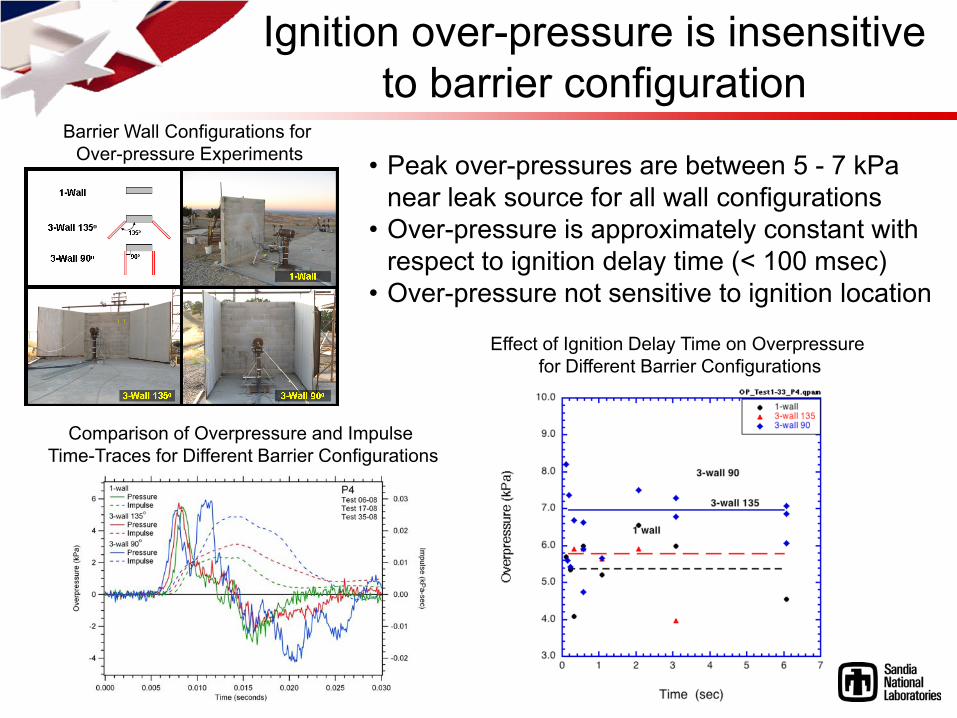
Ignition over-pressure is insensitive to barrier configuration
Barrier Wall Configurations for Over-pressure Experiments
Comparison of Overpressure and ImpulseTime-Traces for Different Barrier Configurations
Effect of Ignition Delay Time on Overpressure for Different Barrier Configurations
• Peak over-pressures are between 5 - 7 kPanear leak source for all wall configurations
• Over-pressure is approximately constant with respect to ignition delay time (< 100 msec)
• Over-pressure not sensitive to ignition location
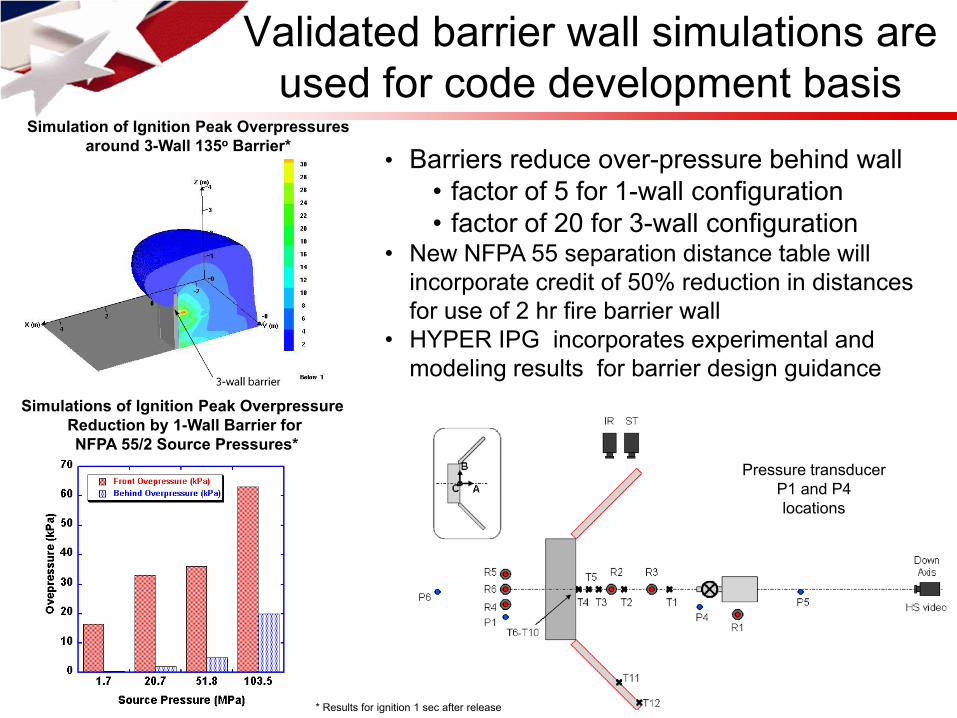
Validated barrier wall simulations are used for code development basis
Simulation of Ignition Peak Overpressuresaround 3-Wall 135o Barrier*
Simulations of Ignition Peak Overpressure Reduction by 1-Wall Barrier forNFPA 55/2 Source Pressures*
• Barriers reduce over-pressure behind wall• factor of 5 for 1-wall configuration• factor of 20 for 3-wall configuration
• New NFPA 55 separation distance table will incorporate credit of 50% reduction in distances for use of 2 hr fire barrier wall
• HYPER IPG incorporates experimental and modeling results for barrier design guidance
* Results for ignition 1 sec after release
Pressure transducer P1 and P4 locations
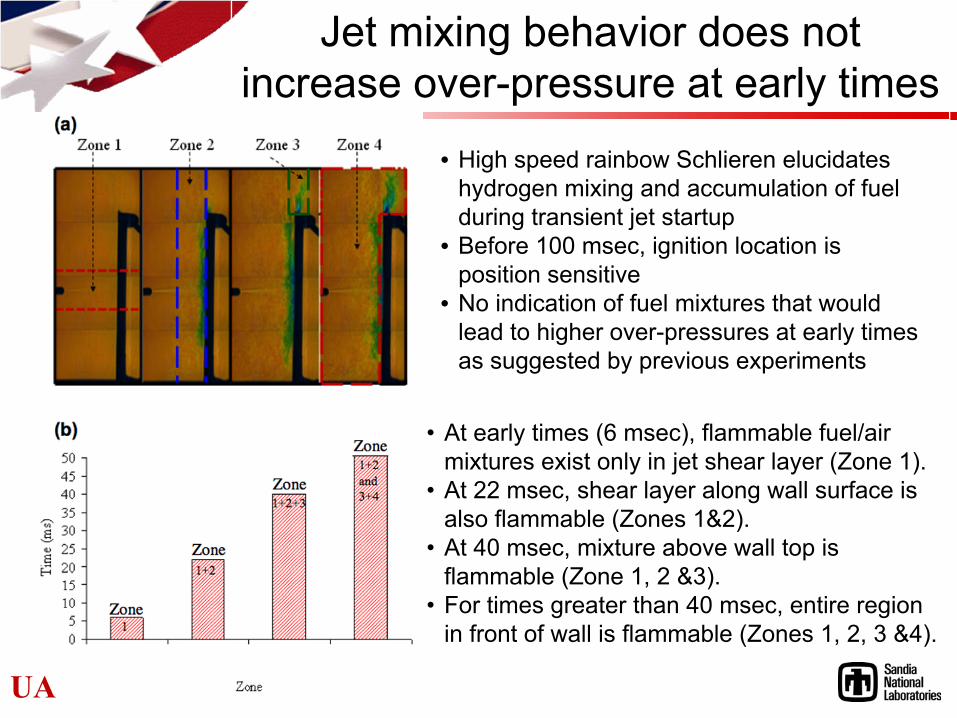
• At early times (6 msec), flammable fuel/air mixtures exist only in jet shear layer (Zone 1).
• At 22 msec, shear layer along wall surface is also flammable (Zones 1&2).
• At 40 msec, mixture above wall top is flammable (Zone 1, 2 &3).
• For times greater than 40 msec, entire region in front of wall is flammable (Zones 1, 2, 3 &4).
• High speed rainbow Schlieren elucidates hydrogen mixing and accumulation of fuel during transient jet startup
• Before 100 msec, ignition location is position sensitive
• No indication of fuel mixtures that would lead to higher over-pressures at early times as suggested by previous experiments
Jet mixing behavior does not increase over-pressure at early times
UA
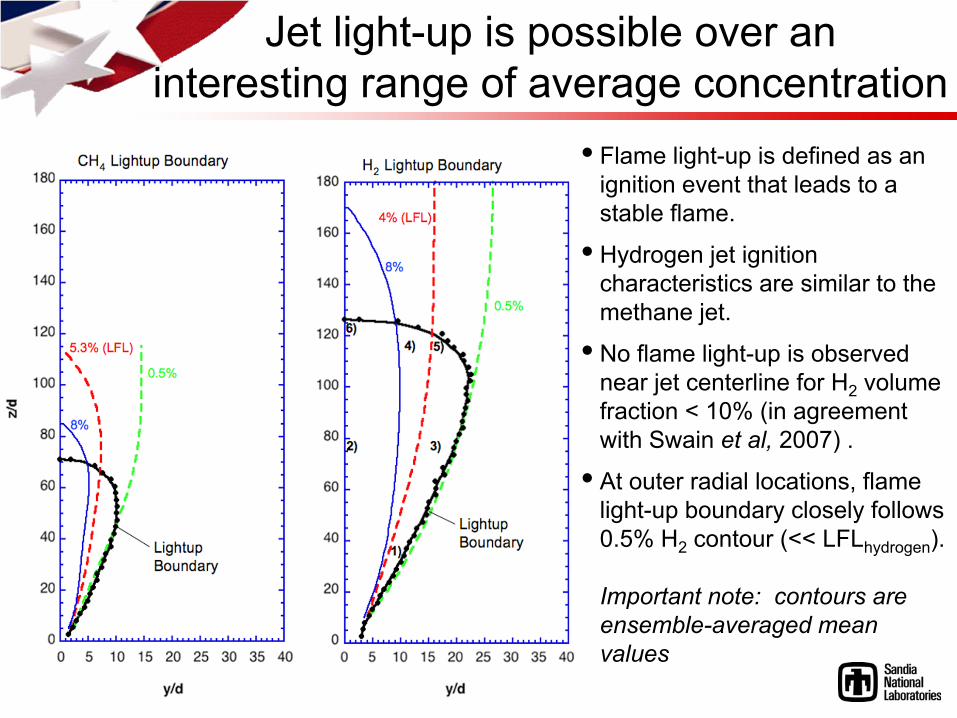
Jet light-up is possible over aninteresting range of average concentration
5
z/D=10
• Flame light-up is defined as an ignition event that leads to a stable flame.
• Hydrogen jet ignition characteristics are similar to the methane jet.
• No flame light-up is observed near jet centerline for H2 volume fraction < 10% (in agreement with Swain et al, 2007) .
• At outer radial locations, flame light-up boundary closely follows 0.5% H2 contour (<< LFLhydrogen).
Important note: contours are ensemble-averaged mean values
Prob
abili
ty
H2 Mole Fraction
PDF(XH2) from Rayleigh
H2 Mole Fraction
Prob
abili
ty
PDF(XH2) for ignition
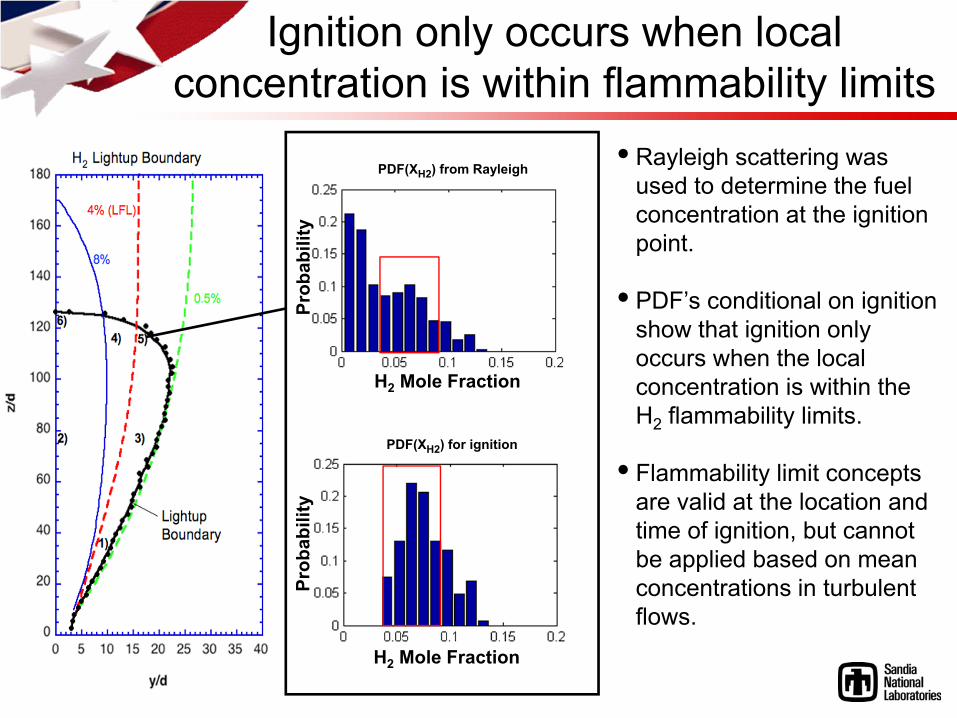
Ignition only occurs when local concentration is within flammability limits
5
z/D=10
• Rayleigh scattering was used to determine the fuel concentration at the ignition point.
• PDF’s conditional on ignition show that ignition only occurs when the local concentration is within the H2 flammability limits.
• Flammability limit concepts are valid at the location and time of ignition, but cannot be applied based on mean concentrations in turbulent flows.
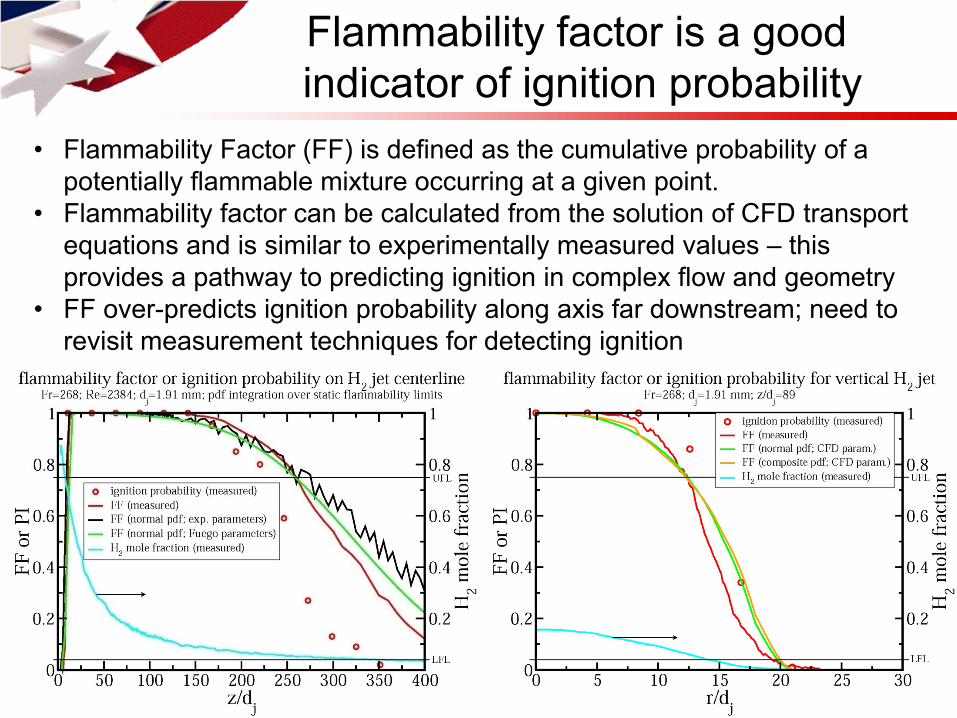
• Flammability Factor (FF) is defined as the cumulative probability of a potentially flammable mixture occurring at a given point.
• Flammability factor can be calculated from the solution of CFD transport equations and is similar to experimentally measured values – this provides a pathway to predicting ignition in complex flow and geometry
• FF over-predicts ignition probability along axis far downstream; need to revisit measurement techniques for detecting ignition
Flammability factor is a goodindicator of ignition probability
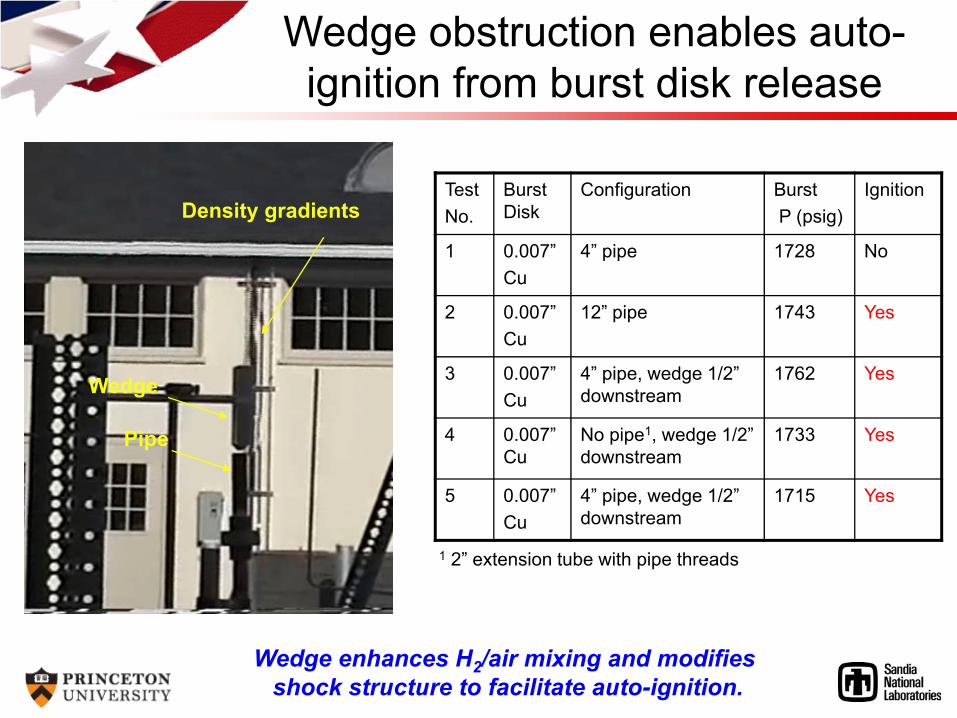
1 2” extension tube with pipe threads
TestNo.
Burst Disk
Configuration Burst P (psig)
Ignition
1 0.007”Cu
4” pipe 1728 No
2 0.007”Cu
12” pipe 1743 Yes
3 0.007”Cu
4” pipe, wedge 1/2” downstream
1762 Yes
4 0.007”Cu
No pipe1, wedge 1/2” downstream
1733 Yes
5 0.007”Cu
4” pipe, wedge 1/2” downstream
1715 Yes
Density gradients
Wedge
Pipe
Wedge enhances H2/air mixing and modifies shock structure to facilitate auto-ignition.
Wedge obstruction enables auto-ignition from burst disk release
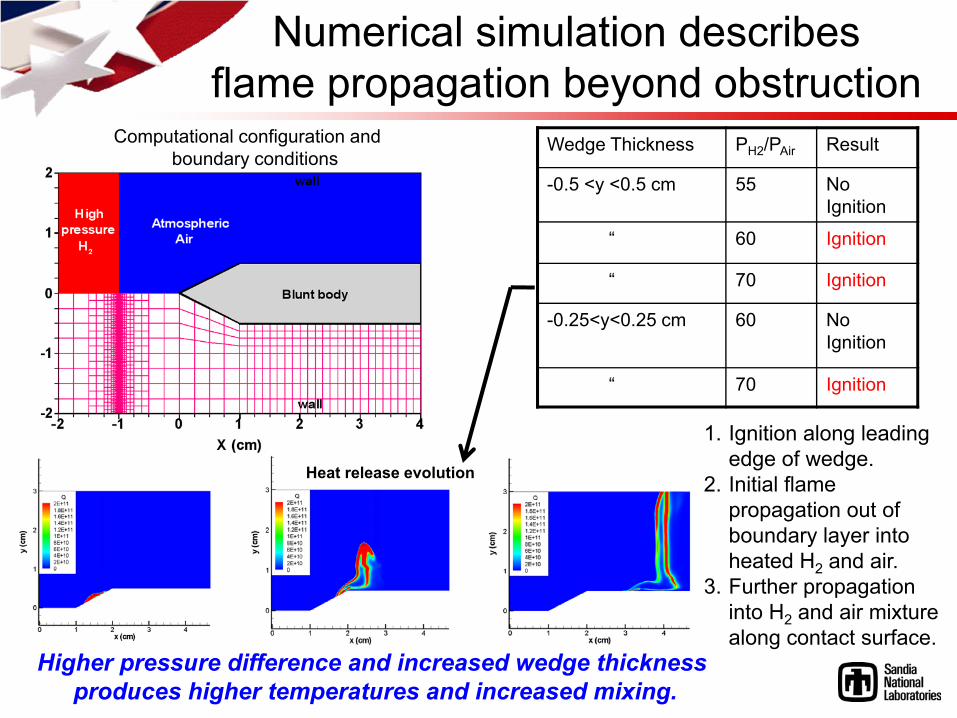
Numerical simulation describesflame propagation beyond obstruction
Computational configuration and boundary conditions
Wedge Thickness PH2/PAir Result
-0.5 <y <0.5 cm 55 No Ignition
“ 60 Ignition
“ 70 Ignition
-0.25<y<0.25 cm 60 No Ignition
“ 70 Ignition
Higher pressure difference and increased wedge thickness produces higher temperatures and increased mixing.
1. Ignition along leading edge of wedge.
2. Initial flame propagation out of boundary layer into heated H2 and air.
3. Further propagation into H2 and air mixture along contact surface.
Heat release evolution
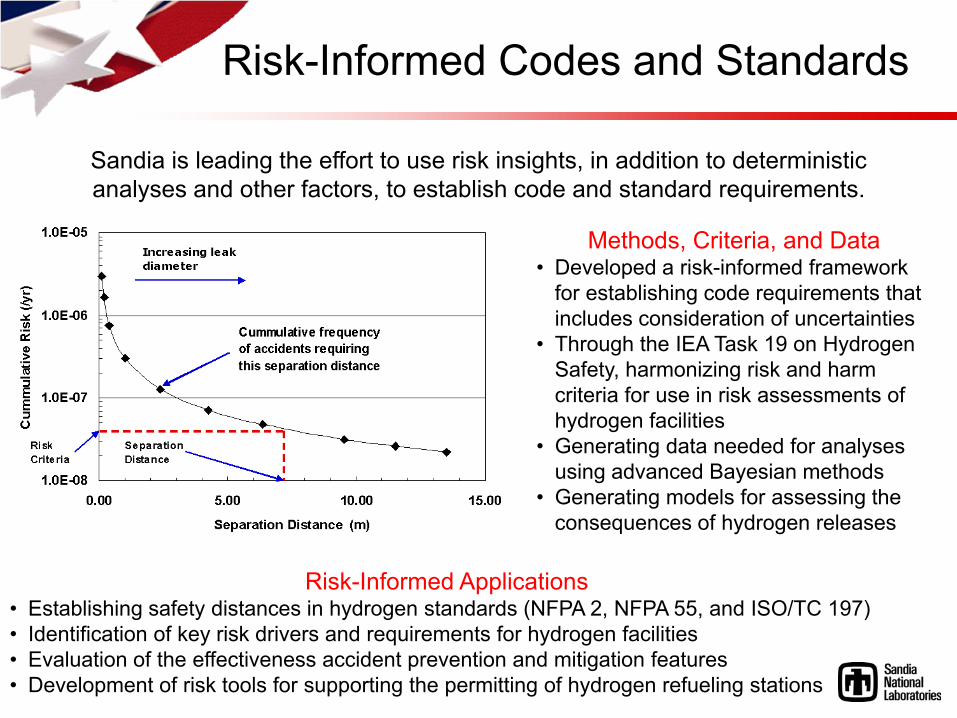
Risk-Informed Codes and Standards
Sandia is leading the effort to use risk insights, in addition to deterministic analyses and other factors, to establish code and standard requirements.
Methods, Criteria, and Data• Developed a risk-informed framework
for establishing code requirements that includes consideration of uncertainties
• Through the IEA Task 19 on Hydrogen Safety, harmonizing risk and harm criteria for use in risk assessments of hydrogen facilities
• Generating data needed for analyses using advanced Bayesian methods
• Generating models for assessing the consequences of hydrogen releases
Risk-Informed Applications• Establishing safety distances in hydrogen standards (NFPA 2, NFPA 55, and ISO/TC 197)• Identification of key risk drivers and requirements for hydrogen facilities • Evaluation of the effectiveness accident prevention and mitigation features• Development of risk tools for supporting the permitting of hydrogen refueling stations
Remainder of FY09• Improve ignition probability diagnostics• Complete validation of flammability factor model• Finish risk-informed separation distances with ISO TC197• Finalize risk analysis for barrier walls• Perform analysis to support performance requirements for use of
hydrogen in semi-enclosed spaces
FY10• Validation tests for partially-enclosed spaces / tunnels• Validation tests for cold vapor plume dynamics• Light-up mechanism model for turbulent flow• Auto-ignition mechanisms• Release behavior in parking structures, warehouses, gas storage• Risk analysis to support releases in tunnels, parking structures• Update risk-informed separation distances with new ignition
probabilities
Future work
• Barrier walls are used to reduce setbacks by factor of 2
• We found no ignition-timing vs. over-pressure sensitivities for jet flow obstructed by barrier walls
• Cryogenic vapor cloud model indicates hazard length scales exceed the room-temperature release; validation experiments are required to confirm
• Light-up maps developed for lean limit ignition; flammability factor model provides good indication of ignition probability
• Auto-ignition is enhanced by blunt-body obstructions –increases gas temperature and promotes fuel/air mixing
Summary