Embed Size (px)
Citation preview
Hydrofluorocarbon Emissions in China: An Inventory for 2005− 2013 and Projections to 2050
Jianxin Hu, Xuekun Fang, Guus J. M. Velders, A. R. Ravishankara, Mario J. Molina and Ronald G. Prinn
College of Environmental Sciences and Engineering, Peking University
July 12, 2017, Nay Pyi Taw, Myanmar
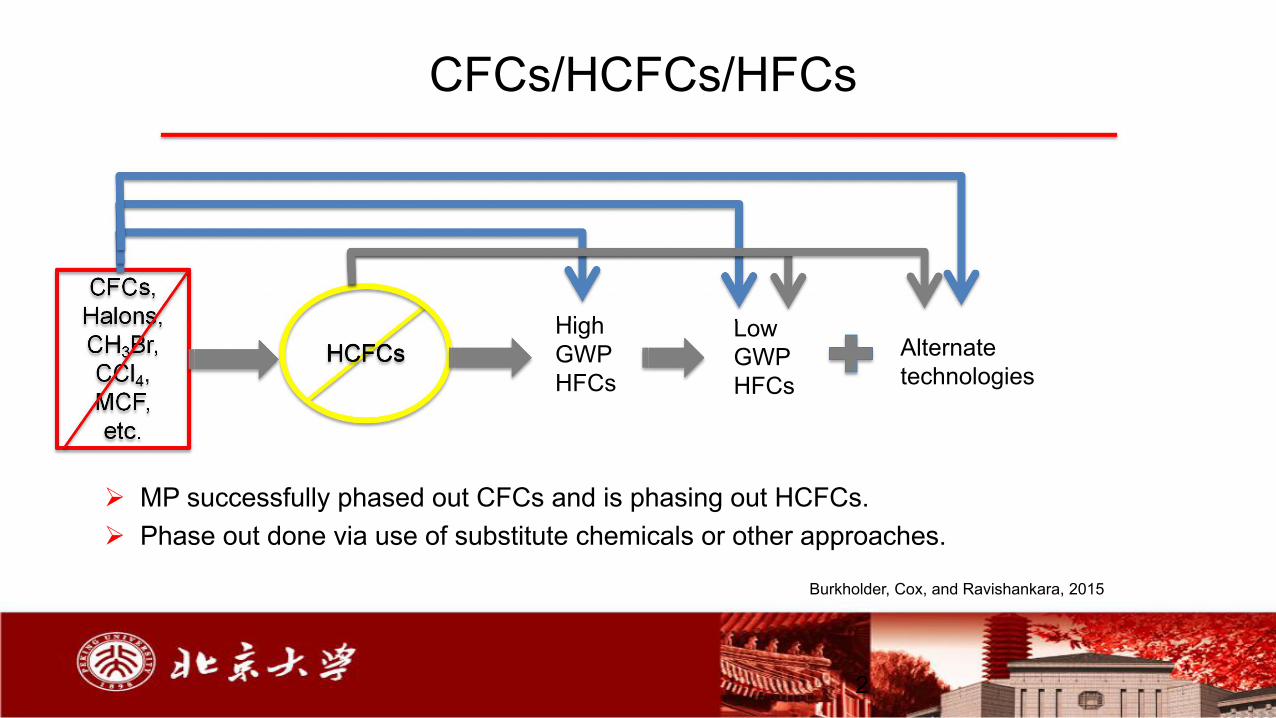
CFCs/HCFCs/HFCs
Ø MP successfully phased out CFCs and is phasing out HCFCs. Ø Phase out done via use of substitute chemicals or other approaches.
CFCs,Halons,CH3Br,CCl4, MCF,etc.
HCFCsHigh GWP HFCs
Low GWP HFCs
Alternate technologies
Burkholder, Cox, and Ravishankara, 2015
2
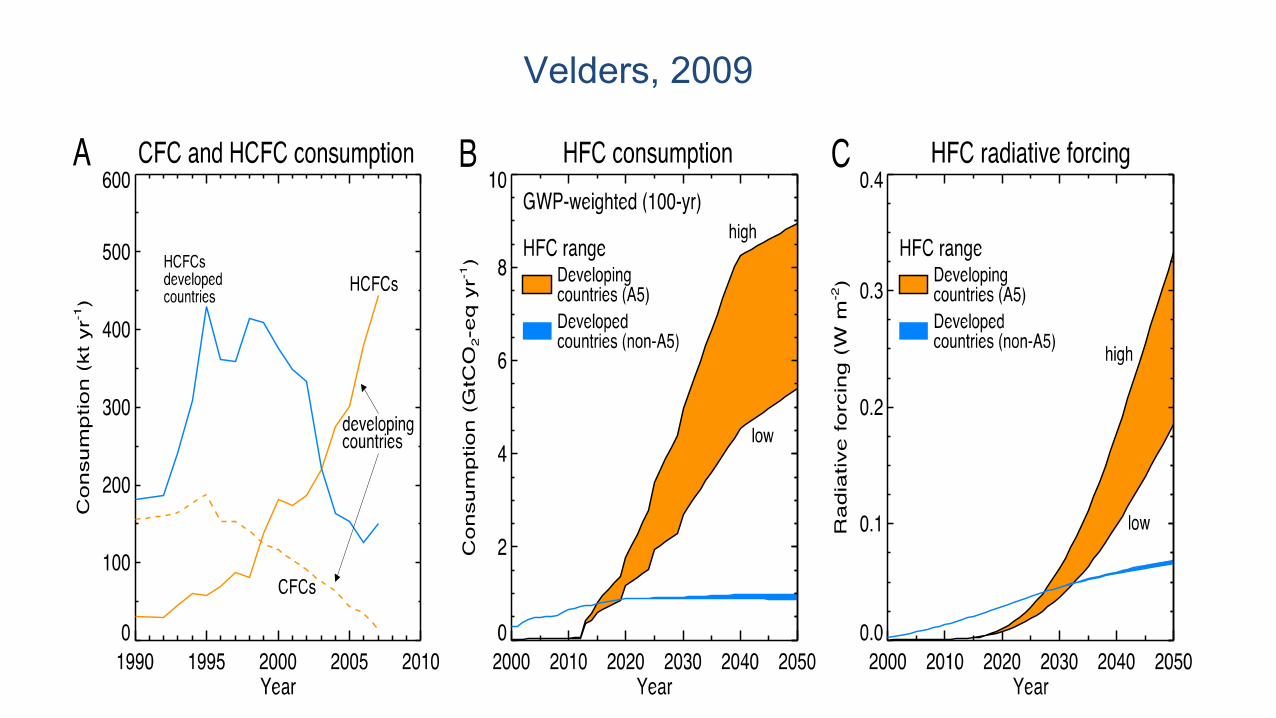
Velders, 2009
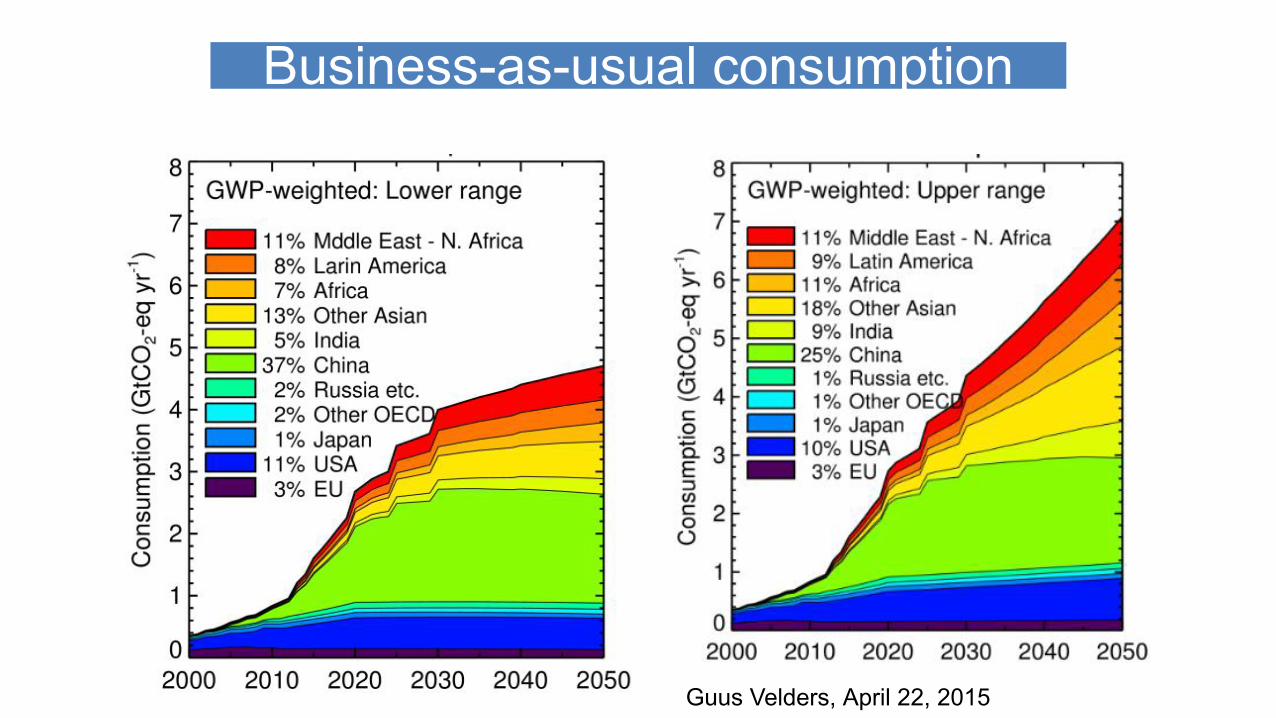
Guus Velders, April 22, 2015
Business-as-usual consumption
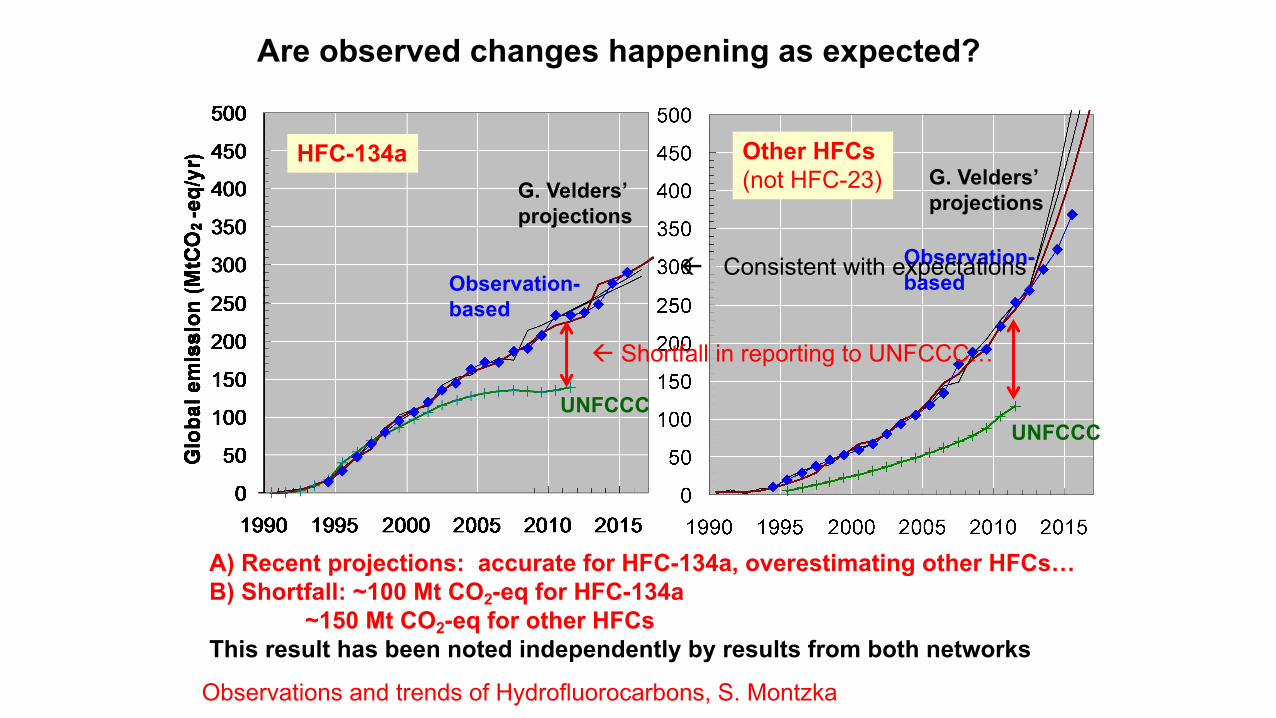
HFC-134a
Observation-based
G. Velders’ projections
UNFCCC
Other HFCs(not HFC-23)
UNFCCC
Observation-based
G. Velders’ projections
A) Recent projections: accurate for HFC-134a, overestimating other HFCs…B) Shortfall: ~100 Mt CO2-eq for HFC-134a
~150 Mt CO2-eq for other HFCsThis result has been noted independently by results from both networks
Are observed changes happening as expected?
Consistent with expectations
Shortfall in reporting to UNFCCC…
Observations and trends of Hydrofluorocarbons, S. Montzka
Data • Production and sales data for 2005-2010 collected from
enterprises• Production and sales data after 2010 bought from POL
CO 2 CO 2CO 2
运输开采
CO 2
CO 2
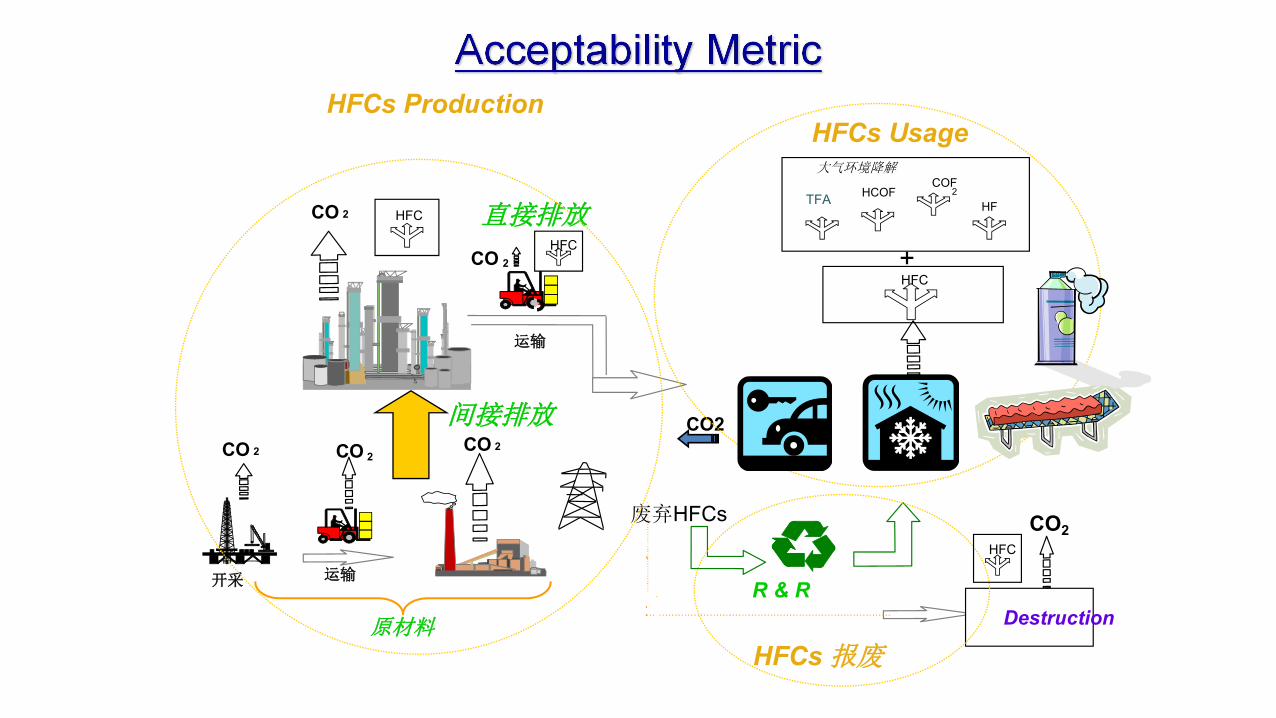
HFCs Production
运输
间接排放
废弃HFCs
直接排放
CO2
HFC
大气环境降解
+
R & R
HCOFCOF
2
HF
CO2
Destruction
CO2
TFAHFC
HFCs Usage
HFCs 报废原材料
HFC
HFC
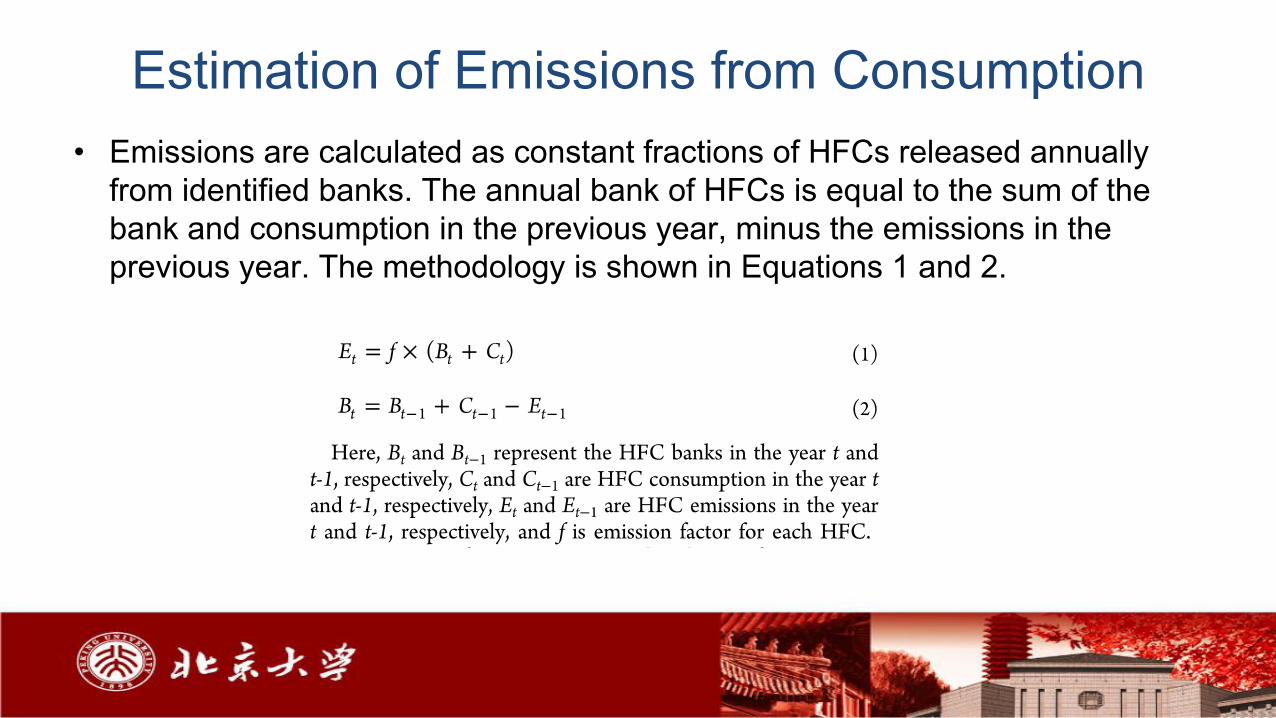
Estimation of Emissions from Consumption• Emissions are calculated as constant fractions of HFCs released annually
from identified banks. The annual bank of HFCs is equal to the sum of the bank and consumption in the previous year, minus the emissions in the previous year. The methodology is shown in Equations 1 and 2.
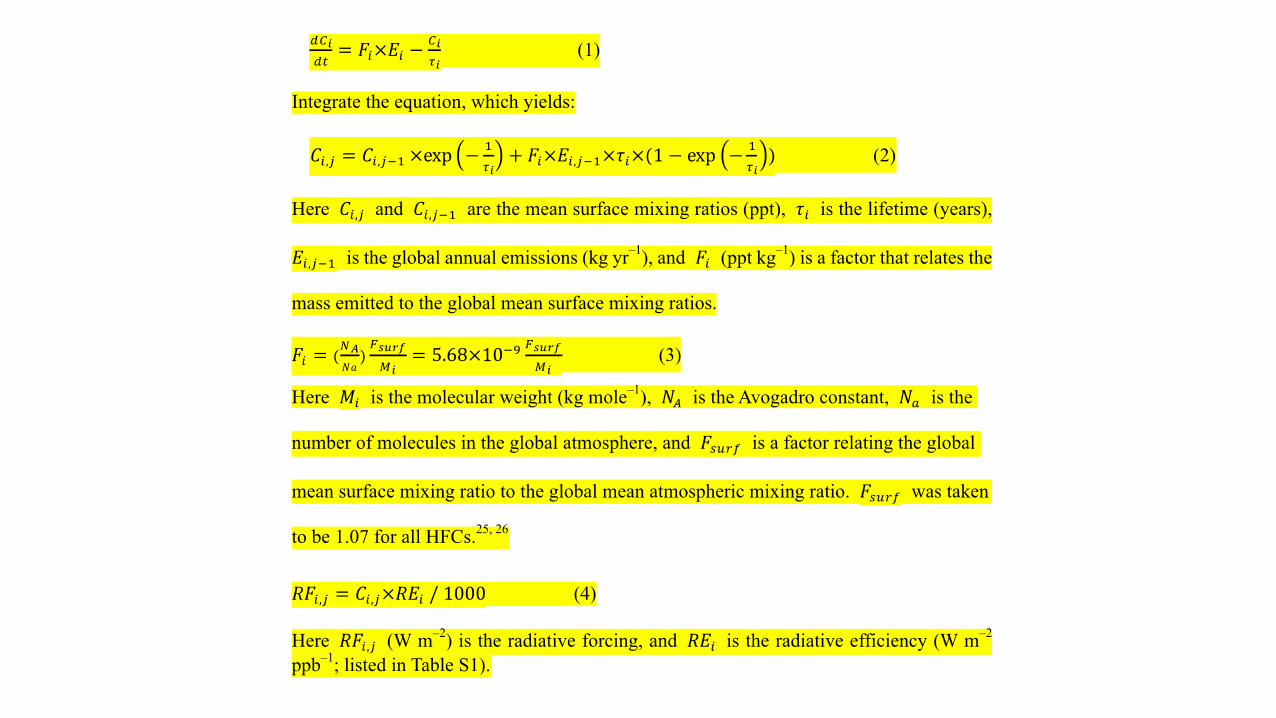
Estimation of mixing ratio and radiative forcing
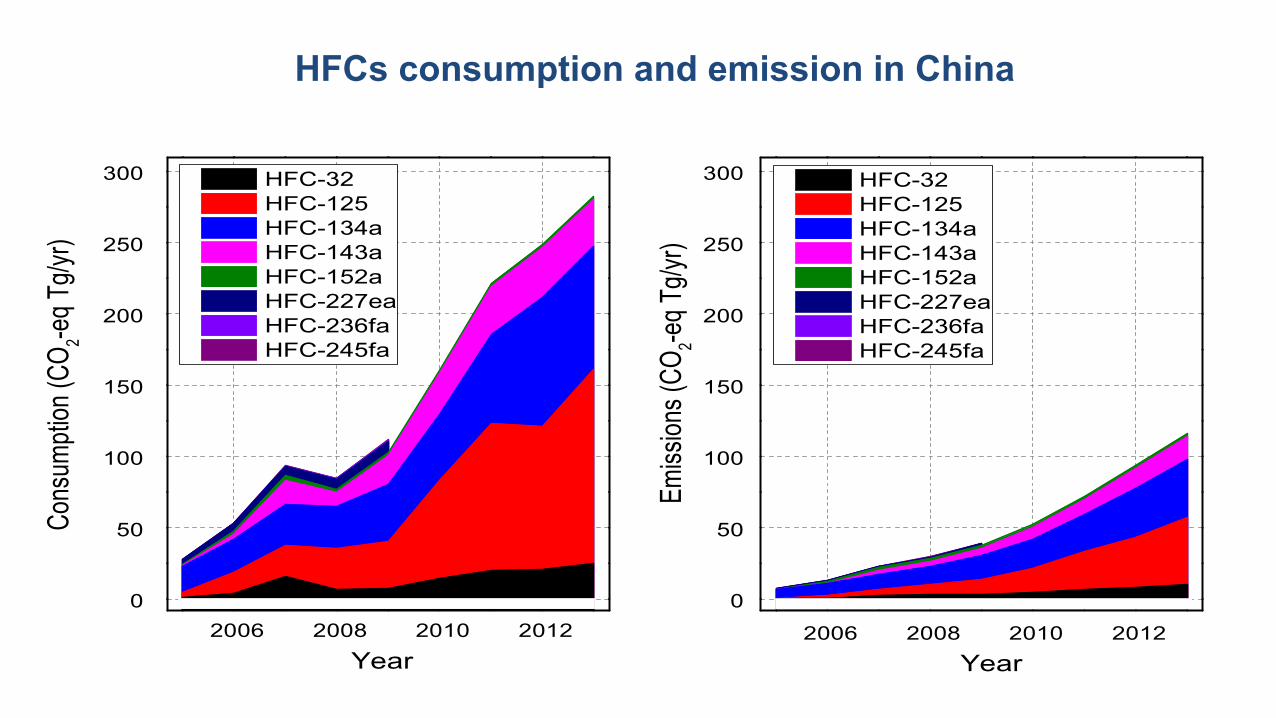
HFCs consumption and emission in China
2006 2008 2010 20120
50
100
150
200
250
300
Cons
umpti
on (C
O 2-eq T
g/yr)
Year
HFC-32 HFC-125 HFC-134a HFC-143a HFC-152a HFC-227ea HFC-236fa HFC-245fa
2006 2008 2010 2012
0
50
100
150
200
250
300
Emiss
ions (
CO2-e
q Tg/ y
r )Year
HFC-32 HFC-125 HFC-134a HFC-143a HFC-152a HFC-227ea HFC-236fa HFC-245fa
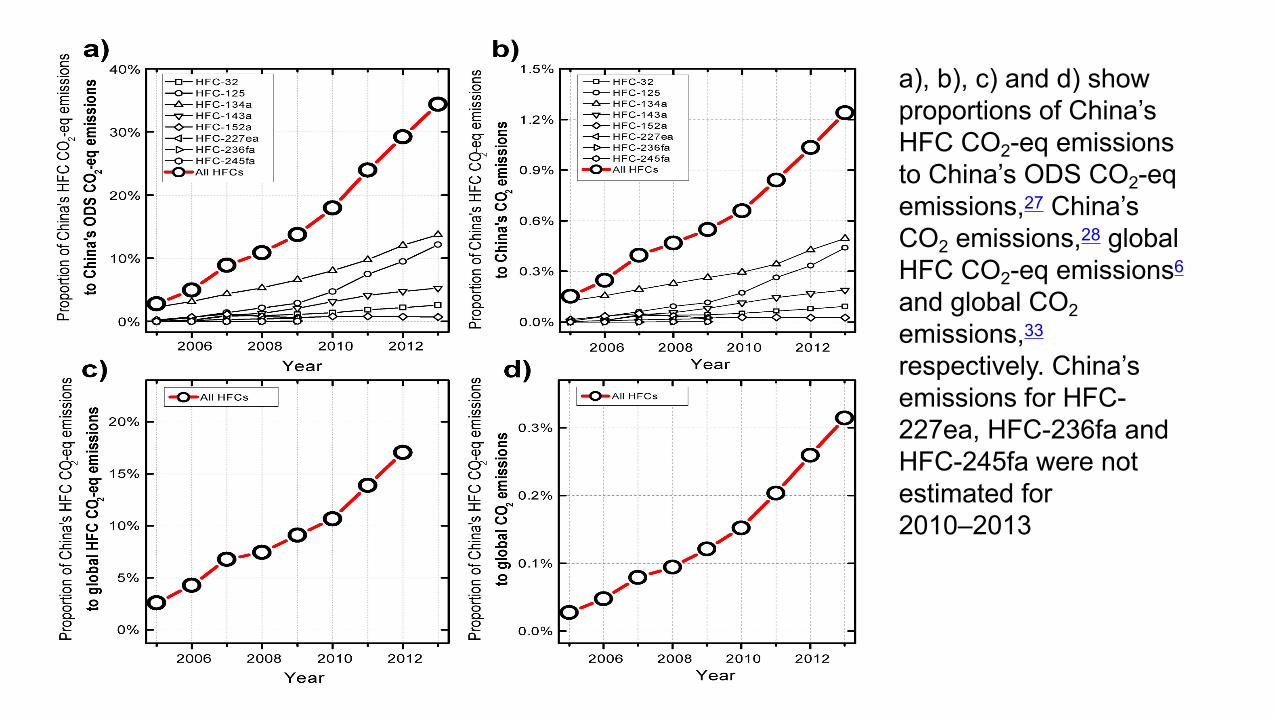
a), b), c) and d) show proportions of China’s HFC CO2-eq emissions to China’s ODS CO2-eq emissions,27 China’s CO2 emissions,28 global HFC CO2-eq emissions6 and global CO2 emissions,33 respectively. China’s emissions for HFC-227ea, HFC-236fa and HFC-245fa were not estimated for 2010–2013
BAU Scenario• the HCFC consumption in China during 2011–2050 is assumed to grow in proportion to the
gross domestic product (GDP) scenarios from Shared Socioeconomic Pathway (SSP)projections.21
• The high and low ends of the range for GDP growth follow the SSP5 and SSP3 scenarios (the five datasets (SSP1 to 5) quantified by the OECD as illustrative SSPs),21 respectively.
• Due to the Montreal Protocol, HCFC consumption in China was frozen in 2013 at the baseline of an average of the 2009–2010 level, and will be reduced by 10% in 2015, 35% in 2020, 67.5% in 2025, and 97.5% by 2030.22 We assume that the HFCs and not-in-kind replacements (the replacement pattern is shown in Table S4) make up for the differences between the HCFC demand and the lower HCFC consumption to comply with the Montreal Protocol.
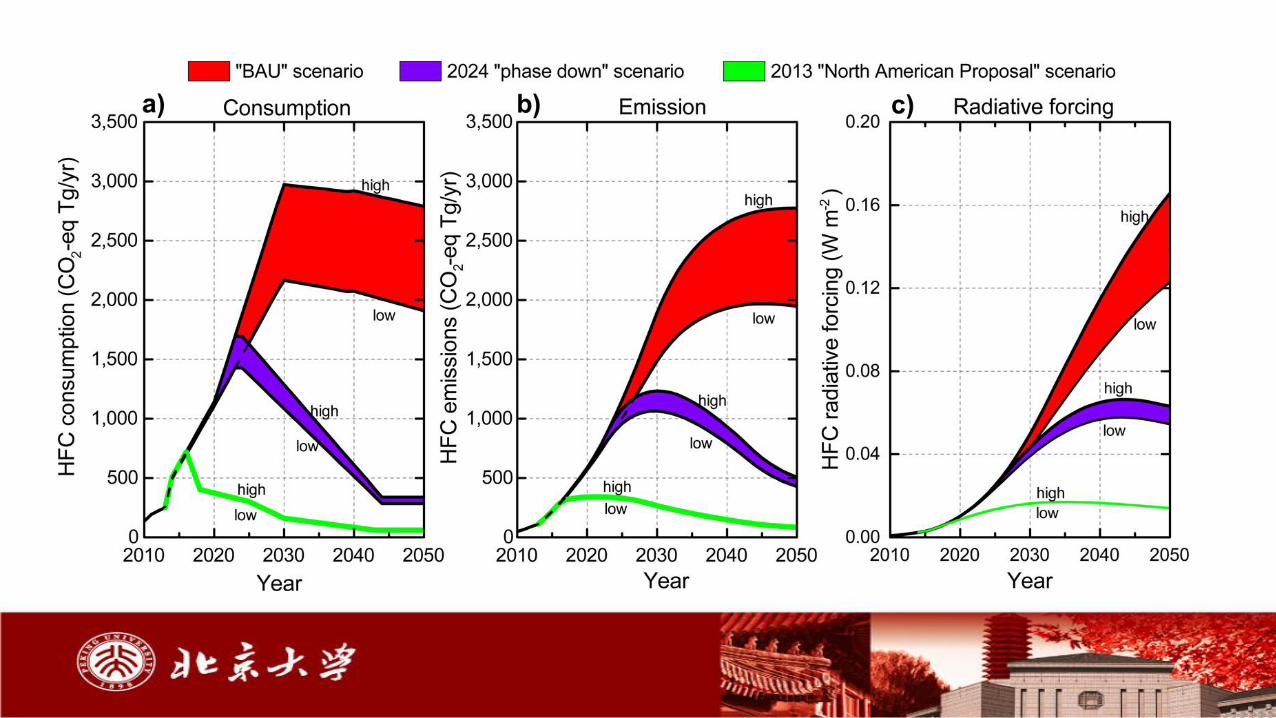
Scenario for mitigation of HFCs• BAU• NAP Consumption cap
– 2018 100%,2025 75%,2030 40%,2043 15%– liner reduction in practise
• 2024 reduction scenarioin 2024 freeze production and consumption at 2023 level4% per year (2025-2044),keep 20% of the baseline liner reduction 2044-2050, keep 20% of the baseline
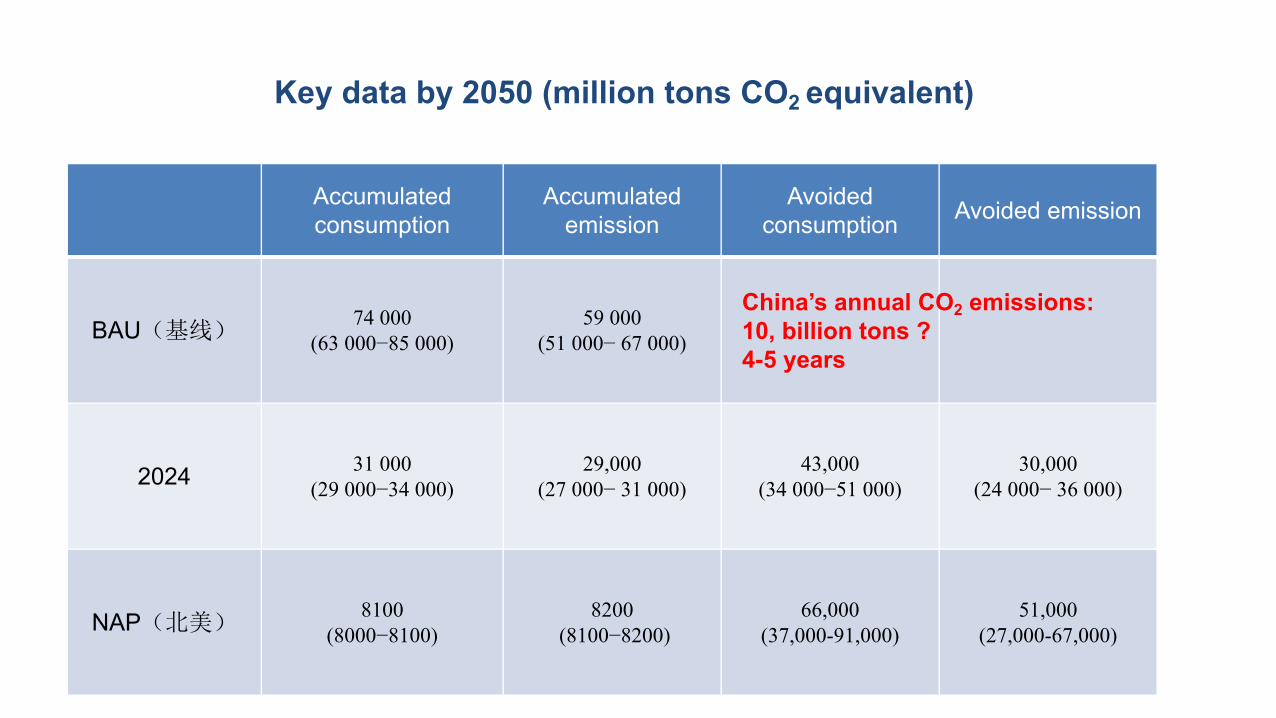
Key data by 2050 (million tons CO2 equivalent)
Accumulated consumption
Accumulated emission
Avoided consumption Avoided emission
BAU(基线)74 000
(63 000−85 000) 59 000
(51 000− 67 000)
2024 31 000 (29 000−34 000)
29,000 (27 000− 31 000)
43,000 (34 000−51 000)
30,000 (24 000− 36 000)
NAP(北美)8100
(8000−8100)8200
(8100−8200)66,000
(37,000-91,000)51,000
(27,000-67,000)
China’s annual CO2 emissions:10, billion tons ?4-5 years