Embed Size (px)
Citation preview

Future hydroclimate changes over Central America and the Caribbean2014 15
気象研究所研究報告 第 65 巻 15-33 頁 平成 26 年 2 月Papers in Meteorology and Geophysics Vol. 65, 15–33, February 2014doi:10.2467/mripapers.65.15
1. Introduction
Central America, including Mexico, and the Caribbean region, are located between the tropical Pacific and Atlantic oceans. They border the Caribbean Sea and the Gulf of Mexico (the Western Hemisphere warm pool), and their climates are strongly affected by the two oceans (Ropelewski and Halpert, 1987; Enfield, 1996). The atmospheric bridge across this region is a key channel by which climate change in the Atlantic influences the tropical Pacific (e.g., Giannini et al., 2000; Xie et al., 2008). Both the North and South American Monsoons, driven primarily by land–sea thermal contrasts, play important hydroclimatic roles in this region (Higgins and Gochis, 2007; Zhou and Lau, 1998). However,
future climate projections for this region are limited in the Fourth Assessment Report of the Intergovernmental Panel on Climate Change (IPCC, 2007a) and later studies (e.g., Biasutti et al., 2012) because high horizontal resolution is required to represent the small landmasses in this region in general circulation models (GCMs).
The multi-model ensemble (MME) of the Coupled Model Intercomparison Project 3rd phase (CMIP3) projects a 9% decrease in annual mean precipitation over most of this region late in this century under the Special Report on Emis-sions Scenarios (SRES) A1B scenario (Christensen et al., 2007). This decrease in mean precipitation is projected to be accompanied by more frequent hot and dry extremes in all seasons. Most models project increased summer precipitation over the eastern Pacific and in some parts of northeastern Mexico, and decreased precipitation in all seasons in Central America (e.g., Biasutti et al., 2012). Central America has been called a climate change “hot spot” because it is the
Hydroclimate changes over Central America and the Caribbean
in a global warming climate projected
with 20-km and 60-km mesh MRI atmospheric general circulation models
by
T. Nakaegawa, A. Kitoh, S. Kusunoki, H. Murakami, and O. Arakawa
Climate Research Department, Meteorological Research Institute, Tsukuba, Japan
(Received March 15, 2013; Accepted June 18, 2013; Published February 18, 2014)
Abstract
Future hydroclimate projections for Central America and the Caribbean were investigated with quantified uncer-tainties using 20-km and 60-km mesh global atmospheric general circulation models. In these regions, only a few future climate projections with high horizontal resolutions are available, although Central America and the Caribbean are char-acterized by spatial and temporal complexities in climate. Horizontal resolutions of 20 km and 60 km are comparable to those of regional climate models for a large region. Both the 20-km and 60-km mesh models reproduced reasonably well the observed seasonal precipitation patterns. Precipitation was projected to decrease in most of this region in all seasons by the end of this century. Evaporation from the ocean was projected to increase throughout the year, except in the Intertropical Convergence Zone, whereas evaporation from land areas was generally projected to decrease in the dry season and to increase in the rainy season. Surface soil moisture and total runoff in most land areas were therefore pro-jected to decrease in both models in all seasons. Annual mean streamflow in the future climate was projected to decrease in most of Central America and the Caribbean as a result of decreased precipitation and increased evaporation. The values of hydroclimate variables over four land-only domains in the future climate changed significantly on a monthly basis within each season. In contrast, changes in the annual means of hydroclimate variables for individual countries were highly uncertain.
Corresponding address: T. Nakaegawa,Meteorological Research Institute,
1-1 Nagamine, Tsukuba, Ibaraki 305-0052, Japan.E-mail: [email protected]
© 2014 by the Japan Meteorological Agency / Meteorological Research Institute

Nakaegawa, T. et al. Vol. 6516
tropical region that is projected to be most responsive to global change, primarily in terms of decreased precipitation and increased precipitation variability (Giorgi, 2006; Tebaldi et al., 2006). For example, a drying trend in the summer in this region is projected in MME studies (Neelin et al., 2006; Rauscher et al., 2008; Campbell et al., 2011). Associated with the drying trend, annual mean streamflow in the Rio Lempa, in Central America, is projected to decrease (Maurer et al., 2009).
Many studies have been devoted to impact assessments, adaptation plans, and mitigation measures on the basis of these future climate projections (e.g., IPCC, 2007b, 2012; Bueno et al., 2008; Smith et al., 2011). These studies require modeling at small scales (local, regional, or national), be-cause actual impacts due to climate changes are highly spe-cific to localities, and adaptation plans and mitigation mea-sures also depend on locality. Weather extremes have distinct effects on human activities such as agricultural production, water use, and transportation, and weather changes in future climates will likewise affect these activities (IPCC, 2012). As a prerequisite for reliable future climate projections, climate models need to simulate small-scale atmospheric phenomena such as weather extremes and storm patterns in present-day climates. Climate scientists have therefore been asked to model projected future climate changes at horizontal scales of tens of kilometers or even finer. Because computational demands limit the resolution of atmosphere-ocean GCMs (AOGCMs), fine-scale studies commonly use dynamical regional climate downscaling techniques to obtain high-reso-lution information on future climate changes.
Regional climate models (RCMs) are typically used to downscale large-scale phenomena for smaller target regions with high-resolution grids (e.g., Christensen and Christensen, 2007; Kanada et al., 2010). Problems can arise in this type of downscaling from the lateral boundary conditions, because no interaction is modeled between the target domain and the whole globe, and large-scale systematic errors can result (e.g., Kanamaru and Kanamitsu, 2007).
A high-resolution atmospheric GCM (AGCM) using a grid of approximately 20 km has recently been used to downscale large-scale phenomena (Mizuta et al., 2006; Kitoh et al., 2009) and is expected to overcome these limitations. The 20-km mesh model simulation, however, is compu-tationally demanding and can use only a single dataset of projected sea surface temperature (SST) as a lower boundary condition. This constraint hinders uncertainty evaluations that incorporate multiple lower boundary conditions. To address this issue, additional experiments with low-resolution versions of the same model (60-km and 180-km mesh) are a plausible way to quantify uncertainties in the conditions and in resolution dependency (Kitoh et al., 2009). Single-model approaches have been used to attempt to project future climates in Central America and the Caribbean with a GCM (e.g., Angeles et al., 2007) and an RCM (e.g., Campbell
et al., 2011; Taylor et al., 2012; Diro et al., 2012), but sta-tistical tests to quantify uncertainties could not be applied in those projections because of limited computer resources. The MME approach with a high horizontal resolution has not yet been used to project future climate in this region, although attempts with GCMs have been made using coarse horizontal resolutions (Giorgi, 2006; Neelin et al., 2006; Rauscher et al., 2008, 2011). In this study, we performed 25-year time-slice experiments using both 20-km and 60-km mesh models and analyzed future hydroclimate changes for Central America and the Caribbean with quantified uncertainty.
2. Model, experiment, and experimental conditions
2.1 ModelWe developed a global hydrostatic AGCM at the Meteo-
rological Research Institute (MRI) and Japan Meteorological Agency (JMA) based on the JMA short-term, numerical, weather-prediction model (60-km mesh) used operationally in the early 2000s (Mizuta et al., 2006). We modified the operational model for long-term climate simulations at MRI by incorporating a semi-Lagrangian scheme and tuning some of the physical parameterizations. The AGCM has a horizon-tal grid size of about 20 km, which is implemented with the spectral transform method by using a triangular truncation at wave number 959 with a linear Gaussian grid (TL959); the model has 60 layers in the vertical, with the model top at 0.1 hPa (MRI-AGCM3.1S). The AGCM includes many sub-grid-scale parameterizations, the Arakawa-Schubert scheme with prognostic closure for the cumulus parameterization, and the latest JMA-Simple biosphere model for the land biosphere-hydrosphere parameterization. For streamflow, we used the digital river routing network dataset Total River Integrated Pathway (TRIP; Oki and Sud, 1998) as a boundary condition along with the Global River flow model (Nohara et al., 2006; Nakaegawa and Hosaka, 2008). The model is described in detail by Mizuta et al. (2006).
2.2 ExperimentsWe performed time-slice, 25-year simulations for the
present-day climate (1979−2003) and the future climate (2075−2099), as indicated in Table 1. For the present-day climate simulations, we used three horizontal resolutions: the original TL959 version (20 km), TL319, and TL95. The latter two correspond to grid sizes of 60 km (MRI-AGCM3.1H) and 180 km (MRI-AGCM3.1L), respectively. As lower boundary conditions for the present-day climate simulations, we used observed monthly SST and sea-ice concentration data (HadISST; Rayner et al., 2003).
For the future climate, we made a single, 25-year, time-slice simulation for 2075−2099 by using the 20-km mesh model and assuming SRES scenario A1B. We used as lower boundary conditions the SST data obtained from observed SSTs and the projected SST from the CMIP3 MME dataset.
Future hydroclimate changes over Central America and the Caribbean2014 17
The lower boundary SST dataset comprised three compo-nents (Mizuta et al., 2008): the future change in the MME mean SST projected from a multi-model dataset, the trend in the MME mean SST, and the detrended observed SST for the period 1979−2003. The MME consisted of 18 CMIP3 GCMs, which are listed in Table 1 of Mizuta et al. (2008). Future changes in the MME mean SST were determined from the difference between the present-day and future climate simulations under SRES scenario A1B. Those future climate simulations show an El Niño–like pattern of mean changes in SST in the tropical Pacific (IPCC, 2007a). The resulting SST dataset, constructed for future climate simulation, has a higher mean and a clearly increasing trend in SST, but also includes time series of variabilities, including El Niño and La Niña events and the Tropical Atlantic SST dipole. Because El Niño–Southern Oscillation (ENSO) projections are not in agreement among the CMIP3 models in the Fourth Assess-ment Report (IPCC, 2007a), the use of observed variabilities may be the best possible choice. We obtained the lower boundary sea-ice concentration data in a similar fashion. The climatological global annual mean SST in the future climate increases by 2.16°C. Schematics of the process by which we developed these lower boundary conditions are given by Mizuta et al. (2008) and Kitoh et al. (2009, 2011). We used initial conditions obtained from previous 20-km mesh simulations (Mizuta et al., 2006) for both the present-day and future climate simulations. Spin-up time was 14 months for each simulation.
Uncertainty is inherent in current climate change projec-tions. In addition, the pattern of SST increase in the tropics and subtropics influences the regional response of the future climate (Xie et al., 2010; Clement et al., 2010), and the local spatial pattern of SST changes influences the precipitation decreases in Central America and the Caribbean (Rauscher et al., 2011). To quantify the uncertainty in climate change projections, we performed ensemble simulations with the
60-km mesh model. The model ensemble was composed of simulations with four different SST datasets: the MME mean SST and sea-ice concentrations used in the 20-km mesh model simulation, and the SSTs and sea-ice concentrations of the CSIRO-Mk3.0, MRI-CGCM2.3.2, and MIROC3.2 high-resolution (hires) models. The latter three models prescribe increases in the climatological global annual mean SST in the future climate of 1.43°C, 1.73°C, and 3.49°C, respectively. The CSIRO-Mk3.0 and MRI-CGCM2.3.2 SSTs show an El Niño–like pattern for climatological annual mean changes, with the western equatorial SST decreasing more than the eastern equatorial SST, as is the case in the MME mean SST, whereas the MIROC3.2 (hires) SSTs show a La Niña–like pattern. For each of these four models, we performed three-member simulations with different initial conditions to assess the influence of natural variability.
2.3 Observation dataThe use of multiple datasets enabled us to estimate
the uncertainty in the observational data. Three different observation datasets, each consisting of monthly mean data, were used for evaluating the reproducibility of the seasonal mean precipitation climatology in the present-day climate simulation: the Climate Prediction Center Merged Analysis of Precipitation (CMAP) without model-generated precipita-tion (V0809_std; Xie and Arkin, 1997), the Climate Research Unit 0.5° monthly climate time series 2.1 (CRU; Mitchell and Jones, 2005), and the Tropical Rainfall Measuring Mission (TRMM) 3B42 datasets (TRMM 3B42; Adler et al., 2000). CMAP has 2.5° horizontal resolution and covers the whole period of the present-day climate simulation; CRU has a 0.5° horizontal resolution and covers the period 1901−2002 for land areas only; and TRMM 3B42 has 0.25° horizontal resolution and covers the period from 1998 to the present. We constructed 24-year (1979−2002) and 14-year (1998−2011) mean precipitation records from CRU and TRMM 3B42, respectively. Although the averaging periods differ among the observation data used, and only CMAP covers the entire period of the present-day simulation, these data are sufficient for comparisons of seasonal mean precipitation climatology between the models and observations.
2.4 Target region and domainsIn this study we focused on Central America and the
Caribbean from 8°N to 32°N and from 58°W to 115°W (Fig. 1). We selected four domains for land-only regional analyses to detect changes in seasonal water cycles at a monthly reso-lution.
3. Results
3.1 Seasonal mean geographic patterns3.1.1 Reproducibility
Figure 2 compares the seasonal mean precipitation
Table 1 Experimental design.
25-year target period
Grid size
Sea surface temperature and sea-ice concentration
Ensemble size
Present day1979−2003
20 km60 km
180 km
Observation HadISST1Observation HadISST1Observation HadISST1
131
Future2075−2099
20 km60 km60 km60 km60 km
CMIP3 multi-model ensembleCMIP3 multi-model ensembleCSIRO-MK3.0a
MIROC3.2(hires)b
MRI-CGCM2.3.2c
13333
a Commonwealth Scientific and Industrial Research Organisation (CSIRO) Atmospheric Research, Australia
b Center for Climate System Research (University of Tokyo), Nation-al Institute for Environmental Studies, and Frontier Research Center for Global Change (FRCGC) of Japan Agency for Marine-Earth Science and Technology (JAMSTEC), Japan
c Meteorological Research Institute, Japan
Nakaegawa, T. et al. Vol. 6518
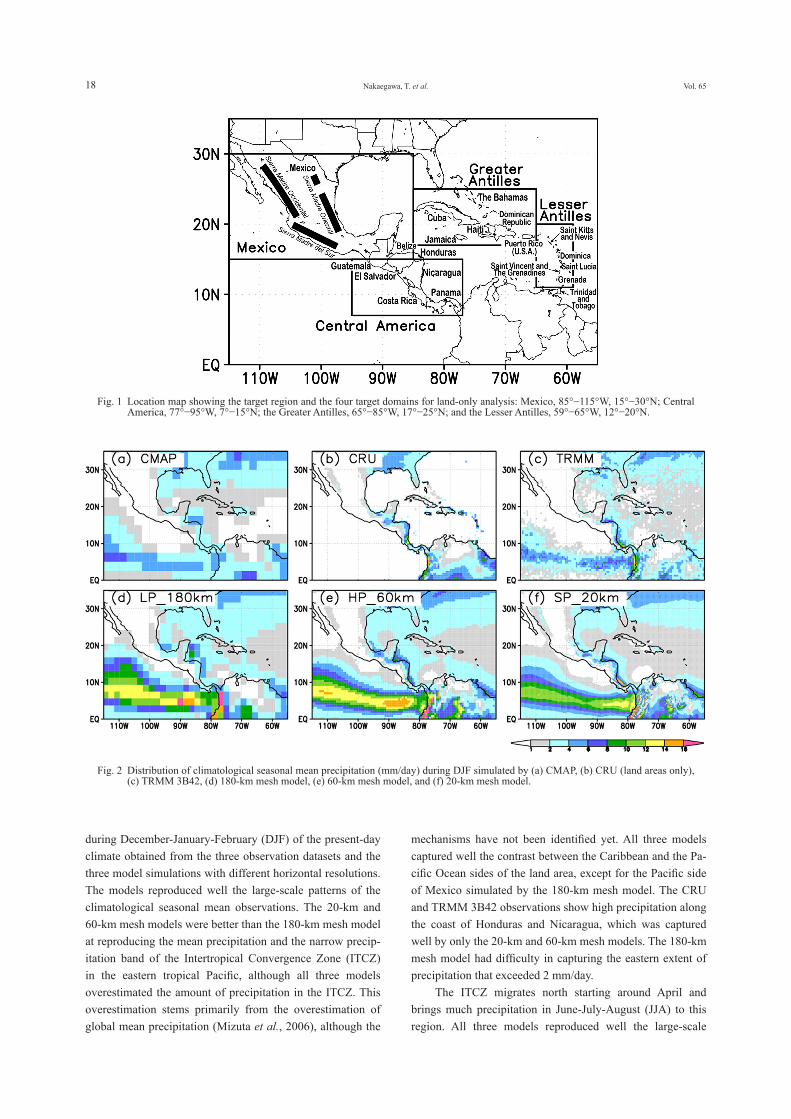
during December-January-February (DJF) of the present-day climate obtained from the three observation datasets and the three model simulations with different horizontal resolutions. The models reproduced well the large-scale patterns of the climatological seasonal mean observations. The 20-km and 60-km mesh models were better than the 180-km mesh model at reproducing the mean precipitation and the narrow precip-itation band of the Intertropical Convergence Zone (ITCZ) in the eastern tropical Pacific, although all three models overestimated the amount of precipitation in the ITCZ. This overestimation stems primarily from the overestimation of global mean precipitation (Mizuta et al., 2006), although the
mechanisms have not been identified yet. All three models captured well the contrast between the Caribbean and the Pa-cific Ocean sides of the land area, except for the Pacific side of Mexico simulated by the 180-km mesh model. The CRU and TRMM 3B42 observations show high precipitation along the coast of Honduras and Nicaragua, which was captured well by only the 20-km and 60-km mesh models. The 180-km mesh model had difficulty in capturing the eastern extent of precipitation that exceeded 2 mm/day.
The ITCZ migrates north starting around April and brings much precipitation in June-July-August (JJA) to this region. All three models reproduced well the large-scale
Fig. 1 Location map showing the target region and the four target domains for land-only analysis: Mexico, 85°−115°W, 15°−30°N; Central America, 77°−95°W, 7°−15°N; the Greater Antilles, 65°−85°W, 17°−25°N; and the Lesser Antilles, 59°−65°W, 12°−20°N.
Fig. 2 Distribution of climatological seasonal mean precipitation (mm/day) during DJF simulated by (a) CMAP, (b) CRU (land areas only), (c) TRMM 3B42, (d) 180-km mesh model, (e) 60-km mesh model, and (f) 20-km mesh model.

Future hydroclimate changes over Central America and the Caribbean2014 19
patterns of precipitation but failed to reproduce the amount of precipitation during JJA as well as during DJF (Fig. 3). Both the CMAP and the 180-km mesh model showed a broad ITCZ precipitation band in the eastern Pacific, whereas the 20-km and 60-km mesh models showed a narrow band, which is apparent in the fine-scale spatial datasets of TRMM 3B42. The 60-km mesh model and especially the 20-km mesh model successfully reproduced small-scale precipita-tion patterns on land in the coastal zone of Nicaragua and Costa Rica and in the three Sierra Madre ranges in Mexico and Honduras, although these were not well resolved by the coarse-resolution CMAP dataset. These results indicate that finer mesh models are more reliable for future projections than coarse-mesh models, especially for small areas such as the land areas in this region.
3.1.2 ProjectionsFigure 4 shows the projected change in seasonal mean
precipitation between the two 25-year target periods (Table 1) for the 20-km mesh model and the 60-km mesh model ensemble. The results for the 60-km mesh model ensemble are the ensemble mean of all 12 members, comprising four different lower boundary conditions and three initial condi-tions (Table 1). The sample sizes for the Student’s t-test were 3 and 12 for the present-day and future climate projections, respectively, the corresponding degrees of freedom being 373 (= 3×25 + 12×25 − 2). As a quantitative measure of the consistency of the results, we considered the projections to be robust when the changes in ensemble means for all four experiments agreed in sign.
The results for the 20-km mesh model and the 60-km mesh model ensemble were consistent with each other, although there were only a few areas in the 20-km mesh
model with statistically significant changes because of the small number of degrees of freedom, 48. Both model results showed significant decreases in most land and ocean areas, particularly during March-April-May (MAM) and JJA; pre-cipitation for MAM was projected to significantly decrease, except in the eastern Sierra Madre ranges. For JJA, both models produced a broad band with significant decreases around 20°N. Precipitation was projected to decrease over most of the Greater and Lesser Antilles. Significant increases of precipitation over land areas were confined to Honduras, Costa Rica, and Panama. For September-October-November (SON), the 60-km mesh model ensemble projected signif-icant decreases, with low consistency from 10°N to 20°N, whereas the changes of precipitation projected by the 20-km mesh model were relatively small. Significant increases of precipitation over land areas were scattered in both models. Both models projected less precipitation over the Greater Antilles, whereas decreased precipitation over inland Mexico was significant, with high consistency only in the 60-km mesh model ensemble.
The large-scale geographic pattern of changes in sea-sonal mean precipitation in the future climate is consistent with that obtained from the CMIP3 MME analysis (Neelin et al., 2006; Christensen et al., 2007; Campbell et al., 2011). The warming of the oceans around Central America and the Caribbean is weaker than the warming in the Indian and Pacific Oceans in the CMIP3 MME (Vecchi and Soden, 2007). Subsequent poleward shift of the subtropical sub-sidence in this region causes these changes in precipitation. Several studies with a single-experiment approach (e.g., Angeles et al., 2007) have produced different features that are less robust than those produced with the MME approach.
Tropical cyclones (TCs) are the most distinct atmo-
Fig. 3 Same as in Fig. 2 but during JJA.

Nakaegawa, T. et al. Vol. 6520
spheric phenomena in this region, and their active season is July to October. Murakami and Wang (2010) projected that the frequency of TCs will decrease in this region. Figure 5 shows the annual precipitation induced by TCs, defined as precipitation within 200 km of their centers. The change in the TC-induced precipitation was not a dominant factor in the change in seasonal mean precipitation, being an order of magnitude smaller and having different spatial patterns. The increase in TC-induced precipitation in eastern Mexico con-tributed to part of the increase in seasonal mean precipitation in SON.
Figure 6 shows the changes in seasonal mean evapo-
ration between the present-day and future climates for the 20-km mesh model and the 60-km mesh model ensemble. Because of the increase in net radiation resulting from the robust increase in downward longwave radiation and the exponential increase in saturated water vapor pressure with increasing air temperature, seasonal mean evaporation from the oceans increased throughout the year, except in the ITCZ, where the downward shortwave radiation decreased at the Earth’s surface. In the land areas, seasonal mean evapora-tion in the 60-km mesh model ensemble was projected to decrease in spotty areas in the dry season (DJF and MAM) and to increase in most areas in the rainy season (JJA and
Fig. 4 Changes in seasonal mean precipitation (mm/day) between the present-day and the end of the 21st century for the 20-km mesh model and the 60-km mesh model ensemble: (a) DJF 60-km, (b) DJF 20-km, (c) MAM 60-km, (d) MAM 20-km, (e) JJA 60-km, (f) JJA 20-km, (g) SON 60-km, and (h) SON 20-km. Colors depict changes in areas that are statistically significant at the 95% confidence level. For the 60-km mesh model ensemble, hatches show areas where all four different SST experiments showed consistent changes in sign. The contour interval is 1 mm/day. The contour line for 0 mm/day is suppressed for the 60-km mesh model ensemble; the 20-km mesh model precipitation is shown without contours.

Future hydroclimate changes over Central America and the Caribbean2014 21
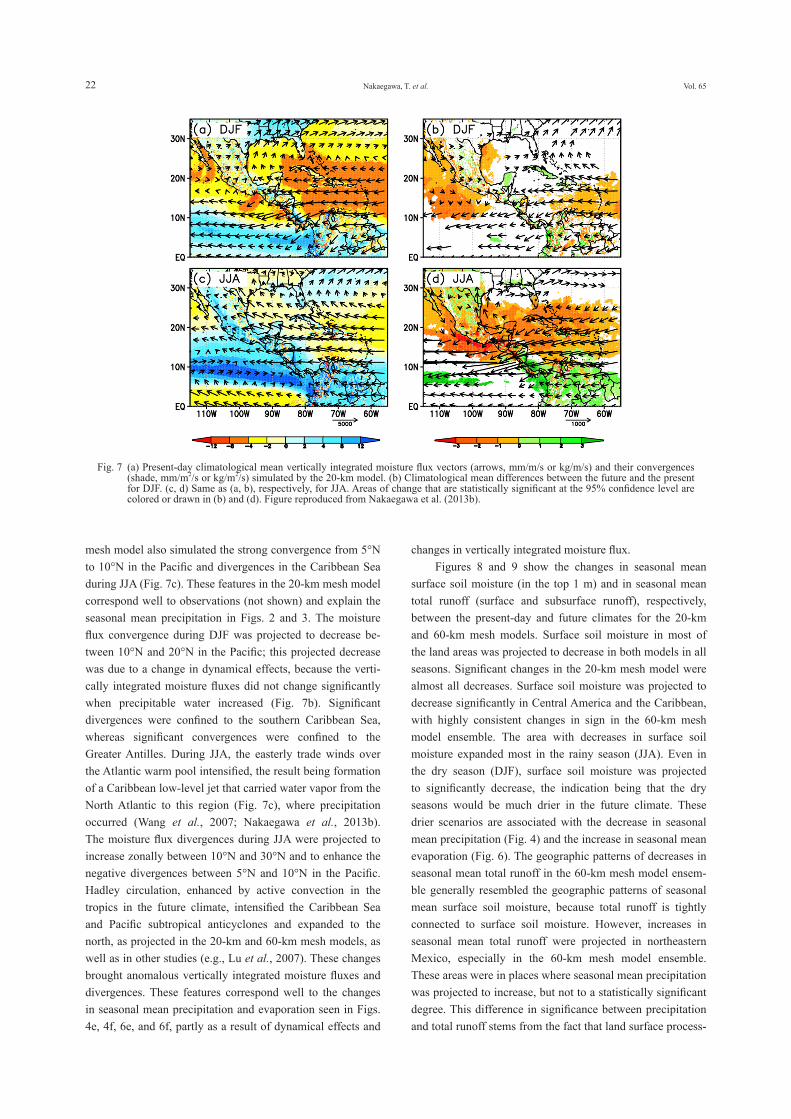
SON). However, Mexico is an exception. Throughout the year, seasonal mean evaporation was projected to decrease in about half of Mexico, where precipitation was projected to decrease in the future climate, and decreasing soil moisture (discussed next) was projected to restrict evaporation. The 20-km mesh model showed a larger increase in evaporation and more detailed geographic features in both land and ocean areas than the 60-km mesh model ensemble, for example in the Greater Antilles in JJA and the southern Caribbean Sea in MAM. Climatological mean, vertically integrated moisture flux convergence was in balance with climatological mean precipitation minus evaporation. The 20-km mesh model simulated the easterly moisture flux from the Caribbean Sea to the Pacific and the divergence fields to the north of 10°N during DJF in the present-day climate (Fig. 7a). The 20-km
Fig. 5 Changes in TC-induced annual mean precipitation (mm/day) between the present-day and future climates for the 20-km mesh model.
Fig. 6 Same as in Fig. 4 but for evaporation (mm/day). Contour interval is 0.2 mm/day; contours for changes of 0.4 mm/day or more are suppressed.
Nakaegawa, T. et al. Vol. 6522
mesh model also simulated the strong convergence from 5°N to 10°N in the Pacific and divergences in the Caribbean Sea during JJA (Fig. 7c). These features in the 20-km mesh model correspond well to observations (not shown) and explain the seasonal mean precipitation in Figs. 2 and 3. The moisture flux convergence during DJF was projected to decrease be-tween 10°N and 20°N in the Pacific; this projected decrease was due to a change in dynamical effects, because the verti-cally integrated moisture fluxes did not change significantly when precipitable water increased (Fig. 7b). Significant divergences were confined to the southern Caribbean Sea, whereas significant convergences were confined to the Greater Antilles. During JJA, the easterly trade winds over the Atlantic warm pool intensified, the result being formation of a Caribbean low-level jet that carried water vapor from the North Atlantic to this region (Fig. 7c), where precipitation occurred (Wang et al., 2007; Nakaegawa et al., 2013b). The moisture flux divergences during JJA were projected to increase zonally between 10°N and 30°N and to enhance the negative divergences between 5°N and 10°N in the Pacific. Hadley circulation, enhanced by active convection in the tropics in the future climate, intensified the Caribbean Sea and Pacific subtropical anticyclones and expanded to the north, as projected in the 20-km and 60-km mesh models, as well as in other studies (e.g., Lu et al., 2007). These changes brought anomalous vertically integrated moisture fluxes and divergences. These features correspond well to the changes in seasonal mean precipitation and evaporation seen in Figs. 4e, 4f, 6e, and 6f, partly as a result of dynamical effects and
changes in vertically integrated moisture flux.Figures 8 and 9 show the changes in seasonal mean
surface soil moisture (in the top 1 m) and in seasonal mean total runoff (surface and subsurface runoff), respectively, between the present-day and future climates for the 20-km and 60-km mesh models. Surface soil moisture in most of the land areas was projected to decrease in both models in all seasons. Significant changes in the 20-km mesh model were almost all decreases. Surface soil moisture was projected to decrease significantly in Central America and the Caribbean, with highly consistent changes in sign in the 60-km mesh model ensemble. The area with decreases in surface soil moisture expanded most in the rainy season (JJA). Even in the dry season (DJF), surface soil moisture was projected to significantly decrease, the indication being that the dry seasons would be much drier in the future climate. These drier scenarios are associated with the decrease in seasonal mean precipitation (Fig. 4) and the increase in seasonal mean evaporation (Fig. 6). The geographic patterns of decreases in seasonal mean total runoff in the 60-km mesh model ensem-ble generally resembled the geographic patterns of seasonal mean surface soil moisture, because total runoff is tightly connected to surface soil moisture. However, increases in seasonal mean total runoff were projected in northeastern Mexico, especially in the 60-km mesh model ensemble. These areas were in places where seasonal mean precipitation was projected to increase, but not to a statistically significant degree. This difference in significance between precipitation and total runoff stems from the fact that land surface process-
Fig. 7 (a) Present-day climatological mean vertically integrated moisture flux vectors (arrows, mm/m/s or kg/m/s) and their convergences (shade, mm/m2/s or kg/m2/s) simulated by the 20-km model. (b) Climatological mean differences between the future and the present for DJF. (c, d) Same as (a, b), respectively, for JJA. Areas of change that are statistically significant at the 95% confidence level are colored or drawn in (b) and (d). Figure reproduced from Nakaegawa et al. (2013b).

Future hydroclimate changes over Central America and the Caribbean2014 23
es enhance the signals of changes in climatological means and suppress the effects of internal variabilities, because sur-face hydrological processes accumulate precipitation as soil moisture and shift white noise to red noise (e.g., Delworth and Manabe, 1988; Nakaegawa et al., 2003). In the 20-km mesh model, the areas of significant decrease in seasonal mean total runoff resembled those in the 60-km mesh model ensemble, but the areas of increased runoff varied, for exam-ple, in northeastern Mexico during MAM and in Nicaragua during JJA.
Wang (2005) examined seasonal mean soil moisture in the future climate based on an MME analysis of 15 CMIP3 models is and found a highly consistent decrease among these models in seasonal mean soil moisture in the future
climate during DJF and JJA. Our surface soil moisture results (Fig. 8) are consistent with Wang’s findings, and they go fur-ther in showing geographic details that have not previously been available because of the coarse horizontal resolution of CMIP3 models.
These drying trends in the future climate in Central America and the Caribbean are associated with a southward shift of the ITCZ in the eastern Pacific (Fig. 4) and an inten-sification of low-level easterlies (Vecchi and Soden, 2007) and the Caribbean low-level jet (Rauscher et al., 2008; Na-kaegawa et al., 2013b) as a result of the anomalous vertically integrated moisture flux vectors (Figs. 7c and 7d). Rauscher et al. (2011) performed a sensitivity experiment to identify the influences of SST patterns (cooling over the tropical
Fig. 8 Same as in Fig. 4, but for surface soil moisture (%).

Nakaegawa, T. et al. Vol. 6524
North Atlantic, El Niño–like pattern over the Pacific, and others) on the drying trend and quantified the contributions of the SSTs projected by the CMIP3 MME to the drying trend. They demonstrated that SST changes in the eastern tropical Pacific exceeding those in the tropical North Atlantic intensify the dryness over Central America and the Caribbean in the present-day climate. We found similar effects with the CMIP3 MME, CSIRO, and MIROC models, but we found the opposite effect with the MRI models. This inconsistency in sign affected the robustness of the results, as shown by the distribution of hatching in Fig. 4 for the 60-km mesh model ensemble. Results like these highlight the potential of the multi-SST approach that we chose for the 60-km mesh model ensemble to quantify the uncertainties in climate projections.
On a seasonal mean time scale, the merits of the
high-resolution models are diluted because the large-scale phenomena resolvable in coarse resolution models control the regional-scale phenomena in this time domain. However, better reproducibilities of the present-day climatologies in the high-resolution models increase the reliability of the future climate projections. In addition, high-resolution results are useful for impact assessments of climate changes on human activities because their spatial scale is small compared to the horizontal resolution of the atmospheric models, and their possible countermeasures depend solely on locations.
3.2 Annual mean geographical pattern of streamflowFigure 10 shows the change in climatological annual
mean streamflow between the present-day and future cli-mates in the 20-km and 60-km mesh models. In the 20-km
Fig. 9 Same as in Fig. 4 but for total runoff change (mm/day).

Future hydroclimate changes over Central America and the Caribbean2014 25
mesh model, annual mean streamflow in the future climate was projected to decrease in most of Central America and the Caribbean (Fig. 10b). The 60-km mesh model ensemble showed similar consistent changes in the future climate in most areas north of about 13°N (Fig. 10a). Although the change in streamflow in northeastern Mexico was not sig-nificant in the 20-km mesh model, the 60-km mesh model ensemble projected a significant increase, but with low con-sistency. As was the case with the changes in seasonal mean total runoff (Fig. 9), the geographic distribution of changes in seasonal mean streamflow varied with seasons (not shown).
Previous projections of global-scale annual mean stream-flow (Milly et al., 2005; Nohara et al., 2006; Nakaegawa et al., 2013a) have shown consistent decreases in the study region, although small-scale patterns could not be identified. Maurer et al. (2009) reported that annual mean streamflow in the Rio Lempa basin, including portions of El Salvador, Honduras, and Guatemala, was projected to decrease by 13% to 24% based on an MME analysis, which is qualitatively consistent with results from both the 20-km and 60-km mesh models in this study.
In previous global-scale projections, the coarse horizon-tal resolutions of the CMIP3 models, which are incapable of resolving complex terrain, and the MME mean process have erased any small-scale characteristics in the distribution of annual mean streamflow. River routing models provide streamflows at fine resolutions, such as 0.5° and 1°, but they often use coarse-resolution inputs of CMIP3 models. Such streamflows are meaningful only for continental-scale basin areas. High-resolution inputs from the 20-km and 60-km mesh models enable the 0.5° resolution of geographic streamflow distributions to yield meaningful information at the same scale.
3.3 Seasonal water cycles over land areas for each domain3.3.1 Reproducibility
Figure 11 shows the seasonal mean land-only precip-itation during DJF and JJA, averaged for each of our four
domains. For the present-day climate, we compared the 20-km and 60-km mesh model simulations with the two high- resolution observational datasets (CRU and TRMM 3B43), in which land-only precipitation was obtained by multiplying grid values by the proportion of land area for each pixel. The land-only precipitation features were different in CRU and TRMM 3B43 for all domains and seasons shown, except for Mexico during DJF. Similar differences were also found between the features of precipitation datasets of the TRMM and Global Precipitation Climatology Project (GPCP; Adler et al., 2003) for Central America (Diro et al., 2012). This finding implies that multiple high-resolution observational datasets are required to validate a model’s reproducibility, especially for a domain with small land-area.
For Mexico, the seasonal contrast between DJF and JJA was reproduced well in both the 20-km and 60-km mesh models, although precipitation during JJA was overestimated (Figs. 11a and 11b). For Central America (Figs. 11c and 11d) and the Greater Antilles (Figs. 11e and 11f), the uncertainty in the observations was large, especially during JJA. Despite this uncertainty, both the models simulated seasonal means and contrasts for both the seasons well, except that precipita-tion during JJA was overestimated in the Greater Antilles.
The Lesser Antilles consists of many small islands, none larger than about 1450 km2 (Basse-Terre and Grande-Terre Islands), the total land area being about 7900 km2. The 20-km mesh model represents only about 2800 km2 of land area, or 36% of the actual land area, and the 60-km mesh model rep-resents no land at all. Therefore, only the 20-km mesh model results are presented in Figs. 11g and 11h. The 20-km mesh model captured the seasonal means and contrasts during both DJF and JJA, despite the quite large uncertainty in observa-tions.
3.3.2 ProjectionsFigure 12 shows the projected climatological mean
monthly land-only precipitation for the 20-km mesh model and the three-member 60-km mesh model ensemble. In Mexico, Central America, and the Greater Antilles, the
Fig. 10 Changes in annual mean streamflow (%) between the present-day and the future for (a) 60-km mesh model ensemble and (b) 20-km mesh model. Areas statistically significant at the 95% confidence level are colored, and areas where all four different SST experi-ments with the 60-km mesh model showed consistent changes in sign are hatched in (a).

Nakaegawa, T. et al. Vol. 6526
precipitations projected by the three members of the 60-km mesh model ensemble were almost the same. In addition, the ensemble mean for each SST experiment was close to that of the CMIP3 ensemble mean SST experiment (the right part of each panel in Fig. 11), the suggestion being that the SST pro-jected by the CMIP3 ensemble mean is probable. Therefore,
if we perform a four-SST ensemble experiment using the 20-km mesh model, we can expect to obtain results similar to the CMIP3 ensemble mean SST experiment as long as we apply the same experimental setup. This conclusion cannot be extended beyond these domains, because the Amazon domain shows relatively larger scatter among the different
Fig. 11 Climatological mean land-only precipitation in (a, b) Mexico, (c, d) Central America, (e, f) Greater Antilles, and (g, h) Lesser Antilles during DJF (left) and JJA (right). Left and right parts of each panel show climatological means for the present-day and future climates, respectively. Horizontal lines represent the ensemble mean of all nine members in the 60-km mesh model.

Future hydroclimate changes over Central America and the Caribbean2014 27
Fig. 12 Seasonal cycle of average land-only monthly mean precipitation, evaporation, and total runoff in the 20-km mesh model and their changes between the present-day and future climate for the 20-km mesh model and the 60-km mesh model ensemble for (a–c) Mexico, (d–f) Central America, (g–i) Greater Antilles, and (j–l) Lesser Antilles. Upper panels: Dashed and solid lines denote the present-day and future climatological means, respectively, for the 20-km mesh model. Lower panels: Thick and thin solid lines de-note the future minus present-day climatological means for the 20-km mesh model and 60-km mesh model ensemble, respectively. Circles denote statistically significant changes at the 95% confidence level for the 20-km mesh model (solid circles) and the 60-km mesh model ensemble (open circles). Units are all in mm/day.

Nakaegawa, T. et al. Vol. 6528
SST experiments (Kitoh et al., 2011).In Mexico, rainy-season (JJA) precipitation in the
20-km mesh model was projected to significantly decrease in the future climate (Figs. 11b and 12a). In the dry season (DJF), precipitation was projected to decrease (Figs. 11a and 12a). Evaporation was projected to increase in the rainy season and to decrease in the dry season (Fig. 12b), a pattern that is con-sistent with the change in precipitation, because evaporation is controlled by available surface soil moisture rather than by net radiation at the surface in this domain. Total runoff was therefore projected to decrease throughout the year, es-pecially in the rainy season (Fig. 12c). These changes in the future climate in the 20-km mesh model resemble those of the 60-km mesh model ensemble; significant changes are all consistent between the 20-km and 60-km mesh models.
In Central America, precipitation in the 20-km mesh model was projected to increase in the rainy season and to decrease in the dry season (Figs. 11c, 11d, and 12d), thus amplifying the seasonality in precipitation. In response to the precipitation increase in the rainy season, evaporation was projected to increase (Fig. 12e). Total runoff in the rainy season was projected to increase in the 20-km mesh model (Fig. 12f) and to decrease in the 60-km mesh model ensem-ble, the suggestion being that this projection is associated with high uncertainty.
In the IPCC reports, “Central America” includes both Mexico and Central America as defined in this study (see Fig. 1). Seasonal mean precipitation is projected to decrease in “Central America” (Wang, 2005; Giorgi, 2006; IPCC, 2007a). Our results show that precipitation is likely to increase in certain months and certain domains, even if seasonal mean precipitation is projected to decrease. This finding suggests that high-resolution projections of future climate are essential for assessing local impacts of climate change.
In the Greater Antilles, precipitation was projected to decrease from April to October in both the 20-km and 60-km
mesh models (Fig. 12g). This decrease exceeded 1 mm/day (15%) during JJA (Fig. 11f). Both models showed almost the same seasonal cycles of changes in evaporation (Fig. 12h). Evaporation was projected to significantly decrease from February to April (FMA) because of the deficit in surface soil moisture caused by decreased precipitation. The decrease of evaporation is more sensitive to the decrease of precipitation in FMA than in May to September (MJJAS) because it is wetter in MJJAS, the peak of the rainy season, than in FMA. Therefore, a small decrease in precipitation in MJJAS does not substantially supress evaporation. However, there was a greater decrease of total runoff than of evaporation in the future climate (Fig. 12i). The fact that the 20-km mesh model showed a greater decrease in total runoff than the 60-km mesh model ensemble is consistent with the differences of their projections of decreased precipitation.
In the Lesser Antilles, precipitation was projected to de-crease from February to October, except for August, although the decreases were significant only in April and September (Fig. 12j). Evaporation was projected to decrease from February to July in response to a deficit in surface soil moisture (Fig. 12k). Because of the commensurate decreases in both precipitation and evaporation, total runoff was pro-jected to remain almost the same (Fig. 12l), except for slight decreases from September to November. Figure 13 shows projected results for the whole rectangular area of the Lesser Antilles, including land and ocean. Precipitation changes in the whole rectangular area resembled those in the land-only areas in this experiment, but changes in evaporation did not. This difference between land-only and total area changes resulted in an overestimate of decreases in total runoff. The fact that the 60-km mesh model does not capture any land areas in the Lesser Antilles hinders quantitative assessment of uncertainty in these projections. Nevertheless, as the first projection to incorporate land areas of the Lesser Antilles, these results may be informative.
Fig. 13 Seasonal cycle of average combined land and ocean monthly mean precipitation and evaporation simulated by the 20-km mesh model and their changes between the present-day (dashed) and future (solid) climate for the 20-km mesh model for the Lesser Antilles. Units are all in mm/day.

Future hydroclimate changes over Central America and the Caribbean2014 29
3.4 Annual mean hydroclimate variables over individual countries
The 20-km and 60-km mesh models can simulate future climate changes on a smaller domain scale than previous methods. Projections of domains that correspond to coun-tries may be useful for studies of impacts, adaptations, and mitigations. Table 2 shows projected future changes in pre-cipitation, evaporation, and total runoff for each country in our study area. The 20-km mesh model fails to represent two small island nations, the nation of Dominica and the nation of Saint Vincent and the Grenadines, where precipitation and evaporation are obtained from ocean grid cells, and runoff is not available; therefore, even the 20-km mesh model cannot always provide reasonable projections, as seen in Fig. 13. In addition to these two countries, the 60-km mesh model en-semble fails to represent the nation of Saint Kitts and Nevis and the nation of Saint Lucia.
The projections were inconsistent for most countries, although highly consistent changes were projected for Cuba, the Bahamas, and Puerto Rico. For Mexico, the changes in
all of the variables were small in the 60-km mesh ensemble; however, there was a large decrease of runoff projected by the 20-km mesh model that could be explained by the uncertainty in the projected SSTs, which falls within the error range of the changes in the 60-km mesh ensemble. The 20-km and 60-km mesh model ensembles projected changes that were opposite in sign for all three variables (precipitation, evaporation, and runoff) for Costa Rica and Panama. These results demonstrate the difficulty in projecting the future hydroclimate on a country scale, even with current AOGCMs or AGCMs, because small differences such as small-scale shifts of anticyclones and slight differences of SST changes in degree and pattern distinctly affect the hydroclimate changes at the scale of countries. Impact studies often use future climate projections that are dynamically downscaled by an RCM forced with results from an AOGCM; however, the uncertainties at the country scale underline the importance of multi-model approaches for impact studies (Boulanger et al., 2010; Ishizaki et al., 2012).
Table 2. Future changes in annual mean hydroclimate variables for each country in Central America and the Caribbean. P, E, and R represent precipitation, evaporation, and total runoff (%), respectively. S and H represent annual means for the 20-km mesh model and the 60-km mesh model ensemble, respectively, and CV represents the coefficient of variation within the 60-km mesh model ensemble forced with four different SST datasets.
Country Statistics P E R Country Statistics P E R
Belize SH
CV
−5.3−1.1
6.8
4.8−1.1
3.0
−44.8−3.182.4
Mexico SH
CV
−2.70.33.6
0.80.51.6
−17.2−0.822.2
Costa Rica SH
CV
5.3−5.511.1
5.1−1.4
2.4
5.3−15.9
37.6
Nicaragua SH
CV
1.1−4.5
9.7
3.6−1.7
3.4
−2.3−11.6
25.8
Cuba SH
CV
−11.2−2.6
6.4
−4.9−2.1
4.2
−63.90.0
520.0
Panama SH
CV
8.4−3.3
4.4
4.8−0.5
2.2
12.0−8.912.9
Dominican Republic SH
CV
−12.0−4.012.0
−1.5−3.0
7.0
−50.219.2
311.5
Saint Kitts and Nevis SH
CV
2.23.16.4
3.13.16.2
7.3
El Salvador SH
CV
−3.2−2.7
4.2
5.0−2.0
1.5
−13.8−5.518.1
The Bahamas SH
CV
−3.0−3.7
7.4
0.0−0.5
1.9
−26.8−3.6
5.3
Grenada SH
CV
0.8−4.3
5.9
8.1−3.2
2.2
13.8−10.9
34.8
Trinidad and Tobago SH
CV
−1.00.10.9
5.4−0.2
2.9
−31.33.0
12.1
Guatemala SH
CV
−4.5−1.4
8.0
3.8−0.8
1.4
−19.3−4.344.6
Dominica SH
CV
−10.2−8.720.2
0.3−0.3
4.1
Haiti SH
CV
−3.9−1.6
5.4
3.7−1.4
4.9
−27.9−3.226.8
Puerto Rico (U.S.A.) SH
CV
−12.4−6.022.5
−4.6−6.022.1
−61.80.0
400.0
Honduras SH
CV
−7.6−3.0
7.9
2.8−1.9
3.0
−32.7−8.332.5
Saint Lucia SH
CV
−3.8 2.6 28.5
Jamaica SH
CV
−9.0−3.817.1
0.4−2.411.4
−25.90.00.0
Saint Vincent and The Grenadines
SH
CV
−5.0 5.8

Nakaegawa, T. et al. Vol. 6530
projected SSTs and sea-ice concentrations and by preparing three different initial conditions, we constructed a 60-km mesh model ensemble to quantify uncertainties in the future climate. The results showed that areas with consistent chang-es in sign among the four SST scenarios in the 60-km mesh model ensemble corresponded well to areas with statistically significant changes in the 20-km mesh model.
5. Conclusions
We used 20-km and 60-km mesh global atmospheric models to investigate future climate projections for Central America and the Caribbean and to quantify uncertainty in the projections. These horizontal resolutions are comparable to the resolution of regional climate models for a large region.
The 20-km mesh model projected that precipitation would decrease over most of this region during all four sea-sons in the future climate. Significant precipitation increases over land areas were confined to the eastern Sierra Madres during MAM and to Costa Rica and Panama during JJA. Precipitation was projected to decrease over most Caribbean countries. Evaporation from the ocean was projected to increase throughout the year, except in the ITCZ. In land areas, evaporation was generally projected to decrease in the dry season and to increase in the rainy season. Therefore, both models projected decreased surface soil moisture and total runoff in most land areas in all seasons. Areas where there were significant changes in the 20-km mesh model corresponded well to areas where changes were consistent in sign among the ensemble of 60-km mesh models. These hydroclimate changes were associated with atmosphere and land-surface interactions.
In land-only areas, the seasonal water cycle in the future climate displayed changes on a monthly time frame; during JJA, precipitation was projected to increase in Central Amer-ica and to decrease in Mexico and the Greater and Lesser An-tilles; however, the monthly changes in precipitation differed between Mexico and the Greater Antilles. Similar patterns were apparent in evaporation and total runoff.
For an individual country, projections of the future hydroclimate on a country scale, even with the 20-km and 60-km mesh models, were highly uncertain, because the cur-rent AOGCMs or AGCMs cannot project slight differences in SST changes and small-scale hydroclimate changes without large uncertainties in the projections. These uncertainties se-riously confound projected hydroclimate changes at the scale of countries.
For future climate projections in a specific region, an ensemble approach involving multiple GCMs and multiple RCMs (e.g., Christensen and Christensen, 2007; Kendon et al., 2010) can directly quantify the uncertainty due to vari-ous GCM-RCM combinations. For a high-resolution AGCM, an ensemble approach using different physical schemes in the same 60-km mesh mode may be a feasible way to address
4. Discussion
Several important processes are not always included in CMIP3 AOGCMs and MRI AGCMs. Given our limited current knowledge of Earth systems, failure to take into account these processes may produce notable uncertainties. In this experimental design, we assumed that oceanic phe-nomena in the future climate would remain the same as in the present-day climate. Models in the 5th phase of CMIP, subsequent to CMIP3, do not agree as well as the CMIP3 models with respect to their projected changes in strength and frequency of ENSO (Stevenson et al., 2012), although ENSO may influence climate variability in this region in the future climate as well as in the present-day climate (e.g. Giannini et al., 2000). In this regard, our assumption of no change in oceanic phenomena may be justified. We also assumed that the present-day land cover would not change in the future climate. However, agroclimatic changes and carbon fertiliza-tion effects will modify agricultural activities and hence alter land cover, both qualitatively and quantitatively (e.g., Salazar et al., 2007). Changes in land cover influence hydroclimate projections, because land cover is tightly linked to surface hydrological cycles. For small regions such as the Central American and Caribbean nations, land cover may have large impacts on hydroclimate projections.
We considered three uncertainties in future climate pro-jections: horizontal resolution within a single model, natural variability within a single model, and differences in projected SSTs and sea-ice concentrations among the CMIP3 MME. Significant differences in future climate phenomena occur when the horizontal resolution varies, and higher-horizontal- resolution models more accurately reproduce present-day climatologies (see Figs. 2 and 3). For example, the probabil-ity density functions of the 5-day rainfall total depend on the horizontal resolutions in complex land areas, and especially in mountainous areas (Nakaegawa et al., 2013c). Natural variabilities often obscure future changes due to global warming. As a typical example, the large natural variability of precipitation makes detection of future precipitation changes difficult. This fact is apparent in the precipitation changes projected with the 20-km mesh model because of its small number of degrees of freedom. The problem is appar-ent from a comparison between the left and right columns of Figs. 4, 6, 8, 9, and 10. Under the same emission scenario, different models project different changes in the spatial pat-terns of temperature (see Fig. 8 in Nakaegawa et al. (2013c)) and future changes in global mean temperature that range from 1.43 to 3.49°C. The 60-km mesh model ensemble may be the best set-up among all the combinations in the four SST-ensemble experiments.
The 20-km mesh model can provide information at high horizontal resolutions equivalent to those of RCMs; however, we had inadequate computational resources to use it in en-semble experiments. Therefore, by prescribing four different
Future hydroclimate changes over Central America and the Caribbean2014 31
the uncertainty associated with a single 20-km mesh model approach or to model structures.
Impact studies require high-resolution projections of future climate because populations and land-surface types and processes are heterogeneous at all spatial scales, and low-resolution future climate projections can yield mislead-ing quantitative changes. Future climate projections from the 20-km mesh model have been widely used for projections of streamflow (Kitoh et al., 2008; Nakaegawa and Vergara, 2010; Fabrega et al. 2013) and ocean waves (Mori et al., 2010). We expect that this study will help to improve impact assessments and adaptation studies at local levels around the world, especially in Central America and the Caribbean.
Acknowledgements
This work was funded by the Ministry of Education, Culture, Sports, Science and Technology of Japan under the SOUSEI Program Theme C “Development of Infrastructural Technology for Risk Information on Climate Change.” The Earth Simulator of the Japan Agency for Marine-Earth Science and Technology (JAMSTEC) made it possible to perform the demanding calculations.
References
Adler, R. F., G. J. Huffman, D. T. Bolvin, S. Curtis and E. J. Nelkin, 2000: Tropical rainfall distributions determined using TRMM combined with other satellite and rain gauge information. J. Appl. Meteorol., l39, 2007−2023, doi:10.1175/1520-0450(2001)040<2007:TRDDUT>2.0.CO;2.
Adler, R., G. Huffman, A. Chang, R. Ferraro and others, 2003: The Version 2 Global Precipitation Climatology Project (GPCP) monthly precipitation analysis (1979−Present), J. Hydrometeo-rol., 4, 1147−1167.
Angeles, M. E., J. E. Gonzalez, D. J. Erickson III and J. L. Hernández, 2007: Predictions of future climate change in the Caribbean region using global general circulation models. Int. J. Climatol., 27, 555−569, doi:10.1002/joc.1416.
Biasutti, M., A. H. Sobel, S. J. Camargo and T. T. Creyts, 2012: Projected changes in the physical climate of the Gulf Coast and Caribbean. Climatic Change, 112, 819−845, doi:10.1007/s10584-011-0254-y.
Boulanger, J.-P., G. Brasseur, A. F. Carril, M. de Castro, N. Degallier, C. Ereño, H. Le Treut, J. A. Marengo, C. G. Menendez, M. N. Nuñez, O. C. Penalba, A. L. Rolla, M. Rusticucci and R. Terra, 2010: A Europe–South America network for climate change assessment and impact studies. Climatic Change, 98, 307−329, doi:10.1007/s10584-009-9734-8.
Bueno, R., C. Herzfeld, E. Stanton and F. Ackerman, 2008: The Caribbean and climate change: the costs of inaction. Tech. rep., Stockholm Environment Institute—US Center, Global Develop-ment and Environment Institute, Tufts University, Somerville, MA.
Campbell, J. D., M. A. Taylor, T. S. Stephenson, R. A. Watson and F. S. Whyte, 2011: Future climate of the Caribbean from a region-
al climate model. Int. J. Climatol., 31, 1866−1878, doi:10.1002/joc.2200.
Christensen, J. H. and O. B. Christensen, 2007: A summary of the PRUDENCE model projections of changes in European climate by the end of this century. Climatic Change, 81, 7−30.
Christensen, J. H., et al., 2007: Regional Climate Projections. In Climate Change 2007: The Physical Science Basis. Contribu-tion of Working Group I to the Fourth Assessment Report of the Intergovernmental Panel on Climate Change. S. D. Solomon et al. eds, Cambridge University Press, Cambridge, United Kingdom and New York, NY, USA. pp.847−940.
Clement, A., C. Baker and J. Leloup, 2010: Climate change: Patterns of tropical warming. Nature Geoscience, 3, 8−9, doi:10.1038/ngeo728.
Delworth, T. L. and S. Manabe, 1988: The influence of potential evaporation on the variabilities of simulated soil wetness and climate. J. Climate, 1, 523−547.
Diro, G. T., S. A. Rauscher, F. Giorgi and A. M. Tompkins, 2012: Sensitivity of seasonal climate and diurnal precipitation over Central America to land and sea surface schemes in RegCM4. Climate Res., 52, 31−48, doi:10.3354/cr01049.
Enfield, D. B.,1996: Relationships of Inter–American rainfall to trop-ical Atlantic and Pacific SST variability. Geophysical Research Letters, 23, 3305−3308, doi:10.1029/96GL03231.
Fábrega, J., T. Nakaegawa, R. Pinzón, K. Nakayama, O. Arakawa, SOUSEI Theme-C modeling group: Hydroclimate projections for Panama in the 21st Century. Hydrological Research Letters. Hydrol. Res. Lett., 23−29.
Giannini, A., M. A. Cane and Y. Kushnir, 2000: Interdecadal changes in the ENSO teleconnection to the Caribbean region and the North Atlantic Oscillation. J. Climate, 14, 2867−2879.
Giorgi, F., 2006: Climate change Hot-Spots. Geophys. Res. Lett., 33, L08707, doi:10.1029/2006GL025734.
Higgins, W. and D. Gochis, 2007: Synthesis of Results from the North American Monsoon Experiment (NAME) Process Study. J. Climate, 20, 1601−1607, doi:10.1175/JCLI4081.1.
IPCC, 2007a: Climate Change 2007: The Physical Science Basis, Contribution of Working Group I to the Fourth Assessment Report of the Intergovernmental Panel on Climate Change. S. Solomon et al. eds, Cambridge Univ. Press, Cambridge, United Kingdom and New York, NY, USA.
IPCC, 2007b: Climate Change 2007: Impacts, Adaptation and Vulnerability, Contribution of Working Group II to the Fourth Assessment Report of the Intergovernmental Panel on Climate Change. M. L. Parry et al. eds, Cambridge University Press, Cambridge, United Kingdom and New York, NY, USA.
IPCC, 2012: Managing the Risks of Extreme Events and Disasters to Advance Climate Change Adaptation. A Special Report of Working Groups I and II of the Intergovernmental Panel on Climate Change. C. B. Field et al. eds, Cambridge University Press, Cambridge, UK, and New York, NY, USA, 582 pp.
Ishizaki, Y., T. Nakaegawa and I. Takayabu, 2012: Validation of the precipitation simulated by three regional climate models and two multi-model ensemble means over Japan for the period 1985−2004 simulated by three regional climate models and two multi-model ensemble means. Climate Dynamics, 39, 185−206, doi:10.1007/s00382-012-1304-5.

Nakaegawa, T. et al. Vol. 6532
Kanada, S., M. Nakano and T. Kato, 2010: Changes in mean at-mospheric structures around Japan during July due to global warming in regional climate experiments using a cloud-system resolving model. Hydrol. Res. Lett., 4, 11−14.
Kanamaru, H. and M. Kanamitsu, 2007: Scale-Selective Bias Cor-rection in a Downscaling of Global Analysis Using a Regional Model. Monthly Weather Review, 135, 334−350, doi:10.1175/MWR3294.1
Kendon, E. J., R. G. Jones, E. K. Kjellström and J. M. Murphy, 2010: Using and designing GCM–RCM ensemble regional climate projections. J. Climate, 23, 6485−6503, doi:10.1175/2010JCLI 3502.1.
Kitoh, A., A. Yatagai and P. Alpert, 2008: First super-high-resolution model projection that the ancient “Fertile Crescent” will disap-pear in this century. Hydrol. Res. Lett., 2, 1−4.
Kitoh, A., S. Kusunoki and T. Nakaegawa, 2011: Climate change projections over South America in the late twenty-first century with the 20-km and 60-km mesh MRI-AGCM. J. Geophys. Res., 116, D06105, doi:10.1029/2010JD014920.
Kitoh, A., T. Ose, K. Kurihara, S. Kusunoki, M. Sugi and KAKU-SHIN Team-3 Modeling Group, 2009: Projection of changes in future weather extremes using super-high-resolution global and regional atmospheric models in the KAKUSHIN Program: Results of preliminary experiments. Hydrol. Res. Lett., 3, 49− 53.
Lu, J., G. A. Vecchi and T. Reichler, 2007: Expansion of the Hadley cell under global warming. Geophys. Res. Lett., 34, L06805.
Maurer, E. P., J. C. Adam and A. W. Wood, 2009: Climate model based consensus on the hydrologic impacts of climate change to the Rio Lempa basin of Central America. Hydrol. Earth Syst. Sci., 13, 183−194.
Milly, P. C. D., K. A. Dunne and A. V. Vecchia, 2005: Global pattern of trends in streamflow and water availability in a changing climate. Nature, 438, 347−350.
Mitchell, T. D. and P. D. Jones, 2005: An improved method of constructing a database of monthly climate observations and associated high-resolution grids. Int. J. Climatol., 25, 693−712.
Mizuta, R., K. Oouchi, H. Yoshimura, A. Noda, K. Katayama, S. Yukimoto, M. Hosaka, S. Kusunoki, H. Kawai and M. Naka-gawa, 2006: 20-km-mesh global climate simulations using JMA-GSM model –Mean climate states–. J. Meteor. Soc. Japan, 84, 165−185.
Mizuta, R., Y. Adachi, S. Yukimoto and S. Kusunoki, 2008: Esti-mation of the Future Distribution of Sea Surface Temperature and Sea Ice Using the CMIP3 Multi-model Ensemble Mean. Technical Report of the Meteorological Research Institute, 56, 28 pp.
Mori, N., T. Yasuda, H. Mase, T. Tom and Y. Oku, 2010: Projection of Extreme Wave Climate Change under Global Warming. Hydrol. Res. Lett., 4, 15−19.
Murakami, H. and B. Wang, 2010: Future change of North Atlantic tropical cyclone tracks: Projection by a 20-km-mesh global atmospheric model. J. Climate, 23, 2699−2721.
Nakaegawa, T. and M Hosaka, 2008: Effects of calibrated current speeds and groundwater scheme in a global river-flow model on river discharge and terrestrial water storage. Hydrol. Res. Lett., 2, 18−21, doi:10.3178/hrl.2.18.
Nakaegawa, T., A. Kitoh and M. Hosaka, 2013a: Discharge of major global rivers in the late 21st century climate projected with the high horizontal resolution MRI-AGCMs–overview–. Hydrolog-ical Processes, 27, doi:10.1002/hyp.9831.
Nakaegawa, T., A. Kitoh, Y. Ishizaki, S. Kusunoki and H. Murakami, 2013b: Caribbean low-level jets and accompanying moisture fluxes in a global warming climate projected with CMIP3 multi-model ensemble and fine-mesh atmospheric general circulation models. Inter. Jour. Climatol., doi:10.1002/joc.3733.
Nakaegawa, T., A. Kitoh, H. Murakami and S. Kusunoki, 2013c: Annual maximum 5-day rainfall total and maximum number of consecutive dry days over Central America and the Caribbean in the late twenty-first century projected by an atmospheric general circulation model with three different horizontal resolu-tions. Theor. Appl. Climatol., doi:10.1007/s00704-013-0934-9.
Nakaegawa, T., M. Sugi and K. Matsumaru, 2003: A Long-term Numerical Study of the Potential Predictability of Seasonal Mean Fields of Water Resource Variables using MRI/JMA- AGCM. J. Meteor. Soc. Japan, 81, 1041−1056.
Nakaegawa, T. and W. Vergara, 2010: First Projection of Climato-logical Mean River Discharges in the Magdalena River Basin, Colombia, in a Changing Climate during the 21st Century. Hydrol. Res. Lett., 4, 50−54.
Neelin, J. D., M. Münnich, H. Su, J. E. Meyerson and C. E. Hollo-way, 2006: Tropical drying trends in global warming models and observations. Proc. Nat. Acad. Sci., 103, 6110−6115, doi: 10.1073/pnas.0601798103.
Nohara, D., A. Kitoh, M. Hosaka and T. Oki, 2006: Impact of climate change on river discharge projected by multi-model ensemble. J. Hydrometeorol., 7, 1076−1089.
Oki, T. and Y. C. Sud, 1998: Design of total runoff integrating pathways (TRIP) – a global river channel network. Earth Inter-actions, 2, 1−37.
Rauscher, S. A., F. Giorgi, N. S. Diffenbaugh and A. Seth, 2008: Extension and intensification of the Meso-American mid- summer drought in the twenty-first century. Climate Dyn., 31, 551−571, doi:10.1007/s00382007-0359-1.
Rauscher, S. A., F. Kucharski and D. B. Enfield, 2011: The role of regional SST warming variations in the drying of Meso- America in future climate projections. J. Climate, 24, 2003− 2016, doi:10.1175/2010JCLI3536.1.
Rayner, N. A., D. E. Parker, E. B. Horton, C. K. Folland, L. V. Alex-ander, D. P. Rowell, E. C. Kent and A. Kaplan, 2003: Global analyses of sea surface temperature, sea ice, and night marine air temperature since the late nineteenth century. J. Geophys. Res., 108, 4407, doi:10.1029/2002JD002670.
Ropelewski, C. F. and M. S. Halpert, 1987: Global and regional scale precipitation patterns associated with the El Niño/Southern Oscillation. Monthly Weather Review, 115, 1606−1626.
Salazar, L. F., C. A. Nobre and M. D. Oyama, 2007: Climate change consequences on the biome distribution in tropical South Amer-ica. Geophys. Res. Lett., 34, L09708, doi:10.1029/2007GL 029695.
Smith, J. B., et al., 2011: Coping with climate variability and climate change in La Ceiba, Honduras. Climatic Change, 108, 457− 470, doi:10.1007/s10584-011-0161-2.
Stevenson, S., B. Fox-Kemper, M. Jochum, R. Neale, C. Deser and

Future hydroclimate changes over Central America and the Caribbean2014 33
G. Meehl, 2012: Will there be a significant change to El Nino in the twenty-first century? Journal of Climate, 25, 2129−2145.
Taylor, M. A., F. S. Whyte, T. S. Stephenson and J. D. Campbell, 2012: Why dry? Investigating the future evolution of the Carib-bean Low Level Jet to explain projected Caribbean drying. In-ternational Journal of Climatology, 32, 119−128. doi:10.1002/joc.3461.
Tebaldi, C., K. Hayhoe, J. M. Arblaster and G. A. Meehl, 2006: Going to the extremes; An intercomparison of model-simulated historical and future changes in extreme events. Climatic Change, 79, 185−211.
Vecchi, G. A. and B. J. Soden, 2007: Global Warming and the Weak-ening of the Tropical Circulation. J. Climate, 20, 4316−4340.
Wang, G., 2005: Agricultural drought in a future climate: results from 15 global climate models participating in the IPCC 4th as-sessment. Climate Dyn., 25, 739−753, doi:10.1007/s00382005-0057-9.
Wang, C., S.-K. Lee and D. B. Enfield, 2007: Impact of the Atlantic warm pool on the summer climate of the western hemisphere. J. Climate, 20, 5021−5040.
Xie, P. and P. A. Arkin, 1997: Global precipitation: A 17-year month-ly analysis based on gauge observations, satellite estimates, and numerical model outputs. Bull. Am. Meteorol. Soc., 78, 2539−2558.
Xie, S.-P., C. Deser, G. A. Vecchi, J. Ma, H. Teng and A. T. Witten-berg, 2010: Global warming pattern formation: Sea surface temperature and rainfall. J. Climate, 23, 966−986, doi:10.1175/2009JCLI3329.1.
Xie, S.-Pi., Y. Okumura, T. Miyama and A. Timmermann, 2008: Influences of Atlantic climate change on the tropical pacific via the Central American Isthmus. J. Climate, 21, 3914−3928, doi:10.1175/2008JCLI2231.1.
Zhou, J. and K.-M. Lau, 1998: Does a Monsoon Climate Exist over South America? J. Climate, 11, 1020−1040.
気象研究所 20 km・60 km 格子版全球大気大循環モデルを用いた地球温暖化時における
中央アメリカとカリブ海での水文気候変化
仲江川敏之・鬼頭昭雄・楠 昌司・村上博之・荒川 理(気象研究所気候研究部)
中央アメリカおよびカリブ海地域は時空間的に複雑な気候を示しているにも関わらず、これまで高解像度モデルによる、将
来予測が殆ど行われてこなかった。20 km メッシュと 60 km メッシュ全球大気大循環モデルを用いて、中央アメリカおよびカ
リブ海での今世紀末の水文気候予測を行い、予測の不確実性を定量化した。この二つの水平解像度は、地域気候モデルを利用
する際の粗い水平解像度と同等である。 両解像度モデル共に、観測季節降水パターンを良く再現することができた。今世紀
の終わりまでに、全ての季節、殆どの対象地域で、降水量は減少すると予測された。陸域での蒸発は、一般的に乾季に減少し、
雨季に増加すると予測された一方、海洋での蒸発は、熱帯収束帯を除いて、年間を通じて増加すると予測された。従って、表
層土壌水分と表面流出は、全ての季節、殆どの陸域で、両解像度のモデルによって、減少すると予測された。今世紀末では、
年河川流量が減少すると予測されているが、それは降水量の減少と蒸発の増加に起因している。広い範囲で陸域平均した水文
気象変数は、気節平均、月平均共に、統計的に有意な将来変化が見られた。これとは対照的に、個々の国の領域平均では、年
平均値でも、その変化は有意でなく、非常に不確実であった。