Embed Size (px)
Citation preview
HYDROCHEMICAL DATA BASE FOR THE DEATH VALLEY REGION, CALIFORNIA AND NEVADA
by Diana L. Perfect, Claudia C. Faunt, William C. Steinkampf and A. Keith Turner
U.S. GEOLOGICAL SURVEY
Open-File Report 94-305
Prepared in cooperation with the
NEVADA OPERATIONS OFFICE
U.S. DEPARTMENT OF ENERGY
(Interagency Agreement DE-AI08-92NV10874)
Denver, Colorado 1995
U.S. DEPARTMENT OF THE INTERIOR
BRUCE BABBITT, Secretary
U.S. GEOLOGICAL SURVEY
Gordon P. Eaton, Director
The use of trade, product, industry, or firm names is for descriptive purposes only and does not imply endorsement by the U.S. Government.
For additional information write to: Copies of this report can be purchased from:
Chief, Hydrologic Investigations Program U.S. Geological SurveyYucca Mountain Project Branch Earth Science Information CenterU.S. Geological Survey Open-File Reports SectionBox 25046, MS 421 Box 25286, MS 517Denver Federal Center Denver Federal CenterDenver, CO 80225 Denver, CO 80225
CONTENTS
Abstract.................................................................................................^^ 1mtroduction............................................................................................._^ 1Data sources.......................................................................................................................................................................... 1Presentation of data............................................................................................................................................................... 2Discussion/data limitations................................................................................................................................................... 6
Conventions used........................................................................................................................................................ 6Location accuracy....................................................................................................................................................... 7Methods used in computing cation-anion balances.................................................................................................... 8Editing procedure.......................................... 8Data-base limitations................................................................................................................................................... 9
Summary...........................................................^ 9References cited.................................................................................................................................................................... 9
FIGURES
1. Map showing area of interest.................................................................................................................................... 12. Diagram showing lettering conventions used to define locations............................................................................. 2
TABLES
1. Abbreviations used in the "SITE NAME" column................................................................................................... 32. Column headings for dissolved chemical species..................................................................................................... 43. Data sources and codes............................................................................................................................................. 54. Abbreviations used to define the laboratory which performed the chemical analysis.............................................. 65. Abbreviations used in the "AQUIFER" column....................................................................................................... 66. Abbreviations used in the "LITHOLOGY" column................................................................................................. 67. Abbreviations used in the "SAMPLE SOURCE" column........................................................................................ 68. Abbreviations used in the "COMMENTS" column ................................................................................................. 7
CONVERSION FACTORS
Multiply metric unit By To obtain inch-pound unit
kilometer (km) 0.6214 mile meter (m) 3.281 foot
Degree Celsius (°C) may be converted to degree Fahrenheit (°F) by using the following equation:°F = 9/5(°C) + 32.
Sea level: In this report "sea level" refers to the National Geodetic Vertical Datum of 1929 (NGVD of 1929) a geodetic datum derived from a general adjustment of the first-order level nets of both the United States and Canada, formerly called Sea Level Datum of 1929.
CONTENTS III
Hydrochemical Data Base for the Death Valley Region, California and Nevada
By Diana L. Perfect, Claudia C. Faunt, William C. Steinkampf, andk. Keith Turner
Abstract
Ground-water chemistry data derived from samples collected within an approximately 100,000-square-kilometer area in the Southern Great Basin have been compiled into a digital data base. The data were compiled from published reports, the U.S. Geological Survey (USGS) National Water Information System (NWIS), and previously unpublished USGS files. The data are contained in two compressed files which self- expand into Lotus (.WK1) files. The first file con tains 4,738 records (4.84 megabytes) and repre sents the basic compilation of all identified analyses. The second file is an edited version of the first and contains 3,733 records (3.84 mega bytes). Editing included the removal of duplicate records and the combining of records, when appro priate. The analyses presented are of variable quality and comprehensiveness and include no isotopic data. Of the 3,733 analyses in the edited data base, 58 percent of the major ion concentra tions balance to within ±10 percent. Most of the remaining records are not sufficiently complete for a balance to be calculated.
INTRODUCTION
Yucca Mountain, Nevada, is being studied by the U.S. Department of Energy as a potential site for con struction of a repository for the permanent storage of high-level radioactive waste. As part of this project, the USGS is engaged in studies to describe the site and the regional geologic and hydrogeologic systems. This compilation of ground-water chemistry data is a part of these studies.
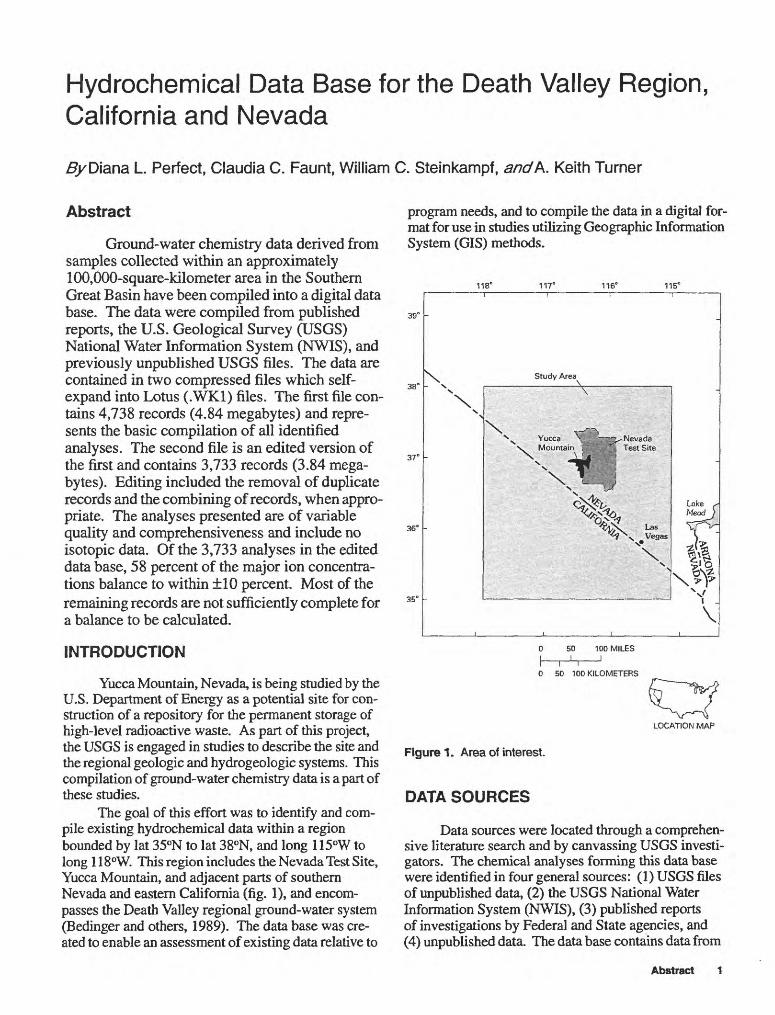
The goal of this effort was to identify and com pile existing hydrochemical data within a region bounded by lat 35°N to lat 38°N, and long 115°W to long 118°W. This region includes the Nevada Test Site, Yucca Mountain, and adjacent parts of southern Nevada and eastern California (fig. 1), and encom passes the Death Valley regional ground-water system (Bedinger and others, 1989). The data base was cre ated to enable an assessment of existing data relative to
program needs, and to compile the data in a digital for mat for use in studies utilizing Geographic Information System (CIS) methods.
118° 117° 116" 115°
39°
38°
37°
36°
35° -
Study Area
*
\Yucca Mountain ,
~2f Nevada Test Site
Vegas
0 50 100 MILESI I II i n0 50 100 KILOMETERS
LOCATION MAP
Figure 1. Area of interest.
DATA SOURCES
Data sources were located through a comprehen sive literature search and by canvassing USGS investi gators. The chemical analyses forming this data base were identified in four general sources: (1) USGS files of unpublished data, (2) the USGS National Water Information System (NWIS), (3) published reports of investigations by Federal and State agencies, and (4) unpublished data. The data base contains data from
Abstract
44 different sources. Dates of the analyses range from 1910 to 1991. The following is a brief discussion of the data sources that provided most of the compiled infor mation.
Data from over 1,800 original USGS laboratory reports were compiled. These data were collected as part of USGS hydrologic investigations in support of U.S. Department of Energy nuclear weapons testing and date from the early 1950's to the mid 1970's. While many of these were unpublished until now, some have been used in previously published USGS reports.
More than 1,300 analyses were retrieved from the NWIS data base for all available sites within the 3- by 3-degree area of interest (fig. 1) for inclusion in this compilation. Additional, unpublished data were obtained in digital form from Thomas and Welch (in press). Some of these records represent the arithmetic average of several analyses for the same sample site at which concentrations varied only slightly from one analysis to another.
PRESENTATION OF DATA
Two versions of the data base are available; both are files built using Lotus 1-2-3. The first, UNEDIT, is an unedited file which contains 4,738 records. The second, DATAEDIT, contains 3,733 records and is an edited version of the first. DATAEDIT primarily dif fers from UNEDIT in that most duplicate records have been removed, some of the records have been made more consistent, and cation-anion balances have been calculated. The information in this report pertains to DATAEDIT.
The files are on two high-density diskettes which accompany this report. They are both in compressed form and are self-expanding as indicated by the .EXE suffix. To expand DATAEDIT.EXE into a file retriev able by Lotus 1-2-3, copy it onto your hard drive and type <DATAEDIT>. The size of the expanded file, DATAEDIT.WK1, is 3.84 megabytes. To similarly expand UNEDIT.EXE, type <UNEDIT>. The size of this expanded file, UNEDIT.WK1, is 4.84 megabytes.
The following is a list of the data-base column headings in DATAEDIT. Column headings for UNEDIT are the same, except "BALANCE" is omit ted.
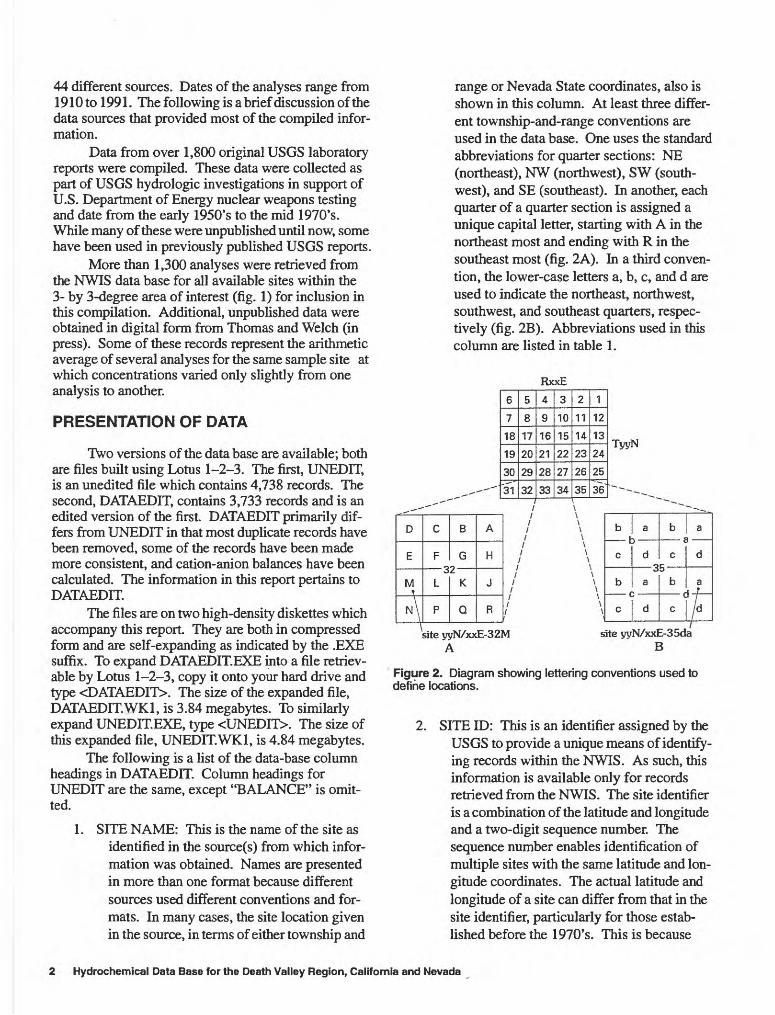
1. SITE NAME: This is the name of the site as identified in the source(s) from which infor mation was obtained. Names are presented in more than one format because different sources used different conventions and for mats. In many cases, the site location given in the source, in terms of either township and
range or Nevada State coordinates, also is shown in this column. At least three differ ent township-and-range conventions are used in the data base. One uses the standard abbreviations for quarter sections: NE (northeast), NW (northwest), SW (south west), and SE (southeast). In another, each quarter of a quarter section is assigned a unique capital letter, starting with A in the northeast most and ending with R in the southeast most (fig. 2A). In a third conven tion, the lower-case letters a, b, c, and d are used to indicate the northeast, northwest, southwest, and southeast quarters, respec tively (fig. 2B). Abbreviations used in this column are listed in table 1.
RxxE
6
7
18
19
30
31
5
8
17
20
29
32
4
9
16
21
28
33
3
10
15
22
27
34
2
11
14
23
26
35
1
12
13
24
25
36
TyyN
D
E
M
H\
C
F 3
L
P
B
G2
K
Q
A
H
J
R
\ \ \ \\ \ \\ \ \ \
\ \
b t
c
b
c
a
d
a
d
b
c
bC
c
a
d
a*~f~
d
site yyN/xxE-32M A
site yyN/xxE-35da B
Figure 2. Diagram showing lettering conventions used to define locations.
2. SITE ID: This is an identifier assigned by the USGS to provide a unique means of identify ing records within the NWIS. As such, this information is available only for records retrieved from the NWIS. The site identifier is a combination of the latitude and longitude and a two-digit sequence number. The sequence number enables identification of multiple sites with the same latitude and lon gitude coordinates. The actual latitude and longitude of a site can differ from that in the site identifier, particularly for those estab lished before the 1970's. This is because
2 Hydrochemical Data Base for the Death Valley Region, California and Nevada
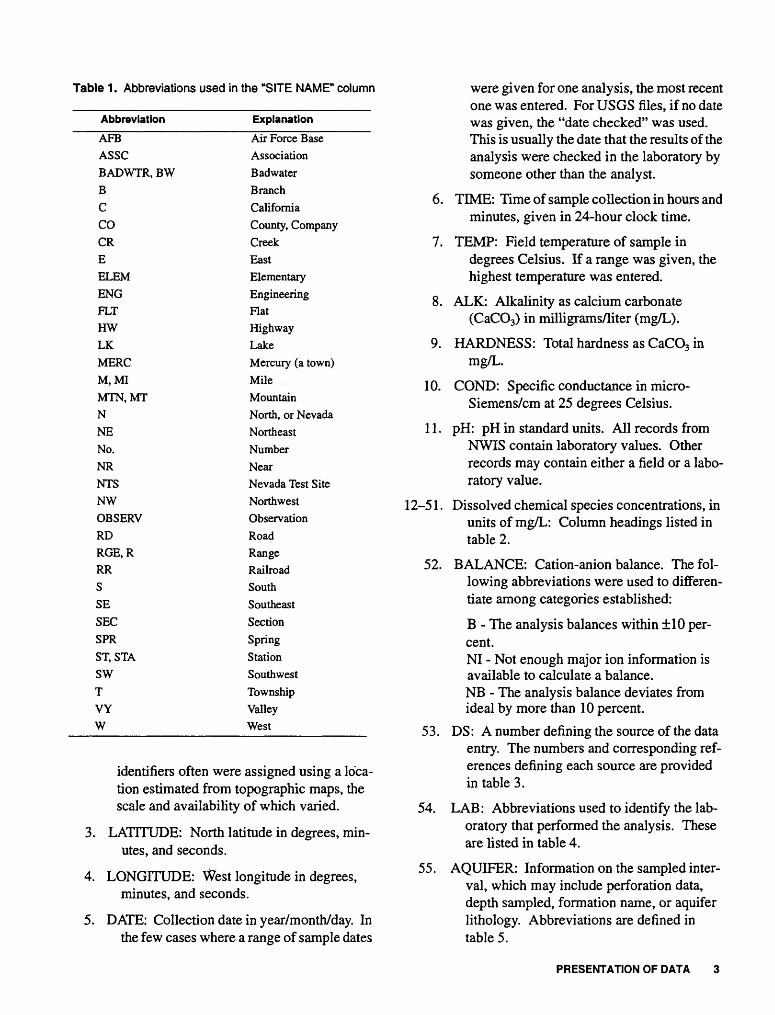
Table 1. Abbreviations used in the "SITE NAME" column
Abbreviation
AFBASSCBADWTR, BWB
CCOCREELEMENGFLTHWLKMERCM,MIMTN.MTNNENo.NRNTSNWOBSERVRDRGE.RRRSSE
SECSPR
ST, STASWTVYW
Explanation
Air Force BaseAssociationBadwaterBranchCaliforniaCounty, CompanyCreekEastElementaryEngineeringFlatHighwayLakeMercury (a town)MileMountainNorth, or NevadaNortheastNumberNearNevada Test SiteNorthwestObservationRoadRangeRailroadSouthSoutheastSection
SpringStationSouthwestTownshipValleyWest
6.
7.
were given for one analysis, the most recent one was entered. For USGS files, if no date was given, the "date checked" was used. This is usually the date that the results of the analysis were checked in the laboratory by someone other than the analyst.
TIME: Time of sample collection in hours and minutes, given in 24-hour clock time.
TEMP: Field temperature of sample in degrees Celsius. If a range was given, the highest temperature was entered.
identifiers often were assigned using a loca tion estimated from topographic maps, the scale and availability of which varied.
3. LATITUDE: North latitude in degrees, min utes, and seconds.
4. LONGITUDE: West longitude in degrees, minutes, and seconds.
5. DATE: Collection date in year/month/day. In the few cases where a range of sample dates
8. ALK: Alkalinity as calcium carbonate (CaCO3) in milligrams/liter (mg/L).
9. HARDNESS: Total hardness as CaCO3 in mg/L.
10. COND: Specific conductance in micro- Siemens/cm at 25 degrees Celsius.
11. pH: pH in standard units. All records from NWIS contain laboratory values. Other records may contain either a field or a labo ratory value.
12-51. Dissolved chemical species concentrations, in units of mg/L: Column headings listed in table 2.
52. BALANCE: Cation-anion balance. The fol lowing abbreviations were used to differen tiate among categories established:
B - The analysis balances within ±10 per cent.NI - Not enough major ion information is available to calculate a balance. NB - The analysis balance deviates from ideal by more than 10 percent.
53. DS: A number defining the source of the data entry. The numbers and corresponding ref erences defining each source are provided in table 3.
54. LAB: Abbreviations used to identify the lab oratory that performed the analysis. These are listed in table 4.
55. AQUIFER: Information on the sampled inter val, which may include perforation data, depth sampled, formation name, or aquifer lithology. Abbreviations are defined in table 5.
PRESENTATION OF DATA
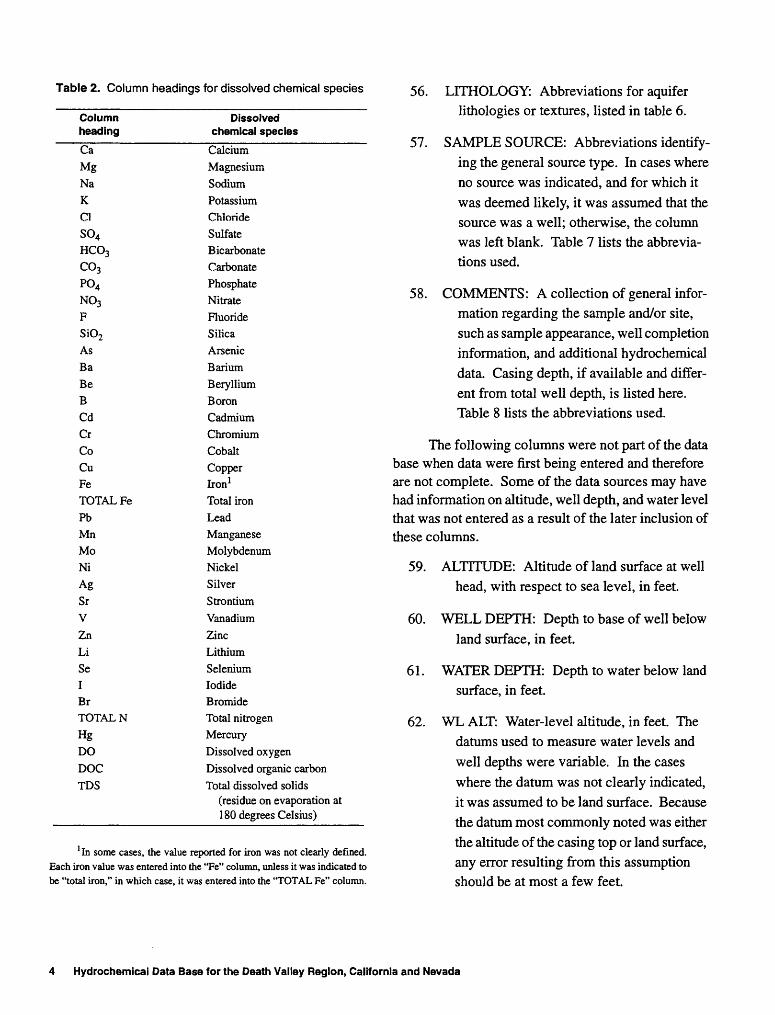
Table 2. Column headings for dissolved chemical species
Column heading
CaMgNaKClSO4HCO3CO3P04N03FSiO2AsBaBeBCdCrCoCu FeTOTAL FePbMnMoNiAgSrVZnLiSeIBrTOTAL NHgDODOCTDS
Dissolved chemical species
CalciumMagnesiumSodiumPotassiumChlorideSulfateBicarbonateCarbonatePhosphateNitrateFluorideSilicaArsenicBariumBerylliumBoronCadmiumChromiumCobaltCopper Iron 1Total ironLeadManganeseMolybdenumNickelSilverStrontiumVanadiumZincLithiumSeleniumIodideBromideTotal nitrogenMercuryDissolved oxygenDissolved organic carbonTotal dissolved solids
(residue on evaporation at 1 80 degrees Celsius)
! In some cases, the value reported for iron was not clearly defined. Each iron value was entered into the "Fe" column, unless it was indicated to be "total iron," in which case, it was entered into the "TOTAL Fe" column.
56. LITHOLOGY: Abbreviations for aquifer lithologies or textures, listed in table 6.
57. SAMPLE SOURCE: Abbreviations identify ing the general source type. In cases where no source was indicated, and for which it was deemed likely, it was assumed that the source was a well; otherwise, the column was left blank. Table 7 lists the abbrevia tions used.
58. COMMENTS: A collection of general infor mation regarding the sample and/or site, such as sample appearance, well completion information, and additional hydrochemical data. Casing depth, if available and differ ent from total well depth, is listed here. Table 8 lists the abbreviations used.
The following columns were not part of the data base when data were first being entered and therefore are not complete. Some of the data sources may have had information on altitude, well depth, and water level that was not entered as a result of the later inclusion of these columns.
59. ALTITUDE: Altitude of land surface at well head, with respect to sea level, in feet.
60. WELL DEPTH: Depth to base of well below land surface, in feet.
61. WATER DEPTH: Depth to water below land surface, in feet.
62. WLALT: Water-level altitude, in feet. The datums used to measure water levels and well depths were variable. In the cases where the datum was not clearly indicated, it was assumed to be land surface. Because the datum most commonly noted was either the altitude of the casing top or land surface, any error resulting from this assumption should be at most a few feet.
4 Hydrochemicai Data Base for the Death Valley Region, California and Nevada
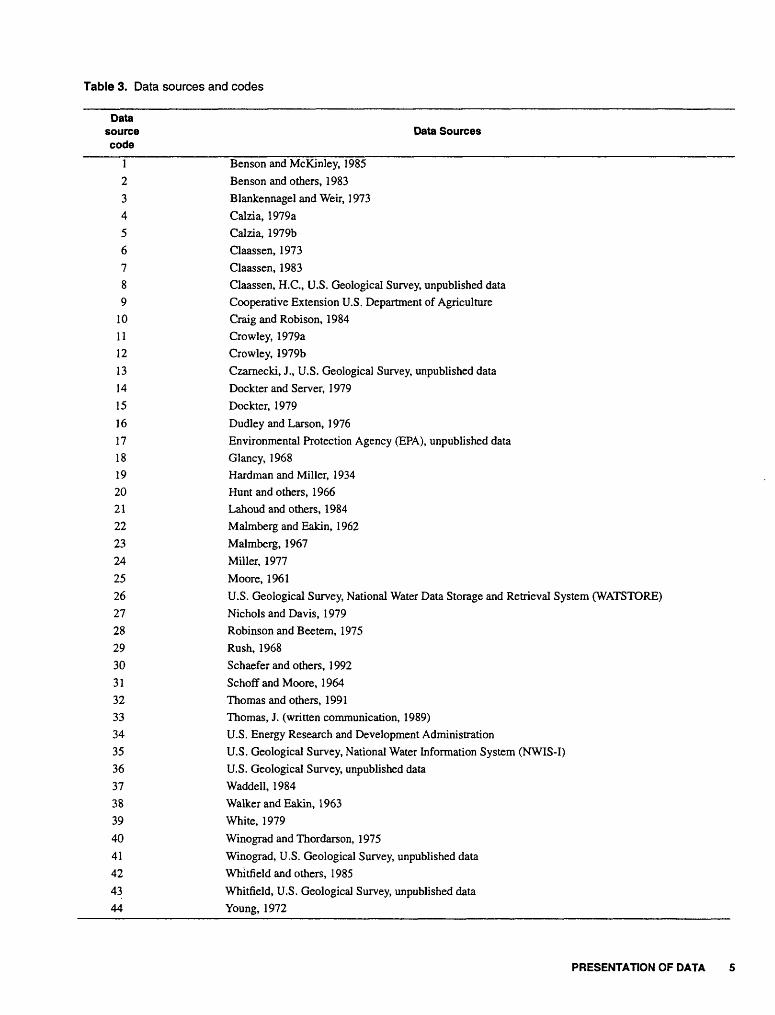
Table 3. Data sources and codes
Datasource Data Sources code
1 Benson and McKinley, 19852 Benson and others, 19833 Blankennagel and Weir, 19734 Calzia, 1979a5 Calzia, 1979b6 Claassen, 19737 Claassen, 19838 Claassen, H.C., U.S. Geological Survey, unpublished data9 Cooperative Extension U.S. Department of Agriculture
10 Craig and Robison, 198411 Crowley, 1979a12 Crowley, 1979b13 Czarnecki, J., U.S. Geological Survey, unpublished data14 Dockter and Server, 197915 Dockter, 1979
16 Dudley and Larson, 197617 Environmental Protection Agency (EPA), unpublished data18 Glancy, 196819 Hardman and Miller, 193420 Hunt and others, 196621 Lahoud and others, 198422 Malmberg and Eakin, 196223 Malmberg, 196724 Miller, 197725 Moore, 196126 U.S. Geological Survey, National Water Data Storage and Retrieval System (WATSTORE)27 Nichols and Davis, 197928 Robinson and Beetem, 197529 Rush, 196830 Schaefer and others, 199231 Schoff and Moore, 196432 Thomas and others, 199133 Thomas, J. (written communication, 1989)34 U.S. Energy Research and Development Administration35 U.S. Geological Survey, National Water Information System (NW1S-I)36 U.S. Geological Survey, unpublished data37 Waddell, 198438 Walker and Eakin, 196339 White, 1979
40 Winograd and Thordarson, 197541 Winograd, U.S. Geological Survey, unpublished data42 Whitfield and others, 1985
43 Whitfield, U.S. Geological Survey, unpublished data44 Young, 1972
PRESENTATION OF DATA
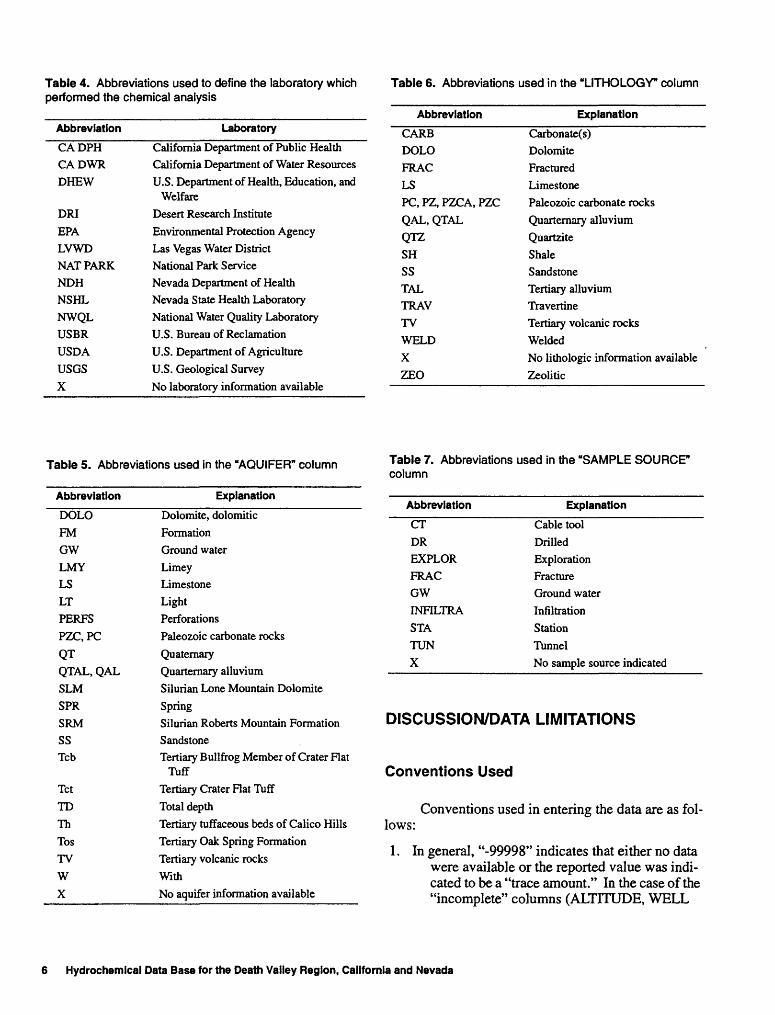
Table 4. Abbreviations used to define the laboratory which performed the chemical analysis
Table 6. Abbreviations used in the "LITHOLOGY" column
Abbreviation Laboratory
CA DPH California Department of Public HealthCA DWR California Department of Water ResourcesDREW U.S. Department of Health, Education, and
WelfareDRI Desert Research InstituteEPA Environmental Protection AgencyLVWD Las Vegas Water DistrictNAT PARK National Park ServiceNDH Nevada Department of HealthNSHL Nevada State Health LaboratoryNWQL National Water Quality LaboratoryUSER U.S. Bureau of ReclamationUSDA U.S. Department of AgricultureUSGS U.S. Geological SurveyX No laboratory information available
Abbreviation Explanation
CARBDOLOFRACLSPC, PZ, PZCA, PZCQAL, QTALQTZSHSS
TALTRAVTVWELDXZEO
Carbonate(s)DolomiteFracturedLimestonePaleozoic carbonate rocksQuarternary alluviumQuartziteShaleSandstoneTertiary alluviumTravertineTertiary volcanic rocks
WeldedNo lithologic information available
Zeolitic
Table 5. Abbreviations used in the "AQUIFER" column Table 7. Abbreviations used in the "SAMPLE SOURCE" column
Abbreviation Explanation
DOLO Dolomite, dolomitic
FM FormationGW Ground waterLMY LimeyLS LimestoneLT LightPERFS PerforationsPZC, PC Paleozoic carbonate rocks
QT QuaternaryQTAL, QAL Quarternary alluviumSLM Silurian Lone Mountain Dolomite
SPR SpringSRM Silurian Roberts Mountain FormationSS SandstoneTcb Tertiary Bullfrog Member of Crater Flat
TuffTct Tertiary Crater Flat Tuff
TD Total depthTh Tertiary tuffaceous beds of Calico HillsTos Tertiary Oak Spring FormationTV Tertiary volcanic rocksW WithX No aquifer information available
Abbreviation
CTDREXPLORFRACGWINFELTRASTATUNX
Explanation
Cable toolDrilledExplorationFractureGround waterInfiltrationStationTunnelNo sample source indicated
DISCUSSION/DATA LIMITATIONS
Conventions Used
Conventions used in entering the data are as fol lows:
1. In general, "-99998" indicates that either no data were available or the reported value was indi cated to be a "trace amount." In the case of the "incomplete" columns (ALTITUDE, WELL
6 Hydrochemicai Data Base for the Death Valley Region, California and Nevada
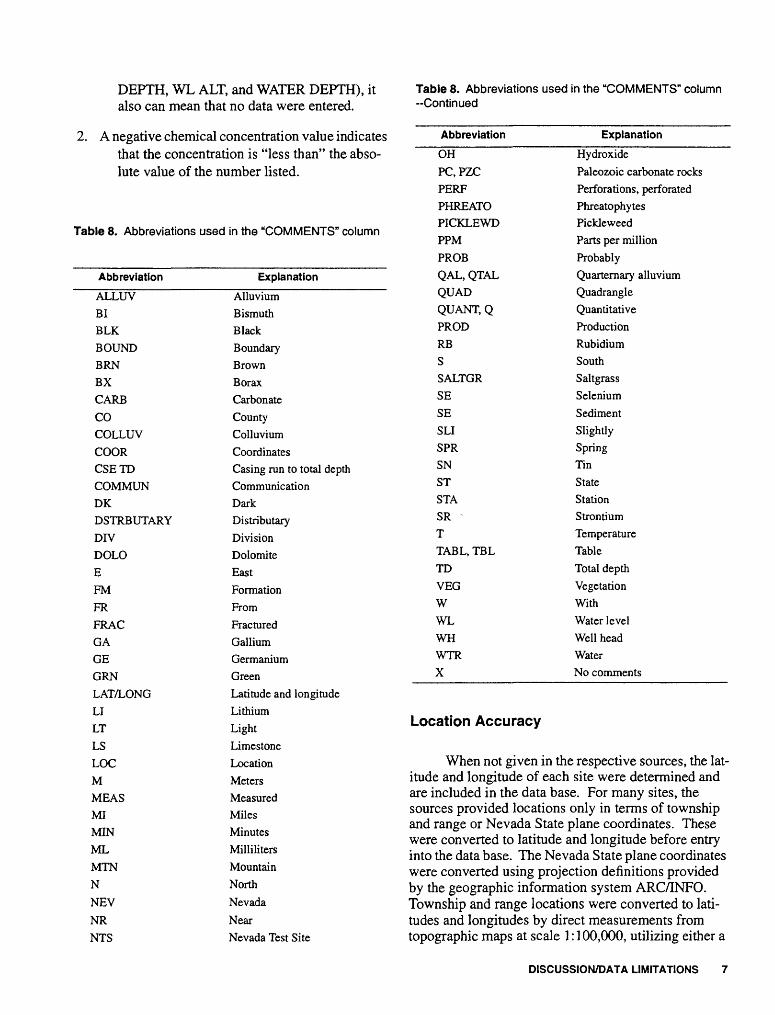
DEPTH, WL ALT, and WATER DEPTH), it also can mean that no data were entered.
Table 8. Abbreviations used in the "COMMENTS" column --Continued
2. A negative chemical concentration value indicatesthat the concentration is "less than" the absolute value of the number listed.
Table 8. Abbreviations used in the "COMMENTS" column
Abbreviation
ALLUVBIBLKBOUNDBRNBXCARB
COCOLLUVCOORCSETDCOMMONDKDSTRBUTARYDIVDOLOEFMFRFRACGAGECRN
LAT/LONGLILTLSLOGMMEASMIMIN MLMTNN
NEV
NRNTS
Explanation
AlluviumBismuthBlackBoundaryBrownBoraxCarbonateCountyColluviumCoordinatesCasing run to total depthCommunicationDarkDistributary
DivisionDolomiteEastFormationFromFracturedGalliumGermaniumGreenLatitude and longitudeLithiumLightLimestoneLocationMetersMeasured
Minutes MillilitersMountainNorth
Nevada
NearNevada Test Site
Abbreviation Explanation
OH Hydroxide
PC, PZC Paleozoic carbonate rocksPERF Perforations, perforatedPHREATO PhreatophytesPICKLEWD Pickleweed
PPM Parts per millionPROB ProbablyQAL, QTAL Quarteraary alluviumQUAD QuadrangleQUANT, Q QuantitativePROD ProductionRB RubidiumS SouthSALTGR SaltgrassSE SeleniumSE SedimentSLI SlightlySPR SpringSN TinST StateSTA StationSR StrontiumT TemperatureTABL, TBL TableTD Total depth
VEG VegetationW WithWL Water levelWH Well headWTR WaterX No comments
Location Accuracy
When not given in the respective sources, the latitude and longitude of each site were determined andare included in the data base. For many sites, thesources provided locations only in terms of townshipand range or Nevada State plane coordinates. These were converted to latitude and longitude before entry into the data base. The Nevada State plane coordinateswere converted using projection definitions providedby the geographic information system ARC/INFO.Township and range locations were converted to latitudes and longitudes by direct measurements fromtopographic maps at scale 1:100,000, utilizing either a
DISCUSSION/DATA LIMITATIONS
variable scale or a digitizer. If the data source had a dis crepancy between the township and range location and the latitude and longitude, the latitude and longitude were assumed to be correct. Locations of sites for which only the name of the well or spring were given were determined as accurately as possible using any available sources, such as reports or maps. In some cases, the information was not clear and judgment had to be used to assign a location. In general, sample loca tions are accurate to within 1 kilometer. Most are much more precisely located than that; a few, however, may be less accurate.
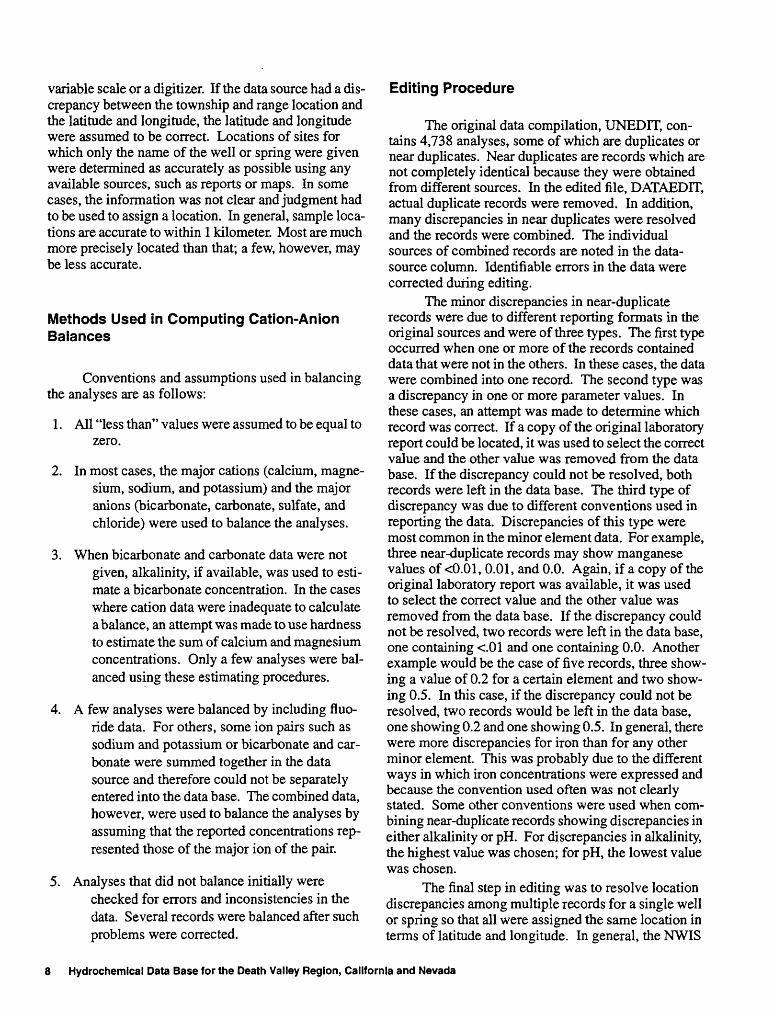
Methods Used in Computing Cation-Anion Balances
Conventions and assumptions used in balancing the analyses are as follows:
1. All "less than" values were assumed to be equal to zero.
2. In most cases, the major cations (calcium, magne sium, sodium, and potassium) and the major anions (bicarbonate, carbonate, sulfate, and chloride) were used to balance the analyses.
3. When bicarbonate and carbonate data were not given, alkalinity, if available, was used to esti mate a bicarbonate concentration. In the cases where cation data were inadequate to calculate a balance, an attempt was made to use hardness to estimate the sum of calcium and magnesium concentrations. Only a few analyses were bal anced using these estimating procedures.
4. A few analyses were balanced by including fluo- ride data. For others, some ion pairs such as sodium and potassium or bicarbonate and car bonate were summed together in the data source and therefore could not be separately entered into the data base. The combined data, however, were used to balance the analyses by assuming that the reported concentrations rep resented those of the major ion of the pair.
5. Analyses that did not balance initially werechecked for errors and inconsistencies in the data. Several records were balanced after such problems were corrected.
Editing Procedure
The original data compilation, UNEDIT, con tains 4,738 analyses, some of which are duplicates or near duplicates. Near duplicates are records which are not completely identical because they were obtained from different sources. In the edited file, DATAEDIT, actual duplicate records were removed. In addition, many discrepancies in near duplicates were resolved and the records were combined. The individual sources of combined records are noted in the data- source column. Identifiable errors in the data were corrected during editing.
The minor discrepancies in near-duplicate records were due to different reporting formats in the original sources and were of three types. The first type occurred when one or more of the records contained data that were not in the others. In these cases, the data were combined into one record. The second type was a discrepancy in one or more parameter values. In these cases, an attempt was made to determine which record was correct. If a copy of the original laboratory report could be located, it was used to select the correct value and the other value was removed from the data base. If the discrepancy could not be resolved, both records were left in the data base. The third type of discrepancy was due to different conventions used in reporting the data. Discrepancies of this type were most common in the minor element data. For example, three near-duplicate records may show manganese values of <0.01, 0.01, and 0.0. Again, if a copy of the original laboratory report was available, it was used to select the correct value and the other value was removed from the data base. If the discrepancy could not be resolved, two records were left in the data base, one containing <.01 and one containing 0.0. Another example would be the case of five records, three show ing a value of 0.2 for a certain element and two show ing 0.5. In this case, if the discrepancy could not be resolved, two records would be left in the data base, one showing 0.2 and one showing 0.5. In general, there were more discrepancies for iron than for any other minor element. This was probably due to the different ways in which iron concentrations were expressed and because the convention used often was not clearly stated. Some other conventions were used when com bining near-duplicate records showing discrepancies in either alkalinity or pH. For discrepancies in alkalinity, the highest value was chosen; for pH, the lowest value was chosen.
The final step in editing was to resolve location discrepancies among multiple records for a single well or spring so that all were assigned the same location in terms of latitude and longitude. In general, the NWIS
8 Hydrochemical Data Base for the Death Valley Region, California and Nevada
locations were considered to be most accurate and were given precedence. Next were the locations as shown in USGS Open-File Report 90-355 (McKinley and others, 1991). Locations given in other USGS reports were used for sampling locations not contained in either of the first two sources.
Data-Base Limitations
Based on the completeness of individual analy ses and on their calculated cation-anion balances, the analytical data contained in the data base are of variable utility. Of the 3,733 analyses in the edited data base, 58 percent (2,178) balanced to within ±10 percent. Of the remaining records, 1,373 did not contain enough major ion data to calculate a balance.
The data base has some deficiencies. No distinc tion was made between field and laboratory pH. Field and laboratory inorganic carbon values (bicarbonate, carbonate, alkalinity) also were not differentiated. In addition, stable and radioisotopic data were omitted. These data, which are available for some sites, include deuterium (82H), tritium (3H), oxygen (818O), carbon (513C and 14C), strontium (587Sr and ^Sr), and a few other radionuclides. The majority of the isotopic data available comprise 52H, 3H, and 518O values.
More than one abbreviation convention was sometimes used in the data-base columns. This is a result of using multiple sources and the way in which the data base was developed.
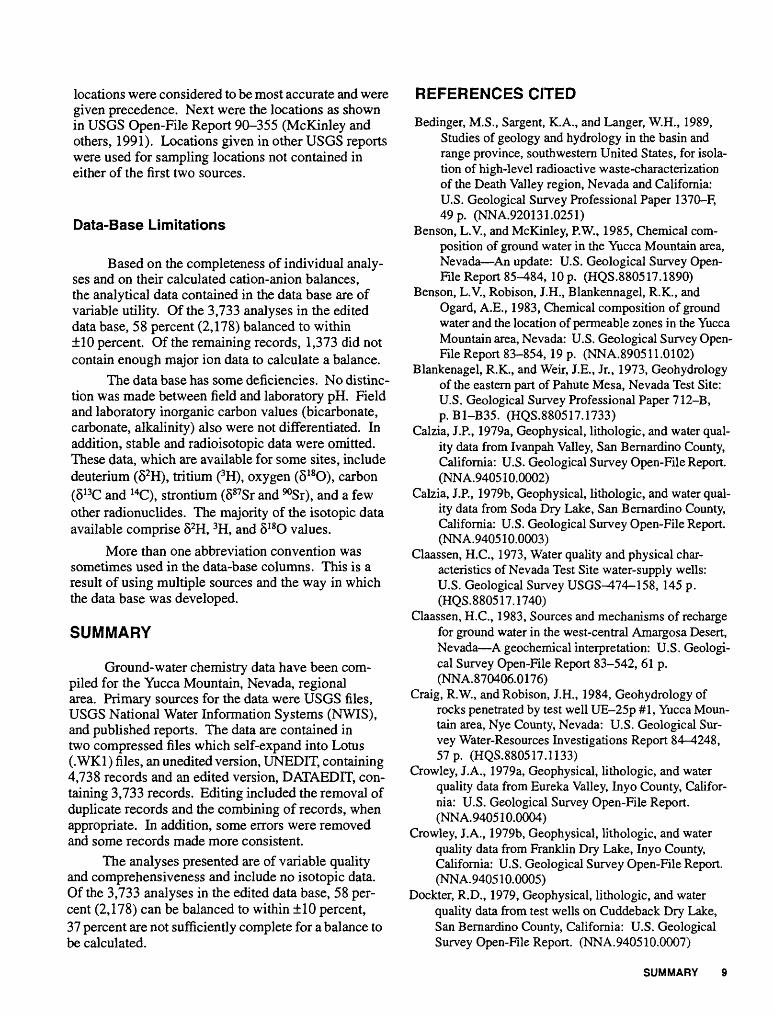
SUMMARY
Ground-water chemistry data have been com piled for the Yucca Mountain, Nevada, regional area. Primary sources for the data were USGS files, USGS National Water Information Systems (NWIS), and published reports. The data are contained in two compressed files which self-expand into Lotus (.WK1) files, an unedited version, UNEDIT, containing 4,738 records and an edited version, DATAEDIT, con taining 3,733 records. Editing included the removal of duplicate records and the combining of records, when appropriate. In addition, some errors were removed and some records made more consistent.
The analyses presented are of variable quality and comprehensiveness and include no isotopic data. Of the 3,733 analyses in the edited data base, 58 per cent (2,178) can be balanced to within ±10 percent, 37 percent are not sufficiently complete for a balance to be calculated.
REFERENCES CITED
Bedinger, M.S., Sargent, K.A., and Langer, W.H., 1989, Studies of geology and hydrology in the basin and range province, southwestern United States, for isola tion of high-level radioactive waste-characterization of the Death Valley region, Nevada and California: U.S. Geological Survey Professional Paper 1370-F, 49 p. (NNA.920131.0251)
Benson, L.V., and McKinley, P.W., 1985, Chemical com position of ground water in the Yucca Mountain area, Nevada An update: U.S. Geological Survey Open- File Report 85-484, 10 p. (HQS.880517.1890)
Benson, L.V., Robison, J.H., Blankennagel, R.K., and Ogard, A.E., 1983, Chemical composition of ground water and the location of permeable zones in the Yucca Mountain area, Nevada: U.S. Geological Survey Open- File Report 83-854, 19 p. (NNA.890511.0102)
Blankenagel, R.K., and Weir, I.E., Jr., 1973, Geohydrology of the eastern part of Pahute Mesa, Nevada Test Site: U.S. Geological Survey Professional Paper 712-B, p.Bl-835. (HQS.880517.1733)
Calzia, J.P., 1979a, Geophysical, lithologic, and water qual ity data from Ivanpah Valley, San Bernardino County, California: U.S. Geological Survey Open-File Report. (NNA.940510.0002)
Calzia, J.P., 1979b, Geophysical, lithologic, and water qual ity data from Soda Dry Lake, San Bernardino County, California: U.S. Geological Survey Open-File Report. (NNA.940510.0003)
Claassen, H.C., 1973, Water quality and physical char acteristics of Nevada Test Site water-supply wells: U.S. Geological Survey USGS-474-158, 145 p. (HQS.880517.1740)
Claassen, H.C., 1983, Sources and mechanisms of recharge for ground water in the west-central Amargosa Desert, Nevada A geochemical interpretation: U.S. Geologi cal Survey Open-File Report 83-542, 61 p. (NNA.870406.0176)
Craig, R.W., and Robison, J.H., 1984, Geohydrology of rocks penetrated by test well UE-25p #1, Yucca Moun tain area, Nye County, Nevada: U.S. Geological Sur vey Water-Resources Investigations Report 84-4248, 57 p. (HQS.880517.1133)
Crowley, J.A., 1979a, Geophysical, lithologic, and water quality data from Eureka Valley, Inyo County, Califor nia: U.S. Geological Survey Open-File Report. (NNA.940510.0004)
Crowley, J.A., 1979b, Geophysical, lithologic, and water quality data from Franklin Dry Lake, Inyo County, California: U.S. Geological Survey Open-File Report. (NNA.940510.0005)
Dockter, R.D., 1979, Geophysical, lithologic, and water quality data from test wells on Cuddeback Dry Lake, San Bernardino County, California: U.S. Geological Survey Open-File Report. (NNA.940510.0007)
SUMMARY 9
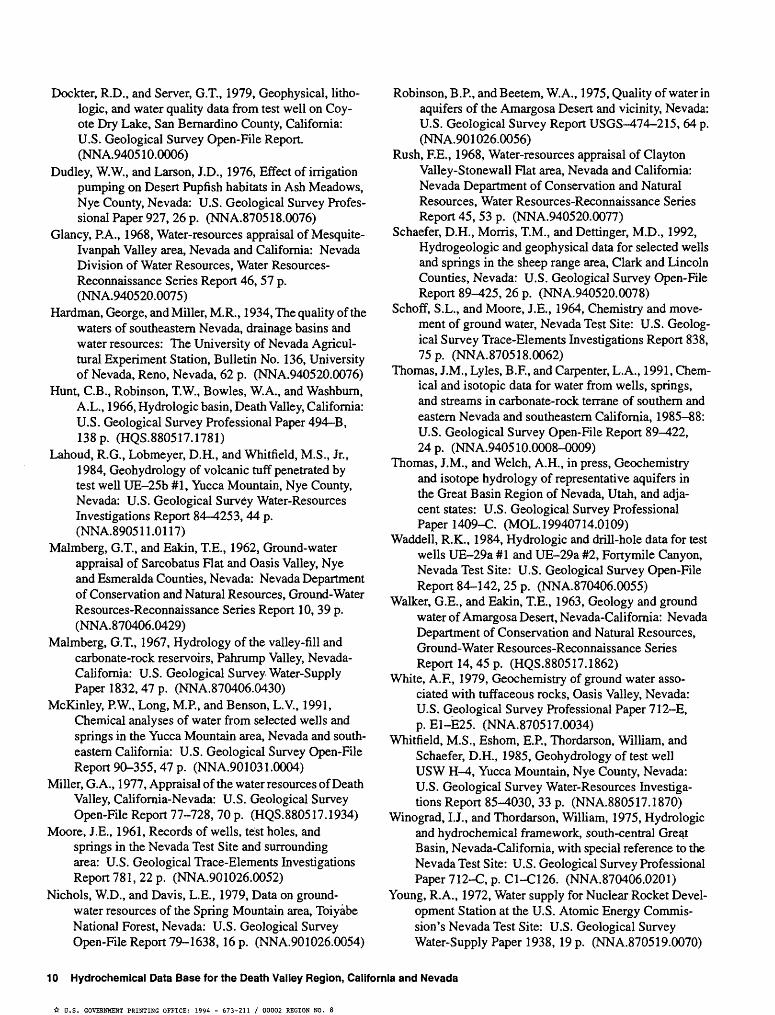
Dockter, R.D., and Server, G.T., 1979, Geophysical, litho- logic, and water quality data from test well on Coy ote Dry Lake, San Bernardino County, California: U.S. Geological Survey Open-File Report. (NNA.940510.0006)
Dudley, W.W., and Larson, J.D., 1976, Effect of irrigation pumping on Desert Pupfish habitats in Ash Meadows, Nye County, Nevada: U.S. Geological Survey Profes sional Paper 927, 26 p. (NNA.870518.0076)
Glancy, PA., 1968, Water-resources appraisal of Mesquite- Ivanpah Valley area, Nevada and California: Nevada Division of Water Resources, Water Resources- Reconnaissance Series Report 46, 57 p. (NNA.940520.0075)
Hardman, George, and Miller, M.R., 1934, The quality of the waters of southeastern Nevada, drainage basins and water resources: The University of Nevada Agricul tural Experiment Station, Bulletin No. 136, University of Nevada, Reno, Nevada, 62 p. (NNA.940520.0076)
Hunt, C.B., Robinson, T.W., Bowles, W.A., and Washburn, A.L., 1966, Hydrologic basin, Death Valley, California: U.S. Geological Survey Professional Paper 494-B, 138 p. (HQS.880517.1781)
Lahoud, R.G., Lobmeyer, D.H., and Whitfield, M.S., Jr., 1984, Geohydrology of volcanic tuff penetrated by test well UE-25b #1, Yucca Mountain, Nye County, Nevada: U.S. Geological Survey Water-Resources Investigations Report 84-4253,44 p. (NNA.890511.0117)
Malmberg, G.T., and Eakin, T.E., 1962, Ground-water appraisal of Sarcobatus Flat and Oasis Valley, Nye and Esmeralda Counties, Nevada: Nevada Department of Conservation and Natural Resources, Ground-Water Resources-Reconnaissance Series Report 10, 39 p. (NNA.870406.0429)
Malmberg, G.T., 1967, Hydrology of the valley-fill and carbonate-rock reservoirs, Pahrump Valley, Nevada- California: U.S. Geological Survey Water-Supply Paper 1832,47 p. (NNA.870406.0430)
McKinley, PW, Long, M.P., and Benson, L.V., 1991, Chemical analyses of water from selected wells and springs in the Yucca Mountain area, Nevada and south eastern California: U.S. Geological Survey Open-File Report 90-355,47 p. (NNA.901031.0004)
Miller, G.A., 1977, Appraisal of the water resources of Death Valley, California-Nevada: U.S. Geological Survey Open-File Report 77-728, 70 p. (HQS.880517.1934)
Moore, I.E., 1961, Records of wells, test holes, and springs in the Nevada Test Site and surrounding area: U.S. Geological Trace-Elements Investigations Report 781, 22 p. (NNA.901026.0052)
Nichols, W.D., and Davis, L.E., 1979, Data on ground- water resources of the Spring Mountain area, Toiyabe National Forest, Nevada: U.S. Geological Survey Open-File Report 79-1638, 16 p. (NNA.901026.0054)
Robinson, B.P, andBeetem, W.A., 1975, Quality of water in aquifers of the Amargosa Desert and vicinity, Nevada: U.S. Geological Survey Report USGS-474-215, 64 p. (NNA.901026.0056)
Rush, F.E., 1968, Water-resources appraisal of Clayton Valley-Stonewall Flat area, Nevada and California: Nevada Department of Conservation and Natural Resources, Water Resources-Reconnaissance Series Report 45, 53 p. (NNA.940520.0077)
Schaefer, D.H., Morris, T.M., and Dettinger, M.D., 1992, Hydrogeologic and geophysical data for selected wells and springs in the sheep range area, Clark and Lincoln Counties, Nevada: U.S. Geological Survey Open-File Report 89-425, 26 p. (NNA.940520.0078)
Schoff, S.L., and Moore, J.E., 1964, Chemistry and move ment of ground water, Nevada Test Site: U.S. Geolog ical Survey Trace-Elements Investigations Report 838, 75 p. (NNA.870518.0062)
Thomas, J.M., Lyles, B.F., and Carpenter, L.A., 1991, Chem ical and isotopic data for water from wells, springs, and streams in carbonate-rock terrane of southern and eastern Nevada and southeastern California, 1985-88: U.S. Geological Survey Open-File Report 89-422, 24 p. (NNA.940510.0008-0009)
Thomas, J.M., and Welch, A.H., in press, Geochemistry and isotope hydrology of representative aquifers in the Great Basin Region of Nevada, Utah, and adja cent states: U.S. Geological Survey Professional Paper 1409-C. (MOL. 19940714.0109)
Waddell, R.K., 1984, Hydrologic and drill-hole data for test wells UE-29a #1 and UE-29a #2, Fortymile Canyon, Nevada Test Site: U.S. Geological Survey Open-File Report 84-142, 25 p. (NNA.870406.0055)
Walker, G.E., and Eakin, T.E., 1963, Geology and ground water of Amargosa Desert, Nevada-California: Nevada Department of Conservation and Natural Resources, Ground-Water Resources-Reconnaissance Series Report 14,45 p. (HQS.880517.1862)
White, A.F., 1979, Geochemistry of ground water asso ciated with tuffaceous rocks, Oasis Valley, Nevada: U.S. Geological Survey Professional Paper 712-E, p. E1-E25. (NNA.870517.0034)
Whitfield, M.S., Eshom, E.P., Thordarson, William, and Schaefer, D.H., 1985, Geohydrology of test well USW H-4, Yucca Mountain, Nye County, Nevada: U.S. Geological Survey Water-Resources Investiga tions Report 85-4030, 33 p. (NNA.880517.1870)
Winograd, I.J., and Thordarson, William, 1975, Hydrologic and hydrochemical framework, south-central Great Basin, Nevada-California, with special reference to the Nevada Test Site: U.S. Geological Survey Professional Paper 712-C, p. C1-C126. (NNA.870406.0201)
Young, R.A., 1972, Water supply for Nuclear Rocket Devel opment Station at the U.S. Atomic Energy Commis sion's Nevada Test Site: U.S. Geological Survey Water-Supply Paper 1938, 19 p. (NNA.870519.0070)
10 Hydrochemical Data Base for the Death Valley Region, California and Nevada
U.S. GOVERNMENT PRINTING OFFICE: 1994 - 673-211 / 00002 REGION NO. 8