Embed Size (px)
Citation preview
ISSN 0378-3731
m\ eurostat
KOHLENWASSERSTOFFE HYDROCARBONS HYDROCARBURES
Monatsbulletin
Monthly bulletin
Bulletin mensuel
ANLAGE - ENERGIEWIRTSCHAFTLICHE ENTWICKLUNG IM ERSTEN HALBJAHR 1981
- MINERALOEL- UND GASBILANZEN 1980
IN ANNEX TRENDS IN THE ENERGY SECTOR DURING THE FIRST HALF OF 1981
PETROLEUM AND GAS BALANCE-SHEETS 1980
EN ANNEXE : - EVOLUTION DE L'ECONOMIE ENERGETIQUE AU COURS DU 1ER SEMESTRE 1981
- BILANS PETROLE ET GAZ 1980
Letzter Stand Up to date Mise à jour
11.11.1981 10-1981
eurostat
DE EUROPÆISKE FÆLLESSKABERS STATISTISKE KONTOR
STATISTISCHES AMT DER EUROPAISCHEN GEMEINSCHAFTEN
STATISTICAL OFFICE OF THE EUROPEAN COMMUNITIES
OFFICE STATISTIQUE DES COMMUNAUTÉS EUROPÉENNES
ISTITUTO STATISTICO DELLE COMUNITÀ EUROPEE
BUREAU VOOR DE STATISTIEK DER EUROPESE GEMEENSCHAPPEN
Luxembourg, Centre Europeen, Boîte postale 1907 — Tél. 43011 Télex: Comeur Lu 3423 1049 Bruxelles, Bâtiment Berlaymont, Rue de la Loi 200 (Bureau de liaison) — Tel. 735 80 40
Hinweis 1. Das Statistische Amt veröffentlicht drei gesonderte Monatsbulletins für die Energiebereiche : Kohle — Kohlenwasserstoffe — Elektrizität Jedes dieser Bulletins enthält : - einen unveränderlichen Teil mit den auf den neuesten Stand gebrachten
monatlichen Hauptreihen - einen veränderlichen Teil über wichtige Aspekte der neuesten Entwicklung, der in
der Anlage auch die vorläufigen Angaben der jährlichen Bilanzen enthält, sobald sie verfügbar sind
2. Der Leser findet auf Seite 19 die Erläuterungen zu den monatlichen Tabellen 3. Zuständig für alle Informationen über die Kohlenwasserstoffe :
D. WRIGHT - Tel. 43011, App. 3254
Note
1. The Statistical Office publishes three series of monthly energy bulletins : Coal - Hydrocarbons — Electrical energy Each of these bulletins consists of : - a permanent section giving updated principal monthly statistical series - a variable section on important aspects of the latest developments, which con
tains in annexe data on the annual balance-sheet ( which may be definitive or provisional ) as such information becomes available
2. The reader will find on page 20 the explanatory notes for the monthly tables 3. For any information dealing with Hydrocarbons statistics, please contact :
D. WRIGHT - Tel. 43011, ext., 3254
Avertissement
1. L'Office Statistique publie trois séries de bulletins mensuels sur l'énergie, à savoir : Charbon - Hydrocarbures - Energie électrique Chacun de ces bulletins est constitué : - d'une partie fixe fournissant la mise à jour des principales séries statistiques men
suelles - d'une partie variable relatant les aspects importants des dernières évolutions et
présentant en annexe les données, même provisoires, des bilans annuels au fur et à mesure de leur disponibilité.
2. Le lecteur trouvera en page 21 les notes explicatives relatives aux tableaux mensuels.
3. Pour toute information concernant les statistiques des hydrocarbures, s'adresser à : D. WRIGHT - Tel. 43011, ext. 3254
Luxembourg: Office des publications officielles des Communautés européennes, 1981
Inhaltswiedergabe nur mit Quellennachweis gestattet Reproduction is subject to acknowledgement of the source Reproduction subordonnée à l'indication de la source
Printed in the FR of Germany
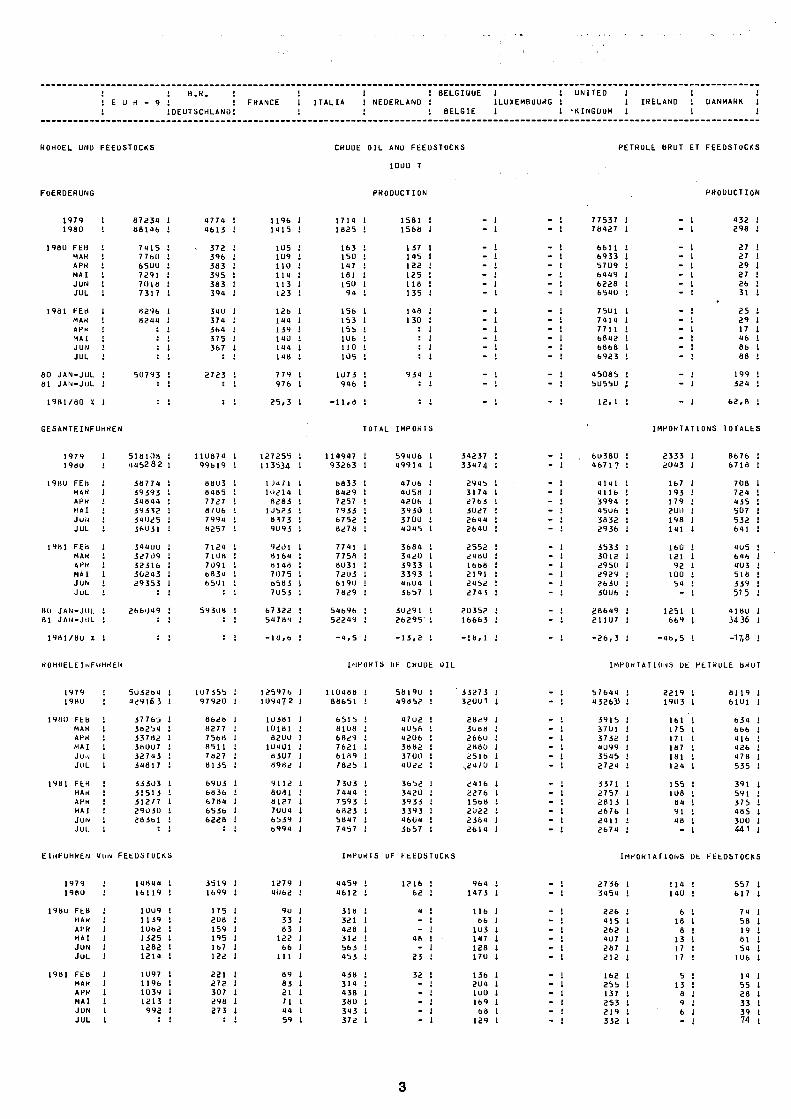
1 1 BELGIUUE 1 1 ITALIA ! NEDERLAND ! ¡LUXEMBOURG ί
! 1 BELGIË 1 1
UNITED ! I I t IRELAND 1 DANMARK !
'KINGDOM 1 1 !
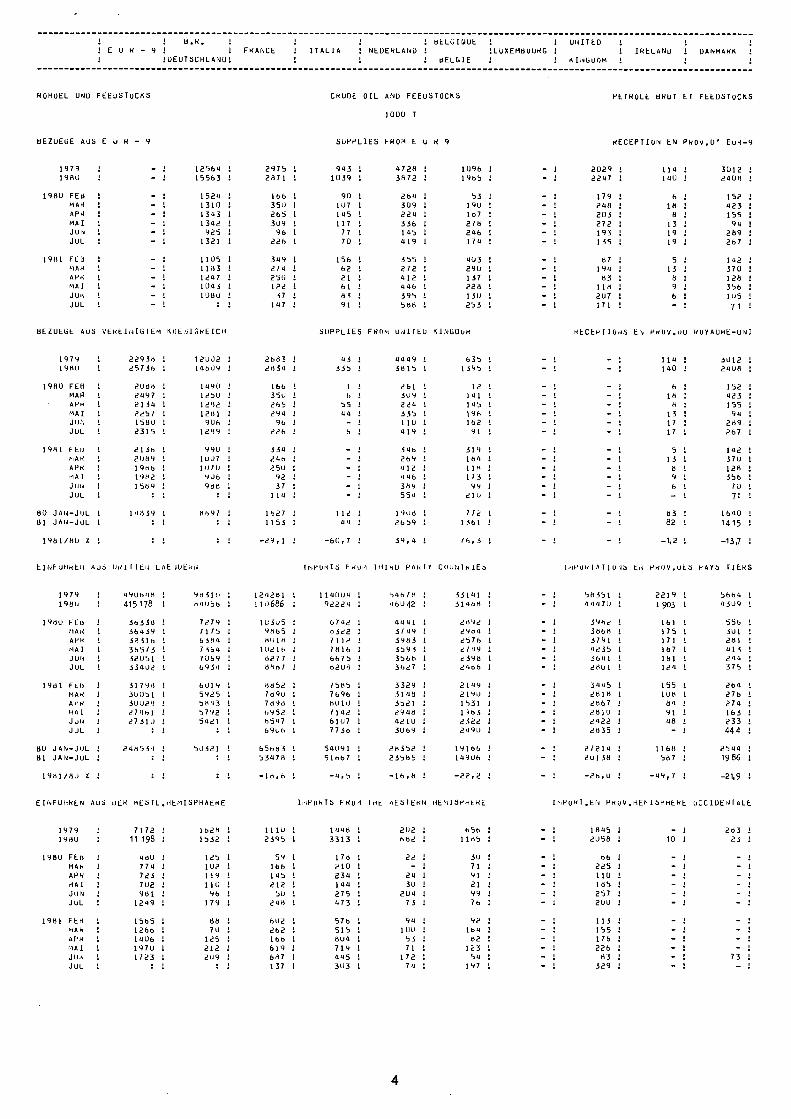
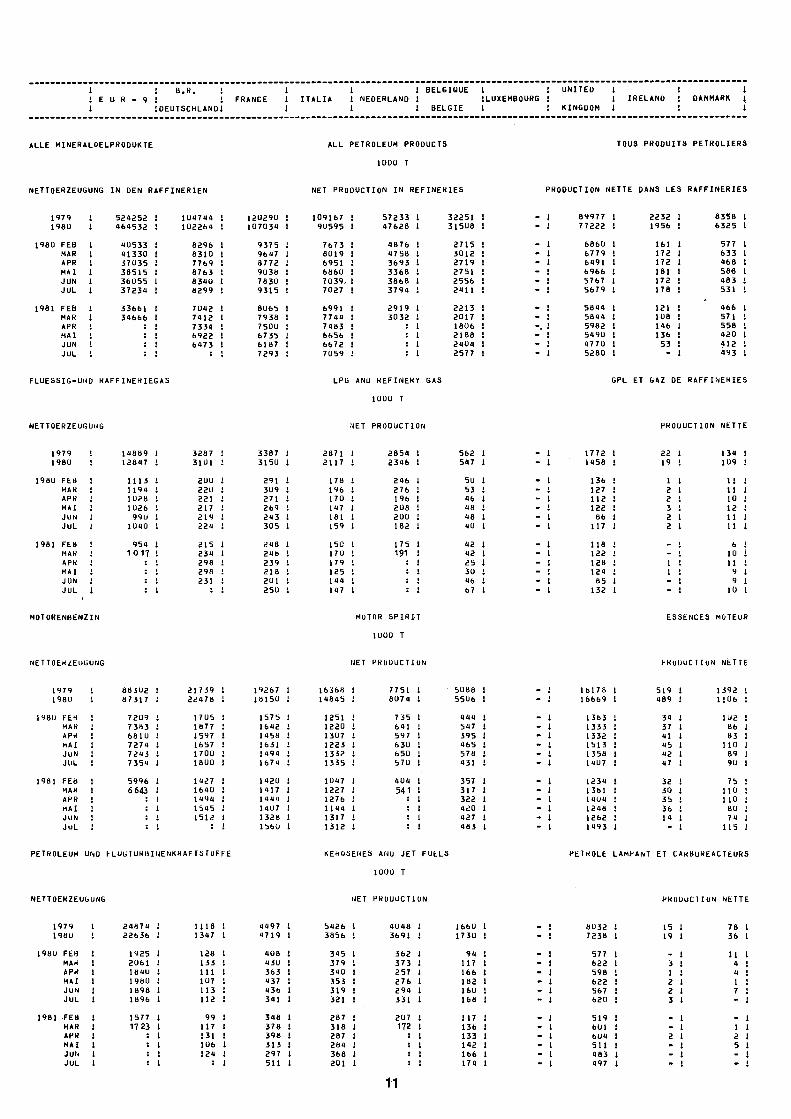
ROHOEL UND FEEDSTOCKS CRUDE OIL AND FEEDSTOCKS
IOUO T
PETROLE BRUT ET FEEDSTOCKS
FOERDERUNG
1979 1980
1980 FEB MAR APK MAI JUN JUL
1981 FEB MAR APR MAI J UU JUL
80 JAN-JOL 81 JAN-JUL
1981/80 X
8723a 88116
7115 7760 6500 7291 7018 7317
8296 8211
50793
1771 1 1613 !
372 1 396 ! 383 1 395 ! 383 ! 391 !
310 : 371 ! 361 1 375 ! 367 Í
2723
1196 ! 1115 !
105 1 109 ! 110 1 H I 1 113 1 123 !
126 Í 111 t 139 ! 110 > 111 1 118 Í
779 I 976 !
25,3 I
1711 1825
163 150 117 181 . 150 91
156 153 155 106 110 105
1073 916
PRODUCTION
1581 1 1568 1
137 1 115 ! 122 ! 125 1 118 1 135 !
118 ; 130 1
931 1
-11,8 !
- : - ί - ι - !
77537 1 78127 1
6611 ! 6933 ! 57Ü9 ! 6119 ! 6228 ! 651U !
7501 ! 7111 1 7711 ί 6812 ! 6866 ! 6923 !
15085 ί 5055Ù ì
12,1 !
PRODUCTION
! 132 ! 1 298 1
! 27 ! 1 27 ! ! 29 1 ! 27 ! ! 26 ί 1 31 !
* 1 25 ! ! 29 ! 1 17 ! 1 16 1 1 86 ! ! 88 !
1 199 ! 1 321 ί
Ι 62,8 1
GESAMTEINFUHREN TOTAL IMPORTS IMPORTATIONS TOTALES
1979 1980
1980 FEb MAK APK M S I JUN JOL
1981 FEB MAK ΛΡΚ MAI J Uh JUL
80 JAN-JOL 81 JAN-JUL
1981/80 %
! 518108 ! J (1152 8 2 ¡
! 38774 ! ¡ 39393 1 ! 31841 ! i 39332 1 ! 34025 ! ! 36031 1
I 31100 1 ί 32709 1 ! 32316 ! ! 30213 ! ί 29353 1
1 266049 !
110874 ! 99619 !
8803 ί 8485 ί 7727 ί 8706 ! 7994 Ì 8257 1
7121 1 7108 ! 7U91 1 6831 ! 6501 1
59308 !
127255 113534 10471 10214 8283
10523 8373 9093
9201 8164 8148 7075 6583 7053
67322 54784
114947 1 93263 ! 6833 ! 8429 ! 7257 1 7933 ! 6752 ! 8278 1
7741 1 7758 ! 8031 ! 7203 1 6190 ! 7829 !
54696 ! 52249 ¡
-4,5 !
59406 ! 49914 ¡
4706 1 1058 1 1206 1 3930 ! 3700 1 4045 1
3684 ! 3420 ! 3933 ! 3393 ! IbUI ! 3657 1
30291 1 26295' 1
-13,2 I
34237 33474
294b 3174 2763 3027 2644 2b40
2552 ¿480 1668 2191 2452 2743
20352 16663
-18,1
60380 ! 46717 !
1141 ! 1116 ί 3994 ! 4506 ! 3832 ! 2936 !
3533 1 3012 ! 2950 1 2929 1 2630 1 3006 !
28649 ! 21107 !
2333 ! 2043 !
167 1 193 1 179 ! 200 1 198 1 111 1
160 ! 121 1 92 !
100 ! 51 1 _ ι
1251 I 669 ¡
8676 ! 6718 ;
708 1 721 ! 135 1 507 ! 532 ! 641 !
405 ! 646 ! 403 ! 516 ! 339 ! 515 !
4160 1 34 36 1
-26,3 -46,5 ! -17,8
ROHOELEluFUHKEN IMPORTS OF CRODE OIL IMPORTATIONS DE PEIROLE BROT
1979 1980
19H0 Ftb MAK APR MAI JON JUL
1981 FtB MAK APR MAI JUN JUL
503264 429163
37765 38254 33782 38007 32743 34817
33303 31513 31277 29030 28361
:
107555 ! 97 920 !
8628 1 8277 ! 7568 1 8511 1 7827 ! 8135 ¡
6903 ! 6836 ! 6781 ! 6536 ! 6228 !
; [
125976 ! 10947 2 !
10381 1 10181 1 8200 1 1U401 1 8307 ! 8982 !
9112 ! 8081 ! 8127 1 7004 1 6539 ! 6994 !
110488 88651
6515 8108 6829 7621 6189 7825
7303 7444 7593 6823 5847 7457
5819U ! 49852 !
47U2 ! 4Ü58 1 4206 ! 3882 ! 37U0 I 4022 1
3652 1 3420 ! 3933 i 3393 ! 4604 ¡ 3b57 !
33273 ! 32ÜU1 1
2829 1 3088 1 266U ! 2880 ! 2516 !
v24/0 1
2416 1 2276 1 15b8 1 2022 ! 2384 1 2611 I
57611 1 132635 ί
3915 ! 3/01 1 3732 1 1099 1 3515 ! 2721 1
3371 ! 2757 ! 2813 ! 267b ! 2111 ! 2671 1
2219 ! 1903 !
161 1 175 ! 171 ! 167 ! 181 1 121 1
155 1 108 1 84 1 91 1 48 1
m 1
8119 ! 61U1 !
634 ! 666 ! 416 ! 126 ! 178 1 535 !
391 ! 591 ¡ 375 ! 185 1 300 ! 441 !
EINFÜHREN VOw FEEDSTOCKS IMPORTS OF FEEDSTOCKS IMPORTATIONS OE FEEDSTOCKS
1979 1980
1980 FEB MAR APR MAI JUN JUL
1981 FEB MAR APR MAI JUN JUL
11844 I 16119 !
10U9 I 1139 ! 1062 ! 1325 ! 1282 l 1214 !
1Ü97 ! 1196 ! 1039 I
I 1213 I I 992 ! I : !
3519 ! 1699 !
175 I 208 ! 159 I 195 I 167 I 122 !
221 ί 272 I 307 Ì 298 I 273 !
; I
1279 ¡ 4062 !
90 I 33 ! 83 I
122 I 66 I
111 I
89 I 83 ! 21 1 71 1 11 1 59 1
1159 ! 1612 ί
318 ! 321 1 128 1 312 ! 563 ! 453 1
438 J 314 ! 438 1 380 ! 343 1 372 I
1216 ! 62 !
4 ! - ! - 1
48 1 - 1
23 1
32 1 - 1 - 1 m I
- ! - 1
961 1 1173 1
116 ! 86 1
103 ! 117 ! 128 ! 170 I
136 I 201 1 100 1 lb9 1 68 1 129 1
! 2736 ! 1 3454 !
1 226 ί 1 415 ! i 262 1 1 407 ! ! 287 1 1 212 1
: 162 ί I 255 ! ! 137 I 1 253 Ι 1 219 ! 1 332 1
114 1 140 !
6 ! 18 1 8 !
13 1 17 1 17 1
5 1 13 1 β 1 9 1 6 1 - !
557 1 617 !
74 ! 58 ! 19 ! 61 ! 54 1
106 !
11 1 55 1 28 1 33 ! 39 ! 74 ι
¡DEUTSCHLAND
FRANCE NEDERLAND
BELGIUOk
BELGIË
LUXEMBOURG
UNITED
KINGDOM
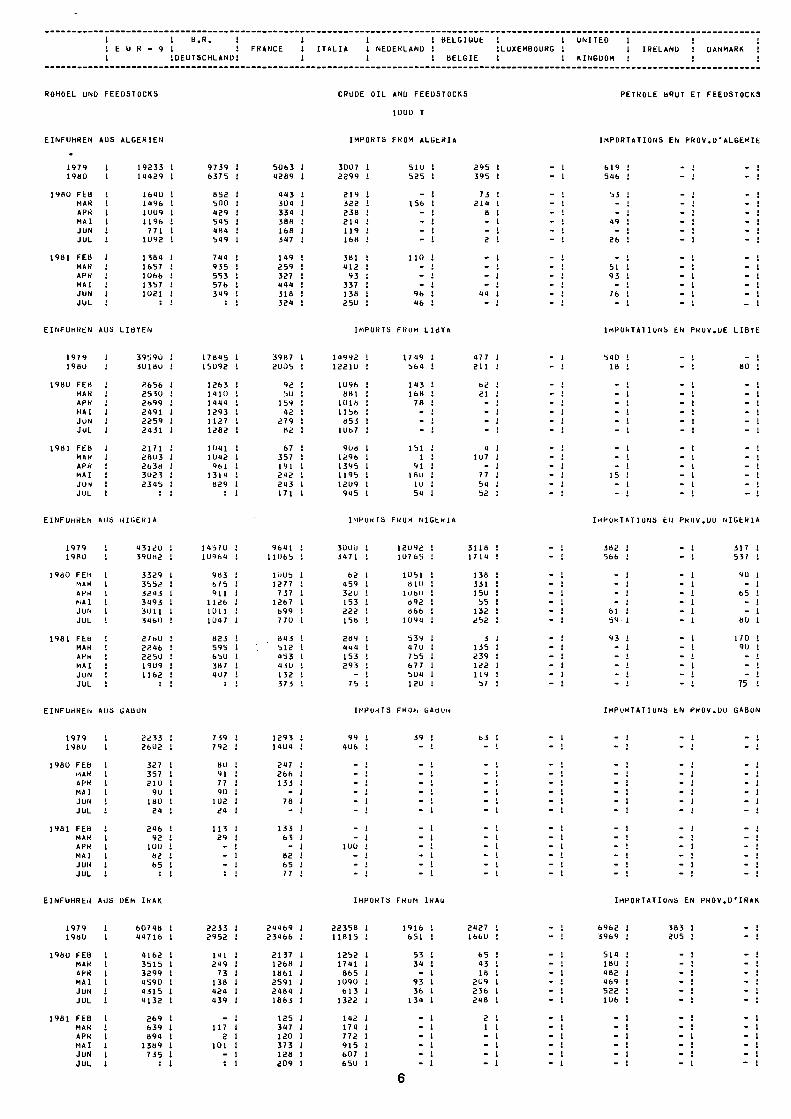
ROHOEL UNO FEEDSTOCKS CRODE OIL ANO FEEDSTOCKS
1000 Τ
PETROLE BRUT EI FEEDSTOCKS
BEZUEGE AUS E U R SUPPLIES FROH E O R 9 RECEPTION EN PROV.D' EOR9
1979 1
1980 1
1980 FEB
MAR
ΑΡΗ
MAI
JON
JOL
19H1 FEB
MAK
APh
MAI
JUN
JUL
12561 !
15563 !
1524 i
1310 1
1343 1
1342 1
925 !
1321 !
1105 1
1183 1
1247 1
1043 !
1D8Ü !
2975 i
2871 !
166 !
350 !
265 !
309 !
96 !
226 !
349 i
274 1
250 1
122 !
37 !
147 i
943 !
1039 !
90 !
1U7 !
145 !
117 i
77 1
70 1
156 1
62 1
21 !
61 !
8 3 !
91 !
4728 !
3872 i
264 1
309 !
224 1
336 !
145 !
419 1
355 i
272 !
412 !
116 !
395 1
588 !
1096
1985
53
190
lo7
i 7 11
¿Uh
lía
HUÍ
291,
15/
22»
130
253
2029
2247
179
2UH
soi
272
193
135
87
194
83
1 1 »
207
1 71
114 !
140 !
6 i
18 i
8 1
13 1
19 !
19 1
5 !
13 1
8 i
9 !
b 1
!
3012
2408
152
423
155
9a
289
2b7
142
370
128
35b
lub
71
BEZUtGE AUS VtKtlfjIGlEM K0EN1GREICH SUPPLIES FROM UNIItU KINGDOM RECEPTIONS EN P R O V . D O R O Y A O H E O N I
1979
19811
1980 FEh
MAK
APR
MAI
JON
JUL
1981 FLb
MAR
APR
MAI
JUN
JUL
80 JANJUL
81 JANJUL
2293»
25736
2088
2497
2134
2257
1580
2315
213b
2089
1986
1982
1589
:
14839
;
12002 !
148Ü9 i
1490 1
1250 i
1282 : 1281 !
906 ;
1289 1
99U !
1UU7 !
lu/o ! 90b !
98« :
»897 !
2683
2834
166
350
265
29a
96
22h
334
24b
250
92
37
114
182/
1 153
1981/8U i
ai
Sib
b b
4 1
4449
381b
2b]
3U9
224
i3b
1 10
a m
346
269
412
aas
389
554
19U8
2659
39,4
63b
1395
12
141
14S
196
162
91
319
164
1 1"
1 I i
SI
21U
7/2 1
libi i
7b, 3 1
114 !
110 !
6 !
18 !
β i
13 !
17 !
17 !
5 1
13 !
8 ;
9 :
6 1
:
63 ί 82 !
3U12 29U8
152 a23 155 91
2»9 2o7
lat-37U 128 ib» 70 71
1610 1415
-1,2 -U,7
E I N F U H R E N AUS D R I T T E N LAE.JOERN IMPORTS FROM IHIKD PARTY C O U N T R I E S I M P O R T A T I O N S E N P R O V . D E S F A Y S T I E R S
1979 198U
198U
1981
FEB MAR APR MAI JUN JUL
Ftl) MAR APR MAI JUN JUL
80 JAN-JUL 81 JA 1-JUL
19B1/BU ί
49064» 415178
36336 36439 3231b 3b5/5 32051 334D2
31798 300b 1 30028 27»bl 2731 U
248539 ; ;
98310 : 84056 !
7279 : 71/5 ! 6384 i 75b4 1 70b9 ! b934 1
6Ü19 1 5925 ! 5843 1 5792 ! 5421 !
: :
5U521 !
; J
121281 ! 110686 :
1U305 ! 9865 1 «01b 1 1021b ! 8277 ί ««b/ !
«852 ί /89u ! 789« 1 69 52 1 b547 ! 69U6 1
b5hb3 ! 53478 1
-18,b !
114DU4 1 92224 !
b/42 : 8322 ! 7112 1 781b ! 6675 ! 8208 !
/5B5 1 7b9b 1 8010 ! M 4 2 ! blU7 ! 7738 !
54091 ! 51bb7 J
-4,b !
54b/b ! 46042 :
4441 1 3749 1 3983 ! 3b91 1 3566 ! 3627 1
3329 ! 5148 ¡ 5521 ! 294« 1 4210 1 30b9 !
2«3b2 1 23b65 1
-16,6 !
53141 ¡ 31468 !
2892 ! 2984 ; 2576 1 2/49 i ¿398 1 24bb !
2149 ! 2190 ! 1531 1 lib 3 1 2 522 1 249U !
191bb 1 149Ub !
-22,2 1
58351 4 4 4 7 0
3982 38b« 3/91 4235 3641 2BU1
3445 2816 2887 2810 2422 2855
2/214 20158
-2b,0
2219 1903
lbl 17b 171 187 lei 12a
lbb 1U8 04 91 48
1166 567
-49, /
5664 4309
bbb 301 281 al 3 244 57b
2bü ¿la 271 Ibi 253 44 4
2511 19 86 -21,9
EINFUHREN AUS DER «ES TL.HtMISPHAERE IM P O R T S F R O M rnt WESTE R N H E M I S P H E R E IMPORT.EN PROV.HEMISPHERE O C C I D E N T A L E
1979 1980
1980
1981
FEB MAR APR MAI JON JOL
Ft« MAR APR HAI JUN JUL
7172 ! 11 198 !
460 ; 7/4 ! 725 1 702 ¡ 981 1
1249 !
15b5 ! 12bb 1 1406 ! 1970 ! 1723 1
lb2» : 1552 !
12b ! 102 ! 1 19 1 110 ! 96 !
1/9 1
88 ί 70 ί
125 1 212 ! 209 !
Ilio ! 2595 !
59 ! 166 ί 145 ! 212 ! 50 !
248 !
602 : 262 ! 16b 1 619 1 687 ! 137 1
1418 ! 3313 1
178 : 210 ! 231 ! 111 : 275 ! 473 !
57b 1 515 ! 804 ! 719 ! 445 ! 303 !
202 ! 882 !
22 ! - 1
24 ¡ 3U !
2U4 !
73 1
94 !
1110 :
53 1
71 !
172 !
74 !
b b t.
1185
30
71
91
21
99
7b
92
Iba
β2
123
54
197
1845
2058
üb
225
1 10
leb
257
200
1 13
155
1 lb
¿db
aí Ì29
2öi
23
! 1 E
! U R
1 B.R. 1
•l 1
¡DEUTSCHLAND!
FRANCE ITALIA 1 NEDERLAND 1
! 1
1 BELGIQUE
BELGIË
! ! ILUXEMBOURG 1
! 1
UNITED
KINGDOM
! 1
! IRELAND
I
i
1
DANMARK ! ! !
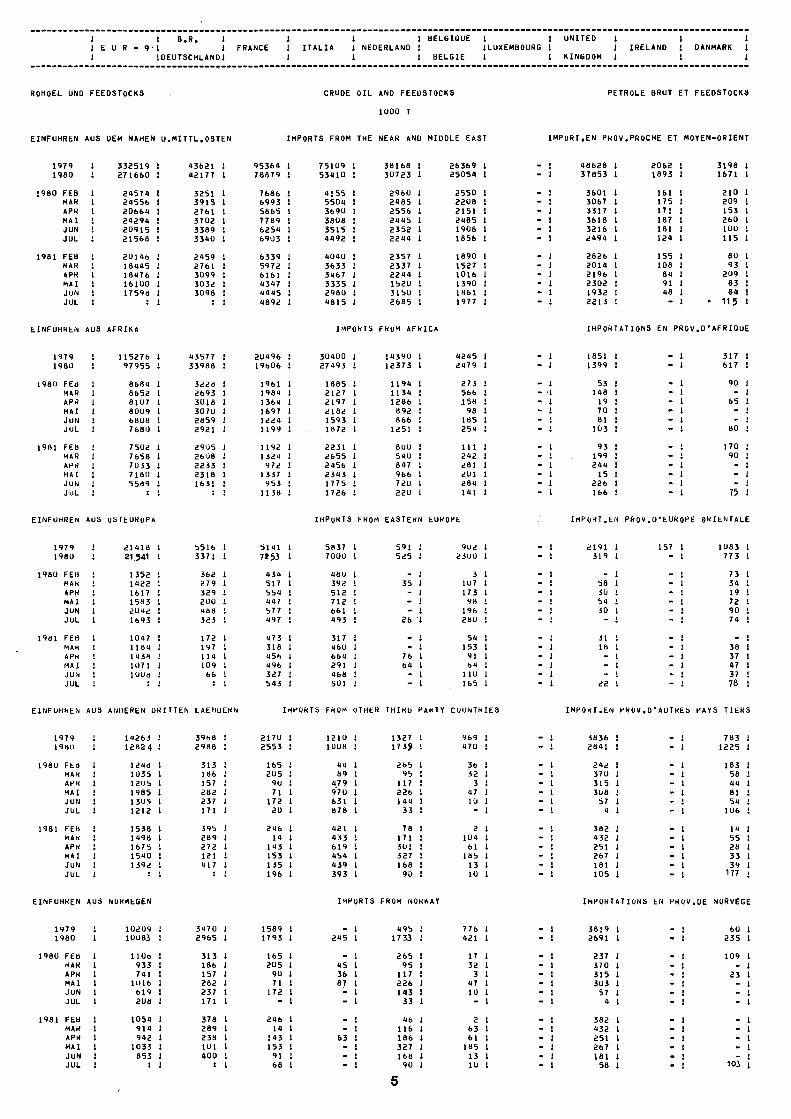
ROHOEL UND FEEDSTOCKS CRUDE OIL AND FEEDSTOCKS
1000 Τ
PETROLE BRUT ET FEEDSTOCKS
EINFUHREN AUS DEM NAHEN U.MITTL.OSTEN IMPORTS FROM THE NEAR AND MIDDLE EAST IMPORTEN PROV.PROCHE ET MOYENORIENT
1979
1980
1980
1981
FEB
MAR
APR
MAI
JUN
JOL
FEB
MAR
APR
MAI
JUN
JOL
332519 !
271660 1
24S74 !
24556 1
20661 !
21294 1
20915 !
21568 !
20146 !
18115 ί 18176 1 16100 ! 17598 !
: ι
13621 ! 12177 !
3251 ! 3915 ¡ 2761 1 3702 1 3389 ! 3340 !
2159 : 2761 ¡ 3099 ! 3032 ! 3098 !
: I
95361 1 78879 1
7686 1 6993 1 5865 1 7789 1 6254 1 6903 1
6339 ! 5972 ! 6161 ί 4317 ! 1115 ! 1892 !
75109 1 53410 !
4155 i 5501 ! 3690 1 3808 1 3515 ! 1192 !
4040 1 3633 ! 3467 1 3335 I 2980 ί 4815 !
38168 1 30723 !
296Ü 1 2485 1 2556 ! 2115 I 2352 ! 2214 1
2357 ! 2337 1 2214 ! 1520 ! 3150 1 2685 ί
26369 1 25054 !
2550 ! 2208 ! 2151 1 2985 1 1908 1 1856 1
1890 1 1527 ! 1016 ί 1390 1 1861 1 1977 1
18628 1 37853 1
3601 1 3067 ! 3317 Ι 3618 ! 3216 Ι 2191 Ι
2826 Ι 2011 ! 2196 1 2302 1 1932 ! 2213 !
2062 Ι 1893 1
161 1 175 1 171 ! 187 Ι 181 1 121 1
1S5 1 108 i 81 Ι 91 Ι 18 t - 1
3198 1 1671 Ι
210 1 209 1 153 Ι 260 Ι 100 1 11S 1
80 1 93 !
209 Ι 83 ! 84 !
- 115 ι
EINFUHREN AOS AFRIKA IMPORTS FROM AFRICA IMPORTATIONS EN PROV.D'AFRIQUE
1979 1980
1980
1981
FEB MAR APR MAI JUN JOL
FEB MAR APK MAI JON JOL
115276 1 97955 !
8684 ! 8652 1 8107 1 8009 ! 6808 1 7680 !
7502 1 7658 1 7033 ! 7180 1 5589 1
: 1
43577 1 33988 !
3228 1 2693 1 3018 ί 3070 ! 2859 I 2921 !
2905 1 2608 ! 2233 ! 2318 1 1631 !
: 1
20496 ! 19606 1
1961 1 1984 ! 1364 1 1697 ! 1224 ! 1199 !
1192 1 1324 ί 972 !
1337 ! 953 1 1138 1
30400 ! 27493 ί
1885 1 2127 1 2197 ! 2182 ! 1593 ! 1872 ¡
2231 !
2655 I
2456 !
2343 1
1775 !
1726 1
14390 1
12373 1
1194 1
1134 1
1286 !
892 i
866 !
1251 !
800 1
540 1
847 !
966 1
720 1
220 !
4215 I
2179 1
273 !
566 1
158 !
98 !
185 !
251 1
U I !
212 1
281 1
201 !
281 1
111 ι
! 1851 !
1 1399 1
I 53 !
1 118 !
1 19 Ι
Ι 70 1
1 81 1
1 103 Ι
1 93 1
1 199 Ι
1 211 1
1 15 !
Ι 226 1
! 166 !
317 1
617 1
90 ! _ Ι
65 !
ν Ι
i 80 1
170
9U
75 !
EINFUHREN AUS OSTEUROPA IMPORTS FROM EASTERN EUROPE IMPORT.EN PROV.O'EORoPE ORIENTALE
1979
1980
1980
1981
FEB
MAR
ΑΡΗ
MAI
JON
JOL
FEB
MAR
APR
MAI
JON
JOL
21918 1
21.541 ί
1352 1 1122 ί 1617 ! 1583 ! 2042 ! 1693 !
1047 ! 1181 1 1138 1 1071 ¡ 100« !
; I
5516 1 3371 !
362 ! 279 1 329 ! 200 I 488 ! 323 1
172 I 197 ! 114 1 109 ! 66 1 : ί
5141 1 7»53 1 434 1 517 1 554 1 447 ! 577 1 497 !
973 I 318 ! 456 ! 496 1 327 ! 543 1
5837 Ι 7000 !
180 1 392 ! 512 ! 712 ! 661 ί 193 1
317 ! 460 1 664 1 291 1 468 1 501 1
591 525
. 35 ---26 . -76
64 --
902 1 2300 1
3 1 107 1 173 ! 9« 1 196 ! 260 !
59 ! 153 1 91 ! 64 :
110 ! 165 ί
1 2191 1 1 319 !
1 - ! ! 58 1 1 30 ! : 54 ι ί 30 1 • - ι
1 51 ! 1 18 1 1 - '
ι - ί 1 22 1
157 ! ί 1083 ! Ι 773 !
! 73 ! ¡ 34 ! 1 19 ί 1 72 ! 1 90 ! 1 74 !
1 - i ! 38 ! ! 37 ! 1 47 ! 1 37 ! 1 78 1
EINFUHREN AUS ANDEREN ORITTEN LAENOEHN IMPORTS FROM OTHER THIRD PARTY COUNTRIES IMPORT.EN PHOV.D'AOTHES PAYS TIERS
1979 1980
1980
1981
FEB MAR APR MAI JUN JOL
FEB MAR APR MAI JUN JUL
14265 ! 12824 !
124d ί 1035 1 1205 ! 198S 1 1305 ! 1212 1
1538 I 1498 1 1675 1 1590 1 1392 !
; 1
39b8 ! 2988 !
313 ί 186 1 157 ! 282 1 237 1 171 !
395 ! 289 ! 272 1 121 1 917 ! : !
2170 1 2553 !
165 ! 205 1 90 ! 71 1
172 1 20 I
296 ί 14 1
143 1 153 I 135 I 196 !
1210 ! 1008 !
44 1 89 !
479 ! 970 ¡ 631 ! 878 !
421 1 133 ! 619 ; 951 ! 139 ! 393 1
1327 ! 17 3? 1
265 ! 95 !
117 ! 226 ! 191 1 33 !
78 I 171 1 301 1 327 ! 168 ! 90 ί
969 1 970 !
36 1 32 1 3 !
47 ¡ ID ! - ! 2 I
104 1 61 1
185 I 13 1 10 1
1 3836 ! 1 2811 1
1 212 1 I 370 1 I 315 1 1 308 1 ! 57 ! ! 1 !
! 382 1 1 132 I 1 251 1 1 267 1 1 181 1 1 105 1
1 783 ! 1 1225 !
! 183 ! 1 58 i I 11 1 1 81 ! 1 51 1 1 106 ί
1 11 ! 1 55 ! 1 28 1 1 33 ! 1 39 1 1 177 ι
EINFUHREN AOS NORMEGEN IMPORTS FROM NORWAY IMPORTATIONS EN PROV.DE NORVEGE
1979 1 1980 I
I960
1981
FEB I MAR 1 APR ! MAI ! JUN 1 JUL 1
FEB I MAR 1 APR 1 MAI 1 JUN 1 JUL 1
10209 ! 10083 !
U O o 1 933 ! 791 1
1016 1 619 1 208 1
1054 1 919 1 992 1
1033 1 853 1
: I
3470 1 2965 1
313 I 186 1 157 1 282 1 237 1 171 1
378 1 289 ! 238 1 101 1 400 1
: 1
1589 ! 1793 !
165 I 205 I 90 1 71 1
172 1 - 1
246 1 14 1
143 1 153 1 91 ! 68 1
- 1 245 1
_ 1
45 ! 36 1 87 I - ! - 1
- ! - 1
63 1 - 1 m I m 1
495 1 1733 1
265 1 95 1
117 1 226 1 143 1 33 I
46 1 116 1 186 1 327 I 168 1 90 I
776 1 421 1
17 1 32 1 3 1
47 1 10 1 - ! 2 1
63 1 61 1 185 1 13 1 10 1
I 3819 1 2691
1 237 1 370 ! 315 ! 303 I 57 ! 4
1 382 1 432 1 251 1 267 1 181 1 58
1 ! ! ! ! 1 ! 1
1 ! ! ! ! !
60 ! 235 I
109 I - 1
23 I - 1
- ! 103 ι
¡DEUTSCHLAND!
1 ¡ 1 BELGIQUE ! ¡ UNITED I 1 1
FRANCE i ITALIA 1 NEDERLAND ¡ ILOXEMBOORG ¡ I IRELAND I DANMARK ¡
¡ ¡ ! BELGIË 1 ¡ KINGDOM ¡ 1 1
ROHOEL OND FEEDSTOCKS CRUDE OIL AND FEEDSTOCKS
1000 Τ
PETROLE BROT ET FEEDSTOCKS
EINFUHREN AOS ALGERIEN IMPORTS FROM ALGtRIA IMPORTATIONS EN PROV.D'ALGERIE
1979 I
1980 !
1980
1981
FEB ! MAR !
APR I
MAI ¡
JUN ¡
JUL !
FEB !
MAR ί APR 1 MAI ! JUN 1 JUL !
19233 I 14429 !
1640 : 1496 ! 1009 1 1196 1 771 1
1092 1
1384 ! 1657 1 1066 ! 1357 ! 1021 ί
: !
9739 1 6375 I
852 1 500 ! 429 1 595 1 484 ! 549 1
744 1 935 ! 553 ! 576 ! 349 !
; I
5063 ! 4289 !
443 ί 304 ! 334 ! 388 ! 168 ! 347 !
119 ! 259 1 327 1 911 1 318 1 321 ;
3007 ! 2299 !
219 ! 322 1 238 ! 219 ! 119 ! 168 !
381 ! 912 ! 93 !
337 ! 138 ! 250 !
51D ! 525 !
m I
156 i - 1 « ; - ! . ι
110 ! m ι
_ I
- ; 96 ! 4b 1
295 ! 395 !
73 ; 219 !
8 1 - ! _ ; 2 !
- ! _ 1
- I - ! 44 ! _ ι
619 54b
49
ib
51 93
EINFÜHREN AUS LIBYEN IMPORTS FROM LIBYA IMPORTATIONS EN PROV.DE LIBYE
1979 1 1
198U
1981
980 1
FEB !
MAR !
ΑΡΗ !
MAI I
JUN !
JOL !
FEB ! MAK !
APR !
MAI !
JON !
JUL !
3959Ü 1
3018U !
2656 1
253U !
2699 !
2491 !
2259 !
2431 !
2171 !
2BU3 1 2638 1
3023 1
2315 1 ; I
17845 ! 15092 !
1263 1 1410 !
1444 !
1293 !
1127 !
1282 1
1041 !
1042 !
961 ¡ 1314 :
829 I ; 1
3987 I
2005 1
92 ! 5U 1
159 !
92 !
279 !
82 1
67 !
357 !
191 ! 242 !
243 ;
171 ¡
14992 1
1221U !
1096 !
881 !
IDI 6 !
llbb !
853 !
1U67 !
9U8 !
1296 1
139S 1 1195 ί 1209 1 945 !
1749 564
143 168 78 ---
151 1
91 ÌBU 1U 54
477 ! 211 !
b2 ! 21 ! - ! - ! - 1 - 1 4 !
107 ! a. 1
77 1 54 ! 52 1
540 ! 18 !
E I N F Ü H R E N AUS i J I G E K I A IMPORTS FROH N I G E R I A I M P O R T A T I O N S E N P R O V . D Ü N I G E R I A
1979 ! 1980 !
1980
1981
FEB ! MAR 1 APR 1 MAI 1 JON ! JUL !
FEB ! MAH ! APR 1 MAI ! JUN ! JUL !
43120 1 39U«2 I
3329 ¡ 3552 1 3243 ! 3493 ! 3011 ! 3460 !
27bO 1 2246 ! 2250 ! 1909 I 1162 !
; 1
145/0 ! 10964 1
983 ! 6/5 1 911 1
1126 ! lull ! 1047 1
823 ! 595 ! 650 ! 387 ! 407 ! : !
9641 1 11065 ί
100b ¡ 1277 1 737 ¡
1267 1 699 ! 770 ¡
843 ! 512 1 453 ! 130 ! 132 ! 373 !
3000 ! 3471 !
62 1 459 ! 320 1 153 ί 222 1 158 !
289 ! 441 ! 153 ! 293 !
_ r 75 !
12092 10765
1051 BIO
1060 892 866 1094
539 470 755 677 504 120
3118 1714
138 551 150 55
132 252
i 135 239 122 119 57
382 ! 566 !
bl 59
317 537
90
6b
1 IU 9 0
75
E I N F U H R E N AOS G A B U N I M P O R T S F R O M G A B U N I M P O R T A T I O N S E N P R O V . U U G A B O N
1979 1 1980 !
1980
1981
FEB ! MAH ! ΑΡΗ ! MAI ! JON ! JÜL !
FEB !
MAR 1
APR 1
MAI !
JUN :
JUL !
2233 !
26U2 !
327 1 357 !
210 !
90 !
180 !
24 !
246 1 92 ¡
100 !
82 !
65 !
: !
759
792
80
91
77 9Ü
102
24
113
29 a.
:
1293 ! 1404 !
247 !
266 1
133 !
! 78 !
!
133 !
63 1
1
62 1
65 ! 77 !
99
406
.
.
100
39 1 _ 1
J
i ι ¿
! 1
1
! i
! 1
1
EINFUHREN AOS OEM IRAK IMPORTS FHOM IHAU IMPORTATIONS EN PROV.D'IRAK
1979 ! 1980 !
19BÜ FEB ! MAR !
APR |
MAI 1 JUN !
JUL 1
1981 FEB 1 MAR !
APR 1
MAI !
JUN 1
JOL I
60798 1 41718 !
4162 ί 3515 ! 3299 I 9590 1 9315 ! 4132 1
269 ! 639 1 894 1
1389 1 735 !
; I
2233 1 2952 !
141 ! 249 ! 73 1
138 1 424 ! 439 1
_ ι 117 i
2 1 101 1 - 1 : !
24469 ! 23466 !
2137 I 1268 1 1861 1 2591 ! 2484 1 1883 !
125 ! 347 1 120 ! 373 t 128 1 209 1
22358 ! 11815 !
1252 1 1741 1 865 !
1090 ! 613 1 1322 1
142 ! 174 1 772 ! 915 ί 607 1 650 I
1916 1 651 1
53 ! 39 1 - ! 93 1
36 I 134 1
- ! _ ; - ! _ t m I
- 1
2427 ! 166U !
65 1 43 ! 18 !
2U9 1 236 ! 248 !
2 I 1 ! - 1 - 1 - 1 - 1
1 !
! 1 !
1 1 1 1
1 !
6962 1 3969 !
SII ! 180 1 182 1 169 1 522 ! 1U6 ί
- ! _ ; - ! m t
- ! - !
383 1 2U5 1
- 1 _ ι
- ! v t m t
_ t
m 1
- ι - 1 - i - 1 - 1
1 B.R. 1 !
i 1 FRANCE I
¡DEUTSCHLAND! !
! BELGIQUE
ITALIA 1 NEDERLAND !
! ! BELGIË
¡ !
¡LUXEMBOURG 1,
ι ι
UNITED
KINGDOM IRELAND
! I OANMARK !
!
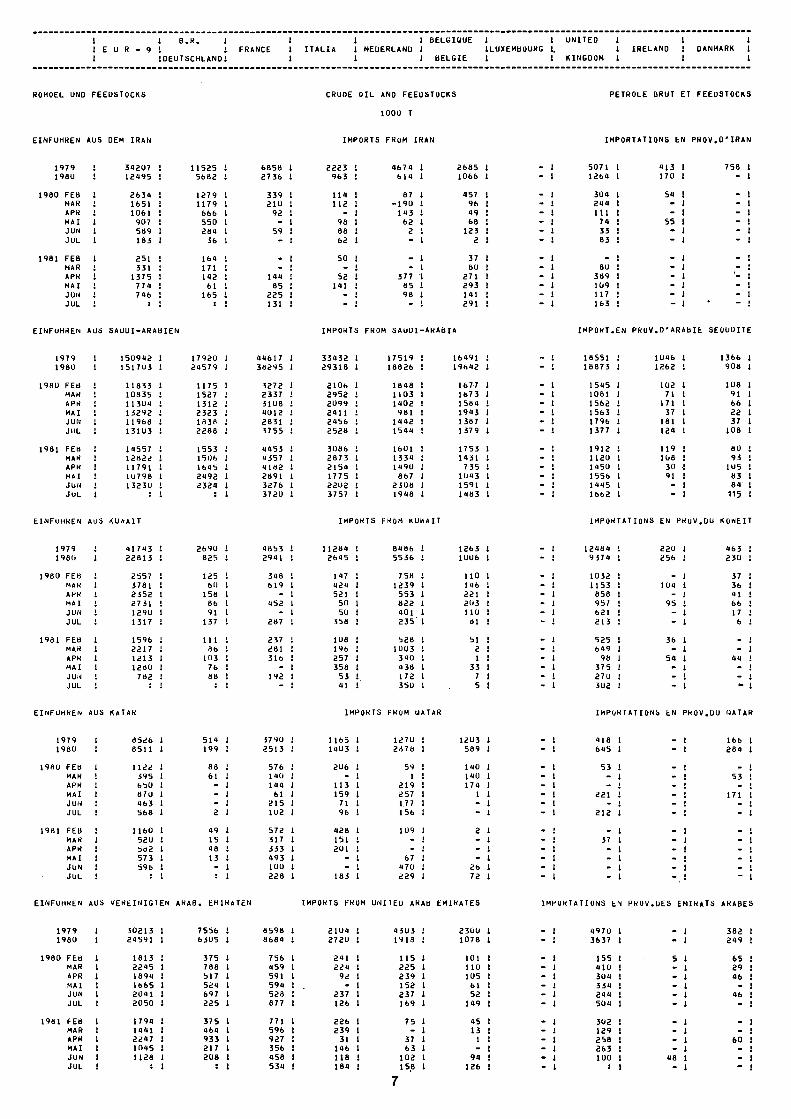
ROHOEL UND FEEDSTOCKS CRUDE OIL AND FEEDSTOCKS
1000 Τ
PETROLE BRUT ET FEEDSTOCKS
EINFUHREN AUS DEM IRAN IMPORTS FROM IRAN IMPORTATIONS EN PROV.D'IRAN
1979
1980
1980
1981
FEB
MAR
APR
MAI
JUN
JOL
FEB
MAR
APR
MAI
JUN
JUL
39207 !
12195 !
2634 !
1651 ί 1061 I 907 ¡ 589 ¡ 183 !
251 ! 331 I
1375 I 774 ί 746 ! : !
11525 I 5682 ¡
1279 ! 1179 ί 666 ! 550 ! 284 ¡
36 ¡
164 I
171 ¡
142 l
61 ¡
165 1 : ¡
6858 !
2736 ¡
339 !
210 !
92 ¡
¡ 59 !
I
¡ m ¡
141 :
85 !
225 ¡
131 !
2223
963
114
112
98
88
62
50
52
141
4674
614
87
190
143
62
2
377 ·
85
98
2685 1
1066 1
457 i 96 !
49 !
68 !
123 !
2 1
37 !
80 !
271 1
293 !
141 !
291 !
1 1
! 1
! ! ¡
|
!
! ¡ 1
1
5071 1
1264 1
304 1 214 1
111 1
74 !
33 !
83 ¡
i 80 !
389 1
109 1
117 !
163 !
413
170
54
55
„
! !
! ! ! ! ! 1
1
! ! I
1
1
758 ¡
! ! _ 1
. 1
! ! ! 1
! '. 1
1 . 1
* — 1
EINFUHREN AOS SAODIARABIEN IMPORTS FROM SAUDIARABIA IMPORT.EN PROV.D'ARABIE SEOUDITE
1979
1980
1980 FEB
MAR
APR
MAI
JON
JOL
1981 FEB
MAH
APR
MAI
JUN
JUL
150992 1
1517U3 1
11833 ¡
10835 1
113U4 1
13292 1
11968 !
131U3 !
14557 !
12822 !
11791 !
1U798 !
1323U !
! : !
17920
29579
1175
1527
1312
2323
1838
2288
1553
1506
1695 2192
2324
;
94617 !
38295 !
3272 !
2337 !
3108 1
4012 1
2831 !
3755 !
4453 !
4357 !
4182 !
2891 !
3276 !
3720 !
33932
29318
2106
2952
2099
2411
2456
2528
3086
2873
2154
1775 2202
3757
17519
18826
1898
1103
1402
981
1442
1544
1601
1334
1490
867
2308
1998
16491 !
19642 1
1677 1
1673 !
1584 !
1943 I
1387 1
1379 !
1753 !
1431 !
735 !
1043 ! 1591 ¡
1483 !
18551 !
18873 !
1545 !
1081 !
1562 !
1563 !
1796 !
1377 !
1912 !
1120 !
1450 !
1556 !
1445 !
1662 !
1046 1
1262 !
102 1
71 !
171 !
37 1
181 !
124 !
119 i
108 !
30 !
91 ! ι
!
1366 !
908 !
108 !
91 !
66 !
22 !
37 !
108 !
80 !
93 !
105 !
83 I
89 !
115 !
EINFUHREN AUS KÜ.IAIT IMPORTS FROM KUWAIT IMPORTATIONS EN PROV.DO KOWEIT
1979
1980
1980
1981
FEB
MAR
APR
MAI
JUN
JOL
FEB
MAH
ΑΡΗ
MAI
JON
JOL
41743 !
22813 !
2557 !
3781 !
2352 !
2731 !
1290 !
1317 !
1596 !
2217 !
1213 !
1280 !
782 ! ; I
2690
825
125
60
158
86
91
137
111
86
103
76
88
:
4853
2991
348
619
452
287
237
281
316
192
11269 !
2615 !
117 !
121 !
521 ! 50 !
50 !
358 !
108 !
196 !
257 !
358 !
53 !
11 !
8186 !
5536 !
758 !
1239 !
553 !
822 1
101 !
235 !
528 1
1003 !
310 1
138 1
1/2 1
350 1
1263 1
1006 !
110 !
146 !
221 !
203 1
110 !
Bl !
51 1
2 !
1 !
33 !
7 !
5 1
1 12484 i
1 9374 !
1 1032 1
! 1153 !
ί 85Β 1 ! 957 ! 1 621 1 1 213 1
1 525 I 1 649 1 i 98 1 1 375 1 ! 270 1 ! 302 1
220 1 256 !
- I 104 ! - ι 95 1 - ! - !
36 1 _ ι
54 ! - ! - ! - !
463 ! 230 i
37 ! 36 ! 41 ί 66 ! 17 ! 6 ! . ι
- ; 44 ! - 1 - 1 - !
EINFÜHREN AUS KATAR IMPORTS FROM QATAR IMPORTATIONS EN PKOV.UU QATAR
1979
198U
1980 FEB
MAR
ΑΡΗ
MAI
JUN
JUL
1981 FEB
MAR
APR
MAI
JUN
JUL
8526 !
8511 !
1122 1
595 ί 650 ! 870 ! 463 ! 568 1
1160 1 520 1 5B2 1 573 ! 596 1
; 1
514 1 199 !
88 ! 61 ! - ! _ ι
- ! 2 !
49 ί 15 ί 98 ! 13 ! - ! ; ¡
3790 !
2513 1
576 !
19U 1
191 1
61 1
215 !
102 I
572 !
317 !
333 1
193 I
100 1
228 1
1165
1903
206
113
159
71
9b
928
151
201
183
1270 !
2878 1
59 !
1 1
219 !
2S7 I
177 I
156 :
109 1
1
1
67 1
470 1
229 !
1203 !
589 !
190 1
190 Ι
179 !
1 1
! Ι
2 1
: Ι
! 26 ¡
72 1
418 !
645 !
53 !
1
¡ 221 !
_ ι
212 1
1
37 ! ι
! ! !
166 i
284 !
171
EINFUHHEN AUS VEREINIGTEN ARAB. EMIHATEN IMPORTS FROM UNITED ARAB EMIRATES IMPORTATIONS EN PHOV.DES EMIRATS ARABES
1979 I
1980 !
I960 FEB !
MAR !
APR I
MAI ! JUN 1
JOL !
1981 FEB 1
MAR !
APR !
MAI 1
JON 1
JUL 1
30213 1
24591 1
1613 1
2295 1
1899 1
1665 ! 2041 !
2050 1
1799 !
1441 1
2247 I
1045 I
1128 1
: !
7556
6305
37b
78«
517
521
697
225
375
464
933
217
2U8
:
1
!
! ! ! ! 1 :
1 ι : : ! 1
8598 1
8684 !
756 1
4S9 1
591 I
S94 1 .
528 1
877 1
771 I
596 1
927 1
356 1
458 !
S31 1
2101 !
2720 !
211 1
221 ί 92 1 - 1
237 1 126 t
226 1 239 1 31 1
146 1 118 1 184 !
4303 1 1918 1
115 1 225 1 239 1 152 ì 237 1
169 ¡
75 1
1
37 1
63 1
102 I
158 1
2300 1
1078 1
101 1
110 !
105 1
61 !
52 1
149 !
45 1
13 1
1 1
1 94 I
126 1
1
1
! ! ι
! ! 1
Ι
! ! ! 1
!
9970 1
3637 !
155 Ι
910 1
3U1 Ι
331 1
211 Ι
501 Ι
302 Ι
129 1
258 1
263 1
100 1
: 1
382 1
299 i
65 1
29 !
46 !
! 46 1
!
Ι
!
! ! B.R. ! ! 1 E O R - 9 1 ! FRANCE 1 1 ¡DEUTSCHLAND! 1
! ί BELGIQUE 1 ITALIA ¡ NEDERLAND ¡ ¡LOXEMbOURG
¡ 1 BELGIË ¡ KINGDOM !
1 i
IRELAND ! DANMARK ¡
ROHOEL OND FEEDSTOCKS CRUDE OIL AND FEEDSTOCKS
10ÜÜ Τ
PETROLE BRUT ET FEEDSTOCKS
EINFUHREN AUS MASKATOMAN
1979
1980
1980
1981
FEB
MAR
APR
MAI
JON
JUL
FEB
MAH
ΑΡΗ
MAI
JUN
JUL
1173 !
1625 !
109 !
73 !
3 ! _ ι
58 1
190 !
251 !
327 !
167 !
54 !
163 !
: I
■338
1242
68
3
_
183
207
327
167
54
183
:
41 !
83 !
! _ ) _ ι
_ ι
! _ ι
_ ι
! i
Ι
! !
IMPORTS FROM MUSCAT OMAN
5bb
3ÜU
αϊ 73
5« /
IMPORTATIONS EN PROV.DE MASCAT-OMAN
175 ! - ! 63 !
EINFUHREN AUS O.P.E.C.-LAENDERN IMPORTS FROM O.P.t.C. IMPORTATIONS EN PROV.DE L'O.P.E.P.
1979 1980
1980 FEB MAR APR MAI JUN JUL
1981 FEB MAR APR MAI JUN JUL
80 JAN-JUL 81 JANJÜL
1981/80 %
437375 !
357583 !
32492 !
3U957 !
2855/ !
31763 !
276U3 !
29314 !
27165 !
25403 !
24770 !
23341 !
22612 !
218016 ! • t
: !
67116
75222
b4 7 2
bb42
5b95
b771
6139
6198
5061
5Ü30
5155
54U8
4514
45213 :
;
114347 !
98892 !
9274 1
7006 !
7239 !
9502 !
7391 !
8245 !
7705 !
7177 !
7031 !
5523 !
5366 !
5904 !
57790 !
46385 !
19,7 !
94936
68084
5622
7325
5500
5475
4876
6294
5911
6032
54/1
5598
9621
6397
93157
59402
»,7
52707 !
42662 !
1136 !
3516 !
3718 !
3289 !
3262 !
3405 !
3207 !
28U8 !
3143 !
2448 !
379b !
2979 !
2b538 !
21978 !
19,1 1
3U9UB
28378
2830
2695
2400
25bl
2139
2189
1975
1933
1329
1891
21U3
2239
17 959
13298
26,0
51564 !
40141 !
3697 !
3207 !
3416 !
3719 !
3515 !
2665 !
29U1 !
2132 !
2398 !
2499 !
2U80 ! ; 1
24658 ! ; 1
2062 !
1893 !
161 !
175 !
171 !
187 !
181 !
129 !
155 !
108 !
81 !
91 !
96 !
1168 !
3735 !
2311 !
300 !
209 !
218 !
259 !
1U0 !
194 !
250 !
183 !
2U9 !
65 !
84 !
190 !
1533 !
1 231 !
19,7
GESAMTAUSFUHRbN TOTAL EXPORTS EXPORTATIONS TOTALES
1979
1980
1980 FEB
MAH
ΑΡΗ
MAI
JUN
JUL
1981 FEH
MAH
ΑΡΗ
MAI
JUN
JUL
80 JANJOL
81 JANJuL
1981/80 Ζ
90750 !
40270 !
3497 !
3528 !
2748 !
3240 !
2949 !
3079 !
3765 !
4329 !
43U9 !
3746 !
4269 ! : !
22134 !
; ¡
: ¡
90 !
70 !
3 !
! 28 1
1« !
1 !
12 !
7 !
7 !
! 1
: : :
62 !
; |
2α
25
36 !
21 !
64 !
25 !
56 !
60 !
. ι
23 !
: ! ! : ! !
17 !
1 !
18 !
! 1
i
: ι
37 !
16 !
94, 1
4U198
39692
3155
3171
2b81
319b
28Β2
3D17
5686 !
9288 !
121U !
3686 !
1213 !
1703 !
21713 !
2B4U6 !
136 !
117 !
32 !
54 !
35 !
25 !
66 !
50 !
16 !
13 !
5 !
35 !
305 !
123 !
59,7 !
NETTOEINFUHREN VON HlNERALOEL U N D PRODUKTEN NET IMPORTS OF PETROLEUM IMPORTATIONS NETTES DE PETROLE
1979 !
19BU !
1980 FEB !
MAR !
APR !
MAI !
JÜN !
JUL !
1961 FEB !
80
81
MAR !
APR !
MAI !
JUN !
JUL !
JANJUL !
JANJUL !
474253 ! 4 2 4807 I
36406 !
36270 !
3286U !
38212 !
33342 !
34784 !
31032 !
31288
144U87 !
130444 !
11867 !
10599 !
1U254 !
11597 !
10635 !
11013 !
9038 !
10010 !
8765 !
8923 !
6272 !
1981/80 X !
121277
112554
1U307
1UU70
7852
10543
895U
93bU
8396
8096
7977
7058
6717
6994
67999
53975 !
20,6 !
99702 !
96683 !
7124 !
8627 !
7762 !
8382 !
7235 !
8782 !
8389 !
8608 !
8733 I
7266 !
6360 !
76U7 !
57201 1
54262 !
36206
37524
2618
2535
2999
3203
2637
2811
2953
2669
20097
2B990 ! 25857?·!
219U !
2376 !
1732 !
2095 !
175U !
2102 !
1743 !
1954 !
15U5 !
1676 !
1660 !
1806 !
14760 1
12149 !
17,7 !
1318 !
1083 !
101 !
94 !
95 !
75 !
75 !
78 !
94 !
88 !
73 !
72 !
76 !
92 !
629 !
586 !
6,8 !
18858 !
1672 !
922 !
133 !
559 !
873 !
617 !
795 !
723 !
1636 !
1731 !
1119 !
1800 !
1913 !
3531 !
9712 !
375,0 !
6337 !
5766 !
556 !
481 !
510 !
513 !
476 !
405 !
384 !
469 !
338 1
392 !
907 !
15478 !
13 224 !
1271 !
1355 !
1102 !
931 !
967 !
1028 !
758 !
1010 !
817 !
762 !
809 !
754 !
ÖÜ79 1
6 031 !
25,4
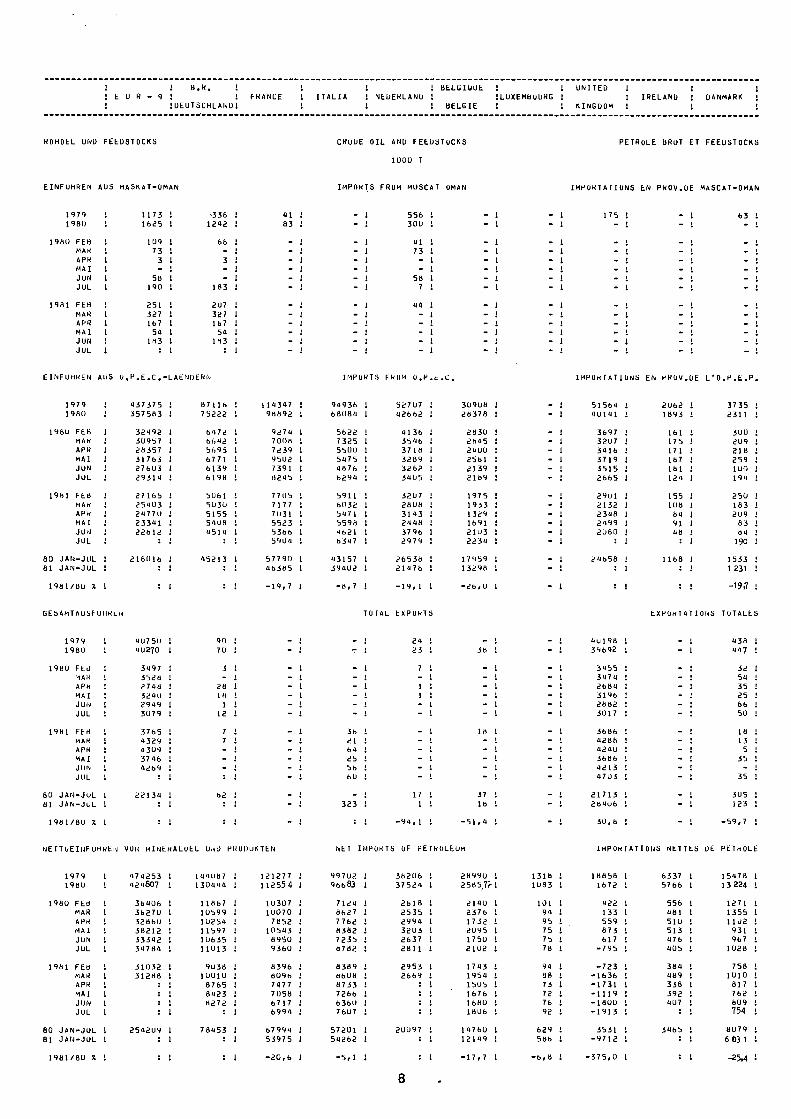
nlNERALOEL UND PRODUKTE PETROLEUH
(ROHOEL+FEEDSTOCKS+nlNERALOELPRODÜKTE) ( CRUDE+FEEOSTOCKS+PRODUCTS )
NETTOEINFUHREN NET IT1PORTS
ΙΠ GLEITJAHR 12 ΠΟΝΤΗ ΠΟΙ/ING TOTAL
PETROLE
(PETROLE BRUT+FEEOSTOCKS+PRODUITS PETR.)
IMPORTATIONS NETTES
EN ANNEE MOBILE
ΠΙΟ Τ
EUR 9
i LU LLUÜ.1U11J1L1J .U J F n A n j J A S O N D J F n A n j J A S O N D J F r i A n J J A S O N D J F T I A n J J A S O N D J F n A n J J A S O N D
19TT 1918 1919 1980 1981 ENDE DES GLEITJAHRES END OF 12 ΠΟΝΤΗ PERIOD FIN DE L'ANNEE TIOBILE
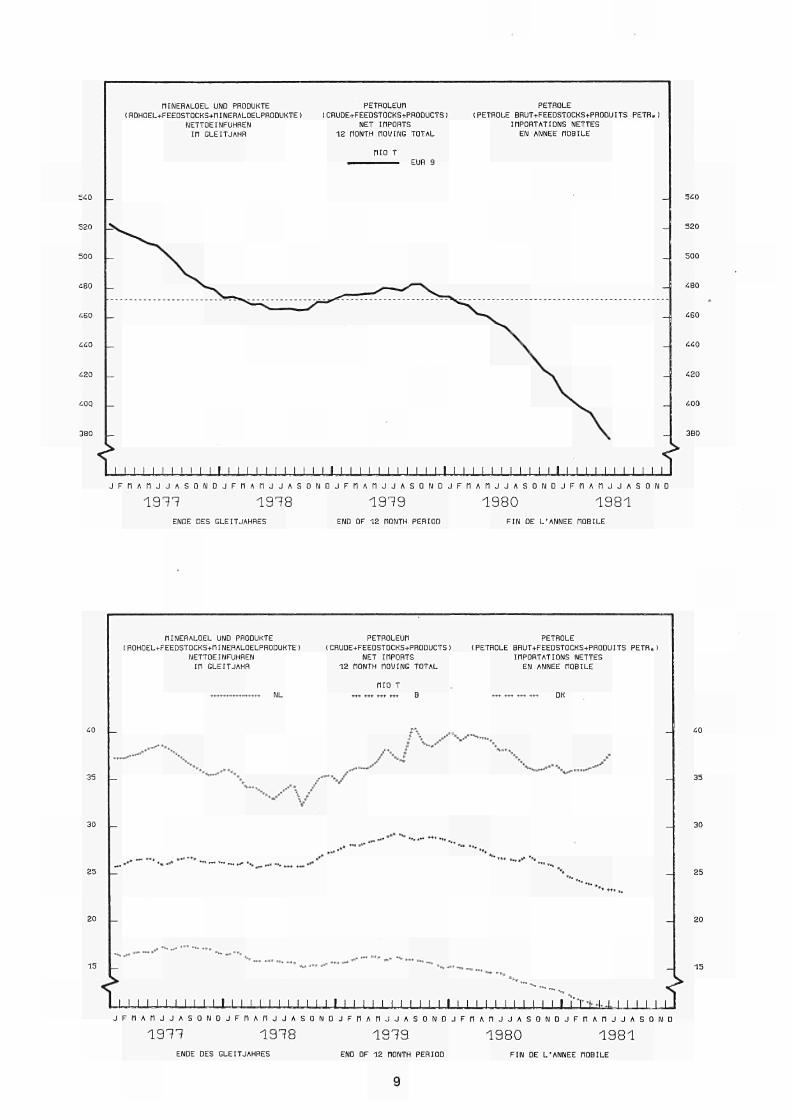
nlNERALOEL UND PRODUKTE
( ROHOEL+FEEDSTOCKS+ΠINERALOELPRODUKTE )
NETTOEINFUHREN
ΙΠ GLEITJAHR
PETROLEUn PETROLE
(CRUDE+FEEDSTOCKS+PRODUCTS) (PETROLE BRUT+FEEDSTOCKS+PRODUITS PETR.1
NET inPORTS IHPORTATIONS NETTES
12 ΠΟΝΤΗ nOUING TOTAL EN ANNEE TIOBILE
ΠΙΟ Τ
V
, . ■
■ s ^ \ \Γ ·/'
■ * *
-"■* * ♦ · " . ,
♦+. _ »*« ' « . · * * " ' ""»·■*
*** ·».."* "■"
. . - — ■ * ·». .*· *** *** * » — **"** ~ * ~ * * * ♦ * ♦ » .
t
30
i I I I I I I I I I I I I I I I I I I I I H J . J . I I I I 1 I
J F n A n j J A S O N O J F n A n j J A S O N D J F n A n j J A S O N D J F r i A n j J A S O N D J F n A n j J A S O N D
1911 1918 19T9 1980 1981 ENDE DES GLEITJAHRES END OF 12 ΠΟΝΤΗ PERIOD FIN DE L'ANNEE HOBILE
9
¡DEUTSCHLAND
1 NEDERLAND
BELklUUE
8ELG1E
LUXEMBOURG IRELAND 1 DANMARK
ROHOEL UND FEEDSTOCKS CRUDE OIL ANO FEEDSTOCKS
10UO Τ
PETROLE BRUT ET FEEDSTOCKS
ROHOELVERAHBEITUNG IN DEN RAFFINERIEN REFINERY THROUGHPUT PETROLE BRUT TRAITE DS.LES RAFFINERIES
1979
1980
1980 MAR
APR
MAI
JUN
JUL
AUG
1981 MAR
APR
MAI
JUN
JUL
AUG
80 JANJUL
81. JANJUL
56U722 ¡ 4 9 8 4 3 5 ¡
95348 ¡ 3 9 7 5 3 ! 41296 i 38618 ! 39984 ! 3 9 6 4 8 ¡
3 7 2 2 5 ! 36690 !
: ! : ! ; ¡ ; 1
2 9 7 8 4 7 ! ¡ i
114119 ! 110772 !
10100 ! 8449 ! 9464 ! 9080 ! 8948 1
8 5 9 3 !
8019 ! 7936 ! 7502 ! 6998 1
: i ; 1
6 6 4 1 3 !
: !
127642 1 113919 !
10255 ! 9301 ! 9571 ! 8359 ! 9910 !
9326 !
8437 ! 8028 ! 7181 ! 6646 ! 7919 !
807 8 !
68129 ! 56792 !
116281 96519
6529 7909 7299
7523 7499 8290
8240 7963 7119 7150 7539
: 55421 5 3 2 5 3
3,9
! 6 0 4 8 9 ! 33883 ! i 5 0 8 3 " 1 3 3 5 2 3 !
I 5059 ! 3170 ! 1 397 ! 2 8 3 5 l ! 3 5 7 5 ! 3ÜÜ7 ! ! 9 1 4 6 ! 2542 ! I 4 0 3 ! 2607 ! I 3152 ! 2970 !
! 3 2 2 0 ! 2150 1 ! 3600 ! 1921 !
! 2 3 4 3 ! ! 2546 ! ! 2731 ! ! 2628 !
! 3 1 6 0 8 ! 2 0 2 6 9 ! ! 16920 !
! 1 6 , 5 !
9 7 2 4 8 ! 8 4 3 8 8 !
7392 !
7099 ! 7570 ! 6 2 8 3 ! 6 2 4 5 ! 6610 !
6442 ! 6499 ! 6034 1 5310 ! 5 7 8 5 !
: 1
50544 !
43666 !
2 3 1 3 ! 2028 1
177 1 177 ! 186 ! 176 1 184 !
185 1
111 1 151 ! 140 !
55 !
! !
1247 ! 737 1
8747 ! 6649 1
666 ! 506 ! 624 ! 509 ! 560 !
522 !
606 1 592 ! 443 ! 437 ! 528 ! 478 !
4221 ! 3711 !
13,6 40,9 12,1 !
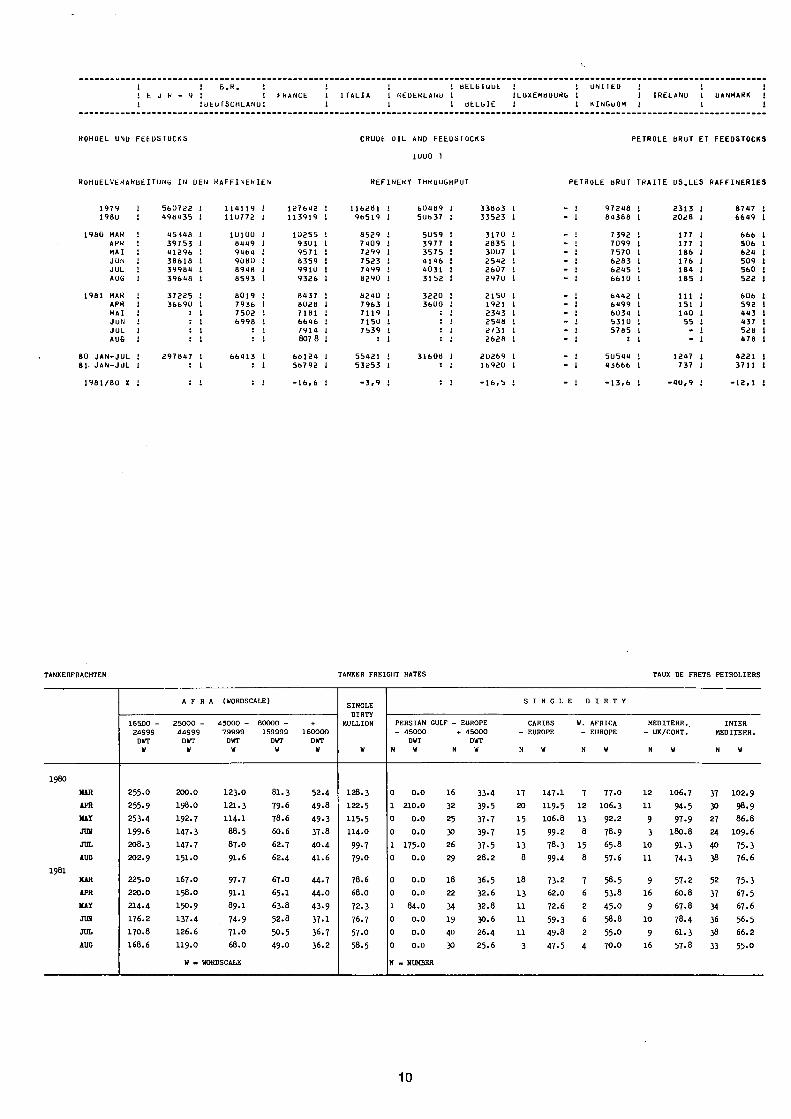
TANKERFRACHTEN TANKER FREIGHT RATES TAUX DE FRETS PETROLIERS
1980
1981
HAR
APR
K å l
JUN
JUL
AUO
NAR
APR
HAÏ
JON
JUL
ADO
A F R A (WORDSCALE)
165D0
2 4 9 9 9
DWT
W
2550
255.9
253.4
I99.6
2O8.3
2O2.9
225.O
2 2 0 . 0
2 1 4 . 4
I 7 6 . 2
I 7 O . 8
1 6 8 . 6
2 5 0 0 0 4 3 0 0 0
4 4 9 9 9 7 9 9 9 9
DWT DWT
W W
2 0 0 . 0 I 2 3 . O
I 9 8 . O 1 2 1 . 3
1 9 2 . 7 1 1 4 1
I47.3 88.5
I47.7 87.O
I5I.O 9I.6
I67.O 97.7
158.0 91.1
I5O.9 89.I
137.4 749
126.6 71.0
119.0 68.0
H WORDSCALE
8 0 0 0 0
1 5 9 9 9 9
DWT
w
81.3
79.6"
78.6
60.6
62.7
62.4
67.O
65.I
63.8
52.8
50.5
49.0
+
1 6 0 0 0 0
DWT
W
52.4
498
493
37.8
4O.4
41.6
44.7
44.0
439
37.1
36.7
36.2
SINGLE
DIRTY
HÜLLION
W
I28.3
I22.5
II5.5
II4.O
99.7
79.O
78.6
68.0
72.3
76.7
57.O
58.5
PERSIAN GOLF
4 5 0 0 0 +
DWT
N W N
0
1
0
0
1
0
0
0
1
0
0
0
N
0 . 0
2 1 0 . 0
0 . 0
0 . 0
175.0
0 . 0
0 . 0
0 . 0
84.0
0 . 0
0 . 0
0 . 0
. NUMBER
16
32
25
30
26
29
1 8
22
34
19
40
30
EUROPE
4 5 0 0 0
DWT
W
33.4
39.5
37.7
39.7
37.5
28 .2
36.5
32.6
32.8
30.6
26.4
25.6
S I N G L E
CARIBS
EUROPE
N W
17 I47.I
20 II9.5
15 106.8
15 99.2
13 78.3
8 99.4
1 8 7 3 . 2
1 3 6 2 . 0
1 1 7 2 6
1 1 5 9 . 3
1 1 4 9 . 8
3 4 7 . 5
D
W.
N
7
1 2
1 3
8
1 5
8
7
6
2
6
2
4
I R Τ Y
AFRICA
EUROPE
W
77.0
IO6.3
92.2
78.9
65.8
576
58.5
53.8
45.O
58.8
550
7 0 . 0
HEDITERR..
UK/CONT.
N W
1 2 1 0 6 . 7
11 945
9 979
3 180.8
10 913
11 74.3
9 57.2
16 60.8
9 67.8
10 78.4
9 6I.3
16 57.8
INTER
MEDITERR.
N W
37
30
27
24
40
36
52
37
34
36
38
33
1 0 2 . 9
98.9
86.8
109.6
753
76.6
75.3
67.5
67.6
56.5
66.2
55.O
10
E U R - 9 ¡DEUTSCHLAND!
FRANCE ITALIA NEDERLAND 1 BELGIQUE I ί BELGIË
! 1
¡LUXEMBOURG !
1 I
UNITEO
KINGDOM
1
! 1
IRELAND ! ! I
1 DANMARK ¡
¡
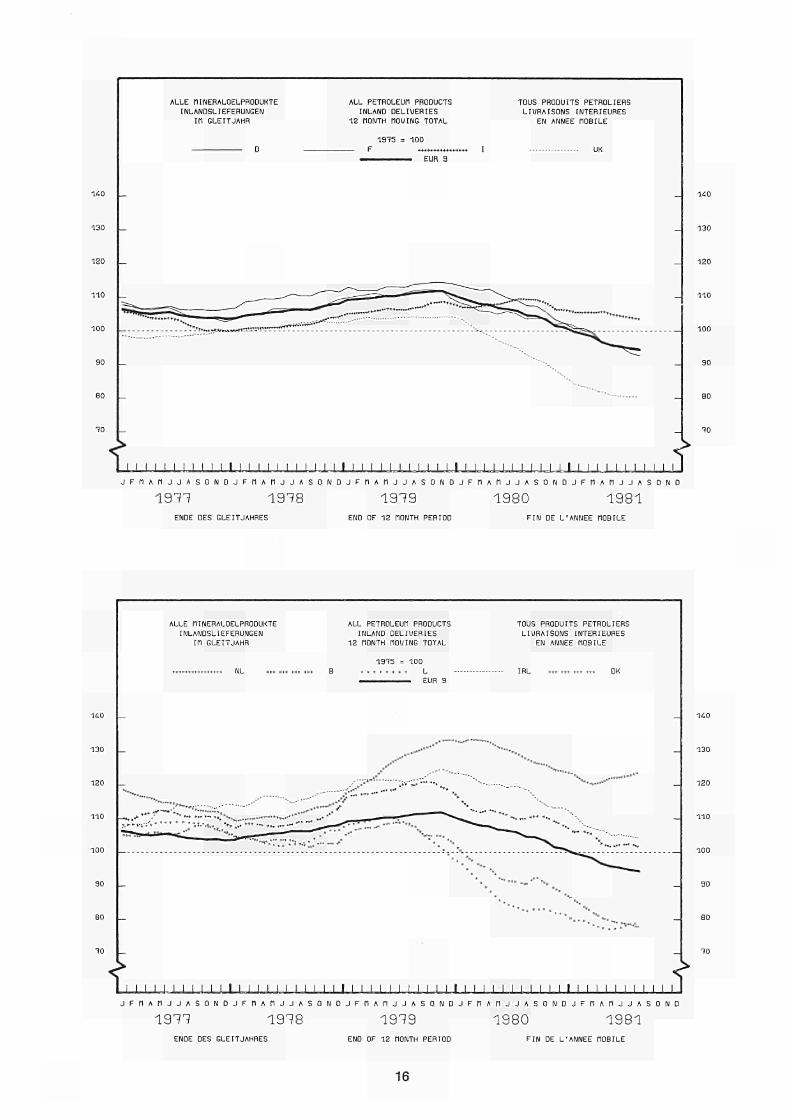
ALLE MINERALOELPRODUKTE ALL PETROLEUM PRODUCTS
1000 Τ
TOUS PRODUITS PETROLIERS
NETTOERZEUGUNG IN DEN RAFFINERIEN NET PRODUCTION IN REFINERIES PRODUCTION NETTE OANS LES RAFFINERIES
1979 I
1980 !
1980
1981
FEB !
MAR !
APR !
MAI ¡
JUN !
JUL !
FEB ¡
MAR !
APR !
MAI !
JUN !
JUL !
524252 ¡ 101711 I
161532 ¡ 102261 !
10533 ί 8296 ! 91330 ! 8310 ! 37035 ! 7769 ! 38515 ! 8763 ! 36055 i 8390 ! 37231 ! 8299 !
3366 39661
! 7012 ! > ! 7412 !
! 7334 ! ! 6922 ! ! 6473 ! I ; I
120290 ! 107034 !
9375 ! 9647 ! 8772 ! 9038 ! 7830 ! 9315 !
8065 ! 7938 ! 7500 ! 6735 ! 6187 ! 7293 !
109167 ! 90595 !
7673 ! 8019 ! 6951 ! 6860 ! 7039. ! 7027 !
6991 ! 7744 ! 7183 ! 6656 1 6672 ! 7059 !
57233 ! 97628 !
4876 1 4758 1 3693 ! 3368 ! 3868 t 3794 !
2919 Γ 3D32 ! : ! : ! : 1 : !
32251 1 31508 1
2715 1 3012 1 2719 1 2751 1 2556 1 2411 1
2213 1 2017 1 1806 1 2188 1 2401 1 2577 I
! 1
! 1 ! ! ! ! ι
! ! 1 ι 1
89977 Ι 77222 !
6860 1 6779 Ι 6991 1 6966 ! 5767 Ι 5679 !
5844 1 5844 1 5982 ! 5490 1 4770 1 5280 !
2232 ! 1956 1
161 1 172 1 172 1 181 1 172 ! 178 !
121 1 108 1 146 ! 136 ! S3 1 - Ι
83SB 1 6325 1
577 1 633 ! 468 ! 58·8 Ι 483 ! 531 !
466 1 571 ! 558 ! 420 ! 412 ! 493 !
FLÜESSIGUND RAFFINERIEGAS LPG AND REFINERY GAS
1000 Τ
GPL ET GAZ DE RAFFINERIES
NETTOERZEOGUNG NET PRODUCTION PRODUCTION NETTE
1979
1980
1980 FEB
MAR
ΑΡΗ
MAI
JUN
JUL
1981 FEB
MAR
APR
MAI
JUN
JUL
14889 !
12847 ί
1113 1 1194 1 1028 1 1026 ! 990 !
1040 !
9bU 10 17
3287 3101
2UU 22U 221 217 219 22α
215 2 3α 298 298 231
3387 3150
291 309 271 2b9 2α3 305
2ab 2α« 239 218 201 250
2871 2117
178 19b 170 147 181 159
150 170 179 125 laa 147
2854 ! 2346 1
246 1 276 1 196 ! 208 ! 200 1 182 1
175 1 191 !
5b2 547
bu b3 4b 48 48 40
42 42 25 3U ab b7
: 1
! 1
: ! 1
1
! 1
1 1 1
I
1
! 1 1
1 I 1
! ! ! 1 I
: !
1772 ! 1458 1
136 ! 127 ! 112 ! 122 ! 86 1
117 !
118 ! 122 1 128 ¡ 124 !
85 !
132 1
22 1
19 !
ι : 2 1
2 :
3 1
2 !
2 !
_ I
1 1 ! 1 !
! 1
134 !
109 1
11 !
11 !
10 !
12 !
11 !
11 !
b :
10 1
Il ! 9 !
9 !
10 !
M010RENBENZIN MOTOR SPIRIT
1000 T
ESSENCES MOTEOR
NETTOEHZEUGUNG NET PRODUCTION PRODUCTION NETTE
1979 !
1980 1
1980 FEB !
MAR 1
APR 1
MAI 1
JUN !
JUL !
1981 FEB !
MAR 1
APR I
MAI :
JUN ί JUL ;
883U2 ! 21739 ! 87311 1 22478 !
7209 ί 1705 ! 73B3 1 1877 ! 6810 ! 1597 ! 7274 1 1657 ! 7243 ί 1700 ! 7354 ! 1800 !
599( 6 642
. 1 1427 1 ! 1640 1 ! 1494 ί 1 1545 1 1 1512 1 ' : '
19267 ! 18150 !
1575 ! 1642 1 1458 ί 1631 ! 1494 ί 1674 ί
1420 1 1117 1 1144 1 1407 ! 1328 ! 156U Ι
16368 14845
1251 1220 1307 1223 1332 1335
1047 1227 1276 1144 1317 1312
775 1 ' 5ÜBB !
8074 ! 5506 1
735 Ι 444 !
64 Ι 547 !
597 ! 395 1
630 ¡ 465 !
650 1 578 !
570 Ι 431 !
404 ! 357 !
541 1 317 !
1 322 !
1 420 1
1 427 !
Ι 483 1
¡ 1
. 1
! i
! !
! ! 1
1
1
!
16178 !
16669 !
1363 1
1333 !
1332 1
1513 !
1358 1
1407 I
1234 1
1361 !
1404 !
1248 1
1262 !
1493 Ι
519 1
489 !
34 1
57 1
41 1
45 !
42 1
47 1
32 1
30 !
35 !
36 !
14 1
!
1392 !
1106 !
102 1
86 Ì
83 1
110 ι
89 !
90 1
75 !
110 1
110 1
80 1
74 !
115 !
PETHOLEUM UNO FLUüIURBINENKRAFTSTOFFE KEROSENES ANU JET FUELS
1000 Τ
PETHOLE LAMPANT ET CARBUREACTEURS
NETTOEHZEUGUNG NET PROUUCTION PRODUCTION NETTE
1979 1
198U 1
19BU FEB 1
MAR 1
APR !
MAI 1
JUN !
JUL 1
1981 FEB 1
MAR I
APR 1
MAI !
JUN 1
JUL !
24871
2263f
1 1118 1
! 1347 1
1925 ί 128 1 206 ! 133 ! 1840 1 111 1 1980 i 1U7 ! 1898 ! 113 ! 1896 1 112 ί
1577 1 99 ! 1723 1 117 1
1 131 ! 1 106 1 1 124 : ! : I
4497 1 4719 1
408 : 430 1 363 I 437 1 436 1 341 1
348 1 378 1 398 ! 313 1 297 1 511 1
5426 ! 3856 1
345 1 379 1 340 I 353 ! 319 ! 321 1
287 1 318 ! 287 I 284 ! 368 ! 201 I
1048 ! 3691 !
362 1 373 ! 257 1 276 1 294 1 331 1
207 1 172 1
: 1 : ! : I : 1
1660 1 1730 1
94 ! 117 1 166 1 182 1 160 < 168 1
117 1 136 1 133 1 142 1 166 1 174 !
! 8032 ! 1 7238 !
1 577 ! ! 622 1 1 598 ! ί 622 1 ! 567 1 1 620 1
! 519 1 1 601 1 1 604 1 ! 511 1 ! 483 1 ! 497 1
15 I 19 1
- ! 3 ! i ; 2 1 2 : 3 !
- 1 - 1 2 ! - ! - ! - I
78 ! 36 1
11 1 4 1 4 1 1 ! 7 ! - ! - 1 1 ! 2 ! 5 ! _ ι . 1
11
I 1 B.R. 1
! E U Η 9 i 1
1 IDEUTSCHLANOl
FHANCE ITALIA
1 BELGIQUE
NEDERLAND 1
! ! UNITED 1 1
ILUXEMBOUKG ! ! IRELAND 1 DANMARK
1 ! KINGDOM ! 1
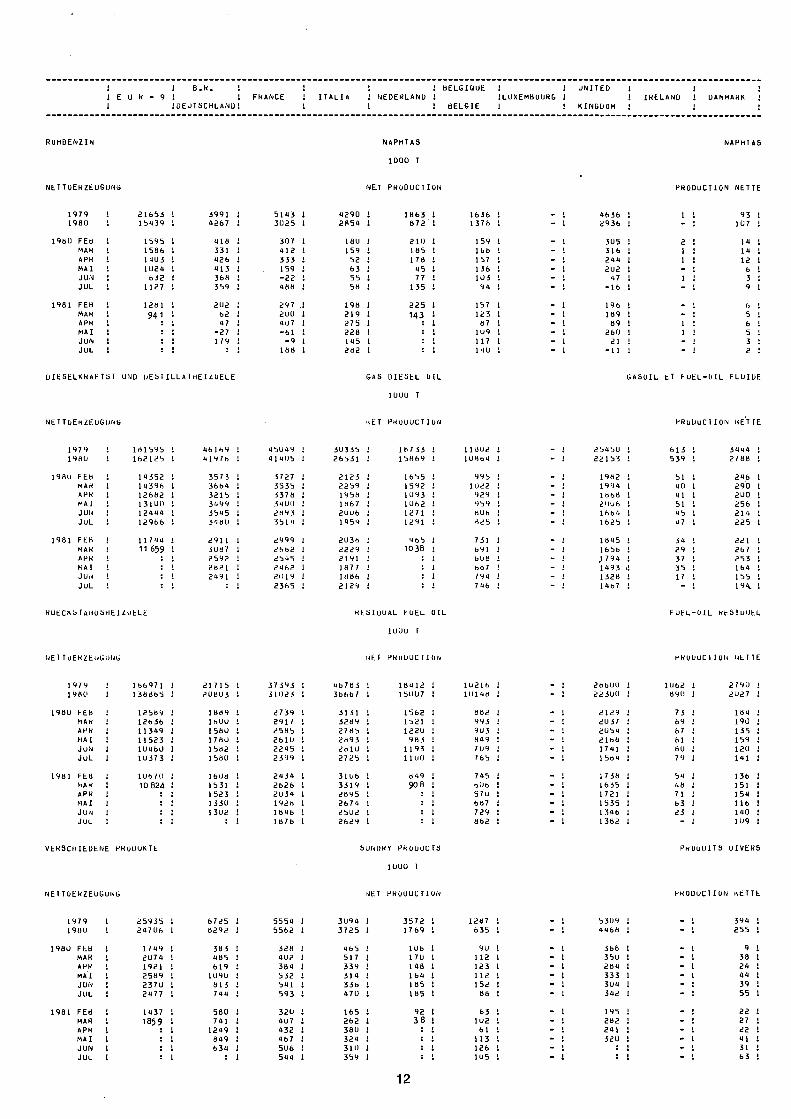
ROHBENZIN NAPHTAS
1000 Τ
NETTOEHZEUGUNG NET PRODUCTION PRODUCTION NETTE
1979
1980
1980 FEB
MAR
APR
MAI
JÜN
JUL
1981 FEB
MAR
APR
MAI
JUN
JUL
IESELKRAFT
21653
15439
1595
1586
14U3
1U24
632
1127
1281
941
: ;
iT UND DESTII
3991 !
4267 !
418 1
331 1
426 1
413 1
368 1
359 !
2U2 !
62 ¡
47 1
27 !
1 79 1 ; t
.LAIHEIZOELE
5143
3025
307
412
333
159
22
988
297 .
200
4U7
61
9
188
4290 1
2854 !
180 ;
159 1
52 !
63 ¡
55 !
58 !
19B !
219 !
27b !
228 ί 145 1 282 1
RUS
1863 1 1636 ! 872 ! 1378 !
210 1 159 1 185 ! 168 ! 178 1 157 ί 45 1 136 : 77 ! 1U3 I
135 1 94 !
225 ! 157 1 143
DIESEL
1000 Τ
! 123 ! ! 67 ! ! 1U9 ! 1 117 ί : nu ι
(/IL
4636 2936
305 316 244 202 47
-16
196 169 89
260 21
-11
1 _ 2 1 1 _ 1 -. -1 1 --
93 107
19 11 12 6 3 9
6 5 b 5 3 2
GASOIL tT FUEL-OIL FLUIDE
NETTOERZEOGUNb NET PRODUCTION PRODUCT ION NETTE
1979 1980
1980 FEb MAR APR M Λ I JUU JUL
1981 FEH MAK Λ Ρ« MAI JUN JUL
HUECKSTANUSHEIZOELE
181595 lb212b
14352 1439b 12b82 131U11 12444 129bb
11/44 11659
4blb9 4197b
3573 3bb4 3215 3499 3545 34 BU
2911 3087 2592 2821 2491
45U49 414U5
3727 3535 537« 340(1 2893 3511
2999 2bb2 2595 24b2 21)19 23b5 1
5U335 ! 26531 !
2123 ! 2259 1 1958 ! 186/ 1 2UU6 ! 1959 !
2U3« ! 2229 ! 2191 ! 1877 ! l«8b ! 2129 1
1873 S 15869 1
1655 1 1592 1 1093 ! 1062 ! 1271 1 1291 :
9b5 1038
RESIDUAL FUEL OIL
1000 T
118U2 1 1U884 :
995 1 1022 1 929 1 959 1 8U6 1 «25 i
731 ! 691 1 608 ! 687 ! 794 ! 746 ;
25450 ! 22153 !
1962 ! 1994 1 1868 ! 20U6 ! Ibb4 ! Ib25 !
1845 1 lbbb ! ^794 : 1493 4 1328 ! 1487 ί
bl3 1 539 ¡
51 !
40 !
41 !
51 !
45 !
47 1
34 !
29 !
37 !
35 !
17 ! _ 1
3441
2788
24b
290
2U0
2bb
211
22b
221
267
255
lba
155
19a.
FUELOIL RESIUUEL
NET ToEHZEUGUNG NET PRODUCTION PRODUCTION NETTE
1979
1980
1980 FEB
MAH
APR
MAI
JU.i
JUL
1981 FEB
MAR
APR
MAI
J Or,
JUL
VERSCHIEDENE PRODUKTE
lbb971 !
1388b5 !
12589 !
12b3b !
11349 !
11523 !
1U460 !
1U373 !
lUb/O
10 824
21715
20B03
1869
IbUU
158U
178U
1582
1580
1808
1531
1523
1330
1302
37395
51025
2739
2917
2585
261U
2245
2399
2454
2626
2U34
192«
1B46
1076
4b7B3
3666/
3131
3269
2785
2893
2610
2725
3106
3319
2895
2674
25U2
2629
SI
18412 1
15UÜ7 !
1562 !
1521 1
1220 1
983 !
1193 !
1100 !
899 !
90 8 !
JNDRY PRODUCTS
1000 Τ
1021b
1U148
882
993
903
»49
7U9
765
74b
oOb
b/u
bB7
729
ob2
268UU ;
22300 ;
2129 !
2037 !
2059 !
2166 !
1711 !
1581 !
1738 !
1635 1
1721 1
1535 !
1316 1
1382 1
1U62 1 890 1
73 :
69 !
67 !
61 !
80 !
79 !
59 !
48 !
71 1
63 !
as ι !
2/90 !
2027 !
184 1
190 !
135 !
159 !
120 !
141 !
136 !
151 !
154 !
116 !
140 !
109 !
PRODUITS UIVERS
NETTOERZEUGUNG NET PROUUCriON PRODUCTION NETTE
1979
1980
198U FEB
MAR
APR
MAI
JUN
JUL
1981 FEB
MAR
ΑΡΗ
MAI
JUN
JUL
25935
247Ü6
1749
2U74
1921
2589
237U
2977
1137
185 9
: : ; :
6/25 !
8292 1
383 !
985 !
619 ί 1U9U ! 813 1 744 1
580 1 741 1
1249 ! 849 ! 634 I
: 1
5554 5562
328 4U2 384 532 541 593
320 4U7 432 467 5U6 544
3094 ! 3725 !
465 ! 517 ! 339 ! 314 ! 336 1 470 !
165 ! 262 1 380 ! 324 ! 310 I 359 !
3572 i 1287 1 1769 ! 635 !
10b ì 90 ! 170 ί 112 ! 198 1 123 1 lb4 ¡ 112 1 185 ί 152 ! 185 ! 88 !
92 ! b3 ! 38 1 1U2 !
! bl ! 1 113 ! 1 126 1 i 1U5 !
53U9 ! 4468 !
368 1 35U ! 284 1 333 1 3U4 1 342 :
195 1 282 ! 241 ! 320 ! : !
: 1
39a 2bb
9 3« 24 44 39 5b
¿i 27 22 41 31 63
12
1 1 B.R. 1
1 Ε υ R 9 I 1
1 ¡DEUTSCHLAND:
1
FRANCE 1
1
I BELGIQUE
ITALIA ! NEDERLAND 1
ί !
1 ¡LUXEMBOURG 1
BELGIË
1 UNITED
1 J , KINGDOM
1
1
I
IRELAND 1
1
I
ι DANMARK I
1
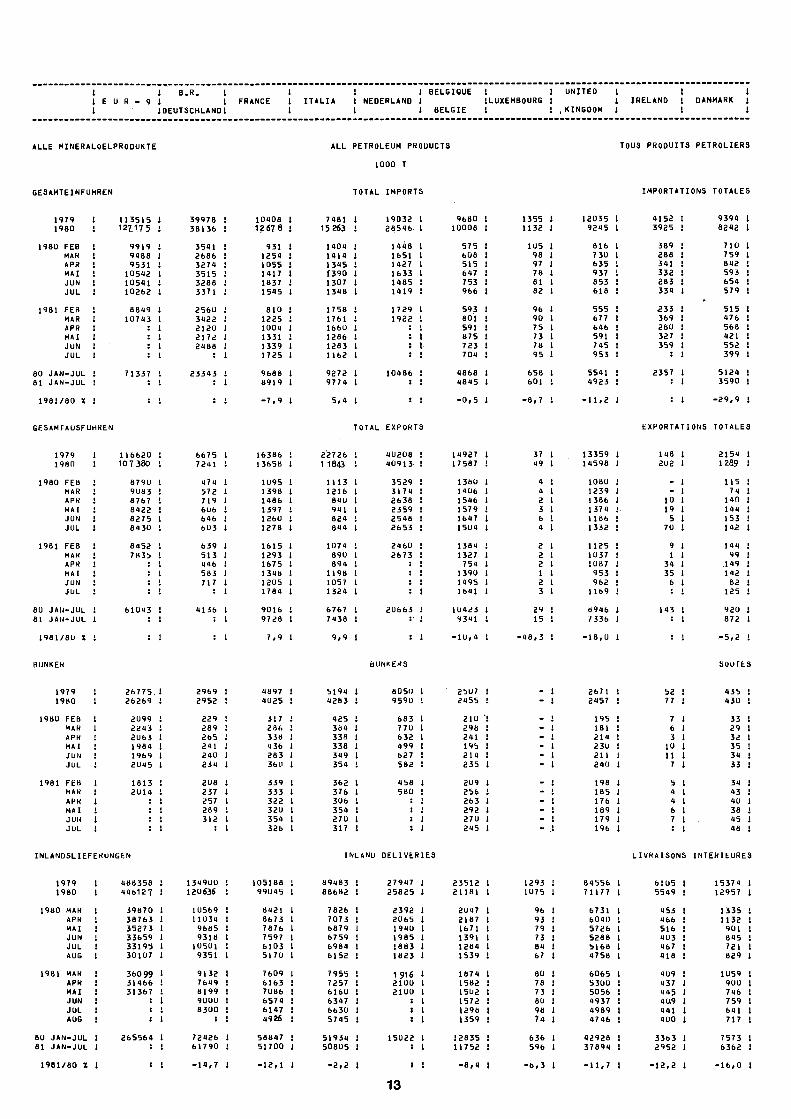
ALLE MINERALOELPRODUKTE ALL PETROLEUM PRODUCTS
1000 Τ
TOUS PRODUITS PETROLIERS
GESAMTEINFUHREN TOTAL IMPORTS IMPORTATIONS TOTALES
1979 1
1980 1
1980 FEB 1
MAR 1
APR ¡
MAI ¡
JUN ¡
JUL 1
1981 FEB 1
MAR ¡
APR ¡
MAI i
JUN !
JUL ¡
80 JANJUL !
81 JANJOL !
113515 ! 39978 ¡
127175 ί Ï8136 !
9919 ί 3541 ί 9488 ¡ 2686 ¡
953 ¡ 3274 ¡
10542 1 3515 1
10S41 ! 3288 !
10262 1 3371 !
8849 ¡ 256U ¡
10793 ! 3422 !
7133'
¡ 2120 1
1 2172 !
! 2488 !
¡ ! ¡
' ¡ 23343 ¡
¡ : ¡
10408 1
12 67 8 ¡
931 1
1254 1
1055 ¡
1417 ¡
1837 ¡
1545 1
810 1
1225 ¡
1001 !
1331 !
1339 1
1725 1
9688 ¡
8919 ¡
7981 1
15 263 ¡
1101 1
1414 1
1315 l Í390 ¡
1307 !
1398 !
1758 ¡
1761 ¡
1660 ¡
1286 ¡
1283 1
1162 1
9272 !
9779 !
19032 1
28596 l
1948 1
165
1121 ! 1
1633 1
1185 1
1419 1
1729 1
1922 !
1
1
1
1
10486 i
!
9680 1
10008 1
575 !
608 1
515 1
647 1
753 !
966 1
593 l
801 1
591 l
875 l
723 !
704 !
4868 I
4845 1
1355 1
1132 1
105 l
98 1
97 1
78 !
81 1
82 !
96 1
90 1
75 !
73 1
78 i
95 !
658 1
601 !
12035 1
9245 1
816 1
730 l
635 !
937 1
853 1
618 1
555 t
677 !
696 1
591 1
795 1
953 1
5591 l
1923 l
4152 l
3925 l
389 l
288 l
391 !
332 l
283 l
334 !
233 l
369 l
280 l
327 l
359 l : I
2357 l ■ I
9394 l
8242 l
710 l
759 l
842 !
593 1
654 1
579 1
SIS 1
476 1
568 !
421 1
552 1
399 1
S124 1
3590 l
1981/80 X l 7 , 9 1 5,4 0 , 5 ! - 8 , 7 1 1 , 2 1 2 9 , 9 1
GESAMTAUSFUHREN TOTAL EXPORTS E X P O R T A T I O N S TOTALES
1979
1980
1980 FEB
MAR
APR
MAI
JUN
JUL
1981 FEB
MAR
APR
MAI
JUN
JUL
0 JANJUL
1 JANJUL
1981/80 X
116620 ! 6675 !
10 7 38C ! 7241 :
8790 1 474 1
9083 ! 572 !
8767 1 719 1
8422 ! 606 !
8275 l 616 1
8130 1 603 !
8152 ! 639 !
7835 ! 513 !
6104
! 446 !
1 583 i
! 717 1 1 ; 1
i ! 4136 1 1 ; t
1 ; 1
16386 1
13658 !
1095 i
1398 !
1486 !
1397 1
1260 i
1278 1
1615 i
1293 !
1675 1
1398 1
1205 1
1784 i
9016 1
9728 !
7,9 !
22726 1
1 1843 !
1113 1
1216 i
840 !
991 !
821 !
811 1
1071 1
890 !
899 !
1198 !
1057 !
1329 !
6767 1
7138 1
9,9 !
90208 1 11927 1
90913 i 17587 !
3529 1 13BU !
3179 1 11U6 ί 2638 ! 1516 1 2359 I 1579 ! 2598 1 1647 1 2653 1 1504 1
2460 1 1384 ί 2673 1 1327 1
2066
I 754 ! i 1390 1 1 1495 I ! 1641 !
! 1 10423 ! ! 9341 !
1 -10,4 1
37 1 49 1
4 ! 4 ! 2 1 3 ! b ! 4 !
2 ! 2 ! 2 ! 1 ! 2 ! 3 !
29 ! 15 I
-48,3 !
13359 1 19598 1
1080 1 1239 ! 1386 1 1374 ! 1186 1 1332 1
1125 1 1037 1 1087 1 953 1 962 1 1169 !
8946 ! 7 336 1
-18,0 !
148 1 202 1
- ! - ! 10 1
19 1 5 1
70 !
9 1 1 !
39 1 35 I 6 1 : '■
143 ! ; ι
; ι
2154 1
1289 !
115 1
74 !
140 !
144 ί 153 ! 142 1
144 ! 99 !
.149 1 142 ί 62 Ι 125 1
920 1 872 !
-5,2 !
ONKER
1979 1980
1980 FEB MAR APR MAI JON JUL
1981 FEB MAR APR MAI JUN JUL
26775.1 2969 ! 26269 ! 2952 ί
2099 1 229 1 2293 ! 289 1 2063 1 265 ! 1984 ! 241 ! 1969 Î 240 ! 2045 1 234 1
1813 ! 208 ¡ 2011 1 237 !
1 257 1 ! 289 ! ! 312 I ! : 1
9897 I 9025 Ì
317 i 286 ί 338 1 436 1 283 ! 360 1
339 1 333 I 322 1 320 ! 354 I 326 1
5194 I 9283 !
125 ί 381 1 338 1 338 ! 319 ! 359 !
362 1 376 1 306 ί 359 1 270 I 317 !
BUNKERS
8051 9591
I 25U7 1 ! 2955 !
683 1 210 '1 770 1 298 ! 632 i 291 1 499 ! 19S I 621 1 214 1 582 1 235 !
458 1 2U9 1 580 1 256 ί
! 263 1 1 292 1 1 27U Ι Ι 295 1
SOUTES
[ ! Ι ! Ι Ι
! ! ι ! ι 1 1 ¿
2671 !
2457 1
195 1
181 Ι
214 !
23U !
211 1
24(1 Ι
198 Ι
185 t
176 1
189 1
179 1
196 !
52 1
77 ί
7 ! 6 Ι i ί
10 1 11 ι 7 1
b 1 4 1 α ι b 1 7 1 : Ι
435 ! 430 !
33 1 29 1 32 1 35 ! 34 1 33 1
34 1 13 ! 10 1 38 1 15 ! 18 1
INLANDSLIEFERUNGEN INLAND DELIVERIES LIVRAISONS INTERIEURES
1979 ! 1980 1
1980 MAR 1 APR 1 MAI 1 JUN ! JUL 1 AUG 1
1981 MAR 1 APR 1 MAI 1 JUN ! JUL ! AUG 1
8U JAN-JUL I 81 JAN-JUL 1
988358 ί 116127 !
39870 1 38763 ! 35273 ! 336S9 ! 33195 1 30107 !
360 99 1 31466 ! 31367 !
: 1 : ; : !
26SS64 1 : 1
134900 ! 120636 1
10569 ! 11034 1 9685 1 9318 !
10501 ! 9351 !
9132 1 7649 1 8199 1 9000 1 8300 ! : !
72426 1 61790 !
105188 ! 99045 1
8421 1 8673 1 7876 1 7597 1 6103 1 5170 I
7609 t 6163 1 7086 1 6574 1 6197 I 1926 1
58897 1 51700 1
1981/80 X 1 -11,7 I •12,1 !
89983 1 88682 1
7826 1 7073 I 6879 1 6759 ! 6989 1 6152 !
79S5 1 7257 ! 6160 1 6347 1 6630 1 5745 !
51934 I 50805 1
- 2 , 2 I
27947 1 25825 !
2392 I 2065 1 1940 I 1985 1 1883 1 1Θ23 1
1 916 I 2100 1 2100 1
: I : I : 1
15022 1 : !
23512 1 21181 1
2047 1 2187 I 1671 1 1391 ! 1281 I 1539 !
187« 1 1582 1 1502 1 1572 1 1298 1 1359 1
12835 I 11752 1
1293 i 1075 1
96 1 93 ! 79 I 73 ! 89 1 67 1
80 1 78 1 73 1 80 ! 98 I 71 1
636 1 596 1
-6,3 1
81556 I 71177 1
6731 1 6010 ¡ 5726 ! 5288 1 5168 1 1758 I
6065 1 530U ! 5056 1 «937 1 9989 1 9796 I
92928 I 37899 1
-11,7 I
61U5 5599
453 966 516 1U3 467 418
409 457 445 4U9 441 4U0
33b3 2952
I ! ! ! ! ! ! ! ! ! ! 1 1 ! ! !
-12,2 I
1S374 1 12957 1
1335 ! 1132 1 901 1 845 i 721 1 829 1
1U59 1 9U0 1 746 ! 759 1 641 ! 717 1
7S73 1 6362 1
-16,0 1
13
1 1 E U R 9
ι
1 B.R. I ! 1 ¡DEUTSCHLAND!
I ¡ ¡ BELGIQUE ! !
FRANCE ! ITALIA ! NEDERLAND ! ¡LUXEMBOURG !
¡ ¡ ! BELGIË ! 1
UNITED I I
¡ IRELAND ¡ DANMARK
KINGUOM ¡ !
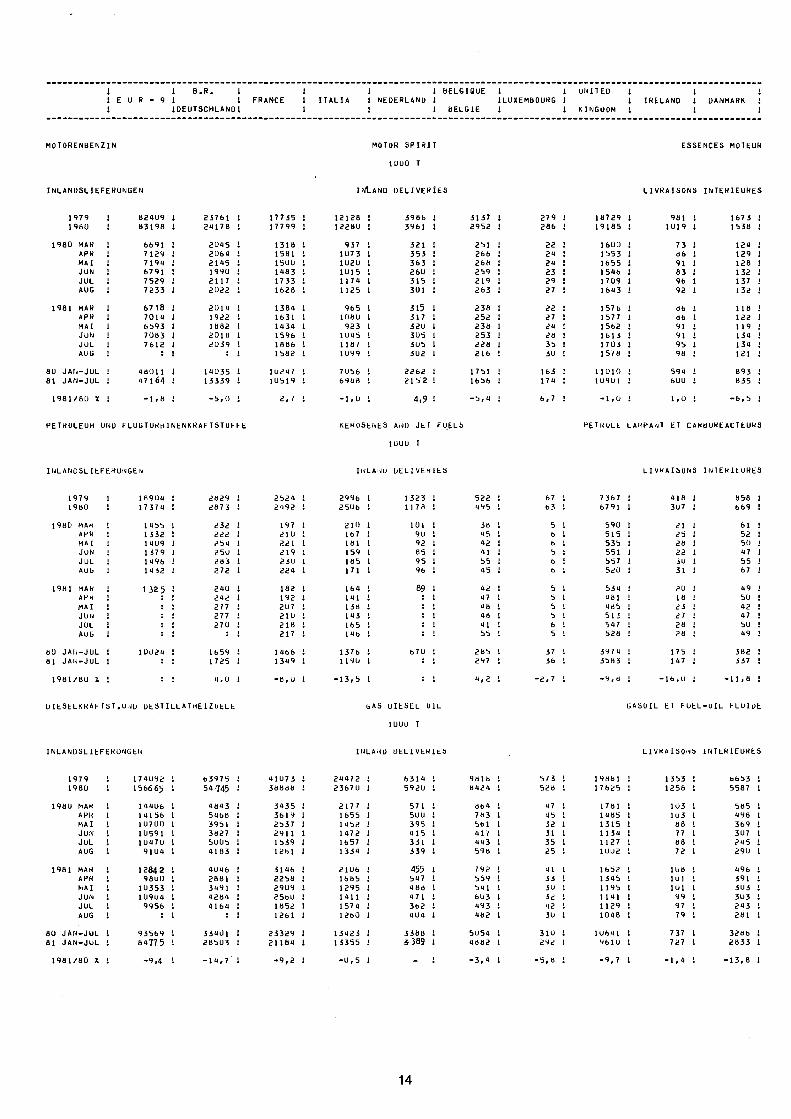
MOTORENBENZIN MOTOR SPIRIT
1UUO Τ
ESSENCES MOTEUR
INLANDSLIEFERUNGEN INLAND DELIVERIES LIVRAISONS INTERIEURES
1979 !
I960 I
1980 MAR
ΑΡΗ
MAI
JUN
JOL
AOG
1981 MAR
APR
MAI
JON
JUL
AUG
BU JAN-JUL 81 JAN-JUL
1981/80 X
82409 !
8319B !
6691 1
7129 1
7199 ί 6791 ! 7529 1 7233 1
6718 ! 7014 1 6593 ! 7083 ! 7612 !
48011 I 47 164 !
23761 1 24178 !
2045 1 2064 ! 2145 ! 1990 ! 2117 ! 2U22 1
2U14 ! 1922 ! 1682 ί 2018 ! 2D39 !
14U35 ! 13339 1
17735 1 17799 !
1318 ! 1581 1500 1483 1733 1628
1384 1631 1434 1596 1886 1582
1024/ 10519
¿.I
12128 ! 12280 !
937 1 1073 ! 1020 ! 1015 ! 1174 ¡ 1125 1
96b 1080 923
1045 118/ 1099
7056 1 6968 !
-1,0 1
3986 1 3961 1
321 ! 353 ! 363 1 260 1 315 ! 301 !
315 ! 317 1 320 ! 305 1 3U5 1 302 ί
2262 ! 2152 1
3137 ¡ 2952 !
251 ! 266 1 268 ί 259 ! 219 ! 263 !
238 ! 252 1 238 1 253 ! 228 1 216 !
1751 ! 1656 1
279 ! 286 !
22 1 24 ! 24 ! 23 ! 29 ! 27 1
22 ! 27 1 29 ! 28 ! 35 ί 30 1
163 1 179 !
4,9 -5,4 6,7 !
18729 ! 19185
16UD 1553 1655 1546 17D9 1643
1576 1577 1562 1613 17D3 1578
11010 1U901
-1,0
981 ! 1019 !
73 bb 91 83 9b 92
bb Bb 91 91 9b 98
594 bUU
1,0
1673 1538
124 129 12« 132 137 132
118 122 119 134 13a 121
893 B35
-6,5
PETROLEUM ONU FLOGTURlilNENKRAFTSTOFFE KEROSENES AND JET FUELS
1000 Τ
PETROLt LAMPANT ET CARBOREACTEUHS
INLANOSLIbFERUNGEN INLAND DELIVERIES LIVRAISONS INTEHIEURES
1979 1980
1980 MAR APR MAI JUN JUL AUG
1981 MAR ΑΡΗ MAI JUN JUL AUG
80 JAN-JUL 81 JAN-JUL
1981/BU X
1H9U4 ! 2829 ! 17374 ! 2873 1
1455 ! 232 1 1332 ! 222 1 14U9 1 254 ! 1379 1 25U ! 1496 1 283 ! 1452 ! 272 1
132 5 1 29U !
1002
! 242 1 ! 2/7 ί ! 277 ! ! 270 ! 1 : I
1 ! 1659 ! I 1725 !
! 4,0 ¡
2524 ! 2492 1
197 1 210 1 221 ! 219 1 2 50 1 224 ¡
182 ί 192 1 2U7 ! 210 ! 21» ! 217 !
1466 ! 1349 !
-8,U !
299b ! 2506 1
210 1 167 ! 181 ! 159 1 165 ! 171 !
169 ! 141 ; 138 ! 143 ί 165 ! 146 1
137b 1 119U 1
-13,5 !
1323 ! 522 ! 1178 ! 495 1
10 ! 58 1 9U ! 95 ! 92 1 42 ! 85 1 41 ! 95 1 55 ! 9b 1 45 !
89 ! 92 !
671
! 47 1 ! 48 ! ! 48 ! 1 41 ! ! 55 !
) ! 265 1 ! 297 !
! 4,2 1
67 1 63 !
b : b I b 1 5 ! b 1 b !
5 ! b : b ! b 1 b ! b !
37 ; 36 !
-2,7 !
7 367 ! 6791 1
590 ! 515 1 53b ! 551 ! 557 1 520 !
539 ! 481 i 4B5 : 513 ! 517 ! 528 !
3974 1 3583 1
-9,8 1
418 ! 3U7 !
21 I 25 ! 28 ! aa '. 3U ! 31 !
20 1 18 i 23 ! 27 ! 28 ! 28 !
175 1 147 !
-16,0 1
BbB 6b9
bl b2 bU 47 bb b7
49 bU a2 47 5U 49
3B2 337
-11,8
DIESELKRAFTST.OND DESTILLATHE1Z0ELE GAS DIESEL OIL
1000 T
GASOIL ET FUEL-OIL FLUIDE
INLANüSLIEFEHUNGEN INLAND DELiVEHltS LIVRAISONS INTERIEURES
1979 1980
1980 MAH APR MAI JUN JOL AOG
1981 MAR APR MAI JON JUL AUG
0 JAN-JUL 1 JAN-JUL
1981/80 X
174092 ! 1566 65 1
14406 ! 14156 ! 10700 ! 10591 ! 10970 ! 9109 !
12842 i 9800 ί
10353 ! 10909 ! 9956 !
; I
93569 ! 69775 ! -9,4 :
63975 59-745
4843 5468 3951 3827 5005 9183
4016 2881 3191 92B9 1161
33101 28503
-11,7
11073 1 38888 !
3135 ! 3619 ! 2537 ! 2911 1 1539 ! 1261 !
3196 1 2258 ! 2909 ! 2560 ! 1852 1 1261 !
23329 ! 21189 !
-9,2 1
29972 ! 23670 !
2177 ! Ib55 ! 1952 ! 1172 ! 1657 ! 1331 !
21U6 1 1685 ! 1295 1 1411 ! 1574 1 1260 1
13123 Ì 13355 1
-U,5 1
6311 ! 592U !
571 ! 5UU i 395 ! 415 ί 331 1 339 1
455 : 547 1 4 88 1 471 ! 362 ! 4U4 1
3388 1 *389 !
_ 1
9818 ! 8424 1
864 ! 763 ! 561 ! 417 ! 443 ! 598 !
792 ! 559 ¡ 541 1 6U3 ! 493 ! 962 1
5054 ! 1862 !
-3,1 !
5/3 528
17 4b 32 31 35 25
11 i i 30 i i 42 3U
31U 292
-5,8
19861 ! 17625 !
1781 ! 19B5 ! 1315 ! 1131 ! 1127 ! 10U2 !
1652 ! 1315 ; 1195 ! 1191 ! 1129 ! 1098 !
1U691 ! 961U !
-9,7 1
1353 ! 1258 1
1U3 ! 1U3 ! 88 1 77 1 88 1 72 I
1U8 ί IUI ί IUI 1 99 ! 97 ! 79 !
737 I 727 I
-1,9 !
6653 5587
bBb 49« 369 3U7 24b 29U
α96 391 3U5 5U3 243 2«!
328b 2833
-13,8
14
1 ! E 1
1 B.R. 1 9 l 1
¡DEUTSCHLAND; ITALIA
1 BELGIQUE ¡ NEDERLAND 1 ί ί
! Ι ¡LUXEMBOURG !
Ι !
UNITED ¡ !
KINGDOM I IRELAND I DANMARK !
I !
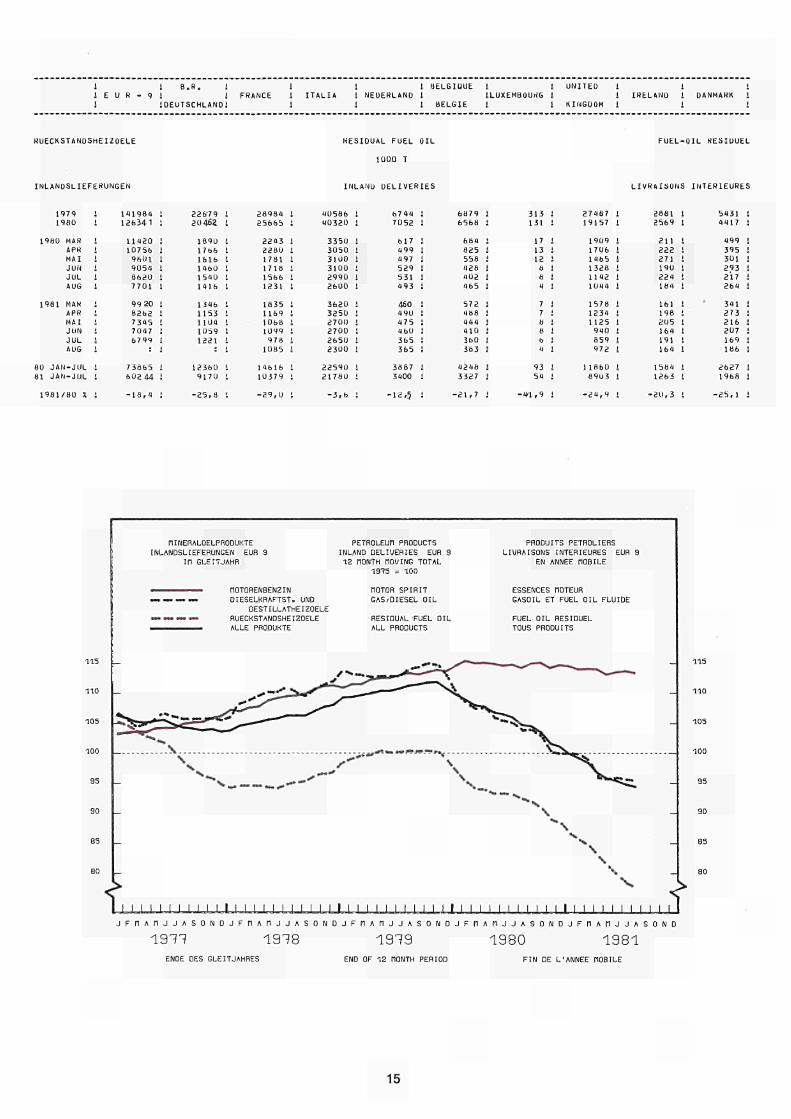
RUECKSTANDSHEIZOELE RESIOUAL FUEL OIL
1UOO Τ
FUELOIL RESIDUEL
INLANDSLIEFERUNGEN INLANU DELIVERIES LIVRAISONS INTERIEURES
1979 ¡
1980 !
1980 MAR 1
APR ¡
MAI !
JON ί JOL ¡ AOG ί
1981 MAH 1 APR ί MAI ί JUN ! JUL 1 AUG :
80 JAN-JUL ! 81 JAN-JUL !
1981/80 X ¡
191989 126341
11920 10756 9601 9059 8620 7701
99 20 6262 7395 7097 6799
: 73865 602 44
-18,4
¡ 22679 ! ! 20462 !
! 1890 ί ! 1766 ! 1 1616 ! ! 1460 ! ! 1540 ! ! 1416 ί
! 1396 1 ! 1153 ¡ ! 1104 ! 1 1059 1 ! 1221 ! 1 : 1
i 12360 : 1 9170 !
28989 ! 25665 !
2293 1 2280 ! 1781 1 1718 1 1566 1 1231 1
1835 1 1169 ¡ 1068 í 1099 ! 978 1
1085 !
19616 ! 10379 !
40586 ! 40320 í
3350 1 3050 ! 3100 ! 3100 ! 2990 ! 2600 !
3620 1 3250 í 2700 : 2700 ! 2650 í 2300 !
22590 1 21780 1
-25,8 -29,0 -3,6
6744 1 7052 1 617 1 499 ! 497 1 529 ! 531 ! 493 ! 460 i 99U ! 975 ! 460 1 365 ! 365 ! 3887 1 3400 1
-12,5 !
6879 l 6568 i 684 ! 825 1 558 ! 428 ! 402 l 465 1 572 1 468 ! 444 ! 410 ! 360 1 383 ! 4248 ! 3327 l
-21,7 !
313 ! 131 !
17 l 13 ! 12 l 8 i 6 1 ü ί
7 ! 7 ! 6 1 8 1 b ! α 1
93 1 54 !
27487 ! 19157 !
19D9 ! 1706 1 1465 ! 1328 ! 1142 1 1U14 !
1578 ! 1234 ! 1125 ! 940 ! 859 ! 972 1
11860 ! 69U3 1
-4-1,9 -29,9 !
2881 1 2569 1 211 ! 222 ! 271 ! 190 ! 224 ! 184 ! 161 ! 198 ί 2U5 ! 164 1 191 ! 164 1 158« 1 1263 1 -20,3 !
5131 ¡ 1117 !
199 !
395
301 293 21/ 264
341 273 216 207 169 186
2627 1 1968 1
2S.1 1
115 ι_
niNERALOELPRODUKTE INLANDSLIEFERUNGEN EUR 9
ΙΠ GLEITJAHR
nOTORENBENZIN DIESELKRAFTST. UND
OESTILLATHEIZOELE RUECKSTANDSHEIZOELE ALLE PRODUKTE
PETROLEUn PRODUCTS INLAND DELIVERIES EUR 9 12 ΠΟΝΤΗ nOlíING TOTAL
19T5 = 100
nOTOR SPIRIT GAS/DIESEL OIL
RESIDUAL 'FUEL OIL ALL PRODUCTS
PRODUITS PETROLIERS LIURAISONS INTERIEURES EUR 9
EN ANNEE HOB ILE
ESSENCES nOTEUR
GASOIL ET FUEL OIL FLUIDE
FUEL OIL RESIDUEL TOUS PRODUITS
t ii' I I I I I I I I I l l I I 1 I I I ί J F n A n j J A S O N D J F n A n j J A S O N D J F n A n J J A S O N D J F n A n j J A S O N D J F n A n j J A S O N D
1 9 Π ENDE DES GLEITJAHRES
1918 1919 END OF 12 ΠΟΝΤΗ PERIOD
1980 1981 FIN DE L'ANNEE nOBILE
15
i
ALLE niNERALOELPRODUKTE
INLANDSLIEFERUNGEN
ΙΠ GLEITJAHR
ALL PETROLEUn PRODUCTS
INLAND DELIVERIES
12 ΠΟΝΤΗ HOU ING TOTAL
19T5 = 100
TOUS PRODUITS PETROLIERS
LIVRAISONS INTERIEURES
EN ANNEE nOBILE
Ll,l,l,.LLI,.J I I I I I I I I I I I I I I I I I I I I I I I I I I I I I I I I I I I I U I I I I LI I I I I I I
J F n A n j J A S O N D J F n A n j J A S O N D J F n A n j J A S O N D J F n A n j J A S O N D J F n A n j J A S O N D
1 9 1 1 1918 1919 1980 1 9 8 1
ENDE DES GLEITJAHRES END OF 12 ΠΟΝΤΗ PERIOD FIN DE L'ANNEE HOBTLE
Ì
ALLE niNERALOELPRODUKTE
INLANDSLIEFERUNGEN
ΙΠ GLEITJAHR
ALL PETROLEUn PRODUCTS
INLAND DELIUERIES
12 ΠΟΝΤΗ HOI/ING TOTAL
TOUS PRODUITS PETROLIERS
LI URA I SONS INTERIEURES
EN ANNEE ΠΟΒILE
1995 = 100
L
EUR 9
Í I I I I I I I I I I I I I I I I I I I I I I I I I I I I I I I I I I I I I I I I I I I I I I I I I I I I I I I I I I I J F n A n j J A S O N D J F n A n j J A S O N D J F n A n j J A S O N D J F n A n j J A S O N D J F n A n j J A S O N D
ï 1 9 1 1 1918 1919 1980 1981
ENDE DES GLEITJAHRES END OF 12 ΠΟΝΤΗ PERIOD FIN DE L'ANNEE HOBTLE
16
1 B.H. !
U R 9 1 1
¡DEUTSCHLAND!
1 ! I BELGIQUE
FRANCE ¡ ITALIA ! NEDERLAND 1
1 1 ! BELGIË
1 1
¡LUXEMBOURG !
! !
UNITED
KINGDOM
IRELAND !
DANMARK 1
!
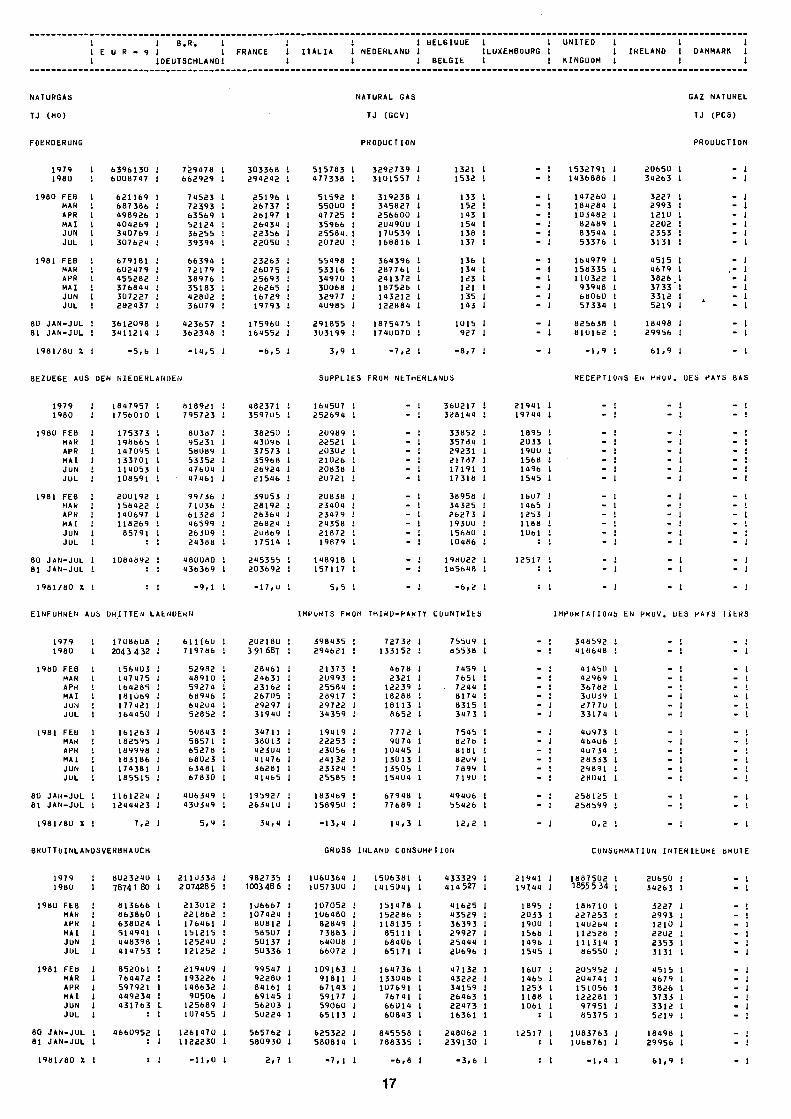
NATURGAS
TJ (HO)
NATURAL GAS
TJ (GCV)
GAZ NATUREL
TJ (PCS)
FOERDERUNG PRODUCTION PRODUCTION
1979
198U
1980 FEB
MAR
ΑΡΗ
MAI
JUN
JUL
1981 FEB
MAR
ΑΡΗ
MAI
JUN
JUL
80 JANJUL
81 JANJUL
1981/80 X 1
6396130 1
6008747
621169
687386
198926
404269
340769
307624
679181
602979
455282
376844
307227
282437
3612098
3411214
5,6
729478 1
662929 ¡
74523 I
72393 ¡
63569 1
52124 1
36255 ¡
39394 ¡
66394 !
72179 1
38976 !
35183 !
42802 !
36079 1
923657 !
362348 !
14,5 !
303368 1
294242 1
25196 1
267 37 ί 26197 1 26434 1 22356 1 22050 ί
23263 ! 26075 1 25693 1 26265 1 16729 1 19793 !
175960 1 169552 Ι
-6,5 1
S1S783 1 477338 !
51592 ! 5S000 ! 47725 ! 35966 ! 25584. 1 20720 ί
55498 1 53316 1 39970 1 30068 1 32977 ! 90985 1
291855 ! 303199 !
3,9 Ι
32927 39 1 3101557 !
319238 Ι 345827 Ι 256600 1 204900 1 170539 1 168816 1
369396 ί 287761 1 241372 ! 187526 ! 143212 1 122884 1
1875175 ! 1710070 1
-7,2 1
1321 1532
133 152 143 154 13« 137
13b 13α 123 121 135 143
1015 927
! ι
ί ! 1 ! Ι ! ! ! 1 Ι ! Ι ! 1
1 1S32791 Ι ! 1436886 1
1 117260 | 1 184284 1 Ι 103482 Ι 1 82489 1 Ι 83544 1 Ι 53376 1
! 164979 1 ! 158335 1 1 110322 1 1 93948 1 ! 68060 1 Ι 57334 1
1 825638 1 ! 810162 !
-8,7 1 ■1,9
20650 1
34263 1
3227 Ι
2993 1
1210 1
22Ü2 Ι
2353 1
3131 1
4515 1
4679 1
3826 !
3 7 3 3 !
3312 !
5219 !
18498 1
29956 Ι
61,9 !
BEZOEGE AUS DEN NIEDERLANDEN SUPPLIES FROM NETHERLANDS RECEPTIONS EN PROV. DES PAYS BAS
1979
1980
1980 FEB
MAR
APR
MAI
JON
JUL
1981 FEB
MAR
APR
MAI
JON
JUL
80 JANJUL
81 JANJUL
1981/80 X
1897957 !
1756010 !
175373 !
198665 !
147095 !
133701 !
114053 ! 108591 !
200192 !
158922 !
140697 !
118269 !
85791 !
: !
1084892 !
! '· ; ι
818921 !
795723 !
80387 !
95231 !
58089 !
53352 !
47604 !
47461 1
99736 !
71036 !
61328 !
46599 !
26509 !
24388 !
480080 !
436369 !
9,1 !
482371 !
359705 !
38250 !
93096 !
37573 !
35968 !
26929 !
21546 !
39053 !
28192 !
28364 !
26824 !
2U869 !
17514 !
245355 !
203692 !
17,U !
164507
252694
20989
2.2521 20302
21026
20838
20721
20838
23904
23479
29358
21872
19879
198918
157117
5,b
360217 !
328199 !
33852 !
35784 !
29231 !
21787 !
17191 !
17318 !
36958 !
34325 !
26273 1
193UU !
1568U !
10486 !
196022 I
185698 !
21941 !
19744 !
1895 !
2033 ! 19UU !
1568 !
1496 !
1545 !
1607 !
1465 !
1253 !
1188 !
1061 !
12517 !
: !
EINFÜHREN AOS DRITTEN L A E N O E H N IMPORTS FROM IHIHOPAKTY COONTHIES IMPORTATIONS EN PKOV. DES PAYS HERS
1979
1980
1980 FEB
MAR
APR
MAI
JUN
JUL
1981 FEB
MAR
ΑΡΗ
MAI
JUN
JUL
80 JANJUL
81 JANJUL
1981/80 X !
17086U8
2043 432
1569U3
197475
164285
181U69
177421
164450
161263
182595
189998
183186
179381
185515
1161224 !
1244423 !
7,2 !
611160 !
719786 !
52982 !
98910 !
59274 !
68946 1
64204 !
52852 !
50843 !
58571 !
65278 !
68023 !
63481 !
67830 !
406349 !
430349 !
5,9 !
202180 !
3 91 687 !
28461 !
24631 !
23162 !
26705 !
29297 I
3194D !
31711 I
38013 !
12501 !
11176 !
36281 !
41465 !
195927 !
26341U !
34,4 !
398435 !
299621 !
21373
20993
25584
28917
29722
34359
19419
22253
23056
29132
23329
25585
183469
158950
13,4 !
72732 !
133152 !
4678 1
2321 1
12239 1
18288 !
18113 1
8652 1
7772 1
9074 1
10445 !
13013 1
13505 1
15404 1
6794B 1
77689 1
14,3 1
755U9 1
85538 I
7459 1
7651 1
7244 !
8174 1
8315 !
3473 1
7545 !
8278 1
8181 !
82U9 1
7899 1
719U 1
494U6 !
55426 !
12,2 ί - 1
348592 ! 41B648 i
41450 1 42969 1 36782 1 30039 ! 2777U 1 33174 1
4U973 ! 464U6 ί 4U734 ! 28333 1 29891 ! 28041 1
258125 1 258599 !
0,2 !
BRUTTOINLANDSVERBRAUCH GROSS INLAND CONSUMPTION CONSOMMATION INTERIEURE BRÜTE
1979 (
1980 !
19BU FEB
MAR
APR
MAI
JÜN
JUL
1981 FEB
MAR
ΑΡΗ
MAI
JUN
JUL
80 JANJUL i
81 JANJUL 1
1981/80 X I
8U23290 1
78741 80 1
813666 I
863860 1
638024 1
514941 1
448398 1
414753 1
8S2061 !
764472 !
597921 1
419234 !
431763 I
4660952 I : 1
2110338 I 2 074285 !
213U12 i
221862 1
176461 1
151215 !
12524U ί 121252 1
219409 I 193226 I 148632 1 90506 I
125689 1 107455 !
1261470 I 1122230 1
- 1 1 , 0 1
982735 ! 1003 48 6 1
106667 1 107921 I 80812 I 58507 I 50137 I 50336 I
99597 I 92280 I 89161 I 69145 I 56203 I 50224 I
S65762 I 580930 I
2,7 t
1U60364 ! 1057300 !
107052 ! 106480 1 82819 1 73883 ί 69008 ! 66072 !
109163 ! 91811 ! 67193 1 59177 1 59060 1 65113 1
625322 I 580814 1
-7,1 !
1506381 ! 1415D4) 1
151478 1 152286 i 118135 1 85111 i 68406 I 65171 I
164736 1 133048 I 107691 I 76741 1 66U14 1 60813 1
815558 1 788335 1
-6 ,8 Ι
133329 1 919 527 t
91625 ! 13529 ! 36393 1 29927 1 25911 1 20696 Ι
97132 Ι 43222 Ι 3«159 Ι 26963 1 22173 1 16361 1
218062 1 239130 1
-3,6 Ι
21911 1 19791 !
189S Ι 2033 1 1900 ί 1568 1 1196 1 15«5 1
1607 1 1«65 1 1253 1 1188 1 1061 1 : !
12517 Ι : 1
1887502 1 1855 5 34 ι 188710 Ι 227253 1 140269 Ι 112528 i 111311 1 86550 Ι
205952 1 209711 1 151056 Ι 122281 1 979S1 Ι 85375 1
1083763 Ι 1U68761 Ι
-1,9 Ι
2Ub5ü !
39263 !
3227 1
2993 1
1210 1
22U2 !
2353 1
3131 1
9515 Ι
1679 1
3826 Ι
3733 Ι
3312 1
5219 !
18998 1
29956 1
61,9 1
- 1
17
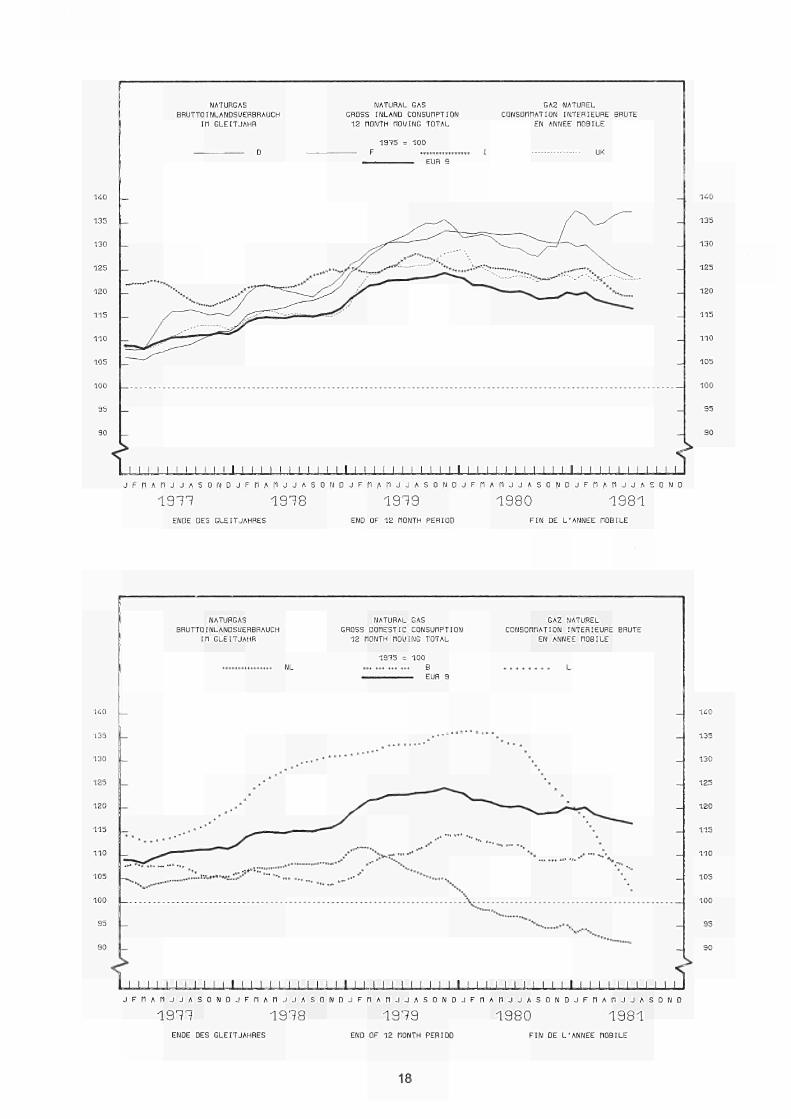
NATURGAS BRUTTOINLANDSUERBRAUCH
ΙΠ GLEITJAHR
t
NATURAL GAS GROSS INLAND CONSUnPTION 12 ΠΟΝΤΗ nOUINC TOTAL
1995 = 100
GAZ NATUREL CONSOLATION INTERIEURE BRUTE
EN ANNEE HOB ILE
' ι I I I I I I I I I t i l l I l l J F n A n j J A S O N D J F n A n j J A S O N D J F n A n j J A S O N D J F n A n j J A S O N D J F n A n j J A
1911 1918 1919 1980 1981 ENDE DES GLEITJAHRES END OF 12 ΠΟΝΤΗ PERIOD FIN DE L'ANNEE nOBILE
135
130
125
120
115
110
105
100
95
J
NATURGAS BRUTTOINLANDSUERBRAUCH
ΙΠ GLEITJAHR
NL
NATURAL GAS GROSS DOHESTIC CONSUHPTION
12 ΠΟΝΤΗ HOUING TOTAL
19Ί5 = 100 .„ „, ... „, Β
GAZ NATUREL CONSOnnATION INTERIEURE BRUTE
EN ANNEE HOBILE
ι ' I I I I I I I I I I I I I I I I I I I I I I I I I I I l l J F n A n j J A S O N D J F n A n j J A S O N D J F n A n j J A S O N D J F n A r j J A S O N D J F n A n j J A S O N D
1911 1918 1919 1980 1981 ENDE DES GLEITJAHRES END OF 12 ΠΟΝΤΗ PERIOD FIN DE L'ANNEE HOBILE
18
ERLÄUTERUNGEN
Für einige Länder liegen in den Zeitreihen über Rohöl und Mineralölprodukte nur v ie r te l jähr l iche Angaben vor. Wo dies zu t r i f f t , sind die Vierteljahreswerte unter dem letzten Quartalsmonat des betreffenden Landes und der EUR 9 aufgeführt.
ROHÖL
"Förderung"t Die Angaben über die Rohölförderung enthalten nicht die bei der Gewinnung, Reinigung und Stabilisierung
von Naturgas anfallenden Mengen von Naturbenzin und Kondensaten; dies gilt nicht für die Fälle, in denen diese Er
zeugnisse in Raffinerien umgewandelt werden.
"In der Raffinerie verarbeitetes Rohöl"ι Es handelt sich um die gesamten Rohölmengen einschliesslich der Halbfabri
kate, die in den Raffinerien verarbeitet werden (Bruttoeinsatz). Zur Vermeidung von Doppelzählungen sind die Rück
flüsse der Petrochemie bei der Raffinerieverarbeitung nicht berücksichtigt.
"Einfuhr aus dritten Ländern"ι Umfasst sämtliche in das Hoheitsgebiet eines jeden Landes eingeführten.Mengen an Roh
öl und Halbfabrikaten, darunter insbesondere solche, die zur Weiterverarbeitung für ausländische Rechnung bestimmt,
vorübergehend eingeführt, auf Zollausschlussläger eingeführt oder auf Spezialläger für ausländische Rechnung einge
führt sind.
Mengen, die im Transitwege (z.B. durch Rohrfernleitungen) das nationale Hoheitsgebiet durchqueren, Bind nicht er
fasst.
In der Regel entstammen die Angaben unmittelbaren Meldungen der Importeure; Differenzen gegenüber den durch die Zoll
dienststellen gemachten und in der Aussenhandelsstatistik veröffentlichten Datan sind deshalb möglich.
Unterteilt wird die Einfuhr nach Herkunftsländern und nicht nach Verkäufer oder Lieferländern.
MINERALÖLPRODUKTE
"Erzeugung"» Hierunter f ä l l t die Gewinnung a l l e r energetischen und nichtenergetischen Mineralölerzeugnisse in Raffinerien mit Ausnahme des Eigenverbrauchs und der Raffinerieverluste. Rücklieferungen von Produkten aus der pe t ro chemischen Industr ie werden ohne Doppelzählung er fass t . Für eine d e t a i l l i e r t e Aufzählung der Produkte wird auf den Anhang zum Bulletin 3/1976 "Energiesta t is t ik" verwiesen.
_ "Einfuhr und Ausfuhr"» Folgen derselben Begriffsbestimmung wie "Rohöleinfuhren".
"Bunker"» Betr i f f t ausschliessl ich die an die Hochseeschiffahrt a l l e r Flaggen gelieferten Bunkermengen, und zwar e inschl iess l ich der aus Beständen der Zollausschluss und Sonderläger entnommenen Mengen. Ausgenommen sind dagegen die Lieferungen für den Bedarf des internationalen Flugverkehrs.
_ "In lands lieferungen" » Erfasst wird die Gesamtmenge der Inlands lieferungen für die Umwandlung und für den Endverbrauch bei sowohl energetischer alB auch nichtenergeti3cher Vervrendung.
GAS
Die Angaben erscheinen in Terajoule (TJ) auf Basis des oberen Heizwertes für jede Gassorte.
"Erzeugung"» Die Mengen sind netto erfasst , das heiss t nach Abzug der abgeblasenen, abgefackelten und in Produktionsversuchen gebrauchten sowie der in die Lagerstätten wieder eingepressten Mengen. Der Eigenverbrauch beim Erzeuger i s t dagegen eingeschlossen.
Die Naturgaserzeugung umfasst Erd und Erdölgas sowie gegebenenfalls Gruben und Klärgase.
Die Kokereigaserzeugung umfasst Gas aus Zechenkokereien, Hüttenkokereien und unabhängigen Kokereien.
In der Erzeugung von Hochofengas sind die aus der Umwandlung von Koks in Hochöfen gewonnenen Gasmengen er fass t .
Die Ortsgaserzeugung umfasst die Oase solcher Unternehmen, deren Hauptzweck es i s t , abgelei tete Oase zu erzeugen und
zu ve r t e i l en . Dazu gehören ferner die Oase, die durch Spalten und Mischen von Naturgas, Flüssiggas und Raffineriegas entstehen.
Die Angaben über die monatliche Erzeugung für das Vereinigte Königreich und Irland beziehen sich auf Zeiträume von 4 oder 5 Woohen (4 Wochen bei den beiden ersten Monaten eines jeden Quartals, 5 Wochen beim letzten Quartalsmonat).
_ "Bezüge und Einfuhren"» Mengen, die das nationale Hoheitsgebiet im Transitwege (d.h. in Rohrfernleitungen) durch
craeren. sind nioht e r fass t .
_ "Bruttoinlandsverbrauch"ι Entspricht der zur Deckung des Inlandsbedarfs insgesamt erforderlichen Menge. Die Zahlen
ergeben s ich aus der Addition der inländischen Erzeugung plus Einfuhr minus Ausfuhr plus Bestandsveränderungen bei Erzeugern und Importeuren.
19
EXPLANATORY NOTES
In some countries the data for the ser ies of tables on crude o i l and petroleum products are only available on a quarterly bas is . Where th i s i s the case, the quarterly data i s presented in the last month of each quarter for the country concerned and the same applies to the EUR-9 t o t a l .
CRUDE OIL
- 'Production'» The data for the production of crude oil excludes natural gasoline and other condensates obtained on production, purification and stabilization of natural gas, except in the cases where these materials undergo transformation in the refineries.
- 'Petroleum treated in refineries'» This covers total quantities of crude oil, and intermediate products received for treatment in refineries (gross input). In order to avoid all duplication, returned products from the petrochemical industry for retreatment are not taken into account.
- 'Imports from third-party countries'» Includes all quantities of crude oil and semis imported from third party countries into the national territory, in particular destined for treatment on behalf of foreign countries, imported on a temporary basis, deposited in uncleared bonded warehouses, placed in special warehouses on behalf of foreign countries. Quantities in transit through the national territory (e.g. by pipeline) are excluded. The data are generally based on direct declarations submitted by importers; they may therefore differ from data supplied by the customB services and published in the Foreign Trade Statistics. The break-down of imports by country is given by country of origin, and not by vendor country or the country effecting delivery.
PETROLEUM PRODUCTS
- 'Production'» Represents the refinery production of all petroleum products for energetical and non-energetical use, with the exception of own consumption and refinery losses. Products returned from the petrochemical industry are counted without duplication. For the definitions of petroleum products see 'Energy Statistics' supplement - Bulletin 3/1976.
- 'Imports and Exports'» Are defined in identical fashion to 'crude imports'. - ' Bunkers'» Concerns the supply of bunkers for sea-going ships of all flags, and includes quantities taken from amounts deposited in uncleared bonded warehouses and in special warehouses. Excluded are supplies for the needs of international air-traffic.
- 'Inland deliveries'; Represents total quantities delivered inland for transformations and for final consumption, for both energetical and non—energetical uses.
GAS
All data is expressed in Terajoules (TJ) on the basis of Gross Calorific Value (OCV) relevant to each type of gas.
- 'Production'» Quantities indicated are net, that is after deduction of blow offs, flares and for natural gas production trials and amounts re—injected into the deposits. Producers own consumption is, however, included. Natural gas-production includes associated and non-associated natural gas and where applicable mine and sewage gas. Coke oven gas-production covers gas collected in colliery coking plants, iron and steel industry coke ovens and independent coking plants. Blast furnace gas-production covers the quantities of gas collected from the transformation of coke in blast furnaces. Works gas-production covers the quantities of gas produced by undertakings whose main objective is the production and distribution of derived gas. Also included are the quantities of natural gas, LPO and refinery gas treated or mixed. The United Kingdom and Ireland monthly production data refer to periods of 4 or 5 weeks (4 weeks for the first two months of each quarter, 5 for ΐ η θ last month).
- 'Supplies and Imports'» Quantities in transit (i.e. by pipeline) through the national territory are excluded. - 'Gross inland consumption'» Represents the quantities necessary to cover total internal requirements» the figures result from the summation of indigenous production plus imports minus exports, plus the variations of stooks at the producers and importers.
20
NOTES EXPLICATIVES
Dans quelques pays, les données des séries pétrole brut et produits pétroliers ne sont disponibles qu'au niveau trimestriel . Dans ce cas, les données condensées sous une forme trimestriel le , ont été indiquées au dernier mois de chaque trimestre, pour les pays concernés et pour EUR—9.
PETROLE BRUT
"Production" t Les données concernant la production de pétrole brut excluent l'essence naturelle et lee autres condénsate obtenus lors de la production, de l'épuration et de la stabil isation du gaz naturel, sauf dans les cas où ces produits subissent une transformation dans les raffineries.
"Pétrole brut tra i té en raffineries" » I l s'agit des quantités totales de pétrole brut, y compris les produits intermédiaires, entrées en traitement dans les raffineries (mise en oeuvre brute). Pour éviter tout double emploi , les restitutions de la pétrochimie pour retraitement dans les raffineries ne sont pas pris en compte.
"Importations en provenance des pays t iers" > Englobent toutes les quantités de pétrole brut et semibrut importées dans le territoire national en provenance des pays t i ers , y compris le traitement à façon pour compte étranger, l'importation à t i t re temporaire, la mise en entrepôt hors douane, la mise en entrepots spéciaux pour compte étranger. Ne sont cependant pas comprises les quantités qui traversent le territoire national en transit (par exemple par oléoducs).
Les données sont en général basées sur les déclarations des importateurs et peuvent de ce fait différer des données douanières, publiées dans les statistiques du commerce extérieur.
La ventilation des importations par pays suit la notion d'origine et non pas ce l le de provenance ou de consignation.
PRODUITS PETROLIERS
"Production" » Correspond à la production en raffineries de tous les produits pétroliers à usage énergétique et non—énergétique, à l'exclusion de la consommation propre et des pertes en raffineries. Les restitutions de la pétroléochimie sont comptées sans double emploi. Pour la définition des produits pétroliers, voir le document ad hoc paru en supplément au bulletin 3/1976 "Statistiques de l'énergie".
"Importations et exportations" » Définies par analogie aux importations de brut.
"Soutes" » Concerne l'approvisionnement des navires de mer, quel que soit leur pavillon, y compris les quantités prélevées dans les entrepôts hors douane et dans les entrepôts spéciaux. Sont exclues les fournitures pour les besoins du trafic aérien international.
"Livraisons Intérieures" » Correspondent au total des quantités livrées dans le pays pour transformation ou pour consommation finale énergétique ou non—énergétique.
GAZ
Les données sont exprimées en Térajoules (TJ) sur la base du pouvoir calorifique supérieur (PCS) propre à chaque
type de gaz.
"Production" ι Les quantités indiquéees sont nettes des lâchers, brûlés à la torche et pour le gaz naturel des
essais de production et des réinjections dans le gisement. La consommation propre des producteurs est cependant
incluse.
La production de gaz naturel couvre le gaz naturel associé et nonassocié et, le cas échéant, le grisou et les
gaz d'égouts.
La production de gaz de cokeries couvre les gaz recueillis dans les cokeries minières, sidérurgiques et indé
pendantes.
La production de gaz de hauts fourneaux couvre les quantités de gaz recueillies lors de la transformation du
coke dans les hauts fourneaux.
La production de gaz d'usines englobe les gaz produits par les entreprises qui ont pour objet principal la pro
duction et la distribution de gaz dérivés. Sont aussi comprises les quantités de gaz naturel GPL et gaz de
raffineries traitées ou mélangées.
Les données de production mensuelle du Royaume—Uni et de l'Irlande concernent des périodes de 4 ou 5 semaines
(4 semaines pour les deux premiers mois de chaque trimestre et 5 pour le dernier mois).
"Réceptions et importations" » Les quantités qui traversent le territoire national en transit (par ex. par
gazoduc) sont exclues.
"Consommation intérieure brute" 1 Représente les quantités nécessaires pour couvrir la totalité des besoins
intérieurs; les chiffres résultent de la somme de la production indigène, plus les importations, moins les ex
portations, plus les variations de stocks chez les producteurs et les importateurs.
21
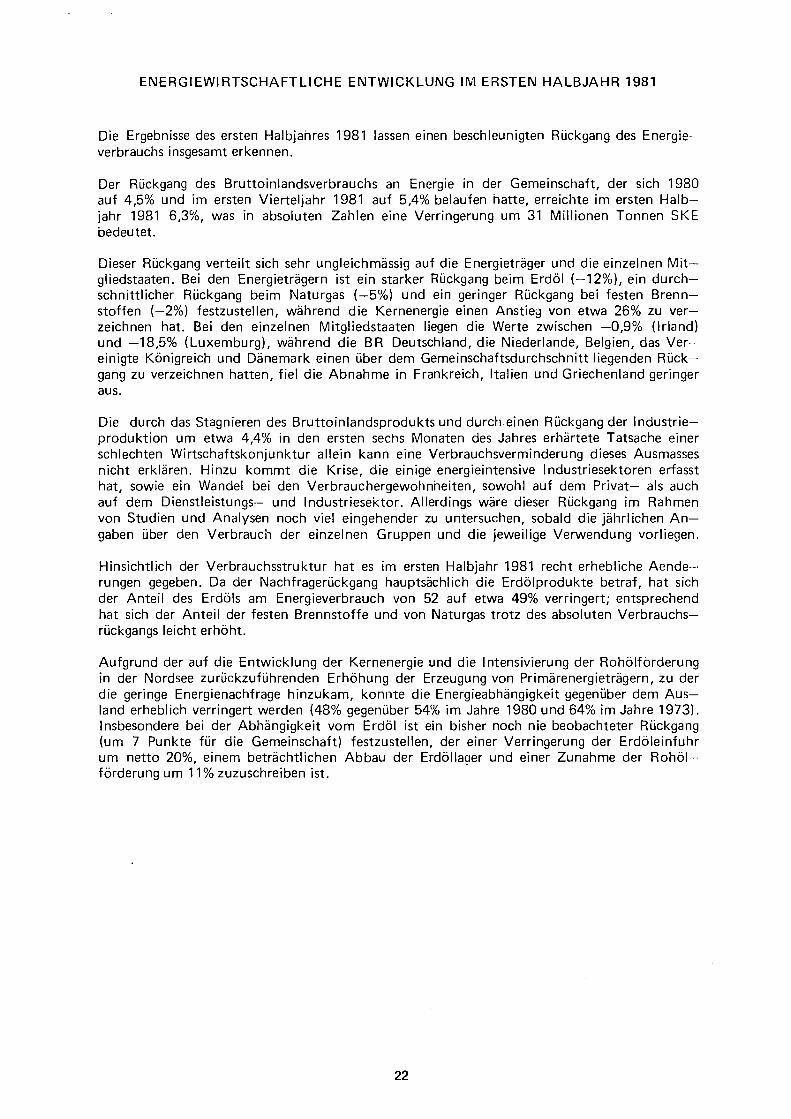
ENERGIEWIRTSCHAFTLICHE ENTWICKLUNG IM ERSTEN HALBJAHR 1981
Die Ergebnisse des ersten Halbjahres 1981 lassen einen beschleunigten Rückgang des Energie Verbrauchs insgesamt erkennen.
Der Rückgang des Bruttoinlandsverbrauchs an Energie in der Gemeinschaft, der sich 1980 auf 4,5% und im ersten Vierteljahr 1981 auf 5,4% belaufen hatte, erreichte im ersten Halbjahr 1981 6,3%, was in absoluten Zahlen eine Verringerung um 31 Millionen Tonnen SKE bedeutet.
Dieser Rückgang verteilt sich sehr ungleichmässig auf die Energieträger und die einzelnen Mit— gliedstaaten. Bei den Energieträgern ist ein starker Rückgang beim Erdöl (—12%), ein durchschnittlicher Rückgang beim Naturgas (—5%) und ein geringer Rückgang bei festen Brennstoffen (—2%) festzustellen, während die Kernenergie einen Anstieg von etwa 26% zu verzeichnen hat. Bei den einzelnen Mitgliedstaaten liegen die Werte zwischen —0,9% (Irland) und —18,5% (Luxemburg), während die BR Deutschland, die Niederlande, Belgien, das Ver einigte Königreich und Dänemark einen über dem Gemeinschaftsdurchschnitt liegenden Rückgang zu verzeichnen hatten, fiel die Abnahme in Frankreich, Italien und Griechenland geringer aus.
Die durch das Stagnieren des Bruttoinlandsprodukts und durch einen Rückgang der Industrieproduktion um etwa 4,4% in den ersten sechs Monaten des Jahres erhärtete Tatsache einer schlechten Wirtschaftskonjunktur allein kann eine Verbrauchsverminderung dieses Ausmasses nicht erklären. Hinzu kommt die Krise, die einige energieintensive Industriesektoren erfasst hat, sowie ein Wandel bei den Verbrauchergewohnheiten, sowohl auf dem Privat— als auch auf dem Dienstleistungs— und Industriesektor. Allerdings wäre dieser Rückgang im Rahmen von Studien und Analysen noch viel eingehender zu untersuchen, sobald die jährlichen A n gaben über den Verbrauch der einzelnen Gruppen und die jeweilige Verwendung vorliegen.
Hinsichtlich der Verbrauchsstruktur hat es im ersten Halbjahr 1981 recht erhebliche Aende— rungen gegeben. Da der Nachfragerückgang hauptsächlich die Erdölprodukte betraf, hat sich der Anteil des Erdöls am Energieverbrauch von 52 auf etwa 49% verringert; entsprechend hat sich der Anteil der festen Brennstoffe und von Naturgas trotz des absoluten Verbrauchs— rückgangs leicht erhöht.
Aufgrund der auf die Entwicklung der Kernenergie und die Intensivierung der Rohölförderung in der Nordsee zurückzuführenden Erhöhung der Erzeugung von Primärenergieträgern, zu der die geringe Energienachfrage hinzukam, konnte die Energieabhängigkeit gegenüber dem Aus land erheblich verringert werden (48% gegenüber 54% im Jahre 1980 und 64% im Jahre 1973). Insbesondere bei der Abhängigkeit vom Erdöl ist ein bisher noch nie beobachteter Rückgang (um 7 Punkte für die Gemeinschaft) festzustellen, der einer Verringerung der Erdöleinfuhr um netto 20%, einem beträchtlichen Abbau der Erdöllager und einer Zunahme der Rohöl— förderung um 11% zuzuschreiben ist.
22
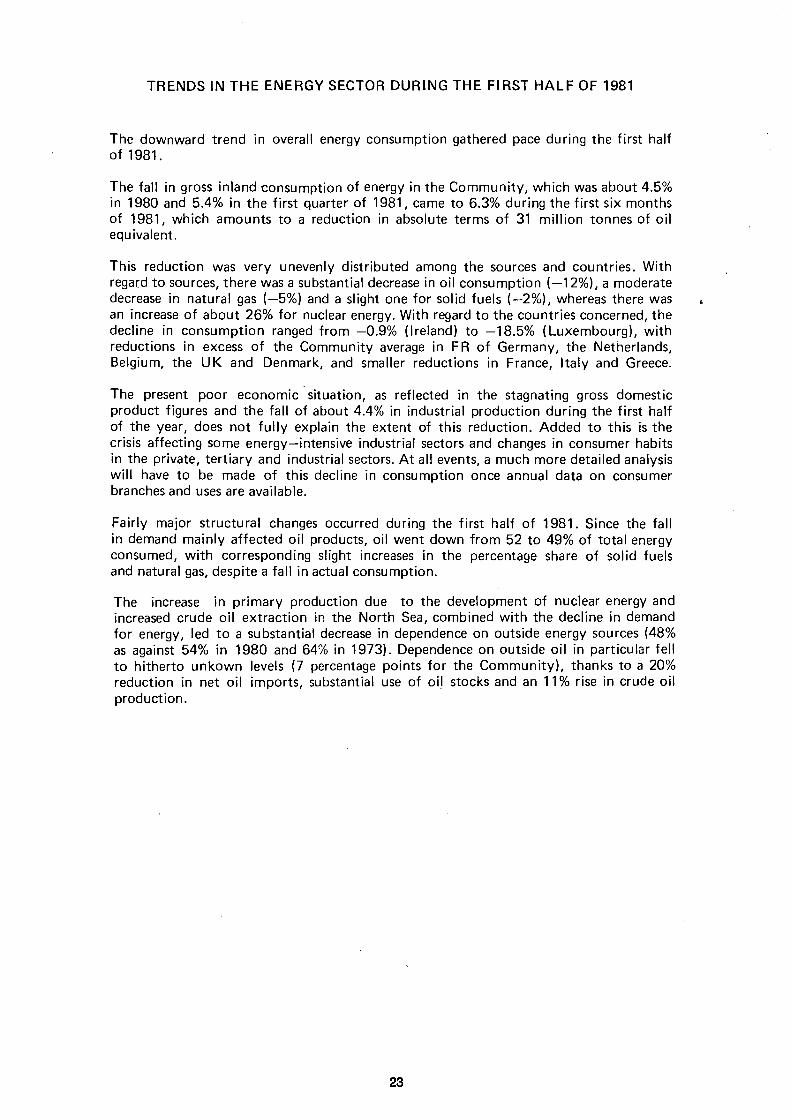
TRENDS IN THE ENERGY SECTOR DURING THE FIRST HALF OF 1981
The downward trend in overall energy consumption gathered pace during the first half of 1981.
The fall in gross inland consumption of energy in the Community, which was about 4.5% in 1980 and 5.4% in the first quarter of 1981, came to 6.3% during the first six months of 1981, which amounts to a reduction in absolute terms of 31 million tonnes of oil equivalent.
This reduction was very unevenly distributed among the sources and countries. With regard to sources, there was a substantial decrease in oil consumption (—12%), a moderate decrease in natural gas (—5%) and a slight one for solid fuels (—2%), whereas there was an increase of about 26% for nuclear energy. With regard to the countries concerned, the decline in consumption ranged from —0.9% (Ireland) to —18.5% (Luxembourg), with reductions in excess of the Community average in FR of Germany, the Netherlands, Belgium, the UK and Denmark, and smaller reductions in France, Italy and Greece.
The present poor economic situation, as reflected in the stagnating gross domestic product figures and the fall of about 4.4% in industrial production during the first half of the year, does not fully explain the extent of this reduction. Added to this is the crisis affecting some energy—intensive industrial sectors and changes in consumer habits in the private, tertiary and industrial sectors. At all events, a much more detailed analysis will have to be made of this decline in consumption once annual data on consumer branches and uses are available.
Fairly major structural changes occurred during the first half of 1981. Since the fall in demand mainly affected oil products, oil went down from 52 to 49% of total energy consumed, with corresponding slight increases in the percentage share of solid fuels and natural gas, despite a fall in actual consumption.
The increase in primary production due to the development of nuclear energy and increased crude oil extraction in the North Sea, combined with the decline in demand for energy, led to a substantial decrease in dependence on outside energy sources (48% as against 54% in 1980 and 64% in 1973). Dependence on outside oil in particular fell to hitherto unkown levels (7 percentage points for the Community), thanks to a 20% reduction in net oil imports, substantial use of oil stocks and an 11% rise in crude oil production.
23
EVOLUTION DE L'ECONOMIE ENERGETIQUE AU COURS DU 1ER SEMESTRE 1981
Les résultats du premier semestre 1981 enregistrent une accélération de la baisse de la consommation énergétique globale.
La diminution de la consommation intérieure brute d'énergie de la Communauté qui avait été de l'ordre de 4,5% en 1980 et de 5,4% pour le 1er trimestre 1981 a atteint, au cours du premier semestre 1981, 6,3%, ce qui, en termes absolus, représente une réduction de 31 m i l lions de tonnes d'équivalent pétrole.
Cette baisse s'est très diversement distribuée suivant les sources et les pays. En ce qui c o n cerne les sources, on constate une régression très importante pour le pétrole (—12%), moyenne pour le gaz naturel (—5%) et faible pour les combustibles solides (—2%), alors que pour l'énergie nucléaire, l'augmentation a été d'environ 26%. Au niveau des pays, entre les e x trêmes de —0,9% pour l'Irlande et —18,5% pour le Luxembourg, on trouve d'un côté la R.F. d'Allemagne, les Pays—Bas, la Belgique, le Royaume-Uni et le Danemark avec des d i minutions supérieures à la moyenne communautaire et de l'autre la France, l'Italie et la Grèce avec des baisses moins importantes.
La mauvaise conjoncture économique, confirmée par la stagnation du produit intérieur brut ainsi que par une régression de la production industrielle d'environ 4,4% pour les six premiers mois de l'année, ne peuvent à elles seules expliquer une baisse de la consommation d'une telle envergure. S'y ajoutent la crise que traversent certains secteurs industriels à forte intensité énergétique ainsi que des modifications dans les habitudes des consommateurs, qu'ils appartiennent au secteur privé, tertiaire ou industriel. Toutefois, cette contraction devra faire l'objet d'études et d'analyses à un niveau beaucoup plus fin dès que les données annuelles concernant les différentes branches consommatrices et les usages seront disponibles.
Sur le plan structurel, des changements assez importants sont intervenus au cours du premier semestre 1981. La réduction de la demande ayant porté essentiellement sur les produits pétroliers, la part du pétrole dans la consommation d'énergie est tombée de 52 à 49% envi ron, et corrélativement les quote—parts des combustibles solides et du gaz naturel ont augmenté légèrement, malgré une diminution absolue de leur consommation.
L'augmentation de la production primaire, attribuable au développement de l'énergie n u cléaire et à l'intensification de l'extraction de pétrole brut en Mer du Nord, se conjuguant avec la faiblesse de la demande d'énergie, a permis de réduire, d'une fapon substantielle la dépendance énergétique extérieure (48% contre 54% en 1980 et 64% en 1973). La dé pendance pétrolière, en particulier, a atteint des niveaux de réduction jamais observés (7 points pour la Communauté) grâce à une réduction des importations nettes de pétrole de 20% , à un déstockage important en produits pétroliers et à un accroissement de 11% de la production de pétrole brut.
24
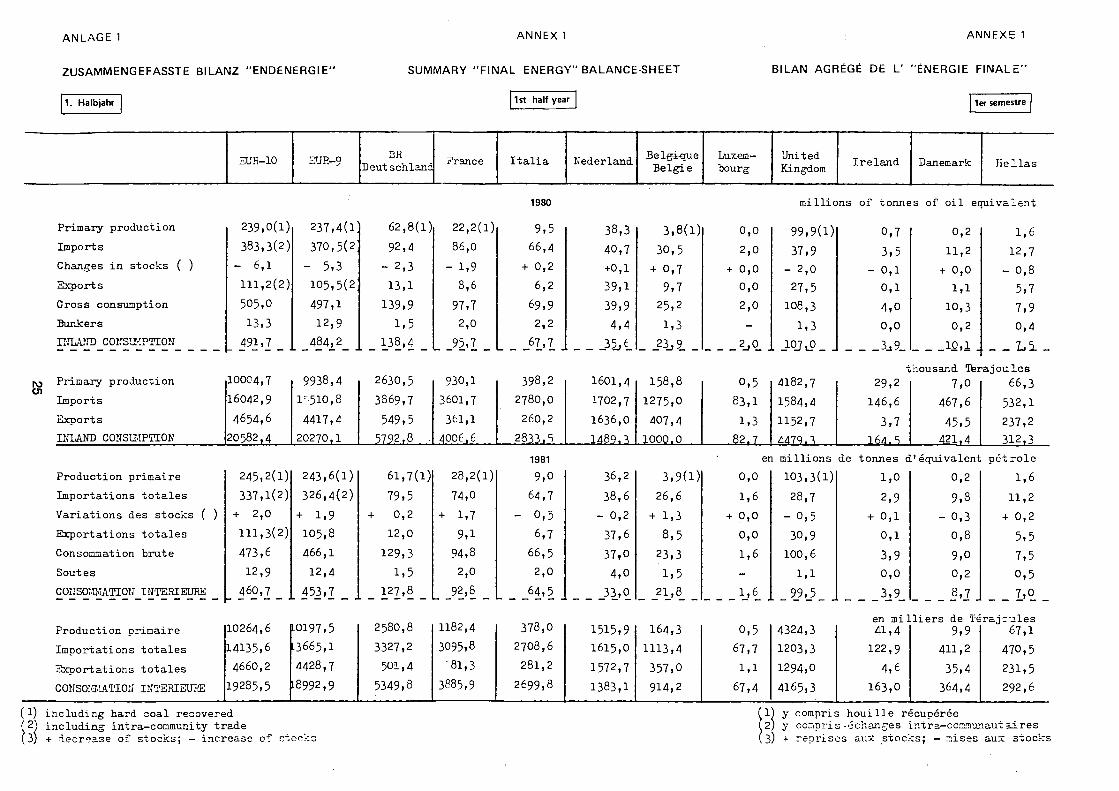
ANLAGE 1
ZUSAMMENGEFASSTE BILANZ "ENDENERGIE"
ANNEX 1
SUMMARY "F INAL ENERGY" BALANCESHEET
ANNEXE 1
BILAN AGRÉGÉ DE L' "ÉNERGIE FINALE'
1. Halbjahr 1st half year 1er semestre
EUR10 EUR9 Deut schisma
I t a l i a Nederland Belgique
Belg ië
Luxem
bourg
United
Kingdom I r e l a n d Danemark H e l l a s
Primary product ion
Imports
Changes in s tocks ( )
Exports
Gross consumption
Bunkers
INLAND CONSUMPTION
239,0(1)
383,3(2)
6,1
111,2(2)
505,0
13,3
491,7
237,4(1
370,5(2
5,3
105,5(2
497,1
12 ,9
484,2
62,8(1)
92,4
2 ,3
13,1
139,9
1,5
138,4
22,2(1)
86,0
1,9
8,6
97,7
2,0
95,7
1980
9,5
66,4
+ 0,2
6,2
69,9
2,2
67,7
m i l l i o n s of tonnes of o i l ecruivalent
38,3
40,7
+0,1
39,1
39,9
4 ,4
_35_,Ê_
3,8(1)
30,5
+ 0,7
9,7
25,2
1,3
23,9_
0,0
2,0
+ 0,0
0,0
2,0
.2j0_
99,9(1)
37,9
2 ,0
27,5
108,3
1,3
_10JU0_ .
0,7
3,5
0 ,1
0 ,1
4 ,0
0 ,0
.3a9_
0 , 2
1 1 , 2
+ 0 , 0
1 ,1
1 0 , 3
0 , 2
1 0 , 1
1,6
1 2 , 7
0 , 8
5 ,7
7 , 9
0 , 4
L i
pa P r i m a r y p r o d u c t i o n
I m p o r t s
E x p o r t s
INLAND CONSUMPTION
10004 ,7
16042 ,9
4 6 5 4 , 6
2 0 5 8 2 , 4
9 9 3 8 , 4
l r 5 1 0 , 8
4 4 1 7 , 4
2 0 2 7 0 , 1
2 6 3 0 , 5
3 8 6 9 , 7
5 4 9 , 5
5 7 9 2 , 8
930 ,1
3601 ,7
361 ,1
4006,6
3 9 8 , 2
2 7 8 0 , 0
2 6 0 , 2
2 8 3 3 . S
1 6 0 1 , 4
1702 ,7
1 6 3 6 , 0
1 4 8 9 . 3
1 5 8 , 8
1 2 7 5 , 0
4 0 7 , 4
1 0 0 0 . 0
0 , 5
8 3 , 1
1 ,3
§ 2 , 7
4 1 8 2 , 7
1 5 8 4 , 4
1 1 5 2 , 7
4479,3.
1
29,2
146,6
3 , 7
16Δ.*,
h o u s a n d T e r a j o u l e s
7 , 0 6 6 , 3
4 6 7 , 6
4 5 , 5
4 2 1 , 4
5 3 2 , 1
2 3 7 , 2
3 1 2 , 3
P r o d u c t i o n p r i m a i r e
I m p o r t a t i o n s t o t a l e s
V a r i a t i o n s d e s s t o c k s ( )
E x p o r t a t i o n s t o t a l e s
Consommation b r u t e
S o u t e s
CONSOMMATION INTERIEURE
2 4 5 , 2 ( 1 )
3 3 7 , 1 ( 2 )
+ 2 , 0
1 1 1 , 3 ( 2 )
4 7 3 , 6
1 2 , 9
4 6 0 , 7
2 4 3 , 6 ( 1 )
3 2 6 , 4 ( 2 )
+ 1,9
1 0 5 , 8
4 6 6 , 1
1 2 , 4
4 5 3 , 7
6 1 , 7 ( 1 )
7 9 , 5
+ 0 , 2
1 2 , 0
1 2 9 , 3
1,5
1 2 7 , 8
2 8 , 2 ( 1 )
74 ,0
+ 1,7
9 ,1
9 4 , 8
2 ,0
92 ,6
1981
9 , 0
6 4 , 7
0 , 5
6 ,7
6 6 , 5
2 , 0
6 4 , 5
3 6 , 2
3 8 , 6
0 , 2
3 7 , 6
3 7 , 0
4 , 0
3 3 , 0
3 , 9 ( 1 )
2 6 , 6
+ 1 ,3
8 , 5
2 3 , 3
1 ,5
2 1 , 8
en m i l l i o n s
0 , 0
1 ,6
+ 0 , 0
0 , 0
1 ,6
1,6
1 0 3 , 3 ( 1 )
2 8 , 7
0 , 5
3 0 , 9
1 0 0 , 6
1 ,1
9 9 , 5
d e t o n n e s c
1,0
2 , 9
+ 0 , 1
0 , 1
3 , 9
0 , 0
3 , 9
1 é q u i v a l e n t
0 , 2
9 , 8
0 , 3
0 , 8
9 , 0
0 , 2
8 , 7
p é t r o l e
1 ,6
1 1 , 2
+ 0 , 2
5 , 5
7 , 5
0 , 5
7 , 0
P r o d u c t i o n p r i m a i r e
I m p o r t a t i o n s t o t a l e s
E x p o r t a t i o n s t o t a l e s
CONSOMMATION INTERIEURE
10264 ,6
1 4 1 3 5 , 6
4660 ,2
1 9 2 8 5 , 5
L0197.5
L3665.1
4 4 2 8 , 7
18992 ,9
2 5 8 0 , 8
3 3 2 7 , 2
5 0 1 , 4
5 3 4 9 , 8
1182 ,4
3095τθ
"81 ,3
3885,9
3 7 8 , 0
2 7 0 8 , 6
2 8 1 , 2
2 6 9 9 , 8
1 5 1 5 , 9
1 6 1 5 , 0
1 5 7 2 , 7
1 3 8 3 , 1
1 6 4 , 3
1 1 1 3 , 4
3 5 7 , 0
9 1 4 , 2
0 , 5
6 7 , 7
1 ,1
6 7 , 4
4 3 2 4 , 3
1 2 0 3 , 3
1 2 9 4 , 0
4 1 6 5 , 3
en m i l l i e r s de Té
4 1 , 4 9 , 9
1 2 2 , 9
4 , 6
1 6 3 , 0
4 1 1 , 2
3 5 , 4
3 6 4 , 4
r a j c u l e s
6 7 , 1
4 7 0 , 5
2 3 1 , 5
2 9 2 , 6
( 1) i n c l u d i n g hard coal recovered
(2Ì i n c l u d i n g intracommunity t r a d e
(3) + decrease of s t o c k s ; i nc rease of ctockc
1) y compris h o u i l l e récupérée
2) y co.Tipriséchanges intra—communautaires
3) + r e p r i s e s aux s tocks ; — mises aux s tocks
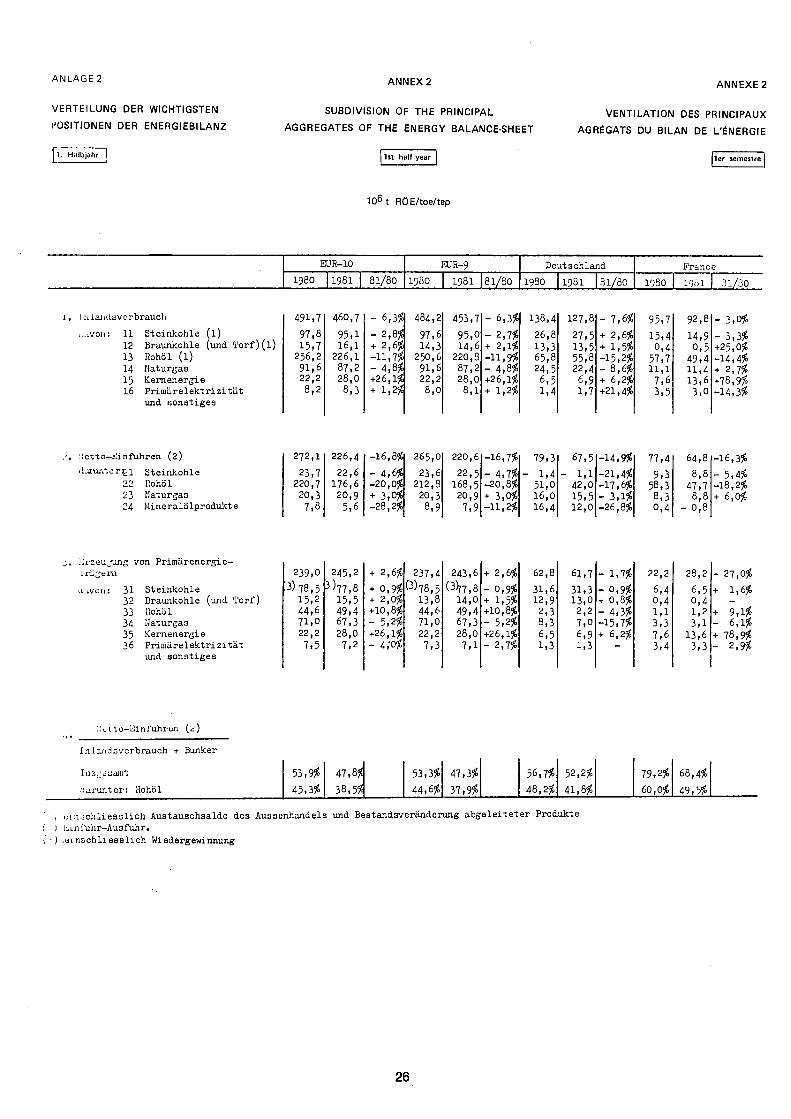
ANLAGE 2 ANNEX 2 ANNEXE 2
VERTEILUNG DER WICHTIGSTEN
i'OSITIONEN DER ENERGIEBILANZ
l l . Halbjahr
SUBDIVISION OF THE PRINCIPAL
AGGREGATES OF THE ENERGY BALANCE-SHEET
1st half year
VENTILATION DES PRINCIPAUX
AGRÉGATS DU BILAN DE L'ÉNERGIE
1er semestre
1 06t RÖE/toe/tep
EUR10
1980 I98I 81/80
EUR9
198O 1981 I81/8O
Deutschland
I98O I98I I31/80
France
I9S0 19o 1 31/80
1 nlaiidsverbrauch
11 Steinkohle fl)
12 Braunkohle (und Torf)(l)
13 Rohöl (1)
14 Naturgas
15 Kernenergie
16 Primärelektrizität
und sonstiges
491,7
97,8
15,7 256,2 91,6 22,2
8 ,2
460,7
95,1 16,1
226,1 87,2 28,0
8 , 3
6 ,3*
2,8$
+ 2,6* 11 ,7* 4 ,8* +26,1* + 1,2*
484,2
97,6
14,3 250,6
91,6 22,2
8 ,0
453,7
95,0 14,6
220,8 87,2 28,0
8 , 1
6 ,3*
2 ,7* + 2 , 1 * 11 ,9* 4 ,8* +26,1* + 1,2*
138,4
26,8
13,3 65,8
24,5 6 , 5
1,4
127,8
27,5 13,5 55,8 22,4
6 ,9
1,7
7 ,6*
+ 2 ,6*
+ 1,5* 15 ,2* 8,6* + 6,2*
+21,4*
95,7
15,4 0 , 4
57,7 11,1
7 ,6
3 , 5
92,8
14,9 0 , 5
49,4 11,4 13,6
3 ,0
3 ,3* +25,0* 14 ,4* + 2 ,7* +78,9* 1 4 , 3 *
. 'ctto¿infuhren (2)
Lirunterçx Steinkohle
22 Rohöl
23 Naturgas
24 Hineralölprodukte
272,1
23,7 220,7 20,3
7 , 8
226,4
22,6
176,6 20,9
5,6
1 6 , 8 *
4 ,6* 20 ,0* + 3,0* 28 ,2*
265,0
23,6 212,8
20,3 8,9
220,6
22,5 168,5 20,9
7 ,9
16 ,7*
4 ,7* 20 ,8* + 3,0* 11 ,2*
79,3
1,4 51,0 16,0 16,4
67,5
1,1 42,0
15,5 12,0
14 ,9*
21 ,4* 17 ,6*
3 , 1 * 26 ,8*
77,4
9 , 3
58,3 8 , 3
0 , 4
64,8
8 , 8
47,7 8 ,8
0,8
16,3*
• 5,4* 18,2* 6,0*
:Jrzeujung von Primär energi ει rädern
iivon: 31 32
33
34
35 36
Steinkohle Braunkohle (und Torf) liohöl ¡Jaturga3
Kernenergie Pr imärelektr i zi t ä t und sonst iges
239,0
3)78,5 15,2 44,6 71,0 22,2
7 , 5
245,2
3)77,8
15,5 49,4 67,3 28,0
7 ,2
+ 2,6*
+ 0 ,9* + 2 ,0* +10,8* 5,2* +26,1*
4;o*
237,4
(3)78,5 13,8 44,6 71,0 22,2
7 , 3
243,6
( % , 8 14,0 49,4 67,3 28,0
7 , 1
+ 2,6$
0 ,9* + 1,5* +10,8* 5,2* +26,1*
2 ,7*
62,8
31,6 12,9
2 , 3
8 ,3
6 ,5 1,3
61,7
31,3 13,0
2 , 2
7 , 0
6 , 9 1,3
1,7*
0 ,9* + 0 ,8* 4 , 3 * 15 ,7* + 6,2*
22,2
6 ,4
0 , 4
1,1 3 , 3
7 , 6
3 , 4
28,2
6 , 5
0 , 4 1,2
3 , 1
13,6
3 , 3
2 7 , 0 *
1,6*
9 , 1 * 6 , 1 *
78,9* 2 ,9*
ÜcltoKinfuhren {¿)
i.iloiïdoverbrauch + Bunker
Insgesamt
darunter! Rohöl
53,9*
45 ,3*
47 ,8 *
38 ,5 *
53,3*
44,6*
47,3*
37,9*
56,7*
48 ,2*
52,2*
41,8*
79,2*
60,0*
68, t
49, ί
) . :ui . ichliessl ich Austauschsaldo des Ausaenhandels und Bestandsveränderung abge l e i t e t e r Produkte
) LanfuhrAusfuhr.
■) . e inschl iess l ich Wiedergewinnung
26
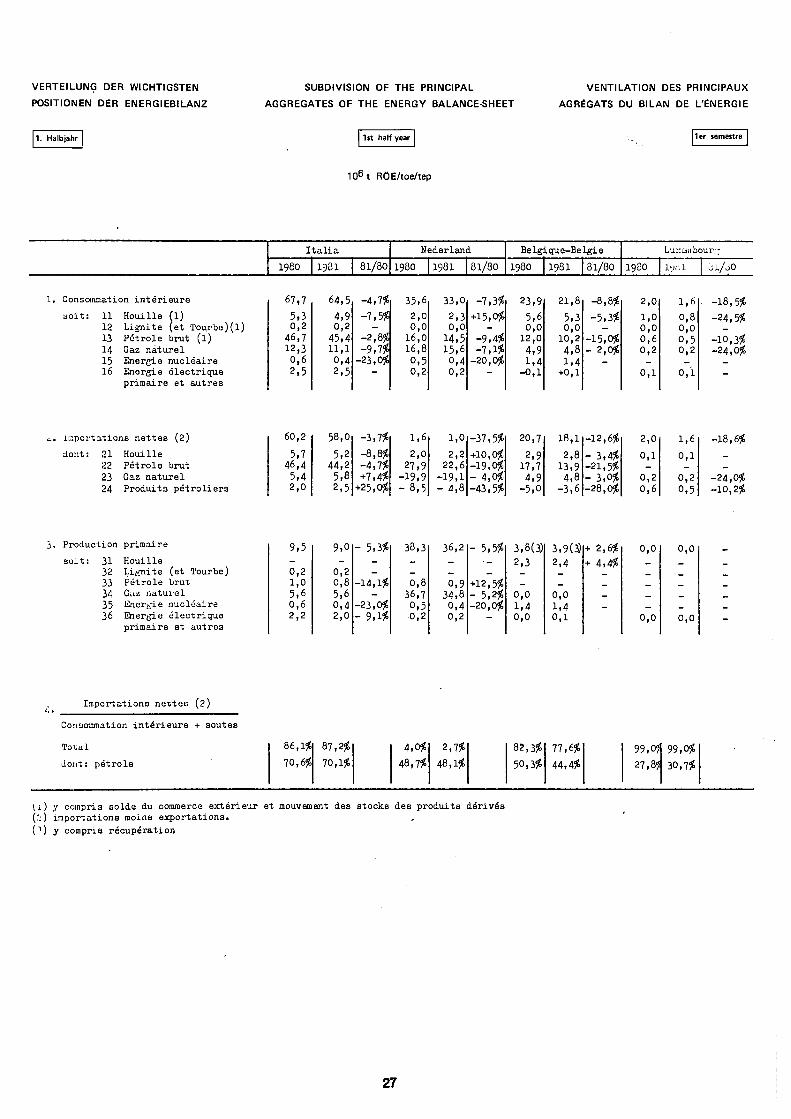
VERTEILUNG DER WICHTIGSTEN
POSITIONEN DER ENERGIEBILANZ
SUBDIVISION OF THE PRINCIPAL
AGGREGATES OF THE ENERGY BALANCE-SHEET
VENTILATION DES PRINCIPAUX
AGRÉGATS DU BILAN DE L'ÉNERGIE
1. Halbjahr 1st half year 1er semestre
106t ROE/toe/tep
I t a l i a
1980 1931 81/80
Nederland
I98O I98I 81/80
Belgique-Belgie
I98O I98I 81/80
Lu::üiubour:;
I98O lyol òl/ jO
Consommation intérieure
(et Tourbe)(1) 11 Houille 12 Lignite 13 Pétrole brut (l) 14 Qaz naturel 15 Energie nucléaire 16 Energie électrique
primaire et autres
67,7
5 , 3
0 , 2
46,7 12,3
0 , 6
2 , 5
64,5
4 , 9 0 , 2
45,4 11,1
0 , 4
2 , 5
- 4 , 7 *
- 7 , 5 * -
- 2 , 8 *
- 9 , 7 * -23 ,0*
35,6
2 , 0 0 , 0
16,0 16,8
0 , 5 0 , 2
33,0
2 , 3 0 , 0
14,5 15,6
0 , 4 0 , 2
- 7 , 3 *
+15,0*
-- 9 , 4 * - 7 , 1 *
-20 ,0* —
23,9
5 ,6 0 , 0
12,0
4,9 1 , 4
-0 ,1
21,8
5 ,3 0 , 0
10,2 4 , 8
1 , 4 +0,1
- 8 , 8 *
- 5 , 3 *
-15 ,0* - 2 ,0*
2 , 0
1 ,0
0 , 0
0 , 6
0 , 2
0 , 1
1 ,6
0 , 8
0 , 0
.0 ,5 0 , 2
0 , 1
-18,5$
-24,5*
-10,3*
-24,0*
^. importations nettes (2)
dont: 21 Houille
22 Pétrole brut
23 Gaz naturel
24 Produits pétroliers
60,2
5,7 46,4
5,4 2,0
58,0
5,2 44,2
5,8
2,5
- 3 , 7 *
- 8 , 8 *
- 4 , 7 * +7,4*
+25,0*
1 ,6
2,0
27,9 -19,9 - 8 , 5
1,0
2,2 22,6
-19,1 - 4,8
-37 ,5*
+10,0* -19 ,0* - 4 ,0* -43 ,5*
20,7
2,9 17,7
4,9 -5 ,0
18,1
2,8 13,9
4,8 -3 ,6
-12 ,6*
- 3 ,4* -21 ,5* - 3 ,0* -28 ,0*
2 , 0
0,1
0,2 0,6
1,6
0,1
0,2
0,5
-18, (
-24,0*
-10,2*
Production
s o i t : 31 32 33
3·;
35 36
primaire
Houille Ligni te (et Tourbe) Pé t ro le brut Gaz na tu re l Energie nuc léa i re Energie é lec t r ique primaire et au t res
9 , 5
-0 , 2 1,0
5 ,6
0 , 6
2 , 2
9 , 0
-0 , 2 0 , 8
5 ,6
0 , 4 2 , 0
- 5 ,3*
-
-- 1 4 , 1 *
--23 ,0* - 9 , 1 *
38,3
-
-0 , 8
36,7 0 , 5 0 , 2
36,2
-
_ 0 , 9
34,8 0 , 4 0 , 2
- 5 ,5* ■ _
_ +12,5* - 5,2* -20 ,0*
—
3,8(3)
2 , 3
_ _
0 , 0
1,4 0 , 0
3,9(3)
2 , 4
_ 0 , 0
1,4 0 , 1
+ 2 ,6*
+ 4 ,4* _ _ _ _
0 f 0
_
_ _ _ _
ofo
0 , 0
_
_ _ _ 0 , 0
Importations nettes (2)
Consommation intérieure + soutes
Total
dont: pétrole
86,1*
70,6*
87,2*
70,1*
4,0*
48,7*
2,7*
48,1*
82 ,3*
50,3*
77,6*
44,4*
99,0?j
27,8?
99,0*
30,7*
(1) y compris solde du commerce extérieur et mouvement des stocks des produits dérivés
('.:) importations moine exportations.
(■") y compris récupération
27
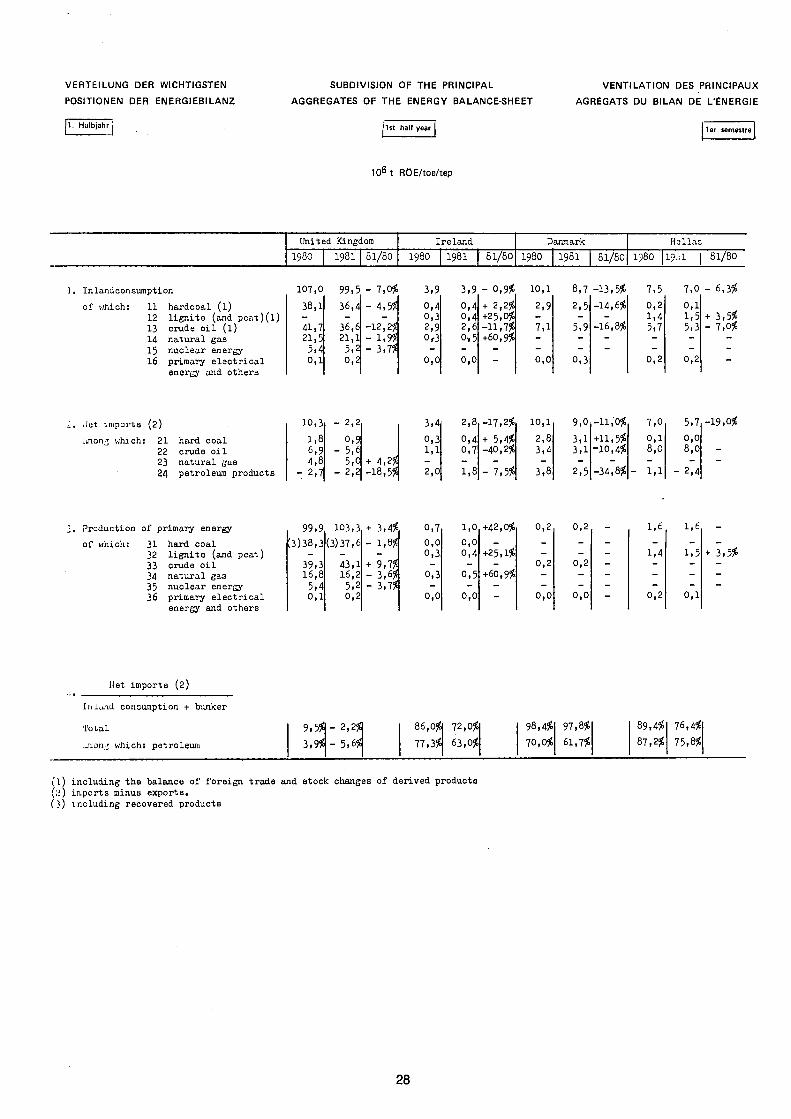
VERTEILUNG DER WICHTIGSTEN
POSITIONEN DER ENERGIEBILANZ SUBDIVISION OF THE PRINCIPAL
AGGREGATES OF THE ENERGY BALANCE-SHEET VENTILATION DES PRINCIPAUX
AGRÉGATS DU BILAN DE L'ÉNERGIE
1. Halbjahr 1st half year 1er semestre
IO6 t RÖE/toe/tep
Uni ted Kingdom
I98O I 9 8 I 81/80 I r e l a n d
I98O I 9 8 I 81 /80 Danmark
I98O I 9 8 I 81/80
Hol l a s
I98O 1931 I 81 /80
1. In landconsumpt ion
of which: 11 h a r d c o a l ( l ) 12 lignite (and poat)(l) 13 crude oil (l) 14 natural gas 15 nuclear energy 16 primary electrical
energy and others
107 ,0
38 ,1 -41 ,7 21 ,5
5,4 0 , 1
9 9 , 5
3 6 , 4 -
36,6 21 ,1
5 ,2 0 , 2
- 7 , 0 *
- 4 ,5$ -
- 1 2 , 2 $ - 1,9* - 3 ,7$
3 ,9
0 ,4 0 , 3 2 ,9 0 r 3
0 , 0
3 ,9
0 ,4 0 ,4 2 , 6 0 , 5 -0 ,0
- 0 , 9 *
+ 2 , 2 * +25 ,0* - 1 1 , 7 * + 6 0 , 9 *
--
1 0 , 1
2 ,9
7 , 1
-0 , 0
8,7
2 , 5 -
5,9 --
0 , 3
- 1 3 , 5 *
- 1 4 , 6 * -
- 1 6 , 8 * --
7,5
0 , 2 1,4 5,7 --
0 ,2
7 ,0
0 , 1 1,5 5,3 --
0 ,2
6,3*
3,5* 7,0*
let i m p o r t s (2)
imonj which: 21 22 23 24
ha rd c o a l c rude o i l n a t u r a l gae pe t ro leum p r o d u c t s
10 ,3
1,8 6,9 4 , 8
- 2 ,7
- 2 ,2
0 ,9 - 5,6
5,C - 2 ,2
+ 4 ,2$ - 1 8 , 5 $
3,4
0 , 3 1,1
2 ,0
2 , 8
0 ,4 0 ,7 -1,8
- 1 7 , 2 $
+ 5 ,4$ - 4 0 , 2 $
-- 7,5*!
1 0 , 1
2 , 8 3 ,4 -
3 ,8
9 ,0
3 , 1 3 ,1 -
2 ,5
- 1 1 , 0 $
+11 ,5$ - 1 0 , 4 $
-- 3 4 , 8 *
7 ,0
0 , 1 8 ,0 -
- 1,1
5,7 0 ,0 8,0 -
- 2 ,4
-19 ,0$
Production of primary energy of which: 31 hard coal
32 lignite (and peat) 33 crude oil 34 natural gas 35 nuclear energy 36 primary electrical
energy and others
99 ,9
[ 3 ) 3 8 , 3
39 ,3 1 6 , 8
5 ,4 0 , 1
103 ,3 (3)37 ,6
43 ,1 16,2
5,2 0 ,2
+ 3 , 4 *
- 1,8$ -
+ 9 ,7$ - 3 ,6$ - 3 ,7$
0 ,7 0 ,0 0 , 3
0 ,3
0 ,0
1,0
0 ,0 0 , 4 -
0 , 5 -
0 ,0
+ 4 2 , 0 *
-+25,1$
-+60 ,9$
-—
0 , 2
--
0 ,2 --
0 ,0
0 ,2
--
0 ,2 --
0 , 0
------—
1,6
-1,4 ---
0 ,2
1,6
-1,5 ---
0 , 1
+ 3,5$
Net imports (2)
I n l a n d consumption + bunker
T o t a l
among which: pe t ro leum
9 , 5 $
3 , 9 $
- 2,2$|
- 5,6$
8 6 , 0 *
7 7 , 3 *
7 2 , 0 *
6 3 , 0 *
9 8 , 4 * 7 0 , 0 $
9 7 , 8 $
6 1 , 7 $
8 9 , 4 *
8 7 , 2 *
7 6 , 4 *
7 5 , 8 $
>'l) including the balance of foreign trade and stock changes of derived products !','.) imports minus exports. (3) including recovered products
28
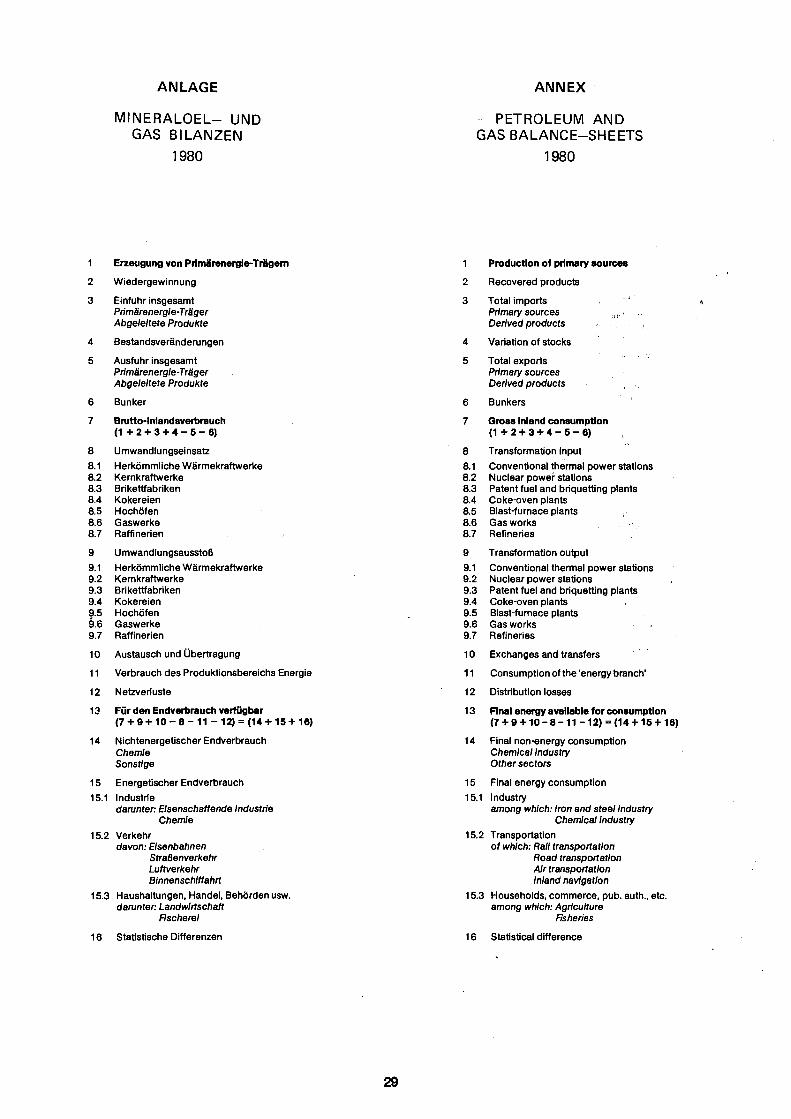
ANLAGE ANNEX
MINERALOEL- UND GAS BILANZEN
1980
PETROLEUM AND GAS BALANCE-SHEETS
1980
1 Erzeugung von Prlmärenergle-Trägem
2 Wiedergewinnung
3 Einfuhr insgesamt Primärenergie-Träger Abgeleitete Produkte
4 Bestandsveränderungen
5 Ausfuhr insgesamt Primärenergle-Träger Abgeleitete Produkte
6 Bunker
7 Brutto-Inlandsverbrauch (1+2 + 3 + 4 - 5 - 6 )
8 Umwandlungseinsatz 8.1 Herkömmliche Wärmekraftwerke 8.2 Kernkraftwerke 8.3 Brikettfabriken 8.4 Kokereien 8.5 Hochöfen 8.6 Gaswerke 8.7 Raffinerien
9 UmwandlungsausstoB 9.1 Herkömmliche Wärmekraftwerke 9.2 Kernkraftwerke 9.3 Brikettfabriken 9.4 Kokereien 9.5 Hochöfen 9.6 Gaswerke 9.7 Raffinerien
10 Austausch und Übertragung
11 Verbrauch des Produktionsbereichs Energie
12 Netzverluste
13 Für den Endverbrauch verfügbar (7 + 9 + 1 0 - 8 - 1 1 -12) = (14 +15 +16)
14 Nichtenergetischer Endverbrauch Chemie Sonstige
15 Energetischer Endverbrauch 15.1 Industrie
darunter: Elsenschaffende Industrie Chemie
15.2 Verkehr davon: Elsenbahnen
Straßenverkehr Luftverkehr Binnenschiffahrt
15.3 Haushaltungen, Handel, Behörden usw. darunter: Landwirtschaft
Fischerei
16 Statistische Differenzen
1 Production of primary sources
2 Recovered products
3 Total imports Primary sources Derived products
4 Variation of stocks
5 Total exports Primary sources Derived products
6 Bunkers
7 Gross inland consumption (1+2 + 3 + 4 - 5 - 6 )
8 Transformation input 8.1 Conventional thermal power stations 8.2 Nuclear power stations 8.3 Patent fuel and briquetting plants 8.4 Coke-oven plants 8.5 Blast-furnace plants 8.6 Gas works 8.7 Refineries
9 Transformation output 9.1 Conventional thermal power stations 9.2 Nuclear power stations 9.3 Patent fuel and briquetting plants 9.4 Coke-oven plants 9.5 Blast-furnace plants 9.6 Gas works 9.7 Refineries
10 Exchanges and transfers
11 Consumption of the'energy branch'
12 Distribution losses
13 Final energy available for consumption (7+ 9 + 1 0 - 8 - 1 1 - 1 2 ) = (14 + 15 + 16)
14 Final non-energy consumption Chemical industry Other sectors
15 Final energy consumption 15.1 Industry
among which: Iron and steel industry Chemical industry
15.2 Transportation of which: Rail transportation
Road transportation Air transportation Inland navigation
15.3 Households, commerce, pub. auth., etc. among which: Agriculture
Fisheries
16 Statistical difference
29
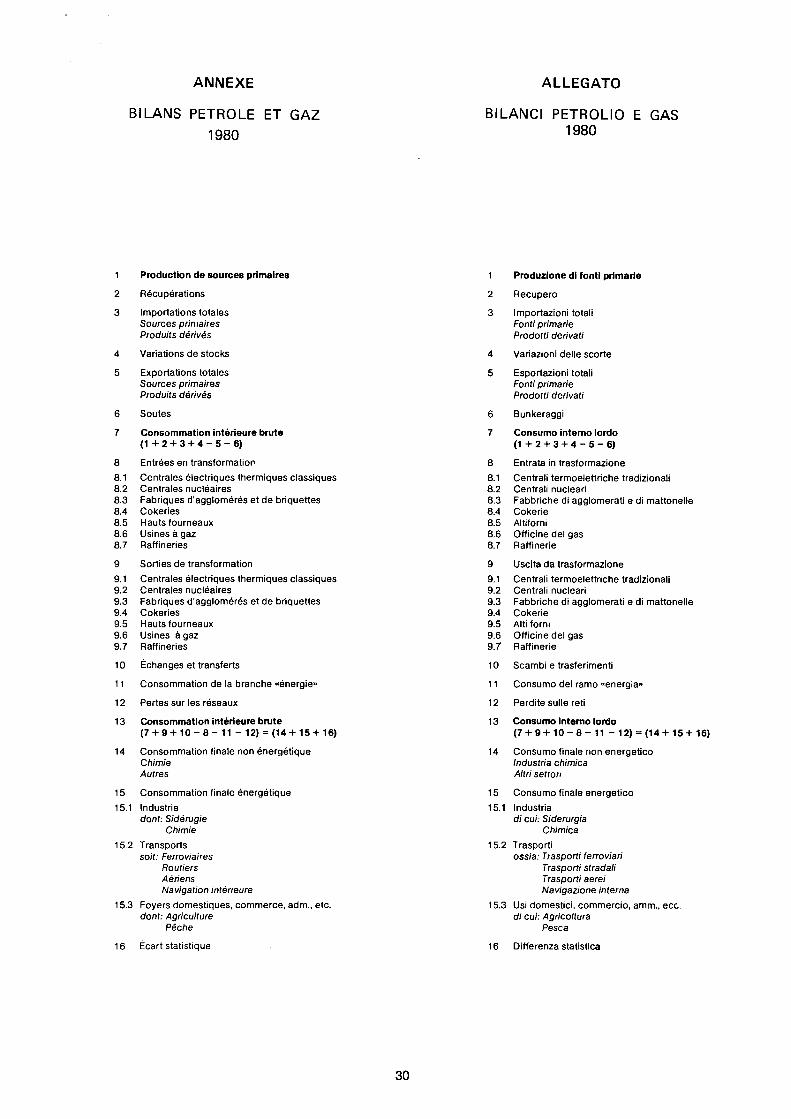
ANNEXE ALLEGATO
BILANS PETROLE ET GAZ 1980
BILANCI PETROLIO E GAS 1980
1 Production de sources primaires
2 Récupérations
3 Importations totales Sources primaires Produits dérivés
4 Variations de stocks
5 Exportations totales Sources primaires Produits dérivés
6 Soutes
7 Consommation intérieure brute ( 1 + 2 + 3 + 4 - 5 - 6 )
8 Entrées en transformation 8.1 Centrales électriques thermiques classiques 8.2 Centrales nucléaires 8.3 Fabriques d'agglomérés et de briquettes 8.4 Cokeries 8.5 Hauts fourneaux 8.6 Usines à gaz 8.7 Raffineries
9 Sorties de transformation 9.1 Centrales électriques thermiques classiques 9.2 Centrales nucléaires 9.3 Fabriques d'agglomérés et de briquettes 9.4 Cokeries 9.5 Hauts fourneaux 9.6 Usines à gaz 9.7 Raffineries
10 Échanges et transferts
11 Consommation de la branche «énergie»
12 Pertes sur les réseaux
13 Consommation intérieure brute (7 + 9 + 1 0 - 8 - 11 - 12) = (14 + 1 5 + 16)
14 Consommation finale non énergétique Chimie Autres
15 Consommation finale énergétique 15.1 Industrie
dont: Sidérugie Chimie
15.2 Transports soit: Ferroviaires
Routiers Aériens Navigation intérieure
15.3 Foyers domestiques, commerce, adm., etc. doni: Agriculture
Pêche
16 Écart statistique
1 Produzione di fonti primarie
2 Recupero
3 Importazioni totali Fonti primarie Prodotti derivati
4 Variazioni delle scorte
5 Esportazioni totali Fonti primarie Prodotti derivati
6 Bunkeraggi
7 Consumo interno lordo ( 1 + 2 + 3 + 4 - 5 - 6 )
8 Entrata in trasformazione 8.1 Centrali termoelettriche tradizionali 8.2 Centrali nucleari 8.3 Fabbriche di agglomerati e di mattonelle 8.4 Cokerie 8.5 Altiforni 8.6 Officine del gas 8.7 Raffinerie
9 Uscita da trasformazione 9.1 Centrali termoelettriche tradizionali 9.2 Centrali nucleari 9.3 Fabbriche di agglomerati e di mattonelle 9.4 Cokerie 9.5 Alti forni 9.6 Officine del gas 9.7 Raffinerie
10 Scambi e trasferimenti
11 Consumo del ramo «energia»
12 Perdite sulle reti
13 Consumo interno lordo (7 + 9 + 1 0 - 8 - 1 1 - 1 2 ) = ( 1 4 + 1 5 + 16)
14 Consumo finale non energetico Industria chimica Altri settori
15 Consumo finale energetico 15.1 Industria
di cui: Siderurgia Chimica
15.2 Trasporti ossia. Trasporti lerroviari
Trasporti stradali Trasporti aerei Navigazione interna
15.3 Usi domestici, commercio, amm., ecc. d; cui: Agricoltura
Pesca
16 Differenza statistica
30
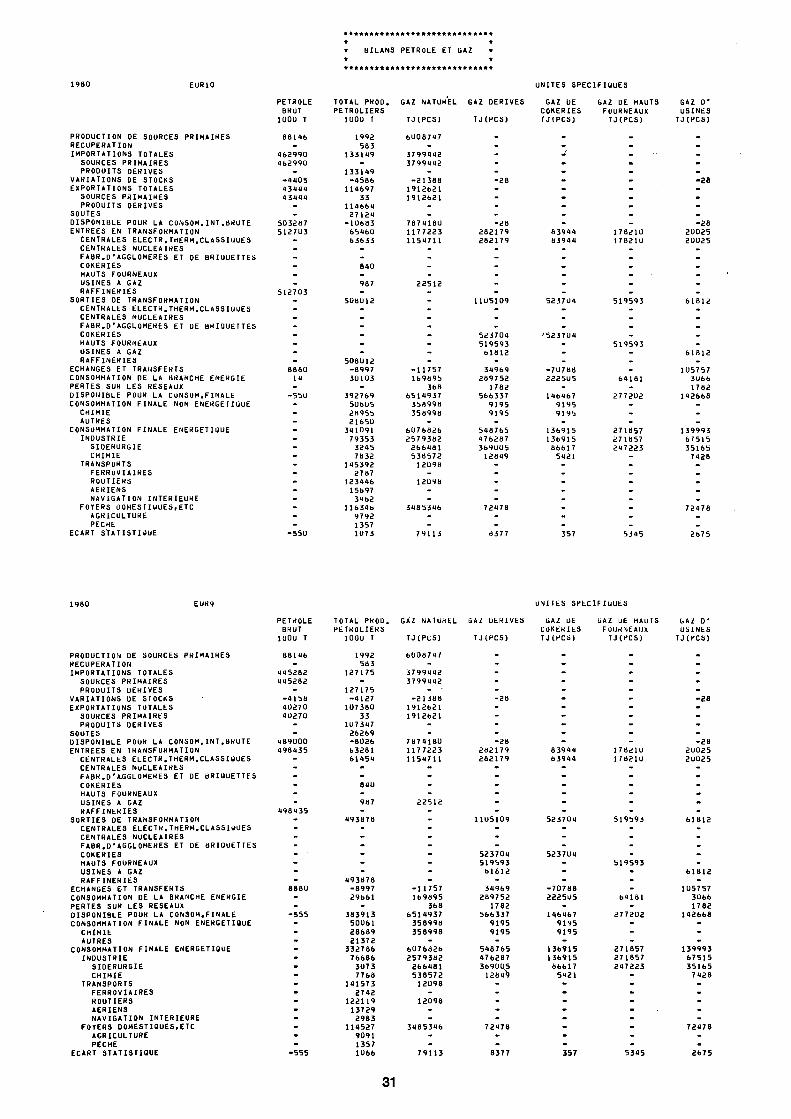
***************************** * * * BILANS PETROLE ET GAZ · * * ***************************** 1980
PRODUCTION DE SOURCES PRI RECUPERATION IMPORTATIONS TOTALES SOURCES PRIMAIRES PRODUITS DERIVES
VARIATIONS DE STOCKS EXPORTATIONS TOTALES SOURCES PRIMAIRES PRODUITS DERIVES
SOUTES DISPONIBLE POUR LA CONSOM ENTREES EN TRANSFORMATION CENTRALES ELECTR.THERM. CENTRALES NUCLEAIRES FABR.D'AGGLOMERES ET DE COKERIES HAUTS FOURNEAUX USINES A GAZ RAFFINERIES
SORTIES DE TRANSFORMATION CENTRALES ELECTR.THERM. CENTRALES NUCLEAIRES FABR.D'AGGLOMERES ET DE COKERIES HAUTS FOURNEAUX USINES A GAZ RAFFINERIES
ECHANGES ET TRANSFERTS CONSOMMATION DE LA BRANCH PERTES SUR LES RESEAUX DISPONIBLE POUR LA CONSOM CONSOMMATION FINALE NON E CHIMIE AUTRES
CONSOMMATION FINALE ENERG INDUSTRIE SIDERURGIE CHIMIE
TRANSPORTS FERROVIAIRES ROUTIERS AERIENS NAVIGATION INTERIEURE
FOTERS ÜOMESTIUUES,ETC AGRICULTURE PECHE
ECART STATISTIUUE
UNITES SPECIFIUUES
MAIRES
1. INT.BRUTE 1 CLASSIQUES
BRIUUETTES
CLASSIUUES
BRIQUETTES
PETROLE BRUT 100U T
8814b • 462990
46299U --4405
43444 43444 --503287
5127U3 ------512703 ----
TOTAL PROD. PETROLIERS
1000 T
1992 583
133149 -133149
-4586 114697
33 114664 27124
-10683 65460 63633 --840 -HUI
-508U12 ---
GAZ NATUREL
TJCPCS)
6U08747 -3799442
3799442 --21368
1912621 1912621
--7874180 1177223 1154711
----22512 -----
GAZ DERIVES
TJCPCS)
. -----28 -----28
282179 282179 ------11US109 ---
GAZ UE COKERIES TJ(PCS)
-----------83944
83944 ------5237U4 ---
GAZ DE HAUTS FOURNEAUX TJCPCS)
. ----------17821U
17B21U — -----519593 ---
GAZ D' USINES
TJCPCS)
• -----28 -----28
2U025 20025 ------61812 ---
iE ENEHGIE
l.FINALE NÊKGEF IliUE
ETIllUE
----8880 ία --55U ----------------550
---50BU12 -B997 3Ü103 -392769
50605 28955 21650
341091 79353 3245 7832
145392 2767
123446 15697 3462
116346 9792 1357 1U73
-----11757 169Ö95
368 6514937 358998 358998 -6Ü76826
2579382 266481 538572 12098 -12Ü98 --3485346 --79113
523704 519593 61812 -34969
289752 1782
566337 9195 9195 -548765
476287 369U05 12849 -----72478 --8377
'5237U4 ----7Ü7B8
2225U5 -146467
9195 9195 -136915
136915 86617 5421 --------357
-519593 ---64181 -277202 ---271857
271857 247223 ---------5345
--61812 -1Ü5757 3U66 1782
142668 ---139993
67515 35165 7428 -----72478 --2675
UNITES SPECIFIQUES
PRODUCTION DE SOURCES PRIMAIRES RECUPERATION IMPORTATIONS TOTALES SOURCES PRIMAIRES PRODUITS DERIVES
VARIATIONS DE STOCKS EXPORTATIONS TOTALES SOURCES PRIMAIRES PRODUITS DERIVES
SOUTES DISPONIBLE POUR LA CONSOM.INT.BRUTE ENTREES EN TRANSFORMATION CENTRALES ELECTR.T HERM.CLASSIUUES CENTRALES NUCLEAIRES FABR.D'AGGLOMERES ET DE BRIQUETTES COKERIES HAUTS FOURNEAUX USINES A GAZ RAFFINERIES
SORTIES OE TRANSFORMATION CENTRALES ELECTR.THERM.CLASSIUUES CENTRALES NUCLEAIRES FABR.D'AGGLOMERES ET DE BRIQUETTES COKERIES HAUTS FOURNEAUX USINES A GAZ RAFFINERIES
ECHANGES ET TRANSFERTS CONSOMMATION DE LA BRANCHE ENERGIE PERTES SUR LES RESEAUX DISPONIBLE POUR LA CONSOM.FINALE CONSOMMATION FINALE NON ENERGETIQUE CHIMIE AUTRES
CONSOMMATION FINALE ENERGETIQUE INDUSTRIE SIDERURGIE CHIMIE
TRANSPORTS FERROVIAIRES ROUTIERS AERIENS NAVIGATION INTERIEURE
FOYERS DOMESTIQUES,ETC AGRICULTURE PECHE
ECART STATISTIQUE
PETROLE BRUT 1U00 T
88146 -445282
445282 --4158
4U270 40270 --489000
498435 ------498435 -
TOTAL PHOD. PETROLIERS
100U T
1992 583
127175 -127175
-4127 107380
33 107347 ¿6269 -8026 63281 61454 --8UÜ -9«7 -493878
GAZ NATUKEL
TJCPCS)
6008747 -3799442
3799442 --213BB
1912621 1912621
--7874180 1177223 1154711
----22512 --
GAZ ULRIVES
TJCPCS)
------2a -----28
2Ò2179 282179 ------11U5109
GAZ DE COKERIES TJCPCS)
-----------83944
83944 ------523704
GAZ UE HAUTS FOURNEAUX TJCPCS)
. ----------17821U
17821U ---« --519593
GAZ D' USINES TJCPCS)
------¿a -----28
2U025 2U025 ------61812
-555
---493878 -8997 29661 -383913
50061 28689 21372
332786 76686 3U73 7768
141573 2742
122119 13729 2983
114527 9091 1357 1066
-----11757 169895
368 6514937 358998 358998 -6076826
2579382 266481 538572 12098 -12098 --3485346 --79113
523704 519593 61812 -34969
289752 1782
566337 9195 9195 -548765
476287 369005 12849 -----72478 --8377
5237U4 ----70788
2225U5 -146467
9195 9195 -136915
136915 66617 5421 --------357
-519593 ---64161 -277202 ---271857
271857 247223 ---------5345
--61812 -105757 3066 1782
142668 ---139993
67515 35165 7428 -----72478 --2675
31
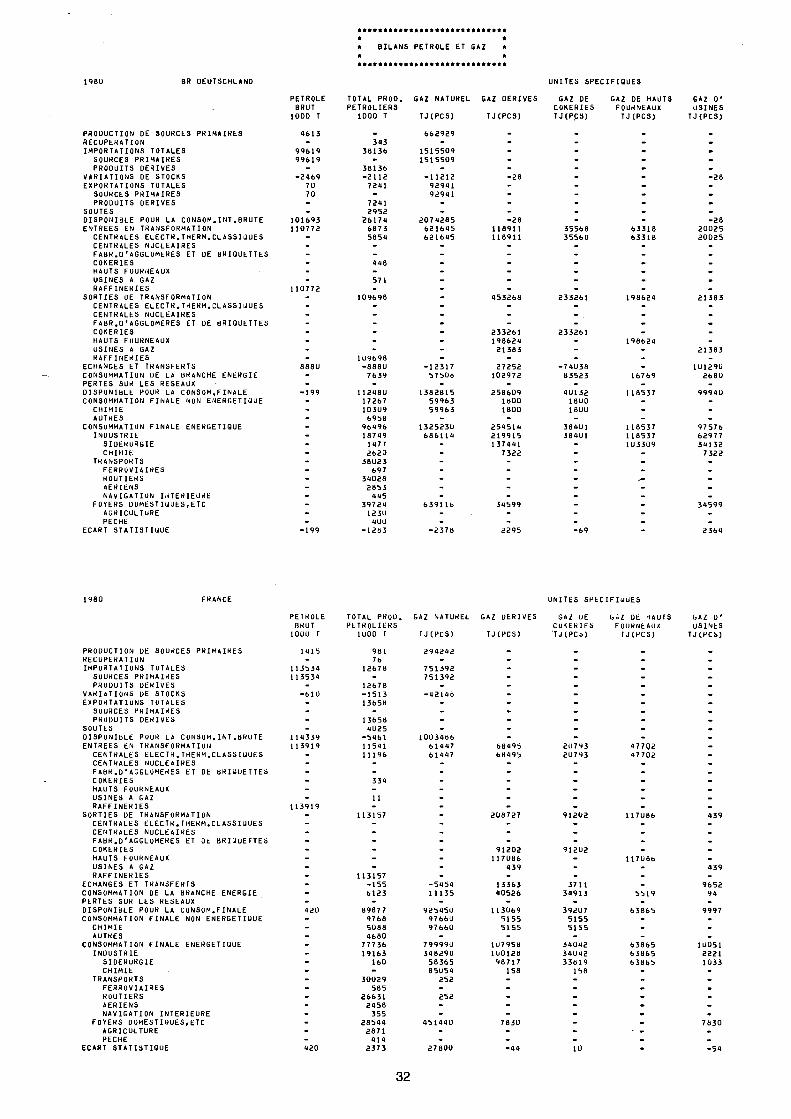
ft*·**·*·*****·*****«*********
* * * BILANS PETROLE ET GAZ *
* * *****************************
1980 BR DEUTSCHLAND UNITES SPECIFIQUES
PRODUCTION DE SOURCES PRIMAIRES
RECUPERATION
IMPORTATIONS TOTALES
SOURCES PRIMAIRES
PRODUITS DERIVES
VARIATIONS DE STOCKS
EXPORTATIONS TOTALES
SOURCES PRIMAIRES
PRODUITS DERIVES
SOUTES
DISPONIBLE POUR LA CONSOM.INT.BRUTE
ENTREES EN TRANSFORMATION
CENTRALES ELECTR.THERM.CLASSIQUES
CENTRALES NUCLEAIRES
FABR.D'AGGLOMERES ET DE BRIQUETTES
COKERIES
HAUTS FOURNEAUX
USINES A GAZ
RAFFINERIES
SORTIES DE TRANSFORMATION
CENTRALES ELECTR.T HERM.CLASSI QUE S
CENTRALES NUCLEAIRES
FABR.D'AGGLOMERES ET DE BRIQUETTES
COKERIES
HAUTS FOURNEAUX
USINES A GAZ
RAFFINERIES
ECHANGES ET TRANSFERTS
CONSOMMATION DE LA BRANCHE ENERGIE
PERTES SUR LES RESEAUX
DISPONIBLE POUR LA CONSOM.FINALE
CONSOMMATION FINALE NON ENERGETIQUE
CHIMIE
AUTRES
CONSUMMATION FINALE ENERGETIOUE
INDUSTRIE
SIDERURGIE
CHIMIE
TRANSPORTS
FERROVIAIRES
ROUTIERS
AERIENS
NAVIGATION INTERIEURE
FOYERS DOMESTIQUES,ETC
AGRICULTURE
PECHE
ECART STATISTIQUE
PETROLE
BRUT
1000 T
4613
99619
99619
2469
7Ü
70
101693
110772
„
:
-110772
TOTAL PROD.
PETROLIERS
1000 T
. 343
38136
38136
2112
7241
7241
2952 26174
6873
5854
448
571
109698
GAZ NATUI
TJCPCS)
662929
1515509
1515509
11212
92941
92941
2D74285
621645
621645
TJCPCS)
GAZ DE
COKERIES
TJCPCS)
GAZ DE HAUTS
FOURNEAUX
TJCPCS)
28
118911
118911
35568
35S6S
233261
63318
63318
GAZ D' USINES
TJCPCS)
28
20025
20025
BB80
199
199
109698
8880
7639
112480
17267
10309
6958
96496
18749
1477
2620
38023
697
34028
2853
445
39724
1230
400
1263
12317
57508
1382815
59963
59963
1325230
686114
639116
2378
233261
198624
21383
27252
102972
— 258609
1600
1600
254514
219915
137441
7322
34599
2295
233261
74038
83523
40132 1800
1800
38401
384U1
69
198624
16769
118537
118537
118537
103309
21383
10129Ü
2680
99940
97576
62977
34132
7322
—
34599
2364
1980
PRODUCTION DE SOURCES PRIMAIRES
RECUPERATION
IMPORTATIONS TOTALES
SOURCES PRIMAIRES
PRODUITS DERIVES
VARIATIONS DE STOCKS
EXPORTATIONS TOTALES
SOURCES PRIMAIRES
PRODUITS DERIVES
SOUTES
DISPONIBLE POUR LA CONSOM.INT.BRUTE
ENTREES EN TRANSFORMATION
CENTRALES ELECTR.T HERM.CLASSIUUES
CENTRALES NUCLEAIRES
FABR.D'AGGLOMERES ET DE BRIUUETTES
COKERIES
HAUTS FOURNEAUX
USINES A GAZ
RAFFINERIES
SORTIES DE TRANSFORMATION
CENTRALES ELECTR.THERM.CLASSIDUES
CENTRALES NUCLEAIRES
FABR.D'AGGLOMERES ET Dt BRIUUETTES
COKERIES
HAUTS FOURNEAUX
USINES A GAZ
RAFFINERIES
ECHANGES ET TRANSFERTS
CONSOMMATION DE LA BRANCHE ENERGIE
PERTES SUR LES RESEAUX
DISPONIBLE POUR LA CONSOM.FINALE
CONSOMMATION FINALE NON ENERGETIQUE
CHIMIE
AUTRES
CONSOMMATION FINALE ENERGETIQUE
INDUSTRIE
SIDERURGIE
CHIMIE
TRANSPORTS
FERROVIAIRES
ROUTIERS
AERIENS
NAVIGATION INTERIEURE
FOYERS DOMESTIQUES,ETC
AGRICULTURE
PECHE
ECART STATISTIQUE
UNITES SPECIFIQUES
PETROLE
BRUT
1000 Γ
1415
113534
113534
114339
113919
TOTAL PKOO. GAZ NATUREL
PETROLIERS
1000 Τ TJCPCS)
901
76
12678
12678
1513
13658
13658
4U25
5461
11541
11196
334
11
113157
294242
751392
751392
1003486
61447
61447
GAZ DERIVES
TJCPCS)
68495
68495
GAZ UE
COKERIES
'TJCPCS)
GAZ DE HAUIS
FOURNEAUX
TJCPCS)
2U793
2U793
912U2
47702 47702
GAZ D*
USINES
TJCPCS)
113157
155
6123
89877
9768
5088
4680
77736
19163
16U
3UU29
585
26631
2458
355
28544
2871
414
2373
5454
11135
92545U
9766U
97660
799990
348298
58365
85054
252
252
451440
27800
91202
117U86
439
13363
40526
113069
5155
5155
1U7958
1U0128
98717
15»
7830
44
912U2
37 11
34913
392U7
5155
5155
34042
34042
33819
158
1U
117U86
5519
63865
63865
63865
63865
439
9652 94
9997
1U051
2221
1033
7830
54
32
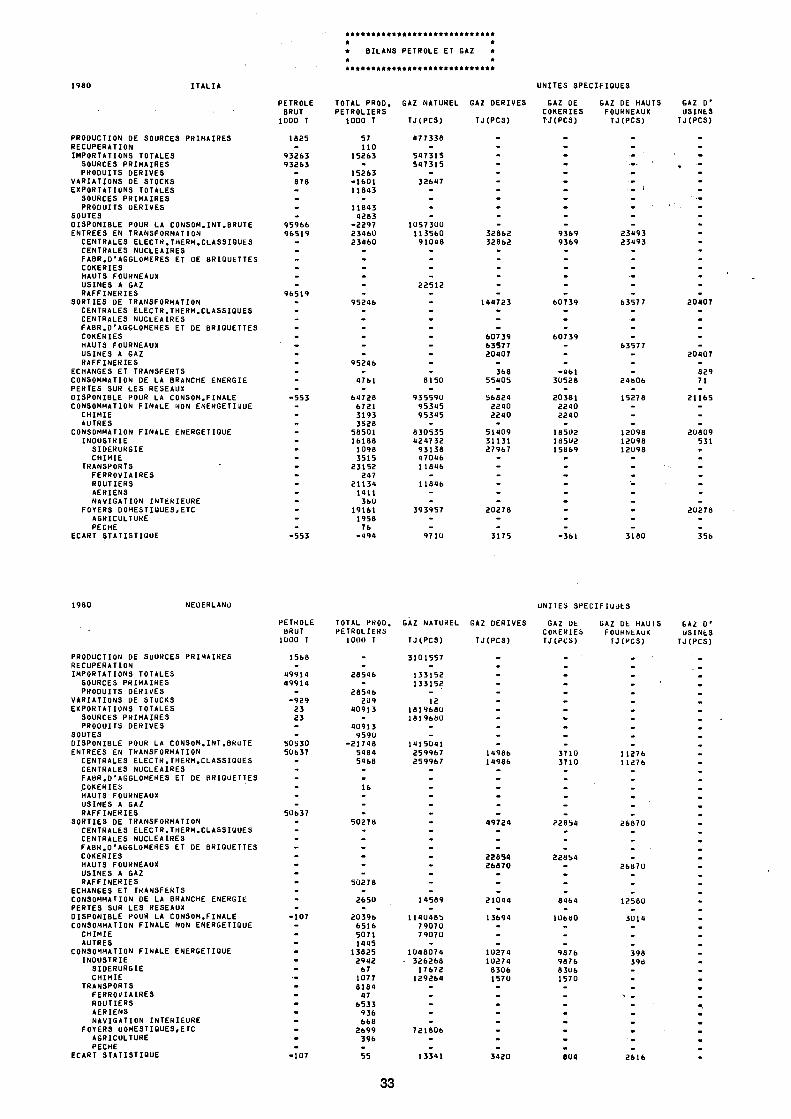
***************************** * * * BILANS PETROLE ET GAZ · * * *****************************
1980 ITALIA UNITES SPECIFIQUES
PRODUCTION DE SOURCES PRIMAIRES RECUPERATION IMPORTATIONS TOTALES
SOURCES PRIMAIRES PRODUITS DERIVES
VARIATIONS DE STOCKS EXPORTATIONS TOTALES
SOURCES PRIMAIRES PRODUITS DERIVES
SOUTES DISPONIBLE POUR LA CONSOM.INT.BRUTE ENTREES EN TRANSFORMATION
CENTRALES ELECTR.THERM.CLASSIQUES CENTRALES NUCLEAIRES FABR.D'AGGLOMERES ET DE BRIQUETTES COKERIES HAUTS FOURNEAUX USINES A GAZ RAFFINERIES
SORTIES DE TRANSFORMATION CENTRALES ELECTR.THERM.CLASSIQUES CENTRALES NUCLEAIRES FABR.D'AGGLOMERES ET DE BRIQUETTES COKERIES HAUTS FOURNEAUX USINES A GAZ RAFFINERIES
ECHANGES ET TRANSFERTS CONSOMMATION DE LA BRANCHE ENERGIE PERTES SUR LES RESEAUX DISPONIBLE POUR LA CONSOM.FINALE CONSOMMATION FINALE NON ENERGETIQUE
CHIMIE AUTRES
CONSOMMATION FINALE ENERGETIQUE INDUSTRIE
SIDERURGIE CHIMIE
TRANSPORTS FERROVIAIRES ROUTIERS AERIENS NAVIGATION INTERIEURE
FOYERS DOMESTIQUES,ETC AGRICULTURE PECHE
ECART STATISTIQUE
PETROLE
BRUT
1 0 0 0 T
1 8 2 5
-9 3 2 6 3
9 3 2 6 3
-8 7 8
----
9 5 9 6 6
9 6 5 1 9
-
TOTAL PROD.
PETROLIERS
1 0 0 0 T
57
H O
1 5 2 6 3
-1 5 2 6 3
- 1 6 0 1
1 1 8 4 3
-1 1 8 4 3
4 2 8 3
- 2 2 9 7
2 3 4 6 0
2 3 4 6 0
GAZ NATUREL
TJCPCS)
4 7 7 3 3 8
-5 4 7 3 1 5
5 4 7 3 1 5
-3 2 6 4 7
----
1 0 5 7 3 0 0
1 1 3 5 6 0
9 1 0 4 8
GAZ DERIVES
TJCPCS)
-----------
3 2 8 6 2
3 2 8 6 2
GAZ DE
COKERIES
TJCPCS)
. ----------
9 3 6 9
9 3 6 9
GAZ DE HAUTS
FOURNEAUX
TJCPCS)
. ----------
2 3 4 9 3
2 3 4 9 3
GAZ D'
U S I N E S
TJCPCS)
. --
. ™
---------
4761
64728 6721 3193 3528
58501 16188
1098 3515
23152 247
21134 1411
360 19161
1958 76
-494
8150
935590 95345 95345
8 3 0 5 3 5 4 2 4 7 3 2
93138 47046 11846
11846
60739 63577 20407
368 55405
56824 2240 2240
51409 31131 27967
-461 30528
20381 2240 2240
18502 185U2 15869
24806
15278
12098 12098 12098
20407
829
71
21165
20809
531
20278
356
UNITES SPECIFIQUES
PRODUCTION DE SOURCES PRIMAIRES RECUPERATION IMPORTATIONS TOTALES
SOURCES PRIMAIRES PRODUITS DERIVES
VARIATIONS DE STOCKS EXPORTATIONS TOTALES
SOURCES PRIMAIRES PRODUITS DERIVES
SOUTES DISPONIBLE POUR LA CONSOM.INT.BRUTE ENTREES EN TRANSFORMATION
CENTRALES ELECTR.THERM.CLASSIQUES CENTRALES NUCLEAIRES FABR.D'AGGLOMERES ET DE BRIQUETTES COKERIES HAUTS FOURNEAUX USINES A GAZ RAFFINERIES
SORTIES DE TRANSFORMATION CENTRALES ELECTR.THERM.CLASSIQUES CENTRALES NUCLEAIRES FABR.D'AGGLOMERES ET DE BRIQUETTES COKERIES HAUTS FOURNEAUX USINES A GAZ RAFFINERIES
ECHANGES ET TRANSFERTS CONSOMMATION DE LA BRANCHE ENERGIE PERTES SUR LES RESEAUX DISPONIBLE POUR LA CONSOM.FINALE CONSOMMATION FINALE NON ENERGETIQUE
CHIMIE AUTRES
CONSOMMATION FINALE ENERGETIQUE INDUSTRIE
SIDERURGIE CHIMIE
TRANSPORTS FERROVIAIRES ROUTIERS AERIENS NAVIGATION INTERIEURE
FOYERS DOMESTIQUES,ETC AGRICULTURE PECHE
ECART STATISTIQUE
PETROLE
BRUT
1 0 0 0 T
1 5 6 8
4 9 9 1 4
4 9 9 1 4
-- 9 2 9
23
¿S
--
5 0 5 3 0
5 0 6 3 7
-
TOTAL PKOD.
PETROLIERS
10UÜ T
-
2 8 5 4 6
-2 8 5 4 6
2 0 9
4 0 9 1 3
-4 0 9 1 3
9 5 9 0
- 2 1 7 4 8
5 4 8 4
5 4 6 8
GAZ NATUREL
TJCPCS)
3 1 0 1 5 5 7
1 3 3 1 5 2
1 3 3 1 5 2
-12
1 8 1 9 6 8 0
1 8 1 9 6 8 0
--
1 4 1 S 0 4 1
2 5 9 9 6 7
2 5 9 9 6 7
GAZ DERIVES
TJCPCS)
-
_ --------
1 4 9 8 6
1 4 9 8 6
GAZ DE
COKERIES
TJCPCS)
-
_ ----— ---
3 7 1 0
3 7 1 0
GAZ DE HAUTS
FOURNEAUX
TJCPCS)
-
.
.
.
. • _ . _
1 1 2 7 6
1 1 2 7 6
GAZ D'
US INES
T J ( P C S )
-
—
_ _ „
_ _ _ _ _ _ .
1 0 7
49724 22854
--5 0 2 7 8
-2 6 5 0
2 0 3 9 6
6 5 1 6
5 0 7 1
1 4 4 5
1 3 8 2 5
2 9 4 2
67
1077
8 1 8 4
47
6 5 3 3
9 3 6
6 6 8
2 6 9 9
3 9 6
-55
--— --1 4 5 8 9
1 1 4 U 4 8 5
7 9 0 7 0
7 9 0 7 0
-1 0 4 8 0 7 4
■ 3 2 6 2 6 8
1 7 6 7 2
1 2 9 2 6 4
-----
7 2 1 8 0 6
--1 3 3 4 1
2 2 8 5 4
2 6 8 7 0
—
2 1 0 4 4
1 3 6 9 4
---
1 0 2 7 4
1 0 2 7 4
8 3 0 6
1 5 7 0
-----. --
3 4 2 0
2 2 8 5 4
----
8 4 6 4
1 0 6 8 0
---
9 8 7 6
9 8 7 6
8 3 0 6
1 5 7 0
-. ------8U4
-2 6 8 7 0
_ -.
1 2 5 8 0
3 0 1 4
. m
m
3 9 6
3 9 8
. -.
N .
. . .
2 6 1 6
33
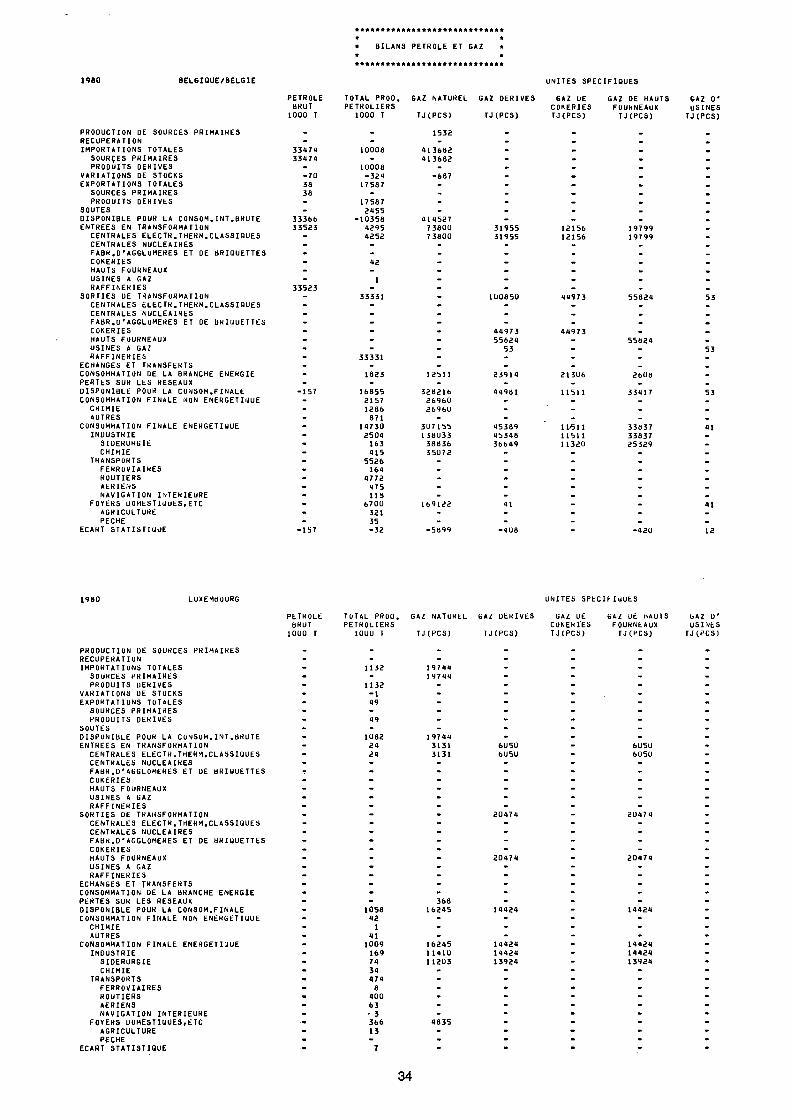
1980 BELGIQUE/BELGIE
PRODUCTION DE SOURCES PRIMAIRES
RECUPERATION
IMPORTATIONS TOTALES
SOURCES PRIMAIRES
PRODUITS DERIVES
VARIATIONS DE STOCKS
EXPORTATIONS TOTALES
SOURCES PRIMAIRES
PRODUITS DERIVES
SOUTES
DISPONIBLE POUR LA CONSOM.INT.BRUTE
ENTREES EN TRANSFORMATION
CENTRALES ELECTR.THERM.CLASSIQUES
CENTRALES NUCLEAIRES
FABR.D'AGGLOMERES ET DE BRIQUETTES
COKERIES
HAUTS FOURNEAUX
USINES A GAZ
RAFFINERIES
SORTIES DE TRANSFORMATION
CENTRALES ELECTR.THERM.CLASSIQUES
CENTRALES NUCLEAIRES
FABR.D'AGGLOMERES ET DE BRIQUETTES
COKERIES
HAUTS FOURNEAUX
USINES A GAZ
RAFFINERIES
ECHANGES ET TRANSFERTS
CONSOMMATION DE LA BRANCHE ENERGIE
PERTES SUR LES RESEAUX
DISPONIBLE POUR LA CONSOM.FINALE
CONSOMMATION FINALE NON ENERGETIQUE
CHIMIE
AUTRES
CONSOMMATION FINALE ENERGETIUUE
INDUSTRIE
SIDERURGIE
CHIMIE
TRANSPORTS
FERROVIAIRES
ROUTIERS
AERIENS
NAVIGATION INTERIEURE
FOYERS UOMESTIUUES.ETC
AGRICULTURE
PECHE
ECART STATISTIQUE
PETROLE BRUT 1000 Τ
33474
33474
70
38
38
33366
33523
33523
*****************************
* * * BILANS PETROLE ET GAZ · * * *****************************
UNITES SPECIFIQUES
TOTAL PROO. PETROLIERS
1000 Τ
10008
GAZ NATUREL GAZ DERIVES
10008
324
17587
17587
2455
10358
4295 4252
42
1
33331
TJCPCS)
1532
413682
413682
414527 73800 73800
TJCPCS)
31955
31955
1U0850
GAZ UE
COKERIES
TJCPCS)
GAZ DE HAUTS
FOURNEAUX
TJCPCS)
GAZ 0'
USINES
TJCPCS)
12156
12156
19799
19799
33331
1823
16855 2157
1286
871 14730
2504
163
415
5526 164
4772
475
115 6700
321
55
32
12511
326216
26960
26960
307155
138033 38636
3 5072
169122
5899
44973 55824
53
23914
44961
45389
45348
36649
41
408
44973
21306
11511
11611
11511 11320
55624
2606
33417
33837
33837 25329
420
198U LUXEMBOURG
PETROLE
BRUT
1000 Τ
TOTAL PROO. PETROLIERS
1UUU τ
UNITES SPtCIUuUES
GAZ NATUREL GAZ DERIVES
TJCPCS) TJCPCS)
GAZ DE COKERIES TJCPCS)
GAZ UE HAUTS FOURNtAUX
TJCPCS)
GAZ D'
USINES
TJCPCS)
PRODUCTION DE SOURCES PRIMAIRES
RECUPERATION
IMPORTATIONS TOTALES
SOURCES PRIMAIRES
PRODUITS DERIVES
VARIATIONS DE STOCKS
EXPORTATIONS TOTALES
SOURCES PRIMAIRES
PROOUITS DERIVES
SOUTES
DISPONIBLE POUR LA CONSOM.INT.BRUTE
ENTREES EN TRANSFORMATION
CENTRALES ELECTR.THERM.CLASSI QUE S
CENTRALES NUCLEAIRES
FABR.D'AGGLOMERES ET DE BRIQUETTES
COKERIES
HAUTS FOURNEAUX
USINES A GAZ
RAFFINERIES
SORTIES DE TRANSFORMATION
'CENTRALES ELECTR.THERM.CLASSIQUES
CENTRALES NUCLEAIRES
FABH.D'AGGLOMERES ET DE BRIQUETTES
COKERIES
HAUTS FOURNEAUX
USINES A GAZ
RAFFINERIES
ECHANGES ET TRANSFERTS
CONSOMMATION DE LA BRANCHE ENERGIE
PERTES SUR LES RESEAUX
DISPONIBLE POUR LA CONSOM.FINALE
CONSOMMATION FINALE NON ENERGETIQUE
CHIMIE
AUTRES
CONSOMMATION FINALE ENERGETIQUE
INDUSTRIE
SIDERURGIE
CHIMIE
TRANSPORTS
FERROVIAIRES
ROUTIERS
AERIENS
NAVIGATION INTERIEURE
FOYERS DOMESTIQUES,ETC
AGRICULTURE
PECHE
ECART STATISTIQUE
1132
1132
1 49
19744
19744
1U82
24
¿4
19744
3131
3131
6U50
6U5U
6U5U
6050
1058 42
1 41
1009
169
74
34 474
Β
4UU
63
■ 3
366
13
368
16245
16245
11410
11203
4835
14424
14424
14424
13924
14424
14424
13924
34
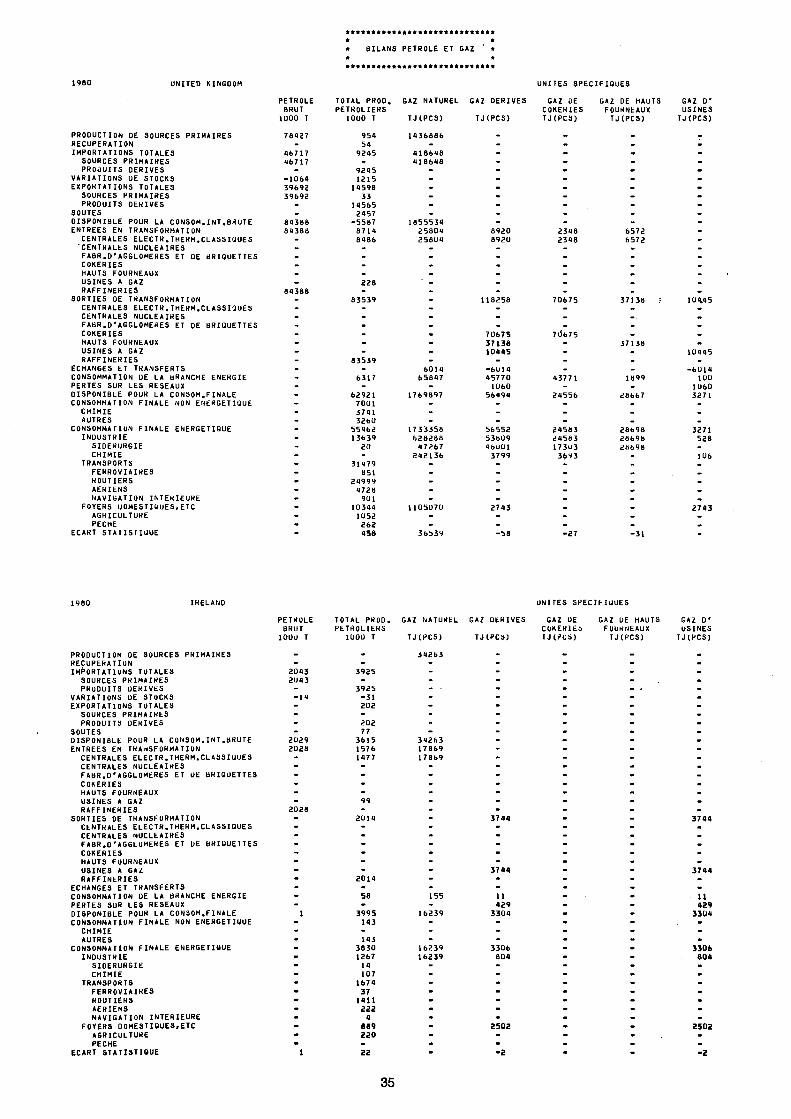
1980 UNITED KINGDOM
***************************** * * * BILANS PETROLE ET GAZ ' · * * *****************************
UNITES SPECIFIQUES
PRODUCTION DE SOURCES PRIMAIRES RECUPERATION
IMPORTATIONS TOTALES SOURCES PRIMAIRES PRODUITS DERIVES
VARIATIONS DE STOCKS EXPORTATIONS TOTALES
SOURCES PRIMAIRES PRODUITS OERIVES
SOUTES DISPONIBLE POUR LA CONSOM.INT.BRUTE ENTREES EN TRANSFORMATION
CENTRALES ELECTR.THERM.CLASSIQUE S 'CENTRALES NUCLEAIRES FABR.D'AGGLOMERES ET DE BRIQUETTES COKERIES HAUTS FOURNEAUX USINES A GAZ RAFFINERIES
SORTIES DE TRANSFORMATION CENTRALES ELECTR.THERM.CLASSIQUES CENTRALES NUCLEAIRES FABR.D'AGGLOMERES ET DE BRIQUETTES COKERIES HAUTS FOURNEAUX USINES A GAZ RAFFINERIES
ECHANGES ET TRANSFERTS CONSOMMATION DE LA BRANCHE ENERGIE PERTES SUR LES RESEAUX DISPONIBLE POUR LA CONSOM.FINALE CONSOMMATION FINALE NON ENERGETIQUE
CHIMIE AUTRES
CONSOMMATION FINALE ENERGETIQUE INDUSTRIE
SIDERURGIE CHIMIE
TRANSPORTS FERROVIAIRES ROUTIERS AERIENS NAVIGATION INTERIEURE
FOYERS DOMESTIQUES,ETC AGRICULTURE PECHE
ECART STATISTIQUE
PETROLE BRUT 1000 τ
78427
46717 46717
1064
39692 39692
84388
84388
TOTAL PROO. PETROLIERS
1000 Τ
954
54 9245
9245 1215
14598 33
14565 2457
5587 8714
8486
GAZ NATUREL
TJ(PCS)
1436886
418648 418648
1855534
25804 25804
GAZ DERIVES
TJCPCS)
8920 8920
GAZ OE COKERIES TJCPCS)
2348
2348
GAZ DE HAUTS FOURNEAUX TJCPCS)
•
•
6S72 6572
GAZ D' USINES
TJ(PCS)
.
228
83539 118258 70675 37138 10445
83539
6317
62921 7001
3741 3260
55462 13639
20
31479
851 24999
4728 9U1
10344
1052 262 458
6014 65847
1769897
1733358
628288 47267
242136
1105070
36539
70675 37138
10445
6U14 45770 1060
56494
56552 53609 46U01
3799
2743
58
70*675
43771
24556
24583
24563 173U3 3693
¿7
37138
1899
28667
28696 28698
28698
-31
10445
6014
100
1060 3271
3271 526
1U6
2743
.
1980 IRELAND UNITES SPECIFIQUES
PRODUCTION DE SOURCES PRIMAIRES RECUPERATION IMPORTATIONS TOTALES
SOURCES PRIMAIRES PRODUITS DERIVES
VARIATIONS DE STOCKS EXPORTATIONS TOTALES
SOURCES PRIMAIRES PRODUITS DERIVES
SOUTES DISPONIBLE POUR LA CONSOM.INT.BRUTE ENTREES EN TRANSFORMATION
CENTRALES ELECTR.THERM.CLASSIUUES CENTRALES NUCLEAIRES FABR.D'AGGLOMERES ET UE BRIQUETTES COKERIES HAUTS FOURNEAUX
USINES A GAZ RAFFINERIES
SORTIES DE TRANSFORMATION CENTRALES ELECTR.THERM.CLASSIQUES CENTRALES NUCLEAIRES FABR.D'AGGLOMERES ET DE BRIQUETTES COKERIES HAUTS FOURNEAUX
USINES A GAZ RAFFINERIES
ECHANGES ET TRANSFERTS CONSOMMATION DE LA BRANCHE ENERGIE PERTES SUR LES RESEAUX DISPONIBLE POUR LA CONSOM.FINALE CONSOMMATION FINALE NON ENERGETIUUE
CHIMIE AUTRES
CONSOMMATION FINALE ENERGETIQUE INDUSTRIE
SIDERURGIE CHIMIE
TRANSPORTS FERROVIAIRES ROUTIERS AERIENS NAVIGATION INTERIEURE
FOYERS DOMESTIQUES,ETC AGRICULTURE PECHE
ECART STATISTIQUE
PETROLE BRUT 1000 Τ
2043 2043
2029 2028
TOTAL PROD. PETROLIERS
1000 Τ
3925
3925 31 202
202
77 3615 1576 1477
99
2014
GAZ NATUREL GAZ DERIVES
TJCPCS) TJCPCS)
GAZ DE COKERIES TJCPCS)
GAZ DE HAUTS FOURNEAUX TJCPCS)
GAZ D' USINES
TJCPCS)
34263 17869 17869
58
3995
143
143
383Ü
1267
14 1U7
1674
37 1411
222 4
889 22U
155
16239
16239
16239
11 429
3304
3306 804
2502
11 429
3304
3306
804
2502
2
35
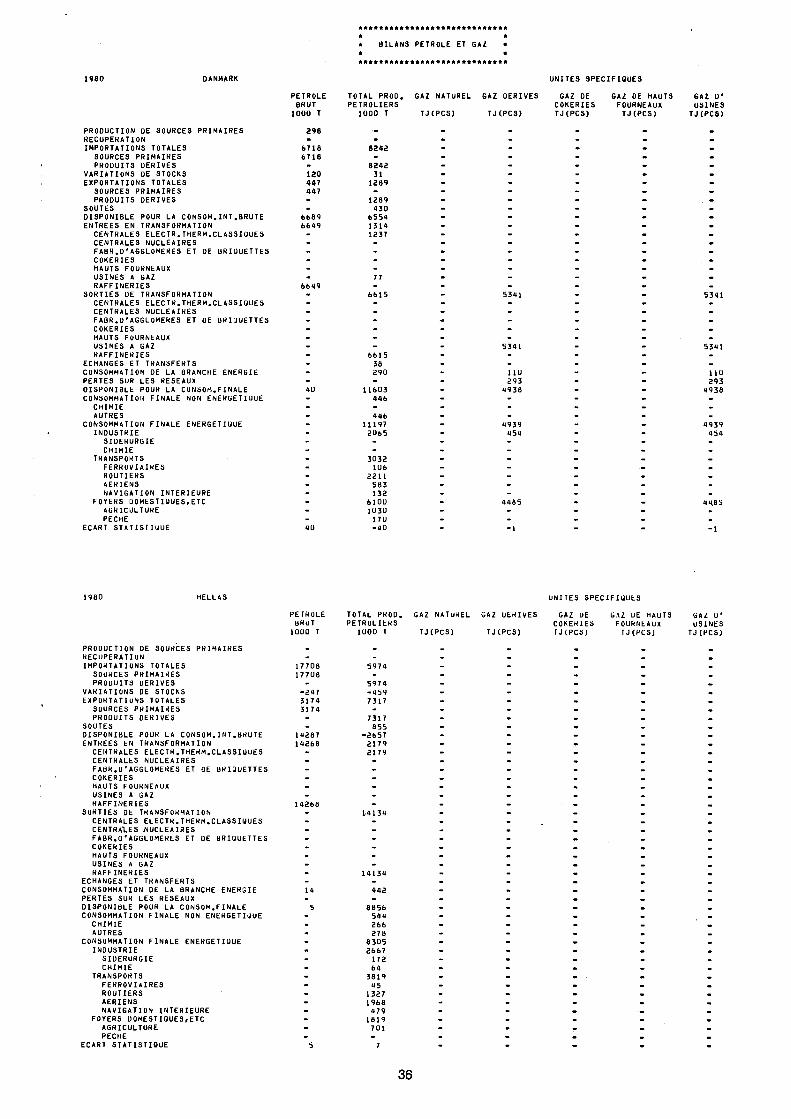
***************************** * * * BILANS PETROLE ET GAZ · * * *****************************
DANMARK
PRODUCTION DE SOURCES PRIMAIRES RECUPERATION IMPORTATIONS TOTALES
SOURCES PRIMAIRES PRODUITS DERIVES
VARIATIONS DE STOCKS EXPORTATIONS TOTALES
SOURCES PRIMAIRES PRODUITS DERIVES
SOUTES DISPONIBLE POUR LA CONSOM.INT.BRUTE ENTREES EN TRANSFORMATION
CENTRALES ELECTR.THERM.CLASSIQUES CENTRALES NUCLEAIRES FABR.D'AGGLOMERES ET DE BRIUUETTES COKERIES HAUTS FOURNEAUX USINES A GAZ RAFFINERIES
SORTIES DE TRANSFORMATION CENTRALES ELECTR.THERM.CLASSI DUES CENTRALES NUCLEAIRES FABR.D'AGGLOMERES ET DE BRIUUETTES COKERIES HAUTS FOURNEAUX USINES A GAZ RAFFINERIES
ECHANGES ET TRANSFERTS CONSOMMATION DE LA BRANCHE ENERGIE PERTES SUR LES RESEAUX DISPONIBLE POUR LA CONSOM.FINALE CONSOMMATION FINALE NON ENEKGETIUUE
CHIMIE AUTRES
CONSOMMATION FINALE ENEHGETIUUE INDUSTRIE
SIDERURGIE CHIMIE
TRANSPORTS FERROVIAIRES ROUTIERS AERIENS NAVIGATION INTERIEURE
FOYERS DOMESTIUUES,ETC AGRICULTURE PECHE
ECART STATISTIUUE
PETROLE BRUT 1000 T
298
TOTAL PROD. PETROLIERS
1000 T
6718 6718 -120 447 447 --6689
6649 -
8242 -8242 31
1289 -1289 430
6554 1314 1237
77
6615
6615 38 290
11603 446 446
11197 2065
3032 106
2211 S83 132
6100 1030 170 -4G
GAZ NATUREL GAZ DERIVES
TJ(PCS) TJCPCS)
UNITES SPECIFIQUES
GAZ OE GAZ DE HAUTS GAZ D' COKERIES FOURNEAUX USINES TJCPCS) TJCPCS) TJCPCS)
nu 293
4938
4939 454
5341
5341
110 293
4938
4939 454
44.85
-1
UNITES SPECIFIQUES
PRODUCTION DE SOURCES PRIMAIRES RECUPERATION IMPORTATIONS TOTALES
SOURCES PRIMAIRES PRODUITS DERIVES
VARIATIONS DE STOCKS EXPORTATIONS TOTALES
SOURCES PRIMAIRES PRODUITS DERIVES
SOUTES DISPONIBLE POUR LA CONSOM.INT.BRUTE ENTREES EN TRANSFORMATION
CENTRALES ELECTR.THERM.CLASSI QUE S CENTRALES NUCLEAIRES FABR.D'AGGLOMERES ET DE BRIQUETTES COKERIES HAUTS FOURNEAUX USINES A GAZ RAFFINERIES
SORTIES DE TRANSFORMATION CENTRALES ELECTR.T HERM.CLASSIQUES CENTRAl.ES NUCLEAIRES FABR.D'AGGLOMERES ET DE BRIQUETTES COKERIES HAUTS FOURNEAUX USINES A GAZ RAFFINERIES
ECHANGES ET TRANSFERTS CONSOMMATION DE LA BRANCHE ENERGIE PERTES SUR LES RESEAUX DISPONIBLE POUR LA CONSOM.FINALE CONSOMMATION FINALE NON ENERGETIQUE
CHIMIE AUTRES
CONSOMMATION FINALE ENERGETIUUE INDUSTRIE
SIDERURGIE CHIMIE
TRANSPORTS FERROVIAIRES ROUTIERS AERIENS NAVIGATION INTERIEURE
FOYERS DOMESTIQUES,ETC AGRICULTURE PECHE
ECART STATISTIQUE
PETROLE BRUT 1000 T
. -17708
17708 --247
3174 3174 --14287
14268 -
TOTAL PKOD. PETROLIERS
1000 T
--5974 -5974
-459 7317 -7317 855
-2657 2179 2179
GAZ NATUKEL
TJCPCS)
-------------
GAZ DERIVES
TJCPCS)
-------------
GAZ DE COKERIES TJCPCS)
. ---. --------
GAZ OE HAUTS FOURNEAUX TJCPCS)
_ -_ ----. -----
GAZ D' USINES
TJCPcs)
« . . . -_ . . _ . . --
4
5
442 -8856 544 266 27B
8305 2667 172 64
3819 45
1327 1968 479
1819 701
36
PRESS NOTICES AND PUBLICATIONS
'ENERGY STATISTICS'
Edition 1 9 8 1
NOTES ET PUBLICATIONS
'STATISTIQUES DE L'ENERGIE'
Edition 1 9 8 1
MONTHLY STATISTICS STATISTIQUES M E N S U E L L E S
A Publications (d/e/f)
— Month ly bul let in Coal
— Month ly bul let in Hydrocarbons
— Month ly bul let in Electrical energy
Β Press notice (d/e/ f )
— Energy supply aspects of the nuclear
power stations (restricted diffusion)
A — Publications (d/e/ f )
— Bul let in mensuel Charbon
— Bul let in mensuel Hydrocarbures
— Bul let in mensuel Energie électrique
Β Note rapide (d/e/ f )
— Exp lo i ta t ion des centrales nucléaires
(diffusion restreinte)
A N N U A L STATISTICS STATISTIQUES A N N U E L L E S
A — Statistical telegrams (d/e/f)
— Coal industry act ivi ty * Λ , ι ·
— Oil market act ivi ty — Natural gas supply economics
— Electricity supply economics *
— Energy economy
Β — Publications
* — Operations of nuclear power stations (e/f)
* — Energy statistics yearbook (d/e/ f / i )
* — Primary energy equivalents balance sheets 1973—79 (f)
— Electrical energy prices 1978—1980 (ef)
— Analysis of energy inputoutput tables
1975 and 1980 (d/e/f)
A — Télégrammes statistiques (d/e/f)
— L'activité charbonnière
— L'activité pétrol ière
— L'économie du gaz naturel
— L'économie électrique
— L'économie de l'énergie
Β — Publications
— Explo i ta t ion des centrales nucléaires (e/f) *
— Annuaire des statistiques de l'énergie (d/e/f/ i) *
— Bilans de l'énergie, en équivalent primaire 1973—79 (f )
— Prix de l'énergie électrique 1978 1980 (ef)
— Analyse des tableaux entréessorties de l'énergie
1975 et 1980 (d/e/f)
NOTE NOTA
1) Non periodical publications — edi t ion 1980
* Gas prices 1 9 7 8 1 9 8 0 (ef)
Electrical energy prices 1 9 7 3 1 9 7 8 ( e / f d / i )
— Useful energy balance sheets 1978 (e/f)
2) Publication dates are given in the quarterly
publ icat ion 'Eurostat news'
1) Publications nonpériodiques — édit ion 1980
* Prix du gaz 1 9 7 8 1 9 8 0 (ef)
* Prix de l'énergie électrique 1973 1978 (e / f d / i )
* Bilans de l'énergie uti le 1978 (e/f)
2) Le calendrier des publications est indiqué t r i
mestriel lement dans Informations de l 'Eurostat'
published and available parues et disponibles
37

Salgs- og abonnementskontorer · Vertriebsbüros - Γραφεία πωλήσεως · Sales Offices ■ Bureaux de vente - Uffici di vendita ■ Verkoopkantoren
Belgique — België
Moniteur belge — Belgisch Staatsblad
Rue de Louvain 4042 — Leuvensestraat 4042 1000 Bruxelles — 1000 Brussel Tél. 512 00 26
Sous-dépõts — Agentschappen :
Librairie européenne — Europese Boekhandel Rue de la Loi 244 — Wetstraat 244 1040 Bruxelles — 1040 Brussel
CREDOC
Rue de la Montagne 34 Bte 11 — Bergstraat 34 Bus 11 1000 Bruxelles — 1000 Brussel
Danmark
Schultz Forlag
Montergade 21 1116 København Κ TH. (01) 12 11 95
Underagentur :
Europa Boger Gammel Torv 6 — Postbox 137 1004 København K Tlf. (01) 15 62 73
BR Deutschland
Verlag Bundesanzeiger
Breite Straße — Postfach 10 80 06 5000 Köln 1 Tel. (0221) 21 03 48 (Fernschreiber : Anzeiger Bonn 8 882 595)
'Ελλάς
Γ. Κ. 'Ελευθερουδάκης Α.Ε.
Νίκης 4 'Αθήνα (126) Τηλ. 3226323 Τέλεξ 219410 elef
Πρακτόρευση :
Βιβλιοπωλείο Μόλχο οδός Τσιμισκή 10 Θεσσαλονίκη Τηλ. 275 271 Τέλεξ 412885 limo
France
Service de vente en France des publications des Communautés européennes
Journal officiel
26, rue Desaix 75732 Paris Cedex 15 Tél. (1) 578 61 39
« Service de documentation »
D.E.P.P. — Maison de l'Europe 37, rue des FrancsBourgeois 75004 Paris Tél. 887 96 50
Ireland
Government Publications
Sales Office G.P.O. Arcade Dublin 1
or by post
Stationery Office
Dublin 4 Tel. 78 96 44
Italia
Libreria dello Stato
Piazza G. Verdi, 10 00198 Roma — Tel. (6) 8508 Telex 62008
Nederland
Staatsdrukkerij- en uitgeversbedrijf
Christoffel Plantijnstraat Postbus 20014 2500EA 'sGravenhage Tel. (070) 78 99 11
United Kingdom
HM Stationery Office
P.O. Box 569 London SE1 9NH Tel. (01) 928 69 77. ext. 365
España
Libreria Mundi-Prensa
Castellò 37 Madrid 1 Tel. 275 46 55
Portugal
Livraria Bertrand, s.a.r.l.
Rua Joào de Deus — Venda Nova Amadora Tél. 97 45 71 Télex 12 709 — litran — p.
Schweiz Suisse Svizzera
Librairie Payot
6, rue Grenus 1211 Genève Tél. 31 89 50
Sverige
Librairie CE. Fritzes
Regeringsgatan 12 Box 16356 103 27 Stockholm Tél. 0823 89 00
United States of America
European Community Information Service
2100 M Street, N.W. Suite 707 Washington, D.C. 20 037 Tel. (202) 862 95 00
Grand-Duché de Luxembourg
Andre lande - Andere Länder - "Αλλες χώρες ■ Other countries - Autres pays Altri paesi - Andere landen
Kontoret for De europæiske Fællesskabers officielle Publikationer · Amt für amtliche Veröffentlichungen der Europäischen Gemeinschaften · 'Υπηρεσία των Επισήμων Δημοσιεύσεων των Ευρωπαϊκών Κοινοτήτων ■ Office for Official Publications of the European Communities · Office des publications officielles des Communautés européennes Ufficio delle pubblicazioni ufficiali delle Comunità europee
Bureau voor officiële publikaties der Europese Gemeenschappen
L2985 Luxembourg 5, rue du Commerce · Tél. 49 00 81
Pris I Luxembourg (moms ikke medregnet) · Öffentliche Preise in Luxemburg (ohne MwSt.) Price (excluding VAT) in Luxembourg · Prix publics au Luxembourg, TVA exclue · Prezzi pubblici nel
Lussemburgo, IVA esclusa · Vastgestelde prijzen in Luxemburg (exclusief BTW)
Pris pr. hæfte Einzelpreis Single copy Prix par numéro Prezzo unitario Prijs per nummer
Abonnement 1981 Subscription 1981 Abbonamento 1981
ECU
1,50
14,65
BFR
60
600
DKR
11,60
116
DM
3,75
37,80
DR
90
900
FF
8,70
87
IRL
1
10.20
LIT
1800
18000
HFL
4,10
41
UKL
0.90
9
USD
2.10
21
KONTORET FOR DE EUROPÆISKE FÆLLESSKABERS OFFICIELLE PUBLIKATIONER AMT FÜR AMTLICHE VERÖFFENTLICHUNGEN DER EUROPÄISCHEN GEMEINSCHAFTEN OFFICE FOR OFFICIAL PUBLICATIONS OF THE EUROPEAN COMMUNITIES OFFICE DES PUBLICATIONS OFFICIELLES DES COMMUNAUTÉS EUROPÉENNES UFFICIO DELLE PUBBLICAZIONI UFFICIALI DELLE COMUNITÀ EUROPEE BUREAU VOOR OFFICIËLE PUBLIKATIES DER EUROPESE GEMEENSCHAPPEN
ISSN 0378-3731
L-2985 Luxembourg Kat./cat.: CA-AO-81-010-3A-C