Embed Size (px)
Citation preview

- 1 -
Hydro-Geological Study Of
Six Micro Watersheds in Chintamani, Karnataka
Foundation for Ecological Security 2010

- 2 -
Contents
1. Present Groundwater Scenario in Gudisivaripalli Micro watershed Pg. 3-42
2. Present Ground Water Scenario in Mudimadagu Micro watershed
Pg.43-109
3. Present Ground Water Scenario in Bodireddypalli Micro watershed
Pg.110-147
4. Present Ground Water Scenario in Mudivaripalli Micro watershed
Pg.148-187
5.
Present Ground Water Scenario in Kamaravaripalli Micro watershed
Pg.188-232
6.
Present Ground Water Scenario in Jeekavandlapalli Micro watershed
Pg.233-279

- 3 -
Present Ground Water Scenario in
Gudisivaripalli Micro Watershed
A Hydro-geological Study 2010

- 4 -
CHAPTER I Introduction Water shortage and its various fall-outs have resulted in increasing application of the “Watershed Development” concept in many areas of the country and it is being increasingly sought as a means to address the problem of water crises. Besides, watershed projects also offer opportunities to address some critical socio-economic issues pertaining to the rural scenario in the country today, especially when many of these issues can be backtracked to the problems of water resources. However, watershed programmes would benefit immensely by undertaking systematic hydrogeological studies as groundwater resources form an important aspect in most of the watershed development programmes (Kulkarni, 1998). Water exists within a certain physical framework of a watershed. This framework is largely controlled by the local geological conditions. Hence, the planning of a watershed development programme will be more effective if the physical system taking the impact of the measures is understood well. 1.1 Background Foundation for Ecological Security (FES) has been working in Papagni1 River Basin through two Spearhead Teams located in Chintamani under Kolar and Chikkaballapura districts in Karnataka and Madanapalle under Chittoor district in Andhra Pradesh. The organization has been working on natural resource based projects, involving local communities and with a watershed as an approach since the year 1995. One of the characteristics of the project area is the presence of large number of traditional water bodies known as kere’s or tanks but today in a very bad state. FES has been providing valuable inputs in the working areas of watershed development, by undertaking the activities such as contour mapping, detailed hydro- geological characterization and evaluation through rapid appraisal.
1.2 Context and Rationale The term ‘precipitation’ signifies all forms of water that is received by earth from the atmosphere and includes rainfall, snowfall, frost, hail etc. When one observes the rainfall pattern, the distribution is uneven and erratic in many parts of the country. This type of erratic and uneven distribution of the rainfall pattern coupled with steadily increasing demand for water due to rapid industrialization, crop diversity and also increasing demand for drinking water, in the light of relatively constant (or even decreasing) supply necessitates an efficient use of this scarce resource. It would mean encouraging the community to judiciously use their limited groundwater resources.
1 a tributary of Pennar River

- 5 -
It is in this context that FES undertook this exercise for understanding the relation between the meteorological and geological aspects in the micro watershed. Detailed study has been carried out in Gudisivaripalli micro watershed micro watershed located in Karnataka to understand the status of both surface and ground water resources. The cropping pattern is highly dependent on the rainfall and groundwater in this area. The water level fluctuations in wells according to the rainfall pattern have been recorded in the study area in order to understand the surface and groundwater scenario and estimating groundwater balance through demand for crops, drinking and supply through rainfall and groundwater. This report is the culmination of a rather rapid mapping appraisal and was conducted as a base-level geological and hydro-geological investigation with the following objectives:
i. define exactly and mapping the hydro-geological regime ii. suggest a broad strategy for watershed development iii. suggest a broad strategy for watershed development iv. analyze nature of the meteorological and agricultural aspects with a rainfall
occurrence and agriculture perspective and v. develop a water audit of the study area (availability & usage of water) in the
context of its geo-hydrological status. 1.3 The Outcome/ Result from this Study
Generating site-specific data on the status of water resources and their use in the study area. When supplemented with data on alternative crops (less water intensive), agricultural best practices etc., the communities living in the area will be able to assess and analyze the water use patterns with respect to water availability and make informed decisions to improve the situation (regulation on bore wells, sharing the water, change in crops, priority of usage – drinking water over irrigation etc.).
Developing a methodology that could be adopted by other agencies involved in working with communities and natural resources. Disseminating the study methodology and results among govt. and other agencies working on water resources, enabling them to take up such models in their areas of operation and also facilitates decision making on the site selection and land characterization.
1.4 Methodology The aim of the detailed hydrological, hydro-geological and agricultural and social assessment was to undertake a systematic evaluation of the area’s local geological setting and its impact on local hydro geological regime and recharge, discharge
- 6 -
components, the output of the recharge, discharge and groundwater balance. The methodology used to obtain the data has been explained at the end of the chapter. The methodology of the study included following steps.
A. Data Collection: a) Primary data was collected from the field from rain gauges, Pan
Evaporimeter, water level data, measured with water level indicator and through house hold surveys.
b) Secondary Data was collected from allied sources such as Revenue and other government departments. Part of the data was also collected from other sources such as Ali Cotton’s study and IWMI study material. Topo-sheets were collected from Survey of India for preparing the base maps and study of the satellite imageries for delineating the lineaments and drainage pattern
1.5 Data Analysis The following data was used for detailed analysis of geological, meteorological and hydrological characteristics of the study areas.
Rainfall Data Assembly and Analysis: Analysis of the rainfall data2 helped to understand the impact of climate on the area. The data was analyzed in such a manner that the total rainfall per month for each year could be exactly calculated. The intensity of the rainfall has been calculated through dividing the total rainfall by the total rainy day per month. Geological Mapping and Analysis: Study and analysis of the occurrence and distribution of the different geological formations and their relationship with surface and groundwater was carried out in order to understand the hydro-geological regime. A detailed study was conducted on secondary structural features like dykes and veins which act as natural geological barriers and their impact on the local ground water movement. GPS was used for tracking dykes and other geological features. Topo sheets and Remote Sensing Satellite Imageries (IRS-1D) were used for analysis of the geology and the land use pattern. Water Level Analysis: Analysis of the water level fluctuations from the selected bore wells and open wells were carried out in order to understand the recharge and discharge criteria. Water Resources Estimation: Rainfall infiltration method and water level fluctuation methods were used for the estimation of groundwater resources. The rainfall infiltration method is as follows.
2 for the period 2000-08

- 7 -
Recharge:
(I) Recharge due to precipitation = p
(ii) Natural Recharge from lakes, streams (Influent seepages)
= Rn
(iii) Artificial Recharge from Canals, Reservoirs, Irrigation return flows
= Ra
(iv) Ground Water inflow from areas outside the basin
= Gi
Discharge:
(i) Evaporation = Et
(ii) Natural Discharge by seepage & stream flow (Effluent seepages
= De
(iii) Artificial Discharge due to Pumping = Do
(iv) Leakage from a bottom semi confining layer = Go
(v) Ground water outflow to area outside the basin = Ge
(vii) Change in Groundwater Storage = Δsg
ΔSg = (Rp + Rn + Ra + Gi) – (Et + De + Do + Go + Ge)
Recharge due to ppt: Volume of the water was calculated by taking the annual rainfall from the study area multiplied by the area of the study (from the total geographical area). For artificial recharge due to lakes and streams: Recharge due to Canals, Reservoirs, and Irrigation return flows. All the other sources are negligible except the irrigation return flows in both study areas. 25% of the discharge due to pumping has been taken as the recharge due to irrigation return flow due to the soil conditions in these areas. Ground water inflow from outside of the basin: It is also taken as negligible because of hard rock terrain and because of natural geological barriers like dykes.

- 8 -
Evaporation: For estimating it, two Pan Evaporimeters were installed and monitored two times in a given day. Day wise data was assembled and was later analyzed on monthly basis by using formula with pan coefficient taking as 0.70. Natural Discharge from seepage & inflow: this was considered negligible for the study area, as the seepages come to the tanks & therefore recharge the ground water. This has already been calculated as the recharge from tanks. Artificial Discharge due to pumping: For discharge due to pumping. Leakage from a bottom semi-confining layer: It is negligible for this region after considering the local hydrogeology. Ground water outflow to area outside the basin: It is negligible for this region due to the natural geological setting. The Water Level Fluctuation method is as follows: Area X Specific yield X Water table rise In this Specific Yield =Sy Sy = {(Dw + Robf + Sd) – (RFw + Ig)}/ (Wld X Ae)
Ground water draft by wells & direct pumping
=Dw
Base flow =Robf
Spring discharge =Sd
Winter rainfall =Rfw
Recharge due to return flow from irrigation =Ig
Average water level decline =Wld
Effective area of ground water recharge =Ae
Annual Groundwater Draft: For analyzing this, demand from population and livestock was considered in addition to the pumping demand. The discharge values of the 7.5 Hp pumps, which are being used in this area, were observed. The discharge measured during the pumping through 100 liters drum, is 2.3-2.5 lit per second. All the pumps are working for 6-8 hours daily.

- 9 -
Net Groundwater Availability: is the sum of total monsoon recharge and non-monsoon recharge and deletion with 5% of non-monsoon discharge or baseflow. Stage of Groundwater Development: is computed by following formula. Annual Groundwater Draft / Net Groundwater Availability X 100 Storage Level Rise / fall: is the ratio of Surplus or Shortage to area * 100. Comparison between Water level fluctuation method and Rainfall infiltration method: the following formula is used to compare both methods and finally the water level fluctuation method considered for Gudisivaripalli micro watershed due to best available data. (A-B)/B) * 100 = P.D where P.D is the percentage deviation A is the recharge by water level fluctuation method B is the recharge by rainfall infiltration method Depend upon the value of P.D. the recharge value finalized. If P.D is between +20% and -20% than A is the recharge If P.D. is > -20 % = 0.8 * B taken as recharge If P.D. is < 20 % = 1.2 * B taken as recharge GIS Mapping Advanced software like Geographical Information System was used for generating the maps and analysis of the data and output. Different maps like Geological, Hydrogeological, Soil and Recommendations were prepared.

- 10 -
CHAPTER-II Location & Topography
2. Location The study area including three NABARD watersheds is located in the upstream of the Papagni River Basin. Study area is situated in Srinivaspur taluk of Kolar district, forms the eastern most district of the Karnataka state. It lies in agro-climatic zone with semi-arid type of climate with dryness in major part of the year. The study area is situated exactly between the boarder of Andhra Pradesh and Karnataka state, where rainfall vagaries and a large-scale over abstraction of groundwater have plagued villages for the last ten years. The location and the topography are discussed in detail in the following paragraphs.Study area is a typical Panchayat with NABARD watershed including Gudisivaripalle and Mudivaripalle. Latitude of the area varies from 13.5319 to 13.5457and longitude 78.2978 to 78.3196 falling in Survey of India Toposheet numbered 47K/6. It is located at the foot hills of Peddakonda and Eswarmala ridges located in the east and north and other small mounds and hillocks in the west forming the catchment for this area. This study area is

- 11 -
located about 30 km from Kolar district headquarters and 20km from Srinivaspur Taluk. It can be best approached by the Madanapalle - Bangalore road that passes through Chintamani and Rayalpadu. Rayalpadu is the nearest small town located about 10km from the study area. FES has a cluster office in Rayalpadu from where it operates its ecological activities. 2.1 Topography of Gudisivaripalli micro watershed Undulating topography with ridges on north and northeast. Entire drainage flow is towards the west and northwest. The mean average elevation of the watershed is 850 m amsl. The highest elevation in the watershed is 960 m amsl, while the lowest elevation is 737 m amsl.
- 12 -
CHAPTER III Geology
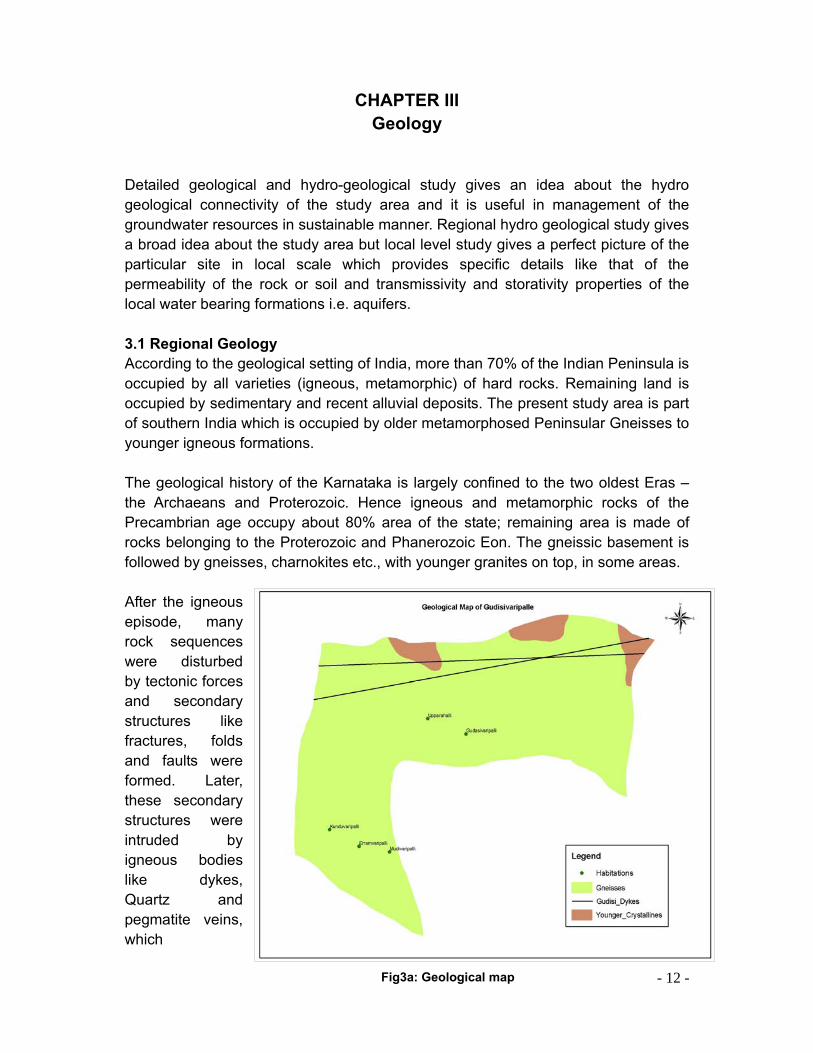
Detailed geological and hydro-geological study gives an idea about the hydro geological connectivity of the study area and it is useful in management of the groundwater resources in sustainable manner. Regional hydro geological study gives a broad idea about the study area but local level study gives a perfect picture of the particular site in local scale which provides specific details like that of the permeability of the rock or soil and transmissivity and storativity properties of the local water bearing formations i.e. aquifers. 3.1 Regional Geology According to the geological setting of India, more than 70% of the Indian Peninsula is occupied by all varieties (igneous, metamorphic) of hard rocks. Remaining land is occupied by sedimentary and recent alluvial deposits. The present study area is part of southern India which is occupied by older metamorphosed Peninsular Gneisses to younger igneous formations. The geological history of the Karnataka is largely confined to the two oldest Eras – the Archaeans and Proterozoic. Hence igneous and metamorphic rocks of the Precambrian age occupy about 80% area of the state; remaining area is made of rocks belonging to the Proterozoic and Phanerozoic Eon. The gneissic basement is followed by gneisses, charnokites etc., with younger granites on top, in some areas. After the igneous episode, many rock sequences were disturbed by tectonic forces and secondary structures like fractures, folds and faults were formed. Later, these secondary structures were intruded by igneous bodies like dykes, Quartz and pegmatite veins, which
Fig3a: Geological map

- 13 -
themselves may have been fractured subsequently. 3.2 Local Geology The main rock types in three watershed areas are peninsular gneisses, younger granites, with secondary intrusives like dykes and Quartz, Pegmatite veins. This area is a part of the regional Archean Complex having outcrops of younger granites and underlain by peninsular gneissic basement. The local geology in these three areas falls under Dharwar Stratigraphy. The Gudisivaripalli micro watershed underlained by hard rock terrain with secondary structural features like faults, joints and fractures. Most of the secondary intrusions such as dykes criss-cross the entire area and controlling the groundwater movement. Lineaments were observed all over the area. Peninsular Gneisses Granite gneisses are the important rock types in the area that belong to the Older Peninsular Gneissic Complex. It is composed of banded gneiss and gneissic granite. Whole terrain has rugged and undulating topography. Therefore, the productive zones to extract ground water in these rocks (aquifer) are frequently erratic and unpredictable. Younger Granites Texturally medium to coarse grained younger granites forms undulating landscape with small and large hillocks and mounds in the study area. These lands are Mineralogically Potash rich, leucocratic granites almost similar to underlying gneisses but less metamorphosed and are more acidic and are highly jointed and showing the typical’ Tor Topography’ commonly shown by granites.

- 14 -
Secondary Intrusions Dykes & Veins The entire study area is criss-crossed by numerous basic dykes forming a remarkable geological feature in the area. These dykes act as the natural barrier for the ground water in the area. The contact zones of these dykes with host rock plays vital role in downward movement and accumulation of the groundwater for deeper confined aquifers. The width of the dykes may vary from 5m to 20m. The exposures of these rocks are explained in detail under hydrogeology of the study areas. Some small quartz pegmatitic veins are exposed in Gudisivaripalle in local scale and scattered and fragmented, with fragments strewn across the foothills.

- 15 -
CHAPTER IV Soils
Soil characteristics play vital role in understanding the geology and hydrogeology of the study area and in suitable site selection for the agriculture or cropping pattern. Soil is the weathered and disintegrated material from parent rock and its characteristics depend on the type and composition of the parent rock. The suitable site selection for water and soil conservation and enhancement of the soil moisture activities depends on the thickness, shape and its grain size. The thickness of the soil depends on the slope, degree of the weathering. On the ridges or steep slope areas, the soil layer is very thin or absent but in the slopes or downstream may extend upto 45meters. While gravelly or sandy soils allow the downward movement or infiltration and percolation of water more rapidly (200mm/hr) loamy, silty and clayey soils contain very slow infiltration or percolation rates (1.3mm/hr). Hence, soil characteristics are very important in site selection for construction of recharge and harvesting structures. Locally four types of soils were observed to be present in the study areas. Red Gravelly Soils Thin red gravelly soils are mainly seen along the foot hills of the granite mounds and quartz, pegmatite intrusions. This soils show presence of granite and quartz pebbles and is highly permeable in nature. This is the suitable soil for water recharge. Red sandy Soils Red sandy soils occupy the down portions of the red gravelly soils with 3-5meter in thickness. Both these soils play key role in recharging the rainwater storm or runoff which is comes from the hillocks. Some tanks are located in this zone contributing more recharge into bore wells wh Red Loamy Soils Thick red loamy soils are dominant soils in this study area. Their thickness varies from 5-15 meters in downstream areas and form part of the regolith portion of the shallow unconfined aquifers. Most of the wells located in this zone contain sand, silt and clay in equal amounts and suitable for cultivation of sunflower, groundnut, and vegetable crops. Black Clay soil The thick black Clay soil occurring further downstream in the study area and along streams is very thick. The moisture content in this zone is high due to its high water holding capacity (porosity) but permeability is less due to its small grain size. Most of the tanks are silted by clay soils which control the groundwater recharge from tanks with less infiltration rate resulting into the high evaporation rate.

- 16 -
CHAPTER V
Meterology
Rainfall Pattern
Rainfall or precipitation is the main source for both surface and groundwater resources. It is important to understand the rainfall characteristics and its behavior on the land in order to estimate its volume, etc. Rainfall is the critical factor for the groundwater recharge (most of the aquifer systems in both areas essentially unconfined and confined). The recharge and discharge parameters depend on several factors such as soil, geology, slope, and land use etc. Rainfall data is very useful to analyze the drought conditions in the area. Climate in Gudisivaripalli is dry and hot during summer. Its average rainfall is 686 mm which is almost same with compare to the district-average but from the last ten years the average rainfall has slightly increased from 686 to 700. From the average rainfall data it can be stated that the intensity generally increases from June to October in a constant manner. In June and July there is a little declination of mean intensity of rainfall for all the years and again it increases in a great manner such that it shows the highest value in the month of October (Graph 5d). Hence two periods of monsoon or double monsoon can be established from this data. Rainfall Analysis There are two spells of rain that occur due to the South-west monsoon or onset of monsoon and the retreat monsoon or North-east monsoon. The rainfall data from 2000 (January) to 2009 (March) was collected from the Mandal/Taluk office in order to understand and assess the conditions of drought and flood. The graph given below explains the year wise rainfall data including monsoon and non monsoon
Yearly Rainfall Pattern in Study Areas
0
200
400
600
800
1000
1200
2000-01 2001-02 2002-03 2003-04 2004-05 2005-06 2006-07 2007-08 2008-09Year
Rai
nfa
ll (m
m)

- 17 -
seasons. It also includes the day-wise, month wise and year wise intensity of rainfall. Graph5a: Year wise Rainfall Pattern
From the above graph it is clear that there is no meteorological drought within 10 years in this area indicating that this area gets quite good rainfall compared to the
district’s average rainfall. Graph5b: Monsoon & Non Monsoon Rainfall Distribution
Graph5c: Deviation from normal rainfall
Monsoon & Non Monsoon Rainfall Distribution in Study Areas
0
100
200
300
400
500
600
700
2000-01 2001-02 2002-03 2003-04 2004-05 2005-06 2006-07 2007-08 2008-09
Year
Ra
infa
ll (m
m)
Monsoon Rainfall Non Monsoon Rainfall
Yearwise Deviation from Normal Rainfall
-400
-200
0
200
400
600
800
1000
1200
2000-01 2001-02 2002-03 2003-04 2004-05 2005-06 2006-07 2007-08 2008-09
Rai
nfa
ll (m
m)
Yearly rainfall (mm) deviation (mm)

- 18 -
From the Monsoon and Non-Monsoon rainfall pattern, it is clear that there is decreasing in alternative year in Non-Monsoon rainfall trend compare to monsoon rainfall which is increase in alternate year (except previous five years).
Graph5d: Agriculture & Meteorological Droughts
Graph 5e: Year wise daily intensity of Rainfall
Yearwise Daily Intensity of Rainfall in Rayalpad
0
5
10
15
20
25
30
35
2000-01 2001-02 2002-03 2003-04 2004-05 2005-06 2006-07 2007-08 2008-09
Year
Rai
nfa
ll (m
m)
Agriculture & Meteorological Droughts
0
50
100
150
200
250
300
2000-01 2001-02 2002-03 2003-04 2004-05 2005-06 2006-07 2007-08 2008-09
Year
Rai
nfa
ll(m
m)
June July Aug Sep
- 19 -
0
500
1000
1500
Agriculture Severe Drought
2001-02 0 44.4 1457.6
June July Yearly rainfall
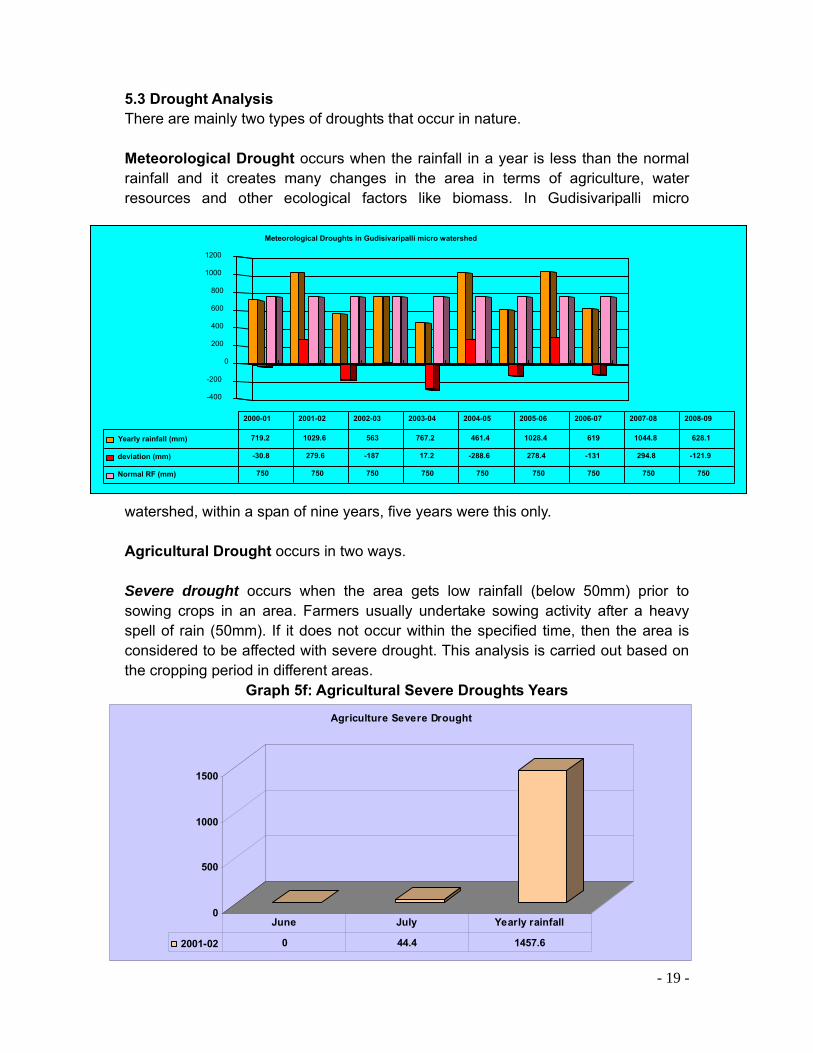
5.3 Drought Analysis There are mainly two types of droughts that occur in nature. Meteorological Drought occurs when the rainfall in a year is less than the normal rainfall and it creates many changes in the area in terms of agriculture, water resources and other ecological factors like biomass. In Gudisivaripalli micro
watershed, within a span of nine years, five years were this only. Agricultural Drought occurs in two ways. Severe drought occurs when the area gets low rainfall (below 50mm) prior to sowing crops in an area. Farmers usually undertake sowing activity after a heavy spell of rain (50mm). If it does not occur within the specified time, then the area is considered to be affected with severe drought. This analysis is carried out based on the cropping period in different areas.
Graph 5f: Agricultural Severe Droughts Years
-400
-200
0
200
400
600
800
1000
1200
Meteorological Droughts in Gudisivaripalli micro watershed
Yearly rainfall (mm) 719.2 1029.6 563 767.2 461.4 1028.4 619 1044.8 628.1
deviation (mm) -30.8 279.6 -187 17.2 -288.6 278.4 -131 294.8 -121.9
Normal RF (mm) 750 750 750 750 750 750 750 750 750
2000-01 2001-02 2002-03 2003-04 2004-05 2005-06 2006-07 2007-08 2008-09
- 20 -
Generally farmers in Gudisivaripalli micro watershed area, undertake sowing activities by the end of the month of June, after receiving at least 50mm of rainfall. This is the minimum rainfall required for crops such as millets and groundnut. Otherwise it becomes difficult to cultivate these crops. Monsoon in this area begins in the month of June. In this background, rainfall data in the month of June in a year is used to assess severe drought. The data is plotted in excel sheet that clearly indicates the period of drought that the area faced for seven years. This clearly indicates that there is no relation between meteorological and moderate droughts because, heavy rainfall occurred in this area, during the year, but it experienced a severe drought.
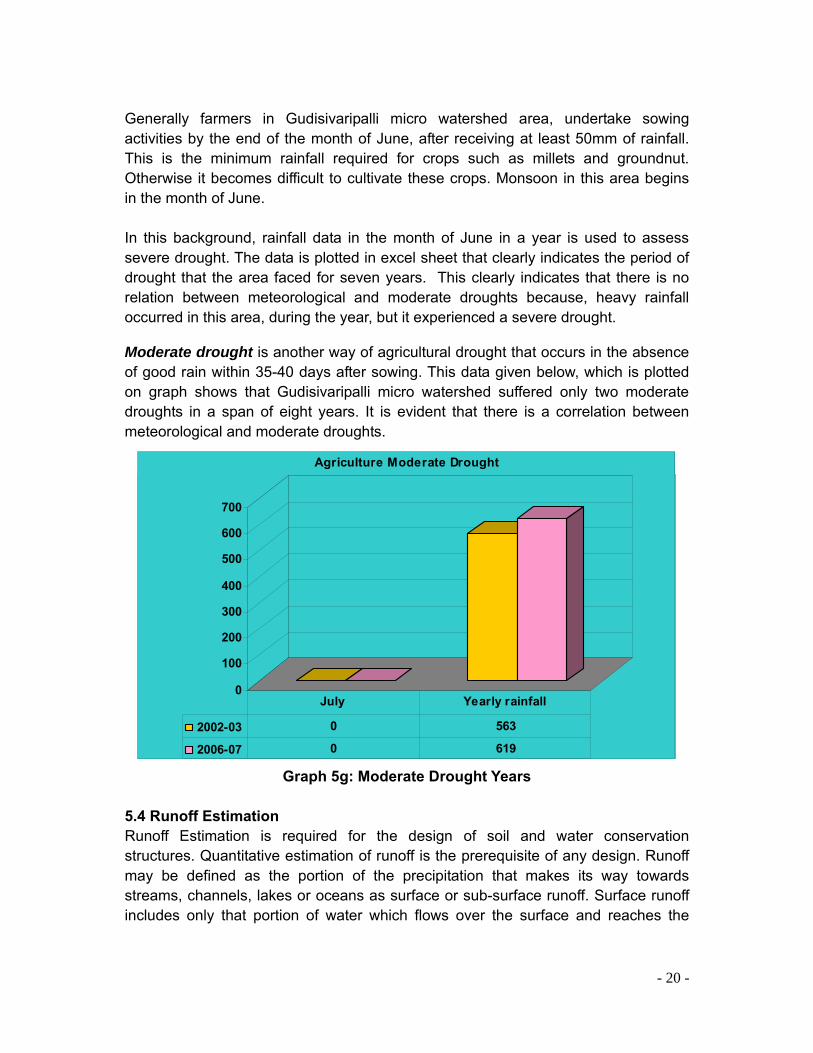
Moderate drought is another way of agricultural drought that occurs in the absence of good rain within 35-40 days after sowing. This data given below, which is plotted on graph shows that Gudisivaripalli micro watershed suffered only two moderate droughts in a span of eight years. It is evident that there is a correlation between meteorological and moderate droughts.
0
100
200
300
400
500
600
700
Agriculture Moderate Drought
2002-03 0 563
2006-07 0 619
July Yearly rainfall
Graph 5g: Moderate Drought Years
5.4 Runoff Estimation Runoff Estimation is required for the design of soil and water conservation structures. Quantitative estimation of runoff is the prerequisite of any design. Runoff may be defined as the portion of the precipitation that makes its way towards streams, channels, lakes or oceans as surface or sub-surface runoff. Surface runoff includes only that portion of water which flows over the surface and reaches the

- 21 -
Yearwise Ruoff Days (Rainfall morethan 20 mm in a Day)
0
20
40
60
80
100
120
140
11/2
/200
8
25/3
/200
8
21/4
/200
7
29/5
/200
5
7/6/
2007
16/6
/200
6
3/7/
2004
15/7
/200
5
1/8/
2007
20/8
/200
6
24/8
/200
7
29/8
/200
5
4/9/
2004
6/9/
2004
7/9/
2005
14/9
/200
6
15/9
/200
6
17/9
/200
7
20/9
/200
4
12/1
0/20
05
20/1
0/20
05
24/1
0/20
04
28/1
0/20
07
29/1
0/20
07
3/11
/200
5
11/3
/200
6
12/1
2/20
06
Date
Rain
fall
(mm
)
natural channel or stream. Soil conservationists are largely concerned with surface runoff for small watersheds. The precipitation reaching the land surface starts infiltrating into the soil. Runoff occurs only when the rate of precipitation, i.e. its intensity, exceeds the rate of infiltration. Once the infiltration rate exceeds, water begins to fill the surface depressions which is called surface or depression storage. After the depressions are filled, water starts flowing over the land as overland flow. Simple runoff estimation computed through analysis of rainfall days with more than 20 mm in a day. The following graph shows the details of runoff days in study area
Graph 5h: Year wise Runoff Days
It is estimated that the average runoff days (Day with more than 20 mm Rainfall) from 2000 to 2009 in Gudisivaripalli micro watershed was 12.87 with average rainfall per day around 40.43 mm. According to this calculation it is estimated that after the deductions of evaporation, soil moisture and other losses, the total runoff component is 20.43 mm / day for 12.87 days. Finally it is estimated that the total runoff is 261.88 mm per year. This is equivalent to 37 lakh m3 per 967 Hectares of area. Hence, it is possible to store 37 lakh m3 of water through recharge and harvesting structures in this area. This is equivalent to 24.72 % of the total rainfall in 2008-2009. If it is assumed that 25% of water recharges into groundwater, then approximately 10, 0000 m3 of water adds into groundwater every year through recharge.

- 22 -
CHAPTER VI Geomorphology
Importance of the Geomorphology The study of the drainage pattern and its characteristics is called as Geomorphology and it is a very useful tool for analyzing the nature of the soil and hydro geological characteristics of the study area. Geomorphological analysis reveal the nature of contributing surfaces, both the surface drainage as wells as the infiltration component (Kulkarni, 1991). Moreover, during the study, it was thought that drainage analysis would help reveal the nature of water flow in a regime, where there are permeable soils above the relatively impermeable rocks and the information about tectonic controls on the area. Entire drainage pattern was mapped by using the GIS software by using the SOI topo-sheet with a scale of 1: 50,000. Drainage lines are narrow but shallow in depth. In the lower reaches of higher order streams, the drainage lines which are wide, appear to be structurally controlled or following the lineaments. But most of the drainage lines in lower reaches turn shallow, due to siltation and vegetative growth. These drainage lines are mapped by the intensive field investigation. However, some of the changes may occur due to the land-use pattern, encroachments of farmlands and common lands (uncultivated / drainage lines). 6.1 Geomorphology With a view to correlate between the geomorphometry of the study area and the hydrological - hydro geological controls in the Gudisivaripalli, detailed drainage analysis was carried out for the mapped drainage network. According to the geomorphological characteristics, this area comes under 5th order drainage basin.
Figure 6a: Geomorphological Map

- 23 -
It gradually slopes towards the west, the regional slope being towards the west from north and east, with elevations are in the range of 960 to 730 m above mean sea level.
6.2 Drainage Pattern The regional drainage pattern is sub dendritic in nature. The drainage usually follows the local topographical trend (slope) from north and east to west. There is one 5th order stream that collects the entire water from the east and north. Most of the second order streams feed into tanks. There are some seven tanks in this study area. 6.3 Drainage analysis The detailed drainage analysis was done in Gudisivaripalli study area considering the length, number and area characteristics and is depicted in below tables.
Table 6a: Drainage characteristics -I
(Order and Length analyses of sub-basins)
Stream Order
Number of Streams (N)
Bifurcation Ratio (Bf)
Total Stream Length (L) (Km)
Average Stream Length (AvgL)(L/N)
Length ratio (lower order AvgL/high order AvgL)
1 12 6 6.18 0.515
2 2 2 1.17 0.585 0.88034
3 1 1 3.33 3.33 0.17567
5 1 1.46 1.46 0.43843
Table 6b: Drainage characteristics - II
(Area and Drainage ratio analyses)
Total No. of streams (N)
Basin area A (Km2)
Total length of streams (L) (Km2)
Drainage density Dd = L/A (Km/Km2)
Constant of channel maintenance (1/Dd) (Km2 for 1 Km)
Stream frequency F=N/A (per Km2
16 7.12 12.14 1.705056 0.5864909 2.2471910
Bifurcation Ratio Ratio is more than 5 in first order streams in Gudisivaripalli clearly indicating that there is structural control along these streams. So it is very helpful to construct water conservation measures along these streams to recharge water into deeper aquifer system. Except first order remaining streams there is no structural control. Remaining two watersheds the average bifurcation ratio indicates that there is no structural control in three areas.

- 24 -
Drainage Density The drainage density of the study area confirms to drainage morphometry and geohydrological conditions are suitable for better surface permeability. Gudisivaripalli micro watershed has relatively good drainage density. In all areas it is confirmed that there is more possibility for recharge conditions but the occurrence of dykes and other hydrogeological characteristics indicating that the permeabilities are more in Gudisivaripalli. Constant of Channel Maintenance The constant of channel maintenance suggests that about 59, 38 and 34 hectares of catchment area is required to support a 1 km long stream in three areas, it indicates that the basin requires small areas to maintain a unit stream length and hence the hydraulic conductivity of the basins is slightly high.

- 25 -
CHAPTER VII Hydrogeology
This is the science which deals the relationship of the water with rocks. Understanding the hydrogeology is important prior to initiating the water shed development projects. It is very helpful in understanding the occurrence and distribution of the groundwater and its movement in hydro geological regime. It is also very helpful in estimating the surface and groundwater resources and their relationship with meteorological parameters.
Gudisivaripalli micro watershed study area falls under moderate to good rainfall zone with average rainfall of 750 mm. In the study area, the runoff component is reported to be a small component when compared to the water balance of ten years because the drainage density is poor due to the permeable nature of the top soil and the underlying weathered mantle. In order to understand the hydro geological regime in the study area, about 40 wells (bore + dug) in Gudisivaripalli micro watershed was considered for the well inventory, from the year 2004. Water level indicator was used for regular water level measurements in all the seasons. The data of water harvesting structures was also collected in order to understand the impact on local groundwater system.The detailed groundwater system in the study area is explained below 7.1 Regional Ground Water System The study area is underlain by granite gneisses and schists of Archaean age. The primary physical framework is provided by Archaean crystalline rocks include granites, gneisses. The ground water in these formations occurs in the weathered and fractured zones. These rock types do not posses primary porosity. Due to fractured and weathering, they have developed secondary porosity often giving rise to potential aquifers at depth. Due to the lower hydrogeological significance the groundwater potential of this area depends on soil properties, degree of weathering of parent rock and intensity of lineaments. Hydrogeological mapping of the study area was conducted through intensive field inventories to delineate the groundwater system and its characteristics. 7.2 Ground Water System in the watershed The geological configuration of the entire study area is made up of gneisses, younger crystallines with structural elements such as fractured pegmatites and jointed dykes. All these elements form components of a complex groundwater system in this area. The groundwater system in the study area is shallow and deep, formed out of the openings attributed by the foliations and fractures in the gneisses. The arrangement of grains and their uneven shape of the rocks in the study area make them hydro-geologically insignificant with less storage capacity and transmissivity. Primary porosity is almost negligible in rocks such as granites and gneisses in the study area. The secondary porosity occurs in the form of secondary

- 26 -
structures like joints, fractures and fissures in rocks. The open wells are limited in number and their contribution is negligible to the irrigation, due to the less yield and they go dry in early summer months. The depth of open wells range from 6 to 12 m below ground level. Most of the open wells are overflowing in monsoon but may go dry in early summer. According to the rainfall analysis, this area is in moderate to good rainfall zone with average rainfall of 750 mm. However, the local geology controls the groundwater contribution from the rainfall but runoff component is reported to be a small component because the drainage density is poor due to the permeable nature of the top soil and the underlying weathered mantle. In order to understand the Hydrogeological regime in the study area, well inventory conducted for 175 wells (bore + dug) and water level information collected in the early pre monsoon periods (Feb 09) to understand the water table trend. The depth variation of the bore wells between 50-227 m indicates the horizontal and vertical openings in the gneissic rocks forming the confined aquifers in this area. 7.2.1 Occurrences and behavior of Ground water The Ground water occurs under phreatic and confined conditions. There are two dyke exposures in this area.
Plate 7a: Hydrogeological Map of Gudisivaripalli

- 27 -
7.2 Regional Ground Water System Ground water systems are a result of the complex combination of different lithological types within the area, that together constitute a realm, within which groundwater accumulates and moves. The geological and climatic features mainly control the movement and occurrence of the groundwater in this area. The groundwater system in the study areas is shallow and deep, formed out of the openings attributed by the foliations and fractures in the gneisses. Shallow (unconfined) aquifer in the soil and weathered mantle along the basal periphery of hillocks and mounds were observed to be present in the area. The open wells in Gudisivaripalli micro watershed is very limited in number and their contribution is negligible to the irrigation, due to the less yield even during the monsoon and they go dry in early summer months. The average depth of the open wells is about 3 to 12m. Groundwater occurs in deep seated structurally weaker zones like joints and fractures and the contact zones between secondary intrusions (dykes and pegmatite veins) and host rocks. The openness of foliation in the gneisses is developed along such zones. The depth variation between 50-230m in both areas indicate the horizontal and vertical openings in the gneissic rocks along some preferred orientations, forming the confined aquifers in some locals, aquifers that provide sufficient yield to the bore wells, even in summer. The aquifer system in the area is classified, based on their occurrence in various depths and their behavior with regard to the recharging conditions. The following table shows the exposure of aquifers in the study area.
Table 7a: Depth wise Aquifer Classification
Aquifer Depth (m) Aquifer Type Aquifer Depth (m) Aquifer Type
1st Aquifer 18 Unconfined 3rd Aquifer 85 Confined
2nd Aquifer 30 Unconfined 4th Aquifer 97 Confined
3rd Aquifer 48 Unconfined 5th Aquifer 121 Confined
1st Aquifer 55 Confined 6th Aquifer 180 Confined
2nd Aquifer 73 Confined
This classification is carried out based on the information of water struck during the drilling and water level fluctuations and their response to recharge. Recent drilling data reveals that the water first struck was at a depth of 18-20 m. Weathered and fractured zone extended up to 50 meters, and contributes to the water to the well

- 28 -
from unconfined aquifer system The confined aquifer system starts at a depth of 55-60 meters, with major fractures. However, the fracture system differs from zone to zone. The wells located within the zone of confining system responds late to recharge and the water level fluctuations goes further deep. The average thickness of the unconfined aquifer system is around 40 meters and confined aquifer system is around 100 meters (according to the maximum depth of bore well). The table above indicates that the unconfined groundwater system occurs in horizontal to sub horizontal fractures. This was confirmed by the observing the sound of water flow in the gaps of the bore well and the partial reflection of the water level indicator when it contacts with the gap during the water level monitoring. This clearly indicates that few bore wells are interconnected through this local horizontal joint system. But this interconnectivity is on a limited scale. Delineation of the interconnected fractures may be very helpful in selecting those wells for constructing the direct and induced recharge methods. At times, confined aquifer system getting water from these interconnected fractures from shallow depths and giving the aquifer makes them temporarily unconfined.
The conceptual model of the groundwater system in the study area is quite similar to the regional hydro geological model proposed for crystalline and metamorphic rocks formed by colluvial and fluvial erosion of the fractured bed rock aquifer (Taylor and Howard, 2000). Athavale and Rangarajan (1988) estimate a recharge range of 1.2 to 13.3% of the annual rainfall for crystalline aquifers from south India, the most likely recharge for Gudisivaripalli micro watershed can be assumed to be within 12% of annual rainfall because the degree of weathering and fracturing is high.

- 29 -
CHAPTER-VIII Water Level Analysis
8.1 Water Level Analysis in Gudisivaripalli Ground water levels are monitored from a network of 52 wells but only 14 wells are considered for long term monitoring. Observation wells including few dug wells covering almost all habitations from the study area. Depths to water level during early (March) and peak (June) pre-monsoon periods range from 4m to 42 m bgl. The average static water level from this area is around 13.67m, highest values are recorded in Kunditivaripalli around 22.4 m and lowest in Gudisivaripalli about 10.19m. Habitation wise average depth to water levels shown in the following table. Given below table is showing the habitation wise well inventory data.
Table 8a: Well Inventory data
Well_ID SWL_Mar SWL_Jun Well_T Total_D Casing Habitation_Name
KDVP2 22.9 40.23 BW 106 6 Kundutivaripalle
KDVP5 31.6 32.45 BW 91 3 Kundutivaripalle
KDVP10 16.7 18.17 BW 136 8 Kundutivaripalle
KDVP11 42.5 24.58 BW 197 12 Kundutivaripalle
SKVP5 15.4 15.96 BW 55 18 Sanakamvaripalle
YVP7 9.7 12.2 BW 121 18 Yerramvaripalle
YVP9 4 10.82 OW 9 0 Yerramvaripalle
YVP13 dry dry OW 12 0 Yerramvaripalle
UP5 16.9 17.93 BW 182 20 Upparpalli
GDVP1 5.2 7.58 BW 152 9 Gudisivaripalli
GDVP2 8.76 9.98 BW 167 14 Gudisivaripalli
GDVP3 14.9 21.16 BW 152 12 Gudisivaripalli
GDVP7 8.12 9.06 BW 182 15 Gudisivaripalli
GDVP8 6.3 6.46 OW 12 Gudisivaripalli

- 30 -
Habitation wise Water Level Analysis in Gudisivaripalle Watershed
0
5
10
15
20
25
30
35
Kundutivaripalle Sanakamvaripalle Yerramvaripalle Upparpalle Gudisivaripalle
Habitation
Wat
erle
vel (
m)
SWL_Mar SWL_Jun
Waterlevel Fluctuation(Mar-Jun)in Gudisivaripalle
-20
-15
-10
-5
0
5
10
15
20
KDVP2 KDVP5 KDVP10 KDVP11 SKVP5 YVP7 YVP9 YVP13 UP5 GDVP1 GDVP2 GDVP3 GDVP7 GDVP8
Well ID
Wat
erle
vel(
mt)
Graph 8a: Habitation wise Static Water Levels (m)
Graph 8b: Water Level Analysis
The above graph indicating that the water level decline is more in Yerramvaripalle, where the groundwater dependency is more on shallow unconfined aquifer system.
Most of open wells are located in Yerramvaripalle and contributing to Kharif irrigation.

- 31 -
CHAPTER IX Water Resources Estimation
Water Resources Estimation Considering the rainfall data over the study area and other data like recharge & discharge, baseflow and other geohydrological parameters the ground water resource estimation has been made for these two study areas. Analyzing all these data in the most suitable methods suggested by CGWB are “Rainfall infiltration method” in the MS-Excel the above calculation has been done. Rainfall is the major dependant source in the study area due to the complex hydrogeological system contains few fracture and joint systems which does not contains much storativity and transmissivity. In this study only one method “Rainfall Infiltration method was used due to the lack of water level data for three seasons. This method is explained briefly in the below table. (The methods and formulas for groundwater resources estimation for both study areas taken from the manual of Dynamic Groundwater Resources of India by Central Groundwater Board 2006 with courtesy). 9.1 Water Resources Estimation through Rainfall Infiltration Method: The average rainfall is around 730mm / year. In 2006 - 2007 there was less rain fall occurred. This entire calculation has done for the year of 2006-2007 because of the availability of crop data. There are about 10 tanks in this area. This year there were filled partially. So the surface source for irrigation is limited or negligible. Rrf = f X A X Rainfall The infiltration factor has been considered as 12% of rainfall due to the shallow and massive crystalline basement with uneven distribution of fracture system and limited thickness of weathered mantle. Total Tank area is in this study area is 46.6 Hectares and the average depth is around 2.5mt. Around 20 % of the total storage has taken as recharge from the surface storage in monsoon season due to the siltation of the tanks by clayey material. The following tables show the water resources estimation from the study area
Table 9a: Monsoon Recharge due to the Precipitation (June-September)
Monsoon Precipitation (mm)
(Jun-Sep)
Total
Area (Hec
t)
Volume of Monsoon
Rainfall
(Cub mt)
Recharge
Factor (%)
Monso
on Rechar
ge (cubic
mt)
Total Tank
Area(Hect)
Total Surface
Storage(Cub.mt)
Recharge from Surface Storage (Cub mt)
Total Monsoon Recharge (Cub mt)
475.4 764 36320
56 12435846
.72 16 320000 64000 499846.
72

- 32 -
Table 9b: Non Monsoon Recharge due to the Precipitation (June-September)
Non-Monsoon
Precipitation (mm)
(Oct-May) Ppt (m)
Total Area
(Hect) Total
Area (m2)
Volume of Non-
Monsoon Rainfall (Cub mt)
Recharge Factor (%)
Non-Monsoon Recharge (cubic mt)
237.7 0.237
7 764 7640000 1816028 12 217923.36
Table 9c: Monsoon Water Budget (June-September)
Year
Total Moosoon Recharge (cubic mt)
Total Monsoon Discharge (Cub mt)
Irrigation Return Flow
(Cub mt)
Water Requireme
nt (Domestic
+Cattle)
Area's Monsoon
Water Requirement (Cub mt)
Monsoon Shortage / Surplus (Cub mt)
2009-10 499846.72 274752 68688 9019 283771 284764
Table 9d: NON - MONSOON WATER BUDGET (October - November)
Non-Moosoon Recharge (cubic mt)
Non-Monsoon Discharge (Cub mt)
Irrigation
Return Flow (Cub mt)
Water Requirement (Domestic+Cattle)
Area's Non-
Monsoon Water
Requirement
(Cub mt)
Natural Discharge (Non-Monsoon) (5%) (Cub mt)
Net Non-Monsoon Groundwater Availability
Non Monsoon Shortage / Surplus (Cub mt)
217923.36 669708 167427 18187 687895 19267.518366082.84
2
-321812.1
58
Table9e: Water Resource Estimation and Water Budgeting (2009 - 2010)
Net Monsoon Groundwater Availability (Cub mt)
Net Non-Monsoon Groundwater Availability (Cub mt)
Annual Replenishable Resources (Cub mt)
Net Groundwater Availability (Cub mt)
Area's Non-Monsoon Water Requirement (Cub mt)
Area's Total Water
Requirement
Monsoo+Non-
Monsoon (Cub
mt)
Annual Groundwater Draft (Cub mt)
Shortage / Surplus (Cub mt)
Stage of Groundwater Development
568535 366082.84
2 934617
.842 934617
.842 687895 971666 971666
-3704
8.158 104

- 33 -
9.2 Demand for Water in both watersheds The water demand estimated from all sources i.e. domestic, livestock, pumping. 9.2.1 Domestic Water Demand: Water Consumption per capita around 48 lit in Rural Areas (According to House Hold Survey done by FES)
Table 9f: Domestic Water Demand from Gudisivaripalli micro watershed Study Area
Total Populatio
n
Total Population Consumption
Cub mt/Day
Monsoon Requirement (Cub mt/year)
Monsoon Requirement Livestock (Cu mt/Year)
Non-Monsoon (Cub mt/year)
Total Population Consumption Cub.mt/Year
1361 65328 65 7905 1114 15940 23845
Total water demand from Population for a year is around 23845 m3 in the watershed. 9.2.2 Water Demand from Livestock: The demand for livestock calculated by the house hold survey by FES. According to this survey it is concluded that the following is the demand from each livestock unit.
Table 9g: Water Usage in liters/Day per unit
Water Usage per Cow 35 liters Water Usage per Buffalo 30 liters Water Usage per Ox 35 liters Water Usage per Sheep 1.5 liters Water Usage per Goat 1.5 liters
Table 9h: Water Requirement for Livestock / Day
Total Water Consumption (Cow)
Total Water Consumption (OX)
Total Water Consumption (Buffalo)
Total Water Consumption (Sheep)
Total Water Consumption (Goat)
Total Livestock Consumption Lit/Day
Total Livestock Consumption cm/Day
Monsoon Requirement (Cu mt/Year)
Non-Monsoon Requiremen (Cub mt/Yeart
Total Livestock Requirement per Year
7980 0 98 1010 122 9209 9 1114 2247 3361
Total water demand from livestock for a year is around 3361m3in Gudisivaripalle watershed

- 34 -
9.2.3 Water Demand Due to the Pumping: The total groundwater draft estimated from pumping demand. The average specific yield calculated by the discharge measurement during pumping. The specific yield from this area is 2.3 liters / second. The average pumping hours from this area is 9 hours due to the current availability in Karnataka. Total pumping days considered as 270 days/ Year including monsoon pumping. The total Pumping Demand summarized in below table.
Table 9i: Monsoon Bore well Discharge (June-September)
Total Area (Ha)
No of Pumps (BW+O
W) Pumping Days
Pumping Hours
Daily
Pumping Hours Yearly
Average Specific
Yield (Lit/Min)
Average Specific
Yield (Lit/Hour)
Monsoon Discharg
e
764 53 80 6 480 180 10800 274752
Table 9j: Non Monsoon Bore well Discharge (June-September) Tota
l Are
a (Ha)
No of Pumps (BW)
Pumping
Days
Pumping Hours
Daily
Pumping
Hours Yearly
Average Specific
Yield (Lit/Min)
Average Specific
Yield (Lit/Hour)
Non-Monsoon Discharge
764 53 195 6 1170 180 10800 669708

- 35 -
CHAPTER X Conceptual Hydro Geological Model for the Study Area
10.1 Supply, Demand and Groundwater Budget The present groundwater scenario in the watershed is little grim due to the over exploitation with high capacity bore wells. The well density is around 5 per sq km with 50 bore wells and the present depth of the aquifer is around 175 meters in some areas. The tables and the graphs given below indicate the Demand & supply and groundwater balance in this area.
Table 10a: Supply, Demand and Groundwater Balance Net Available Groundwater (Cub mt)
Annual Groundwater Draft (Cub mt)
Safe Extraction (70% of Net Annual Recharge) (Cub mt)
Stage of Groundwater Development
934618 971666 654232 104
0
200000
400000
600000
800000
1000000
Ground water scenario in Gudisivaripalle MWS
Series1 934618 971666 654232
Net Available Groundwater
Annual Groundwater
Safe Extraction (70% of Net
Graph 10a : Recharge, Discharge & Ground water balance
Table 10b: Storage Level Rise / Fall in Gudisivaripalli micro watershed
Net Available Groundwater (Cub mt)
Annual Groundwater Draft (Cub mt)
Safe Extraction (70% of Net Annual Recharge) (Cub mt)
Shortage / Surplus
Project Area (Sq.Mt)
Storage Level Rise / Fall (Cm)
890861 971666 623603 -80805 7120000 -1.13
The water level is going down approximately 1.13 cm per year in Gudisivaripalli micro watershed.
- 36 -
CHAPTER XI Conclusions
The detailed water study and stage of groundwater development in study area reveals that this area suffering from groundwater over abstraction problem. The functioning of the groundwater system occurs within the physical framework largely controlled by the geological set-up of the Gneissic Granites with Secondary Intrusions like Dykes. The salient features of the groundwater system behaviour are listed below, based on the water level data collected both areas. Following conclusions and comparisons observed after the detail study. 1. Surface flow or monsoon runoff, though not observed is bound to be limited to a
few days, where the entire drainage network is concerned. 2. The extension area of the study area is 520 Hectares. 3. Geologically study area is consists with Gneissic Granites. 4. Dolerite and Gabbroic Dykes play a crucial role in controlling the local
hydrogeological regimes and separates the study area into different sub hydrogeological units.
5. The area for recharge potential is more in the study area. 6. Highest well density with 52 Bore wells yielding water in Gudisivaripalli is very
high. 7. The lower portion of the watersheds, especially the downstream areas carry
some water during the non-monsoon period. This is essentially groundwater discharges observed as “base flow” in the stream channel. An almost non perennial base flow component clearly indicates deepening of the zone of saturation in both watersheds and geological control on local groundwater regime.
8. Soil permeability on the whole is moderate due to the presence of fragmentary material mixed with top soil on the upland plateaux and slopes. In valleys and tank bed areas it is low, but is offset by a less porosity of the soils in the red, clayey soils.
9. According to the soil condition, Gudisivaripalli is more or less permeable with low drainage density and frequency.
10. The depth of Static Water Level is deeper in Gudisivaripalli particularly in peak pre monsoon season and directly affects the Specific Yield.
11. Abstraction (pumping) from the groundwater system is more in the study area. 12. Groundwater Demand per capita in Gudisivaripalli is around 987636 Cubic
Meters and the supply from aquifer is around 890861 cub mts.

- 37 -
CHAPTER XII Recommendation and Scope for Future work
12.1 Strategy for optimization of water resources From watershed development to watershed management After the analysis in the water study area it is concluded that the demand is more against supply in Gudisivaripalli watershed which necessitates the need to club ‘water management’ simultaneously with watershed development activities such as soil moisture conservation. Initially, inputs are required in planning the water resources development and its implementation, based on the recommendations given in this report. Subsequently, and more significantly, an attempt of optimization of the water resources in both areas for a more long-term is required with sustained endeavors in this area. Based on the geometry and functioning of the groundwater system in the area it is divided into four distinct sub zones. These zones are characterized in Table 12a.
Table 12a: Characterization of hydrological zones in the study area Zone Physiograph
y Lithology / Geology
Hydrogeology Suitability
Zone A (Leather Brown) Runoff zone
Steep slopes Covered by jointed younger granites with very thin gravelly soil cover
Highly runoff zone. Seasonal flows and dry in summer. Thin vegetative cover, but thick in slopes. Almost forest land.
Suitable for soil conservation activities like gully plugs, earthen bunds etc.,
Zone B (Big Sky Blue)
Moderate slopes
Mostly covered by fractured & jointed Younger Granites with thick gravelly to sandy soil
Upper reaches; Seasonal flow of water; streams run dry within a few months from the monsoon. Zone of water table fluctuation. Specific yield likely to be moderate. Transmissivity could be high locally on account of hydraulic conductivity attributed by weathering and fracturing, especially in portions along stream lines
Suitable for recharge through percolation tanks, farm ponds and restoration of existing structures.
Zone C (Berly Green) Moderate to Low Recharge Zone
Intermediate zone with small plateaux and slopes towards stream
Underlined by Gneissic Basement with thick loamy soil bed.
This is also seasonal. Relatively medium specific yield but forming semi confined to confined aquifer system with deeper fracture zones in gneissic rocks.
Portion for construction / use of small structures for recharge and storage also.

- 38 -
channels Zone C (Autunite Yellow) Low Recharge Zone
Higher order Streams and adjoining terraces of farmland
Lower part of each sub hydrogeological unit with thick clay bed.
Middle to lower reaches; no base flow after monsoon period.
Scope for harvesting water deepening of existing open wells if any.
However, one should remember, that water resources management to be effective and sustainable, should be in tune with the project objectives of watershed development. The best option, therefore, is to establish a methodology of water use that is systematic enough to consider the specific hydrogeological characteristics. Based on the present investigation for longer time and the conclusions drawn, a broad strategy is being suggested as an attempt towards effective water resources development and management. Below figures depicts the broad strategy suggested for enhancement of water resources and their sustainable management for the study area. The following map gives the recommendations in study area.
Fig 12b: Recommendation Map of Gudisivaripalle Study Area

- 39 -
12.2 Recommendations for enhancement of Groundwater Resources in both study areas: 1. There is need to conserve the soil from erosion in the zone-A due to the steep slope. The elevation ranges from 1020 mts to 690 mts. Suitable for soil moisture activities like trenches, gully plugs and rock filled dams on first order streams. Underlined by fractured gneissic basement, encourage the slow infiltration into perched aquifer system temporarily and protects the moisture and supports vegetation. 2. The upper slopes and middle portions of the study areas would be most suitable for Farm pond treatment and it could be intensified in this region along the pegmatite and dyke zones. The rationale of farm pond numbers is presented in the box below.
Density of Farm Ponds How many farm ponds suitable for both study areas for conservation of water? The general measurement of farm ponds of 10m x 10m x 2m The total storage volume in each farm pond = 200 m3 Effective volume may be safely considered as 175 m3 Now for a model of 1:1 (1 farm pond per hectare of land, the effective storage works out to about 18mm.)
Application of above concept to the two watersheds Considering an optimum recharge of 12% of normal rainfall for the gneisses, the recharge of groundwater can be assumed to be 84mm (average annual rainfall is 700mm) annually. Going by the bimodal rainfall pattern, there would be effectively two episodes of recharge, each of some 42mm. Therefore, it is necessary to have a mechanism for mobilizing this quantum for systematic conservation within the groundwater system in the watershed. Hence, a factor of 42/18 (one episode / effective volume of one farm pond). The factor work out to be = 2.3 It means that the optimization would be most effective with 230 farm ponds for an area of 100 hectares. 3. There is a scope for mobilizing some recharge to the groundwater system, especially within Zone B. Hence, a few feasible sites for percolation tanks may be very useful to control the runoff and supports infiltration. It is also known that there is sufficient number of existing natural tanks in the Gudisivaripalli Watershed. 4. Construction of the recharge structures particularly across the dyke and quartz vein intrusions will feed the water into deeper aquifer system. 5. Infiltration and percolation rates are very slow due to the shallow depth of gneissic basement and its compactness. Hence, the storage time of water in the structures play a vital role in recharge factor. Water stored for more than six months

- 40 -
can be effective for ground water recharge into deeper aquifer. Otherwise, the water stored in limited unconfined aquifer will serve temporarily. 6. There is a need to construct large number of recharge structures like percolation tanks, mini percolation tanks, check dams and farm ponds in this zone. The best place for water development activities is indicated in map as zone-B while considering zone-C as secondary zone. Zone-B is the best suited for recharge when compared to zone-C. Because this zone is underlined by thick gravelly and sandy soil, which contains high infiltration. 7. Each tank should have been at 2.5-3 mt depth at least in this zone, only then it is possible to enhance the ground water storage. After the construction, equitable sharing of the water is possible through community participation. 8. The unique feature of each zone in the water study area is in the form of the groundwater discharge area (Zone D). This zone is an extremely good indicator of the ‘environmental health’ of the watershed. But unfortunately there are no base flows in this zone even after monsoon. This clearly indicates the lack of the zone of saturation in shallow depth. It is imperative to maintain the base flows in this zone for long-term, water resource sustainability. 9. For the sustainable water management of this zone, it would be better to look at surface water based “water users” groups. This implies looking at older structures and the possibility of using water from these, especially for protective irrigation. Or, even the use of community wells in this zone…although the well-yields from this zone are bound to be limited, but sustainable in the long run. 10. Water harvesting for use is feasible in the lowermost reaches (Zone-D) of all zones in the study area, along the course of the drainage channel (3rd or 4th order mainstreams). For this purpose, few small structures have been suggested, the overflow of which will feed a larger structure in the further downstream. These structures will also control the flow of silt into the downstream water bodies. 12.3 Recommendations for Sustainable Water Management: In addition to the specific recommendations suggested above, there are also some general principles being provided as suggestions below, primarily to ensure sustainable use of water resources. Community based management of groundwater resources is envisaged as the next step in villages. Some of the learning’s from this report will prove to be useful in planning and implementing groundwater management in such villages. Finally, management of artificial recharge ought to involve a component of ‘better informed’ communities. Communities ought to be posed with such questions as

- 41 -
“What after watershed development and artificial recharge” during the post-project management phase. Specifically in Gudisivaripalli, communities need to be informed about the limitations of uncontrolled extraction of groundwater resources and the need for ‘increased community involvement’ in groundwater management and artificial recharge. Creating the awareness Stakeholders on their resources through Kalajathas or any other communication methods. The communities should be capacitated to undertake the estimation of water resources, as well as crop water budgeting. Installation of few Meteorological Equipments such as Rain gauges, and water level indicators for regular monitoring by the community themselves. Formation of the different institutions for surface and ground water with gender equity or strengthening the already existing institutions like Water User Associations or User Groups. Conducting exposure visits to those areas where groundwater management is being successfully practiced such as Kothakunta watershed area, and also to the area where the area is worst effected by groundwater over abstraction such as Sidlagatta. It would be better to encourage the use of shallow groundwater (usually open wells) and establish shallow aquifer systems as a sustainable source of water supply with low discharge, low capacity pumping systems (less than 3-5 hp) since they are most suitable on such wells, so as to build an automated regulatory mechanism of abstraction, which is in agreement with the hydro geological properties of the groundwater system. Discourage bore well drilling for irrigation considering long-term problems of overexploitation from hard rocks aquifers in particular. Encourage advanced irrigation techniques like Drip or Sprinkler systems and push them into less water intensive crops like Cereals (Ragi, Maize, and Bajra etc.,) or vegetables and other flowering plants against high water intensive crops like sugarcane and paddy. Encourage the community into “water sharing mechanism” since this is the better way in long term water management even during the times of drought. Optimization of water use is possible only through a conjunctive use of groundwater and surface water from a closed system. The distribution for this needs to be carefully worked out, based on the principles of local institutions that integrate water balances and community participation.

- 42 -
In order to ensure efficient working of recharge and discharge components, it would be necessary to maintain both these mechanisms through the activities such as regular, periodic de-silting of all structures, progressive increase in vegetative cover, especially along the slopes, well maintenance, continued and improved monitoring of groundwater resources etc. Communities need to be better informed in order to mitigate negative impacts and also asses how much of recharged water will actually be available for use during a season; for what purposes; and how can this be harnessed keeping in mind the objectives of a project like watershed development.

- 43 -
Present Ground Water Scenario
in
Mudimadagu Micro watershed
A Hydro-geological Study 2010

- 44 -
CHAPTER-I Introduction Water shortage and its various fall-outs have resulted in increasing application of the “Watershed Development” concept in many areas of the country and it is being increasingly sought as a means to address the problem of water crises. Besides, watershed projects also offer opportunities to address some critical socio-economic issues pertaining to the rural scenario in the country today, especially when many of these issues can be backtracked to the problems of water resources. However, watershed programmes would benefit immensely by undertaking systematic hydrogeological studies as groundwater resources form an important aspect in most of the watershed development programmes (Kulkarni, 1998). Water exists within a certain physical framework of a watershed. This framework is largely controlled by the local geological conditions. Hence, the planning of a watershed development programme will be more effective if the physical system taking the impact of the measures is understood well. 1.1 Background Foundation for Ecological Security (FES) has been working in Papagni3 River Basin through two Spearhead Teams located in Chintamani under Kolar and Chikkaballapura districts in Karnataka and Madanapalle under Chittoor district in Andhra Pradesh. The organization has been working on natural resource based projects, involving local communities and with a watershed as an approach since the year 1995. One of the characteristics of the project area is the presence of large number of traditional water bodies known as kere’s or tanks but today in a very bad state. FES has been providing valuable inputs in the working areas of watershed development, by undertaking the activities such as contour mapping, detailed hydro- geological characterization and evaluation through rapid appraisal 1.2 Context and Rationale The term ‘precipitation’ signifies all forms of water that is received by earth from the atmosphere and includes rainfall, snowfall, frost, hail etc. When one observes the rainfall pattern, the distribution is uneven and erratic in many parts of the country. This type of erratic and uneven distribution of the rainfall pattern coupled with steadily increasing demand for water due to rapid industrialization, crop diversity and also increasing demand for drinking water, in the light of relatively constant (or even decreasing) supply necessitates an efficient use of this scarce resource. It would mean encouraging the community to judiciously use their limited groundwater resources. It is in this context that FES undertook this exercise for understanding the relation between the meteorological and geological aspects in the microwatershed. Detailed
3 a tributary of Pennar River

- 45 -
study has been carried out in Mudimadugu micro watershed located in Karnataka to understand the status of both surface and ground water resources. The cropping pattern is highly dependent on the rainfall and groundwater in this area. The water level fluctuations in wells according to the rainfall pattern have been recorded in the study area in order to understand the surface and groundwater scenario and estimating groundwater balance through demand for crops, drinking and supply through rainfall and groundwater. This report is the culmination of a rather rapid mapping appraisal and was conducted as a base-level geological and hydro-geological investigation with the following objectives: (i) describe the local geological setting of the watershed area, (ii) define exactly and mapping the hydro-geological regime (iii) suggest a broad strategy for watershed development (iv) analyze nature of the meteorological and agricultural aspects with a rainfall
occurrence and agriculture perspective and (v) develop a water audit of the study area (availability & usage of water) in the
context of its geo-hydrological status. 1.2 Outcome/ Result from this Study
Generating site-specific data on the status of water resources and their use in the study area. When supplemented with data on alternative crops (less water intensive), agricultural best practices etc., the communities living in the area will be able to assess and analyse the water use patterns with respect to water availability and make informed decisions to improve the situation (regulation on bore wells, sharing the water, change in crops, priority of usage – drinking water over irrigation etc.).
Developing a methodology that could be adopted by other agencies involved
in working with communities and natural resources. Disseminating the study methodology and results among govt. and other agencies working on water resources, enabling them to take up such models in their areas of operation and also facilitates decision making on the site selection and land characterization.
1.4 Methodology
The aim of the detailed hydrological, hydro-geological and agricultural and social assessment was to undertake a systematic evaluation of the area’s local geological setting and its impact on local hydrogeological regime and recharge, discharge components, the output of the recharge, discharge and groundwater balance. The methodology used to obtain the data has been explained at the end of the chapter. The methodology of the study included following steps.

- 46 -
Data Collection: a) Primary data was collected from the field from rain gauges, Pan Evaporimeter,
water level data, measured with water level indicator and through house hold surveys.
b) Secondary Data was collected from allied sources such as Revenue and other government departments. Part of the data was also collected from other sources such as Ali Cotton’s study and IWMI study material. Topo-sheets were collected from Survey of India for preparing the base maps and study of the satellite imageries for delineating the lineaments and drainage pattern.
1.5 Data Analysis The following data was used for detailed analysis of geological, meteorological and hydrological characteristics of the study areas. Rainfall Data Assembly and Analysis: Analysis of the rainfall data4 helped to understand the impact of climate on the area. The data was analyzed in such a manner that the total rainfall per month for each year could be exactly calculated. The intensity of the rainfall has been calculated through dividing the total rainfall by the total rainy day per month.
Geological Mapping and Analysis: Study and analysis of the occurrence and distribution of the different geological formations and their relationship with surface and groundwater was carried out in order to understand the hydro-geological regime. A detailed study was conducted on secondary structural features like dykes and veins which act as natural geological barriers and their impact on the local ground water movement. GPS was used for tracking dykes and other geological features. Toposheets and Remote Sensing Satellite Imageries (IRS-1D) were used for analysis of the geology and the land use pattern. Water Level Analysis: Analysis of the water level fluctuations from the selected bore wells and open wells were carried out in order to understand the recharge and discharge criteria.
Water Resources Estimation: Rainfall infiltration method and water level fluctuation methods were used for the estimation of groundwater resources. The rainfall infiltration method is as follows.
Recharge
(i) Recharge due to precipitation = Rp (ii) Natural Recharge from lakes, streams (Influent seepages) = Rn (iii) Artificial Recharge from Canals, Reservoirs, Irrigation return flows = Ra (iv) Ground Water inflow from areas outside the basin. = Gi
4 for the period 2000-08

- 47 -
Discharge
(i) Evaporation = Et (ii) Natural Discharge by seepage & stream flow (Effluent seepages) = De (iii) Artificial Discharge due to Pumping = Do (iv) Leakage from a bottom semi confining layer = Go (v) Ground water outflow to area outside the basin = Ge (vi) Change in Groundwater Storage = ΔSg
ΔSg = (Rp + Rn + Ra + Gi) – (Et + De + Do + Go + Ge) Recharge due to ppt: Volume of the water was calculated by taking the annual rainfall from the study area multiplied by the area of the study (from the total geographical area). Forartificial recharge due to lakes and streams: Recharge due to Canals, Reservoirs, and Irrigation return flows. All the other sources are negligible except the irrigation return flows in both study areas. 25% of the discharge due to pumping has been taken as the recharge due to irrigation return flow due to the soil conditions in these areas. Ground water inflow from outside of the basin: It is also taken as negligible because of hard rock terrain and because of natural geological barriers like dykes. Evaporation: For estimating it, two Pan Evaporimeters were installed and monitored two times in a given day. Day wise data was assembled and was later analyzed on monthly basis by using formula with pan coefficient taking as 0.70. Natural Discharge from seepage & inflow: this was considered negligible for the study area, as the seepages come to the tanks & therefore recharge the ground water. This has already been calculated as the recharge from tanks. Artificial Discharge due to pumping: For discharge due to pumping. Leakage from a bottom semi-confining layer: It is negligible for this region after considering the local hydrogeology. Ground water outflow to area outside the basin: It is negligible for this region due to the natural geological setting. The Water Level Fluctuation method is as follows: Area X Specific yield X Water table rise In this Specific Yield =Sy Sy = {(Dw + Robf + Sd) – (RFw + Ig)}/ (Wld X Ae) Ground water draft by wells & direct pumping =Dw

- 48 -
Base flow =Robf Spring discharge =Sd Winter rainfall =RFw Recharge due to return flow from irrigation =Ig Average water level decline =WLd Effective area of ground water recharge =Ae Annual Groundwater Draft: For analyzing this, demand from population and livestock was considered in addition to the pumping demand. The discharge values of the 7.5 Hp pumps, which are being used in this area, were observed. The discharge measured during the pumping through 100 liters drum, is 2.3-2.5 lit per second. All the pumps are working for 6-8 hours daily. Net Groundwater Availability: is the sum of total monsoon recharge and non-monsoon recharge and deletion with 5% of non-monsoon discharge or baseflow. Stage of Groundwater Development: is computed by following formula. Annual Groundwater Draft / Net Groundwater Availability X 100 Storage Level Rise / fall: is the ratio of Surplus or Shortage to area * 100. Comparison between Water level fluctuation method and Rainfall infiltration method: the following formula is used to compare both methods and finally the water level fluctuation method considered for Mudimadugu due to best available data. (A-B)/B) * 100 = P.D where P.D is the percentage deviation A is the recharge by water level fluctuation method B is the recharge by rainfall infiltration method Depend upon the value of P.D. the recharge value finalized. If P.D is between +20% and -20% than A is the recharge If P.D. is > -20 % = 0.8 * B taken as recharge If P.D. is < 20 % = 1.2 * B taken as recharge GIS Mapping Advanced software like Geographical Information System was used for generating the maps and analysis of the data and output. Different maps like Geological, Hydrogeological, Soil and Recommendations were prepared.

- 49 -
CHAPTER-II Location & Topography
2.1 Location Mudimadugu micro watershed is part of Mudimadagu Grama Panchayat which is a part of Srinivaspur Taluk in Kolar district. It lies in agro-climatic zone with semi-arid type of climate with dryness in major part of the year. The area taken up for the purpose of the study is situated on the border of Andhra Pradesh and Karnataka state, where rainfall vagaries and a large-scale over abstraction of groundwater have plagued villages for the last ten years. Twenty two villages5 form part of the Mudimadagu Grama Panchayat. However, only four revenue6 villages form part of the micro watershed.
Latitude of the area varies from 13˚ 32΄ 30΄΄ to 13˚35΄ 15.5΄΄ and longitude 78˚ 20΄ 22΄΄ to 78˚ 23΄ 30΄΄ falling in Survey of India Top sheet numbered 47K/6. The extension of the study area is around 1433 Hectares. It is located at the foot hills of Peddakonda and Eswarmala ridges located in the east and north and other small mounds and hillocks in the west forming the catchment for this area.
5Mudimadagu, Chikkevaripalli, Chintamanipalli, Bodireddypalli, Ooramadigapalli, M. Vyapalapalli,
Malamotakapalli, Anepalli, M. Thummalapalli, Devannagaripalle, Pathurgadda, M. Kothur, Balevaripalle, Bonepalle, Dombarapalli, Guntapalli, Kothpalli, Maramkindapalli, Hakki Pikki Colony, Bagalghatta
6 Malamotakapalli, Mudimadagu, Anepalli and M. Vyapalpalli

- 50 -
Mudimadagu is located about 30 km from Kolar district headquarters and 20km from Srinivaspur Taluk. It can be best approached by the Madanapalle - Bangalore road that passes through Chintamani and Rayalpadu, the nearest small town. 2.2 Topography The topography of the area is undulating with ridges on three sides. Entire drainage flow is towards the south from west, north east and south east. Average annual rainfall of this area is 730mm. Rainfall occurs over a period between June and October, although rain spells in April and November are not uncommon. But the rainfall pattern occurs in two episodes of Monsoon (June-September) and Non-Monsoon (October-May). The mean average temperature in this area is 300C. The mean average elevation of the watershed is 730 m above msl. The highest elevation in the watershed is 1376 m above msl, while the lowest elevation is 670 m above msl.

- 51 -
CHAPTER III Geology
Prior to initiating a watershed program in a given area, it is essential to study the local geological characters based on rock formations, soil parameters and natural geological controls and its hydrogeological connectivity of the area. It is very crucial in land characterization, particularly suitability of land for watershed activities like water resources development, soil moisture conservation and livestock enhancement. Site with shallow hard rock basement or thick clay soil is suitable for constructing the harvesting structures. Sites with deep hard rock basement or hard rock with intensive fractures, highly weathered and thick gravelly or sandy soil are suitable for constructing the recharge structures like percolation tanks and farm ponds. 3.1 Regional Geology According to the geological setting of India, more than 70% of the Indian Peninsula is occupied by all varieties (igneous, metamorphic) of hard rocks. Remaining land is occupied by sedimentary and recent alluvial deposits. The present study areas forms part of southern India which is occupied by older metamorphosed Peninsular Gneisses to younger igneous formations.
The geological history of the Karnataka is largely confined to the two oldest eras – the Archaeans and Proterozoic. Hence igneous and metamorphic rocks of the Precambrian age occupy about 80% area of the state; remaining area is made of rocks belonging to the Proterozoic and Phanerozoic Eon. Tertiary rocks are exposed along the coastal regions. The gneissic basement is followed by granites, charnokites and khondalites with younger granites on top, in some area.
After the igneous episode, many rock sequences were disturbed by tectonic forces and secondary structures like fractures, folds and faults were formed. Later, these secondary structures were intruded by igneous bodies like dykes, quartz and pegmatite veins, which themselves may have been fractured subsequently. 3.2 Local Geology of the study area The main rock types in the study area are peninsular gneisses, younger gneisses and secondary intrusive like dykes and quartz, pegmatite veins. This area is a part of the regional Archean Complex having outcrops of younger granites and underlain by peninsular gneissic basement. This belt of granites can be correlated with late Archean to Proterozoic aged younger granites of Dharwar craton (Closepet Granites) (Raman and Murthy, 1997) The local geology of the area falls under Dharwar Stratigraphy. The entire study area is of hard rock terrain with secondary structural features like faults, joints and fractures. Lineaments were observed all over the watershed.

- 52 -
3.3 Detailed description of the litho profile Lithological profile plays vital role in understanding the geological nature of the area. Surface studies, exposure of the soil, rock in open wells and geological study at the hill slopes, bore well lithologs and geophysical surveys are very useful in mapping the lithoprofile of the area. According to the geophysical resistivity surveys conducted by National Geophysical Research Institute Hyderabad in different areas reveal that the following litho-profile normally occurs in southern India particularly where Archeans like granite-gneiss forms the basement rock of that area. A brief description of the rocks exposed in the study area is given below Peninsular Gneisses Granite gneisses are the important rock types in the area that belong to the Older Peninsular Gneissic Complex. It is composed of banded gneiss and gneissic granite. Being one of the oldest terrains in India, it has undergone many phases of tectonic activity and metamorphism over the years. Whole terrain has rugged and undulating topography. Therefore, the productive zones to extract ground water in these rocks (aquifer) are frequently erratic and unpredictable.. Younger Granites Texturally medium to coarse grained, porphyritic younger granites forms more or less undulating landscape with small and large hillocks and mounds in the study area. These lands are mineralogically Potash rich, leucocratic granites almost similar to underlying gneisses but less metamorphosed and are more acidic. The study area show the outcrops of grey coloured granites which are highly jointed and show the typical’ Tor Topography’ commonly shown by granites. Secondary Intrusions Dykes The entire study area is criss-crossed by numerous basic dykes forming a remarkable geological feature in the area acting as the natural barrier for the ground water in the area. Though they do not allow the groundwater movement across, but allow the groundwater movement sometimes along their walls. They are highly jointed and fractured on the surface but the degree of the joint and fracture gradually decreases with increasing in the depth. Due to the massive nature of these features in the depth, they play vital role in the movement of groundwater. The contact zones of these dykes with host rock plays vital role in downward movement and accumulation of the groundwater for deeper confined aquifers. Identification of these contact zones which are very useful for construction of recharge structures, particularly where the degree of the crushing (due to the sudden eruption of the secondary magma along the fractures of host rock) is high and is a huge task.

- 53 -
Figure 3b: Geological Map of Mudimadugu Study Area

- 54 -
CHAPTER IV Soils
Soil characteristics play vital role in understanding the geology and hydrogeology of the study area and in suitable site selection for the agriculture or cropping pattern. Soil is the weathered and disintegrated material from parent rock and its characteristics depend on the type and composition of the parent rock. The suitable site selection for water and soil conservation and enhancement of the soil moisture activities depends on the thickness, shape and its grain size. The thickness of the soil depends on the slope, degree of the weathering. On the ridges or steep slope areas, the soil layer is very thin or absent but in the slopes or downstream may extend upto 45meters. While gravelly or sandy soils allow the downward movement or infiltration and percolation of water more rapidly (200mm/hr) loamy, silty and clayey soils contain very slow infiltration or percolation rates (1.3mm/hr). Hence, soil characteristics are very important in site selection for construction of recharge and harvesting structures. 4.1 Soil Characteristic in the study area Locally four types of soils were observed to be present in the study areas. These are red gravelly, red sandy, red loamy and clayey soils. Red Gravelly Soils: Thin red gravelly soils are mainly seen along the foot hills of the granite mounds and quartz, pegmatite intrusions. This soils show presence of granite and quartz pebbles and is highly permeable in nature. Under the lower plate the red gravelly soil with thick vegetation is seen along the foot hills of the Peddakonda in Mudimadugu study area. This is the suitable soil for water recharge. But due the human activities/ interventions, the soil below which is also red gravelly soil changes to clayey soil (paddy cultivation) which is not suitable for water recharge.
{Plate 4a: showing the thick red gravelly soil in the upstream of the paddy cultivation with quartz and granite pebbles.}

- 55 -
Red sandy Soils Red sandy soils occupy the down portions of the red gravelly soils with 3-5meter in thickness. Both these soils play key role in recharging the rainwater storm or runoff which is comes from the hillocks. Some tanks are located in this zone giving sufficient yield to bore wells which are located further downstream of these tanks due to the high permeable nature of these soils. Red Loamy Soils Thick red loamy soils are dominant soils in these study areas. Their thickness varies from 5-45meters in downstream areas and form part of the regolith portion of the shallow unconfined aquifers. Most of the wells located in this zone contain sand, silt and clay in equal amounts and suitable for cultivation of sunflower, groundnut, and vegetable crops. Given below is the plate showing thick red loamy soil exposed in Malamotakapalli hamlet of Mudimadugu.
The thick black Clay soil occurring further downstream of all sub hydrogeological units in the study areas and along streams is very thick and suitable for rice cultivation. The moisture content in this zone is high due to its high water holding capacity (porosity) but
permeability is less due to its small grain size. Most of the tanks are silted by clay soils which control the groundwater recharge from tanks with less infiltration rate resulting into the high evaporation rate.
Plate 4c: showing the thick black clayey soil in the downstream portion
Plate 4b: showing the thick red loamy soil exposure with highly weathered pegmatitic material (white)

- 56 -
4.2 Agriculture & Land use Pattern in the study area
Local perceptive, from the field studies reveal that the landscape surrounding the study area, show degraded vegetation in the uplands and thick vegetation in low lying lands where soil is thick. Most of the study area is encompassed by coarse, fragmentary material mixed with soil. Land-use is in the form of rain fed mixed cropping with barren patches. Out of the total geographic area in Mudimadugu about 24% is occupied by forests, 25 % is put to agricultural irrigated land, 19% is wet land and remaining is the dry land. The economy mainly depends on agriculture. In the absence of perennial rivers, canals, tanks and due to lack of the shallow groundwater aquifer, the area depends mostly on ground water through bore well irrigation. The cropping pattern shows variation in the study area. The intensity of the cash crops like sugarcane, vegetables and mulberry is high in Mudimadugu. Paddy is the main crop in the area and groundnut is common rainfed variety with tomato. The cropping pattern and the persistence of irrigation in summer indicate the potential for over abstraction of groundwater in the Mudimadugu Panchayat. The following table shows the variation in the cropping pattern in the study area.
Table 4a: showing the variation in cropping pattern in the study area Paddy Black gram
Groundnut Millets(Ragi) Tomato Vegetables
Sugarcane Maize Onion Fodder seed
The land distribution is based on the classification of irrigation, wet and dry land. The following table shows the land details in Mudimadugu. The total area is 967 Hectares.
Table 4b: Land Particulars in Mudimadugu micro watershed
Revenue Villages Land Details (Ha)
Total Land (Ha) Irrigated Dry land
Anepalli 3.99 38.01 42 Malamotakapalli 1.7 54.3 56 Mudimadugu 17.65 323.35 341 M. Vyapalapalli 11.10 66.90 78 34.44 482.56 967

- 57 -
In Mudimadugu area, most of the tanks get filled by rains and dry up immediately after the monsoon. Hence, the ultimate source of the irrigation is bore wells only. The condition of the tanks in Mudimadugu micro watershed is in a worse condition. Most of the tanks are silted and another major problem is the growth of the hydrophytes like Ipomia that contributes to the evapo-transpiration. The following plates show the present condition of the tanks in Mudimadugu. Plate 4e shows the tank located in Malamotakapalli, situated in good recharge zone but due to the hydrophytes and human interventions such as encroachments on the supply channels turning them to paddy fields that automatically decreases the inflows and increases the siltation, resulting in high evapo-transpiration rates and less recharge. Plate no 3 shows the condition of the Balthamari Cheruvu of M. Vyapalapalle is extended in large area but has not filled with water since 12 years. Due to heavy rainfall in 2007 this tank got filled partially, but within a month it became dry due to the extensive cropping in downstream. Most of the tanks have thick sand layer with very high infiltration rate but this layer is covered by clay with thickness of 2-3meters..
{Plate 4d: showing Gollapalle Cheruvu in Kadapalareddigaripalle with vegetative cover}

- 58 -
{Plate 4g: showing Balthmari Tank most of the tank bed is encroached and sugar cane cultivation upstream of this tank.}
{Plate 4e: showing Tank in Malamotakapalli located in good recharge zone but silted and covered by Ipomia plants}

- 59 -
4.3 Demography & Livestock
Table 4c: The Habitation wise Demographic details of the Mudimadugu Panchayat.
Village
Population Total
Population Adult Children
Male Female Male Female
Anepalli 60 55 25 30 170
Malamotakapalli 53 53 12 6 124
Mudimadugu 445 497 99 106 1147
Vyapallapalli 239 221 25 29 514
Total 797 826 161 171 1955
Table 4d: Habitation wise Livestock Population in Mudimadugu
Livestock Details in Mudimadugu Panchayat
Village Cow Buffalo Ox Sheep Goat
Anepalli 71 0 12 225 75
Malamotakapalli 44 0 27 96 40
Mudimadugu 198 7 62 320 203
M. Vyapallapalli 98 2 36 275 24
Total 411 9 137 916 342

- 60 -
CHAPTER V Meteorology
5.1 Rainfall Pattern Rainfall or precipitation is the main source of water for both surface and groundwater resources. It is important to understand the rainfall characteristics and its behavior on the land in order to estimate its volume, velocity etc. Rainfall is the critical factor for the groundwater recharge (most of the aquifer systems in the study area essentially unconfined and confined). The recharge and discharge parameters depend on several factors such as soil, geology, slope, and land use etc. There is a direct relationship between the rate of infiltration and the intensity of rainfall. However, if the rainfall intensity exceeds the infiltration capacity, the forgoing relationship breaks down and may, indeed, be replaced by an inverse relationship between infiltration and rainfall intensity. This is normally the case when an increase in rainfall intensity is reflected in an increase in the size of the raindrop, and consequently with an increase in their compacting force as the drops strikes the ground surface. This micro watershed receives rain from both the North-east as well as the South-west monsoon. The total pre monsoon and post monsoon data reveal that there are periods of torrential rain and a period of drought that exists in the region. 5.2 Rainfall Analysis in Mudimadugu Study Area The rainfall data from 2000 (January) to 2009 May were collected from both secondary and primary sources. The graphs given below explain the year wise rainfall data including monsoon and non monsoon seasons and the day-wise, month wise and year wise intensity of rainfall. The average rainfall during the monsoon period is around 422.65 mm and average rainfall of non-monsoon period is 338.42 mm.

- 61 -
0
200
400
600
800
1000
1200
1400
1600
1800
Yearwise Rainfal Pattern of Mudimadugu watershed
Yearly rainfall 1213.4 1457.6 932.2 1075.8 713 1554.8 990.8 1628.2 1103.5
2000-01 2001-02 2002-03 2003-04 2004-05 2005-06 2006-07 2007-08 2008-09
Graph 5a: Year wise Rainfall Trend from 2000 to 2009.
0
100
200
300
400
500
600
Total Monsoon(June-September) Rainfall in Mudimadugu watersheds
Total Monsoon Rainfall 494.2 428 369.2 308.6 251.6 526.4 371.8 583.4 475.4
2000-01
2001-02
2002-03
2003-04
2004-05
2005-06
2006-07
2007-08
2008-09
Graph 5b: Monsoon (June-September) Rainfall Trend from 2000 to 2009.

- 62 -
0
100
200
300
400
500
600
700
Total Non Monsoon(Oct-May) Rainfall in Mudimadugu watershed
Total Non Monsoon Rainfall 225 601.6 193.8 458.6 209.8 502 247.2 461.4 152.7
2000-01
2001-02
2002-03
2003-04
2004-05
2005-06
2006-07
2007-08
2008-09
Graph 5c: Non- Monsoon (October – May) Rainfall Trend from 2000 to 2009.
0.00
20.00
40.00
60.00
80.00
100.00
120.00
140.00
160.00
Yearly Intensity of the Rainfall in Mudimadugu watershed
Rainfall Intensity (mm) 79.91 128.70 80.43 95.90 65.91 102.84 77.38 104.48 149.26
2000-01
2001-02
2002-03
2003-04
2004-05
2005-06
2006-07
2007-08
2008-09
Graph 5d: Year wise Rainfall Intensity in Mudimadugu

- 63 -
Avg. Monthly Intensity (mm)
0
20
40
60
80
100
120
140
160
180
200
Jun
e
July
Au
g
Sep Oct
No
v
Dec
Jan
Feb
Mar
ch
Ap
ril
May
Month
Rai
nfa
ll (m
m)
Avg. Monthly Intensity (mm)
Graph 5e: Month wise Rainfall Intensity in Mudimadugu
0
5
10
15
20
25
30
Daily w ise Rainfall Intensity
D aily Intensity 15.98 29.41 16.08 20.73 17.74 16.32 18.2 18.65
2000-01 2001-02 2002-03 2003-04 2004-05 2005-06 2006-07 2007-08
Graph 5f: Daily wise Intensity of the Rainfall / Year in Mudimadugu
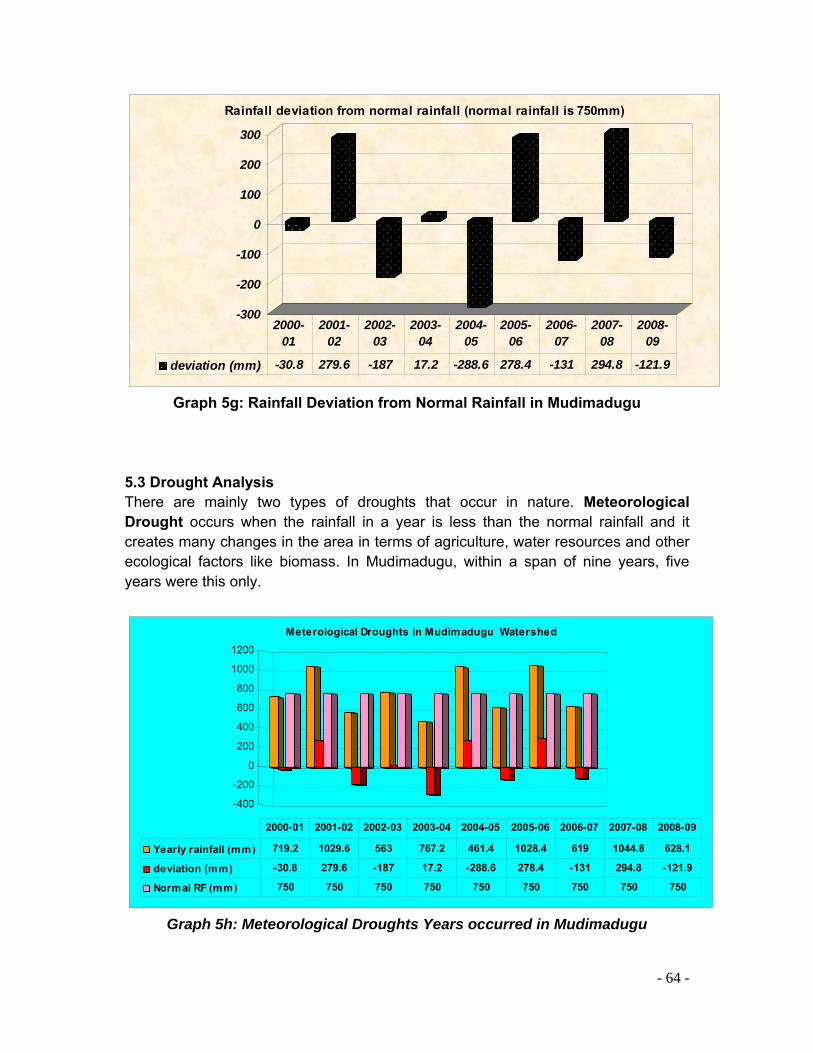
- 64 -
-300
-200
-100
0
100
200
300
Rainfall deviation from normal rainfall (normal rainfall is 750mm)
deviation (mm) -30.8 279.6 -187 17.2 -288.6 278.4 -131 294.8 -121.9
2000-01
2001-02
2002-03
2003-04
2004-05
2005-06
2006-07
2007-08
2008-09
Graph 5g: Rainfall Deviation from Normal Rainfall in Mudimadugu
5.3 Drought Analysis There are mainly two types of droughts that occur in nature. Meteorological Drought occurs when the rainfall in a year is less than the normal rainfall and it creates many changes in the area in terms of agriculture, water resources and other ecological factors like biomass. In Mudimadugu, within a span of nine years, five years were this only.
-400
-200
0
200
400
600
800
1000
1200
Meterological Droughts in Mudimadugu Watershed
Yearly rainfall (mm) 719.2 1029.6 563 767.2 461.4 1028.4 619 1044.8 628.1
deviation (mm) -30.8 279.6 -187 17.2 -288.6 278.4 -131 294.8 -121.9
Normal RF (mm) 750 750 750 750 750 750 750 750 750
2000-01 2001-02 2002-03 2003-04 2004-05 2005-06 2006-07 2007-08 2008-09
Graph 5h: Meteorological Droughts Years occurred in Mudimadugu

- 65 -
Agricultural Drought occurs in two ways. Severe drought occurs when the area gets low rainfall (below 50mm) prior to sowing crops in an area. Farmers usually undertake sowing activity after a heavy spell of rain (50mm). If it does not occur within the specified time, then the area is considered to be affected with severe drought. This analysis is carried out based on the cropping period in different areas.
Generally farmers in Mudimadugu Panchayat area, undertake sowing activities in the month of June, after receiving at least 50mm of rainfall. This is the minimum rainfall required for crops such as millets and groundnut. Otherwise it becomes difficult to cultivate these crops. Monsoon in this area begins in the month of May. In this background, rainfall data in the month of June in a year is used to assess severe drought. The data is plotted in excel sheet that clearly indicates the period of drought that the area faced for seven years. This clearly indicates that there is no relation between meteorological and moderate droughts because, heavy rainfall occurred in this area, during the year, but it experienced a severe drought.
0
500
1000
1500
Agriculture Severe Drought
2001-02 0 44.4 1457.6
June July Yearly rainfall
Graph 5i: Agricultural Severe Droughts Years occurred in Mudimadugu

- 66 -
Moderate drought is another way of agricultural drought that occurs in the absence of good rain within 35-40 days after sowing. This data given below, which is plotted on graph shows that Mudimadugu suffered only two moderate droughts in a span of eight years. It is evident that there is a correlation between meteorological and moderate droughts.
0
100
200
300
400
500
600
700
Agriculture Moderate Drought
2002-03 0 563
2006-07 0 619
July Yearly rainfall
Graph 5j: Moderate Drought Years occurred in Mudimadugu.
The precipitation reaching the land surface starts infiltrating into the soil. Runoff occurs only when the rate of precipitation, i.e. its intensity, exceeds the rate of infiltration. Once the infiltration rate exceeds, water begins to fill the surface depressions which is called surface or depression storage. After the depressions are filled, water starts flowing over the land as overland flow. Simple runoff estimation computed through analysis of rainfall days with more than 20 mm in a day. The following graph shows the details of runoff days in study area
Yearwise Ruoff Days (Rainfall morethan 20 mm in a Day)
0
20
40
60
80
100
120
140
11/2
/200
8
25/3
/200
8
21/4
/200
7
29/5
/200
5
7/6/
2007
16/6
/200
6
3/7/
2004
15/7
/200
5
1/8/
2007
20/8
/200
6
24/8
/200
7
29/8
/200
5
4/9/
2004
6/9/
2004
7/9/
2005
14/9
/200
6
15/9
/200
6
17/9
/200
7
20/9
/200
4
12/1
0/20
05
20/1
0/20
05
24/1
0/20
04
28/1
0/20
07
29/1
0/20
07
3/11
/200
5
11/3
/200
6
12/1
2/20
06
Date
Ra
infa
ll (m
m)
Graph 5t: Year wise Runoff Days in Mudimadugu

- 67 -
5.5 Mudimadugu Runoff Estimation It is estimated that the average runoff days (Day with more than 20 mm Rainfall) from 2000 to 2009 in Mudimadugu was 12.87 with average rainfall per day around 40.43 mm. According to this calculation it is estimated that after the deductions of evaporation, soil moisture and other losses, the total runoff component is 20.43 mm / day for 12.87 days. Finally it is estimated that the total runoff is 261.88 mm per year. This is equivalent to 37 lakh m3 per 967 Hectares of area. Hence, it is possible to store 37 lakh m3 of water through recharge and harvesting structures in this area. This is equivalent to 24.72 % of the total rainfall in 2008-2009. If it is assumed that 25% of water recharges into groundwater, then approximately 10, 0000 m3 of water adds into groundwater every year through recharge.

- 68 -
Chapter VI Geomorphology
6.1 Importance of the Geomorphology The study of the drainage pattern and its characteristics is called as Geomorphology and it is a very useful tool for analyzing the nature of the soil and hydrogeological characteristics of the study area. Geomorphological analysis reveal the nature of contributing surfaces, both the surface drainage as wells as the infiltration component (Kulkarni, 1991). Moreover, during the study, it was thought that drainage analysis would help reveal the nature of water flow in a regime, where there are permeable soils above the relatively impermeable rocks and the information about tectonic controls on the area. Entire drainage pattern was mapped by using the GIS software by using the SOI topo-sheet with a scale of 1: 50,000. Drainage lines are narrow but shallow in depth. In the lower reaches of higher order streams, the drainage lines which are wide, appear to be structurally controlled or following the lineaments. But most of the drainage lines in lower reaches turn shallow, due to siltation and vegetative growth. These drainage lines are mapped by the intensive field investigation. However, some of the changes may occur due to the land-use pattern, encroachments of farmlands and common lands (uncultivated / drainage lines). 6.2 Geomorphology of the Mudimadugu With a view to correlate between the geomorphometry of the study area and the hydrological - hydrogeological controls in the Mudimadugu, detailed drainage analysis was carried out for the mapped drainage network. According to the geomorphological characteristics, the present study area comes under 4th order drainage basin. It gradually slopes towards the south, the regional slope being towards the South. With elevations in the range of 1376 to 860 m above mean sea level, the average topographic gradient in the watershed works out to just below 84 m over a length of 6.15 km (i.e. 1 : 84 or 1.19 %). However, slopes are bound to be

- 69 -
greater along the flanks of the lower side, dividing the eastern, northeastern portions of the study area, where watershed slope treatment measures would be intensive. The central and eastern parts of the area occupy plateau areas gradually sloping towards the south. 6.3 Drainage Pattern This area forms minor basin for the Papagni River. The regional drainage pattern is sub dendritic in nature. The drainage usually follows the local topographical trend (slope) from ENW to South. In the high relief zones, the underlying geology with massive crystallines and gneisses shows a distinctly dendritic drainage pattern with a higher drainage density. Further down, where the permeable soil thickness increases, the drainage density is low, although the pattern is sub-dendritic. There is one 4th order stream that collects the entire water from the basin and feeds to the Bodagundu Cheruvu at Thimmalapalle. Most of the first and second order streams feed into tanks. There are some eight minor and eight major tanks in this study area. 6.4 Drainage analysis Mudimadugu study area is a fourth order basin, with two third order sub-basins. The detailed drainage analysis was done in Mudimadugu study area considering the length, number and area characteristics. These data is provided in Table 2 (a and b).
Table 6a: Drainage characteristics of the Mudimadugu (Order and Length analyses of sub-basins)
Basin Stream Order
Number of
streams (N)
Bifurcation Ratio (Bf)
Total stream
length (km) (L)
Average stream length (km)
(AvgL)
Length ratio (lower order AvgL/high
order AvgL)
Mudimadugu
1 20 4 11.2 0.56 -
2 5 2.5 5.1 1.02 0.549 3 2 2 3.5 1.755 0.581 4 1 - 0.16 0.16 10.96
The average bifurcation ratio of this area indicates that there is no structural control in this area. But there is structural control on the first order drainage basin. Fourth order channels have the largest length ratio, indicating that they flow through areas where surface permeability is likely to be high.

- 70 -
Table 6b: Drainage characteristics of the Mudimadugu study area (Area and Drainage ratio analyses)
Basin
Total No. of
streams (N)
Basin
area A
(km2)
Total length
of streams
L (km)
Drainage
density Dd = L/A(km/km2
)
Constant of channel
maintenance (1/Dd)
(km2 for 1km)
Stream frequency
F=N/A (per km2)
Mudimadugu 28 9.67 19.97 2.06 0.48 2.89
The drainage density of the study area confirms to drainage morphometry and geohydrological conditions suitable for better surface permeabilities. Stream frequency data indicates that, on an average, 2.9 streams are required to drain an area of 100 hectares. The constant of channel maintenance suggests that about 48 hectares of catchment area is required to support a 1 km long stream.

- 71 -
Chapter VII Hydrogeology
This is the science which deals the relationship of the water with rocks. Understanding the hydrogeology is important prior to initiating the water shed development projects. It is very helpful in understanding the occurrence and distribution of the groundwater and its movement in hydrogeological regime. It is also very helpful in estimating the surface and groundwater resources and their relationship with meteorological parameters. Mudimadugu study area falls under moderate to good rainfall zone with average rainfall of 750mm. In the study area, the runoff component is reported to be a small component when compared to the water balance of ten years because the drainage density is poor due to the permeable nature of the top soil and the underlying weathered mantle. In order to understand the hydrogeological regime in the study area, about 40 wells (bore + dug) in Mudimadugu was considered for the well inventory, from the year 2004. Water level indicator was used for regular water level measurements in all the seasons. The data of water harvesting structures was also collected in order to understand the impact on local groundwater system.The detailed groundwater system in the study area is explained below. 7.2 Regional Ground Water System Ground water systems are a result of the complex combination of different lithological types within the area, that together constitute a realm, within which groundwater accumulates and moves. The geological and climatic features mainly control the movement and occurrence of the groundwater in this area. The groundwater system in the study areas is shallow and deep, formed out of the openings attributed by the foliations and fractures in the gneisses Shallow (unconfined) aquifer in the soil and weathered mantle along the basal periphery of hillocks and mounds were observed to be present in the area. The open wells in Mudimadugu is very limited in number and their contribution is negligible to the irrigation, due to the less yield even during the monsoon and they go dry in early summer months. The average depth of the open wells is about 3 to 12m. Groundwater occurs in deep seated structurally weaker zones like joints and fractures and the contact zones between secondary intrusions (dykes and pegmatite veins) and host rocks. The openness of foliation in the gneisses is developed along such zones. The depth variation between 50-230m in both areas indicate the horizontal and vertical openings in the gneissic rocks along some preferred orientations, forming the confined aquifers in some locals, aquifers that provide sufficient yield to the bore wells, even in summer. The aquifer system in the area is classified, based on their occurrence in various depths and their behavior with regard to the recharging conditions. The following table shows the exposure of aquifers in the study area.

- 72 -
Table 7a: Depth wise Aquifer Classification
Aquifer Depth (mt)
Aquifer Type Aquifer
Depth (mt) Aquifer Type
1st Aquifer 18 Unconfined 3rd Aquifer 85 Confined 2nd Aquifer 30 Unconfined 4th Aquifer 97 Confined 3rd Aquifer 48 Unconfined 5th Aquifer 121 Confined 1st Aquifer 55 Confined 6th Aquifer 180 Confined 2nd Aquifer 73 Confined This classification is carried out based on the information of water struck during the drilling and water level fluctuations and their response to recharge. Recent drilling data reveals that the water first struck was at a depth of 18-20mt. Weathered and fractured zone extended up to 50 meters, and contributes to the water to the well from unconfined aquifer system The confined aquifer system starts at a depth of 55-60 meters, with major fractures. However, the fracture system differs from zone to zone. The wells located within the zone of confining system responds late to recharge and the water level fluctuations goes further deep. The average thickness of the unconfined aquifer system is around 40 meters and confined aquifer system is around 100 meters (according to the maximum depth of bore well). The table above indicates that the unconfined groundwater system occurs in horizontal to sub horizontal fractures. This was confirmed by the observing the sound of water flow in the gaps of the bore well and the partial reflection of the water level indicator when it contacts with the gap during the water level monitoring. This clearly indicates that few bore wells are interconnected through this local horizontal joint system. But this interconnectivity is on a limited scale. Delineation of the interconnected fractures may be very helpful in selecting those wells for constructing the direct and induced recharge methods. At times, confined aquifer system getting water from these interconnected fractures from shallow depths and giving the aquifer makes them temporarily unconfined. The conceptual model of the groundwater system in the study area is quite similar to the regional hydrogeological model proposed for crystalline and metamorphic rocks formed by colluvial and fluvial erosion of the fractured bed rock aquifer (Taylor and Howard, 2000). Athavale and Rangarajan (1988) estimate a recharge range of 1.2 to 13.3% of the annual rainfall for crystalline aquifers from south India, the most likely recharge for Mudimadagu can be assumed to be within 12% of annual rainfall because the degree of weathering and fracturing is high. 7.3 Groundwater System in Mudimadagu There are more than 200 wells including 20 dug wells drilled for the purpose of irrigation and drinking. The depth range of bore wells is from 50m to 160m. Most of the wells are individual wells, used for irrigation, except for drinking water wells

- 73 -
which were drilled by the Government. Some bore wells were drilled by the Government for installation of hand-pumps or for energized water supply to local communities. In order to understand the local groundwater system, Hydrogeological maps were prepared, that includes 47 wells out of which seven were dug wells. They were selected for long term monitoring in relation to the local geology. 7.4 Occurrences and behavior of Ground water in Mudimadagu Groundwater occurs under phreatic and confined conditions. Earlier, it was being extracted by means of open wells, mainly for domestic and irrigation purposes. Later, the bore well revolution changed the entire phenomena in this area with the area gradually moving to water scarcity. This area is cris-crossed by many dykes which divide this area into sub hydro-geological units. There are about five major dykes passing through this area, of which four traverses in E-W direction, and one dyke that traverses in NW-SE direction. The table given below shows the zone wise classification of the habitations
Table 7b: Dyke wise Classification of the Habitations in Mudimadugu
Zone 1 (1-2 Dyke) Zone-II (2-3
Dyke) Zone-III (3-4
Dyke) Zone-IV(4-5 Dyke)
Pathurgadda Yerlampalle Mudimadugu
Devannagaripalle Kadapalareddigaripalle
Chilakanerupalle
Vyapalapalle Bonepalle
Malamotakapalli Anepalli
Thatimanipalle
Anepalli
From the table it is evident that few habitations come under zone III, depending on the cultivation pattern and location in different zones. This classification is based on the well inventory and water level collected since the year 2004 for analyzing the water level fluctuations in different zones and the impact of the dykes on each zone. The below map is prepared for different zones.
In Mudimadugu, the groundwater system is unconfined but in some locals it is confined. Few bore wells respond after monsoon. The water occurs at different depths. Earlier, the water table was at a depth of 18 to 30 m, which at present, it has changed due to the rapid groundwater exploitation and with diversified cropping pattern.

- 74 -
Fig 7a: Hydrogeological Map of Mudimadagu Study Area
7.5 Groundwater Movement in Mudimadagu The movement of the groundwater in this area shows variation according to the watershed theme, due to the natural barriers i.e. dykes. Except the surface runoff or surface water flow there is no groundwater movement from upstream Balevaripalle to Thummalapalle in the down stream. According to the watershed theme Thummalapalle located in the discharge zone should contain water levels in shallow but the vast variation in water levels and their depth indicates that there is no subsurface movement. Each zone shows variation in water level fluctuations and response to the recharge. Given below is the well inventory data collected during the month of May, 2004

- 75 -
7.6 Well Inventory Data of Mudimadagu
Table 7c: Wells located in Zone-I
Well ID Type Altitude Purpose Usage
Depth of
Water struck
(ft)
Total Depth
(ft)
Water yield
(No of months)
Discharge (Litre /Sec)
Motor rating
KDP01 BW 838 IND IR 160 250 10 2.1 6.5 KDP04 BW 841 IND 0 60 130 12 1.95 6 KDP10 BW 848 IND IR 90 200 12 0.385 6 KDP11 BW 834 IND IR 90 240 12 2.1 7.5
MUDG01 BW 841 IND IR 180 240 10 1.95 MUDG02 BW 862 IND IR 280 160 12 2.32 6 YERL01 BW 825 IND IR 400 420 7 2.23 7.5 PTG01 BW 844 COL IR 180 230 12 1.45 6 PTG03 BW 859 COM D 320 360 12 2.34 7.5 PTG04 BW 843 IND IR 60 250 12 1.74 5 DVG01 BW 853 COM D 240 300 2.3 5 DVG04 BW 851 IND IR 120 200 12 2.1 7 DVG07 BW 853 IND IR 200 270 7 2 7.5
Table 7d: Wells located in Zone-II
Well ID Type Altitude Purpose Usage
Depth of
Water struck
(ft)
Total Depth
(ft)
Water yield
(No of months)
Discharge ( Litre /Sec)
Motor rating
VYA03 BW 825 IND IR 200 450 12 1.73 7.5 VYA04 BW 828 IND IR 120 260 12 1.78 7.5 BON01 BW 836 COL D 300 260 BON03 BW 827 IND IR 60 310 12 1.85 5_7
Table 7e: Wells located in Zone-III
Well ID Type Altitude Purpose Usage
Depth of Water struck
(ft)
Total Depth
(ft)
Water yield
(No of months)
Discharge( Litre /Sec)
Motor rating
MAL01 BW 842 IND IR 60 230 12 6 MAL03 BW 848 IND IR 50,300 350 12 10 MAL05 BW 858 IND IR 250 375 12 10 ANL05 BW 839 IND IR 360-370 300 12 3.23 10

- 76 -
Table 7f: Wells located in Zone-III
Well ID Type Altitude Purpose Usage
Depth of Water
struck (ft)Total
Depth (ft)
Water yield
(No of months)
Discharge (
Litre/Sec) Motor rating
ANL02 BW 837 IND IR 190 240 7 7.5 ANL08 BW 829 IND IR 266 450 8_ 7.5 ANL10 BW 830 IND IR 300-360 400 12- 10

- 77 -
CHAPTER-VIII Water Level Analysis
Data of Static water levels was collected from the selected wells from 2004 onwards for three seasons (Pre, Syn and Post Monsoon) in Mudimadugu in order to understand the water resources and their estimation and water budgeting. For this purpose the rainfall data from 2003 to 2007 was considered for water level analysis in the study area. Due to the impact of the local geology, dykes in particular control the water movement in this area, (discussed detail in previous chapter). According to these dykes the wells are also divided in to different zones. The analysis described in detail in this chapter is helpful to understand the water resource estimation which is explained in the next chapter. Two methods; “area’s overall water level” and “zone wise water level fluctuation” were used in this chapter to analyse the data in detail. Three months were selected that represent each season in a year, for the data collection. In the month of May water level data was collected for the period of Pre monsoon, the month of October was selected for Monsoon period in Mudimadugu, as the data was available easily. 8.1 Water Level Analysis in Mudimadagu Given below is the graph that explains Monsoon wise rainfall data since the year 2003. The average rainfall is 750 mm in Mudimadugu. Within a span of five years, two meteorological droughts have occurred. 40 bore wells were selected for water level analysis in total. Few dug wells were also selected in this area initially, but during the analysis they were ignored due to their insignificant role and the unavailability of the data due to their dry status in early summer. Given below is the table showing the zone wise water level data of Pre monsoon, monsoon and Post Monsoon periods, and their analysis for the period 2004 – 2007.
Table 8a: Pre-Post Monsoon Water Levels of the Wells between 1st and 2nd Dykes
Well ID. May-
04 May-
05 Oct-05
May-06
Oct-06
May-07
Oct-07
May-08
YERL01 41.24 31.69 25.4 14.97 20.23 25.12 20.3 16.2 PTG01 24.54 39.35 13.65 11.1 17.85 24.82 10.25 10.2 PTG03 24.8 56.7 35.11 23.09 35.15 48.83 30.25 43.3 PTG04 7.63 16.98 8.4 10.06 6.93 15.09 4.6 14.97
MUDG01 75.03 56.34 50.3 18.95 39.93 42.24 26 17.1 MUDG02 51.23 68.59 54.6 59.32 34.52 67.27 47.15 59.42 DVG01 88.39 61.75 20.34 13.50 27.24 32.33 18.4 20 DVG04 37.7 48.52 18.42 12.97 17.48 46.78 14.2 17.72 DVG07 31.12 52.95 32.3 43.52 31.52 38.64 17 18.48 KDP01 39.23 66.4 61 12.53 18.33 28.13 14.07 16 KDP04 28.86 31.8 22.92 16.52 20.27 32.18 19.82 18.33 KDP10 73.45 65 48.34 12.7 37.64 43 28.11 20.68 KDP11 23.98 36.6 18.74 22.97 17.91 24.28 22.54 14.59

- 78 -
Table 8b: Pre-Post Monsoon Water Levels of the Wells between 2nd and 3rd
Dykes Well ID.
May-04
May-05 Oct-05
May-06 Oct-06
May-07 Oct-07
May-08
VYA03 50.33 30.14 21.25 11.23 8.09 23.33 15.2 11.37
VYA04 44.41 49.78 72.94 12.94 23.45 53.68 32.65 12.8
BON01 9 12.16 5.1 5.39 5.96 11.75 3.63 4.6
BON03 18.6 35.57 22.18 12.28 14.65 19.15 21.14 17.31
Table 8c: Pre-Post Monsoon Water Levels of the Wells between 3rd and 4th Dykes
Well ID.
May-04
May-05
Oct-05
May-06
Oct-06
May-07
Oct-07
May-08
MAL01 34.15 53.9 14.36 22.41 41.68 46.73 4.5 14.1 MAL03 30.87 47.4 29.4 3.58 13.38 34.52 1.64 7 MAL05 64.29 71.45 18.2 31.63 25.74 82.38 12.35 37.4 ANL05 25.85 29.18 23 32.48 36.45 100 21 28.62
Table 8d: Pre-Post Monsoon Water Levels of the Wells between 4th and 5th
Dykes
Well ID. May-
04 May-
05 Oct-05
May-06
Oct-06
May-07
Oct-07
May-08
ANL08 20.45 27.5 25.36 16.98 19.69 23.47 18.25 17.6 ANL010 12.31 16.2 12.23 11.3 16.28 18.23 15.32 14.1 ANL02 29.45 29.61 19.59 16.69 27.24 28.47 23.18 17.78
8.2 Total Area’s Analysis in Mudimadagu The graphs given below shows the analysis of the data collected for both pre and post monsoon period. The data was collected in the months of May and January of each year, and an average of season wise data was calculated, while considering the fluctuation by subtracting the Post Monsoon water level from Pre Monsoon water level.

- 79 -
-10.00
-5.00
0.00
5.00
10.00
15.00
20.00
Pre (May) - Post (Oct) Monsoon Fluctuation (2005-2007)
Fluctuation 15.76 -5.67 15.11
Pre-Post (2005) Pre-Post (2006) Pre-Post (2007)
Graph 8a: Area’s Pre-Post Monsoon Fluctuations
Area's Pre-Post Monsoon Fluctuations with Rainfall
-10.00
-5.00
0.00
5.00
10.00
15.00
20.00
Pre-Post (2005) Pre-Post (2006) Pre-Post (2007)
Wat
er L
evel
(m
)
0
100
200
300
400
500
600
700
Rai
nfa
ll (m
m)
Fluctuation Rainfall (mm)
Graph 8b: Area’s Pre-Post Monsoon Fluctuation Trend with Rainfall

- 80 -
-15.00
-10.00
-5.00
0.00
5.00
10.00
Post (Oct) - Pre (May) Monsoon Fluctuation (2005-2008)
Fluctuation 8.01 -12.02 -0.48
Post-Pre (2005-06) Post-Pre (2006-07) Post-Pre (2007-08)
Graph 8c: Area’s Post – Pre Monsoon Fluctuations
8.3 Zone wise Analysis in Mudimadagu Total area is divided into five zones. Given below is the analysis of the water level fluctuations carried out, based on the zone wise data.
Table 8k: Analysis of the Pre-Post Monsoon Water Levels of all zones
May-
05 Oct-05
Pre-Post Fluc (2005) May-06 Oct-06
Pre-Post Fluc (2006)
May-07
Oct-07
Pre-Post Fluc (2007)
Zone-1 39.22 22.19 17.03 15.80 19.60 -3.81 29.77 20.12 9.65 Zone-2 31.91 30.37 1.55 10.46 13.04 -2.58 26.98 18.16 8.82 Zone-3 54.83 30.28 24.55 23.65 36.48 -12.84 65.91 9.87 56.04 Zone-4 24.44 19.06 5.38 14.99 21.07 -6.08 23.39 18.92 4.47 Zone-5 89.76 55.22 34.54 33.22 53.37 -20.16 80.39 45.20 35.19
-30.00
-20.00
-10.00
0.00
10.00
20.00
30.00
40.00
50.00
60.00
Pre (May) -Post (Oct) Monsoon Fluctuations
Pre-Post Fluc (2005) 17.03 1.55 24.55 5.38 34.54
Pre-Post Fluc (2006) -3.81 -2.58 -12.84 -6.08 -20.16
Pre-Post Fluc (2007) 9.65 8.82 56.04 4.47 35.19
Zone-1 Zone-2 Zone-3 Zone-4 Zone-5
Graph 8d: Zone wise Pre-Post Monsoon Fluctuations

- 81 -
From the above data/tables, it can be inferred that the maximum fluctuations from pre monsoon to post monsoon period occurred in Zones-1, 3 and 5 due to the contribution of surface flows according to topographic slope and immediate response due to their shallow unconfined nature. But in zones-2 and 4, the response with regard to the rainfall is less due to the more recharge time and limited groundwater abstraction in the zone-2. But compared to all zones, there are numbers of bore wells in zone-4 indicating that this zone has more groundwater potential zone and availability of maximum recharge zone. But the condition is somewhat grim in zones-3, 5 and 1 where fluctuations exceed their maximum limited. The graphs given below describes the nature of the aquifer systems in different zones and their response to rainfall.
Pre-Post Fluctuation Trend with Rainfall in Zone-2
-30.00
-20.00
-10.00
0.00
10.00
20.00
30.00
40.00
50.00
60.00
Pre-Post Fluc (2005) Pre-Post Fluc (2006) Pre-Post Fluc (2007)
WL
(m
)
0.00
100.00
200.00
300.00
400.00
500.00
600.00
700.00
RF
(m
m)
Zone-2 Rainfall (mm)
Pre-Post Fluctuation Trend with Rainfall in Zone-3
-30.00
-20.00
-10.00
0.00
10.00
20.00
30.00
40.00
50.00
60.00
Pre-Post Fluc (2005) Pre-Post Fluc (2006) Pre-Post Fluc (2007)
WL
(m
)
0.00
100.00
200.00
300.00
400.00
500.00
600.00
700.00
RF
(m
m)
Zone-3 Rainfall (mm)

- 82 -
Pre-Post Fluctuation Trend w ith Rainfall in Zone-4
-30.00
-20.00
-10.00
0.00
10.00
20.00
30.00
40.00
50.00
60.00
Pre-Post Fluc (2005) Pre-Post Fluc (2006) Pre-Post Fluc (2007)
WL
(m
)
0.00
100.00
200.00
300.00
400.00
500.00
600.00
700.00
RF
(m
m)
Zone-4 Rainfall (mm)
Pre-Post Fluctuation Trend with Rainfall in Zone-1
-30.00
-20.00
-10.00
0.00
10.00
20.00
30.00
40.00
50.00
60.00
Pre-Post Fluc (2005) Pre-Post Fluc (2006) Pre-Post Fluc (2007)
WL
(m
)
0.00
100.00
200.00
300.00
400.00
500.00
600.00
700.00
RF
(m
m)
Zone-5 Rainfall (mm)
Graphs 8e: Zone wise Pre-Post Monsoon Water Level Fluctuations Trend with Rainfall
The above graphs indicate that the response of water levels with regard to the rainfall is different in all zones. In zone-1, where response is little late due to the extension area of the aquifer system is high and aquifer properties like Transmissivity (the volume of the water from aquifer to well) and storativity (the storage capacity) is high. So even with less rainfall in a year, the water level fluctuation does not exceed lower than 4 meters. In the zone-2 and zone-4, when compared to zone-1, response to drought and abundance is less and also not much suitable for recharge conditions. When compared to the zone-1 and zone-2, remaining zones 3 and 4 are too sensitive to rainfall. Their immediate response with rainfall is due to more recharge conditions and less Transmissivity and storativity.
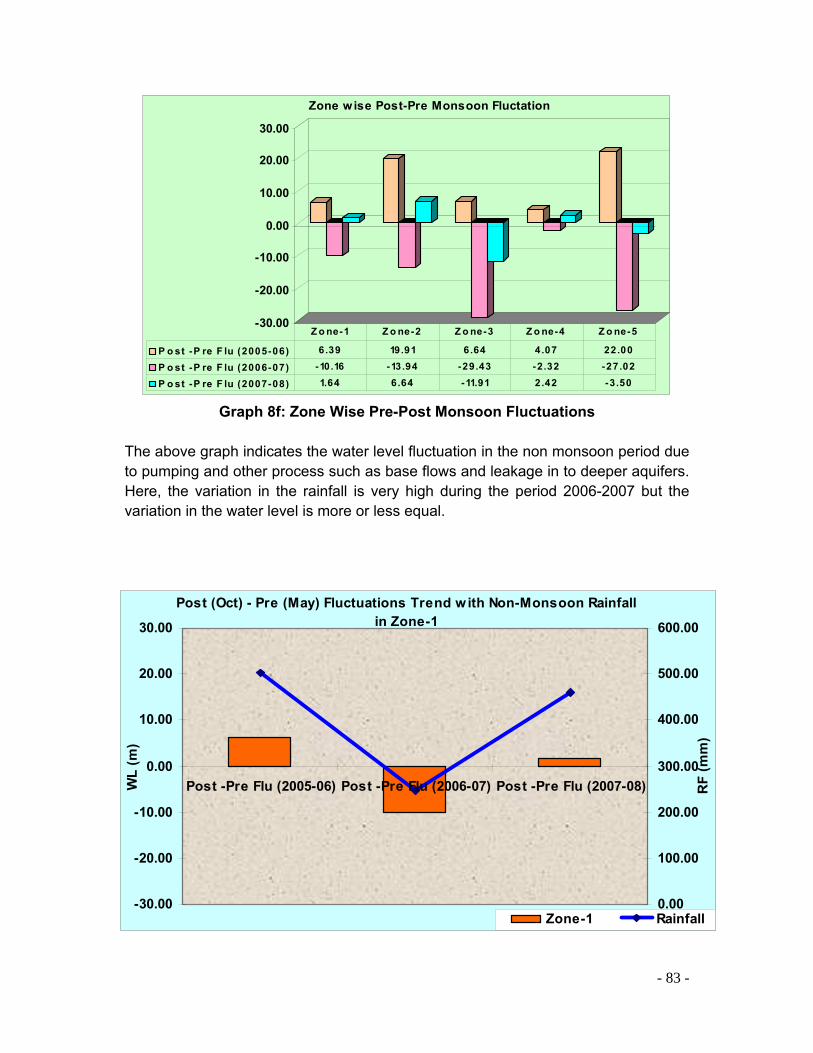
- 83 -
Post (Oct) - Pre (May) Fluctuations Trend with Non-Monsoon Rainfall in Zone-1
-30.00
-20.00
-10.00
0.00
10.00
20.00
30.00
Post -Pre Flu (2005-06) Post -Pre Flu (2006-07) Post -Pre Flu (2007-08)WL
(m
)
0.00
100.00
200.00
300.00
400.00
500.00
600.00
RF
(m
m)
Zone-1 Rainfall
-30.00
-20.00
-10.00
0.00
10.00
20.00
30.00
Zone wise Post-Pre Monsoon Fluctation
P o st -P re F lu (2005-06) 6.39 19.91 6.64 4.07 22.00
P o st -P re F lu (2006-07) -10.16 -13.94 -29.43 -2.32 -27.02
P o st -P re F lu (2007-08) 1.64 6.64 -11.91 2.42 -3.50
Z o ne-1 Z o ne-2 Z o ne-3 Z o ne-4 Z o ne-5
Graph 8f: Zone Wise Pre-Post Monsoon Fluctuations
The above graph indicates the water level fluctuation in the non monsoon period due to pumping and other process such as base flows and leakage in to deeper aquifers. Here, the variation in the rainfall is very high during the period 2006-2007 but the variation in the water level is more or less equal.
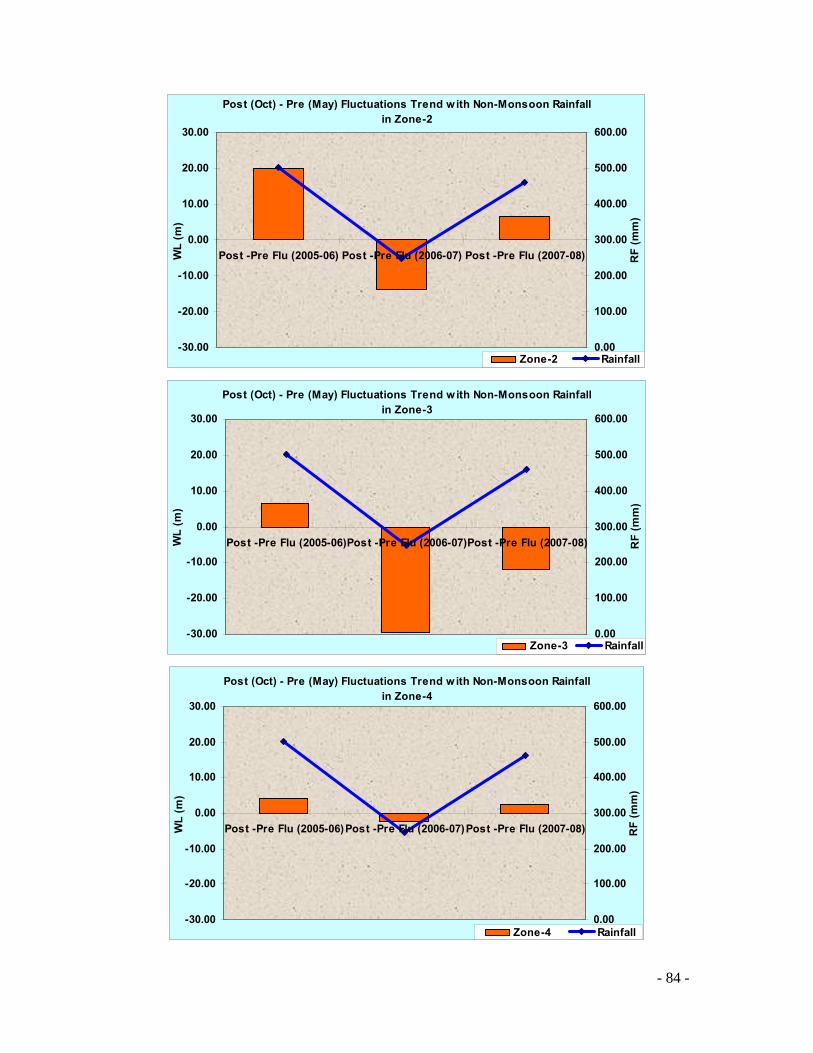
- 84 -
Post (Oct) - Pre (May) Fluctuations Trend with Non-Monsoon Rainfall in Zone-2
-30.00
-20.00
-10.00
0.00
10.00
20.00
30.00
Post -Pre Flu (2005-06) Post -Pre Flu (2006-07) Post -Pre Flu (2007-08)WL
(m
)
0.00
100.00
200.00
300.00
400.00
500.00
600.00
RF
(m
m)
Zone-2 Rainfall
Post (Oct) - Pre (May) Fluctuations Trend w ith Non-Monsoon Rainfall in Zone-3
-30.00
-20.00
-10.00
0.00
10.00
20.00
30.00
Post -Pre Flu (2005-06)Post -Pre Flu (2006-07)Post -Pre Flu (2007-08)WL
(m
)
0.00
100.00
200.00
300.00
400.00
500.00
600.00
RF
(m
m)
Zone-3 Rainfall
Post (Oct) - Pre (May) Fluctuations Trend with Non-Monsoon Rainfall in Zone-4
-30.00
-20.00
-10.00
0.00
10.00
20.00
30.00
Post -Pre Flu (2005-06)Post -Pre Flu (2006-07)Post -Pre Flu (2007-08)WL
(m
)
0.00
100.00
200.00
300.00
400.00
500.00
600.00
RF
(m
m)
Zone-4 Rainfall

- 85 -
Post (Oct) - Pre (May) Fluctuations Trend with Non-Monsoon Rainfall in Zone-5
-30.00
-20.00
-10.00
0.00
10.00
20.00
30.00
Post -Pre Flu (2005-06) Post -Pre Flu (2006-07) Post -Pre Flu (2007-08)WL
(m
)
0.00
100.00
200.00
300.00
400.00
500.00
600.00
RF
(m
m)
Zone-5 Rainfall Graphs 8g: Zone wise Post-Pre Monsoon Water Level Fluctuations Trend with
Rainfall
From the above graphs, it can be concluded that zone-1, 2 and zone-4 have similar trends in non-monsoon period, but in zone-3 and zone-5, more fluctuations exist due to high pumping rate and poor aquifer properties and its limited aquifer thickness.
0.00
10.00 20.00 30.00 40.00 50.00 60.00 70.00 80.00 90.00
2004 2005 2006 2007 2008
Zone wise Pre Monsoon (May) Water Level Trend
Zone-1 31.80 39.22 15.80 29.77 18.48 Zone-2 30.59 31.91 10.46 26.98 11.52
Zone-3 43.56 54.83 23.65 65.91 21.78 Zone-4 20.74 24.44 14.99 23.39 16.49 Zone-5 69.47 89.76 33.22 80.39 48.7
May-04 May-05 May-06 May-07 May-08
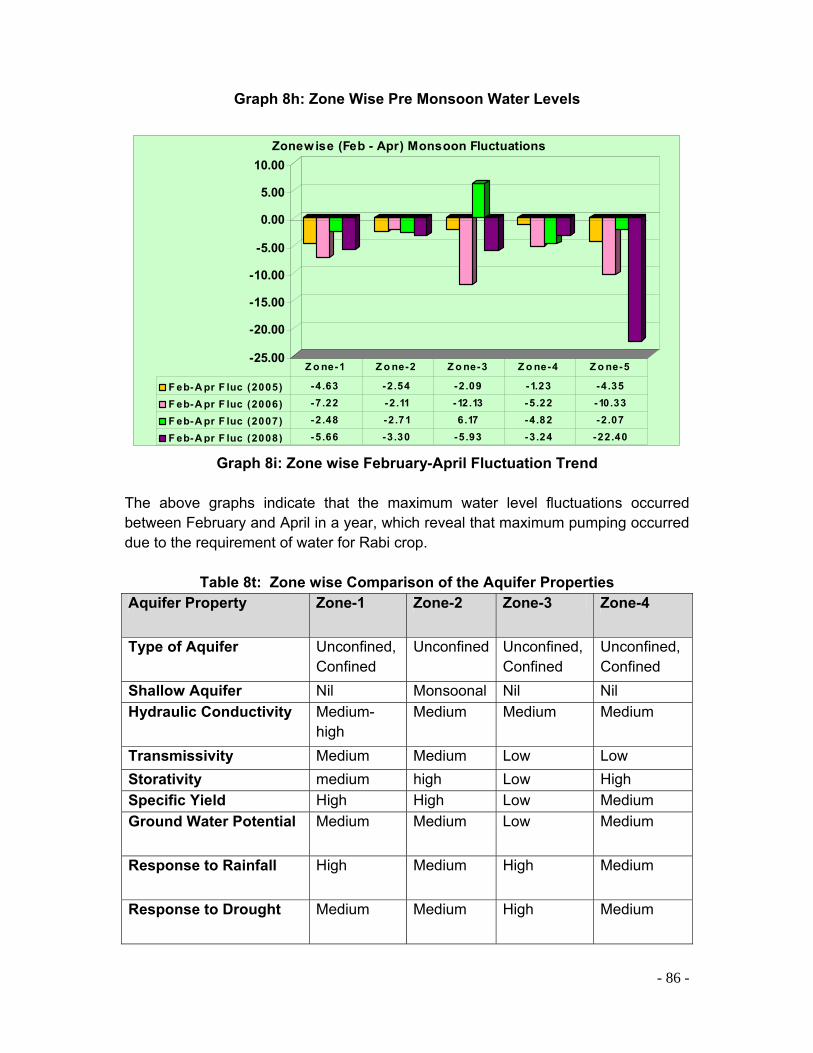
- 86 -
Graph 8h: Zone Wise Pre Monsoon Water Levels
-25.00
-20.00
-15.00
-10.00
-5.00
0.00
5.00
10.00
Zonewise (Feb - Apr) Monsoon Fluctuations
F eb-A pr F luc (2005) -4.63 -2.54 -2.09 -1.23 -4.35
F eb-A pr F luc (2006) -7.22 -2.11 -12.13 -5.22 -10.33
F eb-A pr F luc (2007) -2 .48 -2.71 6.17 -4.82 -2.07
F eb-A pr F luc (2008) -5 .66 -3.30 -5.93 -3.24 -22.40
Z o ne-1 Z o ne-2 Z o ne-3 Z o ne-4 Z o ne-5
Graph 8i: Zone wise February-April Fluctuation Trend
The above graphs indicate that the maximum water level fluctuations occurred between February and April in a year, which reveal that maximum pumping occurred due to the requirement of water for Rabi crop.
Table 8t: Zone wise Comparison of the Aquifer Properties Aquifer Property Zone-1 Zone-2 Zone-3 Zone-4
Type of Aquifer Unconfined, Confined
Unconfined Unconfined, Confined
Unconfined, Confined
Shallow Aquifer Nil Monsoonal Nil Nil
Hydraulic Conductivity Medium-high
Medium Medium Medium
Transmissivity Medium Medium Low Low
Storativity medium high Low High
Specific Yield High High Low Medium
Ground Water Potential Medium Medium Low Medium
Response to Rainfall High Medium High Medium
Response to Drought Medium Medium High Medium

- 87 -
CHAPTER IX Water Resources Estimation
Considering the rainfall data over the study area and other data like recharge & discharge, baseflow and other geohydrological parameters the ground water resource estimation has been made for Mudimadagu. For analyzing all these data the most suitable methods suggested by CGWB are “Rainfall infiltration method” and “Waterlevel Fluctuation Method”. Rainfall is the major dependant source in Mudimadagu area due to the complex hydrogeological system contains few fracture and joint systems which does not contains much storativity and transmissivity. Impulsive. In this study two methods are used and both the methods7 are explained briefly in the below table. 9.1 Water Resources Estimation in Mudimadugu through Rainfall Infiltration Method The average rainfall is around 730mm / year. In 2006 - 2007 there was less rain fall occurred. This entire calculation has done for the year of 2006-2007 because of the availability of crop data. There are about 10 tanks in this area which were filled partially. So the surface source for irrigation is limited or negligible. The infiltration factor has been considered as 12% of rainfall due to the shallow and massive crystalline basement with uneven distribution of fracture system and limited thickness of weathered mantle. Total Tank area is in this study area is 46.6 Hectares and the average depth is around 2.5mt. Around 20 % of the total storage has taken as recharge from the surface storage in monsoon season due to the siltation of the tanks by clayey material. The following tables show the water resources estimation from the study area
7 taken from the manual of Dynamic Groundwater Resources of India by Central Groundwater Board (2006)
Water Level Fluctuation Method The change in the storage has been calculated by multiplying water level fluctuations between Pre and Post monsoon periods with the area’s specific yield. The groundwater resources estimation is as the sum of change in storage and gross draft. R = (h X Sy X A) + DG Where, h = is the Rise in the water level A = is the Area Sy = is the Specific Yield DG = gross groundwater draft Specific Yield (Sy) = (Sy)={(Dw+Robf+Sd)-(Rfw+Ig)}/WLd*Ae

- 88 -
Table 9a: Monsoon (June-September) Recharge due to the Precipitation from 2004-2007
Year
Monsoon Precipitation (mm) (Jun-Sep)
Ppt (m)
Study Area (Ha)
Study Area (m2)
Volume of Monsoon Rainfall (Cub mt)
Rock Type
Recharge Factor (%)
Monsoon Recharge (cubic mt)
Total Surface Storage
Recharge from Surface Storage (Cub mt)
Total Monsoon Recharge (Cub mt)
2004 251.6 0.2516 1433 14330000 3605428
Granite-Gneiss
12 432651.36 1125000 225000 657651.36 2005 526.4 0.5264 1433 14330000 7543312 12 905197.44 1125000 225000 1130197.442006 371.8 0.3718 1433 14330000 5327894 12 639347.28 1125000 225000 864347.28 2007 583.4 0.5834 1433 14330000 8360122 12 1003214.64 1125000 225000 1228214.64
Table 9b: Non-Monsoon Recharge Due to the Precipitation (October - May)
Year Non-Monsoon Ppt (mm)
Ppt (m)
Study Area (Hect)
Study Area (m2)
Volume of Non-Monsoon Rainfall (Cub mt) Rock Type
Recharge Factor (%)
Non-Monsoon Recharge (cubic mt)
04--05 209.8 0.2098 1433 14330000 3006434
Granite-Gneiss
12 360772.08 05--06 502 0.502 1433 14330000 7193660 12 863239.2 06--07 247.2 0.2472 1433 14330000 3542376 12 425085.12 07--08 461.4 0.4614 1433 14330000 6611862 12 793423.44
Table 9c: Monsoon Water Budget (June-September)
Year
Moosoon Recharge (cubic mt)
Monsoon Discharge (Cub mt)
Irrigation Return Flow (Cub mt)
Water Requirement (Domestic+Cattle)
Area's Monsoon Water Requirement (Cub mt)
Net Groundwater Availability (Ppt+Return Flow+Surface Storage) (Cub mt)
Monsoon Shortage / Surplus (Cub mt)
Stage of Groundwater Development
2004 657651.36 533952 133488 33200 567152 791139.36 223987.36 71.68800197

- 89 -
2005 1130197.44 522720 130680 33200 555920 1260877.44 704957.44 44.08993153 2006 864347.28 788508 197127 33200 821708 1061474.28 239766.28 77.41195576 2007 1228214.64 705600 176400 33200 738800 1404614.64 665814.64 52.59805636
Table 9d: Non - Monsoon Water Budget (October - May)
Year
Non-Moosoon Recharge (cubic mt)
Non-Monsoon Discharge (Cub mt)
Irrigation Return Flow (Cub mt)
Water Requirement (Domestic+Cattle)
Area's Non-Monsoon Water Requirement (Cub mt)
Total Non-Monsoon Recharge (Ppt+Return Flow) (Cub mt)
Natural Discharge (Non-Monsoon) (5%) (Cub mt)
Net Non-Monsoon Groundwater Availability
Non Monsoon Shortage / Surplus (Cub mt)
Stage of Groundwater Development
04--05 360772.
08 1428768 357192 67096 1495864 717964.08 35898.204 682065.87 -813798.12 219.31
05--06 863239.
2 1620822 405205.5 67096 1687918 1268444.7 63422.235 1205022.46 -482895.53 140.07
06--07 425085.
12 1881600 470400 67096 1948696 895485.12 44774.256 850710.86 -1097985.13 229.07
07--08 793423.
44 1847664 461916 67096 1914760 1255339.4 62766.972 1192572.46 -722187.53 160.56
08--09 623652.
33 1847664 461916 67096 1914760 1085568.3 54278.4168 1031289.91 -883470.080 185.67
Table 9e: Water Resource Estimation and Water Budgeting (2004 - 2007)
Year
Net Monsoon GW Availability (Cub mt)
Net Non-Monsoon GW Availability (Cub mt)
Annual Replenishable Resources (Cub mt)
Net GW Availability (Cub mt)
Area's Monsoon Water Requirement (Cub mt)
Area's Non-Monsoon Water Requirement (Cub mt)
Area's Total Water Requirement Monsoon+ Non-
Annual GW Draft (Cub mt)
Shortage / Surplus (Cub mt)
Stage of GW Development

- 90 -
Monsoon (Cub mt)
2004 791139.36 682065.88 1473205.24 1473205.24 567152 1495864 2063016 2063016 -589810.8 140.04
2005 1260877.44 1205022.47 2465899.91 2465899.91 555920 1687918 2243838 2243838 222061.91 90.99
2006 1061474.28 850710.86 1912185.14 1912185.14 821708 1948696 2770404 2770404 -858218.9 144.88
2007 1404614.64 1192572.47 2597187.11 2597187.11 738800 1914760 2653560 2653560 -56372.89 102.17

91
9.2 Demands for Water in Mudimadugu The water demand estimated from all sources i.e. domestic, livestock, pumping and cropping demand also. Water Consumption per capita around 48 lit in Rural Areas
Table 9f: Domestic Water Demand Water Requirement per Day
Village Total Population Total Consumption Anepalle 268 12864 Bonepalle 91 4368 Chilakanerupalle 69 3312 Devannagaripalle 64 3072 Kadapalareddipalle 80 3840 Malamotakapalli 105 5040 Mudimadugu 595 28560 Patturgadda 328 15744 Thatimanipalle 87 4176 Vyapallapalle 214 10272 Yerlampalle 98 4704 Total 1999 95952 Total water demand from livestock for a year is around 35022 Cub mt.
The demand8 for livestock is given in the below table
Table 9h: Water Requirement for Livestock in Mudimadugu Panchayat / Day
Total Water Consumption
Village Cow Buffalo Ox Sheep Goat Total Consumption
Lit/Day Anepalli 2485 0 2310 111 112.5 5018.5 Bonepalli 875 0 665 10.5 0 1550.5 Chilakanerupalli 490 0 1435 3 30 1958 Devannagaripalli 595 260 490 30 0 1375 Kadapalareddipalli 770 162.5 875 7.5 0 1815 Malamotakapalli 1540 65 3325 25.5 60 5015.5 Mudimadugu 105 6370 700 13.5 0 7188.5 Patturgadda 2660 390 4480 22.5 150 7702.5 Thatimanipalli 385 0 840 21 0 1246 Vyapallapalli 2555 195 1785 52.5 36 4623.5 Yerlampalle 665 65 3080 13.5 5884.5 9708 Total 13090 7407.5 19985 310.5 6273 47201
8
Water Usage per Cow 35 liters Water Usage per Buffelo 30 liters Water Usage per Ox 35 liters Water Usage per Sheep 1.5 liters Water Usage per Goat 1.5 liters

92
Total water demand from livestock for a year is around 17228 Cub mt.
9.2.3 Water Demand Due to the Pumping: The total groundwater draft estimated from pumping demand. There are about 211 wells are located in Mudimadugu. There are only 141 wells are giving yield. The average specific yield calculated by the discharge measurement during pumping. The specific yield from this area is 2.3 liters / second. The average pumping hours from this area is 9 hours due to the current availability in Karnataka. Total pumping days considered as 270 days/ Year including monsoon pumping. The total Pumping Demand summarized in below tables
Table 9i: Monsoon Bore well Discharge (June-September)
Year
Total Area
(Hect)
No of Pu
mps (BW+OW) Working
Pumping Days
Pumping Hours
Daily
Pumping Hours Yearly
Average
Specific Yield
(Lit/Min)
Average Specific
Yield (Lit/Hour
)
Monsoon
Discharge
2004 1433 110 103 90 6 540 160 9600 533952
2005 1433 130 121 75 6 450 160 9600 522720
2006 1433 165 149 90 7 630 140 8400 788508
2007 1433 209 140 75 8 600 140 8400 705600
Table 9j: Non-Monsoon Bore well Recharge (October-May)
Year
Total Area (Hect
)
No of
Pumps
(BW) Working
Pumping Days
Pumping Hours
Daily
Pumping Hours Yearly
Average Specific
Yield (Lit/Min)
Average Specific
Yield (Lit/Hour
)
Non-Monsoon Discharg
e 04—05 1433 130 121 205 6 1230 160 9600 1428768 05—06 1433 165 149 185 7 1295 140 8400 1620822 06—07 1433 209 140 200 8 1600 140 8400 1881600 07—08 1433 212 141 195 8 1560 140 8400 1847664

93
Table 9k: Total Monsoon and Non- Monsoon Discharge
MONSOON NON-MONSOON Year wise Discharge
(Cub mt)
Year Monsoon Discharge
Irrigation Return Flow
(Cub mt) Year
Non-Monsoon Discharge
Irrigation Return Flow
(Cub mt)
Yearly Discharge (cubic mt)
Total Irrigation Return
Flow (Cub mt)
2004 533952 133488 04--05 1428768 357192 1962720 487872
2005 522720 130680 05--06 1620822 405205.5 2143542 602332.5
2006 788508 197127 06--07 1881600 470400 2670108 646800
2007 705600 176400 07--08 1847664 461916 2553264 461916
Table 9lb: Water Resources Estimation through Water Level Fluctuation Method in Mudimadugu:
Year Specific Yield
Annual Net Groundwater
Availability (Cub mt) (WLF Method)
Annual Net Groundwater
Availability (Cub mt) (RIF Method)
Groundwater Draft (Cub
mt) 2004-05 0.015 1601378 1473205 2063016 2005-06 0.005 1972720 2465900 2243838 2006-07 0.009 2027982 1912185 2770404 2007-08 0.010 2096479 2597187 2653560

94
*According to the norms of CGWB, the recharge from irrigation has been calculated as 25% of total dischargeable 9la: Water Resources Estimation through Water Level Fluctuation Method in Mudimadagu:
Year
Groundwater Draft (Dw) (Cub mt)
Recharge Due to Return Flows (Ig) (Cub Mt)
Effective Area (Ae) (Hect)
Average Water Level Decline / Rise (WLd) (m)
Baseflow (Robf) (Cub mt)
Spring Discharge (Sd)
Winter Rainfall (Rfw)
Specific Yield (Sy)={(Dw+Robf+Sd)-(Rfw+Ig)}/WLd*Ae
Recharge (Fluctuation Method) (=Ae*WLd*Sy) (Cub mt)
Recharge Due to Ppt (Cub mt)
Percentage Deviation P.D = ((A-B) / B) * 100 (Between WIF & RIF)
Annual Net Groundwater Availability (Cub mt)
2004-05 2063016 49068
0 14330000 -7.45 73660 0 0 -0.015 1601378
1473205 8.70 1601378
2005-06 2243838 53588
5 14330000 23.77
123294 0 0 0.005 1972720
2465900 -30.93 1972720
2006-07 2770404 66752
7 14330000 -17.69 95609 0 0 -0.009 2027982
1912185 6.06 2027982
2007-08 2653560 63831
6 14330000 14.63
129859 0 0 0.010 2096479
2597187 -19.28 2096479

95
CHAPTER X Conceptual Hydro geological model for the Study Area
10.1 Supply, Demand and Groundwater Budget in Mudimadagu The present groundwater scenario in the Mudimadagu is little grim due to the over exploitation with high capacity bore wells. The well density is around 17 per sq.km with 233 bore wells and more than 70 bore wells have already failed due to the deepening of the aquifer. The percentage of failure of about 30% of bore wells indicates that if the present situation continues for another 4-5 years, is bound to create groundwater drought in this area. The shallow unconfined aquifers have become dry and the present depth of the aquifer is around 55-60 meters in some areas. Out of the five zones are three are in awful condition and at this juncture, groundwater management is the only option which will help to restore the past scenario. The present scenario of the tanks is in awful condition with formation of silt, growth and extension of Hydrophytes like ipomia. Most of the tanks become empty within 3 months after the monsoon and some of the tanks have remained dry for the past 12 years. The graphs given below indicate the demand & supply and groundwater balance in this area.
0
500000
1000000
1500000
2000000
2500000
3000000
Groundwater Shortage in Mudimadugu
Annual Net GroundwaterAvailability (Cub mt) (WLFMethod)
1601378 1972720 2027982 2096479
Annual Groundwater Draft(Cub mt)
2063016 2243838 2770404 2653560
04--05 05--06 06--07 07--08
Graph 10a: Shortage of the Groundwater in Mudimadagu

96
0
20
40
60
80
100
120
140
Year w ise Stage of Groundwater Development in Mudimadugu
Stage of GroundwaterDevelopment
128.83 113.74 136.61 126.57
04--05 05--06 06--07 07--08
Graph 10b: The Stage of the Groundwater Development in Mudimadagu
The Shortage & Groundwater Development stage map clearly shows that this area is distressed by over abstraction.
0
500000
1000000
1500000
2000000
2500000
3000000
Supply & Demand and Groundwater Balance
A nnual N et A vailability o fGro undwater (C ub mt)
1601378 1972720 2027982 2096479
A nnual Gro undwater D raf t(C ub mt)
2063016 2243838 2770404 2653560
Safe Extract io n (70% o f N etA nnual R echarge) (C ub mt)
1120965 1380904 1419587 1467535
04--05 05--06 06--07 07--08
Graph 10c: Supply Demand and Groundwater Balance in Mudimadugu

97
-6
-5
-4
-3
-2
-1
0
Yearwise Storage Level Rise / Fall (Cm) in Mudimadugu
Storage Level Rise / Fall(Cm)
-3.22 -1.89 -5.18 -3.89
04--05 05--06 06--07 07--08
Graph 10d: The Storage Level (Water Level) Rise / Fall in Mudimadagu
Storage Level Trend with Net Groundwater Availability
0
500000
1000000
1500000
2000000
2500000
04--05 05--06 06--07 07--08
Ava
ilab
le W
ater
(C
ub
mt)
-6
-5
-4
-3
-2
-1
0
Sto
rag
e L
evel
(C
m)
Annual Net Availability of Groundwater (Cub mt) Storage Level Rise / Fall (Cm)
Graph 10e: Storage Level trend with Net Groundwater Availability in Mudimadagu
The above tables reveal that the discharge is much more than the recharge for the entire Mudimadugu. The maximum imbalance occurred in the period 2006-2007 and 2004-2005. The water level is going down approximately 0.4 to 5 cm per year in this area. Except during those periods, when the recharge exceeds discharge, which happened in the year 2005-2006 when the water level raised, the level is going down in general. The average water level decline in this area is around 2.25 cm per year.
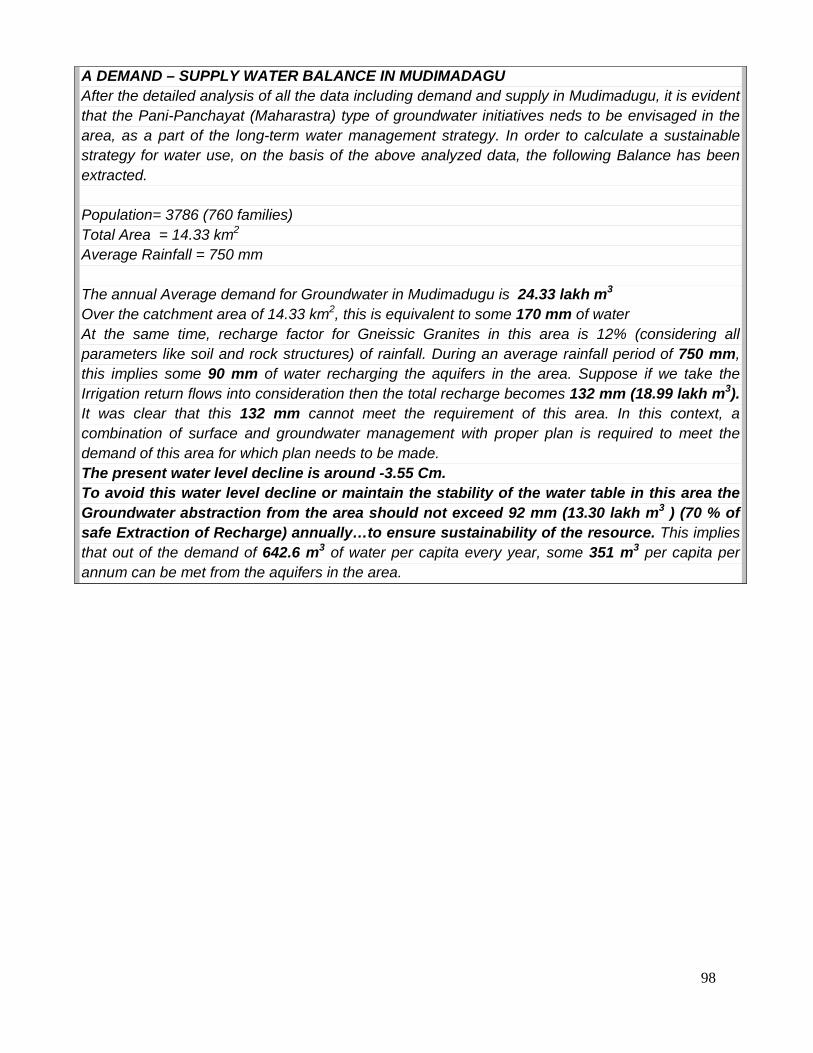
98
A DEMAND – SUPPLY WATER BALANCE IN MUDIMADAGU After the detailed analysis of all the data including demand and supply in Mudimadugu, it is evident that the Pani-Panchayat (Maharastra) type of groundwater initiatives neds to be envisaged in the area, as a part of the long-term water management strategy. In order to calculate a sustainable strategy for water use, on the basis of the above analyzed data, the following Balance has been extracted. Population= 3786 (760 families) Total Area = 14.33 km2 Average Rainfall = 750 mm The annual Average demand for Groundwater in Mudimadugu is 24.33 lakh m3 Over the catchment area of 14.33 km2, this is equivalent to some 170 mm of water At the same time, recharge factor for Gneissic Granites in this area is 12% (considering all parameters like soil and rock structures) of rainfall. During an average rainfall period of 750 mm, this implies some 90 mm of water recharging the aquifers in the area. Suppose if we take the Irrigation return flows into consideration then the total recharge becomes 132 mm (18.99 lakh m3). It was clear that this 132 mm cannot meet the requirement of this area. In this context, a combination of surface and groundwater management with proper plan is required to meet the demand of this area for which plan needs to be made. The present water level decline is around -3.55 Cm. To avoid this water level decline or maintain the stability of the water table in this area the Groundwater abstraction from the area should not exceed 92 mm (13.30 lakh m3 ) (70 % of safe Extraction of Recharge) annually…to ensure sustainability of the resource. This implies that out of the demand of 642.6 m3 of water per capita every year, some 351 m3 per capita per annum can be met from the aquifers in the area.

99
Based on the above data, scenario of groundwater in 2008-2009 is estimated (Rainfall Infiltration Method), which is given below. Table 10d: Year Wise Groundwater Budgeting from 200for the Year of 2008 – 2009 with RIF Method
Year
Net Monsoon Groundwater Availability (Cub mt)
Net Non-Monsoon Groundwater Availability (Cub mt)
Annual Replenishable Resources (Cub mt)
Net Groundwater Availability (Cub mt)
Area's Monsoon Water Requirement (Cub mt)
Area's Non-Monsoon Water Requirement (Cub mt)
Area's Total Water Requirement Monsoo+Non-Monsoon (Cub mt)
Annual Groundwater Draft (Cub mt)
Shortage / Surplus (Cub mt)
Stage of Groundwater Development
04-05 791139 682065.88 1473205.24
1473205.24
567152
1495864 2063016 2063016-589810.76
140.04
05-06 1260877 1205022.47 2465899.91
2465899.91
555920
1687918 2243838 2243838222061.91
90.99
06-07 1061474 850710.86 1912185.14
1912185.14
821708
1948696 2770404 2770404-858218.86
144.88
07-08 1404615 1192572.47 2597187.11
2597187.11
738800
1914760 2653560 2653560 -56372.89 102.17
08-09 1117871 1031289.92 2149161.26
2149161.26
738800
1914760 2653560 2653560-504398.74
123.47
- 100 -
CHAPTER XI Conclusions
The functioning of the groundwater system occurs within the physical framework described earlier and is largely controlled by the geological set-up of the Gneissic Granites with Secondary Intrusions like Dykes. The salient features of the groundwater system behaviour are listed below, based on the water level data collected regularly since 2004 in Mudimadugu. Following conclusions and comparisons can be observed after the detailed study.
Surface flow or monsoon runoff, though not observed is bound to be limited to a few days, where the entire drainage network is concerned.
Dolerite and Gabbroic Dykes play a crucial role in controlling the local hydrogeological regimes and separates the area into different sub hydrogeological units.
Predominantly Socio-Economic conditions play a vital role on groundwater in Mudimadagu.
Highest bore well density with 212 yielding water. The Hydrogeological regime in Mudimadugu underlained by Unconfined and
Confined Aquifer System with deeper fracturing system more than 100 meters depth. Shallow Unconfined system is almost negligible in this area.
An almost non perennial base flow component clearly indicates deepening of the zone of saturation particularly in Mudimadugu and geological control on local groundwater regime.
Tanks and open wells plays negligible role in irrigation in Mudimadugu Soil permeability on the whole is moderate due to the presence of fragmentary
material mixed with top soil on the upland plateaux and slopes. In valleys and tank bed areas it is low, but is offset by a less porosity of the soils in the red, clayey soils.
The soil condition is more permeable with low drainage density and frequency. The depth of Static Water Level is terrible in Mudimadugu particularly in peak
pre monsoon season. Groundwater Demand per capita in Mudimadugu is around 643 Cubic Meters. Mudimadugu is the land for Crop Diversity. Water intensive crops like sugarcane
cultivations in Mudimadugu are exceeding 30 acres every year. Abstraction (pumping) from the groundwater system is more in Mudimadugu.
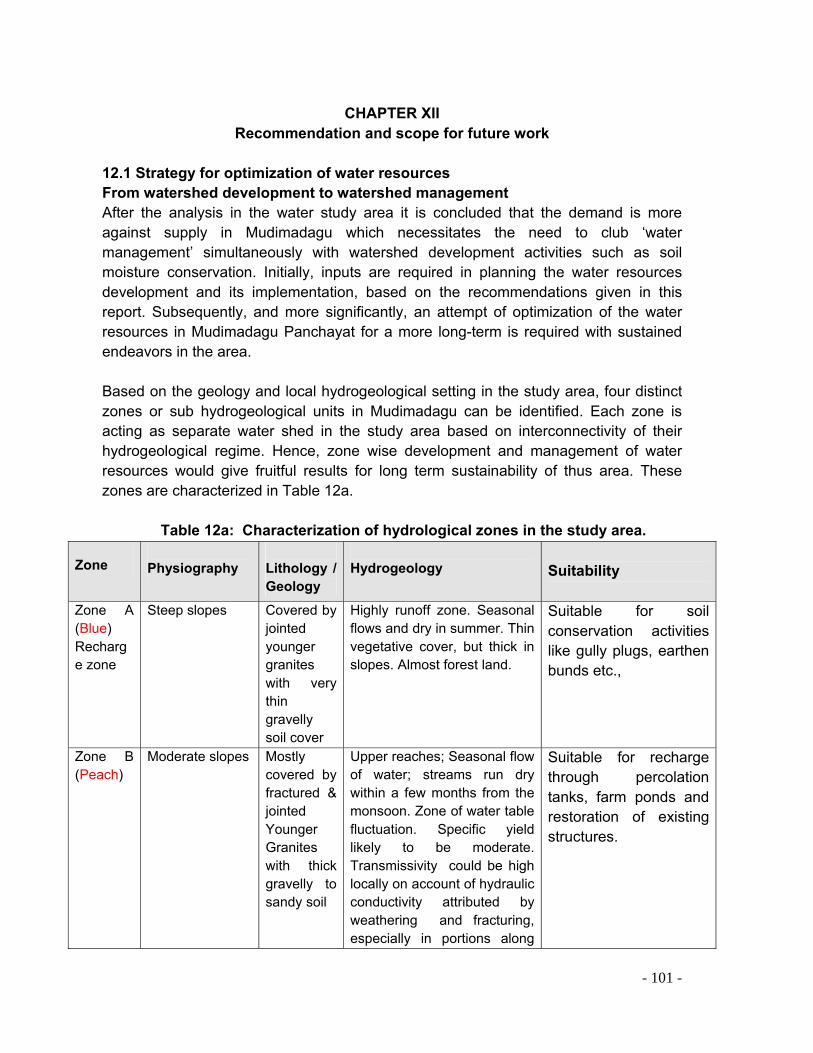
- 101 -
CHAPTER XII Recommendation and scope for future work
12.1 Strategy for optimization of water resources From watershed development to watershed management After the analysis in the water study area it is concluded that the demand is more against supply in Mudimadagu which necessitates the need to club ‘water management’ simultaneously with watershed development activities such as soil moisture conservation. Initially, inputs are required in planning the water resources development and its implementation, based on the recommendations given in this report. Subsequently, and more significantly, an attempt of optimization of the water resources in Mudimadagu Panchayat for a more long-term is required with sustained endeavors in the area. Based on the geology and local hydrogeological setting in the study area, four distinct zones or sub hydrogeological units in Mudimadagu can be identified. Each zone is acting as separate water shed in the study area based on interconnectivity of their hydrogeological regime. Hence, zone wise development and management of water resources would give fruitful results for long term sustainability of thus area. These zones are characterized in Table 12a.
Table 12a: Characterization of hydrological zones in the study area.
Zone Physiography
Lithology / Geology
Hydrogeology
Suitability
Zone A (Blue) Recharge zone
Steep slopes Covered by jointed younger granites with very thin gravelly soil cover
Highly runoff zone. Seasonal flows and dry in summer. Thin vegetative cover, but thick in slopes. Almost forest land.
Suitable for soil conservation activities like gully plugs, earthen bunds etc.,
Zone B (Peach)
Moderate slopes Mostly covered by fractured & jointed Younger Granites with thick gravelly to sandy soil
Upper reaches; Seasonal flow of water; streams run dry within a few months from the monsoon. Zone of water table fluctuation. Specific yield likely to be moderate. Transmissivity could be high locally on account of hydraulic conductivity attributed by weathering and fracturing, especially in portions along
Suitable for recharge through percolation tanks, farm ponds and restoration of existing structures.

- 102 -
stream lines Zone C (Brown) Groundwater Run off zone
Intermediate zone with small plateaux and slopes towards stream channels
Underlined by Gneissic Basement with thick loamy soil bed.
This is also seasonal. Relatively medium specific yield but forming semi confined to confined aquifer system with deeper fracture zones in gneissic rocks. Few Springs supported by groundwater discharge due to dyke interventions.
Portion for construction / use of small structures for recharge and storage also.
Zone C (Yellow) Groundwater discharge zone
Higher order Streams and adjoining terraces of farmland
Lower part of each sub hydrogeological unit with thick clay bed.
Middle to lower reaches; no base flow after monsoon period.
Scope for harvesting water deepening of existing open wells if any.
Fig 12a: Recommendation Map of Mudimadagu Study Area

- 103 -
However, one should remember, that water resources management to be effective and sustainable, should be in tune with the project objectives of watershed development. The best option, therefore, is to establish a methodology of water use that is systematic enough to consider the specific hydrogeological characteristics. Based on the present investigation for longer time and the conclusions drawn, a broad strategy is being suggested as an attempt towards effective water resources development and management. Below figures depicts the broad strategy suggested for enhancement of water resources and their sustainable management for the both areas. The below map give the recommendations in the study area.
12.2 Recommendations for enhancement of Groundwater Resources in the study area: 1. There is need to conserve the soil from erosion in the zone-A due to the steep
slope. The elevation ranges from 1340 mts to 960 mts. Slope is around 24% in this zone. Suitable for soil moisture activities like trenches, gully plugs and rock filled dams on first order streams. Underlined by fractured gneissic basement, encourage the slow infiltration into perched aquifer system temporarily and protects the moisture and supports vegetation.
2. Firstly, it will be effective to execute an established “local model” of artificial
infiltration, available with FES through micro level “farm ponds”. The upper slopes and middle portions of the study area would be most suitable in this regard. Farm pond treatment could be intensified in these regions along the pegmatite and dyke zones. The rationale of farm pond numbers is presented in the box below.
Density of Farm Ponds How many farm ponds suitable for both study areas for conservation of water? The general measurement of farm ponds of 10m x 10m x 2m The total storage volume in each farm pond = 200 m3
Effective volume may be safely considered as 175 m3
Now for a model of 1:1 (1 farm pond per hectare of land, the effective storage works out to about 18mm.) Considering an optimum recharge of 12% of normal rainfall for the gneisses in both areas, Mudimadugu: The recharge of groundwater can be assumed to be 90mm (average annual rainfall is 750mm) annually. Going by the bimodal rainfall pattern, there would be effectively two episodes of recharge, each of some 45mm. Therefore, it is necessary to have a mechanism for mobilizing this quantum for systematic conservation within the groundwater system in the watershed. Hence, a factor of 45/18 (one episode / effective volume of one farm pond).
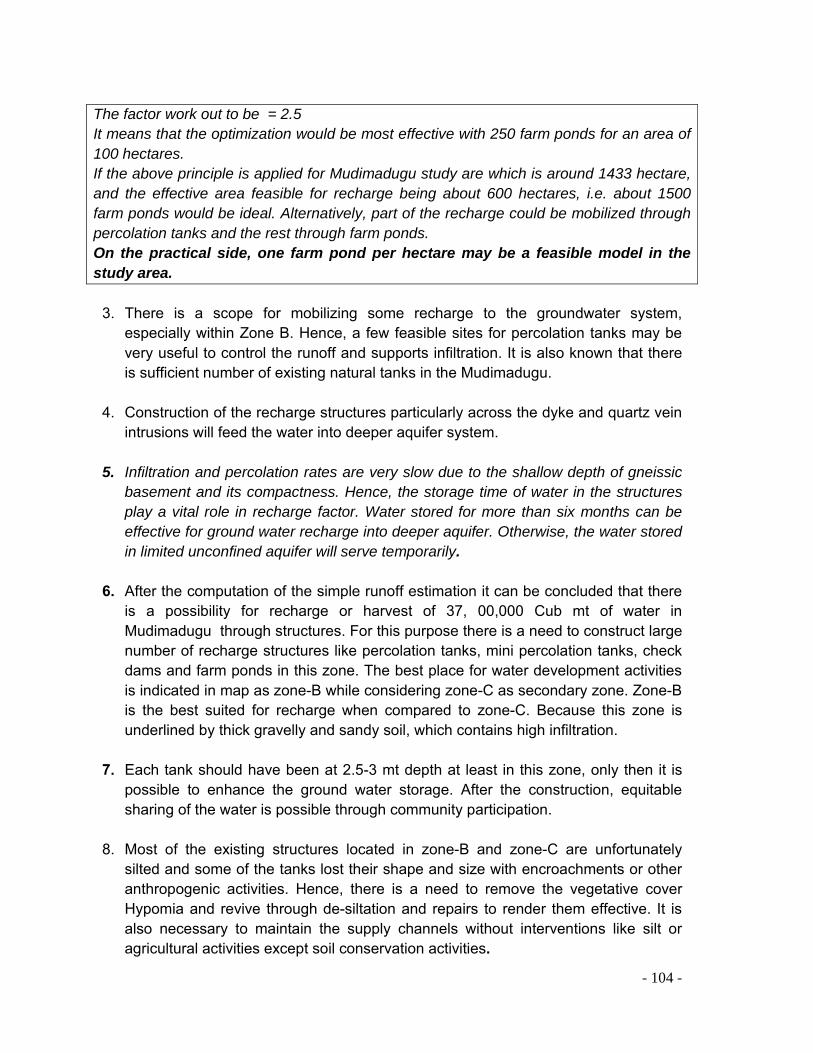
- 104 -
The factor work out to be = 2.5 It means that the optimization would be most effective with 250 farm ponds for an area of 100 hectares. If the above principle is applied for Mudimadugu study are which is around 1433 hectare, and the effective area feasible for recharge being about 600 hectares, i.e. about 1500 farm ponds would be ideal. Alternatively, part of the recharge could be mobilized through percolation tanks and the rest through farm ponds. On the practical side, one farm pond per hectare may be a feasible model in the study area.
3. There is a scope for mobilizing some recharge to the groundwater system,
especially within Zone B. Hence, a few feasible sites for percolation tanks may be very useful to control the runoff and supports infiltration. It is also known that there is sufficient number of existing natural tanks in the Mudimadugu.
4. Construction of the recharge structures particularly across the dyke and quartz vein
intrusions will feed the water into deeper aquifer system. 5. Infiltration and percolation rates are very slow due to the shallow depth of gneissic
basement and its compactness. Hence, the storage time of water in the structures play a vital role in recharge factor. Water stored for more than six months can be effective for ground water recharge into deeper aquifer. Otherwise, the water stored in limited unconfined aquifer will serve temporarily.
6. After the computation of the simple runoff estimation it can be concluded that there
is a possibility for recharge or harvest of 37, 00,000 Cub mt of water in Mudimadugu through structures. For this purpose there is a need to construct large number of recharge structures like percolation tanks, mini percolation tanks, check dams and farm ponds in this zone. The best place for water development activities is indicated in map as zone-B while considering zone-C as secondary zone. Zone-B is the best suited for recharge when compared to zone-C. Because this zone is underlined by thick gravelly and sandy soil, which contains high infiltration.
7. Each tank should have been at 2.5-3 mt depth at least in this zone, only then it is
possible to enhance the ground water storage. After the construction, equitable sharing of the water is possible through community participation.
8. Most of the existing structures located in zone-B and zone-C are unfortunately
silted and some of the tanks lost their shape and size with encroachments or other anthropogenic activities. Hence, there is a need to remove the vegetative cover Hypomia and revive through de-siltation and repairs to render them effective. It is also necessary to maintain the supply channels without interventions like silt or agricultural activities except soil conservation activities.

- 105 -
9. Just like Ammacheruvu in Mudimadugu in the upstream of study area, where it
keeps the ground water system live, (for feeding water into local groundwater system and located exactly in recharge zone) for zone-1, there is need to construct large numbers of percolation tanks, in perticular where the lower and higher streams are joining in Zone B and C.
10. Increasing the storage capacity of the tanks is the only option for deeper recharge because most of the tanks in this area are exactly situated on the dykes. For example Kothacheruvu in Malamotakapalli and Gollapalle Cheruvu in Kadapalareddigaripalle. Hence, through the contact zones of dyke and host rocks there is better probability to recharge water into deeper aquifers. However, unfortunately almost all the tanks are silted with nearly two to three meters thick clayey silt. It is better to encourage small scale industry such as brick making and also this soil can be utilized for enrichment of the fertility of agricultural fields.
Plate No: Existing structures such as this tank (located in a groundwater Recharge Zone) can be used as a percolation tank by increasing its storage capacity

- 106 -
11. One of the most concerned situations in this area is the encroachment of the tanks and supply channels particularly in Mudimadugu. May be it is the social problem but it can be solved through the community participation by creating an awareness on understanding their resources.
Plate No: This is the supply channel for the above tank in Mudimadugu, but almost extinct by anthropogenic activities. It is necessary to restore them for increasing the storage volume of the tanks.
12. Groundwater resource development is possible in the middle reaches of the
watershed also but not intensive, i.e. within Zone C by constructing the small recharge structures such as farm ponds and deepening of existing open wells in particular in Mudimadagu. Any new wells promoted through this project will have to be initiated in with certain social regulations governed by groundwater monitoring committees (GMC) or using the principles of “Pani Panchayat” (Maharastra) like village level institutions which are successful in some parts of Maharashtra.
13. The unique feature of each zone in both of the water study areas is in the form of
the groundwater discharge area (Zone D). This zone is an extremely good indicator of the ‘environmental health’ of the watershed. But unfortunately there are no baseflows in this zone even after monsoon. This clearly indicates the lack of the zone of saturation in shallow depth. It is imperative to maintain the base flows in this zone for long-term, water resource sustainability.
14. For the sustainable water management of this zone, it would be better to look at
surface water based “water users” groups. This implies looking at older structures

- 107 -
and the possibility of using water from these, especially for protective irrigation. Or, even the use of community wells in this zone…although the well-yields from this zone are bound to be limited, but sustainable in the long run.
15. Water harvesting for use is feasible in the lowermost reaches (Zone-D) of all zones
in the study area, along the course of the drainage channel (3rd or 4th order mainstreams). For this purpose, few small structures have been suggested, the overflow of which will feed a larger structure in the further downstream. These structures will also control the flow of silt into the downstream water bodies.
12.3 Recommendations for Sustainable Water Management: In addition to the specific recommendations suggested above, there are also some general principles being provided as suggestions below, primarily to ensure sustainable use of water resources. Community based management of groundwater resources is envisaged as the next
step in villages like Malamotakapalli, Thummalapalle and Anepalle. Some of the learning’s from this report will prove to be useful in planning and implementing groundwater management in such villages.
Finally, management of artificial recharge ought to involve a component of ‘better
informed’ communities. Communities ought to be posed with such questions as “What after watershed development and artificial recharge” during the post-project management phase. Specifically in Mudimadugu, communities need to be informed about the limitations of uncontrolled extraction of groundwater resources and the need for ‘increased community involvement’ in groundwater management and artificial recharge.
Creating the awareness Stakeholders on their resources through Kalajathas or any
other communication methods. The communities should be capacitated to undertake the estimation of water
resources, as well as crop water budgeting. Installation of few Meteorological Equipments such as Rain gauges, and water level
indicators for regular monitoring by the community themselves. Formation of the different institutions for surface and ground water with gender
equity or strengthening the already existing institutions like Water User Associations or User Groups.
Conducting exposure visits to those areas where groundwater management is
being successfully practiced such as Kothakunta watershed area, and also to the

- 108 -
area where the area is worst effected by groundwater overabstraction such as Sidlagatta.
It would be better to encourage the use of shallow groundwater (usually open wells)
and establish shallow aquifer systems as a sustainable source of water supply with low discharge, low capacity pumping systems (less than 3-5 hp) since they are most suitable on such wells, so as to build an automated regulatory mechanism of abstraction, which is in agreement with the hydrogeological properties of the groundwater system.
Discourage bore well drilling for irrigation considering long-term problems of
overexploitation from hard rocks aquifers in particular. Encourage advanced irrigation techniques like Drip or Sprinkler systems and push them into less water intensive crops like Cereals (Ragi, Maize, and Bazra etc.,) or vegetables and other flowering plants against high water intensive crops like sugarcane and paddy. Encourage the community into “water sharing mechanism” since this is the better way in long term water management even during the times of drought.
Plate No: There are six bore wells (though not seen clearly in photo) within 100 meter radius in Zone-2 in Mudimadagu for paddy cultivation.
Optimization of water use is possible only through a conjunctive use of groundwater
and surface water from a closed system. The distribution for this needs to be carefully worked out, based on the principles of local institutions that integrate water balances and community participation.

- 109 -
In order to ensure efficient working of recharge and discharge components, it would be necessary to maintain both these mechanisms through the activities such as regular, periodic de-silting of all structures, progressive increase in vegetative cover, especially along the slopes, well maintenance, continued and improved monitoring of groundwater resources etc.
Communities need to be better informed in order to mitigate negative impacts and
also asses how much of recharged water will actually be available for use during a season; for what purposes; and how can this be harnessed keeping in mind the objectives of a project like watershed development?
Efficient monitoring network can be achieved through a long-term partnership
between local institutions, community and FES. Filling up of the unutilized dug wells (like well in Pathurgadda and Thummalapalle)
which is being filled up by sewage, garbage etc. should be undertaken, in order to avoid contamination of the groundwater from the well.
References
Ramam P.K. and Murty V.N. (1997) Geology of Andhra Pradesh. Geological Society of India, Bangalore, 245p.
Karanth, K.R. (1987) Groundwater assessment, development and management. Tata-McGraw Hill Publ. Co., New Delhi, India, 720p.
Todd, D. K. (1995) Groundwater Hydrology. 2nd edition, John Wiley and Sons (SEA) PTE Ltd, Singapore.
Macdonald, D.M.J., Thomson, D.M. and Herbert, R. (1995ii) Sustainability of yields from wells and boreholes in crystalline basement aquifers. British Geological Survey (NERC) Technical report WC/95/50 © NERC, BGS, UK; 69p.
Pakhmode, V., Kulkarni, H. and Deolankar, S.B. (2003) Hydrogeological- Drainage analysis in watershed-programme planning: a case from the Deccan basalts, India. Hydrogeology Journal, v. 11, pp. 595-604.
Kulkarni H., (1998) Watershed Development and Management - a movement seeking inputs in earth sciences. Jour. Geol. Soc. India, v. 52(2), pp. 239-241.
Strahler, A.N. (1952) Dynamic basis for geomorphology. Bull. Geol. Soc. America, 63: 926-938.
ACWADAM (2000) Strategy for watershed development and management optimizing recharge and water management in the Kavalratti- Salparahalli micro-watershed, Arsikere Taluk, Hassan District, Karnataka (based on rapid geohydrological mapping using remote sensing data). ACWADAM Tech. Report ACWA/Y2K/H-3.

- 110 -
Present Ground Water Scenario
In
Bodireddypalli Micro watershed
A Hydro-geological Study
2010

- 111 -
CHAPTER-I
Introduction Water shortage and its various fall-outs have resulted in increasing application of the “Watershed Development” concept in many areas of the country and it is being increasingly sought as a means to address the problem of water crises. Besides, watershed projects also offer opportunities to address some critical socio-economic issues pertaining to the rural scenario in the country today, especially when many of these issues can be backtracked to the problems of water resources.
However, watershed programmes would benefit immensely by undertaking systematic hydro-geological studies as groundwater resources form an important aspect in most of the watershed development programmes (Kulkarni, 1998). Water exists within a certain physical framework of a watershed. This framework is largely controlled by the local geological conditions. Hence, the planning of a watershed development programme will be more effective if the physical system taking the impact of the measures is understood well. 1.1 Background Foundation for Ecological Security (FES) has been working in Papagni9 River Basin through two Spearhead Teams located in Chintamani under Kolar and Chikkaballapura districts in Karnataka and Madanapalle under Chittoor district in Andhra Pradesh. The organization has been working on natural resource based projects, involving local communities and with a watershed as an approach since the year 1995. One of the characteristics of the project area is the presence of large number of traditional water bodies known as kere’s or tanks but today in a very bad state. FES has been providing valuable inputs in the working areas of watershed development, by undertaking the activities such as contour mapping, detailed hydro- geological characterization and evaluation through rapid appraisal 1.2 Context and Rationale The term ‘precipitation’ signifies all forms of water that is received by earth from the atmosphere and includes rainfall, snowfall, frost, hail etc. When one observes the rainfall pattern, the distribution is uneven and erratic in many parts of the country. This type of erratic and uneven distribution of the rainfall pattern coupled with steadily increasing demand for water due to rapid industrialization, crop diversity and also increasing demand for drinking water, in the light of relatively constant (or even decreasing) supply necessitates an efficient use of this scarce resource. It would mean encouraging the community to judiciously use their limited groundwater resources.
It is in this context that FES undertook this exercise for understanding the relation between the meteorological and geological aspects in the micro watershed. Detailed
9 a tributary of Pennar River

- 112 -
study has been carried out in Mudimadugu micro watershed located in Karnataka to understand the status of both surface and ground water resources. The cropping pattern is highly dependent on the rainfall and groundwater in this area. The water level fluctuations in wells according to the rainfall pattern have been recorded in the study area in order to understand the surface and groundwater scenario and estimating groundwater balance through demand for crops, drinking and supply through rainfall and groundwater. This report is the culmination of a rather rapid mapping appraisal and was conducted as a base-level geological and hydro-geological investigation with the following objectives:
(i) describe the local geological setting of the watershed area, (ii) define exactly and mapping the hydro-geological regime (iii) suggest a broad strategy for watershed development (iv) analyze nature of the meteorological and agricultural aspects with a rainfall
occurrence and agriculture perspective and (v) develop a water audit of the study area (availability & usage of water) in the
context of its geo-hydrological status. 1.3 Outcome/ Result from this Study:
Generating site-specific data on the status of water resources and their use in the study area. When supplemented with data on alternative crops (less water intensive), agricultural best practices etc., the communities living in the area will be able to assess and analyse the water use patterns with respect to water availability and make informed decisions to improve the situation (regulation on bore wells, sharing the water, change in crops, priority of usage – drinking water over irrigation etc.).
Developing a methodology that could be adopted by other agencies involved in
working with communities and natural resources. Disseminating the study methodology and results among govt. and other agencies working on water resources, enabling them to take up such models in their areas of operation and also facilitates decision making on the site selection and land characterization.
1.4 Methodology
The aim of the detailed hydrological, hydro-geological and agricultural and social assessment was to undertake a systematic evaluation of the area’s local geological setting and its impact on local hydrogeological regime and recharge, discharge components, the output of the recharge, discharge and groundwater balance. The methodology used to obtain the data has been explained at the end of the chapter. The methodology of the study included following steps.
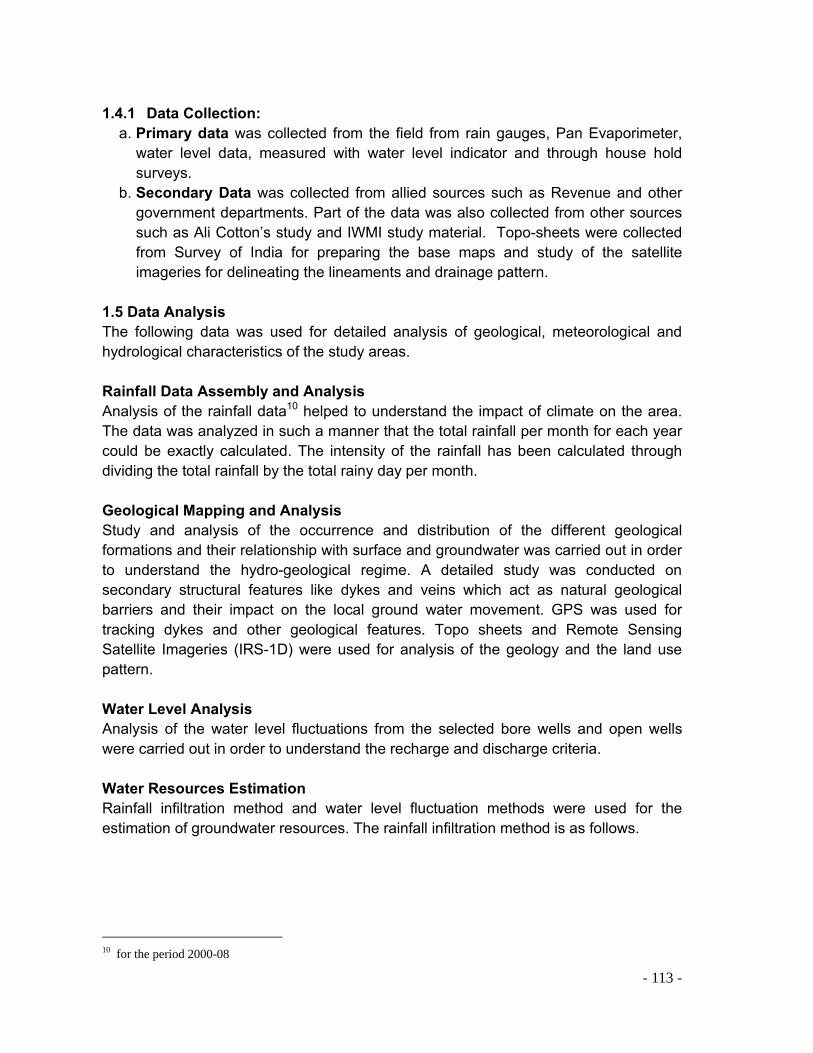
- 113 -
1.4.1 Data Collection: a. Primary data was collected from the field from rain gauges, Pan Evaporimeter,
water level data, measured with water level indicator and through house hold surveys.
b. Secondary Data was collected from allied sources such as Revenue and other government departments. Part of the data was also collected from other sources such as Ali Cotton’s study and IWMI study material. Topo-sheets were collected from Survey of India for preparing the base maps and study of the satellite imageries for delineating the lineaments and drainage pattern.
1.5 Data Analysis The following data was used for detailed analysis of geological, meteorological and hydrological characteristics of the study areas. Rainfall Data Assembly and Analysis Analysis of the rainfall data10 helped to understand the impact of climate on the area. The data was analyzed in such a manner that the total rainfall per month for each year could be exactly calculated. The intensity of the rainfall has been calculated through dividing the total rainfall by the total rainy day per month.
Geological Mapping and Analysis Study and analysis of the occurrence and distribution of the different geological formations and their relationship with surface and groundwater was carried out in order to understand the hydro-geological regime. A detailed study was conducted on secondary structural features like dykes and veins which act as natural geological barriers and their impact on the local ground water movement. GPS was used for tracking dykes and other geological features. Topo sheets and Remote Sensing Satellite Imageries (IRS-1D) were used for analysis of the geology and the land use pattern. Water Level Analysis Analysis of the water level fluctuations from the selected bore wells and open wells were carried out in order to understand the recharge and discharge criteria.
Water Resources Estimation Rainfall infiltration method and water level fluctuation methods were used for the estimation of groundwater resources. The rainfall infiltration method is as follows.
10 for the period 2000-08

- 114 -
Recharge:
(i) Recharge due to precipitation = Rp
(ii) Natural Recharge from lakes, streams (Influent seepages) = Rn
(iii) Artificial Recharge from Canals, Reservoirs, Irrigation return flows
= Ra
(iv) Ground Water inflow from areas outside the basin. = Gi
Discharge:
(i) Evaporation = Et
(ii) Natural Discharge by seepage & stream flow (Effluent seepages)
= De
(iii) Artificial Discharge due to Pumping = Do
(iv) Leakage from a bottom semi confining layer =Go
(v) Ground water outflow to area outside the basin =Ge
(vi) Change in Groundwater Storage =ΔSg
ΔSg = (Rp + Rn + Ra + Gi) – (Et + De + Do + Go + Ge) Recharge due to ppt: Volume of the water was calculated by taking the annual rainfall from the study area multiplied by the area of the study (from the total geographical area). For artificial recharge due to lakes and streams: Recharge due to Canals, Reservoirs, and Irrigation return flows. All the other sources are negligible except the irrigation return flows in both study areas. 25% of the discharge due to pumping has been taken as the recharge due to irrigation return flow due to the soil conditions in these areas. Ground water inflow from outside of the basin: It is also taken as negligible because of hard rock terrain and because of natural geological barriers like dykes.

- 115 -
Evaporation: For estimating it, two Pan Evaporimeters were installed and monitored two times in a given day. Day wise data was assembled and was later analyzed on monthly basis by using formula with pan coefficient taking as 0.70. Natural Discharge from seepage & inflow: this was considered negligible for the study area, as the seepages come to the tanks & therefore recharge the ground water. This has already been calculated as the recharge from tanks. Artificial Discharge due to pumping: For discharge due to pumping. Leakage from a bottom semi-confining layer: It is negligible for this region after considering the local hydrogeology. Ground water outflow to area outside the basin: It is negligible for this region due to the natural geological setting. The Water Level Fluctuation method is as follows: Area X Specific yield X Water table rise In this Specific Yield =Sy Sy = {(Dw + Robf + Sd) – (RFw + Ig)}/ (Wld X Ae) Ground water draft by wells & direct pumping =Dw Base flow =Robf Spring discharge =Sd Winter rainfall =RFw Recharge due to return flow from irrigation =Ig Average water level decline =WLd Effective area of ground water recharge =Ae Annual Groundwater Draft: For analyzing this, demand from population and livestock was considered in addition to the pumping demand. The discharge values of the 7.5 Hp pumps, which are being used in this area, were observed. The discharge measured during the pumping through 100 liters drum, is 2.3-2.5 lit per second. All the pumps are working for 6-8 hours daily. Net Groundwater Availability: is the sum of total monsoon recharge and non-monsoon recharge and deletion with 5% of non-monsoon discharge or baseflow. Stage of Groundwater Development: is computed by following formula. Annual Groundwater Draft / Net Groundwater Availability X 100

- 116 -
Storage Level Rise / fall: is the ratio of Surplus or Shortage to area * 100. Comparison between Water level fluctuation method and Rainfall infiltration method: the following formula is used to compare both methods and finally the water level fluctuation method considered for Mudimadugu due to best available data. (A-B)/B) * 100 = P.D where P.D is the percentage deviation A is the recharge by water level fluctuation method B is the recharge by rainfall infiltration method Depend upon the value of P.D. the recharge value finalized. If P.D is between +20% and -20% than A is the recharge If P.D. is > -20 % = 0.8 * B taken as recharge If P.D. is < 20 % = 1.2 * B taken as recharge GIS Mapping: Advanced software like Geographical Information System was used for generating the maps and analysis of the data and output. Different maps like Geological, Hydrogeological, Soil and Recommendations were prepared.

- 117 -
CHAPTER-II Location & Topography
2.1 Location Bodireddypalli micro watershed is part of Mudimadagu Grama Panchayat which is a part of Srinivaspur Taluk in Kolar district. It lies in agro-climatic zone with semi-arid type of climate with dryness in major part of the year. The area taken up for the purpose of the study is situated on the border of Andhra Pradesh and Karnataka state, where rainfall vagaries and a large-scale over abstraction of groundwater have plagued villages for the last ten years. Twenty two villages11 form part of the Mudimadagu Grama Panchayat. However, only four revenue12 villages form part of the micro watershed.
Latitude of the area varies from 13˚ 34΄ 39.6΄΄ to 13˚35΄ 20.4΄΄ and longitude 78˚ 21΄ 56.4΄΄ to 78˚ 23΄ 27.6΄΄ falling in Survey of India Top sheet numbered 47K/6. The extension of the study area is around 686 Hectares. It is located at the foot hills of Peddakonda and Eswarmala ridges located in the east and north and other small mounds and hillocks in the west forming the catchment for this area.
Bodireddypalli is located about 35 km from Kolar district headquarters and 20km from Srinivaspur Taluk. It can be best approached by the Madanapalle - Bangalore road that passes through Chintamani and Rayalpadu, the nearest small town. 2.2 Topography The topography of the area is undulating with ridges on three sides. Entire drainage flow is towards the south from west, north east and south east. Average annual rainfall of this area is 730mm. Rainfall occurs over a period between June and October, although rain spells in April and November are not uncommon. But the rainfall pattern occurs in two episodes of Monsoon (June-September) and Non-Monsoon (October-May). The mean average temperature in this area is 300C. The mean average elevation of the watershed is 745 m above msl. The highest elevation in the watershed is 1364 m above msl, while the lowest elevation is 800 m above msl.
11 Mudimadagu, Chikkevaripalli, Chintamanipalli, Bodireddypalli, Ooramadigapalli, M. Vyapalapalli,
Malamotakapalli, Anepalli, M. Thummalapalli, Devannagaripalle, Pathurgadda, M. Kothur, Balevaripalle, Bonepalle, Dombarapalli, Guntapalli, Kothpalli, Maramkindapalli, Hakki Pikki Colony, Bagalghatta
12 Chinthamanipalli, Bodireddypalli, Chikkevaripalli and Balevaripalli
- 118 -
CHAPTER III Geology
Detailed geological and hydro-geological study gives an idea about the hydrogeological connectivity of the study area and it is useful in management of the groundwater resources in sustainable manner. Regional hydrogeological study gives a broad idea about the study area but local level study gives a perfect picture of the particular site in local scale which provides specific details like that of the permeability of the rock or soil and transmissivity and storativity properties of the local water bearing formations i.e. aquifers. Regional Geology According to the geological setting of India, more than 70% of the Indian Peninsula is occupied by all varieties (igneous, metamorphic) of hard rocks. Remaining land is occupied by sedimentary and recent alluvial deposits. The present study area is part of southern India which is occupied by older metamorphosed Peninsular Gneisses to younger igneous formations.
The geological history of the Karnataka is largely confined to the two oldest Eras – the Archaeans and Proterozoic. Hence igneous and metamorphic rocks of the Precambrian age occupy about 80% area of the state; remaining area is made of rocks belonging to the Proterozoic and Phanerozoic Eon. The gneissic basement is followed by gneisses, charnokites etc., with younger granites on top, in some areas.
After the igneous episode, many rock sequences were disturbed by tectonic forces and secondary structures like fractures, folds and faults were formed. Later, these secondary structures were intruded by igneous bodies like dykes, Quartz and pegmatite veins, which themselves may have been fractured subsequently. Local Geology in Bodireddypalle Watershed The main rock types in the study area are peninsular gneisses, younger gneisses and secondary intrusive like dykes and Quartz, Pegmatite veins.
This area is part of the regional Archean Complex having outcrops of younger granites and underlain by peninsular gneissic basement. This belt of granites can be correlated with late Archean to Proterozoic aged younger granites of Dharwar craton (Closepet Granites) (Raman and Murthy, 1997).
The local geology of the area falls under Dharwar Stratigraphy. The entire study area is of hard rock terrain with secondary structural features like faults, joints and fractures. Secondary intrusions such as dykes criss-cross the entire area and divide the area into sub hydrogeological units.

- 119 -
The following drawing depicts the lithological cross section of the study area.
Fig 3a: Generalized litho profile of study area
Given below is a brief description of exposed rocks in the study area. According to the local geological setting, the following is the broad description of the rocks exposed in the study area. Peninsular Gneisses Granite gneisses are the important rock types in the area that belong to the Older Peninsular Gneissic Complex. It is composed of banded gneiss and gneissic granite. Being one of the oldest terrains in India, it has undergone many phases of tectonic activity and metamorphism over the years. Whole terrain has rugged and undulating topography. Therefore, the productive zones to extract ground water in these rocks (aquifer) are frequently erratic and unpredictable. The following picture shows the exposed bed rock gneiss in the hill slopes of the study area.

- 120 -
Plate3a: Gneissic Basement Exposure along the slopes of the Granite hillock Younger Granites:
Texturally medium to coarse grained, porphyritic younger granites forms more or less undulating landscape with small and large hillocks and mounds in the study area. These lands are Mineralogically Potash rich, leucocratic granites almost similar to underlying gneisses but less metamorphosed and are more acidic. Secondary Intrusions Dykes The entire study area is criss-crossed by two basic dykes forming a remarkable geological feature in the area. These dykes act as the natural barrier for the ground water in the area. Though they do not allow the groundwater movement across, but allow the groundwater movement sometimes along their walls and divide the area into separate units. The contact zones of these dykes with host rock plays vital role in downward movement and accumulation of the groundwater for deeper confined aquifers. In this area the impact of the dyke is very less compared to other areas because they exposed at the foot hills of the Ambajidurga and separating the Chintamani aquifer system from Western portion.

- 121 -
Plate 3b: Massive Granite Mound overlying the Gneissic rock exposed in the study area
Plate 3c: Dyke Exposure in the study area (Massive)
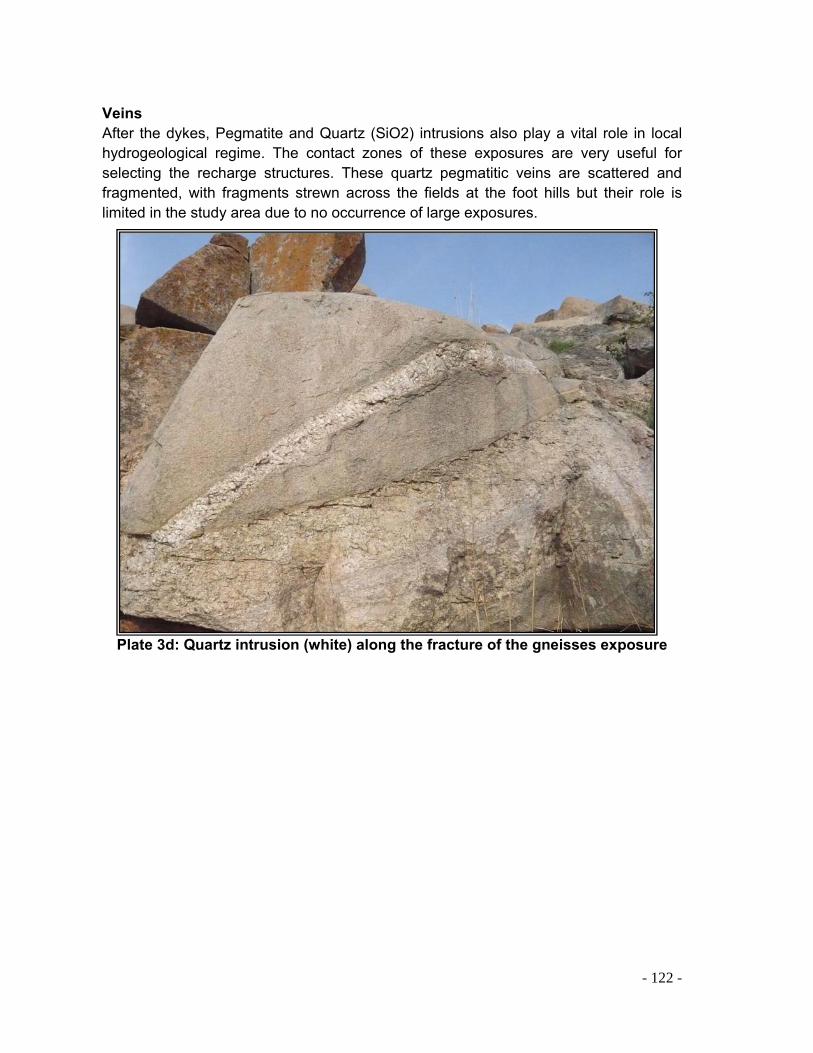
- 122 -
Veins After the dykes, Pegmatite and Quartz (SiO2) intrusions also play a vital role in local hydrogeological regime. The contact zones of these exposures are very useful for selecting the recharge structures. These quartz pegmatitic veins are scattered and fragmented, with fragments strewn across the fields at the foot hills but their role is limited in the study area due to no occurrence of large exposures.
Plate 3d: Quartz intrusion (white) along the fracture of the gneisses exposure

- 123 -
CHAPTER IV Soils
Soils Soil characteristics play a vital role in understanding the geology and hydrogeology of the study area and in suitable site selection for the agriculture or cropping pattern. Soil is the weathered and disintegrated material from parent rock and its characteristics depend on the type and composition of the parent rock. On the ridges or steep slope areas, the soil layer is very thin or absent but in the slopes or downstream may extend upto 30 meters. Few soils such as gravelly or sandy soils allow the downward movement or infiltration and percolation of water more rapidly (200mm/hr). Soils like loamy, silty and clayey soils contain very slow infiltration or percolation rates (1.3mm/hr). Hence, soil characteristics are very important in the site selection for construction of recharge and harvesting structures. Regionally, southern part of India is covered by almost all types of soils. The dominant soil type in the southern India is red and black soil formed from the granite and gneisses and Deccan basalts. Red soils are rich in iron and black soils are rich in organic matter. There are two major classifications of soils: Geological and Agricultural that is based on the size and colour of the soils. Red Gravelly Soils Thin red gravelly soils are mainly seen along the foot hills of the granite mounds and quartz, pegmatite intrusions. This soils show presence of granite and quartz pebbles and is highly permeable in nature. This is the suitable soil for water recharge.
Red sandy Soils Red sandy soils occupy the down portions of the red gravelly soils with 3-5meter in thickness. Both these soils play key role in recharging the rainwater storm or runoff which is comes from the hillocks. Some tanks are located
Fig 4b: Red Sandy soil occupy foot hill region of Bodireddypalle watershed

- 124 -
in this zone contributing more recharge into bore wells which are located further downstream of these tanks due to the high permeable nature of these soils. Red Loamy Soils Thick red loamy soils are dominant soils in this study area. Their thickness varies from 5-15 meters in downstream areas and form part of the regolith portion of the shallow unconfined aquifers. Most of the wells located in this zone contain sand, silt and clay in equal amounts and suitable for cultivation of sunflower, groundnut, and vegetable crops.
The thick black Clay soil occurring further downstream in the study area and along streams is very thick. The moisture content in this zone is high due to its high water holding capacity (porosity) but permeability is less due to its small grain size. Most of the tanks are silted by clay soils which control the groundwater recharge from tanks with less infiltration rate resulting into the high evaporation rate.
Fig 4c: Thick black soil occupy downstream of the study area

- 125 -
4.2 Agriculture & Land use Pattern in study area:
Local perceptive, from the field studies reveal that the landscape surrounding most of the study area is encompassed by buildings, roads and other development activities and moderate agriculture activity. As per the data of Bodireddypalle the total area (including conurbation area) under planning jurisdiction is 686 hectares. Out of this total, developed area is 389 ha, which is almost 60% of total area. Remaining 40% area is under crop land and fallow land in and around the study area.
Table 4a: Present Land Details in Bodireddypalle watershed
Sl. No Description
Village wise area (Ha)
Chintaman palli
Chikke varipalli
Bodireddy palli
Balevari palli
Mudimadagu RV (Ooramadigapalli, Cheruvumarava
palli)
Total
PUBLIC LAND 1 Government
Forest Land 10.00 17.00 150.00 4.00 75.00 256
2 Revenue Land 20.00 13.00 60.00 10.00 30.00 133
Sub-Total 30.00 30.00 210.00 14.00 105.00 389
LAND PRIVATELY OWNED 8
Cropped Area :-
a Seasonally Irrigated 10.00 10.00 5.00 5.00 22.60 52.60
b Rainfed 20.00 44.00 51.00 31.00 98.40 244.40
Sub-Total 30.00 54.00 56.00 36.00 121.00 297.00
TOTAL (ha) 60.00 84.00 266.00 50.00 226.00 686.00

- 126 -
4.3 Demographic details of Bodireddypalli watershed
Table 4b: Demographic details of Bodireddypalli Watershed
Table 4c: Age Group wise Demographical details of Bodireddypalli watershed
Table 4d: No of Household in Bodireddypalli watershed
PARTICULARS No of House holds Population
Landless: 92 239
Landowners 232 1117
Total 324 1356
Average Family size 4.19
AGE - GROUP
TOTAL Population 0-<5 5-<15 15-<40 40-<60 60 and above
Males 12 37 90 45 11 195
Females 11 39 86 50 8 194
Total 23 76 176 95 19 389
SC ST Others
TOTAL
No of Households 186 18 120 324
Population 736 40 580 1356
% to total (HH) 57 6 37100
% to total (Population) 54 3 43100

- 127 -
CHAPTER V
Meteorology
Rainfall Pattern
Rainfall or precipitation is the main source for both surface and groundwater resources. It is important to understand the rainfall characteristics and its behavior on the land in order to estimate its volume, etc. Rainfall is the critical factor for the groundwater recharge (most of the aquifer systems in both areas essentially unconfined and confined). The recharge and discharge parameters depend on several factors such as soil, geology, slope, and land use etc. Rainfall data is very useful to analyze the drought conditions in the area. Climate in Bodireddyipalli is dry and hot during summer. Its average rainfall is 686 mm which is almost same with compare to the district-average but from the last ten years the average rainfall has slightly increased from 686 to 700. From the average rainfall data it can be stated that the intensity generally increases from June to October in a constant manner. In June and July there is a little declination of mean intensity of rainfall for all the years and again it increases in a great manner such that it shows the highest value in the month of October (Graph 5d). Hence two periods of monsoon or double monsoon can be established from this data. Rainfall Analysis in Bodireddypalli Study Area There are two spells of rain that occur due to the South-west monsoon or onset of monsoon and the retreat monsoon or North-east monsoon. The rainfall data from 2000 (January) to 2009 (March) was collected from the Mandal/Taluk office in order to understand and assess the conditions of drought and flood. The graph given below explains the year wise rainfall data including monsoon and non monsoon seasons. It also includes the day-wise, month wise and year wise intensity of rainfall. The average rainfall during the monsoon period is around 423 mm and average rainfall of non-monsoon period is 338 mm.
Graph 5a: Year wise Rainfall Trend from 2000-01 to 2009-10.
0.0 200.0 400.0 600.0 800.0
1000.0 1200.0
Year wise Total Rainfall pattern in Bodireddypalli
Total 719.2 1029.6 563.0 767.2 461.4 1028.4 619.0 1044.8 628.1
2000- 01
2001- 02
2002-03
2003-04
2004-05
2005-06
2006-07
2007-08
2008-09

- 128 -
From the above graph it is clear that there is no meteorological drought within 10 years in this area indicating that this area gets quite good rainfall compared to the district’s average rainfall.
Graph 5b: Monsoon (June-September) Rainfall Trend.
0
100
200
300
400
500
600
700
Year wise Non Monsoon(Oct-May) Rainfall Pattern
Oct-May 225 601.6 193.8 458.6 209.8 502 247.2 461.4 152.7
2000-01
2001-02
2002-03
2003-04
2004-05
2005-06
2006-07
2007-08
2008-09
Graph 5c: Non- Monsoon (October – May) Rainfall Trend.
From the Monsoon and Non-Monsoon rainfall pattern, it is clear that there is decreasing in alternative year in Non-Monsoon rainfall trend compare to monsoon rainfall which is increase in alternate year (except previous five years).
0.0
100.0
200.0
300.0
400.0
500.0
600.0
Monsoon Rainfall (June-Sept) pattern in Bodireddypalli
June-Sept 494.2 428.0 369.2 308.6 251.6 526.4 371.8 583.4 475.4
2000- 01
2001- 02
2002-03
2003-04
2004-05
2005-06
2006-07
2007-08
2008-09

- 129 -
0.0
50.0
100.0
150.0
200.0
Month wise Average Rainfall Pattern
Average 0.0 16.0 20.1 31.8 52.3 79.8 74.5 106. 162. 172. 31.4 22.6
Januar
Februar
March
April
MayJun
eJuly
August
Septem
Octobe
Novem
Decem
Graph 5d: Month wise Rainfall Intensity
From the above graph it is clear that the amount of rainfall recorded is high in October indicating that this area gets more rainfall from the retreating monsoon when compared to monsoons. It is necessary to take the bimodal rainfall pattern for further analysis in this area.
-300.00
-200.00
-100.00
0.00
100.00
200.00
300.00
400.00
Rain fall Deviation from Normal Rainfall (686mm)
Deviation 33.13 343.53 -123.0 81.13 -224.6 342.33 -67.07 358.73 -57.97
2000-01
2001-02
2002-03
2003-04
2004-05
2005-06
2006-07
2007-08
2008-09
Graph 5e: Rainfall Deviation from Normal Rainfall in Bodireddypalli
From the above graph it could be concluded that there are only four drought years with in last nine years period.

- 130 -
Chapter VI
GEOMORPHOLOGY
Geomorphology of the Bodireddypalli With a view to correlate between the geomorphometry of the study area and the hydrological - hydro geological controls in the Bodireddypalli, detailed drainage analysis was carried out for the mapped drainage network. According to the geomorphological characteristics, the present study area comes under 4th order drainage basin. It gradually slopes towards the west and south west, the regional slope being towards the northeast. Elevations are in the range of 1000 to 800 m above mean sea level. The central and eastern parts of the area are mostly plateau areas that are gradually sloping towards the west.
Figure 6a: Geomorphological Map of Bodireddypalle Drainage Pattern The regional drainage pattern is sub dendritic in nature. The drainage usually follows the local topographical trend (slope) from East and North-East to West and South-West. In the high relief zones, the underlying geology with massive crystallines and gneisses shows a distinctly dendritic drainage pattern with a higher drainage density.

- 131 -
Further down, where the permeable soil thickness increases, the drainage density is low, although the pattern is sub-dendritic. Most of the first and second order streams feed into tanks. There are four major tanks and few minor tanks in this study area.
Drainage analysis
Table 6a: Drainage characteristics of the Bodireddypalli Watershed ((Order and Length analysis of sub-basins)
Basin Stream Order
Number of
Streams (N)
Bifurcation Ratio (Bf)
Total Stream Length
(L) (Km)
Average Stream Length
(AvgL)(L/N)
Length ratio (lower order AvgL/high
order AvgL)
Bodireddypalli
1 13 6.5 8.6 0.661538462 -
2 2 2 4.9 2.45 0.270015699
3 1 1 0.332 0.332 7.379518072
4 1 1.359 1.359 0.244297277
Table 6b: Drainage characteristics of the Bodireddypalli Watershed (Area and Drainage ratio analysis)
Basin
Total No. of
streams (N)
Basin area
A (Km2)
Total length
of streams
(L) (Km2)
Drainage density Dd
= L/A (mt/Km2)
Constant of channel
maintenance (1/Dd) (Km2 for 1 Km)
Stream frequency F=N/A (per
Km2 )
Bodireddypalli 17 6.86 15.191 2.21443148 0.451583174 2.47813411
Bodireddypalli study area has one forth order sub-basins. The detailed drainage analysis of the Bodireddypalli study area indicates that the drainage density is around 2.21 mt/km2. This suggests that the study area conforms to drainage morphometry and geo hydrological conditions suitable for better surface permeability. Stream frequency data indicates that, on an average, 2.5 streams are required to drain an area of 100 hectares.

- 132 -
On the whole, the data suggests good prospects for infiltration measures, presuming that such measures are in line with local hydro geological conditions. Bifurcation Ratio Bifurcation ratio is the ratio between higher order stream & lower order stream indicates the impact of the structural control on the basin. If the Bifurcation ratio exceeds five, it indicates structural control drainage pattern. For Bodireddyipalli watershed the ratio is more than 5 in first order streams clearly indicating that there is structural control along these streams. So it is not much very helpful to construct water conservation measures along these streams to recharge water into deeper aquifer system. Drainage Density Drainage density represents the texture of the drainage basin. It is basically a ratio of stream length to the basin area; lesser value indicates that basin carries lesser volume of runoff. The drainage density of the study area confirms to drainage morphometry and geo hydrological conditions not much suitable for better surface permeability. In this area it is confirmed that there is less possibility for recharge conditions but the occurrence of dykes and other hydro-geological characteristics indicating that the permeability is more in Bodireddypalli. Stream Frequency Stream frequency data indicates the number of streams required draining an area of 100 hector. Here Stream frequency data indicates that, on an average, 2.5 streams are required to drain an area of 100 hectares.
The average length ratio The length of the stream indicates the hydrological nature of the contributing surfaces of the drainage network. Permeable media support fewer or less streams that are longer. The length ratio indicates the nature (permeable/impermeable) of the drainage course. If the length ratio is more that indicate more permeable. The ratio of second order channels is little bit more in Bodireddypalli, indicating that they flow through areas where surface permeability is slightly high. On the whole, the data suggests moderate prospects for infiltration measures, presuming that such measures are in line with local hydro-geological conditions.
Constant Channel maintenance Constant channel maintenance is a reciprocal or equal of the drainage density. It is directly proportional to the surface hydraulic conductivity of the underlying rocks. This value also gives an indication of the effective area required to maintain a length of 1 km stream channel. Here in Bodireddypalli the value of constant channel maintenance is less, so hydraulic conductivity is less of the underlying rocks in Bodireddypalli.

- 133 -
CHAPTER VII Hydrogeology
This is the science which deals with the relationship of water with rocks. Understanding the hydrogeology of an area is important prior to understanding the water scenario of the area. It is very helpful in understanding the occurrence and distribution of the groundwater and its movement in hydro geological regime. It is also essential in estimating the surface and groundwater resources and their relationship with meteorological parameters. The primary physical framework of the study area is provided by gneissic rocks, traversed by fractures, dykes and quartz veins. Hence, the hydrological and hydro geological environment is essentially a “hard-rock” domain. Hard rocks are ancient igneous and metamorphic rocks that generally posses low porosity and permeability or hydraulic conductivity (Macdonald et al, 1995). They constitute groundwater systems showing uncertain well-yields with an overall low aquifer-storage potential. Due to the lower hydro geological significance the groundwater potential of this area depends on soil properties, degree of weathering of the parent rock and intensity of lineaments. Hydro geological mapping of the study area was conducted through intensive field inventories to delineate the groundwater system and its characteristics. 7.1 Hydro geological properties of rocks According to the rainfall analysis, this area has experienced good rainfall for the last 10 years. However, the local geology controls the rainfall contribution to the groundwater. The granite terrain is marked with undulating topography. The grains are highly jointed and fractured and these continue up to certain depths. The openness of these spaces decreases with depth and this is something that cannot be easily predicted. The hillocks are barren but their slopes where the weathered soil is thick, groundwater content is rich. Underneath the weathered zone, there is presence of gneissic rock with horizontal to sub horizontal joints and shallow to deep vertical fractures down from 30 - 200m forming confined aquifers in this area. In the study area, since the terrain is mainly granite, the primary porosity of the area is negligible. However, the gneissic granite possesses moderate secondary porosity, thus giving sufficient water sometimes to the wells even during the summer. 7.2 Regional Ground Water System The geological configuration in this area is made up of gneisses and younger crystallines, with structural elements such as fractured pegmatites and jointed dykes. All these elements form components of a complex groundwater system. Such a system will obviously have shallow (unconfined) and deeper (confined) aquifers that need to be understood as both separate as well as interconnected components.

- 134 -
The geological features mainly control the movement and occurrence of the groundwater in this area. The groundwater system in the study area is shallow and deep, formed out of the openings attributed by the foliations and fractures in the gneisses. The drawdown (pumped water level) and radius of influence (the radius distance of affected area due to pumping) clearly indicates that transmissivity is expected to be in the lower range. Bore wells are the only option for the groundwater abstraction from the deeper aquifer system in this area due to the disappearance of the shallow unconfined aquifer system thereby negating the contribution of water from the open wells. Along with that, most open wells have become dry after the bore well revolution. The depth variation of the bore wells is between 75-200m in this area indicating the horizontal and vertical openings in the gneissic rocks along with some preferred orientations, forming the confined aquifers in some locations. The aquifer system in this area is classified, based on their occurrence in various depths and their behavior with regard to the recharging conditions. The following table shows the exposure of aquifers in the study area.
Table 7a: Depth wise Aquifer Classification
S. No Aquifer Depth (m) Aquifer
Type Status
1 1st Aquifer 18 UnconfinedDry
2 2nd Aquifer 30 UnconfinedDry
3 3rd Aquifer 48 UnconfinedDry
1 1st Aquifer 55 Confined Dry
2 2nd Aquifer 73 Confined Less Yield
3 3rd Aquifer 85 Confined Less Yield
4 4th Aquifer 97 Confined Moderate Yield, Quality Deterioration
5 5th Aquifer 121 Confined Moderate Yield, Quality Deterioration
6 6th Aquifer 180 Confined Moderate Yield, Quality Deterioration
This classification is carried out based on the information of water struck during drilling and the water level fluctuations and their response to recharge. Previous drilling data reveals that the water first struck was at a depth of 18-20m. The present drilling data shows that the water struck is at an extreme depth (50 to 60 mt) showing the severity of the situation. Weathered and fractured zone extends up to 26 to 50 meters, and

- 135 -
contributes water to the wells from the unconfined aquifer system. Due to the increased concrete constructions there has been a gradual reduction in soil depth causing more runoff rather than infiltration. The depth of the unconfined aquifer system has fallen significantly in the recent years, due to the sudden increase in the number of bore wells and over exploitation.
Figure 7a: Geological Map of Bodireddypalli Study Area 7.6 Well Inventory Data of Bodireddypalli In order to understand the hydro geological regime in the study area, well inventory data was collected in this area for bore and open wells for the pre monsoon period of the year 2010. Water level indicator was used for water level measurements. About 10 bore wells were selected for long term monitoring in relation to the local geology.

- 136 -
Table 7b: Wells Inventory Data in Bodireddypalli
Well_ID Altitude SWL (m)
Total Depth
(m)
Casing (m)
Drilled Year
Owner Name
BLVP 854 24.6 136 15 2003 Govt.
ACVP 860 21.7 136 12 2005 SriramReddy
DVGP 855 19.4 87 15 2007 Ram Chandra Reddy
MDD 850 16.8 92 12 2006 Venkat Swami
CHMP 845 20.3 105 14 2003 C.Venkat Ramunaa
CKVP 847 22.9 160 32 2005 Pedakka

- 137 -
CHAPTER-VIII Water Level Analysis
Data of Static water levels was collected from the selected wells from 2004 onwards for three seasons (Pre, Syn and Post Monsoon) in Mudimadugu in order to understand the water resources and their estimation and water budgeting. For this purpose the rainfall data from 2003 to 2007 was considered for water level analysis in the study area. Due to the impact of the local geology, dykes in particular control the water movement in this area, (discussed detail in previous chapter). According to these dykes the wells are also divided in to different zones. The analysis described in detail in this chapter is helpful to understand the water resource estimation which is explained in the next chapter. Two methods; “area’s overall water level” and “zone wise water level fluctuation” were used in this chapter to analyse the data in detail. Three months were selected that represent each season in a year, for the data collection. In the month of May water level data was collected for the period of Pre monsoon, the month of October was selected for Monsoon period in Mudimadugu, as the data was available easily.
0
5
10
15
20
25
SWL (m) of PreMonsoon period in Bodireddypalle
SWL (m) 24.6 21.7 19.4 16.8 20.3 22.9
BLVP ACVP DVGP MDD CHMP CKVP
Data of static water levels was collected from the selected wells in pre monsoon period for the year 2010 in order to understand the water resources, their estimation and water budgeting. The analysis of the water level data indicates that the depth of water table in Bodireddypalli is around 21m in pre monsoon period. This is due to the already dried unconfined system and the over abstraction from the deeper aquifer system.

- 138 -
CHAPTER-IX
Water Resources Estimation
Considering the rainfall data over the study area and other data like recharge & discharge, base flow and other geo hydrological parameters the ground water resource estimation has been made for this study area. Analyzing all these data in the most suitable methods suggested by CGWB are “Rainfall infiltration method” in the MS-Excel the above calculation has been done.
Rainfall is the major dependant source in the study area due to the complex hydrogeological system contains few fracture and joint systems which does not contains much storativity and transmissivity.
In this study only one method “Rainfall Infiltration method is used due to the lacking of water level data for three seasons. This method is explained briefly in the below table.
(The methods and formulas for groundwater resources estimation for two study areas taken from the manual of Dynamic Groundwater Resources of India by Central Groundwater Board 2006 with courtesy) 9.1 Water Resources Estimation in Two watersheds through Rainfall Infiltration Method The average rainfall is around 612mm / year. This entire calculation has done for the year of 2009-2010 because of the availability of data. Rrf = f X A X Rainfall The infiltration factor in the study area has been considered as 12% of rainfall due to the shallow and massive crystalline basement with uneven distribution of fracture system and limited thickness of weathered mantle. Total Tank area in Bodireddypalli is 60 Ha and the average depth is around 2 m considered for surface storage. Around 20 % of the total storage has taken as recharge from the surface storage in monsoon season due to the siltation of the tanks by clayey material. The following table showing the water resources estimation from the study area:

- 139 -
Table 9a: Monsoon Recharge due to the Precipitation (June-September)
WS
Monsoon Precipitation (mm) (Jun-Sep) Ppt (m)
Total Area (Ha)
Total Area (m2)
Volume of Monsoon Rainfall
(m3)
Recharge Factor
(%)
Monsoon Recharge
(m3)
Total Surfac
e Storag
e
Recharge from Surface Storage (m3)
Total Monsoon Recharge (m3)
Bodireddypalli 423.18 0.42318 902 9020000 3817083.6 12 458050.032197500
0 395000 853050.032
Table 9b: Non Monsoon Recharge due to the Precipitation (October-May)
WS
Non-Monsoon Precipitation (mm) (Oct-
May) Ppt (m) Total Area
(m2)
Volume of Non-Monsoon
Rainfall (m3) Recharge Factor (%)
Non-Monsoon Recharge (m3)
Bodireddypalli 339.12 0.33912 9020000 3058862.4 12 367036.488
Table 9c: Monsoon Water Budget (June-September)
WS
Total Moosoon Recharge (m3)
Total Monsoon Discharge (m3)
Irrigation Return
Flow (m3)
Water Requirement
(Domestic+Cattle)
Area's Monsoon
Water Requirement
(m3)
Net Groundwater Availability (Ppt+Return Flow+Surface Storage) (m3)
Stage of Groundwater Development
Bodireddypalle 853050.032 453600 113400 9837.9655 463437.9655 966450.032 48
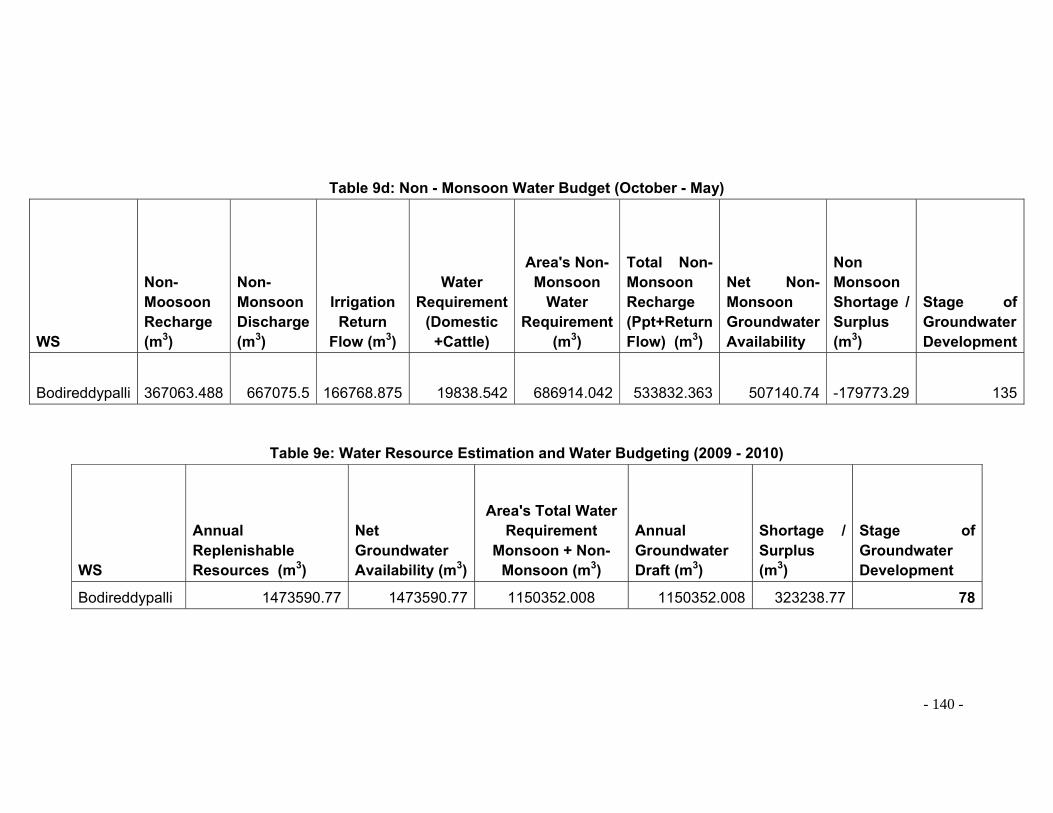
- 140 -
Table 9d: Non - Monsoon Water Budget (October - May)
WS
Non-Moosoon Recharge (m3)
Non-Monsoon Discharge (m3)
Irrigation Return
Flow (m3)
Water Requirement
(Domestic +Cattle)
Area's Non-Monsoon
Water Requirement
(m3)
Total Non-Monsoon Recharge (Ppt+Return Flow) (m3)
Net Non-Monsoon Groundwater Availability
Non Monsoon Shortage / Surplus (m3)
Stage of Groundwater Development
Bodireddypalli 367063.488 667075.5 166768.875 19838.542 686914.042 533832.363 507140.74 -179773.29 135
Table 9e: Water Resource Estimation and Water Budgeting (2009 - 2010)
WS
Annual Replenishable Resources (m3)
Net Groundwater Availability (m3)
Area's Total Water Requirement
Monsoon + Non-Monsoon (m3)
Annual Groundwater Draft (m3)
Shortage / Surplus (m3)
Stage of Groundwater Development
Bodireddypalli 1473590.77 1473590.77 1150352.008 1150352.008 323238.77 78

- 141 -
9.2 Demand for Water in two watersheds The water demand estimated from all sources i.e. domestic, livestock, pumping. 9.2.1 Domestic Water Demand: Water Consumption per capita around 48 lit in Rural Areas (According to House Hold Survey done by FES) Total population in Bodireddypalli watershed is 1356. Total water demand from Population for a year is around 23757 Cub mt in Bodireddypalli watershed. 9.2.2 Water Demand from Livestock: The demand for livestock calculated by the house hold survey by FES. According to this survey it is concluded that the following is the demand from each livestock unit. Table 9f: Water Usage in liters/Day per unit
Cow Buffalo Ox Sheep & Goat
Water Usage 35 30 35 1.5 Table 9g: Water Requirement for Livestock in Bodireddypalle watershed / Day
Watershed
Total Livestock
Consumption Lit/Day
Total Livestock
Consumption cm/Day
Monsoon Requirement
(m3/Year)
Non-Monsoon
Requirement (m3 /Year
Total Livestock
Requirement per Year
Bodireddypalli 16217.5 16.2175 1962.3175 3957.07 5919.38 Total water demand from Livestock for a year is around 5919.38 Cub mt in Bodireddypalli watershed. 9.2.3 Water Demand Due to the Pumping The total groundwater draft estimated from pumping demand. There are about 40 wells are located in two watersheds in these only 34 wells are giving yield.
The average specific yield calculated by the discharge measurement during pumping is 3 liters / second. The average pumping hours from this area is 6 hours due to the current availability in Andhra Pradesh. Total pumping days considered as 275 days/ Year including monsoon pumping.The total Pumping Demand summarized in below table.

- 142 -
Table 9i: Monsoon bore well Discharge (June-September)
Total Area (Ha)
No of Pumps
(BW+OW) Pumping
Days
Pumping Hours Daily
Pumping Hours Yearly
Average Specific
Yield (Lit/Min)
Monsoon Discharge
902 116 80 3.5 280 300 453600
Table 9j: Non Monsoon bore well Discharge (October-May)
WS
Total Area (Ha)
No of Pumps (BW)
Pumping Days
Pumping Hours Daily
Pumping Hours Yearly
Average Specific
Yield (Lit/Min)
Non-Monsoon Discharge
Bodireddypalli 902 116 195 3.5 682.5 181 667075.5
Demand, Supply and Ground water balance in Bodireddypalle watershed
In this study area the supply (1473591cub mt) is more than demand side (1150352 cub mt) and the stage of Ground water development is 78, which comes into semi critical to safe condition.
0
200000
400000
600000
800000
1000000
1200000
1400000
1600000
Demand Supply and Groundwater Balance
Net Available Groundwater (Cub mt) 1473591
Annual Groundwater Draft (Cub mt) 1150352
Safe Extraction (70% of Net AnnualRecharge) (Cub mt)
1031514
2009-10

- 143 -
CHAPTER X Conceptual Hydro geological model for the Study Area
10.1 Supply, Demand and Groundwater Budget in Bodireddypalli Watershed The present groundwater scenario in the Bodireddypalli is little grim due to the over exploitation with high capacity bore wells. The well density is around 4 per Hector. The tables and the graphs given below indicate the Demand & supply and groundwater balance in this area.
Table 10a: Supply, Demand and Groundwater Balance in Bodireddypalli Watershed
WS
Net Available Groundwater (m3)
Annual Groundwater Draft (m3)
Safe Extraction (70% of Net Annual Recharge) (m3)
Stage of Groundwater Development
Bodireddypalli 1473591 1150352 1031514 78
0
200000
400000
600000
800000
1000000
1200000
1400000
1600000
Demand Supply and Groundwater Balance
Net Available Groundwater (Cub mt) 1473591
Annual Groundwater Draft (Cub mt) 1150352
Safe Extraction (70% of Net AnnualRecharge) (Cub mt)
1031514
2009-10
Graph 10a: Supply Demand and Groundwater Balance in Bodireddypalli watershed
Strategy for optimization of water resources from its development to management After the analysis in the study area it is concluded that the demand is more against the supply in Bodireddypalle which necessitates the need to club ‘water management’ simultaneously with water enhancement activities. FES stresses more on the domain of “Enhancement of water resources and their management”. Initially, inputs are required in planning the development of water resources and its implementation, based on the recommendations given in this report.

- 144 -
Recommendations for enhancement of Groundwater Resources in study area Based on geology, hydrogeology and other parameters including soil, the following is the recommendation map prepared for site selection for recharge and water harvesting structure.
Table 10b: Characterization of hydrological zones in two study areas.
Zone Physiography
Lithology / Geology
Hydrogeology Suitability
Zone A (Leather Brown) Runoff zone
Steep slopes
Covered by jointed younger granites with very thin gravelly soil cover
Highly runoff zone. Seasonal flows and dry in summer. Thin vegetative cover, but thick in slopes. Almost forest land.
Suitable for soil conservation activities like gully plugs, earthen bunds etc.,
Zone B (Sky Blue) Recharge Zone
Moderate slopes
Mostly covered by fractured & jointed Younger Granites with thick gravelly to sandy soil
Upper reaches; Seasonal flow of water; streams run dry within a few months from the monsoon. Zone of water table fluctuation. Specific yield likely to be moderate.
Suitable for recharge through percolation tanks, farm ponds and restoration of existing structures.
Zone C (Autunite Yellow) Discharge Zone
Higher order Streams and adjoining terraces of farmland
Lower part of each sub hydrogeological unit with thick clay bed.
Middle to lower reaches; no base flow after monsoon period.
Scope for harvesting water deepening of existing open wells if any.

- 145 -
From the above map it is concluded that there is scope for mobilizing recharge to the groundwater system. Hence, a few feasible sites for percolation tanks are proposed and may be very useful to control the runoff and supports infiltration. Also seen that there are several existing water bodies already, hence all that is needed is to restore them along with the other natural flowing streams. Construction of the recharge structures particularly along the foothills of hillock will feed the water into the deeper aquifer system. Infiltration and percolation rates are very slow due to the shallow depth of gneissic basement and its compactness. Hence, the storage time of water in the structures play a vital role in recharge factor. Water stored for more than six months can be effective for ground water recharge into the deeper aquifer. Otherwise, the water stored in limited unconfined aquifer will serve temporarily. For recharge purpose there is a need to construct a large number of recharge structures like percolation tanks, mini percolation tanks, check dams and farm ponds in this (Recharge zone) zone A. Due to the urbanization of the study area, it may be difficult to obtain sufficient land for the above structures so it is better to initiate injection wells.

- 146 -
Each tank should have been at least 2.5-3 m depth, only then is it possible to enhance the ground water storage.
Encroachment of tanks and supply channels is a rather big social problem but it can be solved through the government intervention and active community participation by stressing on awareness of the available resources. Micro watershed wise development will give the fruitful results in this area. There is a need to construct an efficient underground drainage system with Effluent Treatment Plots for cleaning the drain in the town to avoid nitrate contamination particularly in north and northeastern downstream portion. Recommendations for Sustainable Water Management: In addition to the specific recommendations suggested above, there are also some general principles being provided as suggestions below, primarily to ensure judicious use of water resources.
Initiating Basin Management practices by dividing the study area into different
hydrological units and take-up water enhancement activities. Government should create a Tank Development Authority for managing the harvesting
of storm water in all tanks and as a mandate to preserve and enhance surface water bodies in the area.
Recycling/reusing the water that is thoroughly filtered with the ETP’s to avoid water
contamination. Demand management through regulating the water supply and avoiding the increased
installation of private bore wells. Participatory management through awareness programmes, training programs for
Architects/Engineers/Plumbers and all other stakeholders. Efficient monitoring network can be achieved through a long-term partnership between
local institutions, government and other likeminded stake holders. Filling up of the unutilized dug wells, which are otherwise being filled up by sewage,
garbage etc., in order to avoid contamination of the groundwater from the well.

- 147 -
CHAPTER XI
Conclusions
The detailed water study and stage of groundwater development in study area reveals that this area not much suffering from groundwater over abstraction problem. The functioning of the groundwater system occurs within the physical framework largely controlled by the geological set-up of the Gneissic Granites with Secondary Intrusions like Dykes. The salient features of the groundwater system behaviour are listed below, based on the water level data collected in the study area. Following conclusions and comparisons observed after the detail study.
Surface flow or monsoon runoff, though not observed is bound to be limited to a few days, where the entire drainage network is concerned.
The extension area of the study area is 686 Hectares. Geologically study area is consists with Gneissic Granites. Dolerite and Gabbroic Dykes play a crucial role in controlling the local
hydrogeological regimes and separates the study area into different sub hydrogeological units.
The area for recharge potential is more in the study area. Highest well density with 32 Bore wells yielding water in Bodireddypalli is not very
high. The lower portion of the watersheds, especially the downstream areas carry some
water during the non-monsoon period. This is essentially groundwater discharges observed as “base flow” in the stream channel. An almost non perennial base flow component clearly indicates deepening of the zone of saturation in both watersheds and geological control on local groundwater regime.
Soil permeability on the whole is moderate due to the presence of fragmentary material mixed with top soil on the upland plateau and slopes. In valleys and tank bed areas it is low, but is offset by a less porosity of the soils in the red, clayey soils.
According to the soil condition, Bodireddypalli is more or less permeable with low drainage density and frequency.
The depth of Static Water Level is deeper in Bodireddypalli particularly in peak pre monsoon season and directly affects the Specific Yield.
Abstraction (pumping) from the groundwater system is not much more in the study area.
Groundwater Demand per capita in Bodireddypalli is around 1150352 Cubic Meters and the supply from aquifer is around 1473591 cub mts.

- 148 -
Present Ground Water Scenario
In
Mudivaripalli Micro watershed
A Hydro-geological Study
2010

- 149 -
CHAPTER-I
Introduction Water shortage and its various fall-outs have resulted in increasing application of the “Watershed Development” concept in many areas of the country and it is being increasingly sought as a means to address the problem of water crises. Besides, watershed projects also offer opportunities to address some critical socio-economic issues pertaining to the rural scenario in the country today, especially when many of these issues can be backtracked to the problems of water resources.
However, watershed programmes would benefit immensely by undertaking systematic hydro-geological studies as groundwater resources form an important aspect in most of the watershed development programmes (Kulkarni, 1998). Water exists within a certain physical framework of a watershed. This framework is largely controlled by the local geological conditions. Hence, the planning of a watershed development programme will be more effective if the physical system taking the impact of the measures is understood well.
1.1 Background Foundation for Ecological Security (FES) has been working in Papagni13 River Basin through two Spearhead Teams located in Chintamani under Kolar and Chikkaballapura districts in Karnataka and Madanapalle under Chittoor district in Andhra Pradesh. The organization has been working on natural resource based projects, involving local communities and with a watershed as an approach since the year 1995. One of the characteristics of the project area is the presence of large number of traditional water bodies known as kere’s or tanks but today in a very bad state. FES has been providing valuable inputs in the working areas of watershed development, by undertaking the activities such as contour mapping, detailed hydro- geological characterization and evaluation through rapid appraisal 1.2 Context and Rationale The term ‘precipitation’ signifies all forms of water that is received by earth from the atmosphere and includes rainfall, snowfall, frost, hail etc. When one observes the rainfall pattern, the distribution is uneven and erratic in many parts of the country. This type of erratic and uneven distribution of the rainfall pattern coupled with steadily increasing demand for water due to rapid industrialization, crop diversity and also increasing demand for drinking water, in the light of relatively constant (or even decreasing) supply necessitates an efficient use of this scarce resource. It would mean encouraging the community to judiciously use their limited groundwater resources. It is in this context that FES undertook this exercise for understanding the relation between the meteorological and geological aspects in the micro watershed. Detailed study has been carried out in Mudivaripalli micro watershed located in Karnataka to understand the status of both surface and ground water resources. The cropping pattern is highly dependent on the rainfall and groundwater in this area. The water level fluctuations in wells according to
13 a tributary of Pennar River

- 150 -
the rainfall pattern have been recorded in the study area in order to understand the surface and groundwater scenario and estimating groundwater balance through demand for crops, drinking and supply through rainfall and groundwater.
This report is the culmination of a rather rapid mapping appraisal and was conducted as a base-level geological and hydro-geological investigation with the following objectives:
(i) describe the local geological setting of the watershed area,
(ii) define exactly and mapping the hydro-geological regime
(iii) suggest a broad strategy for watershed development
(iv) analyze nature of the meteorological and agricultural aspects with a rainfall occurrence and agriculture perspective and
(v) Develop a water audit of the study area (availability & usage of water) in the context of its geo-hydrological status
1.3 The Outcome/ Result from this Study Generating site-specific data on the status of water resources and their use in the study
area. When supplemented with data on alternative crops (less water intensive), agricultural best practices etc., the communities living in the area will be able to assess and analyse the water use patterns with respect to water availability and make informed decisions to improve the situation (regulation on bore wells, sharing the water, change in crops, priority of usage – drinking water over irrigation etc.).
Developing a methodology that could be adopted by other agencies involved in working with communities and natural resources. Disseminating the study methodology and results among govt. and other agencies working on water resources, enabling them to take up such models in their areas of operation and also facilitates decision making on the site selection and land characterization.
1.4 Methodology
The aim of the detailed hydrological, hydro-geological and agricultural and social assessment was to undertake a systematic evaluation of the area’s local geological setting and its impact on local hydro geological regime and recharge, discharge components, the output of the recharge, discharge and groundwater balance. The methodology used to obtain the data has been explained at the end of the chapter.
The methodology of the study included the following steps: 1.4.1 Data Collection:
a) Primary data was collected from the field from rain gauges, Pan Evaporimeter, water level data, measured with water level indicator and through house hold surveys.

- 151 -
b) Secondary Data was collected from allied sources such as Revenue and other government departments. Part of the data was also collected from other sources such as Ali Cotton’s study and IWMI study material. Topo-sheets were collected from Survey of India for preparing the base maps and study of the satellite imageries for delineating the lineaments and drainage pattern.
1.5 Data Analysis The following data was used for detailed analysis of geological, meteorological and hydrological characteristics of the study areas. Rainfall Data Assembly and Analysis: Analysis of the rainfall data14 helped to understand the impact of climate on the area. The data was analyzed in such a manner that the total rainfall per month for each year could be exactly calculated. The intensity of the rainfall has been calculated through dividing the total rainfall by the total rainy day per month.
Geological Mapping and Analysis: Study and analysis of the occurrence and distribution of the different geological formations and their relationship with surface and groundwater was carried out in order to understand the hydro-geological regime. A detailed study was conducted on secondary structural features like dykes and veins which act as natural geological barriers and their impact on the local ground water movement. GPS was used for tracking dykes and other geological features. Topo sheets and Remote Sensing Satellite Imageries (IRS-1D) were used for analysis of the geology and the land use pattern. Water Level Analysis: Analysis of the water level fluctuations from the selected bore wells and open wells were carried out in order to understand the recharge and discharge criteria.
Water Resources Estimation: Rainfall infiltration method and water level fluctuation methods were used for the estimation of groundwater resources. The rainfall infiltration method is as follows.
14 for the period 2000-08

- 152 -
Recharge:
(i) Recharge due to precipitation = Rp
(ii) Natural Recharge from lakes, streams (Influent seepages)
= Rn
(iii) Artificial Recharge from Canals, Reservoirs, Irrigation return flows
= Ra
(iv) Ground Water inflow from areas outside the basin. = Gi
Discharge:
(i) Evaporation = Et
(ii) Natural Discharge by seepage & stream flow (Effluent seepages)
= De
(iii) Artificial Discharge due to Pumping = Do
(iv) Leakage from a bottom semi confining layer = Go
(v) Ground water outflow to area outside the basin =Ge
(vi) Change in Groundwater Storage = ΔSg
ΔSg = (Rp + Rn + Ra + Gi) – (Et + De + Do + Go + Ge)
Recharge due to ppt: Volume of the water was calculated by taking the annual rainfall from the study area multiplied by the area of the study (from the total geographical area). For artificial recharge due to lakes and streams: Recharge due to Canals, Reservoirs, and Irrigation return flows. All the other sources are negligible except the irrigation return flows in both study areas. 25% of the discharge due to pumping has been taken as the recharge due to irrigation return flow due to the soil conditions in these areas.

- 153 -
Ground water inflow from outside of the basin: It is also taken as negligible because of hard rock terrain and because of natural geological barriers like dykes. Evaporation: For estimating it, two Pan Evaporimeters were installed and monitored two times in a given day. Day wise data was assembled and was later analyzed on monthly basis by using formula with pan coefficient taking as 0.70. Natural Discharge from seepage & inflow: this was considered negligible for the study area, as the seepages come to the tanks & therefore recharge the ground water. This has already been calculated as the recharge from tanks. Artificial Discharge due to pumping: For discharge due to pumping. Leakage from a bottom semi-confining layer: It is negligible for this region after considering the local hydrogeology. Ground water outflow to area outside the basin: It is negligible for this region due to the natural geological setting. The Water Level Fluctuation method is as follows: Area X Specific yield X Water table rise In this Specific Yield =Sy Sy = {(Dw + Robf + Sd) – (RFw + Ig)}/ (Wld X Ae) Ground water draft by wells & direct pumping =Dw Base flow =Robf Spring discharge =Sd Winter rainfall =RFw Recharge due to return flow from irrigation =Ig Average water level decline = =WLd Effective area of ground water recharge =Ae Annual Groundwater Draft: For analyzing this, demand from population and livestock was considered in addition to the pumping demand. The discharge values of the 7.5 Hp pumps, which are being used in this area, were observed. The discharge measured during the pumping through 100 liters drum, is 2.3-2.5 lit per second. All the pumps are working for 6-8 hours daily. Net Groundwater Availability: is the sum of total monsoon recharge and non-monsoon recharge and deletion with 5% of non-monsoon discharge or base flow. Stage of Groundwater Development: is computed by following formula. Annual Groundwater Draft / Net Groundwater Availability X 100

- 154 -
Storage Level Rise / fall: is the ratio of Surplus or Shortage to area * 100. Comparison between Water level fluctuation method and Rainfall infiltration method: the following formula is used to compare both methods and finally the water level fluctuation method considered for Mudivaripalli due to best available data. (A-B)/B) * 100 = P.D where P.D is the percentage deviation A is the recharge by water level fluctuation method B is the recharge by rainfall infiltration method Depend upon the value of P.D. the recharge value finalized. If P.D is between +20% and -20% than A is the recharge If P.D. is > -20 % = 0.8 * B taken as recharge If P.D. is < 20 % = 1.2 * B taken as recharge GIS Mapping Advanced software like Geographical Information System was used for generating the maps and analysis of the data and output. Different maps like Geological, Hydrogeological, Soil and Recommendations were prepared.
CHAPTER-II Location & Topography
Location The study area, Mudivaripalli is located in the upstream of the Papagni River Basin. Study area is situated in Srinivaspur taluk of Kolar district, forms the eastern most district of the Karnataka state. It lies in agro-climatic zone with semi-arid type of climate with dryness in major part of the year. The study area is situated exactly between the boarder of Andhra Pradesh and Karnataka state, where rainfall vagaries and a large-scale over abstraction of groundwater have plagued villages for the last ten years. The location and the topography are discussed in detail in the following paragraphs. Latitude of the area varies from 13˚ 31΄ 30΄΄ to 13˚33΄ 15.5΄΄ and longitude 78˚ 19΄ 56΄΄ to 78˚ 22΄ 28΄΄ falling in Survey of India Toposheet numbered 47K/6. It is located at the foot hills of Peddakonda and Eswarmala ridges located in the east and north and other small mounds and hillocks in the west forming the catchment for this area.

- 155 -
Fig 2a: Location map of Mudivaripalli micro watershed
This study area is located about 30 km from Kolar district headquarters and 20km from Srinivaspur Taluk. It can be best approached by the Madanapalle - Bangalore road that passes through Chintamani and Rayalpadu. Rayalpadu is the nearest small town located about 10km from the study area. FES has a cluster office in Rayalpadu from where it operates its ecological activities.
2.1 Topography Mostly flat terrain and slopes towards north to northwest from south and southeast. The mean average elevation of the watershed is 815 m above msl. The highest elevation in the watershed is 860 m amsl, while the lowest elevation is 770 amsl.

- 156 -
Fig2b: Topography Map of Mudivaripalli micro watershed

- 157 -
CHAPTER-III Geology
3.1 Regional Geology The geology of Karnataka is classified into different formations based on the age and lithology. The Karnataka craton has been extensively intruded by granites and granitoids of the ca. age 2600 to 2500 million years. The eastern Karnataka abounds in these granites and granitoids. The northern part of Karnataka is made up of Kaladgi and Badami and Bhima Group of sediments, approximately of Proterozoic age. Further north the terrain is covered by extensive volcanic flows known as Deccan traps of Cretaceous -Tertiary age.
After the igneous episode, many rock sequences were disturbed by tectonic forces and secondary structures like fractures, folds and faults were formed. Later, these secondary structures were intruded by igneous bodies like dykes, Quartz and pegmatite veins, which themselves may have been fractured subsequently. 3.2 Local Geology The main rock types in three watershed areas are peninsular gneisses, younger granites, with secondary intrusives like Quartz, Pegmatite veins. This area is a part of the regional Archean Complex having outcrops of younger granites and underlain by peninsular gneissic basement. The local geology in this area falls under Dharwar Stratigraphy. The micro watershed is underlained by hard rock terrain with secondary structural features like faults, joints and fractures.
Fig3a: Geological map of Mudivaripalli micro watershed

- 158 -
Peninsular Gneisses: Granite gneisses are the important rock types in the area that belong to the Older Peninsular Gneissic Complex. It is composed of banded gneiss and gneissic granite. Whole terrain has rugged and undulating topography. Therefore, the productive zones to extract ground water in these rocks (aquifer) are frequently erratic and unpredictable.
Fig 3b: Peninsular Gneisses exposed in the mount of the hillock
Younger Granites Texturally medium to coarse grained younger granites forms undulating landscape with small and large hillocks and mounds in the study area. These lands are Mineralogically Potash rich, leucocratic granites almost similar to underlying gneisses but less metamorphosed and are more acidic and are highly jointed and showing the typical’ Tor Topography’ commonly shown by granites.

- 159 -
Fig 3c: Younger Granite exposure in Mudivaripalli micro watershed
Fig 3d: Quartz vein (white) exposure in Granite Rock

- 160 -
Secondary Intrusions Veins The entire study area is criss-crossed by numerous veins forming a remarkable geological feature in the area. Some small quartz pegmatitic veins are exposed in Mudivaripalli in local scale and scattered and fragmented, with fragments strewn across the foothills. After the dykes, Pegmatite and Quartz (SiO2) intrusions also play a vital role in local hydrogeological regime. The contact zones of these exposures are very useful for selecting the recharge structures. These quartz pegmatitic veins are scattered and fragmented, with fragments strewn across the fields at the foot hills but their role is limited in the study area due to no occurrence of large exposures.

- 161 -
CHAPTER IV Soils
Soil characteristics play vital role in understanding the geology and hydrogeology of the study area and in suitable site selection for the agriculture or cropping pattern. Soil is the weathered and disintegrated material from parent rock and its characteristics depend on the type and composition of the parent rock. The suitable site selection for water and soil conservation and enhancement of the soil moisture activities depends on the thickness, shape and its grain size. The thickness of the soil depends on the slope, degree of the weathering. On the ridges or steep slope areas, the soil layer is very thin or absent but in the slopes or downstream may extend upto 45meters. While gravelly or sandy soils allow the downward movement or infiltration and percolation of water more rapidly (200mm/hr) loamy, silty and clayey soils contain very slow infiltration or percolation rates (1.3mm/hr). Hence, soil characteristics are very important in site selection for construction of recharge and harvesting structures. 4.1 Soil Characteristic in the study area Locally four types of soils were observed to be present in the study areas. These are red gravelly, red sandy, red loamy and clayey soils exposed in different landuse. Thin red gravelly soils are mainly seen along the foot hills of the granite mounds and quartz, pegmatite intrusions. This soils show presence of granite and quartz pebbles and is highly permeable in nature. Under the lower place the red gravelly soil with thick vegetation is seen along the foot hills of the forests. This is the suitable soil for water recharge. Red sandy soils occupy the down portions of the red gravelly soils with 3-5meter in thickness. Both these soils play key role in recharging the rainwater storm or runoff which is comes from the hillocks. Thick red loamy soils are dominant soils in these study areas. Their thickness varies from 5-45 meters in downstream areas and form part of the regolith portion of the shallow unconfined aquifers. The thick black Clay soil occurring further downstream of all hydrogeological units in the study area and along streams is very thick and suitable for rice cultivation. Regionally, southern part of India is covered by almost all types of soils. The dominant soil type in the southern India is red and black soil formed from the granite and gneisses and Deccan basalts. Red soils are rich in iron and black soils are rich in organic matter. There are two major classifications of soils: Geological and Agricultural that is based on the size and colour of the soils.
Red Gravelly Soils Thin red gravelly soils are mainly seen along the foot hills of the granite mounds and quartz, pegmatite intrusions. This soils show presence of granite and quartz pebbles and is highly permeable in nature. This is the suitable soil for water recharge.

- 162 -
Fig 4a: Red Gravelly soils occupy along the foot hills area
Red sandy Soils Red sandy soils occupy the down portions of the red gravelly soils with 3-5meter in thickness. Both these soils play key role in recharging the rainwater storm or runoff which is comes from the hillocks. Some tanks are located in this zone contributing more recharge into bore wells which are located further downstream of these tanks due to the high permeable nature of these soils.

- 163 -
Fig 4b: Red Sandy soil occupy foot hill region of Mudivaripalli micro watershed Red Loamy Soils Thick red loamy soils are dominant soils in this study area. Their thickness varies from 5-15 meters in downstream areas and form part of the regolith portion of the shallow unconfined aquifers. Most of the wells located in this zone contain sand, silt and clay in equal amounts and suitable for cultivation of sunflower, groundnut, and vegetable crops. Black Clay soil The thick black Clay soil occurring further downstream in the study area and along streams is very thick. The moisture content in this zone is high due to its high water holding capacity (porosity) but permeability is less due to its small grain size. Most of the tanks are silted by clay soils which control the groundwater recharge from tanks with less infiltration rate resulting into the high evaporation rate.

- 164 -
CHAPTER V METEOROLOGY
5.1 Rainfall Pattern
Rainfall or precipitation is the main source of water for both surface and groundwater resources. It is important to understand the rainfall characteristics and its behavior on the land in order to estimate its volume, velocity etc. Rainfall is the critical factor for the groundwater recharge (most of the aquifer systems in the study area essentially unconfined and confined). The recharge and discharge parameters depend on several factors such as soil, geology, slope, and land use etc. There is a direct relationship between the rate of infiltration and the intensity of rainfall. However, if the rainfall intensity exceeds the infiltration capacity, the forgoing relationship breaks down and may, indeed, be replaced by an inverse relationship between infiltration and rainfall intensity. This is normally the case when an increase in rainfall intensity is reflected in an increase in the size of the raindrop, and consequently with an increase in their compacting force as the drops strikes the ground surface.
This micro watershed receives rain from both the North-east as well as the South-west monsoon. The total pre monsoon and post monsoon data reveal that there are periods of torrential rain and a period of drought that exists in the region.
Rainfall Pattern
Rainfall or precipitation is the main source for both surface and groundwater resources. It is important to understand the rainfall characteristics and its behavior on the land in order to estimate its volume, etc. Rainfall is the critical factor for the groundwater recharge (most of the aquifer systems in both areas essentially unconfined and confined). The recharge and discharge parameters depend on several factors such as soil, geology, slope, and land use etc. Rainfall data is very useful to analyze the drought conditions in the area.
Climate in Mudivaripalli micro watershed is dry and hot during summer. Its average rainfall is 686 mm which is almost same with compare to the district-average but from the last ten years the average rainfall has slightly increased from 686 to 700.
From the average rainfall data it can be stated that the intensity generally increases from June to October in a constant manner. In June and July there is a little declination of mean intensity of rainfall for all the years and again it increases in a great manner such that it shows the highest value in the month of October. Hence two periods of monsoon or double monsoon can be established from this data.
5.1 Rainfall Analysis

- 165 -
There are two spells of rain that occur due to the South-west monsoon or onset of monsoon and the retreat monsoon or North-east monsoon. The rainfall data from 2000 (January) to 2009 (March) was collected from the Mandal/Taluk office in order to understand and assess the conditions of drought and flood. The graph given below explains the year wise rainfall data including monsoon and non monsoon seasons. The average rainfall during the monsoon period is around 423 mm and average rainfall of non-monsoon period is 338 mm.
Graph 5a: Year wise Rainfall Trend from 2000-01 to 2009-10
From the above graph it is clear that in this study area rainfall increase in alternative year wise. This area gets quite good rainfall compared to the district’s average rainfall.
Monsoon & Non Monsoon Rainfall Distribution in Study Areas
0
100
200
300
400
500
600
700
2000-01 2001-02 2002-03 2003-04 2004-05 2005-06 2006-07 2007-08 2008-09
Year
Ra
infa
ll (m
m)
Monsoon Rainfall Non Monsoon Rainfall
Graph5b: Monsoon & Non Monsoon Rainfall Distribution From the Monsoon and Non-Monsoon rainfall pattern, it is clear that there is decreasing in alternative year in Non-Monsoon rainfall trend compare to Monsoon rainfall which is increase in alternative year (except previous five years).
0.0 200.0
400.0
600.0
800.0
1000.0
1200.0
Year wise Total Rainfall pattern in Mudivaripalli
Total 719.2 1029.6 563.0 767.2 461.4 1028.4 619.0 1044.8 628.1
2000- 01
2001-02
2002-03
2003-04
2004-05
2005-06
2006-07
2007-08
2008-09

- 166 -
Yearwise Deviation from Normal Rainfall
-400
-200
0
200
400
600
800
1000
1200
2000-01 2001-02 2002-03 2003-04 2004-05 2005-06 2006-07 2007-08 2008-09
Rai
nfa
ll (m
m)
Yearly rainfall (mm) deviation (mm)
Graph5c: Deviation from normal rainfall From the above graph it could be calculated that there are five drought years with in last nine years period.
Agriculture & Meteorological Droughts
0
50
100
150
200
250
300
2000-01 2001-02 2002-03 2003-04 2004-05 2005-06 2006-07 2007-08 2008-09
Year
Rai
nfa
ll(m
m)
June July Aug Sep
Graph5d: Agriculture & Meteorological Droughts There are mainly two types of droughts that occur in nature, Meteorological and Agriculture.
Meteorological Drought: If the rainfall in a year is less than the normal rainfall it is considered as the meteorological drought. When the meteorological drought occurs, it

- 167 -
creates many changes in the area in terms of agriculture, water resources and other ecological factors like biomass.
Agricultural Drought: Agricultural drought occurs in two ways. Severe drought occurs when the area gets low rainfall (below 50mm) prior to sowing crops in an area. Farmers usually undertake sowing activity after a heavy spell of rain (50mm). If it does not occur within the specified time, then the area is considered to be affected with severe drought. This analysis is carried out based on the cropping period in different areas.
Generally farmers in Mudivaripalli panchayat area, undertake sowing activities in the month of June, after receiving atleast 50mm of rainfall. This is the minimum rainfall required for crops such as millets and groundnut. Otherwise it becomes difficult to cultivate these crops. Monsoon in this area begins in the month of June. Farmers start sowing at the end of June or 1st week of July. In this background, rainfall data in the month of June in a year is used to assess severe drought. The data is plotted in excel sheet that clearly indicates the period of drought that the area faced for seven years. This clearly indicates that there is no relation between meteorological and moderate droughts because, heavy rainfall occurred in this area, during the year, but it experienced a severe drought.
Yearwise Daily Intensity of Rainfall in Rayalpad
0
5
10
15
20
25
30
35
2000-01 2001-02 2002-03 2003-04 2004-05 2005-06 2006-07 2007-08 2008-09
Year
Rai
nfa
ll (m
m)
Graph 5e: Year wise daily intensity of Rainfall

- 168 -
Chapter VI GEOMORPHOLOGY
Geomorphology With a view to correlate between the geomorphometry of the study area and the hydrogeological controls in three watersheds, detailed drainage analysis was carried out for the mapped drainage network. 6.1 Geomorphology of the Mudivaripalli Watershed According to the geomorphologic characteristics, this area comes under 5th order drainage basin. It gradually slopes towards the northwest, the regional slope being towards the northwest.
Figure 6a: Geomorphological Map of Mudivaripalli micro watershed

- 169 -
6.2 Drainage Pattern The drainage pattern is dendritic to sub dendritic in nature. The drainage usually follows the local topographical trend (slope) from south, southeast and east to northwest. There is one 5th order streams that collect the entire water from the east, south and southeast. There are some two major and nine minor tanks are in this study area.
Table 6a: Drainage characteristics-I
Stream Order
Number of Streams (N)
Bifurcation Ratio (Bf)
Total Stream Length (L) (Km)
Average Stream Length (AvgL)(L/N)
Length ratio (lower order AvgL/high order AvgL)
1 17 4.25 14.57 0.857058824 -
2 4 4 3.94 0.985 0.8701104
3 1 1 1.82 1.82 0.541208791
5 1 4.36 4.36 0.225917431
Table 6b: Drainage characteristics-II
Total No. of streams (N)
Basin area A (Km2)
Total length of streams (L) (Km2)
Drainage density Dd = L/A (Km/Km2)
Constant of channel maintenance (1/Dd) (Km2 for 1 Km)
Stream frequency F=N/A (per Km2
23 8.3 24.69 2.97 0.34 2.77
Bifurcation Ratio Ratio is less than 5 in first order streams in Mudivaripalli clearly indicating that there is no structural control along these streams. So it is not very much helpful to construct water conservation measures along these streams to recharge water into deeper aquifer system. Drainage Density The drainage density of the study area confirms to drainage morphometry and geohydrological conditions are suitable for better surface permeability. In the study area it is confirmed that there is more possibility for recharge conditions in the area but the occurrence of dykes and other hydrogeological characteristics indicating that the permeabilities are more in Gudisivaripalle and Thummalapalle than Mudivaripalli. Constant of Channel Maintenance The constant of channel maintenance suggests that about 34 hectares of catchment area is required to support a 1 km long stream in the area, it indicates that the basin requires small area to maintain a unit stream length and hence the hydraulic conductivity of the basins is slightly high.

- 170 -
Chapter VII Hydrogeology
7.1 Regional Ground Water System The study area is underlain by granite gneisses and schists of Archaean age. The primary physical framework is provided by Archaean crystalline rocks include granites, gneisses. The ground water in these formations occurs in the weathered and fractured zones. These rock types do not posses primary porosity. Due to fractured and weathering, they have developed secondary porosity often giving rise to potential aquifers at depth. Due to the lower hydrogeological significance the groundwater potential of this area depends on soil properties, degree of weathering of parent rock and intensity of lineaments. Hydrogeological mapping of the study area was conducted through intensive field inventories to delineate the groundwater system and its characteristics. 7.2 Ground Water System in the watershed The geological configuration of the entire study area is made up of gneisses, younger crystallines with structural elements such as fractured pegmatites and jointed dykes. All these elements form components of a complex groundwater system in this area. The groundwater system in the study area is shallow and deep, formed out of the openings attributed by the foliations and fractures in the gneisses. The arrangement of grains and their uneven shape of the rocks in the study area make them hydro-geologically insignificant with less storage capacity and transmissivity. Primary porosity is almost negligible in rocks such as granites and gneisses in the study area. The secondary porosity occurs in the form of secondary structures like joints, fractures and fissures in rocks.
The open wells are limited in number and their contribution is negligible to the irrigation, due to the less yield and they go dry in early summer months. The depth of open wells range from 6 to 12 m below ground level. Most of the open wells are overflowing in monsoon but may go dry in early summer.
According to the rainfall analysis, this area is in moderate to good rainfall zone with average rainfall of 750 mm. However, the local geology controls the groundwater contribution from the rainfall but runoff component is reported to be a small component because the drainage density is poor due to the permeable nature of the top soil and the underlying weathered mantle. In order to understand the Hydrogeological regime in the study area, well inventory conducted for 175 wells (bore + dug) and water level information collected in the early pre monsoon periods (Feb09) to understand the water table trend. The depth variation of the bore wells between 50-227 m indicates the horizontal and vertical openings in the gneissic rocks forming the confined aquifers in this area.

- 171 -
7.2.1 Occurrences and behavior of Ground water in Mudivaripalli In this area also there is no influence of dykes due to their absence.
Plate 7a: Hydrogeological Map of Mudivaripalli

- 172 -
Chapter VII Water Level Analysis
8.1 Water Level Analysis in Mudivaripalli micro watershed Well inventory data of total 52 bore wells were collected but 23 wells were selected for water level analysis and long term monitoring of water table trend. Few dug wells were also selected in this area. Given below table is showing the habitation wise water level data of Pre monsoon period (May-June). The average static water level in this area around 19.91 mts. highest values is recorded in Mudivaripalli around 29.13mt and lowest in Kandevaripalle about 10.37 mt.
Table 8a: Well Inventory Data
Owner_Name SWL-May
Well_ Type
Total_ Depth Casing Alt Village Name
Water Supply Bore 23.18 BW 136.36 15.15 778 Bogamvaripalli
B.V.Biya Reddy 24.93 BW 66.67 6.06 779 Bogamvaripalli
Sriram Reddy 26.14 BW 153.64 15.15 782 Bogamvaripalli
Sri Ram Reddy 26.67 BW 136.36 15.15 780 Bogamvaripalli
Narayansami 20.45 BW 100.00 8.18 793 Kashipalli
Ram Krishnappa 20.81 BW 106.06 12.12 788 Kashipalli
Jonne Ramappa 27.69 BW 157.58 19.70 797 Mudivaripalli
Jayanna 29.75 BW 172.73 8.48 799 Mudivaripalli
M.V.Ramakrishnappa 30.17 BW 151.52 10.61 800 Mudivaripalli
Thoka Ramadhas 28.53 BW 127.27 7.58 796 Mudivaripalli
Venkatramunappa 30.63 BW 142.42 9.09 802 Mudivaripalli
Krishna Reddy 44.24 BW 227.27 18.18 810 Madarangpalli
Krishna Reddy 11.4 BW 84.85 0.00 808 Madarangpalli
Krishna Reddy 20.57 BW 227.27 0.00 801 Madarangpalli
M.C. Venkatramuna Reddy 33.7 BW 136.36 18.18 808 Madarangpalli
G.R.Venkatramuna Reddy 43.4 BW 136.36 18.18 806 Madarangpalli
Ramshyam Reddy 4 OW 13.64 0.00 799 Madarangpalli
V.C Venkatramappa 3.5 OW 6.06 0.00 796 Madarangpalli
Krishnappa 1.5 OW 7.58 0.00 795 Madarangpalli
Laxmi Reddy 3 OW 12.12 0.00 800 Madarangpalli
Water Supply Bore 12.54 BW 196.97 15.15 846 Kandevaripalle
Yarrappa Reddy 8.23 BW 90.91 9.09 838 Kandevaripalle
Shankar Reddy 10.64 BW 121.21 10.61 842 Kandevaripalle

- 173 -
0
10
20
30
40
Static water level in Mudivaripalle Observation Bores
Series1 17 19 26 25 26 29 32 11 19 3.2 2.9 1.5 4.3 30 38
BGP2
BGP6
KSP2
KSP4
MVP2
MVP5
MHRP
MHRP
MHRP
MHRP
MHRP
MHRP
MHRP
MHRP
MHRP
Water Level Analysis (May) in Mudivaripalle Watershed
0.00
5.00
10.00
15.00
20.00
25.00
30.00
35.00
Bogamvaripalli Kashipalli Mudivaripalli Madharangpalle Kandlevaripalli
Habitations
Wat
erle
vel (
m)
Graph 8a: Habitation wise Static Water Levels (mt)
The above graph indicating that the water level decline is more in Mudivaripalli, where the groundwater over abstraction is more considered to other areas. Most of open wells are located in Madharangipalle and contributing to Kharif irrigation.
Graph 8b: Post monsoon Static Water Levels (mt) in Mudivaripalli micro watershed

- 174 -
CHAPTER IX
Water Resources Estimation
Water Resources Estimation Considering the rainfall data over the study area and other data like recharge & discharge, baseflow and other geohydrological parameters the ground water resource estimation has been made for these two study areas. Analyzing all these data in the most suitable methods suggested by CGWB are “Rainfall infiltration method” in the MS-Excel the above calculation has been done. Rainfall is the major dependant source in the area due to the complex hydrogeological system contains few fracture and joint systems which does not contains much storativity and transmissivity. In this study only one method “Rainfall Infiltration method is used due to the lacking of water level data for three seasons. This method is explained briefly in the below table. (The methods and formulas for groundwater resources estimation for the study area taken from the manual of Dynamic Groundwater Resources of India by Central Groundwater Board 2006 with courtesy). 9.1 Water Resources Estimation in three watersheds through Rainfall Infiltration Method: The average rainfall is around 730mm / year. In 2006 - 2007 there was less rain fall occurred. This entire calculation has done for the year of 2006-2007 because of the availability of crop data. There are about 10 tanks in this area. This year there were filled partially. So the surface source for irrigation is limited or negligible.
Rrf = f * A * Rainfall The infiltration factor in both areas has been considered as 12% of rainfall due to the shallow and massive crystalline basement with uneven distribution of fracture system and limited thickness of weathered mantle. Total Tank area is in this study area is 46.6 Hectares and the average depth is around 2.5mt. Around 20 % of the total storage has taken as recharge from the surface storage in monsoon season due to the siltation of the tanks by clayey material. The below table(s) show the water resources estimation from the study area

175
Table 9a: Monsoon Recharge due to the Precipitation (June-September)
Monsoon Precipitation (mm) (Jun-Sep)
Total Area (Ha)
Volume of Monsoon Rainfall (Cub mt)
Recharge Factor (%)
Monsoon Recharge (cubic mt)
Total Tank Area (Ha)
Total Tank Area(Sq. Mt)
Total Surface Storage (Cub.mt)
Recharge from Surface Storage (Cub mt)
Total Monsoon Recharge (Cub mt)
475.4 830 3945820 10 394582 71 710000 1420000 284000 678582
Table 9b: Non Monsoon Recharge due to the Precipitation (Oct-May)
Non-Monsoon Precipitation (mm) (Oct-May) Ppt (m)
Total Area (Ha)
Total Area (m2)
Volume of Non-Monsoon Rainfall (Cub mt)
Recharge Factor (%)
Non-Monsoon Recharge (cubic mt)
237.7 0.2377 830 8300000 1972910 10 197291
Table 9c: Monsoon Water Budget (June-September)
Year
Total Monsoon Recharge (cubic mt)
Total Monsoon Discharge (Cub mt)
Irrigation Return Flow (Cub mt)
Water Requirement (Domestic+Cattle)
Area's Monsoon Water Requirement (Cub mt)
Net Groundwater Availability (Ppt+Return Flow+Surface Storage) (Cub mt)
Monsoon Shortage / Surplus (Cub mt)
2008 651959 269568 67392 10837 280405 719351 438946

176
Table 9d: Non - Monsoon Water Budget (October - May)
Non-Monsoon Recharge (cubic mt)
Non-Monsoon Discharge (Cub mt)
Irrigation Return Flow (Cub mt)
Water Requirement (Domestic+Cattle)
Area's Non-Monsoon Water Requirement (Cub mt)
Total Non-Monsoon Recharge (Ppt+Return Flow) (Cub mt)
Natural Discharge (Non-Monsoon) (5%) (Cub mt)
Net Non-Monsoon Groundwater Availability
Non Monsoon Shortage / Surplus (Cub mt)
183979.8 657072 164268 21852.274 678924.274 348247.8 17412.39 330835.41 -348088.864
Table9e: Water Resource Estimation and Water Budgeting (2008 - 2009)
Net Monsoon Groundwater Availability (Cub mt)
Net Non-Monsoon Groundwater Availability (Cub mt)
Net Groundwater Availability (Cub mt)
Area's Monsoon Water Requirement (Cub mt)
Area's Non-Monsoon Water Requirement (Cub mt)
Annual Groundwater Draft (Cub mt)
Shortage / Surplus (Cub mt)
Stage of Groundwater Development
719351 330835 1050186 280404.5785 678924.274 959328.8525 90857.5575 91

- 177 -
9.2 Demand for Water in Mudivaripalli micro watershed The water demand estimated from all sources i.e. domestic, livestock, pumping. 9.2.1 Domestic Water Demand: Water Consumption per capita around 48 lit in Rural Areas (According to House Hold Survey done by FES)
Table 9f: Domestic Water Demand from Mudivaripalli micro watershed Study Area
Total Population
Total Population Consumption
Cub mt/Day
Monsoon Requirement (Cub mt/year)
Non-Monsoon (Cub mt/year)
Total Population Consumption Cub.mt/Year
1509 73680 74 8915 17978 26893
Total water demand from Population for a year is around 26893 Cub mt in Mudivaripalli watershed. 9.2.2 Water Demand from Livestock: The demand for livestock calculated by the house hold survey by FES. According to this survey it is concluded that the following is the demand from each livestock unit.
Table 9g: Water Usage in liters/Day per unit
Water Usage per Cow 35 liters
Water Usage per Buffalo 30 liters
Water Usage per Ox 35 liters
Water Usage per Sheep 1.5 liters
Water Usage per Goat 1.5 liters
Table 9h: Water Requirement for Livestock in Mudivaripalli Panchayat /
Day
Total Water Consumption (Litres/Day) Requirement (Cu mt/Year)
(Cow) (Ox) (Buffalo) (Sheep) (Goat) Total Monsoon
Non-Monsoon Year

- 178 -
9835 4200 878 822 144 15879 1921 3874 5796
Total water demand from livestock for a year is around 5796 Cub mt in Mudivaripalli watershed. 9.2.3 Water Demand Due to the Pumping The total groundwater draft estimated from pumping demand. There are about 52 wells are located in Mudivaripalli. The average specific yield calculated by the discharge measurement during pumping. The specific yield from this area is 2.3 liters / second. The average pumping hours from this area is 6 hours due to the current availability in Karnataka. Total pumping days considered as 270 days/ Year including monsoon pumping. The total Pumping Demand summarized in below table.
Table 9i: Monsoon bore well Discharge (June-September)
Total Area (Ha)
No of Pumps (BW+OW)
Pumping Days
Pumping Hours Daily
Pumping Hours Yearly
Average Specific Yield (Lit/Min)
Average Specific Yield (Lit/Hour)
Monsoon Discharge
830 52 80 6 480 180 10800 269568
Table 9j: Non Monsoon Bore well Discharge (Oct-May)
Total Area (Hect)
No of Pumps (BW)
Pumping Days
Pumping Hours Daily
Pumping Hours Yearly
Average Specific Yield (Lit/Min)
Average Specific Yield (Lit/Hour)
Non-Monsoon Discharge
830 52 195 6 1170 180 10800 657072

- 179 -
CHAPTER X Conceptual hydro geological model
10.1 Supply, Demand and Groundwater Budget in Mudivaripalli micro watershed The present groundwater scenario in the Mudivaripalli watershed is little grim due to the over exploitation with high capacity bore wells. The well density is around 5 per Sq. Km with 50 bore wells and the present depth of the aquifer is around 175 meters in some areas. The tables and the graphs given below indicate the Demand & supply and groundwater balance in this area.
Table 10a: Supply, Demand and Groundwater Balance in the study area
Net Available Groundwater (Cub mt)
Annual Groundwater Draft (Cub mt)
Safe Extraction (70% of Net Annual Recharge) (Cub mt)
Stage of Groundwater Development
1050186 959329 735130 91
0
200000
400000
600000
800000
1000000
1200000
Recharge & Discharge and Groundwater Balance in Mudivaripalle
Mudivaripalle 1050186 959329 735130
Net Available Groundwater (Cub mt)
Annual Groundwater Draft (Cub mt)
Safe Extraction (70% of Net Annual Recharge) (Cub mt)
Graph 10a: Recharge, Discharge & Ground water balance

- 180 -
Table 10d: Storage Level Rise / Fall in three watersheds
Net Available Groundwater (Cub mt)
Annual Groundwater Draft (Cub mt)
Safe Extraction (70% of Net Annual Recharge) (Cub mt)
Shortage / Surplus
Project Area (Sq.Mt)
Storage Level Rise / Fall (Cm)
1050186 959329 735130 90858 8300000 1.17 The above tables reveal that the recharge is much more than the discharge in Mudivaripalli micro watershed. The water level is going to rise approximately 1.17 cm per year in Mudivaripalli micro watershed.

- 181 -
CHAPTER XI Conclusions
The detailed water study and stage of groundwater development in study area reveals that this area suffering from groundwater over abstraction problem. The functioning of the groundwater system occurs within the physical framework largely controlled by the geological set-up of the Gneissic Granites with Secondary Intrusions like Dykes. The salient features of the groundwater system behaviour are listed below, based on the water level data collected both areas. Following conclusions and comparisons observed after the detail study. Surface flow or monsoon runoff, though not observed is bound to be limited
to a few days, where the entire drainage network is concerned.
The extension area of the study area is 960 Hectares.
Geologically study area is consists with Gneissic Granites.
The area for recharge potential is more in the study area.
Highest well density with 52 Bore wells yielding water in Mudivaripalli micro watershed is very high.
The lower portion of the watersheds, especially the downstream areas carry some water during the non-monsoon period. This is essentially groundwater discharges observed as “base flow” in the stream channel. An almost non perennial base flow component clearly indicates deepening of the zone of saturation in both watersheds and geological control on local groundwater regime.
Soil permeability on the whole is moderate due to the presence of fragmentary material mixed with top soil on the upland plateaux and slopes. In valleys and tank bed areas it is low, but is offset by a less porosity of the soils in the red, clayey soils.
According to the soil condition, Mudivaripalli micro watershed is permeable with low drainage density and frequency.
The depth of Static Water Level is deeper in Mudivaripalli micro watershed particularly in peak pre monsoon season and directly affects the Specific Yield.
Abstraction (pumping) from the groundwater system is more in the study area.

- 182 -
Ground water Demand per capita in Mudivaripalli micro watershed is around 959329 Cubic Meters and the supply from aquifer is around 1050186 cub mts.

- 183 -
CHAPTER XII Recommendations and scope for future work
12.1 Strategy for optimization of water resources From watershed development to watershed management After the analysis in the water study area it is concluded that the demand is less against supply in Mudivaripalli watershed which necessitates the need to club ‘water management’ simultaneously with watershed development activities such as soil moisture conservation. Based on the geometry and functioning of the groundwater system in the area it is divided into four distinct sub zones. These zones are characterized in Table 12a.
Table 12a: Characterization of hydrological zones in Mudivaripalli
micro watershed study area
Zone Physiography
Lithology / Geology
Hydrogeology
Suitability
Zone A (Big Sky Blue)
Moderate slopes
Mostly covered by fractured & jointed Younger Granites with thick gravelly to sandy soil
Upper reaches; Seasonal flow of water; streams run dry within a few months from the monsoon. Zone of water table fluctuation. Specific yield likely to be moderate. Transmissivity could be high locally on account of hydraulic conductivity attributed by weathering and fracturing, especially in portions along stream lines
Suitable for recharge through percolation tanks, farm ponds and restoration of existing structures.
Zone B (Berly Green) Moderate to Low Recharge Zone
Intermediate zone with small plateaux and slopes towards stream channels
Underlined by Gneissic Basement with thick loamy soil bed.
This is also seasonal. Relatively medium specific yield but forming semi confined to confined aquifer system with deeper fracture zones in gneissic rocks.
Portion for construction / use of small structures for recharge and storage also.
However, one should remember, that water resources management to be effective and sustainable, should be in tune with the project objectives of

- 184 -
watershed development. The best option, therefore, is to establish a methodology of water use that is systematic enough to consider the specific hydrogeological characteristics. Based on the present investigation for longer time and the conclusions drawn, a broad strategy is being suggested as an attempt towards effective water resources development and management. Below figures depicts the broad strategy suggested for enhancement of water resources and their sustainable management for the study area. The
following map gives the recommendations in study area. Fig 12a: Recommendation Map of Mudivaripalli micro watershed Study
Area 12.2 Recommendations for enhancement of Groundwater Resources in the study areas: The upper slopes and middle portions of the study areas would be most
suitable for Farm pond treatment and it could be intensified in this region along the pegmatite and dyke zones.
There is a scope for mobilizing some recharge to the groundwater system, especially within Zone A. Hence, a few feasible sites for percolation tanks

- 185 -
may be very useful to control the runoff and supports infiltration. It is also known that there is sufficient number of existing natural tanks in the Mudivaripalli micro watershed .
Construction of the recharge structures particularly across the quartz vein intrusions will feed the water into deeper aquifer system.
Infiltration and percolation rates are very slow due to the shallow depth of gneissic basement and its compactness. Hence, the storage time of water in the structures play a vital role in recharge factor. Water stored for more than six months can be effective for ground water recharge into deeper aquifer. Otherwise, the water stored in limited unconfined aquifer will serve temporarily.
There is a need to construct large number of recharge structures like percolation tanks, mini percolation tanks, check dams and farm ponds in this zone. The best place for water development activities is indicated in map as zone-A while considering zone-B as secondary zone. Zone-A is the best suited for recharge when compared to zone-B. Because this zone is underlined by thick gravelly and sandy soil, which contains high infiltration.
Each tank should have been at 2.5-3 mt depth at least in this zone, only then it is possible to enhance the ground water storage. After the construction, equitable sharing of the water is possible through community participation.
For the sustainable water management of this zone, it would be better to look at surface water based “water users” groups. This implies looking at older structures and the possibility of using water from these, especially for protective irrigation. Or, even the use of community wells in this zone…although the well-yields from this zone are bound to be limited, but sustainable in the long run.
Water harvesting for use is feasible in the lowermost reaches (Zone-B) of all zones in the study area, along the course of the drainage channel (3rd or 4th order mainstreams). For this purpose, few small structures have been suggested, the overflow of which will feed a larger structure in the further downstream. These structures will also control the flow of silt into the downstream water bodies.
12.3 Recommendations for Sustainable Water Management: In addition to the specific recommendations suggested above, there are also some general principles being provided as suggestions below, primarily to ensure sustainable use of water resources.

- 186 -
Community based management of groundwater resources is envisaged as the next step in villages. Some of the learning’s from this report will prove to be useful in planning and implementing groundwater management in such villages.
Finally, management of artificial recharge ought to involve a component of ‘better informed’ communities. Communities ought to be posed with such questions as “What after watershed development and artificial recharge” during the post-project management phase. Specifically in Gudisivaripalle, communities need to be informed about the limitations of uncontrolled extraction of groundwater resources and the need for ‘increased community involvement’ in groundwater management and artificial recharge.
Creating the awareness Stakeholders on their resources through Kalajathas or any other communication methods.
The communities should be capacitated to undertake the estimation of water resources, as well as crop water budgeting.
Installation of few Meteorological Equipments such as Rain gauges, and water level indicators for regular monitoring by the community themselves.
Formation of the different institutions for surface and ground water with gender equity or strengthening the already existing institutions like Water User Associations or User Groups.
Conducting exposure visits to those areas where groundwater management is being successfully practiced such as Kothakunta watershed area, and also to the area where the area is worst effected by groundwater overabstraction such as Sidlagatta.
It would be better to encourage the use of shallow groundwater (usually open wells) and establish shallow aquifer systems as a sustainable source of water supply with low discharge, low capacity pumping systems (less than 3-5 hp) since they are most suitable on such wells, so as to build an automated regulatory mechanism of abstraction, which is in agreement with the hydrogeological properties of the groundwater system.
Discourage bore well drilling for irrigation considering long-term problems of overexploitation from hard rocks aquifers in particular. Encourage advanced irrigation techniques like Drip or Sprinkler systems and push them into less water intensive crops like Cereals (Ragi, Maize, and Bajra etc.,) or vegetables and other flowering plants against high water intensive crops like sugarcane and paddy. Encourage the community into “water sharing mechanism” since this is the better way in long term water management even during the times of drought.
- 187 -
Optimization of water use is possible only through a conjunctive use of
groundwater and surface water from a closed system. The distribution for this needs to be carefully worked out, based on the principles of local institutions that integrate water balances and community participation.
In order to ensure efficient working of recharge and discharge components, it would be necessary to maintain both these mechanisms through the activities such as regular, periodic de-silting of all structures, progressive increase in vegetative cover, especially along the slopes, well maintenance, continued and improved monitoring of groundwater resources etc.
Communities need to be better informed in order to mitigate negative impacts and also asses how much of recharged water will actually be available for use during a season; for what purposes; and how can this be harnessed keeping in mind the objectives of a project like watershed development.

- 188 -
Present Ground Water Scenario
In
Kamaravaripalli Micro watershed
A Hydro-geological Study 2010

- 189 -
CHAPTER-I
Introduction
Water shortage and its various fall-outs have resulted in increasing application of the “Watershed Development” concept in many areas of the country. The concept of “Watershed Development and Management” has gained momentum during the recent past, and is being increasingly sought as a means to address the problem of water crises. Besides, watershed projects also offer opportunities to address some critical socio-economic issues pertaining to the rural scenario in the country today, especially when many of these issues can be backtracked to the problems of water resources.
In a watershed or landscape unit, each hydrogeological unit is distinct with certain geological, biophysical and socio-economical parameters. Hence, understanding such relationship with regard to all the essential components is important in development and sustainable management of water resources. It is in this context that the term hydrogeology came in to existence as this provides a platform to design, plan and effective management of water resources. 1.1Background Foundation for Ecological Security (FES) has been working in Papagni15 River Basin through two Spearhead Teams located in Chintamani under Kolar and Chikkaballapura districts in Karnataka and Madanapalle under Chittoor district in Andhra Pradesh. The organization has been working on natural resource based projects, involving local communities and with a watershed as an approach since the year 1995. One of the characteristics of the project area is the presence of large number of traditional water bodies known as kere’s or tanks but today in a very bad state. FES has been providing valuable inputs in the working areas of watershed development, by undertaking the activities such as contour mapping, detailed hydro- geological characterization and evaluation through rapid appraisal. 1.2 Context and Rationale The term ‘precipitation’ signifies all forms of water that is received by earth from the atmosphere and includes rainfall, snowfall, frost, hail etc. When one observes the rainfall pattern, the distribution is uneven and erratic in many parts of the country. This type of erratic and uneven distribution of the rainfall pattern coupled with steadily increasing demand for water due to rapid industrialization, crop diversity and also increasing demand for drinking water, in the light of relatively constant (or even decreasing) supply necessitates an
15 a tributary of Pennar River
- 190 -
efficient use of this scarce resource. It would mean encouraging the community to judiciously use their limited groundwater resources. It is in this context that FES undertook this exercise for understanding the relation between the meteorological and geological aspects in the micro watershed. Detailed study has been carried out in Mudimadugu micro watershed located in Karnataka to understand the status of both surface and ground water resources. The cropping pattern is highly dependent on the rainfall and groundwater in this area. The water level fluctuations in wells according to the rainfall pattern have been recorded in the study area in order to understand the surface and groundwater scenario and estimating groundwater balance through demand for crops, drinking and supply through rainfall and groundwater. This report is the culmination of a rather rapid mapping appraisal and was conducted as a base-level geological and hydro-geological investigation with the following objectives:
(i) Describe the local geological setting of the watershed area (ii) Define exactly and mapping the hydro-geological regime (iii) Suggest a broad strategy for watershed development (iv) Analyze nature of the meteorological and agricultural aspects with a
rainfall occurrence and agriculture perspective and (v) Analyze develop a water audit of the study area (availability & usage of
water) in the context of its geo-hydrological status.
1.4 The Outcome/ Result from this Study:
Generating site-specific data on the status of water resources and their use in the study area. When supplemented with data on alternative crops (less water intensive), agricultural best practices etc., the communities living in the area will be able to assess and analyze the water use patterns with respect to water availability and make informed decisions to improve the situation (regulation on bore wells, sharing the water, change in crops, priority of usage – drinking water over irrigation etc.).
Developing a methodology that could be adopted by other agencies involved in working with communities and natural resources. Disseminating the study methodology and results among govt. and other agencies working on water resources, enabling them to take up such models in their areas of operation and also facilitates decision making on the site selection and land characterization.
1.5 Methodology

- 191 -
The aim of the detailed hydrological, hydro-geological and agricultural and social assessment was to undertake a systematic evaluation of the area’s local geological setting and its impact on local hydro geological regime and recharge, discharge components, the output of the recharge, discharge and groundwater balance. The methodology of the study included following steps. Data Collection a) Primary data was collected from the field from rain gauges, Pan
Evaporimeter, water level data, measured with water level indicator and through house hold surveys.
b) Secondary Data was collected from allied sources such as Revenue and other government departments. Part of the data was also collected from other sources such as Ali Cotton’s study and IWMI study material. Topo-sheets were collected from Survey of India for preparing the base maps and study of the satellite imageries for delineating the lineaments and drainage pattern.
1.6 Data Analysis The following data was used for detailed analysis of geological, meteorological and hydrological characteristics of the study areas. Rainfall Data Assembly and Analysis: Analysis of the rainfall data16 helped to understand the impact of climate on the area. The data was analyzed in such a manner that the total rainfall per month for each year could be exactly calculated. The intensity of the rainfall has been calculated through dividing the total rainfall by the total rainy day per month. Geological Mapping and Analysis: Study and analysis of the occurrence and distribution of the different geological formations and their relationship with surface and groundwater was carried out in order to understand the hydro-geological regime. A detailed study was conducted on secondary structural features like dykes and veins which act as natural geological barriers and their impact on the local ground water movement. GPS was used for tracking dykes and other geological features. Topo sheets and Remote Sensing Satellite Imageries (IRS-1D) were used for analysis of the geology and the land use pattern. Water Level Analysis: Analysis of the water level fluctuations from the selected bore wells and open wells were carried out in order to understand the recharge and discharge criteria.
16 for the period 2000-08

- 192 -
Water Resources Estimation: Rainfall infiltration method and water level fluctuation methods were used for the estimation of groundwater resources. The rainfall infiltration method is as follows. Recharge:
(i) Recahrge due to precipitation = p
(ii) Natural Recharge from lakes, streams (Influent seepages)
= Rn
(iii) Artificial Recharge from Canals, Reservoirs, Irrigation return flows
= Ra
(iv) Ground Water inflow from areas outside the basin = Gi
Discharge:
(i) Evaporation = Et
(ii) Natural Discharge by seepage & stream flow (Effluent seepages)
= De
(iii) Artificial Discharge due to Pumping
= Do
(iv) Leakage from a bottom semi confining layer
= Go
(v) Ground water outflow to area outside the basin = Ge
(vi) Change in Groundwater Storage = ΔSg
ΔSg = (Rp + Rn + Ra + Gi) – (Et + De + Do + Go + Ge) Recharge due to ppt: Volume of the water was calculated by taking the annual rainfall from the study area multiplied by the area of the study (from the total geographical area). For artificial recharge due to lakes and streams: Recharge due to Canals, Reservoirs, and Irrigation return flows. All the other sources are negligible except the irrigation return flows in both study areas. 25% of the discharge due to pumping has been taken as the recharge due to irrigation return flow due to the soil conditions in these areas.

- 193 -
Ground water inflow from outside of the basin: It is also taken as negligible because of hard rock terrain and because of natural geological barriers like dykes. Evaporation: For estimating it, two Pan Evaporimeters were installed and monitored two times in a given day. Day wise data was assembled and was later analyzed on monthly basis by using formula with pan coefficient taking as 0.70. Natural Discharge from seepage & inflow: this was considered negligible for the study area, as the seepages come to the tanks & therefore recharge the ground water. This has already been calculated as the recharge from tanks. Artificial Discharge due to pumping: For discharge due to pumping. Leakage from a bottom semi-confining layer: It is negligible for this region after considering the local hydrogeology. Ground water outflow to area outside the basin: It is negligible for this region due to the natural geological setting. The Water Level Fluctuation method is as follows: Area X Specific yield X Water table rise In this Specific Yield =Sy Sy = {(Dw + Robf + Sd) – (RFw + Ig)}/ (Wld X Ae) Ground water draft by wells & direct pumping =Dw Base flow =Robf Spring discharge =Sd Winter rainfall =RFw Recharge due to return flow from irrigation =Ig Average water level decline =WLd Effective area of ground water recharge =Ae Annual Groundwater Draft: For analyzing this, demand from population and livestock was considered in addition to the pumping demand. The discharge values of the 7.5 Hp pumps, which are being used in this area, were observed. The discharge measured during the pumping through 100 liters drum, is 2.3-2.5 lit per second. All the pumps are working for 6-8 hours daily. Net Groundwater Availability: is the sum of total monsoon recharge and non-monsoon recharge and deletion with 5% of non-monsoon discharge or baseflow.

- 194 -
Stage of Groundwater Development: is computed by following formula. Annual Groundwater Draft / Net Groundwater Availability X 100 Storage Level Rise / fall: is the ratio of Surplus or Shortage to area * 100. Comparison between Water level fluctuation method and Rainfall infiltration method: the following formula is used to compare both methods and finally the water level fluctuation method considered for Mudimadugu due to best available data. (A-B)/B) * 100 = P.D where P.D is the percentage deviation A is the recharge by water level fluctuation method B is the recharge by rainfall infiltration method Depend upon the value of P.D. the recharge value finalized. If P.D is between +20% and -20% than A is the recharge If P.D. is > -20 % = 0.8 * B taken as recharge If P.D. is < 20 % = 1.2 * B taken as recharge GIS Mapping Advanced software like Geographical Information System was used for generating the maps and analysis of the data and output. Different maps like Geological, Hydrogeological, Soil and Recommendations were prepared.

- 195 -
CHAPTER-II Location & Topography
Location The study area is located in the upstream of the Papagni River Basin. Kamarvaripalli is part of Thimmampalle Panchayat situated in Bagepalle taluk of Chikaballapur district. It lies in agro-climatic zone with semi-arid type of climate with dryness in major part of the year. This watershed17 is falling in toposheet no 57/g/13 and in between 77055’ E to 77056’E in longitude and 13048’ N to 13052’ N in latitude. The extension of the study area is around 919.5 ha. It is located at the foot hills of Itikaladurga State forest forming ridges in north and west. This study area is located about 22 km from Bagepalle Taluka headquarters and 25km from Kadiri. It can be best approached by the Bagepalle-Kadiri road that passes through the area
17 Five habitations are part of the watershed which include Kamaravaripalli, Mullangichetlupalli,
Boyinavaripalli, G.Cherlopalli and Kolimpalli

- 196 -
Figure 2b: Topography Map
2.2 Topography of Kamaravaripalli Watershed
The topography of the area is undulating with ridge portion in northern and western side. Entire drainage flow is towards the south east from north, northwest and northeast. The mean average elevation of the watershed is 869.5 msl with highest elevation at 1021 msl and the lowest at 718 msl.

- 197 -
CHAPTER III Geology
Prior to initiating a watershed program in a given area, it is essential to study the local geological characters based on rock formations, soil parameters and natural geological controls and its hydrogeological connectivity of the area. It is very crucial in land characterization, particularly suitability of land for watershed activities like water resources development, soil moisture conservation and livestock enhancement. Site with shallow hard rock basement or thick clay soil is suitable for constructing the harvesting structures. Sites with deep hard rock basement or hard rock with intensive fractures, highly weathered and thick gravelly or sandy soil are suitable for constructing the recharge structures like percolation tanks and farm ponds. 3.1 Regional Geology According to the geological setting of India, more than 70% of the Indian Peninsula is occupied by all varieties (igneous, metamorphic) of hard rocks. Remaining land is occupied by sedimentary and recent alluvial deposits. The present study areas forms part of southern India which is occupied by older metamorphosed Peninsular Gneisses to younger igneous formations.
The geological history of the Karnataka is largely confined to the two oldest eras – the Archaeans and Proterozoic. Hence igneous and metamorphic rocks of the Precambrian age occupy about 80% area of the state; remaining area is made of rocks belonging to the Proterozoic and Phanerozoic Eon. Tertiary rocks are exposed along the coastal regions. The gneissic basement is followed by granites, charnokites and khondalites with younger granites on top, in some area.
After the igneous episode, many rock sequences were disturbed by tectonic forces and secondary structures like fractures, folds and faults were formed. Later, these secondary structures were intruded by igneous bodies like dykes, quartz and pegmatite veins, which themselves may have been fractured subsequently. 3.2 Local Geology The local geology of the area falls under Dharwar Stratigraphy. This area is a part of the regional Archean Complex having outcrops of younger granites and underlain by peninsular gneissic basement. The main rock types are peninsular gneisses, younger gneisses and secondary intrusives like dykes and Quartz, Pegmatite veins. The entire study area is of hard rock terrain with secondary structural features like faults, joints and fractures. Most of the secondary intrusions such as

- 198 -
dykes criss-cross the entire area and divide both areas into sub hydrogeological units.
Given below is a brief description of exposed rocks in the watershed.
Peninsular Gneisses:
Granite gneisses are the important rock types in the area that belong to the Older Peninsular Gneissic Complex and are composed of banded gneiss and gneissic granite. Being one of the oldest terrains in India, it has undergone many phases of tectonic activity and metamorphism over the years. Whole terrain has rugged and undulating topography. Therefore, the productive zones to extract ground water in these rocks (aquifer) are frequently erratic and unpredictable. The following picture shows the exposed bed rock gneiss in the hill slopes of the Kamaravaripalli Watershed.
Photo3a: Gneissic Basement Exposure along the slopes of the Granite hillock
Younger Granites
Texturally medium to coarse grained, porphyritic younger granites forms more or less undulating landscape with small and large hillocks and mounds in the study area. These lands are Mineralogically Potash rich, leucocratic granites almost similar to underlying gneisses but less metamorphosed and are more acidic. Both the study areas show the outcrops of grey colored granites which

- 199 -
are highly jointed and show the typical’ Tor Topography’ commonly shown by granites.
Photo 3b: Fractures in
Granite Mound overlying Gneissic basement
Secondary Intrusions
Dykes: Two major dykes are exposed in the watershed dividing this area into two different hydrogeological zones. The trend of these dykes is NW-SE. the composition is mainly doleritic.
Photo 3c: Dyke Exposure in the study area
Veins: After the dykes, quartz intrusions also play a vital role in local hydrogeological regime. The contact zones of these exposures are very useful for selecting the

- 200 -
recharge structures. These structures are linear but there extension is in local scale. These quartz veins are scattered and fragmented, with fragments strewn across the fields of both study areas.
Photo 3e: Small Quartz intrusion (white) along the fracture of the granite exposure
The following map show’s the local geological setting of the study area
Figure 3b: Geological Map

- 201 -
CHAPTER IV Soils
Soil characteristics play vital role in understanding the geology and hydrogeology of the study area and in suitable site selection for the agriculture or cropping pattern. Soil is the weathered and disintegrated material from parent rock and its characteristics depend on the type and composition of the parent rock. The suitable site selection for water and soil conservation and enhancement of the soil moisture activities depends on the thickness, shape and its grain size. The thickness of the soil depends on the slope, degree of the weathering. On the ridges or steep slope areas, the soil layer is very thin or absent but in the slopes or downstream may extend upto 45meters. While gravelly or sandy soils allow the downward movement or infiltration and percolation of water more rapidly (200mm/hr) loamy, silty and clayey soils contain very slow infiltration or percolation rates (1.3mm/hr). Hence, soil characteristics are very important in site selection for construction of recharge and harvesting structures.
4.1 Soil Characteristic
Locally four types of soils were observed to be present in the study areas. These are red gravelly, red sandy, red loamy and clayey soils.
Red Gravelly Soils
Thin red gravelly soils are mainly seen along the foot hills of the granite mounds and quartz, pegmatite intrusions. This soils show presence of granite and quartz pebbles and is highly permeable in nature. This is the suitable soil for water recharge.

- 202 -
Photo 4a: Thick red gravelly soil at the foot hills of the granite mound with dyke exposure
Red sandy Soils
Red sandy soils occupy the down portions of the red gravelly soils with 3-5meter in thickness. Both these soils play key role in recharging the rainwater storm or runoff which is comes from the hillocks. Some tanks are located in this zone contributing more recharge into bore wells which are located further downstream of these tanks due to the high permeable nature of these soils.
Photo 4b: showing the thick red loamy soil exposure in study area
Red Loamy Soils
Thick red loamy soils are dominant soils in these study areas. Their thickness varies from 5-45meters in downstream areas and form part of the regolith portion of the shallow unconfined aquifers. Most of the wells located in this zone contain sand, silt and clay in equal amounts and suitable for cultivation of sunflower, groundnut, and vegetable crops.
Black Clayey soils
The thick black Clay soil occurring further downstream in the study areas and along streams is very thick. The moisture content in this zone is high due to its high water holding capacity (porosity) but permeability is less due to its small grain size. Most of the tanks are silted by clay soils which control the

- 203 -
groundwater recharge from tanks with less infiltration rate resulting into the high evaporation rate.
4.2 Agriculture & Land use Pattern in Kamaravaripalli Watershed
Local perceptive, from the field studies reveal that the landscape surrounding both the study areas, show degraded vegetation in the uplands and thick vegetation in low lying lands where soil is thick. Most of the study area is encompassed by coarse, fragmentary material mixed with soil. Land-use is in the form of rain fed mixed cropping with barren patches.
The economy of the area is mainly dependent on agriculture. In the absence of perennial rivers, canals, tanks both the areas depend mostly on ground water through bore well irrigation. Paddy is the main crop in both areas and groundnut is common rainfed variety with tomato. The cropping pattern and the persistence of irrigation in summer indicate the potential for over abstraction of groundwater is little high in both areas.

- 204 -
CHAPTER V Meteorology
5.1 Rainfall Pattern Rainfall or precipitation is the main source of water for both surface and groundwater resources. It is important to understand the rainfall characteristics and its behavior on the land in order to estimate its volume, velocity etc. Rainfall is the critical factor for the groundwater recharge (most of the aquifer systems in the study area essentially unconfined and confined). The recharge and discharge parameters depend on several factors such as soil, geology, slope, and land use etc. There is a direct relationship between the rate of infiltration and the intensity of rainfall. However, if the rainfall intensity exceeds the infiltration capacity, the forgoing relationship breaks down and may, indeed, be replaced by an inverse relationship between infiltration and rainfall intensity. This is normally the case when an increase in rainfall intensity is reflected in an increase in the size of the raindrop, and consequently with an increase in their compacting force as the drops strikes the ground surface. This microwatershed receives rain from both the North-east as well as the South-west monsoon. The total pre monsoon and post monsoon data reveal that there are periods of torrential rain and a period of drought that exists in the region. Meteorological parameters such as rainfall data is analyzed in detail for the study area. The annual average rainfall is around 700 mm with 374 mm in monsoon and 324 mm in non monsoon period indicating that this area getting almost equal rainfall in two spells and the rainfall intensity is more in October. The total monsoon and non monsoon data reveal that there are periods of torrential and a period of drought that exists in the region. The rainfall data from 1990 to 2009 analyzed to find the year wise trend.
Yearwise Rainfall Pattern of Bagepalle Taluka
0
200
400
600
800
1000
1200
90-91 91-92 92-93 93-94 94-95 95-96 96-97 97-98 98-99 99-00 00-01 01-02 02-03 03-04 04-05 07-08 08-09Year
Rai
nfal
l (m
m)

- 205 -
Monsoon Rainfall Pattern in Bagepalle Taluka
0
100
200
300
400
500
600
700
800
900
90-91 91-92 92-93 93-94 94-95 95-96 96-97 97-98 98-99 99-00 00-01 01-02 02-03 03-04 04-05 07-08 08-09
Year
Rai
nfa
ll (m
m)
Non Monsoon Rainfall Pattern in Bagepalle Taluka
0
100
200
300
400
500
600
700
800
900
90-91 91-92 92-93 93-94 94-95 95-96 96-97 97-98 98-99 99-00 00-01 01-02 02-03 03-04 04-05 07-08 08-09
Year
Rai
nfa
ll (m
m)
Graph 5a: Year wise Rainfall Trend from 1990 to 2009 (2005-06 missing) From the above graph it clearly show that the study area is a good rainfall zone but from 1996-97 its (rainfall) increase in alternative years. In 1996-97 is the highest rainfall year it shows more than 1000mm of rainfall happened in this year.
Graph 5b: Monsoon (June-Sep) Rainfall Trend from 1990 to 2009.
Here we consider only the Monsoon rain fall pattern (June-September). The average monsoon rainfall in this area is 374mm. The above graph shows good monsoon rainfall for last two years 2007-08 & 2008-09).
Graph 5c: Non- Monsoon (Oct–May) Rainfall Trend from 1990 to 2009

- 206 -
Yearwise Deviation from the normal rainfall in Bagepalle Taluka
-500
-400
-300
-200
-100
0
100
200
300
400
500
90-91 91-92 92-93 93-94 94-95 95-96 96-97 97-98 98-99 99-00 00-01 01-02 02-03 03-04 04-05 07-08 08-09
Year
Rai
nfa
ll (m
m)
In this graph we consider the non monsoon rainfall pattern (October to May) which shows that for last ten years it’s increase in alternative years. The average Non monsoon rainfall in this study area is 324mm.
Monthly Average Rainfall in Bagepalle Taluka
0.00
20.00
40.00
60.00
80.00
100.00
120.00
140.00
160.00
180.00
200.00
Jun Jul Aug Sep Oct Nov Dec Jan Feb Mar Apr May
Month
Avg
.Rai
nfa
ll (m
m)
Graph 5d: Average Monthly Rainfall Trend from 1990 to 2009.
From the above graph it is clear that the amount of rainfall recorded is high in October indicating that this area gets more rainfall from the retreating monsoon when compared to monsoon. It is necessary to take the bimodal rainfall pattern for further analysis in this area.
Graph 5f: Rainfall Deviation from Normal Rainfall in Kamaravaripalli

- 207 -
The above graph indicating that during the past 16 years in around 10 years less rainfall recorded clearly indicating the more drought conditions dominating in this area.
Chapter VI Geomorohology
6.1 Importance of the Geomorphology The study of the drainage pattern and its characteristics is called as Geomorphology and it is a very useful tool for analyzing the nature of the soil and hydrogeological characteristics of the study area. Geomorphological analysis reveal the nature of contributing surfaces, both the surface drainage as wells as the infiltration component (Kulkarni, 1991). Moreover, during the study, it was thought that drainage analysis would help reveal the nature of water flow in a regime, where there are permeable soils above the relatively impermeable rocks and the information about tectonic controls on the area. Entire drainage pattern was mapped by using the GIS software by using the SOI topo-sheet with a scale of 1: 50,000. Drainage lines are narrow but shallow in depth. In the lower reaches of higher order streams, the drainage lines which are wide, appear to be structurally controlled or following the lineaments. But most of the drainage lines in lower reaches turn shallow, due to siltation and vegetative growth. These drainage lines are mapped by the intensive field investigation. However, some of the changes may occur due to the land-use pattern, encroachments of farmlands and common lands (uncultivated / drainage lines).

- 208 -
Figure 6a: Geomorphological Map
With a view to correlate between the geomorphometry of the study area and the hydrological - hydrogeological controls in the watershed, detailed drainageanalysis was carried out for the mapped drainage network.
6.1Geomorphology of the Watershed
According to the geomorphological characteristics, this area comes under 3rd order drainage basin. It gradually slopes towards the south east, the regional slope being towards the east to southeast, with elevations are in the range of 1020 to 715 msl.
6.1.1 Drainage Pattern
The drainage pattern is dendritic to sub dendritic in nature. The drainage usually follows the local topographical trend (slope) from WNW to east and southeast. There is one 3rd order stream that collects the entire water from the west north and north east except south. There are some six minor and two major tanks in this study area.

- 209 -
Table 6c: Drainage characteristics of the Watershed
Stream Order
Number of Streams (N)
Bifurcation Ratio (Bf)
Total Stream Length (L) (Km)
Average Stream Length (AvgL)(L/N)
Length ratio (lower order AvgL/high order AvgL)
1 25 3.125 13.157 0.52628 - 2 8 4 3.857 0.482125 1.091584133 3 2 2 2.198 1.099 0.438694268
The average bifurcation ratio of this area indicates that there is no structural control in this area. The average length ratio of second order channels is little bit more, indicating that they flow through areas where surface permeability is slightly high.
Table 6d: Drainage characteristics of Watershed -II
(Area and Drainage ratio analyses)
Total No. of streams (N)
Basin area A (Km2)
Total length of streams (L) (Km2)
Drainage density Dd = L/A (Km/Km2)
Constant of channel maintenance (1/Dd) (Km2 for 1 Km)
Stream frequency F=N/A (per Km2
35 9.195 19.212 2.089396411 0.478607121 3.806416531 The drainage density of the study area confirms to drainage morphometry and geo hydrological conditions suitable for better surface permeability but the scope for permeability is less. It is also confirmed that there is less possibility for recharge conditions in this watershed. Stream frequency data also supports this conclusion as this basin contains lesser number of streams per unit area.
The constant of channel maintenance suggests that about 70 and 48 hectares of catchment area is required to support a 1 km long stream in both areas, it indicates that the basin requires very small areas to maintain a unit stream length and hence the hydraulic conductivity of the basins is slightly high.

- 210 -
0
5
10
15
20
25
30
35
Comparision of Morphometry in Both Watersheds
Jeekavandlapalli 13 10.291 14.592 1.417938 0.705249454 1.263239724
Kamaravaripalli 35 9.195 19.212 2.089396411 0.478607121 3.806416531
Total No. of streams (N)
Basin area A (Km2)
Total length of streams (L) (Km2)
Drainage density Dd =
L/A
Constant of channel
maintenanc
Stream frequency F=N/A (per
Graph 6a: Comparison of Morphology in Both Watersheds
From the tables above, these observations can be attributed to the higher permeability of the rocks in Jeekwandlapalli as compared to those in Kamaravaripalle. This contributes to more infiltration to the groundwater system at Jeekwandlapalli. On the whole, the data suggests good prospects for infiltration measures, presuming that such measures are in line with local hydrogeological conditions.

- 211 -
Chapter VII HYDROGEOLOGY
This is the science which deals the relationship of the water with rocks. Understanding the hydrogeology is important prior to initiating the water shed development projects. It is very helpful in understanding the occurrence and distribution of the groundwater and its movement in hydrogeological regime. It is also very helpful in estimating the surface and groundwater resources and their relationship with meteorological parameters. The primary physical framework for the study areas is provided by gneissic rocks, traversed by fractures, dykes and quartz veins. Hence, the hydrological and hydrogeological environment is essentially a “hard-rock” domain. They constitute groundwater systems showing uncertain well-yields with an overall low aquifer-storage potential. Due to the lower hydrogeological significance the groundwater potential of this area depends on soil properties, degree of weathering of parent rock and intensity of lineaments. Hydrogeological mapping of the area was conducted through intensive field inventories to delineate the groundwater system and its characteristics. Kamaravaripalli watershed falls under moderate rainfall zone. The average rainfall in this watershed is around 700 mm; the runoff component is reported to be a small component when compared to the water balance of ten years. Because, in the study area, the drainage density is poor due to the permeable nature of the top soil and the underlying weathered mantle. In order to understand the hydrogeological regime in study area, about 43 wells in Kamaravaripalli study area was considered for the well inventory, from the year 2009. Water level indicator was used for regular water level measurements in all the seasons. Detailed water level analysis is described in the following chapter. The detailed groundwater system in the areas is explained in the following paragraphs.
7.1 Regional Ground Water System
Study area underlained by peninsular gneissic rocks comprising gneisses and granite with poor hydrogeological properties such as porosity and permeability or hydraulic conductivity. The bore well lithology clearly indicating that the Weathered and fractured zone extended up to 18 meters, and contributes to the water to the well from unconfined aquifer system in monsoon period.
7.2 Groundwater System in Kamaravaripalli Watershed
There are more than 43 wells including 5 dug wells drilled for the purpose of irrigation and drinking. The depth range of bore wells is from 40m to 180m. Most of the wells are individual wells, used for irrigation, except for drinking

- 212 -
water wells which were drilled by the Government. Some bore wells were drilled by the Government for installation of hand-pumps or for energized water supply to local communities. In order to understand the local groundwater system, Hydrogeological maps were prepared. Locations of dug wells and drainage network have been marked on the Hydrogeological map.
7.3.1 Occurrences and behavior of Ground water
There is one major dyke passing through this area and traverses in NW-SE direction and dividing this area into two hydrogeological units. Quartz material is dominant but major exposures are absent.
Figure7a: Hydrogeological Map of Kamaravaripalli

- 213 -
CHAPTER-VIII Water Level Analysis
Data of Static water levels was collected from the selected wells for the pre monsoon period in both watersheds in order to understand the water resources and their estimation and water budgeting. 8.1 Water Level Analysis Data of Static water levels was collected from the selected wells for the pre monsoon period in both watersheds in order to understand the water resources and their estimation and water budgeting.
8.2 Water Level Analysis
Well inventory data of 40 bore wells were collected for hydrogeological study. Few dug wells were also selected in this area. Given below table is showing the habitation wise well inventory data of Pre monsoon period.

- 214 -
Table 8a: Well Inventory data in Kamaravaripalli Watershed
Well_ID S_W_L Casing Well Type
Total Depth
1st Gap 2nd
Gap Village_N
BYVP1 4.18 14 BW 42 24.2 0 Boyinivaripalle
BYVP2 4.12 6 BW 106 27.3 45 Boyinivaripalle
BYVP3 6.48 12 BW 76 36.4 55 Boyinivaripalle
BYVP4 6.90 6 BW 152 42.4 73 Boyinivaripalle
BYVP5 4.20 6 BW 45 45.5 0 Boyinivaripalle
BYVP6 3.97 12 BW 91 0 0 Boyinivaripalle
BYVP7 4.18 0 BW 0 0 0 Boyinivaripalle
BYVP8 4.36 9 BW 152 0 0 Boyinivaripalle
GCP1 7.81 18 BW 70 18.2 48 G.Cherlapalle
GCP2 7.46 21 BW 91 81.8 0 G.Cherlapalle
GCP3 3.43 0 OW 9 0 0 G.Cherlapalle
GCP4 3.98 6 BW 73 0 0 G.Cherlapalle
GCP5 3.66 6 BW 67 21.2 0 G.Cherlapalle
GCP6 4.06 0 OW 9 0 0 G.Cherlapalle
GCP7 4.72 6 BW 136 127 0 G.Cherlapalle
GCP8 8.48 0 BW 145 0 0 G.Cherlapalle
GCP9 6.88 8 BW 79 24.2 42 G.Cherlapalle
GCP10 10.76 21 BW 55 31.8 48 G.Cherlapalle
KMVP1 8.80 15 BW 58 0 0 Kamaravaripalle
KMVP2 7.91 6 BW 115 0 0 Kamaravaripalle
KMVP3 3.59 9 BW 121 0 0 Kamaravaripalle
KMVP4 4.07 12 BW 97 54.5 67 Kamaravaripalle
KMVP5 2.59 27 BW 85 36.4 48 Kamaravaripalle
KMVP6 7.31 6 BW 82 24.2 42 Kamaravaripalle
KMVP7 10.68 13 BW 145 0 0 Kamaravaripalle
KMVP8 5.76 6 BW 61 30.3 0 Kamaravaripalle
KMVP9 5.38 8 BW 121 106 0 Kamaravaripalle
KMVP10 1.76 0 OW 9 0 0 Kamaravaripalle
MGCP1 10.79 5 BW 65 27.3 64 Mullangichetlapalle
MGCP2 13.85 12 BW 115 54.5 0 Mullangichetlapalle
MGCP3 25.14 9 BW 61 48.5 55 Mullangichetlapalle
MGCP4 17.24 0 BW 103 27.3 45 Mullangichetlapalle
MGCP5 4.56 0 BW 0 0 0 Mullangichetlapalle
MGCP6 7.42 2 BW 136 12.1 130 Mullangichetlapalle
MGCP7 5.86 2 BW 109 27.3 100 Mullangichetlapalle
MGCP8 5.86 2 BW 79 21.2 73 Mullangichetlapalle
MGCP9 6.96 0 BW 161 0 0 Mullangichetlapalle
MGCP10 11.64 2 BW 142 100 130 Mullangichetlapalle
MGCP11 22.41 5 BW 117 117 0 Mullangichetlapalle
MGCP12 5.26 5 BW 85 9.09 45 Mullangichetlapalle
MGCP13 2.18 0 BW 65 45.5 0 Mullangichetlapalle
MGCP14 0.42 7 BW 109 72.7 0 Mullangichetlapalle
MGCP15 11.13 9 BW 82 12.1 21 Mullangichetlapalle

- 215 -
(vi) Table 8b: Well Inventory data in Kamaravaripalle Watershed
Owner_N Drilled Year
Depend Land Major Crop
Motor Depth
Motor Capacity
Nanjappa 1999 3 Paddy 30 6.6 M.Choudappa 1994 2 Paddy 12 6.8 Srinivas 2004 1.5 Maize 42 7.5 Chinnayappa 2001 3 Maize 79 10 B.V.Choudappa 2004 2 Maize 39 7.5 C.Narayanappa 1996 2 S.Flower 61 7.5 Chinnayappa 1995 3 Paddy 45 7.5 Venkat Ramunappa 1993 4 Maize 39 7.5 G.Ramappa 1995 2 G.Nut 76 6 Rangappa 1985 0 5 S.Narayansimappa 1999 3.5 Maize 48 7.5 S.Muniyappa 2002 3 S.Flower 18 7.5 Venkatesh Rao 1999 5 Maize 0 7.5 G.Narayansami 2005 3.5 Paddy 52 7.5 B.Chinanarasimappa 1999 2.5 S.Flower 36 6.8 C. Gangulappa 2003 1 Tomato 48 7.5 D.Nanjappa 2005 0 7.5 K.Gangappa 2005 3 Tomato 61 10 Venkatramunappa 2000 5 Tomato 61 7.5 Meddi Reddy 1998 2 Bazra 85 12 Nanjappa 1995 2 G.Nut 61 7.5 D.kariyanna 2000 2 0 Srinivasa 1995 2 Paddy 30 6.5 C.Muniyappa 2002 2 Paddy 91 10.5 K.Venkatramunappa 1997 3 S.Flower 55 6.5 M.Venkatappa 1995 2 Maize 30 6.5 Sathyanarayana 2000 3 Tomato 48 7.5 Anjan Reddy 2005 5 Maize 97 10 Abhimannu Kumar 2005 2 Maize 52 15 Govindra Reddy 1996 2.5 Vegetable 76 10.5 Chinappa Reddy 1992 2 Maize 48 10.5 Nirumamidi 2005 2 Vegetable 76 15 Bal Reddy 1994 5 Maize 109 15 Bal Reddy 1990 2.5 Maize 61 6.5 Water Supply 2001 73 10.5 P.Narayanappa 2003 3 Maize 79 15

- 216 -
After the detail analysis of the water level data it is confirmed that the
average static water level in this area around 10mts. highest value recorded in Guttapalya and lowest in Gujjavandlapalle. Here the dyke dividing the entire watershed into two sub hydrogeological units. Gujjavandlapalle and parts of Tattanagarpalle and Jiganivandlapalle are separating from other habitations by the dyke. The average water level is around 11 mts in dyke upstream and 3 mts in downstream clearly indicating that the impact of dyke in both zones.
0
2
4
6
8
10
12
Village wise Static Water Level(mt) in Kamaravaripalle
S_W_L(mt) 5.98 4.798 5.785 10.048
G.cherlapalli Boyinivaripalli kamaravaripalli Mullangichetlapalli
Graph 8a: Village Wise Static Water Level (mt) in Kamaravaripalli

- 217 -
CHAPTER IX Water Resources Estimation
Considering the rainfall data over the study area and other data like recharge & discharge, base flow and other geohydrological parameters the ground water resource estimation has been made for these two study areas. Analyzing all these data in the most suitable methods suggested by CGWB are “Rainfall infiltration method18” in the MS-Excel the above calculation has been done. Rainfall is the major dependant source in the study area due to the complex hydrogeological system contains few fracture and joint systems which does not contains much storativity and transmissivity. In this study only one method “Rainfall Infiltration method is used due to the lacking of water level data for three seasons. This method is explained briefly in the below table. 9.1 Water Resources Estimation In 2008 - 2009 there was less rain fall occurred around 593mm only. The entire water resources analysis done based on this rainfall.
Rrf = f X A X Rainfall
The infiltration factor in both areas has been considered as 11 and 12 % of rainfall due to the shallow and massive crystalline basement with uneven distribution of fracture system and limited thickness of weathered mantle. The average depth of tanks taken around 2.5mt. Around 20 % of the total storage has taken as recharge from the surface storage in monsoon season due to the siltation of the tanks by clayey material. The following tables showing the water resources estimation from the study area. Table 9a: Monsoon Recharge due to the Precipitation (June-September)
Ppt (m)
Total Area (Hect)
Total Area (m2)
Volume of Monsoon Rainfall (Cub mt)
Recharge Factor (%)
Monsoon Recharge (cubic mt)
Total Surface Storage
Recharge from Surface Storage (Cub mt)
Total Monsoon Recharge (Cub mt)
0.397 919.47 9194700 3650295.9 11 401532 325000 65000 466532
18 The methods and formulas for groundwater resources estimation for both study areas taken
from the manual of Dynamic Groundwater Resources of India by Central Groundwater Board 2006 with courtesy

- 218 -
(vii) Table 9b: Non Monsoon Recharge due to the Precipitation (October-May)
Non-Monsoon Precipitation (mm) (Oct-May)
Ppt (m)
Total Area (Hect)
Total Area (m2)
Volume of Non-Monsoon Rainfall (Cub mt)
Recharge Factor (%)
Non-Monsoon Recharge (cubic mt)
162 0.162 919.47 9194700 1489541.4 11 163849

219
Table 9c: Monsoon Water Budget (June-September)
Total Monsoon Recharge (m3)
Total Monsoon Discharge (m3)
Irrigation Return Flow (m3)
Water Requirement (Domestic+ Cattle)
Area’s Monsoon Water Requirement (m3)
Net Groundwater Availability (m3)
Monsoon Shortage / Surplus (m3)
Stage of Groundwater Development
466532 215040 57792 2522 217563 520293 302730 42
Table 9d: Non - Monsoon Water Budget (October - May)
Non-Monsoon Recharge
(m3)
Non-Monsoo
n Discharg
e (m3)
Irrigation
Return Flow (m3)
Water Requireme
nt (Domestic
+Cattle)
Area’s Non-
Monsoon Water Require
ment (m3)
Total Non-
Monsoon Recharg
e (Ppt+Return Flow)
(m3)
Natural Discharge (Non-Monsoon) (5%)
(m3)
Net Non-Monsoo
n Groundwater
Availability
Non Monsoo
n Shortag
e / Surplus
(m3)
Stage of Groundwat
er Developme
nt
163849 458640 114660 4414 463055 278510 13925 264584 -198471 175
Table9e: Water Resource Estimation and Water Budgeting (2008 - 2009)
Net Monsoon Groundwater Availability (m3)
Net Non-Monsoon Groundwater Availability (m3)
Annual Replenishable Resources (m3)
Net Groundwater Availability (m3)
Area’s Monsoon Water Requirement (m3)
Area’s Non-Monsoon Water Requirement (m3)
Area’s Total Water Requirement Monsoo+Non-Monsoon (m3)
Annual Groundwater Draft (m3)
Shortage / Surplus (m3)
Stage of Groundwater Development
520293 264584 784877 784877 217563 463055 680618 680618 104259 87

- 220 -
9.2 Demand for Water in both watersheds
The water demand estimated from all sources i.e. domestic, livestock, pumping.
9.2.1 Domestic Water Demand: Water Consumption per capita around 48 lit in Rural Areas (According to House Hold Survey done by FES)
(viii) Table 9f: Domestic Water Demand
Total Population
Total Population Consumption m3/Day
Monsoon Requirement (m3/year)
Non Monsoon Requirement (m3/year)
1416 67968 67.968 8224.128 16584.192
Water demand from population for a year is around 24808 m3in this watershed.
9.2.2 Water Demand from Livestock: The water demand for livestock calculated by the house hold survey19 by FES.
Table 9g: Water Requirement for Livestock in Bagepalle / Day Total Livestock Consumption Lit/Day
Total Livestock Consumption m3/Day
Monsoon Requirement (m3/Year)
Non-Monsoon Requirement (m3/Year)
Total Livestock Requirement per Year
18094 18.094 2189.374 4414.936 6604 Water demand from livestock for a year is around 6640 m3 in this watershed.
9.2.3 Water Demand Due to the Pumping:
The total groundwater draft estimated from pumping demand. There are about 100 wells are located in both areas. There are only 95 wells are giving yield. The average specific yield calculated by the discharge measurement during pumping.
The specific yield from this area is 2.3 liters / second.
19
Water Usage per Cow 35 liters Water Usage per Buffalo 30 liters Water Usage per Ox 35 liters Water Usage per Sheep 1.5 liters Water Usage per Goat 1.5 liters

- 221 -
The average pumping hours from this area is 7 hours due to the current availability in Karnataka. Total pumping days considered as 270 days/ Year including monsoon pumping.
The total Pumping Demand summarized in below table.
Table 9i: Monsoon Bore well Discharge (June-September)
Total Area (ha)
No of Pumps (BW+OW) Working
Pumping Days
Pumping Hours Daily
Pumping Hours Yearly
Average Specific Yield (Lit/Min)
Average Specific Yield (Lit/Hour)
Monsoon Discharge
919.47 43 40 80 7 560 160 9600 215040
Table 9j: Non Monsoon Bore well Discharge (October-May)
Total Area (Hect)
No of Pumps (BW) Working
Pumping Days
Pumping Hours Daily
Pumping Hours Yearly
Average Specific Yield (Lit/Min)
Average Specific Yield (Lit/Hour)
Non-Monsoon Discharge
919.47 43 40 195 7 1365 140 8400 458640

- 222 -
0
100000
200000
300000
400000
500000
600000
700000
800000
Recharge Discharge and Groundwater Balance Kamaravaripalle
Kamaravaripalle 784877 680618 549414
Net Availability of Groundwater
Annual Groundwater DraftSafe Extraction (70% of Net
Annual Recharge)
CHAPTER X Conceptual Hydrogeological Model
10.1 Supply, Demand and Groundwater Budget The present groundwater scenario in the watershed is little grim due to the over exploitation with high capacity bore wells. The well density is around 5 per Sq.Km with 50 bore wells and the present depth of the aquifer is around 175 meters in some areas. The tables and the graphs given below indicate the Demand & supply and groundwater balance in this area.
Table 10a: Supply, Demand and Groundwater Balance
Net Availability of Groundwater
Annual Groundwater Draft
Safe Extraction (70% of Net Annual Recharge)
Stage of Groundwater Development
784877 680618 549414 87
Graph 10a: Recharge, Discharge and Groundwater Balance

- 223 -
86
87
87
87
87
87
88
88
88
Stage of Groundwater Development in Both Watersheds
Stage of Groundwater Development 87 88
Kamaravaripalle Jeekavandlapalle
Graph 10b: The Stage of the Groundwater Development
The Shortage map and Stage of Groundwater Development Map clearly shows that this watershed is quite distressed by over abstraction. The above tables reveal that the discharge is much more than the recharge in both watersheds. The maximum imbalance occurred in Kamaravaripalli.
10.2 A Demand – Supply Water Balance
After the detailed analysis of all the data including demand and supply in Kamaravaripalli, it is evident that the Pani-Panchayat (Maharastra) type of groundwater initiatives are being envisaged in the area, as a part of the long-term water management strategy. In order to calculate a sustainable strategy for water use, on the basis of the above analyzed data, the following Balance has been extracted.
(i) Population = 1416 (450 families)
(ii) Total Area = 9.19 km2
(iii) Average rainfall = 700mm
(iv) The annual Average demand for Groundwater in Kamaravaripalle is 6,80,000 m3. Over the catchment area of 9.19 km2, this is equivalent to some 74 mm of water
At the same time, recharge factor for Gneissic Granites in this area is 11% (considering all parameters like soil and rock structures) of rainfall. During an

- 224 -
0
50
100
150
200
250
300
350
400
450
500
Demand& Supply and Groundwater Balance in Both Watersheds
Demand/Capita (Cubmt) 480 390
Supplly from Aquifer system (Cubmt) 388 380
Kamaravaripalle Jeekavandlapalle
average rainfall period of 700 mm, this implies some 77mm of water recharging the aquifers in the area. Suppose if we take the Irrigation return flows into consideration then the total recharge becomes 85 mm (7,85,000 m3) To avoid this water level decline or maintain the stability of the water table in this area the Groundwater abstraction from the area should not exceed 60 mm (5,50,000 Cub mt) (70 % of safe Extraction of Recharge) annually…to ensure sustainability of the resource. This implies that out of the demand of 480 m3 of water per capita every year, some 388 m3 per capita per annum can be met from the aquifers in the area.
Graph 10c: Demand, Supply and Groundwater Balance

- 225 -
CHAPTER XI Conclusions
The functioning of the groundwater system occurs within the physical framework described earlier and is largely controlled by the geological set-up of the Gneissic Granites with Secondary Intrusions like Dykes. The detailed water study and stage of groundwater development in the study area reveals that this area is suffering from groundwater over abstraction problem. The functioning of the groundwater system occurs within the physical framework largely controlled by the geological set-up of the Gneissic Granites with Secondary Intrusions like Dykes. The salient features of the groundwater system behaviour are listed below, based on the water level data collected in the study area. Following conclusions can be derived after the detail study.
Study area is similar physiographically. Surface flow or monsoon runoff, though not observed is bound to be
limited to a few days, where the entire drainage network is concerned. The total area of Kamaravaripalle watershed is 919 Hectares. Geologically study area is similar with Gneissic Granites. Dolerite and Gabbroic Dykes play a crucial role in controlling the local
hydrogeological regimes and separates both areas into different sub hydrogeological units.
The area for recharge potential is less in Kamaravaripalle. Highest well density with 43 Bore wells yielding water in Kamaravaripalle
is high. Soil permeability on the whole is moderate due to the presence of
fragmentary material mixed with top soil on the upland plateaux and slopes. In valleys and tank bed areas it is low, but is offset by a less porosity of the soils in the red, clayey soils.
According to the soil condition, Kamaravaripalle is less permeable with high drainage density and frequency.
The depth of Static Water Level is deeper in Kamaravaripalle particularly in peak pre monsoon season and directly affects the Specific Yield.
Abstraction (pumping) from the groundwater system is more in Kamaravaripalle.
Groundwater Demand per capita in Kamaravaripalle it is 480 Cub mts the supply from aquifer is 388 cub mts.
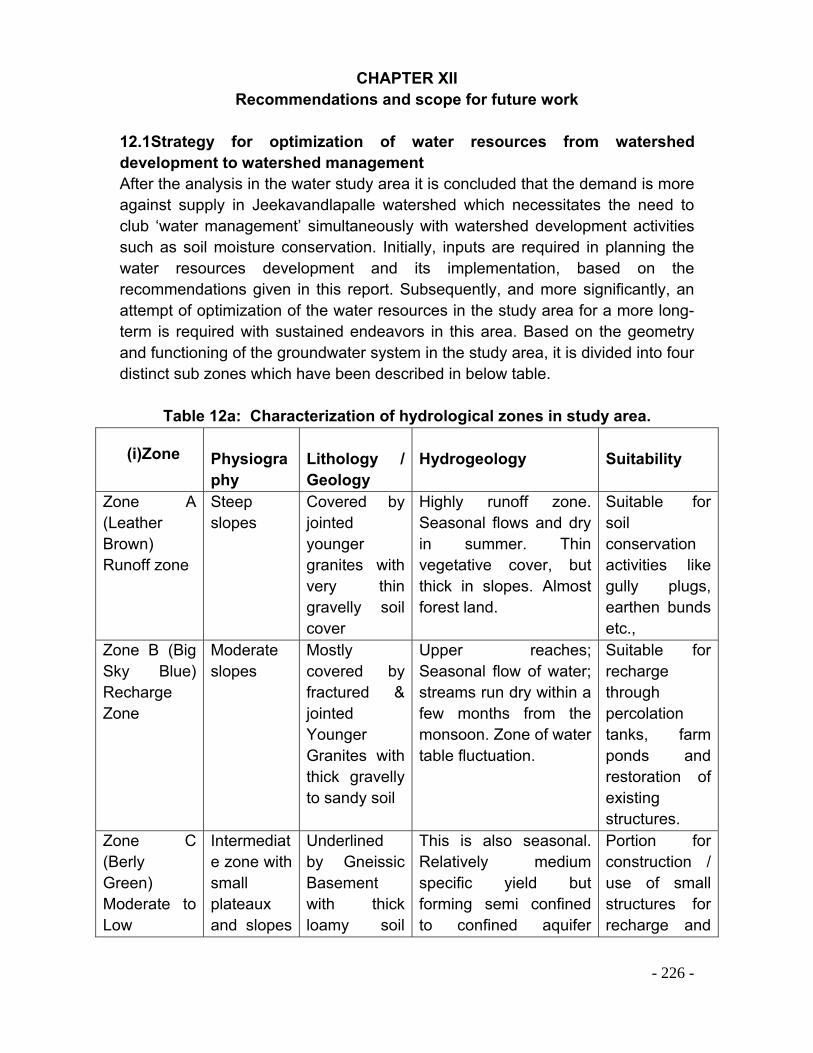
- 226 -
CHAPTER XII Recommendations and scope for future work
12.1Strategy for optimization of water resources from watershed development to watershed management After the analysis in the water study area it is concluded that the demand is more against supply in Jeekavandlapalle watershed which necessitates the need to club ‘water management’ simultaneously with watershed development activities such as soil moisture conservation. Initially, inputs are required in planning the water resources development and its implementation, based on the recommendations given in this report. Subsequently, and more significantly, an attempt of optimization of the water resources in the study area for a more long-term is required with sustained endeavors in this area. Based on the geometry and functioning of the groundwater system in the study area, it is divided into four distinct sub zones which have been described in below table.
Table 12a: Characterization of hydrological zones in study area.
(i)Zone Physiography
Lithology / Geology
Hydrogeology
Suitability
Zone A (Leather Brown) Runoff zone
Steep slopes
Covered by jointed younger granites with very thin gravelly soil cover
Highly runoff zone. Seasonal flows and dry in summer. Thin vegetative cover, but thick in slopes. Almost forest land.
Suitable for soil conservation activities like gully plugs, earthen bunds etc.,
Zone B (Big Sky Blue) Recharge Zone
Moderate slopes
Mostly covered by fractured & jointed Younger Granites with thick gravelly to sandy soil
Upper reaches; Seasonal flow of water; streams run dry within a few months from the monsoon. Zone of water table fluctuation.
Suitable for recharge through percolation tanks, farm ponds and restoration of existing structures.
Zone C (Berly Green) Moderate to Low
Intermediate zone with small plateaux and slopes
Underlined by Gneissic Basement with thick loamy soil
This is also seasonal. Relatively medium specific yield but forming semi confined to confined aquifer
Portion for construction / use of small structures for recharge and

- 227 -
Recharge Zone
towards stream channels
bed. system with deeper fracture zones in gneissic rocks.
storage also.
Zone D (Autunite Yellow) Low Recharge Zone
Higher order Streams and adjoining terraces of farmland
Lower part of each sub hydrogeological unit with thick clay bed.
Middle to lower reaches; no base flow after monsoon period.
Scope for harvesting water deepening of existing open wells if any.
However, one should remember, that water resources management to be effective and sustainable, should be in tune with the project objectives of watershed development. The best option, therefore, is to establish a methodology of water use that is systematic enough to consider the specific hydrogeological characteristics. Based on the present investigation for longer time and the conclusions drawn, a broad strategy is being suggested as an attempt towards effective water resources development and management. Below figures depicts the broad strategy suggested for enhancement of water resources and their sustainable management for the both areas.
The following map gives the recommendations in study area
.
Fig 12b: Recommendation Map

- 228 -
12.2 Recommendations for enhancement of Groundwater Resources in study area:
1. There is need to conserve the soil from erosion in the zone-A due to the steep slope. The elevation ranges from 1020 mts to 690 mts. Suitable for soil moisture activities like trenches, gully plugs and rock filled dams on first order streams. Underlined by fractured gneissic basement, encourage the slow infiltration into perched aquifer system temporarily and protects the moisture and supports vegetation.
2. The upper slopes and middle portions of both the study areas would be most suitable for Farm pond treatment and it could be intensified in these regions along the pegmatite and dyke zones. The rationale of farm pond numbers is presented in the box below.
Density of Farm Ponds How many farm ponds suitable for both study areas for conservation of water? The general measurement of farm ponds of 10m x 10m x 2m The total storage volume in each farm pond = 200 m3
Effective volume may be safely considered as 175 m3
Now for a model of 1:1 (1 farm pond per hectare of land, the effective storage works out to about 18mm.) Application of above concept to the two watersheds Considering an optimum recharge of 12% of normal rainfall for the gneisses in both areas, Kamaravaripalle: The recharge to groundwater can be assumed to be 70mm (average annual rainfall is 700mm) annually. Going by the bimodal rainfall pattern, there would be effectively two episodes of recharge, each of some 35mm. Hence, a factor of 35/18 (one episode / effective volume of one farm pond) The factor work out to be = 1.94 It means that the optimization would be most effective with 194 farm ponds for an area of 100 hectares. Feasible farm ponds in both sites
If the above principle is applied for the Kamaravaripalle, which is around 919 hectares and the effective area feasible for recharge being about 500 hectares, i.e. about 900 farm ponds would be ideal. Alternatively, part of the recharge could be mobilized through percolation tanks and the rest through farm ponds.
On the practical side, one farm pond per hectare may be a feasible model in study area.
3. There is a scope for mobilizing some recharge to the groundwater system, especially within Zone B. Hence, a few feasible sites for percolation tanks
- 229 -
may be very useful to control the runoff and supports infiltration. It is also known that there is not sufficient number of existing natural tanks in the Kamaravaripalle.
4. Construction of the recharge structures particularly across the dyke and quartz vein intrusions will feed the water into deeper aquifer system.
5. Infiltration and percolation rates are very slow due to the shallow depth of gneissic basement and its compactness. Hence, the storage time of water in the structures play a vital role in recharge factor. Water stored for more than six months can be effective for ground water recharge into deeper aquifer. Otherwise, the water stored in limited unconfined aquifer will serve temporarily.
6. There is a need to construct large number of recharge structures like percolation tanks, mini percolation tanks, check dams and farm ponds in this zone. The best place for water development activities is indicated in map as zone-B while considering zone-C as secondary zone. Zone-B is the best suited for recharge when compared to zone-C. Because this zone is underlined by thick gravelly and sandy soil, which contains high infiltration.
7. Each tank should have been at 2.5-3 mt depth at least in this zone, only then it is possible to enhance the ground water storage. After the construction, equitable sharing of the water is possible through community participation.
8. The unique feature of each zone in both areas is in the form of the groundwater discharge area (Zone D). For the sustainable water management of this zone, it would be better to look at surface water based “water users” groups. This implies looking at older structures and the possibility of using water from these, especially for protective irrigation. Or, even the use of community wells in this zone…although the well-yields from this zone are bound to be limited, but sustainable in the long run.
9. Water harvesting for use is feasible in the lowermost reaches (Zone-D) of all zones in the study area, along the course of the drainage channel (3rd or 4th order mainstreams). For this purpose, few small structures have been suggested, the overflow of which will feed a larger structure in the further downstream. These structures will also control the flow of silt into the downstream water bodies.
12.3 Recommendations for Sustainable Water Management
In addition to the specific recommendations suggested above, there are also some general principles being provided as suggestions below, primarily to ensure sustainable use of water resources.

- 230 -
Community based management of groundwater resources is envisaged as the next step in villages. Some of the learning’s from this report will prove to be useful in planning and implementing groundwater management in villages.
Finally, management of artificial recharge ought to involve a component of ‘better informed’ communities. Communities ought to be posed with such questions as “What after watershed development and artificial recharge” during the post-project management phase. Specifically in Kamaravaripalle, communities need to be informed about the limitations of uncontrolled extraction of groundwater resources and the need for ‘increased community involvement’ in groundwater management and artificial recharge.
Creating the awareness Stakeholders on their resources through Kalajathas or any other communication methods.
The communities should be capacitated to undertake the estimation of water resources, as well as crop water budgeting.
Installation of few Meteorological Equipments such as Rain gauges, and water level indicators for regular monitoring by the community themselves.
Formation of the different institutions for surface and ground water with gender equity or strengthening the already existing institutions like Water User Associations or User Groups.
Conducting exposure visits to those areas where groundwater management is being successfully practiced such as Kothakonta watershed area, and also to the area where the area is worst effected by groundwater over abstraction such as Sidlagatta.
It would be better to encourage the use of shallow groundwater (usually open wells) and establish shallow aquifer systems as a sustainable source of water supply with low discharge, low capacity pumping systems (less than 3-5 hp) since they are most suitable on such wells, so as to build an automated regulatory mechanism of abstraction, which is in agreement with the hydrogeological properties of the groundwater system.
Discourage bore well drilling for irrigation considering long-term problems of overexploitation from hard rocks aquifers in particular. Encourage advanced irrigation techniques like Drip or Sprinkler systems and push them into less water intensive crops like Cereals (Ragi, Maize, and Bazra etc.,) or vegetables and other flowering plants against high water intensive crops like sugarcane and paddy. Encourage the community into “water sharing mechanism” since this is the better way in long term water management even during the times of drought.

- 231 -
Optimization of water use is possible only through a conjunctive use of groundwater and surface water from a closed system. The distribution for this needs to be carefully worked out, based on the principles of local institutions that integrate water balances and community participation.
In order to ensure efficient working of recharge and discharge components, it would be necessary to maintain both these mechanisms through the activities such as regular, periodic de-silting of all structures, progressive increase in vegetative cover, especially along the slopes, well maintenance, continued and improved monitoring of groundwater resources etc.
Communities need to be better informed in order to mitigate negative impacts and also asses how much of recharged water will actually be available for use during a season; for what purposes; and how can this be harnessed keeping in mind the objectives of a project like watershed development?
- 232 -
References
Karanth, K.R. (1987) Groundwater assessment, development and management. Tata-McGraw Hill Publ. Co., New Delhi, India, 720p.
Todd, D. K. (1995) Groundwater Hydrology. 2nd edition, John Wiley and Sons (SEA) PTE Ltd, Singapore.
Macdonald, D.M.J., Thomson, D.M. and Herbert, R. (1995ii) Sustainability of yields from wells and boreholes in crystalline basement aquifers. British Geological Survey (NERC) Technical report WC/95/50 © NERC, BGS, UK; 69p.
Pakhmode, V., Kulkarni, H. and Deolankar, S.B. (2003) Hydrogeological- Drainage analysis in watershed-programme planning: a case from the Deccan basalts, India. Hydrogeology Journal, v. 11, pp. 595-604.
Kulkarni H., (1998) Watershed Development and Management - a movement seeking inputs in earth sciences. Jour. Geol. Soc. India, v. 52(2), pp. 239-241.
Strahler, A.N. (1952) Dynamic basis for geomorphology. Bull. Geol. Soc. America, 63 : 926-938.
ACWADAM (2000) Strategy for watershed development and management optimizing recharge and water management in the Kavalratti- Salparahalli micro-watershed, Arsikere Taluk, Hassan District, Karnataka (based on rapid geohydrological mapping using remote sensing data). ACWADAM Tech. Report ACWA/Y2K/H-3.

- 233 -
Present Ground Water Scenario In
Jeekavandlapalli Micro watershed
A Hydro geological Study 2010

- 234 -
ntroduction Water shortage and its various fall-outs have resulted in increasing application of the “Watershed Development” concept in many areas of the country and it is being increasingly sought as a means to address the problem of water crises. Besides, watershed projects also offer opportunities to address some critical socio-economic issues pertaining to the rural scenario in the country today, especially when many of these issues can be backtracked to the problems of water resources.
However, watershed programmes would benefit immensely by undertaking systematic hydrogeological studies as groundwater resources form an important aspect in most of the watershed development programmes (Kulkarni, 1998). Water exists within a certain physical framework of a watershed. This framework is largely controlled by the local geological conditions. Hence, the planning of a watershed development programme will be more effective if the physical system taking the impact of the measures is understood well.
1.1 Background Foundation for Ecological Security (FES) has been working in Papagni20 River Basin through two Spearhead Teams located in Chintamani under Kolar and Chikkaballapura districts in Karnataka and Madanapalle under Chittoor district in Andhra Pradesh. The organization has been working on natural resource based projects, involving local communities and with a watershed as an approach since the year 1995. One of the characteristics of the project area is the presence of large number of traditional water bodies known as kere’s or tanks but today in a very bad state. FES has been providing valuable inputs in the working areas of watershed development, by undertaking the activities such as contour mapping, detailed hydro- geological characterization and evaluation through rapid appraisal 1.2 Context and Rationale The term ‘precipitation’ signifies all forms of water that is received by earth from the atmosphere and includes rainfall, snowfall, frost, hail etc. When one observes the rainfall pattern, the distribution is uneven and erratic in many parts of the country. This type of erratic and uneven distribution of the rainfall pattern coupled with steadily increasing demand for water due to rapid industrialization, crop diversity and also increasing demand for drinking water, in the light of relatively constant (or even decreasing) supply necessitates an efficient use of this scarce
20 a tributary of Pennar River

- 235 -
resource. It would mean encouraging the community to judiciously use their limited groundwater resources.
It is in this context that FES undertook this exercise for understanding the relation between the meteorological and geological aspects in the microwatershed. Detailed study has been carried out in Mudimadugu micro watershed located in Karnataka to understand the status of both surface and ground water resources. The cropping pattern is highly dependent on the rainfall and groundwater in this area. The water level fluctuations in wells according to the rainfall pattern have been recorded in the study area in order to understand the surface and groundwater scenario and estimating groundwater balance through demand for crops, drinking and supply through rainfall and groundwater. This report is the culmination of a rather rapid mapping appraisal and was conducted as a base-level geological and hydro-geological investigation with the following objectives:
(i) describe the local geological setting of the watershed area, (ii) define exactly and mapping the hydro-geological regime (iii) suggest a broad strategy for watershed development (iv) analyze nature of the meteorological and agricultural aspects with a
rainfall occurrence and agriculture perspective and (v) develop a water audit of the study area (availability & usage of water) in
the context of its geo-hydrological status.
1.3 Outcome/ Result from this Study Generating site-specific data on the status of water resources and their
use in the study area. When supplemented with data on alternative crops (less water intensive), agricultural best practices etc., the communities living in the area will be able to assess and analyse the water use patterns with respect to water availability and make informed decisions to improve the situation (regulation on bore wells, sharing the water, change in crops, priority of usage – drinking water over irrigation etc.).
Developing a methodology that could be adopted by other agencies
involved in working with communities and natural resources. Disseminating the study methodology and results among govt. and other agencies working on water resources, enabling them to take up such models in their areas of operation and also facilitates decision making on the site selection and land characterization.

- 236 -
1.4 Methodology The aim of the detailed hydrological, hydro-geological and agricultural and social assessment was to undertake a systematic evaluation of the area’s local geological setting and its impact on local hydrogeological regime and recharge, discharge components, the output of the recharge, discharge and groundwater balance. The methodology used to obtain the data has been explained at the end of the chapter. The methodology of the study included following steps.
Data Collection: a) Primary data was collected from the field from rain gauges, Pan
Evaporimeter, water level data, measured with water level indicator and through house hold surveys.
b) Secondary Data was collected from allied sources such as Revenue and other government departments. Part of the data was also collected from other sources such as Ali Cotton’s study and IWMI study material. Topo-sheets were collected from Survey of India for preparing the base maps and study of the satellite imageries for delineating the lineaments and drainage pattern.
1.5 Data Analysis The following data was used for detailed analysis of geological, meteorological and hydrological characteristics of the study areas. Rainfall Data Assembly and Analysis: Analysis of the rainfall data21 helped to understand the impact of climate on the area. The data was analyzed in such a manner that the total rainfall per month for each year could be exactly calculated. The intensity of the rainfall has been calculated through dividing the total rainfall by the total rainy day per month.
Geological Mapping and Analysis: Study and analysis of the occurrence and distribution of the different geological formations and their relationship with surface and groundwater was carried out in order to understand the hydro-geological regime. A detailed study was conducted on secondary structural features like dykes and veins which act as natural geological barriers and their impact on the local ground water movement. GPS was used for tracking dykes and other geological features. Toposheets and Remote Sensing Satellite Imageries (IRS-1D) were used for analysis of the geology and the land use pattern.
21 for the period 2000-08

- 237 -
Water Level Analysis: Analysis of the water level fluctuations from the selected bore wells and open wells were carried out in order to understand the recharge and discharge criteria.
Water Resources Estimation: Rainfall infiltration method and water level fluctuation methods were used for the estimation of groundwater resources. The rainfall infiltration method is as follows.
Recharge:
(i) Recharge due to precipitation = Rp
(ii) Natural Recharge from lakes, streams (Influent seepages) = Rn
(iii) Artificial Recharge from Canals, Reservoirs, Irrigation return flows = Ra
(iv) Ground Water inflow from areas outside the basin = Gi
Discharge:
Recharge due to ppt: Volume of the water was calculated by taking the annual rainfall from the study area multiplied by the area of the study (from the total geographical area). For artificial recharge due to lakes and streams: Recharge due to Canals, Reservoirs, and Irrigation return flows. All the other sources are negligible except the irrigation return flows in both study areas. 25% of the discharge due to
(i) Evaporation = Et
(ii) Natural Discharge by seepage & stream flow (Effluent seepages) = De
(iii) Artificial Discharge due to Pumping = Do
(iv) Leakage from a bottom semi confining layer = Go
(v) Ground water outflow to area outside the basin = Ge
(vi) Change in Groundwater Storage = ΔSg
ΔSg = (Rp + Rn + Ra + Gi) – (Et + De + Do + Go + Ge)
- 238 -
pumping has been taken as the recharge due to irrigation return flow due to the soil conditions in these areas. Ground water inflow from outside of the basin: It is also taken as negligible because of hard rock terrain and because of natural geological barriers like dykes. Evaporation: For estimating it, two Pan Evaporimeters were installed and monitored two times in a given day. Day wise data was assembled and was later analyzed on monthly basis by using formula with pan coefficient taking as 0.70. Natural Discharge from seepage & inflow: this was considered negligible for the study area, as the seepages come to the tanks & therefore recharge the ground water. This has already been calculated as the recharge from tanks. Artificial Discharge due to pumping: For discharge due to pumping. Leakage from a bottom semi-confining layer: It is negligible for this region after considering the local hydrogeology. Ground water outflow to area outside the basin: It is negligible for this region due to the natural geological setting. The Water Level Fluctuation method is as follows: Area X Specific yield X Water table rise In this Specific Yield =Sy Sy = {(Dw + Robf + Sd) – (RFw + Ig)}/ (Wld X Ae) Ground water draft by wells & direct pumping =Dw Base flow =Robf Spring discharge =Sd Winter rainfall =RFw Recharge due to return flow from irrigation =Ig Average water level decline = =WLd Effective area of ground water recharge =Ae Annual Groundwater Draft: For analyzing this, demand from population and livestock was considered in addition to the pumping demand. The discharge values of the 7.5 Hp pumps, which are being used in this area, were observed. The discharge measured during the pumping through 100 liters drum, is 2.3-2.5 lit per second. All the pumps are working for 6-8 hours daily.

- 239 -
Net Groundwater Availability: is the sum of total monsoon recharge and non-monsoon recharge and deletion with 5% of non-monsoon discharge or baseflow. Stage of Groundwater Development: is computed by following formula. Annual Groundwater Draft / Net Groundwater Availability X 100 Storage Level Rise / fall: is the ratio of Surplus or Shortage to area * 100. Comparison between Water level fluctuation method and Rainfall infiltration method: the following formula is used to compare both methods and finally the water level fluctuation method considered for Mudimadugu due to best available data. (A-B)/B) * 100 = P.D where P.D is the percentage deviation A is the recharge by water level fluctuation method B is the recharge by rainfall infiltration method Depend upon the value of P.D. the recharge value finalized. If P.D is between +20% and -20% than A is the recharge If P.D. is > -20 % = 0.8 * B taken as recharge If P.D. is < 20 % = 1.2 * B taken as recharge GIS Mapping: Advanced software like Geographical Information System was used for generating the maps and analysis of the data and output. Different maps like Geological, Hydrogeological, Soil and Recommendations were prepared.

- 240 -
CHAPTER-II Location & Topography
2.1 Location The study area is located in the upstream of the Papagni River Basin. Jeekavandlapalle is part of Thimmampalle Panchayat situated in Bagepalle taluk of Chikaballapur district, It lies in agro-climatic zone with semi-arid type of climate with dryness in major part of the year. This watershed is falling in toposheet no 57/g/13 and in between 77055’ E to 77056’E in longitude and 13048’ N to 13052’ N in latitude. The extension of the study area is around 1029 Hectares. It is located at the foot hills of Itikaladurga State forest forming ridges in north and west. This study area is located about 22 km from Bagepalle Taluka headquarters and 25km from Kadiri. It can be best approached by the Bagepalle-Kadiri road that passes through.
Fig 2a: Location Map
Jeekavandlapalle watershed with eight habitations including Jeekavandlapalle, Tattanagarpalle, Guttapalya, G.Maddepalle, Sakavandlapalle, Jiganivandlapalle, Gujjavandlapalle and Mittavandlapalle.
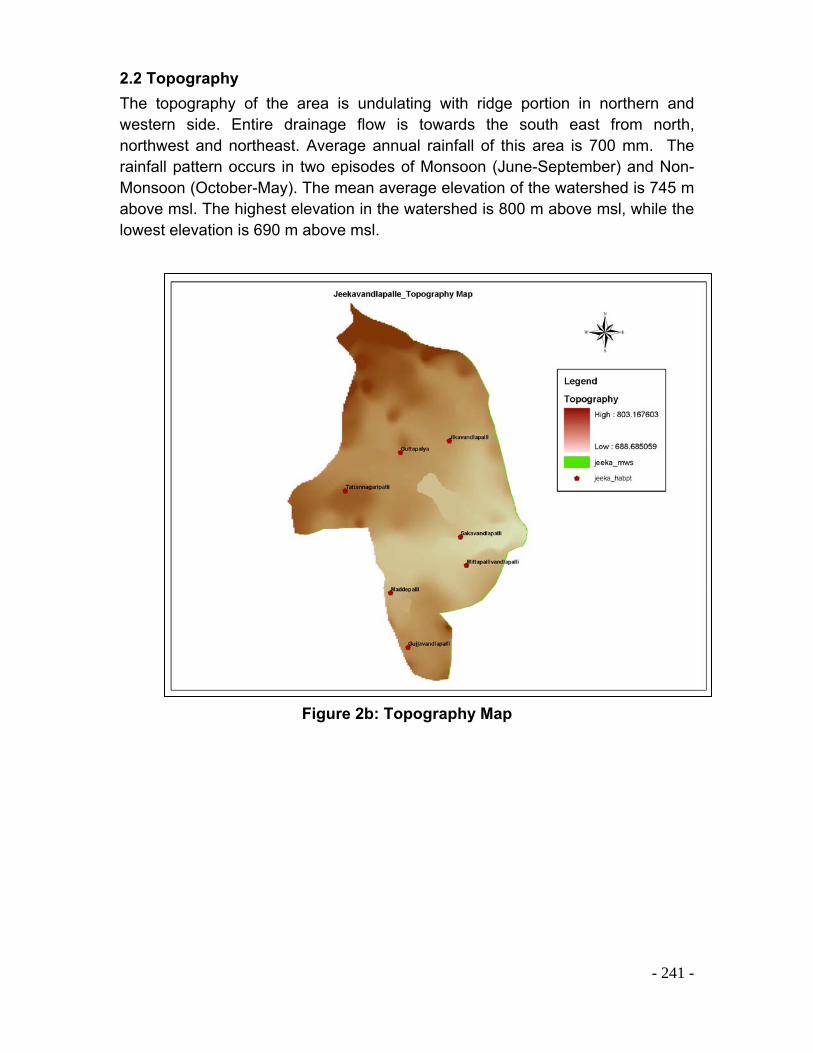
- 241 -
2.2 Topography
The topography of the area is undulating with ridge portion in northern and western side. Entire drainage flow is towards the south east from north, northwest and northeast. Average annual rainfall of this area is 700 mm. The rainfall pattern occurs in two episodes of Monsoon (June-September) and Non-Monsoon (October-May). The mean average elevation of the watershed is 745 m above msl. The highest elevation in the watershed is 800 m above msl, while the lowest elevation is 690 m above msl.
Figure 2b: Topography Map
- 242 -
CHAPTER III Geology
Prior to initiating a watershed program in a given area, it is essential to study the local geological characters based on rock formations, soil parameters and natural geological controls and its hydrogeological connectivity of the area. It is very crucial in land characterization, particularly suitability of land for watershed activities like water resources development, soil moisture conservation and livestock enhancement. Site with shallow hard rock basement or thick clay soil is suitable for constructing the harvesting structures. Sites with deep hard rock basement or hard rock with intensive fractures, highly weathered and thick gravelly or sandy soil are suitable for constructing the recharge structures like percolation tanks and farm ponds. 3.1 Regional Geology According to the geological setting of India, more than 70% of the Indian Peninsula is occupied by all varieties (igneous, metamorphic) of hard rocks. Remaining land is occupied by sedimentary and recent alluvial deposits. The present study areas forms part of southern India which is occupied by older metamorphosed Peninsular Gneisses to younger igneous formations.
The geological history of the Karnataka is largely confined to the two oldest eras – the Archaeans and Proterozoic. Hence igneous and metamorphic rocks of the Precambrian age occupy about 80% area of the state; remaining area is made of rocks belonging to the Proterozoic and Phanerozoic Eon. Tertiary rocks are exposed along the coastal regions. The gneissic basement is followed by granites, charnokites and khondalites with younger granites on top, in some area.
After the igneous episode, many rock sequences were disturbed by tectonic forces and secondary structures like fractures, folds and faults were formed. Later, these secondary structures were intruded by igneous bodies like dykes, quartz and pegmatite veins, which themselves may have been fractured subsequently. 3.2 Local Geology The main rock types in the study area are peninsular gneisses, younger gneisses and secondary intrusive like dykes and quartz, pegmatite veins. This area is a part of the regional Archean Complex having outcrops of younger granites and underlain by peninsular gneissic basement. This belt of granites can be correlated with late Archean to Proterozoic aged younger granites of Dharwar craton (Closepet Granites) (Raman and Murthy, 1997) The local geology of the area falls under Dharwar.

- 243 -
Stratigraphy. The entire study area is of hard rock terrain with secondary structural features like faults, joints and fractures. Lineaments were observed all over the watershed.
Photo3a: Gneissic Basement Exposure along the slopes of the Granite hillock
Peninsular Gneisses Granite gneisses are the important rock types in the area that belong to the Older Peninsular Gneissic Complex. It is composed of banded gneiss and gneissic granite. Being one of the oldest terrains in India, it has undergone many phases of tectonic activity and metamorphism over the years. Whole terrain has rugged and undulating topography. Therefore, the productive zones to extract ground water in these rocks (aquifer) are frequently erratic and unpredictable. The following picture shows the exposed bed rock gneiss in the hill slopes of the Jeekavandlapalle Watershed

- 244 -
Younger Granites: Texturally medium to coarse grained, porphyritic younger granites forms more or less undulating landscape with small and large hillocks and mounds in the study area. These lands are Mineralogically Potash rich, leucocratic granites almost similar to underlying gneisses but less metamorphosed and are more acidic. Both the study areas show the outcrops of grey colored granites which are highly jointed and show the typical’ Tor Topography’ commonly shown by granites. Photo 3b: Fractures in Granite Mound overlying the Gneissic basement Secondary Intrusions Dykes: Two major dykes are exposed in both watersheds dividing this area into two different hydrogeological zones. The trend of these dykes in NW-SE. the composition is mainly doleritic.
Photo 3c: Dyke Exposure in the study area

- 245 -
Veins: After the dykes, quartz intrusions also play a vital role in local hydrogeological regime. The contact zones of these exposures are very useful for selecting the recharge structures. These structures are linear but there extension is in local scale. These quartz veins are scattered and fragmented, with fragments strewn across the fields of both study areas. Photo 3d: Dyke Exposure in the study area and concealed in some places
Photo 3e: Small Quartz intrusion (white) along the fracture of the granite exposure

- 246 -
The following map show the local geological setting of the study are
Figure 3a: Geological Map of Jeekavandlapalli Study Area

- 247 -
CHAPTER IV Soils
Soil characteristics play vital role in understanding the geology and hydrogeology of the study area and in suitable site selection for the agriculture or cropping pattern. Soil is the weathered and disintegrated material from parent rock and its characteristics depend on the type and composition of the parent rock. The suitable site selection for water and soil conservation and enhancement of the soil moisture activities depends on the thickness, shape and its grain size. The thickness of the soil depends on the slope, degree of the weathering. On the ridges or steep slope areas, the soil layer is very thin or absent but in the slopes or downstream may extend upto 45meters. While gravelly or sandy soils allow the downward movement or infiltration and percolation of water more rapidly (200mm/hr) loamy, silty and clayey soils contain very slow infiltration or percolation rates (1.3mm/hr). Hence, soil characteristics are very important in site selection for construction of recharge and harvesting structures. 4.1 Soil Characteristic Locally four types of soils were observed to be present in the study areas. These are red gravelly, red sandy, red loamy and clayey soils. Red Gravelly Soils Thin red gravelly soils are mainly seen along the foot hills of the granite mounds and quartz, pegmatite intrusions. This soils show presence of granite and quartz pebbles and is highly permeable in nature. This is the suitable soil for water recharge.
Photo 4a: Thick red gravelly soil at the foot hills of the granite moundwith dyke exposure

- 248 -
Red sandy Soils Red sandy soils occupy the down portions of the red gravelly soils with 3-5meter in thickness. Both these soils play key role in recharging the rainwater storm or runoff which is comes from the hillocks. Some tanks are located in this zone contributing more recharge into bore wells which are located further downstream of these tanks due to the high permeable nature of these soils. Red Loamy Soils Thick red loamy soils are dominant soils in these study areas. Their thickness varies from 5-45meters in downstream areas and form part of the regolith portion of the shallow unconfined aquifers.
Photo 4b: showing the thick red loamy soil exposure in study area Most of the wells located in this zone contain sand, silt and clay in equal amounts and suitable for cultivation of sunflower, groundnut, and vegetable crops.
The thick black Clay soil occurring further downstream in the study areas and along streams is very thick. The moisture content in this zone is high due to its high water holding capacity (porosity) but permeability is less due to its small grain size. Most of the tanks are silted by clay soils which control the groundwater recharge from tanks with less infiltration rate resulting into the high evaporation rate.

- 249 -
4.2 Agriculture & Land use Pattern in Watershed Local perceptive, from the field studies reveal that the landscape surrounding both the study areas, show degraded vegetation in the uplands and thick vegetation in low lying lands where soil is thick. Most of the study area is encompassed by coarse, fragmentary material mixed with soil. Land-use is in the form of rain fed mixed cropping with barren patches. The economy of both the areas mainly depends on agriculture. In the absence of perennial rivers, canals, tanks both the areas depend mostly on ground water through bore well irrigation. But the intensity of bore well is more in Jeekavandlapalle compared to Kamaravaripalle. Paddy is the main crop in both areas and groundnut is common rainfed variety with tomato. Compared to the cultivated land, Jeekavandlapalle has more cultivated land when compared to Kamaravaripalle. The cropping pattern and the persistence of irrigation in summer indicate the potential for over abstraction of groundwater is little high in both areas.

- 250 -
CHAPTER V METEOROLOGY
5.1 Rainfall Pattern Rainfall or precipitation is the main source of water for both surface and groundwater resources. It is important to understand the rainfall characteristics and its behavior on the land in order to estimate its volume, velocity etc. Rainfall is the critical factor for the groundwater recharge (most of the aquifer systems in the study area essentially unconfined and confined). The recharge and discharge parameters depend on several factors such as soil, geology, slope, and land use etc. There is a direct relationship between the rate of infiltration and the intensity of rainfall. However, if the rainfall intensity exceeds the infiltration capacity, the forgoing relationship breaks down and may, indeed, be replaced by an inverse relationship between infiltration and rainfall intensity. This is normally the case when an increase in rainfall intensity is reflected in an increase in the size of the raindrop, and consequently with an increase in their compacting force as the drops strikes the ground surface. This microwatershed receives rain from both the North-east as well as the South-west monsoon. The total pre monsoon and post monsoon data reveal that there are periods of torrential rain and a period of drought that exists in the region. Meteorological parameters such as rainfall data is analyzed in detail for the study area. The annual average rainfall is around 700 mm with 374 mm in monsoon and 324 mm in non monsoon period indicating that this area getting almost equal rainfall in two spells and the rainfall intensity is more in October. The total monsoon and non monsoon data reveal that there are periods of torrential and a period of drought that exists in the region. The rainfall data from 1990 to 2009 analyzed to find the year wise trend.
Yearwise Rainfall Pattern of Bagepalle Taluka
0
200
400
600
800
1000
1200
90-91 91-92 92-93 93-94 94-95 95-96 96-97 97-98 98-99 99-00 00-01 01-02 02-03 03-04 04-05 07-08 08-09Year
Rai
nfal
l (m
m)
Graph 5a: Year wise Rainfall Trend from 1990 to 2009 (2005-06 missing)
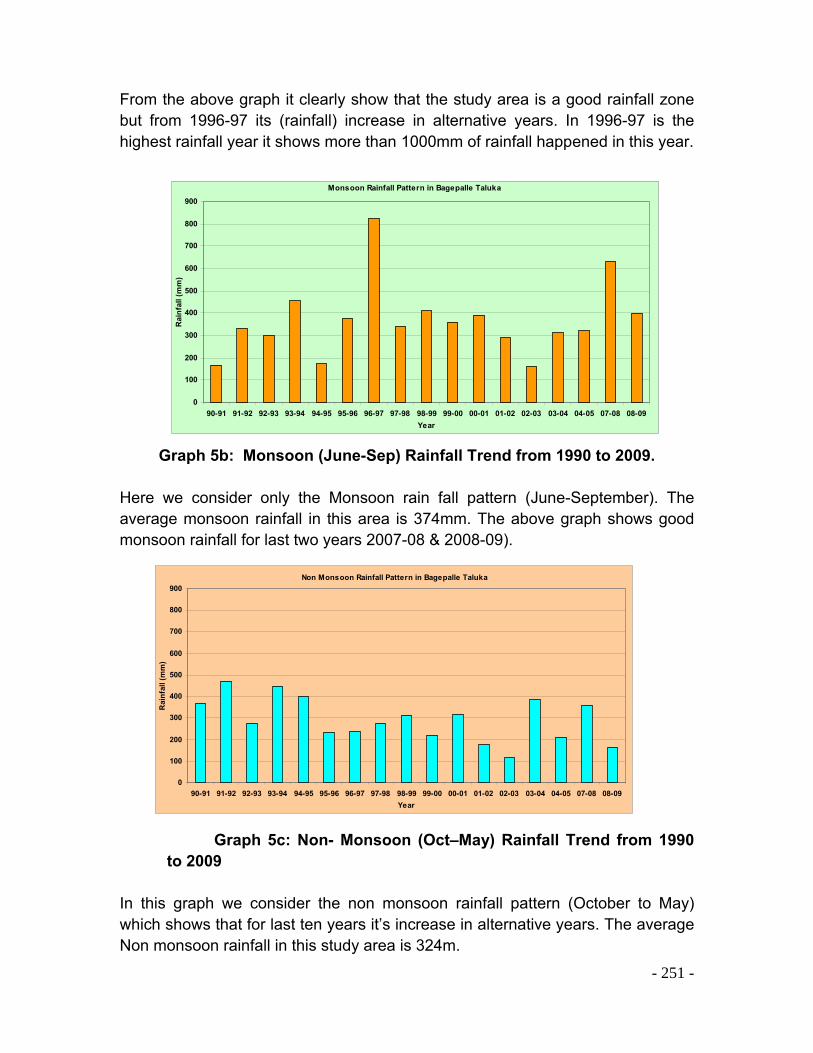
- 251 -
Monsoon Rainfall Pattern in Bagepalle Taluka
0
100
200
300
400
500
600
700
800
900
90-91 91-92 92-93 93-94 94-95 95-96 96-97 97-98 98-99 99-00 00-01 01-02 02-03 03-04 04-05 07-08 08-09
Year
Rai
nfa
ll (m
m)
Non Monsoon Rainfall Pattern in Bagepalle Taluka
0
100
200
300
400
500
600
700
800
900
90-91 91-92 92-93 93-94 94-95 95-96 96-97 97-98 98-99 99-00 00-01 01-02 02-03 03-04 04-05 07-08 08-09
Year
Rai
nfa
ll (m
m)
From the above graph it clearly show that the study area is a good rainfall zone but from 1996-97 its (rainfall) increase in alternative years. In 1996-97 is the highest rainfall year it shows more than 1000mm of rainfall happened in this year.
Graph 5b: Monsoon (June-Sep) Rainfall Trend from 1990 to 2009. Here we consider only the Monsoon rain fall pattern (June-September). The average monsoon rainfall in this area is 374mm. The above graph shows good monsoon rainfall for last two years 2007-08 & 2008-09).
Graph 5c: Non- Monsoon (Oct–May) Rainfall Trend from 1990 to 2009
In this graph we consider the non monsoon rainfall pattern (October to May) which shows that for last ten years it’s increase in alternative years. The average Non monsoon rainfall in this study area is 324m.
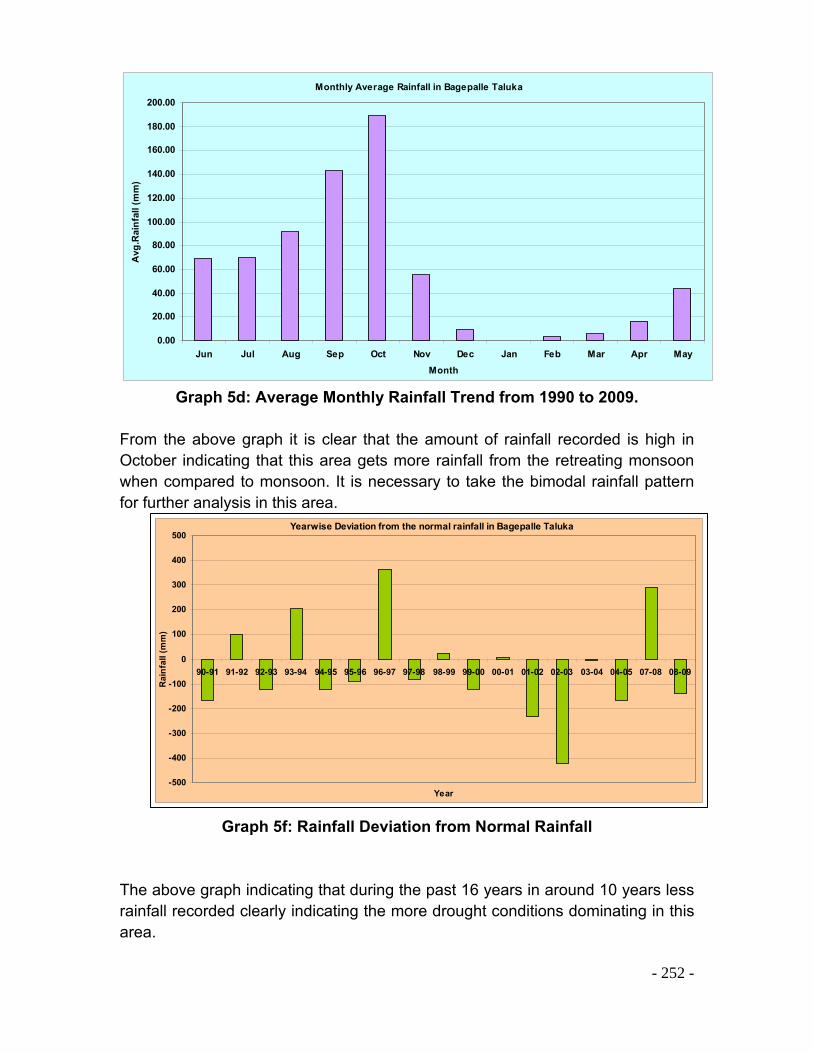
- 252 -
Yearwise Deviation from the normal rainfall in Bagepalle Taluka
-500
-400
-300
-200
-100
0
100
200
300
400
500
90-91 91-92 92-93 93-94 94-95 95-96 96-97 97-98 98-99 99-00 00-01 01-02 02-03 03-04 04-05 07-08 08-09
Year
Rai
nfa
ll (m
m)
Monthly Average Rainfall in Bagepalle Taluka
0.00
20.00
40.00
60.00
80.00
100.00
120.00
140.00
160.00
180.00
200.00
Jun Jul Aug Sep Oct Nov Dec Jan Feb Mar Apr May
Month
Avg
.Rai
nfa
ll (m
m)
Graph 5d: Average Monthly Rainfall Trend from 1990 to 2009.
From the above graph it is clear that the amount of rainfall recorded is high in October indicating that this area gets more rainfall from the retreating monsoon when compared to monsoon. It is necessary to take the bimodal rainfall pattern for further analysis in this area.
Graph 5f: Rainfall Deviation from Normal Rainfall
The above graph indicating that during the past 16 years in around 10 years less rainfall recorded clearly indicating the more drought conditions dominating in this area.

- 253 -
Chapter VI
GEOMORPHOLOGY 6.1 Importance of the Geomorphology The study of the drainage pattern and its characteristics is called as Geomorphology and it is a very useful tool for analyzing the nature of the soil and hydrogeological characteristics of the study area. Geomorphological analysis reveal the nature of contributing surfaces, both the surface drainage as wells as the infiltration component (Kulkarni, 1991). Moreover, during the study, it was thought that drainage analysis would help reveal the nature of water flow in a regime, where there are permeable soils above the relatively impermeable rocks and the information about tectonic controls on the area. Entire drainage pattern was mapped by using the GIS software by using the SOI topo-sheet with a scale of 1: 50,000. Drainage lines are narrow but shallow in depth. In the lower reaches of higher order streams, the drainage lines which are wide, appear to be structurally controlled or following the lineaments. But most of the drainage lines in lower reaches turn shallow, due to siltation and vegetative growth. These drainage lines are mapped by the intensive field investigation. However, some of the changes may occur due to the land-use pattern, encroachments of farmlands and common lands (uncultivated / drainage lines). With a view to correlate between the geomorphometry of the study area and the hydrological - hydrogeological controls in both watersheds, detailed drainage analysis was carried out for the mapped drainage network. 6.1 Geomorphology of the Watershed: According to the geomorphological characteristics, this area comes under 4th order drainage basin. It gradually slopes towards the south east, the regional slope being towards the South east to south, with elevations are in the range of 800 to 690 m above mean sea level.

- 254 -
Figure 6a: Geomorphologic Map 6.1.2 Drainage Pattern This area forms a minor basin for the Papagni River. The regional drainage pattern is sub dendritic in nature. The drainage usually follows the local topographical trend (slope) from WNW to south and southeast. There is one 4th order stream that collects the entire water from the west north and north east except south. Most of the first and second order streams feed into tanks. There are some four minor and one major tank in this study area. 6.1.2 Drainage analysis The detailed drainage analysis was done in Jeekavandlapalle study area considering the length, number and area characteristics. These data is provided in Table 6 (b and c).
Table 6a: Drainage characteristics of the Jeekavandlapalle Watershed (Order and Length analyses of sub-basins)

- 255 -
Stream Order
Number of
Streams (N)
Bifurcation Ratio (Bf)
Total Stream Length
(L) (Km)
Average Stream Length
(AvgL)(L/N)
Length ratio (lower order AvgL/high
order AvgL)1 9 4.5 7.827 0.869666667 -
2 2 2 3.822 1.911 0.455084598
3 1 1 0.081 0.081 23.59259259
4 1 2.862 2.862 0.028301887
The bifurcation ratio of all the stream orders indicates that there is no structural control in this area.
Table 6b: Drainage characteristics of the Jeekavandlapalle Watershed (Area and Drainage ratio analyses)
Total No. of streams (N)
Basin area A (Km2)
Total length of streams (L) (Km2)
Drainage density Dd = L/A (Km/Km2)
Constant of channel maintenance (1/Dd) (Km2 for 1 Km)
Stream frequency F=N/A (per Km2
13 10.291 14.592 1.417938 0.705249454 1.263239724
The drainage density of the study area confirms to drainage morphometry and geohydrological conditions suitable for better surface permeability. It is confirmed that more possibility for recharge conditions in Jeekavandlapalle. Stream frequency data also supports this conclusion as the basin contain lower number of streams per unit area particularly Jeekavandlapalle contains lower number of streams around 1.26 streams are required to drain an area of 100 hectares.
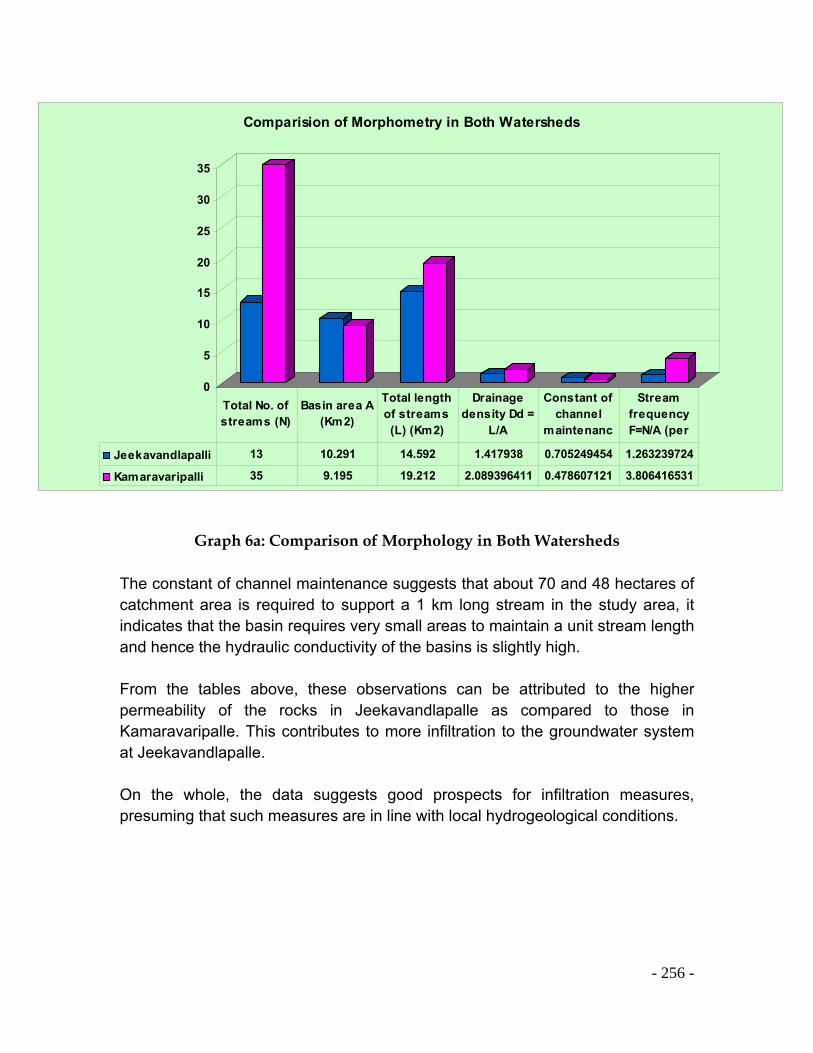
- 256 -
0
5
10
15
20
25
30
35
Comparision of Morphometry in Both Watersheds
Jeekavandlapalli 13 10.291 14.592 1.417938 0.705249454 1.263239724
Kamaravaripalli 35 9.195 19.212 2.089396411 0.478607121 3.806416531
Total No. of streams (N)
Basin area A (Km2)
Total length of streams (L) (Km2)
Drainage density Dd =
L/A
Constant of channel
maintenanc
Stream frequency F=N/A (per
Graph 6a: Comparison of Morphology in Both Watersheds
The constant of channel maintenance suggests that about 70 and 48 hectares of catchment area is required to support a 1 km long stream in the study area, it indicates that the basin requires very small areas to maintain a unit stream length and hence the hydraulic conductivity of the basins is slightly high. From the tables above, these observations can be attributed to the higher permeability of the rocks in Jeekavandlapalle as compared to those in Kamaravaripalle. This contributes to more infiltration to the groundwater system at Jeekavandlapalle. On the whole, the data suggests good prospects for infiltration measures, presuming that such measures are in line with local hydrogeological conditions.

- 257 -
CHAPTER VII Hydrogeology
This is the science which deals the relationship of the water with rocks. Understanding the hydrogeology is important prior to initiating the water shed development projects. It is very helpful in understanding the occurrence and distribution of the groundwater and its movement in hydrogeological regime. It is also very helpful in estimating the surface and groundwater resources and their relationship with meteorological parameters. The primary physical framework for the study areas is provided by gneissic rocks, traversed by fractures, dykes and quartz veins. Hence, the hydrological and hydrogeological environment is essentially a “hard-rock” domain. They constitute groundwater systems showing uncertain well-yields with an overall low aquifer-storage potential. Due to the lower hydrogeological significance the groundwater potential of this area depends on soil properties, degree of weathering of parent rock and intensity of lineaments. Hydrogeological mapping of the area was conducted through intensive field inventories to delineate the groundwater system and its characteristics. Jeekavandlapalle watershed fall under moderate rainfall zone. The average rainfall in this watershed is around 700 mm; the runoff component is reported to be a small component when compared to the water balance of ten years. Because, in this area, the drainage density is poor due to the permeable nature of the top soil and the underlying weathered mantle. In order to understand the hydrogeological regime in the study area, about 50 wells (bore + dug) in Jeekavandlapalle was considered for the well inventory, from the year 2009. Water level indicator was used for regular water level measurements in all the seasons. Detailed water level analysis is described in the following chapter. 7.1 Regional Ground Water System: Ground water systems are a result of the complex combination of different lithological types within the area, that together constitute a realm, within which groundwater accumulates and moves. The geological and climatic features mainly control the movement and occurrence of the groundwater in this area. The groundwater system in the study areas is shallow and deep, formed out of the openings attributed by the foliations and fractures in the gneisses Shallow (unconfined) aquifer in the soil and weathered mantle along the basal periphery of hillocks and mounds were observed to be present in the area. The
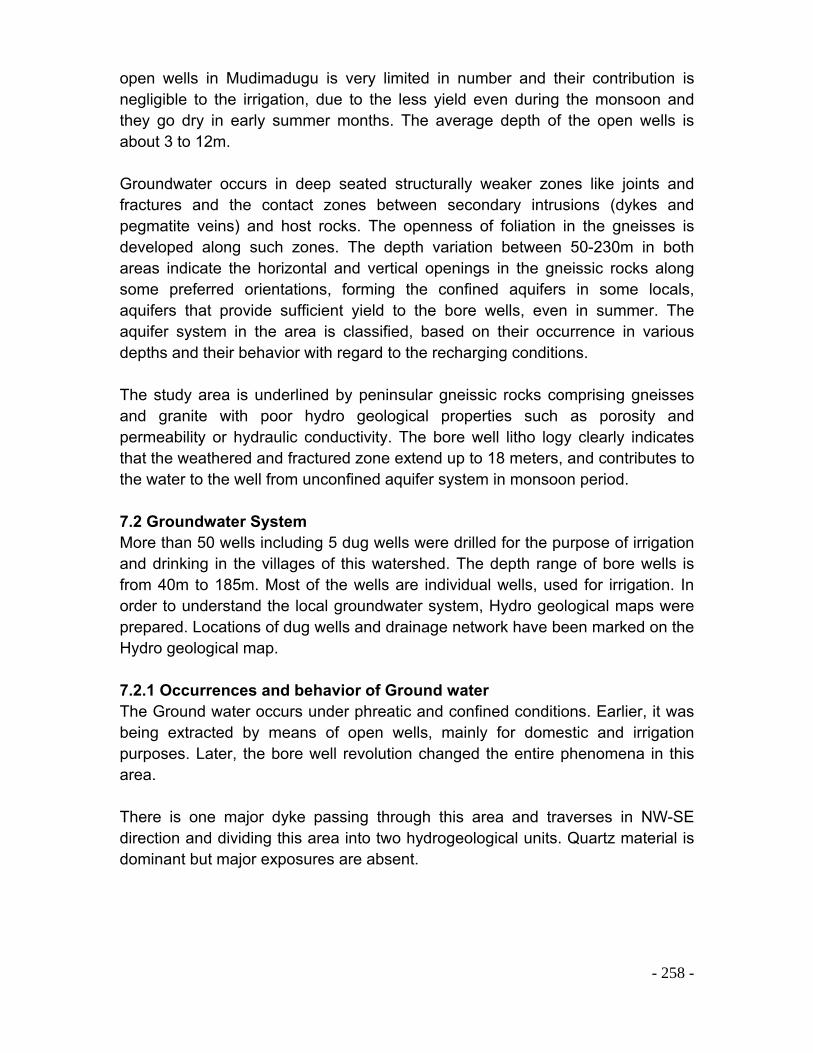
- 258 -
open wells in Mudimadugu is very limited in number and their contribution is negligible to the irrigation, due to the less yield even during the monsoon and they go dry in early summer months. The average depth of the open wells is about 3 to 12m. Groundwater occurs in deep seated structurally weaker zones like joints and fractures and the contact zones between secondary intrusions (dykes and pegmatite veins) and host rocks. The openness of foliation in the gneisses is developed along such zones. The depth variation between 50-230m in both areas indicate the horizontal and vertical openings in the gneissic rocks along some preferred orientations, forming the confined aquifers in some locals, aquifers that provide sufficient yield to the bore wells, even in summer. The aquifer system in the area is classified, based on their occurrence in various depths and their behavior with regard to the recharging conditions.
The study area is underlined by peninsular gneissic rocks comprising gneisses and granite with poor hydro geological properties such as porosity and permeability or hydraulic conductivity. The bore well litho logy clearly indicates that the weathered and fractured zone extend up to 18 meters, and contributes to the water to the well from unconfined aquifer system in monsoon period. 7.2 Groundwater System More than 50 wells including 5 dug wells were drilled for the purpose of irrigation and drinking in the villages of this watershed. The depth range of bore wells is from 40m to 185m. Most of the wells are individual wells, used for irrigation. In order to understand the local groundwater system, Hydro geological maps were prepared. Locations of dug wells and drainage network have been marked on the Hydro geological map.
7.2.1 Occurrences and behavior of Ground water The Ground water occurs under phreatic and confined conditions. Earlier, it was being extracted by means of open wells, mainly for domestic and irrigation purposes. Later, the bore well revolution changed the entire phenomena in this area. There is one major dyke passing through this area and traverses in NW-SE direction and dividing this area into two hydrogeological units. Quartz material is dominant but major exposures are absent.

- 259 -
Figure 7a: Hydro geological Map of Jeekavandlapalle
Photo 7a: Dried open well in Sakavandlapalle

- 260 -
In Jeekavandlapalle, the groundwater system is unconfined but in some locals it is confined. Few bore wells respond after monsoon. The water occurs at different depths. Earlier, the water table was at a depth of 18 to 30 m, which at present, has changed due to the rapid groundwater exploitation and with diversified cropping pattern.
Photo 7b: Artesian conditions occurring still in pre monsoon period in Gujjavandlapalle
7.2.2 Groundwater Movement in Jeekavandlapalle The movement of the groundwater in this area shows variation according to the watershed theme, due to the natural barriers i.e. dykes. Except the surface runoff or surface water flow there is no groundwater movement from upstream to down stream.

- 261 -
CHAPTER-VIII Water Level Analysis
Data of Static water levels was collected from the selected wells for the pre monsoon period in both watersheds in order to understand the water resources and their estimation and water budgeting. 8.1 Water Level Analysis in Jeekavandlapalle: 52 bore wells were selected for water level analysis in total. Few dug wells were also selected in this area. Given below table is showing the habitation wise water level data of Pre monsoon period. The average static water level in this area around 10mts. Highest value recorded in Guttapalya and lowest in Gujjavandlapalle.

- 262 -
Table 8a: Well Inventory data in Jeekavandlapalle Watershed
Well_ID S_W_L Casing Total Depth 1st Gap 2nd Gap Village_N
TGP1 1.28 6 6 Tatanagarpalle
TGP2 5.62 14 167 106 136 Tatanagarpalle
TGP3 4.85 9 91 Tatanagarpalle
SKVP1 3.66 6 76 Sakavandlapalli
SKVP2 21.36 9 124 27 67 Sakavandlapalli
SKVP3 3.04 0 12 Sakavandlapalli
SKVP4 22.56 9 155 Sakavandlapalli
SKVP5 1.3 6 106 18 Sakavandlapalli
SKVP6 1.36 0 12 Sakavandlapalli
SKVP7 2.86 6 52 Sakavandlapalli
SKVP8 2.41 0 9 Sakavandlapalli
SKVP9 3.46 0 11 Sakavandlapalli
MTVP1 4.43 12 79 79 Maittavandlapalle
MTVP2 11.87 9 136 76 97 Maittavandlapalle
MTVP3 5.78 12 82 21 Maittavandlapalle
MTVP4 7.12 9 76 Maittavandlapalle
MTVP5 4.66 12 115 6 85 Maittavandlapalle
JGVP1 8.39 6 106 33 45 Jiganivandlapalle
JGVP2 8.58 11 79 Jiganivandlapalle
JGVP3 8.68 6 121 Jiganivandlapalle
JGVP4 8 6 85 Jiganivandlapalle
JGVP5 9.11 5 91 Jiganivandlapalle
JGVP6 8.56 11 106 Jiganivandlapalle
JGVP7 8.18 9 106 Jiganivandlapalle
JGVP8 8.05 6 121 Jiganivandlapalle
JGVP9 8.68 5 91 Jiganivandlapalle
JGVP10 7.9 12 106 Jiganivandlapalle
JGVP11 9.39 5 106 Jiganivandlapalle
JGVP12 10.07 5 106 Jiganivandlapalle
JGVP13 8.68 12 121 Jiganivandlapalle
JGVP14 3.36 15 136 Jiganivandlapalle
JKP1 8.83 6 85 55 Jeekavandlapalle
JKP2 9.16 18 85 52 76 Jeekavandlapalle
JKP3 15.46 12 152 36 118 Jeekavandlapalle
JKP4 14.72 7 158 148 Jeekavandlapalle
JKP5 1.84 5 91 18 36 Jeekavandlapalle
JKP6 5.86 5 115 33 Jeekavandlapalle
JKP7 10.14 8 61 Jeekavandlapalle
JKP8 9.31 5 121 88 Jeekavandlapalle
JKP9 3.38 6 91 55 Jeekavandlapalle
JKP10 4.38 5 67 52 Jeekavandlapalle
JKP11 2.61 6 106 12 Jeekavandlapalle
GTP1 34.26 4 182 176 Guttapalya
GJVP1 2.66 12 121 Gujjavandlapalli
GJVP2 1.36 12 121 Gujjavandlapalli
GJVP3 3.39 3 76 Gujjavandlapalli
GJVP4 2.45 9 50 Gujjavandlapalli
GJVP5 2.86 12 61 Gujjavandlapalli
GJVP6 1.36 5 76 Gujjavandlapalli
GJVP7 12 21 55 Gujjavandlapalli

- 263 -
Table 8b: Well Inventory data in Jeekavandlapalle Watershed
Drilled Year
Depend Land Major Crop
Motor Capacity
MotorDepth
2006 4 Maize 12 121
2003 7.5 61
1999 3 Paddy 10 67
2006 3 Beans 15 76
1989 3.5 Paddy 3 8
2006 2 Tomato 15
2006 3 Zonai 7.5
1989 3 Zonai 10
1995 8 Zonai 6 30
1985 2 Zonai 7.5
1985 2 Paddy 7.5
2001 4 Maize 7.5 61
2004 6 Maize 7.5 106
2005 3 S.Flower 7.5 42
1999 2 Tomato 7.5 91
2004 1.5 Paddy 10 70
2004 1 Tomato 10 70
1996 1 Onion 7.5 39
2004 5 Paddy 7.5 76
2002 1 Paddy 7.5 76
2003 1 Tomato 10 76
2002 1.5 Paddy 10 91
2002 1 Tomato 7.5 61
2005 1 Ragi 10 91
1995 5 Paddy 7.5 91
2005 3 Paddy 7.5 76
2003 3 Tomato 7.5 91
2003 3 Onion 10 76
1997 4 Vegetable 7.5 67
1997 4 Vegetable 6.5 55
2005 4 Vegetable 10 109
2007 4 Vegetable 16 106
2009 6 Maize 10.12 91
2005 7 Maize 6.8 73
1999 3 S.Flower 7.5 91
2006 6 Maize 7.5 76
1983 4 Maize 7.5 61
1994 3.5 Maize 7.5 48
2006 10.5 112
2007 2 Paddy 7.5 106
2007 2 Paddy 7.5 106
2008 2 Ragi 7.5 61
2005 7 Ragi 6.5 36
2006 2 Ragi 7.5 30
2003 5 Zonai 7.5 30
2003 2 Ragi 7.5 61

- 264 -
0
5
10
15
2 0
2 5
3 0
3 5
Village wise Static Water Levels (mt) in Jeekavandlapalle
S WL (m t) 7 .7 9 3 .9 16 3 4 .2 6 6 .8 9 8 .2 5 9 2 .3 4 6 6 .7 7 2
J e e ka v a ndla pa lli Ta t ta na g a rpa lli Gutta pa lya S a ka v a ndla pa lli J ig a niv a ndla pa lli Gujja v a ndla pa lli M itta v a ndla pa lli
After the detail analysis of the water level data it is confirmed that the average static water level in this area around 10mts. highest value recorded in Guttapalya and lowest in Gujjavandlapalle. Here the dyke divides the entire watershed into two sub hydrogeological units. Gujjavandlapalle and parts of Tattanagarpalle and Jiganivandlapalle are separated from other habitations by the dyke. The average water level is around 11 mts in the upstream and 3 mts in downstream of the dyke clearly indicating its impact in both zones.
Graph 8a: Village wise Static Water Levels

- 265 -
0
2
4
6
8
10
12
Zone wise Static Water Level (mt) in Jeekavandlapalle Watershed
SWL (mt) 11.3 5.3
Zone1 Zone2
Graph 8b: Zone wise Static water Levels (mt)

- 266 -
CHAPTER-IX Water Resources Estimation
Considering the rainfall data over the study area and other data like recharge & discharge, base flow and other geohydrological parameters the ground water resource estimation has been made for these two study areas. Analyzing all these data in the most suitable methods suggested by CGWB are “Rainfall infiltration method22” in the MS-Excel the above calculation has been done. Rainfall is the major dependant source in the study area due to the complex hydrogeological system contains few fracture and joint systems which does not contains much storativity and transmissivity. In this study only one method “Rainfall Infiltration method is used due to the lacking of water level data for three seasons. This method is explained briefly in the below table. 9.1 Water Resources Estimation In 2008 - 2009 there was less rain fall occurred around 593mm only. The entire water resources analysis done based on this rainfall.
Rrf = f X A X Rainfall The infiltration factor in both areas has been considered as 11 and 12 % of rainfall due to the shallow and massive crystalline basement with uneven distribution of fracture system and limited thickness of weathered mantle. The average depth of tanks taken around 2.5mt. Around 20 % of the total storage has taken as recharge from the surface storage in monsoon season due to the siltation of the tanks by clayey material. The following tables show the water resources estimation from the study area Table 9a: Monsoon Recharge due to the Precipitation (June-September)
Ppt (m)
Total Area
(Hect)
Total Area (m2)
Volume of
Monsoon Rainfall
(m3)
Recharge Factor
(%)
Monsoon Recharge
(m3)
Total Surface Storage
Recharge from Surface Storage (m3)
Total Monsoon Recharge (m3)
0.397 1029.7 10297000 4087909 12 490549 525000 105000 595549
22 The methods and formulas for groundwater resources estimation for both study areas taken from the
manual of Dynamic Groundwater Resources of India by Central Groundwater Board 2006

267
Table 9b: Non Monsoon Recharge due to the Precipitation (October-May)
Ppt (m)
Total Area
(Hect) Total Area
(m2)
Volume of Non-Monsoon Rainfall
(m3) Recharge Factor (%)
Non-Monsoon Recharge (m3)
0.162 1029.7 10297000 1668114 12 200173
Table 9c: Monsoon Water Budget (June-September)
Total Moosoon Recharge (m3)
Total Monsoon Discharge (m3)
Irrigation Return
Flow (m3) Water Requirement (Domestic+Cattle)
Area's Monsoon
Water Requirement
(m3)
Net Groundwater Availability (m3)
Monsoon Shortage / Surplus (m3)
Stage of Groundwater Development
595549 315840 87360 19661 335501 674509 339008 50
Table 9d: Non - Monsoon Water Budget (October - May)
Non-Moosoon Recharge
(m3)
Non-Monsoon Discharge
(m3)
Irrigation Return Flow (m3)
Water Requirement
(Domestic+Cattle)
Area's Non-Monsoon
Water Requirement
(m3)
Total Non-Monsoon Recharge
(Ppt+Return Flow) (m3)
Natural Discharge
(Non-Monsoon) (5%) (m3)
Net Non-Monsoon
Groundwater Availability
Non Monsoon Shortage / Surplus
(m3)
Stage of Groundwater Development
200173 538902 134726 2849 541752 334899 16745 318154 -223597 170
Table9e: Water Resource Estimation and Water Budgeting (2008 - 2009)
Net Monsoon Groundwater Availability (m3)
Net Non-Monsoon Groundwater Availability (m3)
Annual Replenishable Resources (m3)
Net Groundwater Availability (m3)
Area's Monsoon Water Requirement (m3)
Area's Non-Monsoon Water Requirement (m3)
Area's Total Water
Requirement Monsoo+Non-Monsoon (m3)
Annual Groundwater Draft (m3)
Shortage / Surplus (m3)
Stage of Groundwater Development
674509 318154 992663 992663 335501 541752 877253 877253 115410 88
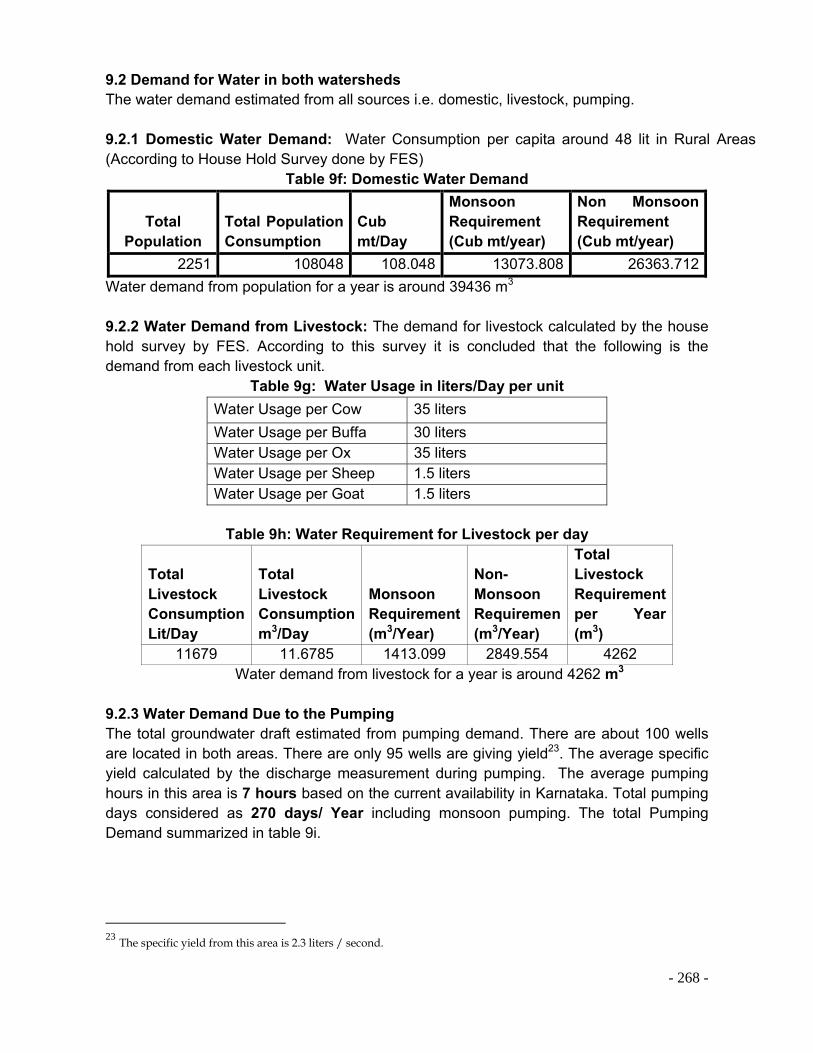
- 268 -
9.2 Demand for Water in both watersheds The water demand estimated from all sources i.e. domestic, livestock, pumping. 9.2.1 Domestic Water Demand: Water Consumption per capita around 48 lit in Rural Areas (According to House Hold Survey done by FES)
Table 9f: Domestic Water Demand
Total Population
Total Population Consumption
Cub mt/Day
Monsoon Requirement (Cub mt/year)
Non Monsoon Requirement (Cub mt/year)
2251 108048 108.048 13073.808 26363.712
Water demand from population for a year is around 39436 m3 9.2.2 Water Demand from Livestock: The demand for livestock calculated by the house hold survey by FES. According to this survey it is concluded that the following is the demand from each livestock unit.
Table 9g: Water Usage in liters/Day per unit
Water Usage per Cow 35 liters
Water Usage per Buffa 30 liters Water Usage per Ox 35 liters Water Usage per Sheep 1.5 liters Water Usage per Goat 1.5 liters
Table 9h: Water Requirement for Livestock per day
Total Livestock Consumption Lit/Day
Total Livestock Consumption m3/Day
Monsoon Requirement (m3/Year)
Non-Monsoon Requiremen (m3/Year)
Total Livestock Requirement per Year (m3)
11679 11.6785 1413.099 2849.554 4262 Water demand from livestock for a year is around 4262 m3
9.2.3 Water Demand Due to the Pumping The total groundwater draft estimated from pumping demand. There are about 100 wells are located in both areas. There are only 95 wells are giving yield23. The average specific yield calculated by the discharge measurement during pumping. The average pumping hours in this area is 7 hours based on the current availability in Karnataka. Total pumping days considered as 270 days/ Year including monsoon pumping. The total Pumping Demand summarized in table 9i.
23 The specific yield from this area is 2.3 liters / second.

- 269 -
Table 9i: Monsoon Bore well Discharge (June-September)
Total Area (Ha)
No of Pump
s (BW+OW)
Working
Pumping Days
Pumping
Hours Daily
Pumping
Hours Yearl
y
Average Specific
Yield (Lit/Min)
Average Specific
Yield (Lit/Hour)
Monsoon Discharg
e 1029.7 52 47 80 7 560 200 12000 315840
Table 9j: Non Monsoon Bore well Discharge (October-May)
Total Area
(Hect)
No of Pumps (BW) Working
Pumping Days
Pumping Hours Daily
Pumping Hours Yearly
Average Specific
Yield (Lit/Min)
Average Specific
Yield (Lit/Hour)
on-Monsoon Discharge
1029.7 52 47 195 7 1365 140 8400 538902

- 270 -
CHAPTER X
10.0 Conceptual hydrogeological model 10.1 Supply, Demand and Groundwater Budget The present groundwater scenario in the Jeekavandlapalle is little grim due to the over exploitation with high capacity bore wells. The well density is around 5 per Sq.Km with 50 bore wells and the present depth of the aquifer is around 175 meters in some areas. The tables and the graphs given below indicate the Demand & supply and groundwater balance in this area.
Table 10a: Supply, Demand and Groundwater Balance
Net Availability of Groundwater
Annual Groundwater Draft
Safe Extraction (70% of Net Annual Recharge)
Stage of Groundwater Development
992663 877253 694864 88
0
100000
200000
300000
400000
500000
600000
700000
800000
900000
1000000
Recharge Discharge and Groundwater Balance Jeekavandlapalle
Jeekavandlapalle 992663 877253 694864
Net Availability of Groundwater
Annual Groundwater DraftSafe Extraction (70% of Net
Annual Recharge)
Graph 10b: Recharge, Discharge and Groundwater Balance

- 271 -
86
87
87
87
87
87
88
88
88
Stage of Groundwater Development in Both Watersheds
Stage of Groundwater Development 87 88
Kamaravaripalle Jeekavandlapalle
Graph 10c: The Stage of the Groundwater Development
The Shortage map and Stage of Groundwater Development Map clearly shows that the Jeekavandlapalle is more distressed by over abstraction than Kamaravaripalle. The above tables reveal that the discharge is much more than the recharge in both watersheds. The maximum imbalance occurs in Jeekavandlapalle.
10.2 A Demand – Supply Water Balance After the detailed analysis of all the data including demand and supply in Jeekavandlapalle, it is evident that the Pani-Panchayat (Maharastra) type of groundwater initiatives are being envisaged in the area, as a part of the long-term water management strategy. In order to calculate a sustainable strategy for water use, on the basis of the above analyzed data, the following balance has been extracted. Population= 2251 (450 families) Total Area = 10.19 km2 Average Rainfal2 = 700 mm The annual Average demand for Groundwater in Jeekavandlapalle is 877253 m3 Over the watershed area of 10.29 km2, this is equivalent to 85 mm of water At the same time, recharge factor for Gneissic Granites in this area is 12% (considering all parameters like soil and rock structures) of rainfall. During an average rainfall period of 700 mm, this implies some 84mm of water recharging the aquifers in the area. Suppose if we take the Irrigation return flows into consideration then the total recharge becomes 96 mm (992663 Cub mt)
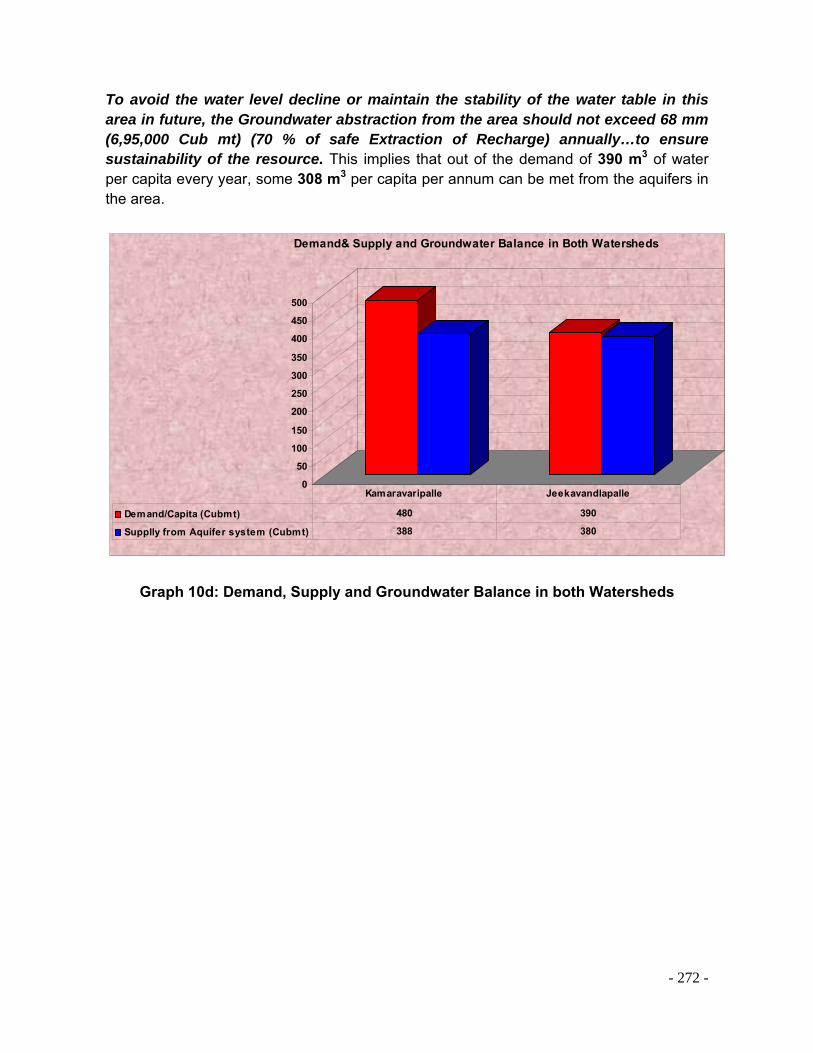
- 272 -
To avoid the water level decline or maintain the stability of the water table in this area in future, the Groundwater abstraction from the area should not exceed 68 mm (6,95,000 Cub mt) (70 % of safe Extraction of Recharge) annually…to ensure sustainability of the resource. This implies that out of the demand of 390 m3 of water per capita every year, some 308 m3 per capita per annum can be met from the aquifers in the area.
0
50
100
150
200
250
300
350
400
450
500
Demand& Supply and Groundwater Balance in Both Watersheds
Demand/Capita (Cubmt) 480 390
Supplly from Aquifer system (Cubmt) 388 380
Kamaravaripalle Jeekavandlapalle
Graph 10d: Demand, Supply and Groundwater Balance in both Watersheds
- 273 -
CHAPTER XI Conclusions
The functioning of the groundwater system occurs within the physical framework described earlier and is largely controlled by the geological set-up of the Gneissic Granites with Secondary Intrusions like Dykes. The detailed water study and stage of groundwater development in the study area reveals that this area is suffering from groundwater over abstraction problem. The functioning of the groundwater system occurs within the physical framework largely controlled by the geological set-up of the Gneissic Granites with Secondary Intrusions like Dykes. The salient features of the groundwater system behaviour are listed below, based on the water level data collected in the study area. Following conclusions can be derived after the detail study.
Study area is similar physiographically. Surface flow or monsoon runoff, though not observed is bound to be limited to a few
days, where the entire drainage network is concerned.
The total area of Jeekavandlapalle is 1029 Hectares.
Geologically study area is similar with Gneissic Granites.
Dolerite and Gabbroic Dykes play a crucial role in controlling the local hydrogeological regimes and separates both areas into different sub hydrogeological units.
The area for recharge potential is more in Jeekavandlapalle.
Highest well density with 52 Bore wells yielding water in Jeekavandlapalle is very
high.
Soil permeability on the whole is moderate due to the presence of fragmentary material mixed with top soil on the upland plateau and slopes. In valleys and tank bed areas it is low, but is offset by a less porosity of the soils in the red, clayey soils.
According to the soil condition, Jeekavandlapalle is more permeable with low
drainage density and frequency.
The depth of Static Water Level is deeper in Jeekavandlapalle particularly in peak pre monsoon season and directly affects the Specific Yield.
Abstraction (pumping) from the groundwater system is less in Jeekavandlapalle.

- 274 -
Groundwater Demand per capita in Jeekavandlapalle is around 390 Cubic Meters and the supply from aquifer is around 308 cub mts.

- 275 -
CHAPTER XII RECOMMENDATIONS AND SCOPE FOR FUTURE WORK
12.1Strategy for optimization of water resources from watershed development to watershed management After the analysis in the water study area it is concluded that the demand is more against supply in Jeekavandlapalle watershed which necessitates the need to club ‘water management’ simultaneously with watershed development activities such as soil moisture conservation. Initially, inputs are required in planning the water resources development and its implementation, based on the recommendations given in this report. Subsequently, and more significantly, an attempt of optimization of the water resources in the study area for a more long-term is required with sustained endeavors in this area. Based on the geometry and functioning of the groundwater system in the study area, it is divided into four distinct sub zones depicted in below table
Table 12a: Characterization of hydrological zones.
Zone Physiography
Lithology / Geology
Hydrogeology
Suitability
Zone A (Leather Brown) Runoff zone
Steep slopes
Covered by jointed younger granites with very thin gravelly soil cover
Highly runoff zone. Seasonal flows and dry in summer. Thin vegetative cover, but thick in slopes. Almost forest land.
Suitable for soil conservation activities like gully plugs, earthen bunds etc.,
Zone B (Big Sky Blue) Recharge Zone
Moderate slopes
Mostly covered by fractured & jointed Younger Granites with thick gravelly to sandy soil
Upper reaches; Seasonal flow of water; streams run dry within a few months from the monsoon. Zone of water table fluctuation.
Suitable for recharge through percolation tanks, farm ponds and restoration of existing structures.
Zone C (Berly Green) Moderate to Low Recharge Zone
Intermediate zone with small plateaux and slopes towards stream channels
Underlined by Gneissic Basement with thick loamy soil bed.
This is also seasonal. Relatively medium specific yield but forming semi confined to confined aquifer system with deeper fracture zones in gneissic rocks.
Portion for construction / use of small structures for recharge and storage also.
Zone D Higher Lower part of Middle to lower Scope for

- 276 -
(Autunite Yellow) Low Recharge Zone
order Streams and adjoining terraces of farmland
each sub hydrogeological unit with thick clay bed.
reaches; no base flow after monsoon period.
harvesting water deepening of existing open wells if any.
However, one should remember, that water resources management to be effective and sustainable, should be in tune with the project objectives of watershed development. The best option, therefore, is to establish a methodology of water use that is systematic enough to consider the specific hydrogeological characteristics. Based on the present investigation for longer time and the conclusions drawn, a broad strategy is being suggested as an attempt towards effective water resources development and management. Below figures depicts the broad strategy suggested for enhancement of water resources and their sustainable management for the both areas. The below maps give the recommendations in Jeekavandlapalle watershed.
Fig 12a: Recommendation Map 12.2 Recommendations for enhancement of Groundwater Resources
There is need to conserve the soil from erosion in the zone-A due to the steep slope. The elevation ranges from 1020 mts to 690 mts. Suitable for soil moisture activities like trenches, gully plugs and rock filled dams on first order streams. Underlined by fractured gneissic basement, encourage the slow infiltration into

- 277 -
perched aquifer system temporarily and protects the moisture and supports vegetation.
The upper slopes and middle portions of both the study areas would be most suitable for Farm pond treatment and it could be intensified in these regions along the pegmatite and dyke zones. The rationale of farm pond numbers is presented in the box below.
Density of Farm Ponds
How many farm ponds suitable for both study areas for conservation of water? The general measurement of farm ponds of 10m x 10m x 2m The total storage volume in each farm pond = 200 m3
Effective volume may be safely considered as 175 m3
Now for a model of 1:1 (1 farm pond per hectare of land, the effective storage works out to about 18mm.)
Application of above concept to the watershed Considering an optimum recharge of 12% of normal rainfall for the gneisses in both areas. The recharge of groundwater can be assumed to be 84mm (average annual rainfall is 700mm) annually. Going by the bimodal rainfall pattern, there would be effectively two episodes of recharge, each of some 42mm. Therefore, it is necessary to have a mechanism for mobilizing this quantum for systematic conservation within the groundwater system in the watershed. Hence, a factor of 42/18 (one episode / effective volume of one farm pond). The factor work out to be = 2.3 It means that the optimization would be most effective with 230 farm ponds for an area of 100 hectares.
There is a scope for mobilizing some recharge to the groundwater system,
especially within Zone B. Hence, a few feasible sites for percolation tanks may be very useful to control the runoff and supports infiltration. It is also known that there is sufficient number of existing natural tanks in the Jeekavandlapalle.
Construction of the recharge structures particularly across the dyke and quartz vein
intrusions will feed the water into deeper aquifer system.
Infiltration and percolation rates are very slow due to the shallow depth of gneissic basement and its compactness. Hence, the storage time of water in the structures play a vital role in recharge factor. Water stored for more than six months can be effective for ground water recharge into deeper aquifer. Otherwise, the water stored in limited unconfined aquifer will serve temporarily.
There is a need to construct large number of recharge structures like percolation
tanks, mini percolation tanks, check dams and farm ponds in this zone. The best

- 278 -
place for water development activities is indicated in map as zone-B while considering zone-C as secondary zone. Zone-B is the best suited for recharge when compared to zone-C. Because this zone is underlined by thick gravelly and sandy soil, which contains high infiltration.
Each tank should have been at 2.5-3 mt depth at least in this zone, only then it is
possible to enhance the ground water storage. After the construction, equitable sharing of the water is possible through community participation.
The unique feature of each zone in both areas is in the form of the groundwater
discharge area (Zone D). For the sustainable water management of this zone, it would be better to look at surface water based “water users” groups. This implies looking at older structures and the possibility of using water from these, especially for protective irrigation. Or, even the use of community wells in this zone…although the well-yields from this zone are bound to be limited, but sustainable in the long run.
Water harvesting for use is feasible in the lowermost reaches (Zone-D) of all zones
in the study area, along the course of the drainage channel (3rd or 4th order mainstreams). For this purpose, few small structures have been suggested, the overflow of which will feed a larger structure in the further downstream. These structures will also control the flow of silt into the downstream water bodies.
12.3 Recommendations for Sustainable Water Management In addition to the specific recommendations suggested above, there are also some general principles being provided as suggestions below, primarily to ensure sustainable use of water resources. Community based management of groundwater resources is envisaged as the next
step in villages Jeekavandlapalle and Jiganivandlapalle. Some of the learning’s from this report will prove to be useful in planning and implementing groundwater management in villages.
Finally, management of artificial recharge ought to involve a component of ‘better
informed’ communities. Communities ought to be posed with such questions as “What after watershed development and artificial recharge” during the post-project management phase.
Creating the awareness Stakeholders on their resources through Kalajathas or any
other communication methods. The communities should be capacitated to undertake the estimation of water
resources, as well as crop water budgeting.

- 279 -
Installation of few Meteorological Equipments such as Rain gauges, and water level indicators for regular monitoring by the community themselves.
Formation of the different institutions for surface and ground water with gender equity
or strengthening the already existing institutions like Water User Associations or User Groups.
Conducting exposure visits to those areas where groundwater management is being
successfully practiced such as Kothakota watershed area, and also to the area where the area is worst effected by groundwater over abstraction such as Siddlaghatta.
It would be better to encourage the use of shallow groundwater (usually open wells)
and establish shallow aquifer systems as a sustainable source of water supply with low discharge, low capacity pumping systems (less than 3-5 hp) since they are most suitable on such wells, so as to build an automated regulatory mechanism of abstraction, which is in agreement with the hydrogeological properties of the groundwater system.
Discourage bore well drilling for irrigation considering long-term problems of
overexploitation from hard rocks aquifers in particular. Encourage advanced irrigation techniques like Drip or Sprinkler systems and push them into less water intensive crops like Cereals (Ragi, Maize, and Bazra etc.,) or vegetables and other flowering plants against high water intensive crops like sugarcane and paddy. Encourage the community into “water sharing mechanism” since this is the better way in long term water management even during the times of drought.
Optimization of water use is possible only through a conjunctive use of groundwater
and surface water from a closed system. The distribution for this needs to be carefully worked out, based on the principles of local institutions that integrate water balances and community participation.
In order to ensure efficient working of recharge and discharge components, it would be
necessary to maintain both these mechanisms through the activities such as regular, periodic de-silting of all structures, progressive increase in vegetative cover, especially along the slopes, well maintenance, continued and improved monitoring of groundwater resources etc.
Communities need to be better informed in order to mitigate negative impacts and also
asses how much of recharged water will actually be available for use during a season; for what purposes; and how can this be harnessed keeping in mind the objectives of a project like watershed development?


![[Hydro]geological analysis using open source app: case Cikapundung River](https://img.pdfslide.us/doc/110x75/55baf9c3bb61eb2c508b46c6/hydrogeological-analysis-using-open-source-app-case-cikapundung-river.jpg)