Embed Size (px)
Citation preview
HYDRAULICS BRANCH OFFICIAL FILE COPY
UNITED STATES DEPARTMENT OF THE INTERIOK BUREAU OF RECLAMATION
ENGINEERING AND RESEARCH CENTER Building 67, Denver Federal Center
Denver, Colorado 80225 November 7, 1972
Memorandum
To: Chief, Hydraulics Branch
From: U. J. Palde
Subject: Hydraulic laboratory investigation of an 8-inch Dall flow tube
PURPOSE
A hydraulic laboratory investigation was performed on an 8-inch Dall flow tube (manufactured by BIF Industries) to obtain the discharge calibration and to determine the head loss coefficient of the tube.
INTRODUCTION
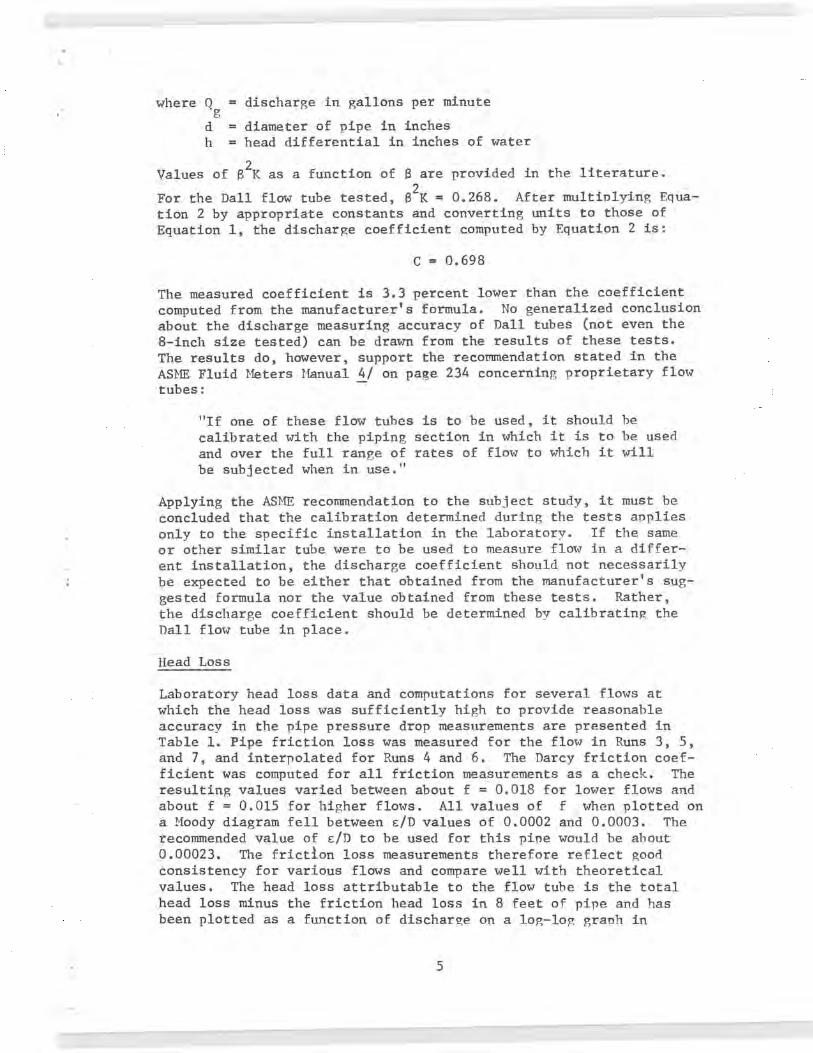
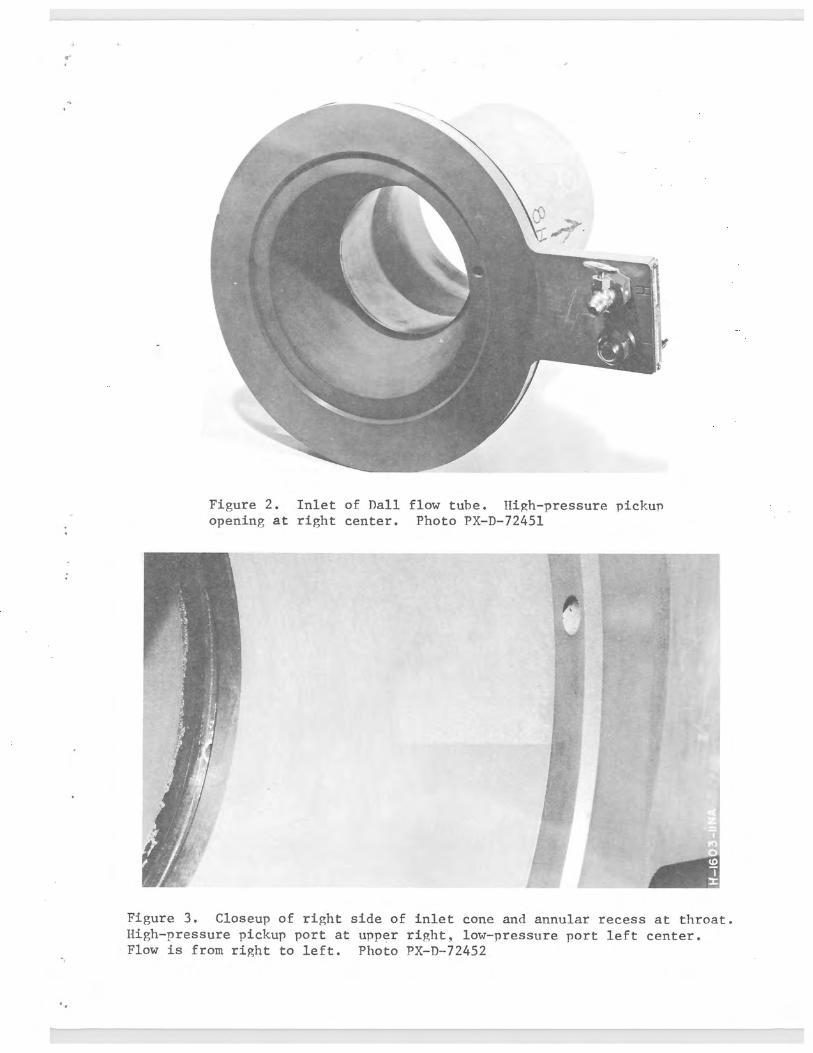
The Dall flow tube (see Figure 1) is a differential pressure type flow-meter. It produces a higher pressure differential than a Venturi tube having the same value of R (throat diameter to pipe diameter ratio). The higher differential is obtained by measuring a stagnation pressure as the high pressure and an artificially reduced low pressure in the throat. The upstream stagnation pressure is produced by an abrupt decrease in diameter which creates a flat annular surface protruding into the flow (see Figure 2). An opening for pressure pickup is located on the annular surface. The low pressure in the throat is produced by a narrow annular recess. The resulting lower pressure is sensed through an opening in the recess (see Figure 3). Information on the flow related properties of the Dall flow tube is available in engineering literature.1/ 2/ 3/
i~ The Dall tube tested was of the type that is inserted inside the pipe. The tube had a fiberglass reinforced polyester plastic body with a circular flange at the upstream face cast as part of the body. The throat recess was bronze. The tube is held in place in a pine by inser-ting the tube flange between two adjacent pine flanges, and clamping the assembly with the pipe flange bolts.
CONCLUSIONS
1. The obtain accurate discharge measurements with a Dall tube of the insert type, the tube should be calibrated in place over the full range of flow to be measured.
2. The head loss resulting from flow through an 8-inch Dall tube of the insert type with a throat diameter of 4.80 inches is equal to about 0.54 of the velocity head of the flow in the 8-inch pipe in which it is used. The loss coefficient corresponds to about 3.6 per-cent of the pressure differential produced by the tube, agreeing with the value given in the manufacturer's literature.
APPLICATIONS
The head loss data for an 8-inch Dall flow tube of the insert type with a throat diameter of 4.80 inches given in this report can be used as a good estimate for predicting the losses in a typical installation. Because of excellent agreement between the test results and manufacturer's (BIF Industries) head loss data for the particular tube, the manufacturer's head loss curve can also be expected to provide good estimates for other tube sizes and S ratios.
LABORATORY INSTALLATION
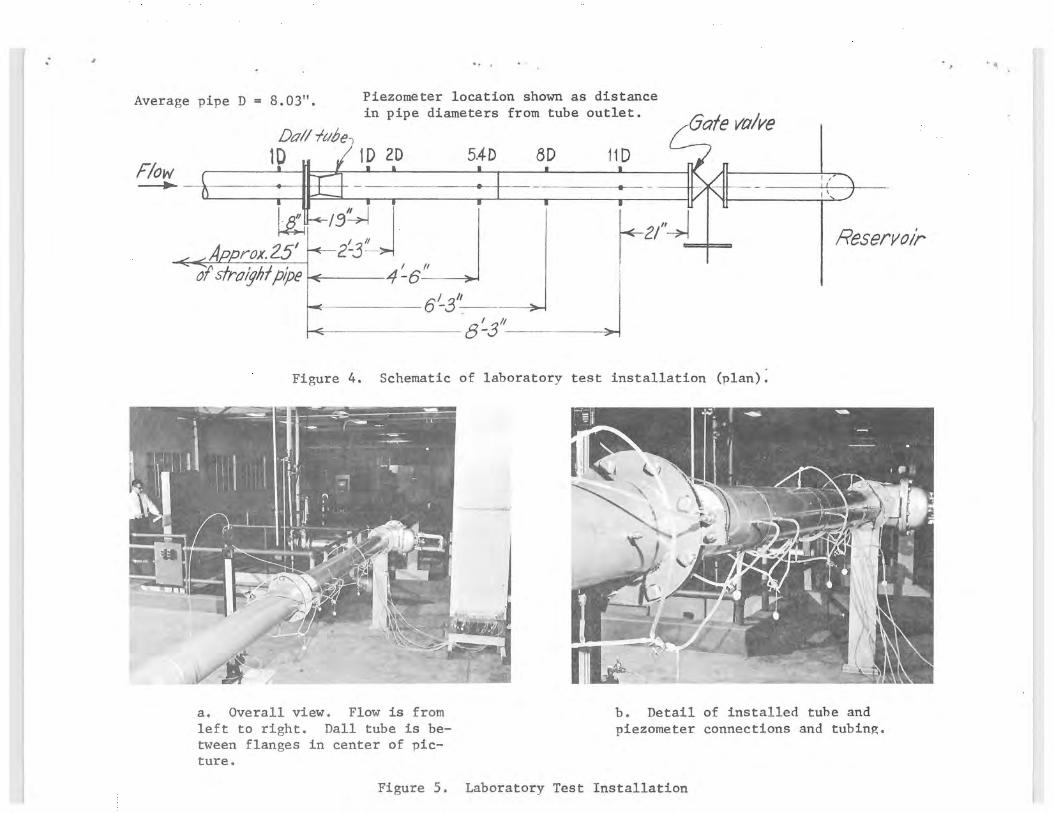
The Dall flow tube was installed in an 8-inch steel pipe in the laboratory (see Figures 4 and 5), The installation was equipped to measure the discharge in the pipe, the pressure differential produced by the tube, and the head loss resulting from the flow through the tube.
Water was supplied through the laboratory's permanent recirculating system. The flow was measured with permanently installed volu-metrically calibrated Venturi meters. Two different meters with an overlapping range were used during the Dall tube calibration. Differential head across the Venturi meters was measured with a pot-type mercury manometer. This system is generally considered to be capable of measuring the discharge with an error of less than 1 percent. The maximum discharge measured in the tests was about 4 cfs.
Differential pressure produced by the flow tube was determined from the difference in the water column height of two open manometers for up to about 10 feet differential. For higher differentials a pot-type mercury differential manometer was used. The maximum differential head measured was about 30 feet of water. Shutoff_ valves were provided in the differential pressure lines at the flow tube flange.
Piezometers were located in the pipe 8 inches upstream and at several locations downstream of the flow tube for determination of pressure drop in the pipe. At most locations four piezometers were installed (90° apart from each other) and were connected by a 1/4-inside-diameter tube manifold to provide an average pressure reading for each section.
2
About 25 feet of straight 8-inch nominal diameter pipe existed upstream of the flow tube and about 13 feet downstream, where a gate valve was located to control the pressure in the pipe. The length of straight pipe upstream (38 pipe diameters) was about five times the minimum recommended by the manufacturer to obtain meter readings within an error of less than one-half, of one percent.
LABORATORY PROCEDURF
The installation initially was checked for straight alinement of the pipe, leaks in pipe joints and piezometer connections, and con-sistency in head measurements from piezometers in one set.
Discharge calibration data were obtained for discharges between about 0.5 cfs and 4.1 cfs. For each discharge calibration point, a steady-state discharge of approximately the desired magnitude was set with the controls on the laboratory control panel. The down-stream gate valve was then adjusted to produce a flow tube throat pressure just above atmospheric. Pressure differential readings were taken after simulaneously closing the shutoff valves at the flow tube flange in the pressure lines leading to the manometers. Five readings were taken for each discharge and averaged for use in later computations and analyses. Discharge readings on the control panel were taken before and after the flow tube differential readings and the average used in computations. If more than 0.5 percent change in discharge had occurred during the run, the run was repeated.
Several combinations of discharge calibration measuring equipment were used during the tests. Depending on the magnitude of discharge, either a 6-inch or 8-inch Venturi meter was used for measurement. The flow tube was calibrated at two angular orientations in the pipe, 180 degrees apart. The two orientations are identified as pressure tap outlet flange on the right (see Figure 5) or on the left. Cali-bration data were obtained at sufficient overlap ranges for the different conditions to check any possible deviation in the calibra-tion caused by a particular condition.
Head loss resulting from the Dall flow tube was determined at several discharges. Pressure drop in the pipe was measured between. locations 1 diameter upstream of the flow tube and 11 diameters down-stream. Readings were also taken from all piezometers in between as a check. The flow tube was then removed and pressure drop measurements were taken for the same discharges to determine head loss due to friction in the 8.92-foot length of pipe.
3
RESULTS
Discharge Calibration
Discharge Coefficients were computed from calibration data obtained for a total of 32 runs. The discharge coefficient was computed from
C.Q ✓ l R
(1) a 2~
where Q = discharge in cubic feet per second a = throat area in square feet g = acceleration due to gravity, 32.16 ft/sect H = differential head produced by flow tube, feet s = 0.598
The average computed discharge coefficient for all runs was 0.677. The average coefficient for 25 runs with Reynolds number greater than 300,000 (the approximate value indicated in literature above which C is constant) was 0.678. Slightly different coefficients resulted from data taken with the two different angular orienta-tions of the flow tube in the pipe.
The most probable value of the discharge coefficient should be obtained using the results of measurements taken only with water manometers at Reynolds numbers greater than 300,000. For eight runs with the pressure connection flange on the right, the average coef-ficient was 0.680, while the average for four runs with the flange on the left was 0.670. The most probable value of the coefficient would be the average of these two values, or
C = 0.675.
The difference in the discharge coefficients for the flow tube at the two orientations could be partly due to swirling or unsymmetrical approach flow (no flow straighteners were used) or possibly different alinement of the tube flange in relation to the pipe axis. Reasonable precautions were taken to center the tube during installation, but it is possible that even a slight asymmetry could have caused signifi-cant variation of pressure at the pressure sensing ports. Most of the references point out that the Dall flow tube is more sensitive to upstream .flow conditions than the Venturi tube.
The manufacturer's literature gives the following discharge relationship for calculations with cold water flow:
ex 0.1764Q9
s = d2 Y'h— (2)
Cpl
where Q. = discharge in gallons per minute
d = diameter of pipe in inches h = head differential in inches of water
Values of S 2 K as a function of a are provided in the literature.
For the Dall flow tube tested, a 2 K = 0.268. After multiplying Equa-tion 2 by appropriate constants and converting units to those of Equation 1, the discharge coefficient computed by Equation 2 is:
C = 0.698
The measured coefficient is 3.3 percent lower than the coefficient computed from the manufacturer's formula. No generalized conclusion about the discharge measuring accuracy of Dall tubes (not even the 8-inch size tested) can be drawn from the results of these tests. The results do, however, support the recommendation stated in the ASME Fluid Meters Manual 4/ on page 234 concerning proprietary flow tubes:
"If one of these flow tubes is to be used, it should be calibrated with the piping section in which it is to be used and over the full range of rates of flow to which it will be subjected when in use."
Applying the ASME recommendation to the subject study, it must be concluded that the calibration determined during the tests applies only to the specific installation in the laboratory. If the same or other similar tube were to be used to measure flow in a differ-ent installation, the discharge coefficient should not necessarily be expected to be either that obtained from the manufacturer's sug-gested formula nor the value obtained from these tests. Rather, the discharge coefficient should be determined by calibrating the Dall flow tube in place.
Head Loss
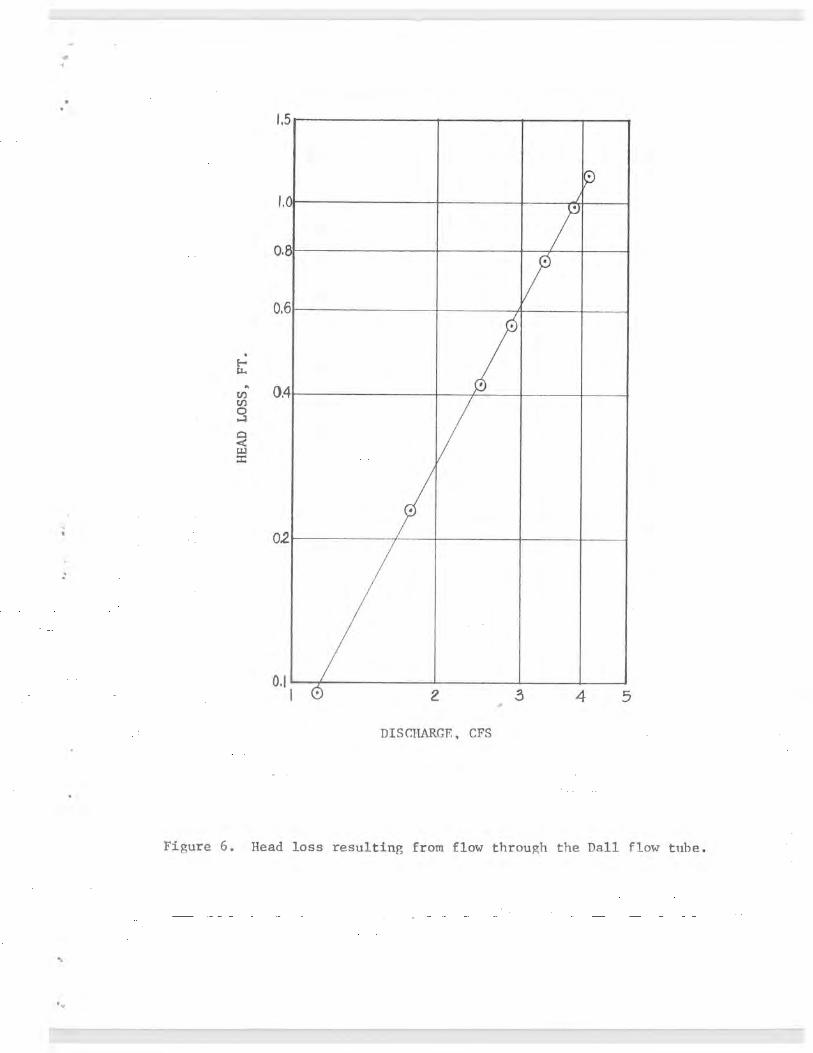
Laboratory head loss data and computations for several flows at which the head loss was sufficiently high to provide reasonable accuracy in the pipe pressure drop measurements are presented in Table 1. Pipe friction loss was measured for the flow in Runs 3, 5, and 7, and interpolated for Runs 4 and 6. The Darcy friction coef-ficient was computed for all friction measurements as a check. The resulting values varied between about f = 0.018 for lower flows and about f = 0.015 for higher flows. All values of f when plotted on a ?Moody diagram fell between e/D values of 0.0002 and 0.0003. The recommended value of c/D to be used for this pipe would be about 0.00023. The friction loss measurements therefore reflect good consistency for various flows and compare well with theoretical values. The head loss attributable to the flow tube is the total head loss minus the friction head loss in 8 feet of pipe and has been plotted as a function of discharge on a log-log graph in
R
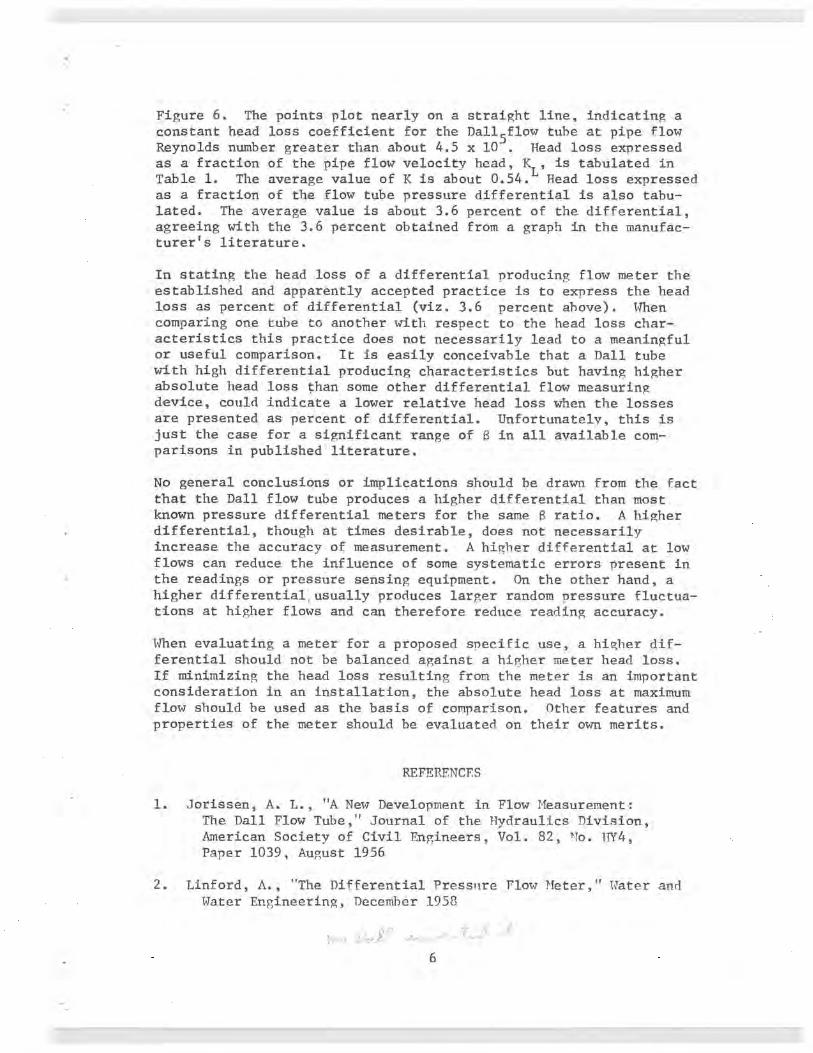
Figure 6. The points plot nearly on a straight line, indicating a constant head loss coefficient for the Dall 5flow tube at pipe flow Reynolds number greater than about 4.5 x 10 . Head loss expressed as a fraction of the pipe flow velocity head, KL, is tabulated in Table 1. The average value of K is about 0.54. Head loss expressed as a fraction of the flow tube pressure differential is also tabu-lated. The average value is about 3.6 percent of the differential, agreeing with the 3.6 percent obtained from a graph in the manufac-turer's literature.
In stating the head loss of a differential producing flow meter the established and apparently accepted practice is to express the head loss as percent of. differential (viz. 3.6 percent above). When comparing one tube to another with respect to the head loss char-acteristics this practice does not necessarily lead to a meaningful or useful comparison. It is easily conceivable that a Dall tube with high differential producing characteristics but having higher absolute head loss than some other differential flow measuring device, could indicate a lower relative head loss when the losses are presented as percent of differential. Unfortunately, this is just the case for a significant range of S in all available com-parisons in published literature.
No general conclusions or implications should be drawn from the fact that the Dall flow tube produces a higher differential than most known pressure differential meters for the same S ratio. A higher differential, though at times desirable, does not necessarily increase the accuracy of measurement. A higher differential at low flows can reduce the influence of some systematic errors present in the readings or pressure sensing equipment. On the other hand, a higher differential usually produces larger random pressure fluctua-tions at higher flows and can therefore reduce reading accuracy.
When evaluating a meter for a proposed specific use, a higher dif-ferential should not be balanced against a higher meter head loss. If minimizing the head loss resulting from the meter is an important consideration in an installation, the absolute head loss at maximum flow should be used as the basis of comparison. Other features and properties of the meter should be evaluated on their own merits.
REFERENCES
1. Jorissen, A. L., "A New Development in Flow Measurement: The Dall Flow Tube," Journal of the Hydraulics Division, American Society of Civil Engineers, Vol. 82, No. HY4, Paper 1039, August 1956
2. Linf_ord, A., "The Differential Pressure Flow Meter," Water and Water Engineering, December 1958
M
3. diner, L. 0., "The Dall Flow Tube," Transactions of the American Society of I-techanical Engineers, Paper No. 54-A-139, 1954
4. Fluid '.deters: Their Theory and Application, 6th Edition, American Society of :Mechanical Engineers, 1971
Copy to: 1500 1530 (PAP File) 1531 1532 1532 (W.M. File) 1532 (Palde (8) 220 (2) 250 (2) 430 (2)
0
7
ons are approxi- scaled from in laboratory.
Alt
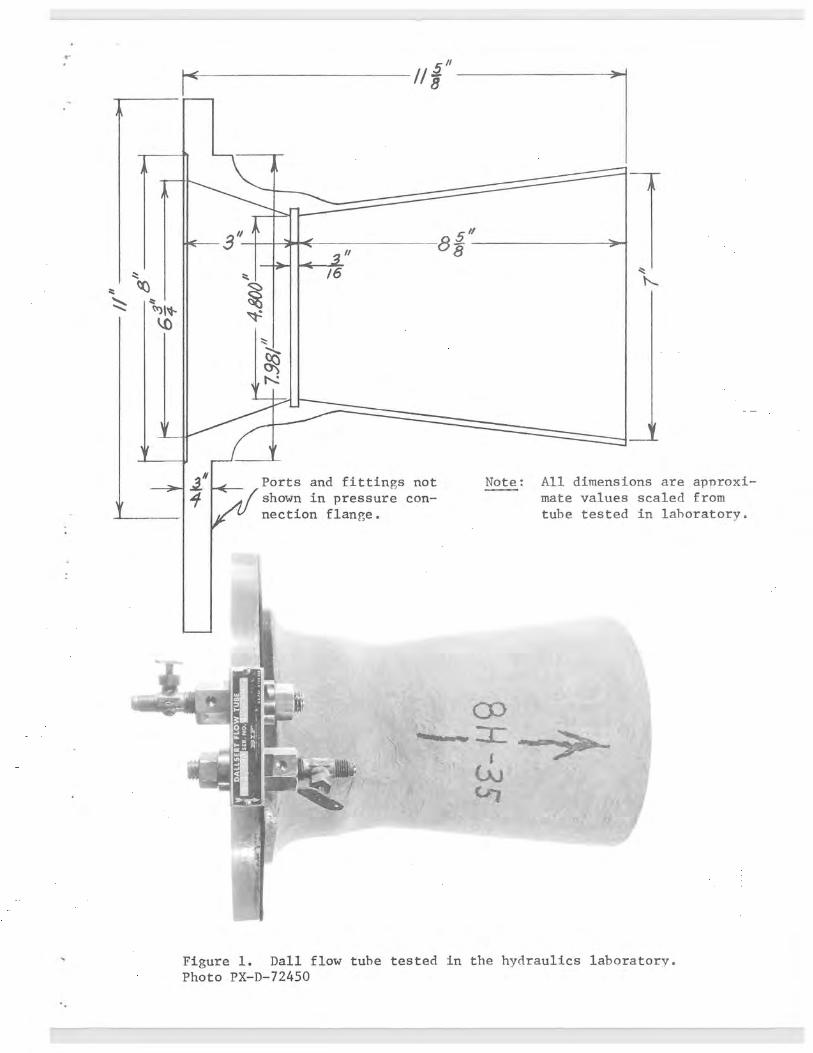
Figure Figure 1. Dall flow tube tested in the hydraulics laboratory. Photo PX-D-72450
01
Figure 2. Inlet of Dall flow tube. High-pressure pickup opening at right center. Photo PX-D-72451
Figure 3. Closeup of right side of inlet cone and annular recess at throat. High-pressure pickup port at upper right, low-pressure port left center. Flow is from right to left. Photo PX-D-72452
Average pipe D = 5.03". Piezometer location shown as distance in pipe diameters from tube outlet.
D~ii f~~be Gafe ✓a/ve
Flow 1Q 1D ZD 5.4D 8D 11D
~~ 2~ ~ Reser✓oi~ A rox. 25' 2 3 ---
af sfraiyhf pipe .¢ =6--~
— 6-3 ----
Figure 4. Schematic of laboratory test installation (plan).
M -
b. Detail of installed tube and piezometer connections and tubing.
a. Overall view. Flow is from left to right. Dall tube is be-tween flanges in center of pic-ture.
Figure 5. Laboratory Test Installation
M
NI O
Q
Id
,2
1,5
B
2 3 -4 5
DISCHARGE, CFS
Figure 6. Head loss resulting from flow through the Dall flow tube.
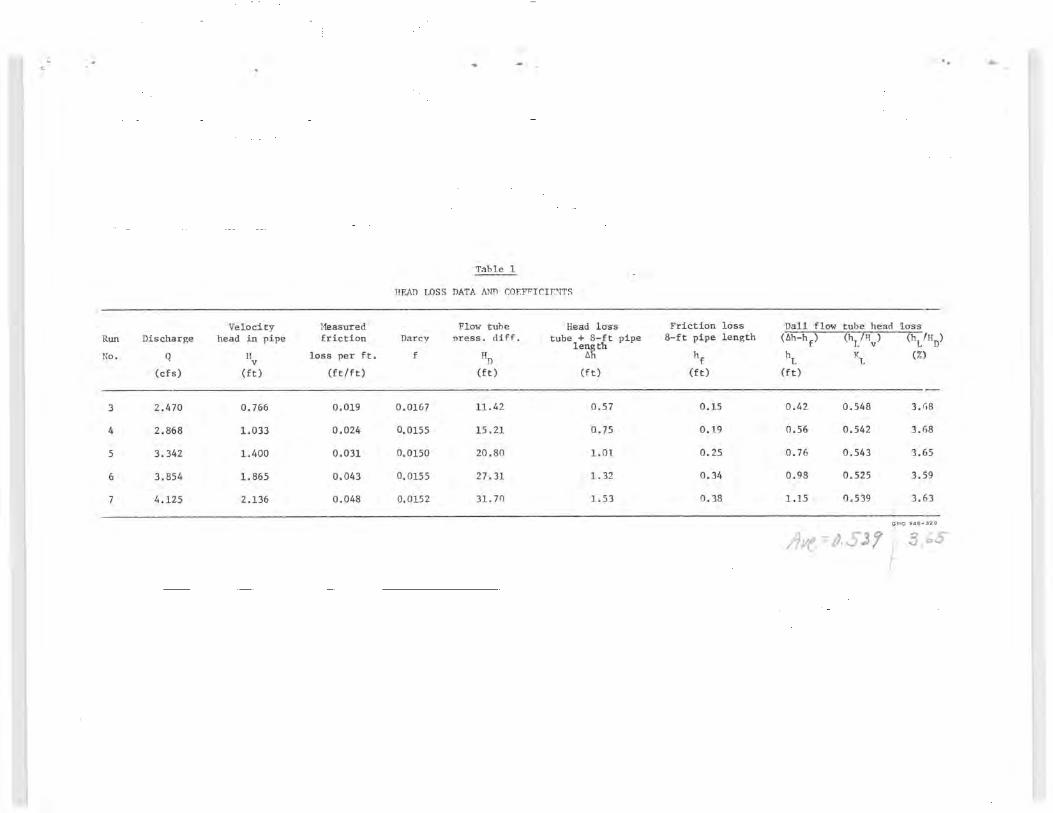
Table 1
HEAD LOSS DATA AND COFFFICIMITS
Velocity Pleasured Flow tube Head loss Friction loss Dall flow tube head loss Run Discharge head in pipe friction Darcv nress. diff. tube + 8-ft pipe 8-ft pipe length (Ah-hf) (hl /TIV) III
'o.lenggth
No. Q Hv
loss per ft. f HD Ah h h
KL M (cfs) (ft) (ft/ft) (ft) (ft) (ft) (ft)
3 2.470 0.766 0.019 0.0167 11.42 0.57 0.15 0.42 0.548 3.68
4 2.868 1.033 0.024 0.0155 15.21 0.75 0.19 0.56 0.542 3.68
5 3.342 1.400 0.031 0.0150 20.80 1.01 0.25 0.76 0.543 3.65
6 3.854 1.865 0.043 0.0155 27.31 1.32 0.34 0.98 0.525 3.59
7 4.125 2.136 0.048 0.0152 31.70 1.53 0.38 1.15 0.539 3.63
Po GPO
hy 045-329