Embed Size (px)
Citation preview
© The Author 2012. Published by Oxford University Press. All rights reserved. For Permissions, please email: [email protected]
Tree Physiology 00, 1–12doi:10.1093/treephys/tps114
Hydraulic time constants for transpiration of loblolly pine at a free-air carbon dioxide enrichment site
Eric J. Ward1,2,5, David M. Bell1,2, James S. Clark1,3 and Ram Oren1,4
1Nicholas School of the Environment, Duke University, Durham, NC 27708, USA; 2University Program in Ecology, Duke University, Durham, NC, USA; 3Department of Statistics, Duke University, Durham, NC, USA; 4Department of Forest Ecology & Management, Swedish University of Agricultural Sciences (SLU), SE-901 83 Umeå, Sweden; 5Corresponding author ([email protected])
Received March 30, 2012; accepted October 12, 2012; handling Editor Frederick Meinzer
The impact of stored water on estimates of transpiration from scaled sap flux measurements was assessed in mature Pinus taeda (L.) at the Duke Free-Air CO2 Enrichment (FACE) site. We used a simple hydraulic model with measurements of sap flux (J) at breast height and the base of the live crown for 26 trees over 6 months to examine the effects of elevated CO2 (eCO2) and fertilization (NF) treatments, as well as temporal variation in soil moisture (M(t)), on estimates of the hydraulic time con-stant (κ). At low M(t), there was little (<12%) difference in κ of different treatments. At high M(t), differences were much greater, with κ reductions of 27, 52 and 34% in eCO2, NF and eCO2 × NF respective to the control. Incorporating κ with these effects into the analysis of a larger data set of previous J measurements at this site (1998–2008) improved agreement between modeled and measured values in 92% of cases. However, a simplified calibration of κ that neglected treatment and soil mois-ture effects performed more dependably, improving agreement in 98% of cases. Incorporating κ had the effect of increasing estimates of reference stomatal conductance at 1 kPa vapor pressure deficit (VPD) and saturating photosynthetic active radiation (PAR) an average of 12–14%, while increasing estimated sensitivities to VPD and PAR. A computationally efficient hydraulic model, such as the one presented here, incorporated into a hierarchical model of stomatal conductance presents a novel approach to including hydraulic time constants in estimates of stomatal responses from long-term sap flux data sets.
Keywords: capacitance, elevated CO2, fertilization, free-air CO2 enrichment, Granier sensors, hierarchical Bayes, hydraulic resistance, Pinus taeda, RC models, sap flux, soil moisture, stored water use, tree hydraulics.
Introduction
The use of sap flux sensors to estimate the water flow in mature trees has been common for over two decades (Swanson 1972, Swanson and Whitfield 1981, Granier 1987, Smith and Allen 1996, Loustau et al. 1998, Wullschleger et al. 1998, Oren et al. 1999, Lu et al. 2004). The process of interest in many such studies is the regulation of transpiration at the leaf surface by variation of stomatal aperture. At long time scales—days to weeks—the amount of water flowing through the stem at breast height, where sap flux is often measured on mature trees, is in steady state with the amount of water transpired, and can be used to estimate a daily representation of stomatal conductance
(Phillips and Oren 1998). However, sap flux at breast height often differs from transpiration rate at time scales relevant to stomatal regulation—minutes to hours—due to the withdrawal and recharge of water stored in stems, branches and leaves above the height of measurement (Landsberg et al. 1976). It is clear that the dynamics of stored water usage can affect sap flux scaled estimates of stomatal conductance, e.g., leading to under-estimations in the morning and over-estimations in the after-noon, creating an apparent hysteresis between stomatal conductance and environmental drivers (Phillips et al. 1997). The magnitude of this apparent hysteresis is itself dependent on underlying hydraulic characteristics of the plant, which may vary
Research paper
tps114.indd 1 11/27/2012 6:46:18 PM
Tree Physiology Advance Access published November 27, 2012 at D
uke University on D
ecember 4, 2012
http://treephys.oxfordjournals.org/D
ownloaded from
Tree Physiology Volume 00, 2012
by soil moisture and growth conditions (Ewers et al. 2000, Sperry et al. 2002). In this study, we present a method of accounting for this effect of stored water by coupling a hierarchi-cal model of stomatal conductance to a simple representation of tree hydraulics using data from the Duke Free-Air Carbon diox-ide Enrichment (FACE, see Table 1 for all abbreviations and symbols) site, and including interacting effects of soil moisture, elevated atmospheric CO2 (eCO2) and nitrogen fertilization (NF). We use a data set of sap flux at two stem heights to estimate the magnitude of these effects for this site. We end with an evalua-tion of how to best incorporate hydraulic effects in the analysis of stomatal conductance using a larger, longer-term sap flux data study at the same site. While the treatments themselves are not the focus of this study, they do provide a context in which long-term data sets that are internally consistent and compara-ble to other studies are essential to understand the impacts of global change and management practices on forests.
In studies using sap flux measurements to investigate the responses of stomatal conductance to environmental drivers over multiple months or years, corrections for stored water remain rare (but see Zweifel et al. 2007). Uncertainty in how to employ existing models with data from long-term studies may be one reason for their lack of application. One approach is to use a hydraulic model to translate data from a network of sap flux sensors to a time series of canopy-averaged stomatal con-ductance (GS) that is then analyzed for GS responses to envi-ronmental drivers (a ‘bottom-up’ approach). As hydraulic effects are expected to dampen the transpiration signal in sap flux data, applying the hydraulic model to data from each sen-sor would have the tendency of amplifying noise in the data, regardless of the hydraulic model selected. Using the mean flow from all sensors may lessen the effect of this noise, but requires a method for filling gaps in data, which introduces a source of error that is difficult to quantify. Regressions against working sensors or environmental drivers may predict well the integrated value of missing data (e.g., daily sums of transpira-tion), but the diurnal pattern of imputed data will be deter-mined by the pattern of the predicting variable.
Another approach is to use a hierarchical modeling frame-work to iteratively fit parameters of one of many stomatal con-ductance models (Jarvis 1976, Leuning 1990, Collatz et al. 1991) to generate a time series of transpiration, then employ a hydraulic model to predict mean sap flux at breast height, eval-uating the likelihood of available data at each iteration (Ward et al. 2008). Such a ‘top-down’ approach works from the can-opy to breast height, finding the time series of transpiration that best predicts basal sap flux data, given the hydraulic model selected. The conductance parameters resulting in pre-dictions best matching the measured sap flux are selected as the most reasonable representation of stomatal behavior. Individual sensor data can be interpreted using techniques such as Gibbs sampling (Gelfand and Smith 1990) in a
hierarchical Bayes state-space approach to accommodate missing values and compute the resulting uncertainty in stoma-tal conductance and parameter estimates (Clark et al. 2011). This requires the hydraulic model to be applied repeatedly, often in 105 or more iterations, making computational efficiency of implementation a primary concern.
The simplest methods for correcting sap flux for the effects of water storage involve correlations between sap flux and environmental drivers (Martin et al. 2001, Pataki and Oren 2003, Ford et al. 2005, Ambrose et al. 2010) at different time lags to assess whether stored water usage is relevant at the time scale studied. Even studies that measure sap flux at differ-ent heights within trees sometimes assess the effects of stored water in terms of lags in the diurnal pattern of peak sap flux rates or in the onset of measurable sap flux at different sensor heights (Chapotin et al. 2006). These approaches limit the modeled effect of stored water to discrete lags at multiples of the data collection interval. Furthermore, these methods are not consistent with the cohesion–tension theory of water flow in plants, which would require that transpirational fluxes lead to immediate flux of water in the stem (Burgess and Dawson 2007). Thus, the effect of stored water leading to differences between transpiration of the canopy and sap flux near the stem base is better represented as a dampening of the changes in flux over the entire diurnal cycle (Phillips et al. 2008).
There is a long history of representing the flow of water within plants as series of electrical resistances (R) and capaci-tances (C) (van den Honert 1948, Landsberg et al. 1976, Hunt and Nobel 1987, Phillips et al. 1997) to assess hydraulic time constants in different parts of plants. Depending on the struc-ture of an electrical analog, the interpretation of such time con-stants may vary, but it is generally taken as the product of C and the sum of resistances for axial flow and discharge from storage from each compartment (Phillips et al. 1997). While the estimated values of R and C show considerable variation within a plant and with water potential of each organ (Tyree and Sperry 1988, James et al. 2003), the dynamics between transpiration and sap flux at measurement height inferred with such a model using fixed time constants for whole trees or stands are more consistent with the cohesion–tension theory than are the absolute lags mentioned above (Phillips et al. 2008). Although each component R and C value cannot be determined from time constants without information regarding the other components (Phillips et al. 2004), in the evaluation of stomatal conductance using sap flux data, it is the time con-stant with which we are primarily concerned.
To calibrate time constants for entire trees, one needs an estimate of transpiration independent of sap flux measure-ments. Estimates based on environmental drivers of transpira-tion (e.g., Phillips et al. 1997) are sensitive to assumptions about stomatal responses to those same drivers, hence cannot be used when such stomatal responses are themselves the
2 Ward et al.
tps114.indd 2 11/27/2012 6:46:18 PM
at Duke U
niversity on Decem
ber 4, 2012http://treephys.oxfordjournals.org/
Dow
nloaded from
Tree Physiology Online at http://www.treephys.oxfordjournals.org
object of study. Eddy covariance techniques do not isolate the transpiration of different species from soil evaporation and have measurement footprints that are often not amenable to the area of study, with uncertainties due to large temporal (Phillips et al. 1997) and spatial (Oren et al. 2006) variability even in even-aged plantations. Interventions such as whole-tree misting (Daley et al. 2008), which produce time series of transpiration that are analytically tractable to solutions of trans-fer functions (Phillips et al. 2004), have been successfully employed to calibrate such time constants, but in large trees it is difficult and expensive to completely saturate the canopy and stop transpiration, as required by this method.
In the absence of an independent estimate of transpiration, studies may use differences in flow between two points, such as the base of the stem and branches. Studies that assess the differences in flux rates between the stem and branches using electrical circuit analogs have been criticized for inadequate characterization of the effect of light variation on transpiration rates in different portions of the crown (Burgess and Dawson 2007). Nevertheless, such studies represent one of the few methods to estimate an integrated time constant for the aboveground woody portions of the flow path, where there is adequate replication and the general exposure of branches is taken into consideration (Ewers et al. 2007, Phillips et al. 2008). Even if the resolution of dynamics between branch and basal sap flux remains a problem too complex for many studies at the stand scale, the dynamics between fluxes within the stem at breast height and the base of the crown can be con-strained by the conservation of mass with the assumption of negligible net change in plant water content between consecu-tive nights (Goldstein et al. 1998, Loustau et al. 1998). Yet this type of measurement is not commonly considered in studies estimating canopy transpiration from basal sap flux measure-ments. This is not to say that parameterizations of whole-stem hydraulics are easy to make, even when sap flux measure-ments at different heights are available. In the field, hydraulic parameters can vary by season, especially under drought con-ditions (Phillips et al. 1997, Zweifel et al. 2007). In long-term studies, one should therefore consider changes in parameters over the course of a growing season, possibly linked to soil moisture.
In this study, we assessed the impact of stored water within the main stems of mature trees on estimates of GS from scaled sap flux measurements. We employed a hydraulic model char-acterized by a single time constant (κ), which was simple enough to use in the hierarchical modeling of stomatal conduc-tance (Ward et al. 2012) while providing a continuous range of possible values for κ (versus the discrete possibilities provided by lagging time series). Our primary objective was to calibrate this model for the analysis of basal sap flux from the Duke FACE site. We calibrated the model using sap flux measure-ments at breast height and the base of the live crown on a
subset of trees over a period of ~6 months, both with and without effects on κ of soil moisture, eCO2 and NF. We then investigated the extrapolation of these two calibrations in the analysis of GS from half-hourly basal sap flux of the preceding 11 years of study at this site.
Materials and methods
Study site and data collection
This study used measurements from loblolly pine (Pinus taeda L.) trees at the Duke FACE site (35°58′41.430″ N, 79°05′39.087″ W, 163 m AMSL). Treatments included eCO2 (200 ppm above ambient) using FACE technology on 30-m diameter plots (Hendrey et al. 1999), as well as NF (11.2 g of N m−2 year−1) in split plots of the eCO2 treatment. The eCO2 treatment was established in 1994 in a prototype plot with an un-instrumented paired control plot and in 1996 in three addi-tional plots, each with a fully instrumented paired control. The fertilization began in 1998 in the prototype and its control and was expanded in 2005 to the other plots. Further details of the site can be found at http://face.env.duke.edu.
The data used for hydraulic model calibration were collected from 19 June to 28 December 2009. Seven trees in each of the four treatments (AC: ambient CO2 unfertilized, EC: eCO2 unfertilized, AF: ambient CO2 fertilized, EF: eCO2 fertilized) were equipped with thermal dissipation (TDP) sap flux probe sets (Granier 1987) at breast height (1.4 m) and 10–30 cm below the base of the live crown at 0–20 mm sapwood depth (see Supplementary Material available as Supplementary Data at Tree Physiology Online for number of observations and tree dimensions). The data used for evaluation of impacts on the stomatal conductance model were collected during the years 1998–2008 for unfertilized treatments and 2005–08 for fer-tilized treatments, with different numbers of TDP sets by year, treatment and sapwood depth (see Supplementary Material available as Supplementary Data at Tree Physiology Online for details). Data were logged at 30 s intervals and half-hourly averages were recorded using a data logger in each plot (CR-23x, Campbell Science, Logan, UT, USA). Differential volt-age data from TDPs were converted to sap flux density values using zero-flow values established on nights with little to no potential transpiration (Oishi et al. 2008) using the original calibration of Granier (1987). Environmental covariates measured at the site included air temperature and VPD at 2/3 canopy height in each plot (HMP series, Campbell Science), the incident photosynthetic photon flux density (μmol m−2 ground s−1) at the top of the canopy (LI-190, Li-Cor Biosciences, Lincoln, NE, USA) and volumetric soil moisture content from 0 to 30 cm depths (M, cm3 cm−3 soil) measured at four points in each of the eight plots (CS615 and CS616L, Campbell Science). Over the course of the calibration period, soil moisture in this layer varied from 0.13 to 0.52, very near
Hydraulic time constants for transpiration of loblolly pine 3
tps114.indd 3 11/27/2012 6:46:18 PM
at Duke U
niversity on Decem
ber 4, 2012http://treephys.oxfordjournals.org/
Dow
nloaded from
Tree Physiology Volume 00, 2012
the long-term minimum and maximum observed over the previ-ous 11 years of study at this site.
Hydraulic model
Sap flux scalingSap flux sensors do not always correctly represent the mean flow at a given height, due to many factors (Oren et al. 1998), including spatial variability in sapwood conductivity (Tateishi et al. 2008). In estimating hydraulic time constants, we are not as much interested in the absolute flow at each sensor height, but the relative timing of that flow. However, in calculating daily stored water use of each tree, the total flow at each height is a necessary input. As we expect the amount of water transpired by a tree to greatly exceed the net change in water content of the stem over a given day, we assume that there is no change in water content of the stem between the sensors over each 24-h period (Meinzer et al. 2003). We first examined the varia-tion in estimated total flow of the measurement depths at the two heights to see if rescaling was necessary to match the flows estimated at each height in each individual. Once this rescaling was complete, we examined each tree to see if the estimated flows conformed to the assumption that flow at the upper boundary should exceed that at the lower boundary in the morning and vice versa in the afternoon.
As a comparison of the data at each height, we assessed if the total water flow in the outer 2 cm annulus represented by the sensors was the same at both heights. We examined differ-ence in upper and lower sap flow (flux rate times sapwood area) in this outer annulus at each height, normalized by the mean flow across both heights. Across trees, this difference was close to zero (mean: +5.6%, median: −1.3%), but it showed considerable variation among trees (standard devia-tion: 67%). Thus, while there is no evidence of a consistent difference in the amount of water moved by the outer annulus at the two heights, which would indicate a bias in sampling, there is clearly large variation among sensor pairs in individual trees.
As we detected no bias between heights, but observed large differences in flow, we rescaled upper sensors to the daily sum of the lower sensors. To determine sapwood area at each height, we estimated bark thickness (BT, cm) from stem diameter (SD, cm) using an equation employed in net primary productivity estimates by McCarthy et al. (2010):
BT 228SD14215= 0 0. . (1)
Sapwood area was then estimated as a circle with diameter SD − 2BT. Cross-sections of trunks from a site harvest in 2010 show negligible heartwood formation in all treatments. For each tree, we scaled the breast-height sap flux rate at time t (Jb(t), g m−2 min−1) to the total flux rate per sapwood area at breast height (Qb(t), g m−2 min−1), as
Q J
A A r ArA A At tb bO M M I I
O M I( ) ( )= + +
+ + (2)
where AO, AM and AI are the breast height sapwood areas of the tree at depths of 0–2, 2–4 and >4 cm from the cambium, respectively. The ratios of middle (rM) and inner (rI) sap flux to outer sap flux were determined for each treatment from the mean sap flux rates at these depths in the larger sap flux net-work at Duke FACE in 2008 (Ward et al. 2012). We then esti-mated the flux of water at the upper sensor height (Qu(t)) per unit sapwood area at breast height (as a common area basis for both heights) by rescaling the upper sensor sap flux rate (Ju(t)) to the sum of Qb(t) for each day of data (from t = 0400 to 0400 h the next day):
Q J
Q
Jt t
t
tt
t
u uu
b
( ) ( )( )
( )= ∑∑
(3)
We eliminated days with sensor outages in the upper or lower sensor of each tree (see Supplementary Material avail-able as Supplementary Data at Tree Physiology Online for the number of half-hourly time steps for each treatment).
4 Ward et al.
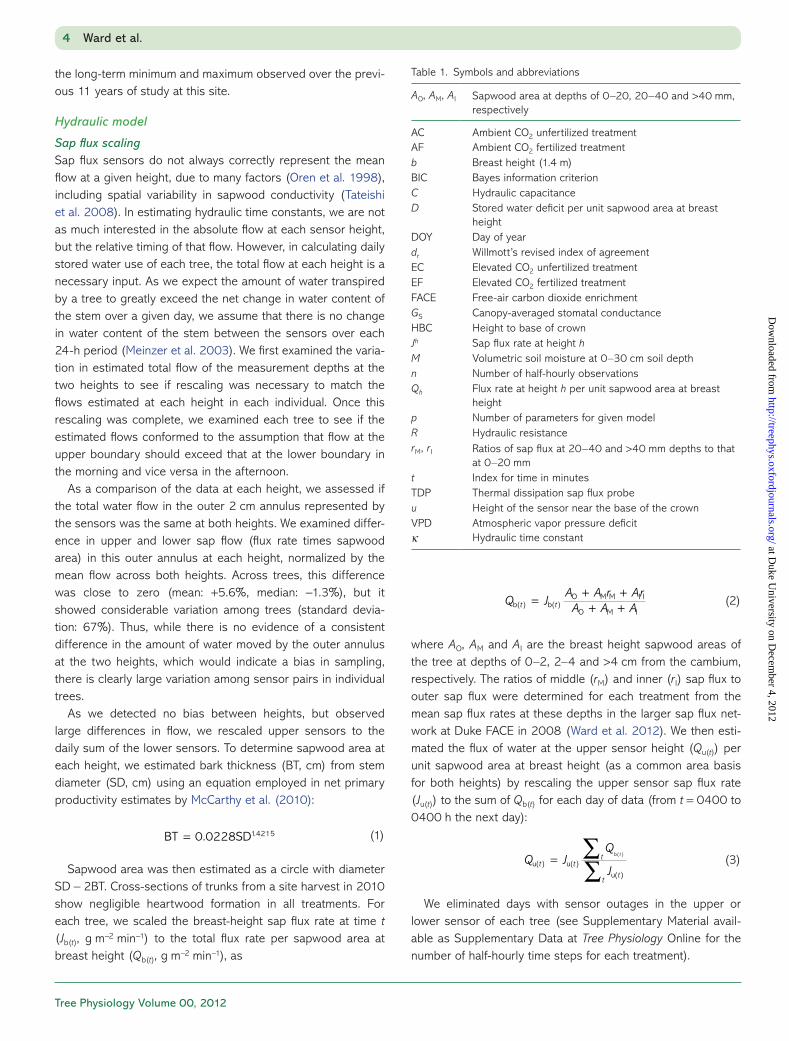
Table 1. Symbols and abbreviations
AO, AM, AI Sapwood area at depths of 0–20, 20–40 and >40 mm, respectively
AC Ambient CO2 unfertilized treatmentAF Ambient CO2 fertilized treatmentb Breast height (1.4 m)BIC Bayes information criterionC Hydraulic capacitanceD Stored water deficit per unit sapwood area at breast
heightDOY Day of yeardr Willmott’s revised index of agreementEC Elevated CO2 unfertilized treatmentEF Elevated CO2 fertilized treatmentFACE Free-air carbon dioxide enrichmentGS Canopy-averaged stomatal conductanceHBC Height to base of crownJh Sap flux rate at height hM Volumetric soil moisture at 0–30 cm soil depthn Number of half-hourly observationsQh Flux rate at height h per unit sapwood area at breast
heightp Number of parameters for given modelR Hydraulic resistancerM, r I Ratios of sap flux at 20–40 and >40 mm depths to that
at 0–20 mmt Index for time in minutesTDP Thermal dissipation sap flux probeu Height of the sensor near the base of the crownVPD Atmospheric vapor pressure deficitκ Hydraulic time constant
tps114.indd 4 11/27/2012 6:46:18 PM
at Duke U
niversity on Decem
ber 4, 2012http://treephys.oxfordjournals.org/
Dow
nloaded from
Tree Physiology Online at http://www.treephys.oxfordjournals.org
Before fitting the model, we also checked the temporal dynamics of the difference between upper and lower sensors for each tree. If the sensors represent the temporal pattern of mean flow well, we would expect the mean values of Qu(t) − Qb(t) to be positive in the morning and negative in the evening. We removed from the analysis 2 of the 28 trees, which did not have mean Qu(t) − Qb(t) > 0 from 0400 to 1000 h and mean Qu(t) − Qb(t) < 0 from 1400 to 2000 h, possibly due to azi-muthal variations in the diurnal pattern of sap flux at one or both of the measurement heights. While such variations were not found to be significant across trees in this stand over long measurement periods (Schäfer et al. 2002), they may be pres-ent in individual trees. We cannot say as to what extent azi-muthal variation in diurnal patterns affected other trees. Along with variation in sapwood conductivity within individuals (Tateishi et al. 2008), they are a possible source of variation between measurements not attributable to random sensor error.
Model developmentWe used a simple hydraulic model to estimate the time con-stant for water transport in the stem section between the two sensor heights. In doing so, we made some assumptions to limit the number of latent variables and unmeasured parame-ters required to estimate the effects of water storage. This allowed us to base our inference on entire diel cycles of mea-surements under field conditions, which are not always well represented by the idealized inputs underlying the application of transfer functions (Phillips et al. 2004). A detailed model description is given in the Supplementary Material available as Supplementary Data at Tree Physiology Online. The time con-stant (κ) translates the height gradient in flux to change in flux at the boundary b:
Q Qt
Q Qt t t t tb d b u b
d( ) ( ) ( ) ( )+ −
=−κ (4)
The time constant in our model (κ) is functionally equivalent to the time constant in studies employing electrical analog models in response to a step change in flow at the upper boundary. In this simple case, the electrical analog is a saturat-ing exponential function and κ is the time it takes to flow at the lower boundary to reach 63.2% of the final rate (Phillips et al. 2004). While the discretization in our study is coarser than most (dt = 30 min), as efficiency is required by the posterior simulation of the GS model (see below), values of κ have func-tional similarity to time constants from other studies and should be comparable in magnitude. It should be noted that, as the time constant κ approaches dt, the discretization (see Supplementary Material available as Supplementary Data at Tree Physiology Online) will cause differences in the response to rapid changes. At κ = dt, our data model is equivalent to a simple lag of dt, below this value of κ the data model would
become numerically unstable. Treatment effects (eCO2 and NF) were incorporated in the recharge time constant (κ), as was that of volumetric soil moisture (M(t)). We allowed for both posi-tive and negative effects of increasing soil moisture up to a limit of M(t) = 0.33, with the assumption that soil water content above this limit will be lost to drainage without affecting the predawn water potential of the trees. This limit was the value at −0.01 MPa soil water potential determined by the pressure plate method (Model 1000, Soil Moisture Equipment, Santa Barbara, CA, USA) on 0.5 mm sieved samples of the top 20 cm of soil. The models for inference on these effects were a nested family of linear models for κ with main effects for treatments as factors and M(t) (see Supplementary Material available as Supplementary Data at Tree Physiology Online). The minimal model contains only an intercept, and the maximum model contains all main effects, two-, and three-way interactions. Models were compared with the Bayesian information criterion (BIC; see Supplementary Material available as Supplementary Data at Tree Physiology Online for further detail).
Stomatal conductance model
Model descriptionTo assess the effect of the hydraulic model on the interpretation of transpiration and stomatal conductance estimated from basal sap flux data, we ran three versions of a stomatal conductance model for data from Duke FACE for the years 1998–2008: with-out a hydraulic model (null model), with a hydraulic model using estimates of κ based on the best fit model for the 2009 calibra-tion data (full model) and with a hydraulic model using estimates of κ based on the calibration data fit only with an intercept (mini-mal model). Full details of the conductance model and its appli-cation to these data are given in another study (Ward et al. 2012), so we will only briefly summarize them here.
Canopy-averaged stomatal conductance (GS) was modeled in a hierarchical Bayesian state-space framework (Clark 2007) with a process error on GS and observation error on sap flux density (J) measured at each sensor. This model used an esti-mate of the steady-state GS for each treatment based on a ref-erence conductance (GSRef) at 1 kPa vapor pressure deficit (VPD(t)), saturating photosynthetic active radiation (PAR(t)) and soil moisture (M(t)), multiplied by a series of functions for the effects of these three environmental drivers, similar to the approach of Jarvis (1976). As M exhibits little diurnal variation on most days, we neither expected nor observed notable effects of the hydraulic model on the response to this driver. The function for the response to VPD was
fVPD VPD= −1 λ ln( ) (5)
while the function for the response to PAR was
fPAR
PAR= − −
1 12
β βexp (6)
Hydraulic time constants for transpiration of loblolly pine 5
tps114.indd 5 11/27/2012 6:46:19 PM
at Duke U
niversity on Decem
ber 4, 2012http://treephys.oxfordjournals.org/
Dow
nloaded from
Tree Physiology Volume 00, 2012
The resulting steady-state estimate of GS was used to gener-ate a time series of dynamic GS with a stomatal response time constant (Rayment et al. 2000) of 20 min. This time series was then translated to transpiration using a conductance coef-ficient (Phillips and Oren 1998) based on air temperature and VPD and assuming negligible boundary layer resistance. In the absence of a hydraulic model, total sap flow equaled total tran-spiration at each half hourly time step, otherwise it was calcu-lated after Eq. (4) with transpiration per unit basal sapwood area serving as the upper flux estimate (Qu). Total sap flow for each time step was translated to an estimate at each sensor based on a random effects model and a measurement error.
A Gibbs sampling Markov Chain Monte Carlo algorithm (Gelfand and Smith 1990) was used to simulate posterior dis-tributions of all parameters. A complete description of this algorithm, including diagnostics and convergence analyses, is given in Bell (2011), with details of sampling methods and pri-ors for each parameter in Ward et al. (2012). To account for phenological changes in P. taeda (McCarthy et al. 2006, 2007), we independently simulated posteriors of the data for three overlapping intervals per year, corresponding to day-of-year (DOY) intervals (1146), (110,256) and (219,365) or (219,366) in leap years. These intervals represent periods of low (‘spring’), increasing (‘growing season’) and decreasing (‘autumn’) leaf area, respectively.
Model parameterization and evaluationValues of the hydraulic time constant (κ) for the ‘full’ hydraulic model were based on the model fit to the calibration data with the lowest BIC, using the mean soil moisture for each model period and mean model effects to estimate a calibration value for 2009 for each treatment. Values for the ‘minimal’ hydraulic model were based on a single calibration value for all treat-ments. These values were then adjusted for tree size, multiply-ing the 2009 calibration value of κ by the ratio of mean canopy height in each model period to that of the calibration period, using the mean plot height of each treatment for the full model and the mean across treatments for the minimal model. As our calibration data were collected over a fairly narrow range of heights (see Supplementary Material available as Supplementary Data at Tree Physiology Online), we did not attempt to estimate the effect of tree height on κ from these data.
As κ is similar to an electric analog time constant, we expect it to scale linearly with the product of resistance (R) and capacitance (C). In analogy with Ohm’s law, we would expect stem R to scale linearly with the path length between sensors. If stored water scales with the stem volume per unit sapwood area, we would expect the same for the C of the stem. Thus, based on a simple dimensional analysis, we would expect κ to increase with the square of the distance between the sensors if it is proportional with RC. However, given that not all studies
of conifers find a link between hydraulic time constants and tree size (Daley et al. 2008), as well as changes observed in cellular architecture of tree xylem with age and position (Domec and Gartner 2002, Domec et al. 2005), such a strong effect of height is not a conservative assumption. A linear rela-tionship with tree height was chosen as a compromise between the isometric expectation and a constant value.
We evaluated the performance of each of the three model calibrations (‘null’, ‘full’ and ‘minimal’) by relative changes in dr, the refined index of agreement (Willmott et al. 2012). Larger values of dr, which ranges from −1 to 1, represent greater agreement between modeled and measured values. As it is based on the sum of absolute differences between modeled and measured deviations from the mean measured value, dr is sensitive to model bias (unlike the coefficient of determination, R2) and is less sensitive to outliers than indices based on squared deviations, such as root mean square error (Willmott et al. 2009). To illustrate the effect of the hydraulic model on estimating responses to environmental drivers, we compared the values of GSRef, λ, β1 and β2 (Eqs. (5) and (6)) resulting from the different hydraulic model parameterizations, as well as the response curves described by the mean parameters for each calibration across treatments and modeling periods.
Results
Calibration of hydraulic model
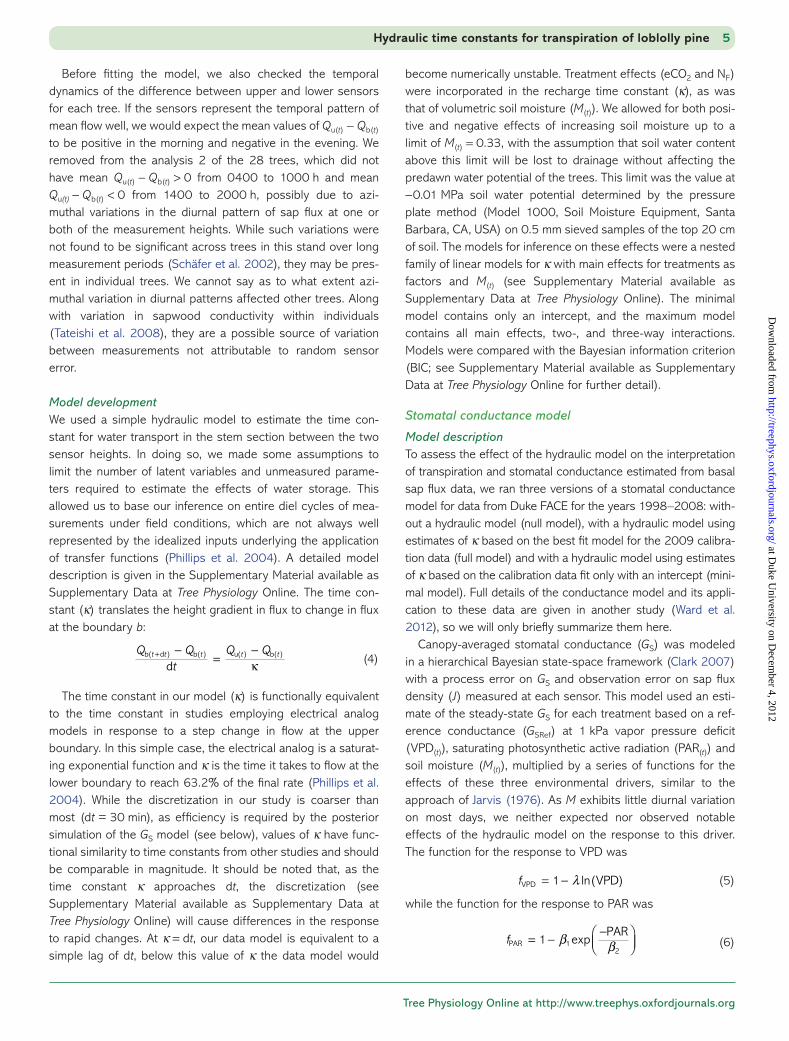
We first estimated the amount of stored water used by each individual on each day (0400–0400 h) from the differences in estimated flow (Q) at each height. For each 24-h period, we estimated the stem water deficit for each time step as the cumulative sum of flow differences times the step length (30 min). These calculations are not dependent on the hydrau-lic model, but they are affected by the rescaling of sap flux (Eqs. (2) and (3)). Using only clear days (daily mean photosyn-thetically active radiation >80% of maximum for site latitude and elevation; Campbell and Norman 1998), we calculated the means of the sum of the daily flux (ΣQ) and of the maximum daily value of the deficit (Dmax) for each tree. Comparing these means across trees on a log–log plot yields a relationship of daily stored water use and transpiration (Dmax = 0.283 ΣQ0.668, Figure 1). This common relationship across treatments is the model with the lowest BIC of a family of nested models with effects for eCO2, NF and the sum of daily transpiration. At the mean daily transpiration of 72.5 g cm−2 day−1, this represents 4.78 g cm−2 of stored water used, or 6.6% of the total.
Next, the recharge rate constant (1/κ) of each treatment group was estimated using a series of nested models with a linear combination of effects (see Supplementary Material available as Supplementary Data at Tree Physiology Online). We selected the model with the lowest BIC (−339,839), which has fixed effects for eCO2, NF and soil moisture (Mt), as well as the
6 Ward et al.
tps114.indd 6 11/27/2012 6:46:19 PM
at Duke U
niversity on Decem
ber 4, 2012http://treephys.oxfordjournals.org/
Dow
nloaded from
Tree Physiology Online at http://www.treephys.oxfordjournals.org
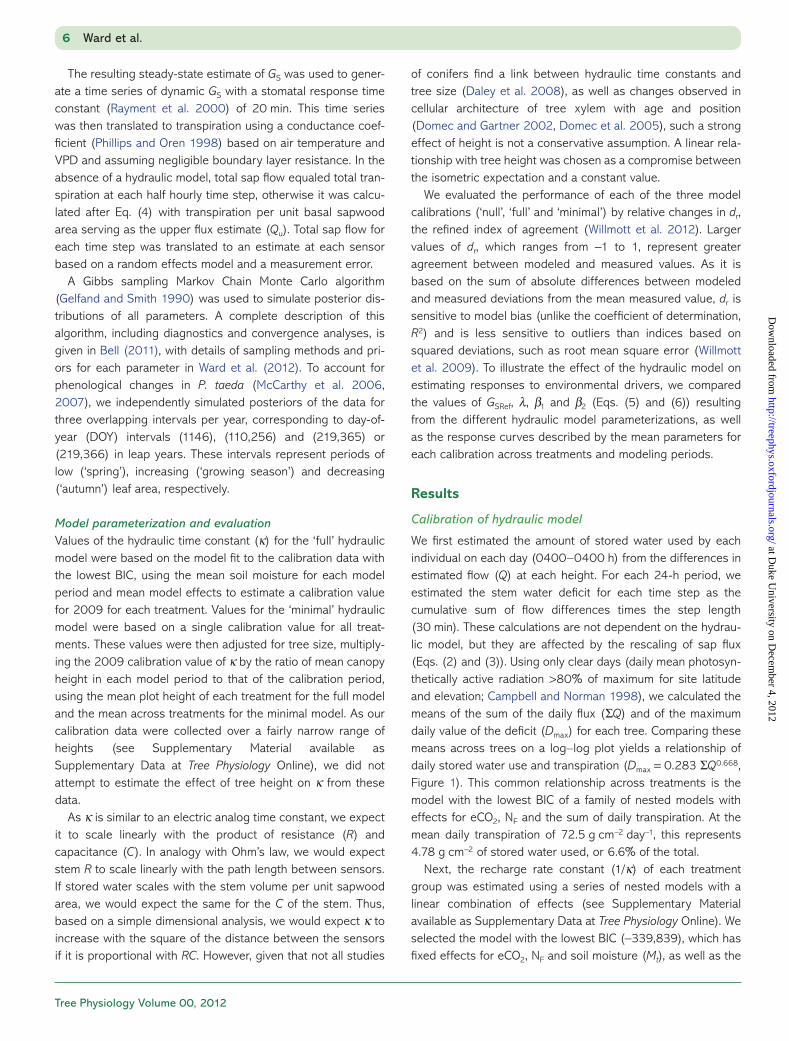
interactions of eCO2 × NF and Mt × NF. The soil moisture response of the hydraulic time constant (κ) is presented in Figure 2, with confidence intervals determined by bootstrap-ping the univariate posterior distributions of these effects (Table 2) with 104 random draws. At minimum soil moisture, there was little (<12%) difference in κ of different treatments. At high soil moisture (Mt > 0.33), differences were much greater, with reductions of 27, 52 and 34% in eCO2 (EC), fertil-ized (AF) and combined (EF) treatments respective to the con-trol (AC). Only the direction of the difference between EC and EF was not consistent in 99% of the parameter draws (P(EC < EF) = 0.735) at high soil moisture.
Effects of hydraulic model on interpretation of sap flux data
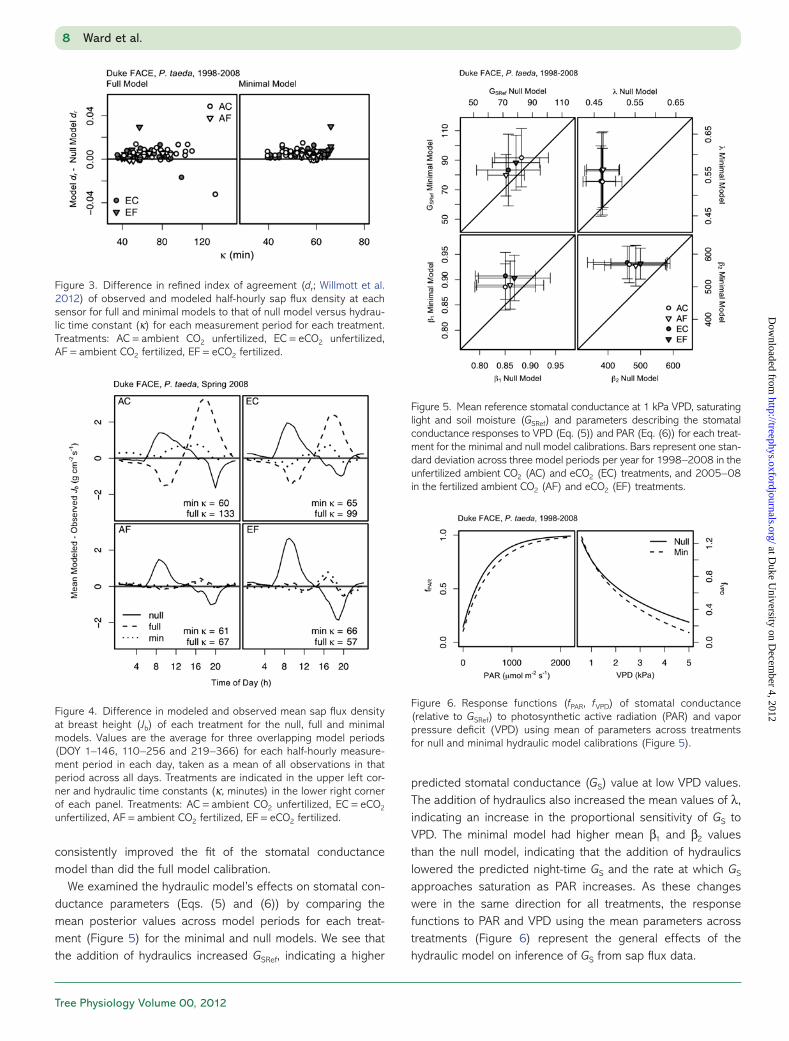
Looking across all 11 years of data, we compared values of the refined index of agreement (dr) for sap flux data from the null (without hydraulics), full (κ with treatment and soil moisture effects) and minimal (κ without treatment and soil moisture effects) models to assess the relative performance of each. Out of the 90 treatment-model periods total, in 83 treatment-model periods for the full model and 88 for the minimal model, dr was greater than that of the null model (Figure 3). While the difference in values of dr were not generally related to mean tree height or the time constant of the full model (κ), the great-est reduction of dr relative to the null model occurred with the greatest value of κ (133.2 min) in the AC treatment in the spring model period of 2008 and the second greatest in EC during the same period. These two decreases in dr were more pronounced than any others for the full model, with no similar decreases observed in the minimal model.
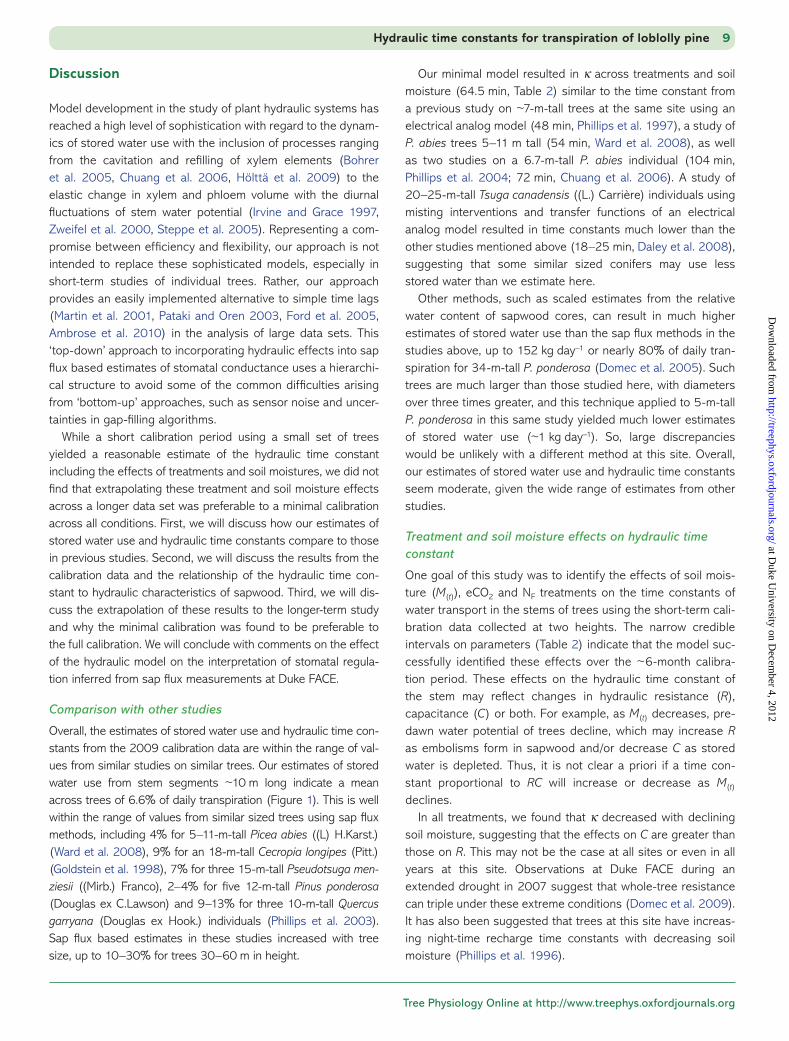
We further examined this model period by calculating the mean difference in modeled versus observed J for all observa-tions at each half-hourly time step to get a mean diurnal pat-tern across days for each treatment (Figure 4). In all treatments, we see that the difference of the null model is positive in the morning and negative in the evening. This apparent hysteresis is expected as sap flux is dampened relative to the transpira-tional signal. In all treatments, the minimal model results in a diurnal pattern of mean model-observation difference closer to the zero line. In the AC and EC treatments, the full model results in a reversal of the null model hysteresis as noted above, while in the AF and EF treatments, where κ estimates are lower, the results of the full model are similar to that of the minimal model. Using both dr (Figure 3) and the diurnal pat-terns of fluxes (Figure 4), we see that the minimal model more
Hydraulic time constants for transpiration of loblolly pine 7
Figure 1. Mean daily maximum water deficit of stem per unit basal sapwood area (Dmax), determined by cumulative sum of differences between flux rates estimated at lower and upper sensors, versus the daily sum of estimated flux at lower sensor (ΣQ) for each tree on clear days during calibration period. Treatments: AC = ambient CO2 unfertil-ized, EC = eCO2 unfertilized, AF = ambient CO2 fertilized, EF = eCO2 fertilized.
Figure 2. Mean soil moisture responses of hydraulic time constant (κ) from best-fit model by treatment. Bars represent 95% credible interval of 104 bootstrapped estimates from parameter posterior distributions (Table 2). Treatments: AC = ambient CO2 unfertilized, EC = eCO2 unfer-tilized, AF = ambient CO2 fertilized, EF = eCO2 fertilized.
Table 2. Credible interval quantiles of posterior effects for best-fit model of recharge rate constant (1/κ, min−1)
Quantile (%) Intercept eCO2 NF eCO2 × NF Mt NF × M(t)
2.5 0.0266 0.0020 −0.0025 −0.0074 −0.0673 0.018650 0.0276 0.0026 −0.0009 −0.0065 −0.0631 0.025197.5 0.0286 0.0032 0.0006 −0.0055 −0.0588 0.0316
tps114.indd 7 11/27/2012 6:46:20 PM
at Duke U
niversity on Decem
ber 4, 2012http://treephys.oxfordjournals.org/
Dow
nloaded from
Tree Physiology Volume 00, 2012
consistently improved the fit of the stomatal conductance model than did the full model calibration.
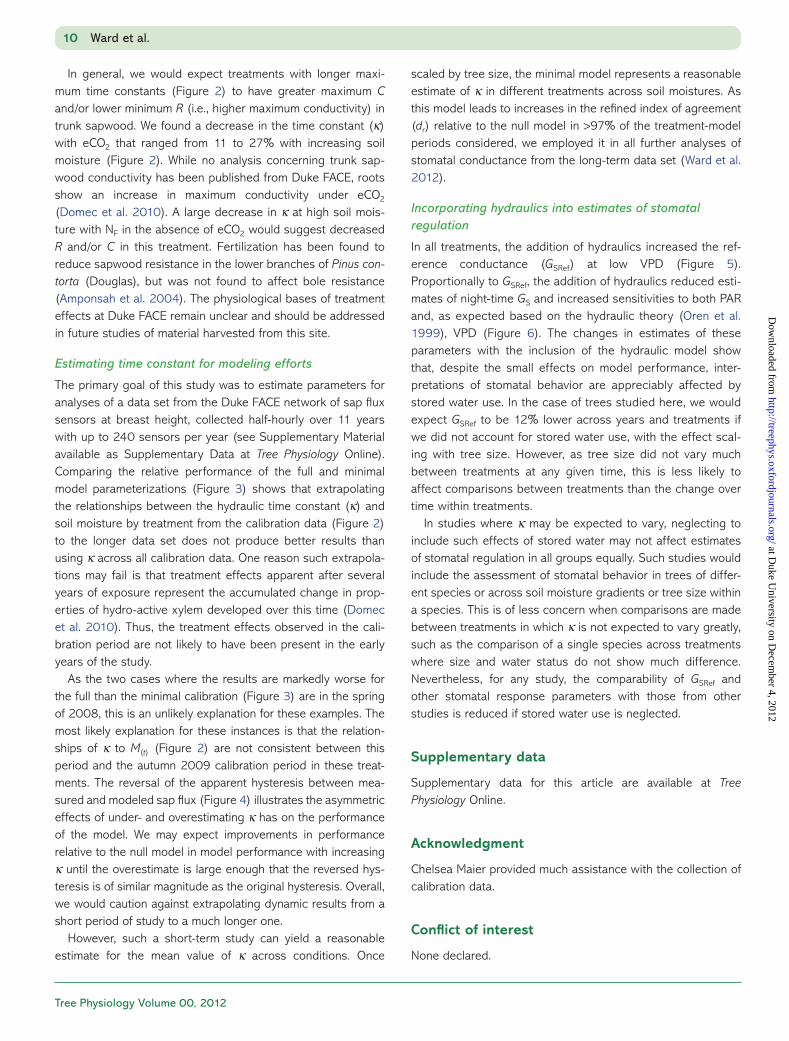
We examined the hydraulic model’s effects on stomatal con-ductance parameters (Eqs. (5) and (6)) by comparing the mean posterior values across model periods for each treat-ment (Figure 5) for the minimal and null models. We see that the addition of hydraulics increased GSRef, indicating a higher
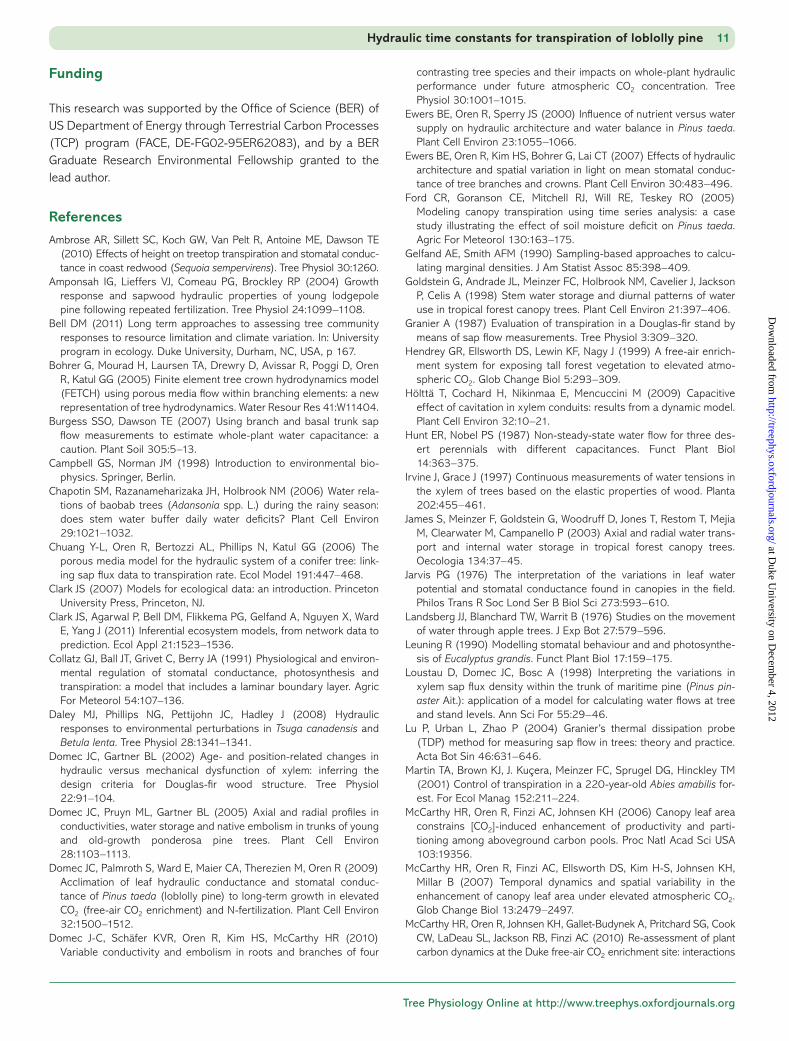
predicted stomatal conductance (GS) value at low VPD values. The addition of hydraulics also increased the mean values of λ, indicating an increase in the proportional sensitivity of GS to VPD. The minimal model had higher mean β1 and β2 values than the null model, indicating that the addition of hydraulics lowered the predicted night-time GS and the rate at which GS approaches saturation as PAR increases. As these changes were in the same direction for all treatments, the response functions to PAR and VPD using the mean parameters across treatments (Figure 6) represent the general effects of the hydraulic model on inference of GS from sap flux data.
8 Ward et al.
Figure 3. Difference in refined index of agreement (dr; Willmott et al. 2012) of observed and modeled half-hourly sap flux density at each sensor for full and minimal models to that of null model versus hydrau-lic time constant (κ) for each measurement period for each treatment. Treatments: AC = ambient CO2 unfertilized, EC = eCO2 unfertilized, AF = ambient CO2 fertilized, EF = eCO2 fertilized.
Figure 4. Difference in modeled and observed mean sap flux density at breast height (Jb) of each treatment for the null, full and minimal models. Values are the average for three overlapping model periods (DOY 1–146, 110–256 and 219–366) for each half-hourly measure-ment period in each day, taken as a mean of all observations in that period across all days. Treatments are indicated in the upper left cor-ner and hydraulic time constants (κ, minutes) in the lower right corner of each panel. Treatments: AC = ambient CO2 unfertilized, EC = eCO2 unfertilized, AF = ambient CO2 fertilized, EF = eCO2 fertilized.
Figure 5. Mean reference stomatal conductance at 1 kPa VPD, saturating light and soil moisture (GSRef) and parameters describing the stomatal conductance responses to VPD (Eq. (5)) and PAR (Eq. (6)) for each treat-ment for the minimal and null model calibrations. Bars represent one stan-dard deviation across three model periods per year for 1998–2008 in the unfertilized ambient CO2 (AC) and eCO2 (EC) treatments, and 2005–08 in the fertilized ambient CO2 (AF) and eCO2 (EF) treatments.
Figure 6. Response functions (fPAR, fVPD) of stomatal conductance (relative to GSRef) to photosynthetic active radiation (PAR) and vapor pressure deficit (VPD) using mean of parameters across treatments for null and minimal hydraulic model calibrations (Figure 5).
tps114.indd 8 11/27/2012 6:46:21 PM
at Duke U
niversity on Decem
ber 4, 2012http://treephys.oxfordjournals.org/
Dow
nloaded from
Tree Physiology Online at http://www.treephys.oxfordjournals.org
Discussion
Model development in the study of plant hydraulic systems has reached a high level of sophistication with regard to the dynam-ics of stored water use with the inclusion of processes ranging from the cavitation and refilling of xylem elements (Bohrer et al. 2005, Chuang et al. 2006, Hölttä et al. 2009) to the elastic change in xylem and phloem volume with the diurnal fluctuations of stem water potential (Irvine and Grace 1997, Zweifel et al. 2000, Steppe et al. 2005). Representing a com-promise between efficiency and flexibility, our approach is not intended to replace these sophisticated models, especially in short-term studies of individual trees. Rather, our approach provides an easily implemented alternative to simple time lags (Martin et al. 2001, Pataki and Oren 2003, Ford et al. 2005, Ambrose et al. 2010) in the analysis of large data sets. This ‘top-down’ approach to incorporating hydraulic effects into sap flux based estimates of stomatal conductance uses a hierarchi-cal structure to avoid some of the common difficulties arising from ‘bottom-up’ approaches, such as sensor noise and uncer-tainties in gap-filling algorithms.
While a short calibration period using a small set of trees yielded a reasonable estimate of the hydraulic time constant including the effects of treatments and soil moistures, we did not find that extrapolating these treatment and soil moisture effects across a longer data set was preferable to a minimal calibration across all conditions. First, we will discuss how our estimates of stored water use and hydraulic time constants compare to those in previous studies. Second, we will discuss the results from the calibration data and the relationship of the hydraulic time con-stant to hydraulic characteristics of sapwood. Third, we will dis-cuss the extrapolation of these results to the longer-term study and why the minimal calibration was found to be preferable to the full calibration. We will conclude with comments on the effect of the hydraulic model on the interpretation of stomatal regula-tion inferred from sap flux measurements at Duke FACE.
Comparison with other studies
Overall, the estimates of stored water use and hydraulic time con-stants from the 2009 calibration data are within the range of val-ues from similar studies on similar trees. Our estimates of stored water use from stem segments ~10 m long indicate a mean across trees of 6.6% of daily transpiration (Figure 1). This is well within the range of values from similar sized trees using sap flux methods, including 4% for 5–11-m-tall Picea abies ((L) H.Karst.) (Ward et al. 2008), 9% for an 18-m-tall Cecropia longipes (Pitt.) (Goldstein et al. 1998), 7% for three 15-m-tall Pseudotsuga men-ziesii ((Mirb.) Franco), 2–4% for five 12-m-tall Pinus ponderosa (Douglas ex C.Lawson) and 9–13% for three 10-m-tall Quercus garryana (Douglas ex Hook.) individuals (Phillips et al. 2003). Sap flux based estimates in these studies increased with tree size, up to 10–30% for trees 30–60 m in height.
Our minimal model resulted in κ across treatments and soil moisture (64.5 min, Table 2) similar to the time constant from a previous study on ~7-m-tall trees at the same site using an electrical analog model (48 min, Phillips et al. 1997), a study of P. abies trees 5–11 m tall (54 min, Ward et al. 2008), as well as two studies on a 6.7-m-tall P. abies individual (104 min, Phillips et al. 2004; 72 min, Chuang et al. 2006). A study of 20–25-m-tall Tsuga canadensis ((L.) Carrière) individuals using misting interventions and transfer functions of an electrical analog model resulted in time constants much lower than the other studies mentioned above (18–25 min, Daley et al. 2008), suggesting that some similar sized conifers may use less stored water than we estimate here.
Other methods, such as scaled estimates from the relative water content of sapwood cores, can result in much higher estimates of stored water use than the sap flux methods in the studies above, up to 152 kg day−1 or nearly 80% of daily tran-spiration for 34-m-tall P. ponderosa (Domec et al. 2005). Such trees are much larger than those studied here, with diameters over three times greater, and this technique applied to 5-m-tall P. ponderosa in this same study yielded much lower estimates of stored water use (~1 kg day−1). So, large discrepancies would be unlikely with a different method at this site. Overall, our estimates of stored water use and hydraulic time constants seem moderate, given the wide range of estimates from other studies.
Treatment and soil moisture effects on hydraulic time constant
One goal of this study was to identify the effects of soil mois-ture (M(t)), eCO2 and NF treatments on the time constants of water transport in the stems of trees using the short-term cali-bration data collected at two heights. The narrow credible intervals on parameters (Table 2) indicate that the model suc-cessfully identified these effects over the ~6-month calibra-tion period. These effects on the hydraulic time constant of the stem may reflect changes in hydraulic resistance (R), capacitance (C) or both. For example, as M(t) decreases, pre-dawn water potential of trees decline, which may increase R as embolisms form in sapwood and/or decrease C as stored water is depleted. Thus, it is not clear a priori if a time con-stant proportional to RC will increase or decrease as M(t) declines.
In all treatments, we found that κ decreased with declining soil moisture, suggesting that the effects on C are greater than those on R. This may not be the case at all sites or even in all years at this site. Observations at Duke FACE during an extended drought in 2007 suggest that whole-tree resistance can triple under these extreme conditions (Domec et al. 2009). It has also been suggested that trees at this site have increas-ing night-time recharge time constants with decreasing soil moisture (Phillips et al. 1996).
Hydraulic time constants for transpiration of loblolly pine 9
tps114.indd 9 11/27/2012 6:46:21 PM
at Duke U
niversity on Decem
ber 4, 2012http://treephys.oxfordjournals.org/
Dow
nloaded from
Tree Physiology Volume 00, 2012
In general, we would expect treatments with longer maxi-mum time constants (Figure 2) to have greater maximum C and/or lower minimum R (i.e., higher maximum conductivity) in trunk sapwood. We found a decrease in the time constant (κ) with eCO2 that ranged from 11 to 27% with increasing soil moisture (Figure 2). While no analysis concerning trunk sap-wood conductivity has been published from Duke FACE, roots show an increase in maximum conductivity under eCO2 (Domec et al. 2010). A large decrease in κ at high soil mois-ture with NF in the absence of eCO2 would suggest decreased R and/or C in this treatment. Fertilization has been found to reduce sapwood resistance in the lower branches of Pinus con-torta (Douglas), but was not found to affect bole resistance (Amponsah et al. 2004). The physiological bases of treatment effects at Duke FACE remain unclear and should be addressed in future studies of material harvested from this site.
Estimating time constant for modeling efforts
The primary goal of this study was to estimate parameters for analyses of a data set from the Duke FACE network of sap flux sensors at breast height, collected half-hourly over 11 years with up to 240 sensors per year (see Supplementary Material available as Supplementary Data at Tree Physiology Online). Comparing the relative performance of the full and minimal model parameterizations (Figure 3) shows that extrapolating the relationships between the hydraulic time constant (κ) and soil moisture by treatment from the calibration data (Figure 2) to the longer data set does not produce better results than using κ across all calibration data. One reason such extrapola-tions may fail is that treatment effects apparent after several years of exposure represent the accumulated change in prop-erties of hydro-active xylem developed over this time (Domec et al. 2010). Thus, the treatment effects observed in the cali-bration period are not likely to have been present in the early years of the study.
As the two cases where the results are markedly worse for the full than the minimal calibration (Figure 3) are in the spring of 2008, this is an unlikely explanation for these examples. The most likely explanation for these instances is that the relation-ships of κ to M(t) (Figure 2) are not consistent between this period and the autumn 2009 calibration period in these treat-ments. The reversal of the apparent hysteresis between mea-sured and modeled sap flux (Figure 4) illustrates the asymmetric effects of under- and overestimating κ has on the performance of the model. We may expect improvements in performance relative to the null model in model performance with increasing κ until the overestimate is large enough that the reversed hys-teresis is of similar magnitude as the original hysteresis. Overall, we would caution against extrapolating dynamic results from a short period of study to a much longer one.
However, such a short-term study can yield a reasonable estimate for the mean value of κ across conditions. Once
scaled by tree size, the minimal model represents a reasonable estimate of κ in different treatments across soil moistures. As this model leads to increases in the refined index of agreement (dr) relative to the null model in >97% of the treatment-model periods considered, we employed it in all further analyses of stomatal conductance from the long-term data set (Ward et al. 2012).
Incorporating hydraulics into estimates of stomatal regulation
In all treatments, the addition of hydraulics increased the ref-erence conductance (GSRef) at low VPD (Figure 5). Proportionally to GSRef, the addition of hydraulics reduced esti-mates of night-time GS and increased sensitivities to both PAR and, as expected based on the hydraulic theory (Oren et al. 1999), VPD (Figure 6). The changes in estimates of these parameters with the inclusion of the hydraulic model show that, despite the small effects on model performance, inter-pretations of stomatal behavior are appreciably affected by stored water use. In the case of trees studied here, we would expect GSRef to be 12% lower across years and treatments if we did not account for stored water use, with the effect scal-ing with tree size. However, as tree size did not vary much between treatments at any given time, this is less likely to affect comparisons between treatments than the change over time within treatments.
In studies where κ may be expected to vary, neglecting to include such effects of stored water may not affect estimates of stomatal regulation in all groups equally. Such studies would include the assessment of stomatal behavior in trees of differ-ent species or across soil moisture gradients or tree size within a species. This is of less concern when comparisons are made between treatments in which κ is not expected to vary greatly, such as the comparison of a single species across treatments where size and water status do not show much difference. Nevertheless, for any study, the comparability of GSRef and other stomatal response parameters with those from other studies is reduced if stored water use is neglected.
Supplementary data
Supplementary data for this article are available at Tree Physiology Online.
Acknowledgment
Chelsea Maier provided much assistance with the collection of calibration data.
Conflict of interest
None declared.
10 Ward et al.
tps114.indd 10 11/27/2012 6:46:21 PM
at Duke U
niversity on Decem
ber 4, 2012http://treephys.oxfordjournals.org/
Dow
nloaded from
Tree Physiology Online at http://www.treephys.oxfordjournals.org
Funding
This research was supported by the Office of Science (BER) of US Department of Energy through Terrestrial Carbon Processes (TCP) program (FACE, DE-FG02-95ER62083), and by a BER Graduate Research Environmental Fellowship granted to the lead author.
References
Ambrose AR, Sillett SC, Koch GW, Van Pelt R, Antoine ME, Dawson TE (2010) Effects of height on treetop transpiration and stomatal conduc-tance in coast redwood (Sequoia sempervirens). Tree Physiol 30:1260.
Amponsah IG, Lieffers VJ, Comeau PG, Brockley RP (2004) Growth response and sapwood hydraulic properties of young lodgepole pine following repeated fertilization. Tree Physiol 24:1099–1108.
Bell DM (2011) Long term approaches to assessing tree community responses to resource limitation and climate variation. In: University program in ecology. Duke University, Durham, NC, USA, p 167.
Bohrer G, Mourad H, Laursen TA, Drewry D, Avissar R, Poggi D, Oren R, Katul GG (2005) Finite element tree crown hydrodynamics model (FETCH) using porous media flow within branching elements: a new representation of tree hydrodynamics. Water Resour Res 41:W11404.
Burgess SSO, Dawson TE (2007) Using branch and basal trunk sap flow measurements to estimate whole-plant water capacitance: a caution. Plant Soil 305:5–13.
Campbell GS, Norman JM (1998) Introduction to environmental bio-physics. Springer, Berlin.
Chapotin SM, Razanameharizaka JH, Holbrook NM (2006) Water rela-tions of baobab trees (Adansonia spp. L.) during the rainy season: does stem water buffer daily water deficits? Plant Cell Environ 29:1021–1032.
Chuang Y-L, Oren R, Bertozzi AL, Phillips N, Katul GG (2006) The porous media model for the hydraulic system of a conifer tree: link-ing sap flux data to transpiration rate. Ecol Model 191:447–468.
Clark JS (2007) Models for ecological data: an introduction. Princeton University Press, Princeton, NJ.
Clark JS, Agarwal P, Bell DM, Flikkema PG, Gelfand A, Nguyen X, Ward E, Yang J (2011) Inferential ecosystem models, from network data to prediction. Ecol Appl 21:1523–1536.
Collatz GJ, Ball JT, Grivet C, Berry JA (1991) Physiological and environ-mental regulation of stomatal conductance, photosynthesis and transpiration: a model that includes a laminar boundary layer. Agric For Meteorol 54:107–136.
Daley MJ, Phillips NG, Pettijohn JC, Hadley J (2008) Hydraulic responses to environmental perturbations in Tsuga canadensis and Betula lenta. Tree Physiol 28:1341–1341.
Domec JC, Gartner BL (2002) Age- and position-related changes in hydraulic versus mechanical dysfunction of xylem: inferring the design criteria for Douglas-fir wood structure. Tree Physiol 22:91–104.
Domec JC, Pruyn ML, Gartner BL (2005) Axial and radial profiles in conductivities, water storage and native embolism in trunks of young and old-growth ponderosa pine trees. Plant Cell Environ 28:1103–1113.
Domec JC, Palmroth S, Ward E, Maier CA, Therezien M, Oren R (2009) Acclimation of leaf hydraulic conductance and stomatal conduc-tance of Pinus taeda (loblolly pine) to long-term growth in elevated CO2 (free-air CO2 enrichment) and N-fertilization. Plant Cell Environ 32:1500–1512.
Domec J-C, Schäfer KVR, Oren R, Kim HS, McCarthy HR (2010) Variable conductivity and embolism in roots and branches of four
contrasting tree species and their impacts on whole-plant hydraulic performance under future atmospheric CO2 concentration. Tree Physiol 30:1001–1015.
Ewers BE, Oren R, Sperry JS (2000) Influence of nutrient versus water supply on hydraulic architecture and water balance in Pinus taeda. Plant Cell Environ 23:1055–1066.
Ewers BE, Oren R, Kim HS, Bohrer G, Lai CT (2007) Effects of hydraulic architecture and spatial variation in light on mean stomatal conduc-tance of tree branches and crowns. Plant Cell Environ 30:483–496.
Ford CR, Goranson CE, Mitchell RJ, Will RE, Teskey RO (2005) Modeling canopy transpiration using time series analysis: a case study illustrating the effect of soil moisture deficit on Pinus taeda. Agric For Meteorol 130:163–175.
Gelfand AE, Smith AFM (1990) Sampling-based approaches to calcu-lating marginal densities. J Am Statist Assoc 85:398–409.
Goldstein G, Andrade JL, Meinzer FC, Holbrook NM, Cavelier J, Jackson P, Celis A (1998) Stem water storage and diurnal patterns of water use in tropical forest canopy trees. Plant Cell Environ 21:397–406.
Granier A (1987) Evaluation of transpiration in a Douglas-fir stand by means of sap flow measurements. Tree Physiol 3:309–320.
Hendrey GR, Ellsworth DS, Lewin KF, Nagy J (1999) A free-air enrich-ment system for exposing tall forest vegetation to elevated atmo-spheric CO2. Glob Change Biol 5:293–309.
Hölttä T, Cochard H, Nikinmaa E, Mencuccini M (2009) Capacitive effect of cavitation in xylem conduits: results from a dynamic model. Plant Cell Environ 32:10–21.
Hunt ER, Nobel PS (1987) Non-steady-state water flow for three des-ert perennials with different capacitances. Funct Plant Biol 14:363–375.
Irvine J, Grace J (1997) Continuous measurements of water tensions in the xylem of trees based on the elastic properties of wood. Planta 202:455–461.
James S, Meinzer F, Goldstein G, Woodruff D, Jones T, Restom T, Mejia M, Clearwater M, Campanello P (2003) Axial and radial water trans-port and internal water storage in tropical forest canopy trees. Oecologia 134:37–45.
Jarvis PG (1976) The interpretation of the variations in leaf water potential and stomatal conductance found in canopies in the field. Philos Trans R Soc Lond Ser B Biol Sci 273:593–610.
Landsberg JJ, Blanchard TW, Warrit B (1976) Studies on the movement of water through apple trees. J Exp Bot 27:579–596.
Leuning R (1990) Modelling stomatal behaviour and and photosynthe-sis of Eucalyptus grandis. Funct Plant Biol 17:159–175.
Loustau D, Domec JC, Bosc A (1998) Interpreting the variations in xylem sap flux density within the trunk of maritime pine (Pinus pin-aster Ait.): application of a model for calculating water flows at tree and stand levels. Ann Sci For 55:29–46.
Lu P, Urban L, Zhao P (2004) Granier’s thermal dissipation probe (TDP) method for measuring sap flow in trees: theory and practice. Acta Bot Sin 46:631–646.
Martin TA, Brown KJ, J. Kuçera, Meinzer FC, Sprugel DG, Hinckley TM (2001) Control of transpiration in a 220-year-old Abies amabilis for-est. For Ecol Manag 152:211–224.
McCarthy HR, Oren R, Finzi AC, Johnsen KH (2006) Canopy leaf area constrains [CO2]-induced enhancement of productivity and parti-tioning among aboveground carbon pools. Proc Natl Acad Sci USA 103:19356.
McCarthy HR, Oren R, Finzi AC, Ellsworth DS, Kim H-S, Johnsen KH, Millar B (2007) Temporal dynamics and spatial variability in the enhancement of canopy leaf area under elevated atmospheric CO2. Glob Change Biol 13:2479–2497.
McCarthy HR, Oren R, Johnsen KH, Gallet-Budynek A, Pritchard SG, Cook CW, LaDeau SL, Jackson RB, Finzi AC (2010) Re-assessment of plant carbon dynamics at the Duke free-air CO2 enrichment site: interactions
Hydraulic time constants for transpiration of loblolly pine 11
tps114.indd 11 11/27/2012 6:46:21 PM
at Duke U
niversity on Decem
ber 4, 2012http://treephys.oxfordjournals.org/
Dow
nloaded from
Tree Physiology Volume 00, 2012
of atmospheric [CO2] with nitrogen and water availability over stand development. New Phytol 185:514–528.
Meinzer FC, James SA, Goldstein G, Woodruff D (2003) Whole-tree water transport scales with sapwood capacitance in tropical forest canopy trees. Plant Cell Environ 26:1147–1155.
Oishi AC, Oren R, Stoy PC (2008) Estimating components of forest evapotranspiration: a footprint approach for scaling sap flux mea-surements. Agric For Meteorol 148:1719–1732.
Oren R, Phillips N, Katul G, Ewers BE, Pataki DE (1998) Scaling xylem sap flux and soil water balance and calculating variance: a method for partitioning water flux in forests. Ann Sci For 55:191–216.
Oren R, Sperry JS, Katul GG, Pataki DE, Ewers BE, Phillips N, Schafer KVR (1999) Survey and synthesis of intra- and interspecific variation in stomatal sensitivity to vapour pressure deficit. Plant Cell Environ 22:1515–1526.
Oren R, Hsieh C-I, Stoy P, Albertson J, McCarthy HR, Harrell P, Katul GG (2006) Estimating the uncertainty in annual net ecosystem carbon exchange: spatial variation in turbulent fluxes and sampling errors in eddy-covariance measurements. Glob Change Biol 12:883–896.
Pataki DE, Oren R (2003) Species differences in stomatal control of water loss at the canopy scale in a mature bottomland deciduous forest. Adv Water Resour 26:1267–1278.
Phillips N, Oren R (1998) A comparison of daily representations of canopy conductance based on two conditional time-averaging methods and the dependence of daily conductance on environmen-tal factors. Ann Sci For 55:217–235.
Phillips N, Oren R, Zimmermann R (1996) Radial patterns of xylem sap flow in non-, diffuse- and ring-porous tree species. Plant Cell Environ 19:983–990.
Phillips N, Nagchaudhuri A, Oren R, Katul G (1997) Time constant for water transport in loblolly pine trees estimated from time series of evap-orative demand and stem sapflow. Trees Struct Funct 11:412–419.
Phillips NG, Ryan MG, Bond BJ, McDowell NG, Hinckley TM, Cermak J (2003) Reliance on stored water increases with tree size in three species in the Pacific Northwest. Tree Physiol 23:237–245.
Phillips NG, Oren R, Licata J, Linder S (2004) Time series diagnosis of tree hydraulic characteristics. Tree Physiol 24:879–890.
Phillips NG, Scholz FG, Bucci SJ, Goldstein G, Meinzer FC (2008) Using branch and basal trunk sap flow measurements to estimate whole-plant water capacitance: comment on Burgess and Dawson (2008). Plant Soil 315:315–324.
Rayment MB, Loustau D, Jarvis PG (2000) Measuring and modeling conductances of black spruce at three organizational scales: shoot, branch and canopy. Tree Physiol 20:713–723.
Schäfer KVR, Oren R, Lai CT, Katul GG (2002) Hydrologic balance in an intact temperate forest ecosystem under ambient and elevated atmospheric CO2 concentration. Glob Change Biol 8:895–911.
Smith DM, Allen SJ (1996) Measurement of sap flow in plant stems. J Exp Bot 47:1833–1844.
Sperry JS, Hacke UG, Oren R, Comstock JP (2002) Water deficits and hydraulic limits to leaf water supply. Plant Cell Environ 25:251–263.
Steppe K, De Pauw DJW, Lemeur R, Vanrolleghem PA (2005) A math-ematical model linking tree sap flow dynamics to daily stem diame-ter fluctuations and radial stem growth. Tree Physiol 26:257.
Swanson RH (1972) Water transpired by trees is indicated by heat pulse velocity. Agric Meteorol 10:277–281.
Swanson RH, Whitfield DWA (1981) A numerical analysis of heat pulse velocity theory and practice. J Exp Bot 32:221–239.
Tateishi M, Kumagai TÄ, Utsumi Y, Umebayashi T, Shiiba Y, Inoue K, Kaji K, Cho K, Otsuki K (2008) Spatial variations in xylem sap flux den-sity in evergreen oak trees with radial-porous wood: comparisons with anatomical observations. Trees Struct Funct 22:23–30.
Tyree MT, Sperry JS (1988) Do woody plants operate near the point of catastrophic xylem dysfunction caused by dynamic water stress?: answers from a model. Plant Physiol 88:574–580.
van den Honert TH (1948) Water transport in plants as a catenary process. Discus Faraday Soc 3:146–153.
Ward E, Oren R, Bell DM, Clark JS, McCarthy H, Kim HS, Domec JC (2012). The effects of elevated CO2 and nitrogen fertilization on stomatal conductance estimated from 11 years of scaled sap flux measurements at Duke FACE. Tree Physiol (in press) doi:10.1093/treephys/tps118.
Ward EJ, Oren R, Sigurdsson BD, Jarvis PG, Linder S (2008) Fertilization effects on mean stomatal conductance are mediated through changes in the hydraulic attributes of mature Norway spruce trees. Tree Physiol 28:579–596.
Willmott CJ, Matsuura K, Robeson SM (2009) Ambiguities inherent in sums-of-squares-based error statistics. Atmos Environ 43:749–752.
Willmott CJ, Robeson SM, Matsuura K (2012) A refined index of model performance. Int J Climatol 32:2088–2094.
Wullschleger SD, Meinzer FC, Vertessy RA et al. (1998) A review of whole-plant water use studies in trees. Tree Physiol 18:499–512.
Zweifel R, Item H, R. Häsler (2000) Stem radius changes and their rela-tion to stored water in stems of young Norway spruce trees. Trees 15:50–57.
Zweifel R, Steppe K, Sterck FJ (2007) Stomatal regulation by microcli-mate and tree water relations: interpreting ecophysiological field data with a hydraulic plant model. J Exp Bot 58:2113–2131.
12 Ward et al.
tps114.indd 12 11/27/2012 6:46:21 PM
at Duke U
niversity on Decem
ber 4, 2012http://treephys.oxfordjournals.org/
Dow
nloaded from


![PINUS TAEDA - Inter Link SAS · PINUS TAEDA [Loblolly Pine] Growing zones and origin The loblolly pine is native to the Southeastern United States. Tree profile The evergreen loblolly](https://img.pdfslide.us/doc/110x75/5c486c1993f3c31f4f7b23c2/pinus-taeda-inter-link-sas-pinus-taeda-loblolly-pine-growing-zones-and-origin.jpg)