Embed Size (px)
Citation preview

Alliance of Indiana Rural Water September 21, 2016
Hydraulic Modeling – Predicting and Resolving Water Quality Issues
The content of this presentation is not to be downloaded, copied, used, or otherwise transmitted without the prior consent of Strand Associates, Inc. ®
Jim McNulty, P.G.
Strand Associates, Inc.®

Presentation Summary
• Hydraulic Water Modeling Overview
• Water Quality Modeling
- What is it, How is it accomplished, Why it is beneficial
• Case Studies

Water System Models – Almost Every Community Needs One!
• Current System Conditions
• Design Information and Results
• Planning Tools
• “What ifs”?
Courtesy of: Strand Associates, Inc. ®, Fond du Lac Water System Master Plan,2014
What is a Water Model?• Computerized representation of a real water distribution system
• Pipes, nodes (pipe junctions/demand points), valves, reservoirs, storage tanks, pumps, etc.
Storage Tanks
Reservoir (WTP Clearwell)
High Service Pump Station
Pipes
Courtesy of: Strand Associates, Inc. ®, Kentucky American Water Company Hydraulic Analysis for Comprehensive Planning Study, 2012
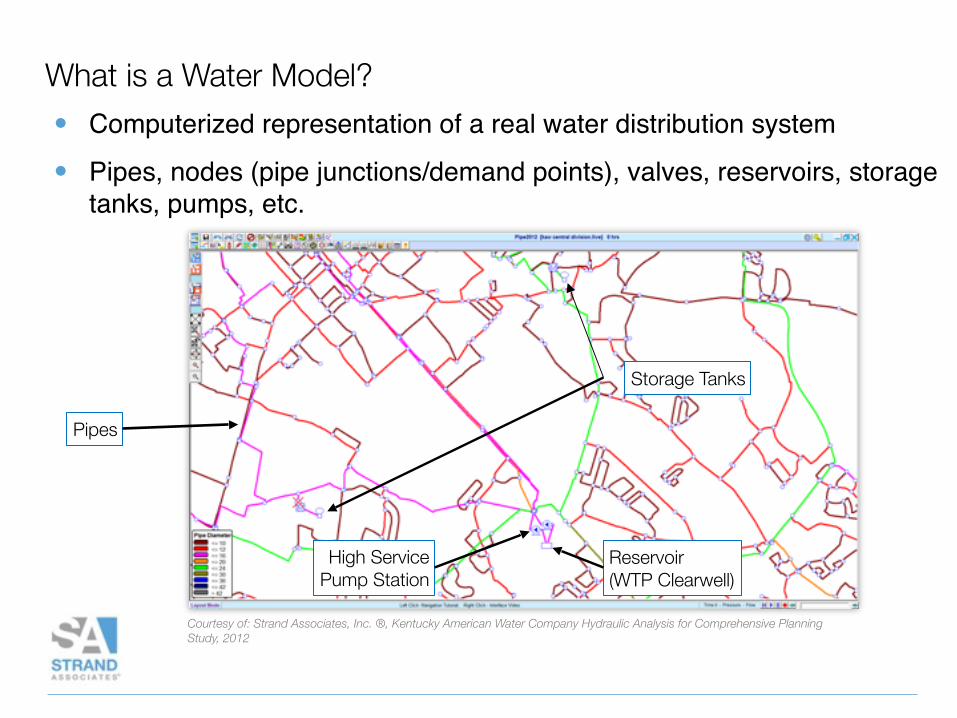
Water System Models Used to Support Many Decisions• Simulate various hydraulic scenarios and conditions
- Steady state (snapshot in time) - Extended Period Simulation (EPS) - Fire Flow - Water Quality (Age) - Transients (Surge)
Courtesy of: Strand Associates, Inc. ®, Kentucky American Water Company Northern Division Connection Project, 2013
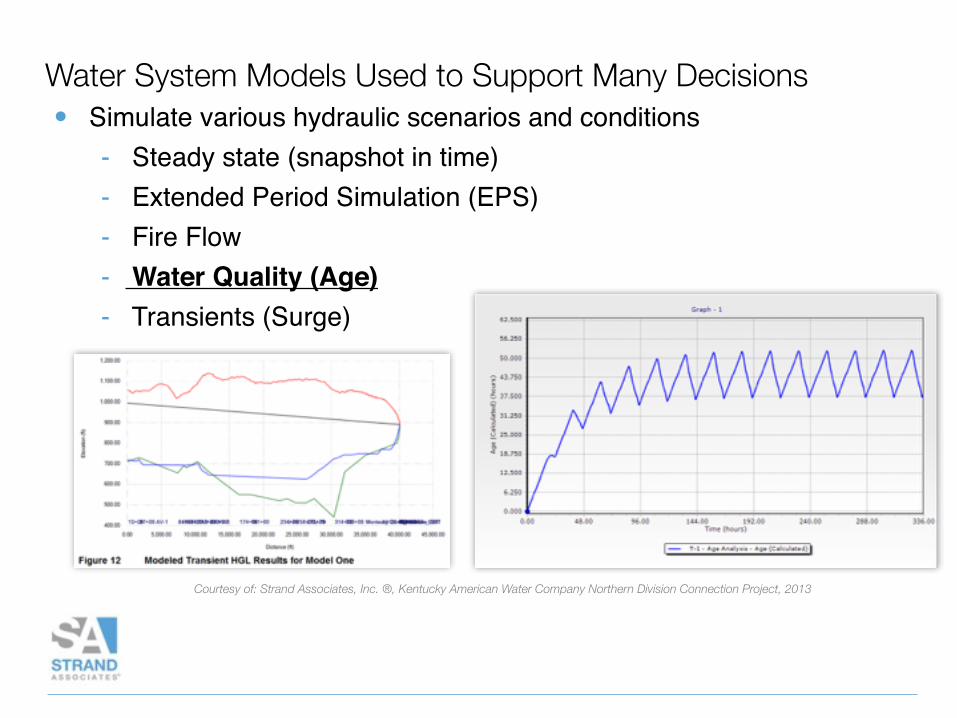
Accurate Model Development Requires Utility Input
• All Pipes Valve (APV) vs. Skeletonized Model
• Calibration
• Demand
• Accurate Source Information
• Accurate Control Schemes
Courtesy of: Strand Associates, Inc. ®, Centralia Water Distribution System Evaluation, 2009

Model Development Can Be Very Simple
• APV – All Pipes and Valves (often excludes service lines)
• Skeletonized – Eliminates some smaller diameter mains
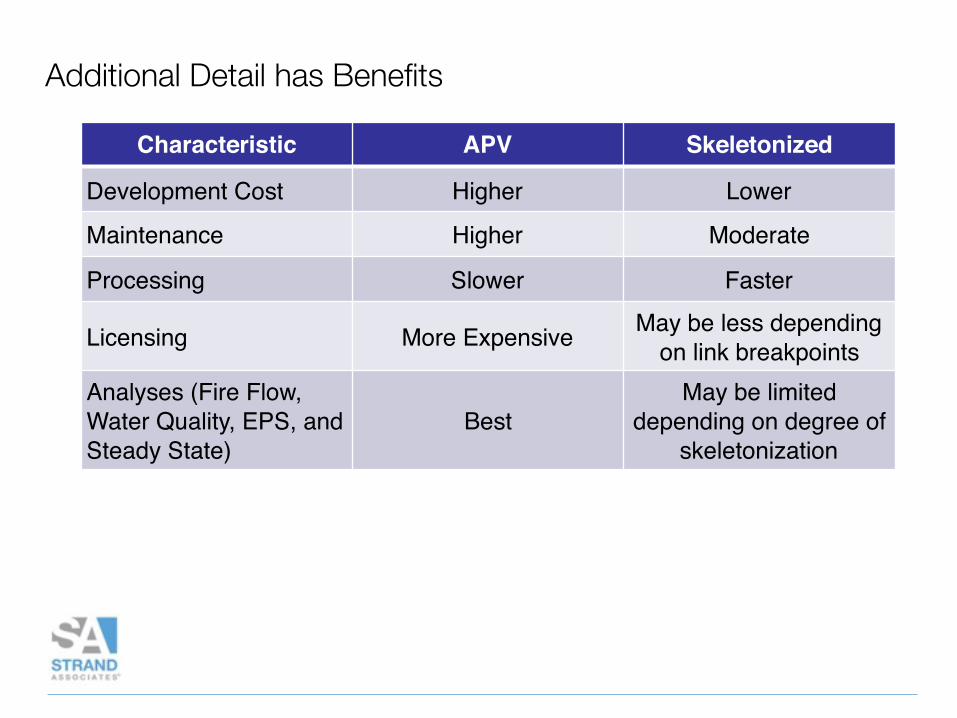
Additional Detail has Benefits
Characteristic APV Skeletonized
Development Cost Higher Lower
Maintenance Higher Moderate
Processing Slower Faster
Licensing More Expensive May be less depending on link breakpoints
Analyses (Fire Flow, Water Quality, EPS, and Steady State)
BestMay be limited
depending on degree of skeletonization
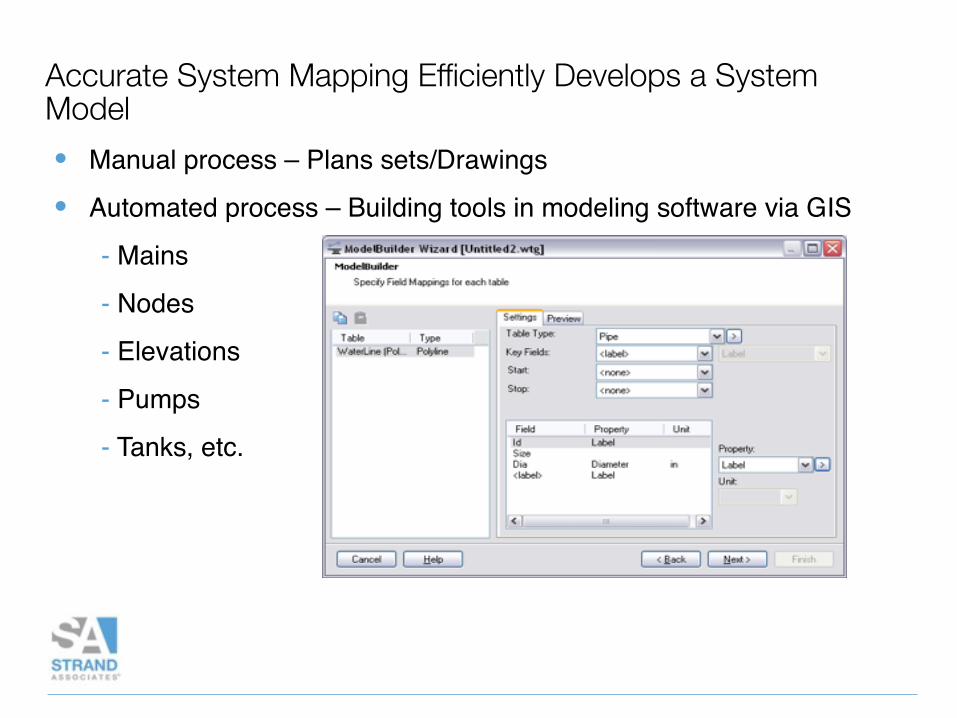
Accurate System Mapping Efficiently Develops a System Model• Manual process – Plans sets/Drawings
• Automated process – Building tools in modeling software via GIS
- Mains
- Nodes
- Elevations
- Pumps
- Tanks, etc.
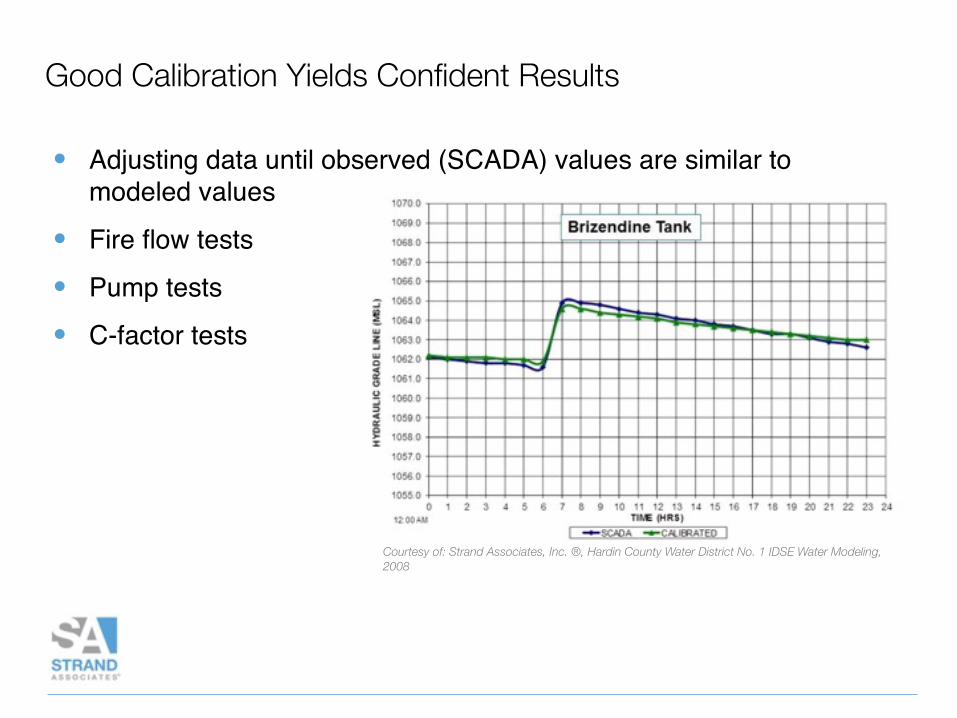
Good Calibration Yields Confident Results
• Adjusting data until observed (SCADA) values are similar to modeled values
• Fire flow tests
• Pump tests
• C-factor tests
Courtesy of: Strand Associates, Inc. ®, Hardin County Water District No. 1 IDSE Water Modeling, 2008
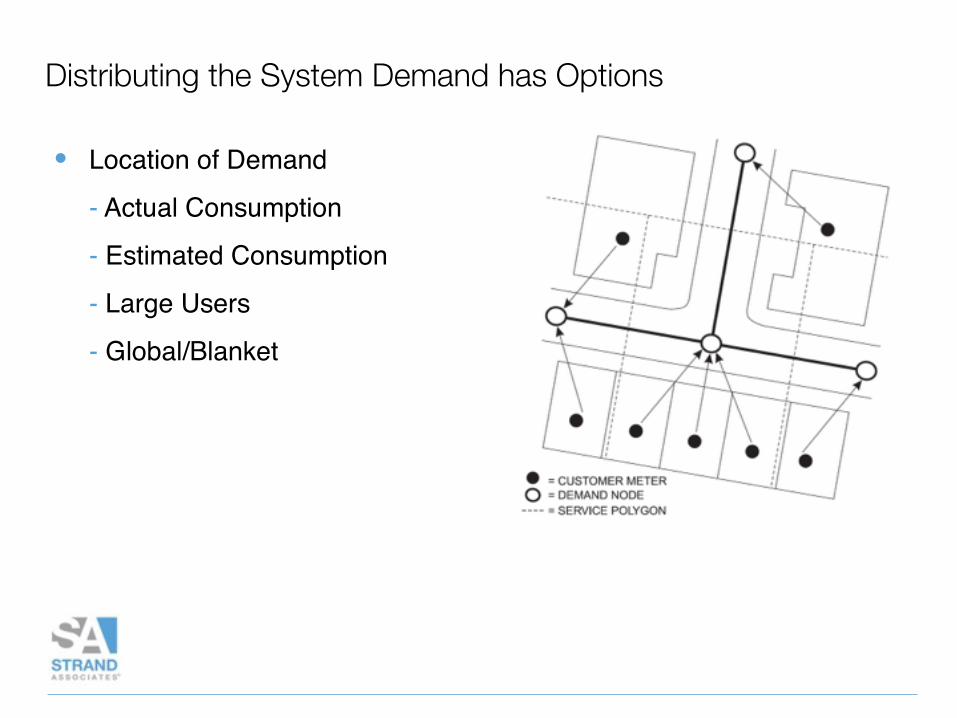
Distributing the System Demand has Options
• Location of Demand
- Actual Consumption
- Estimated Consumption
- Large Users
- Global/Blanket
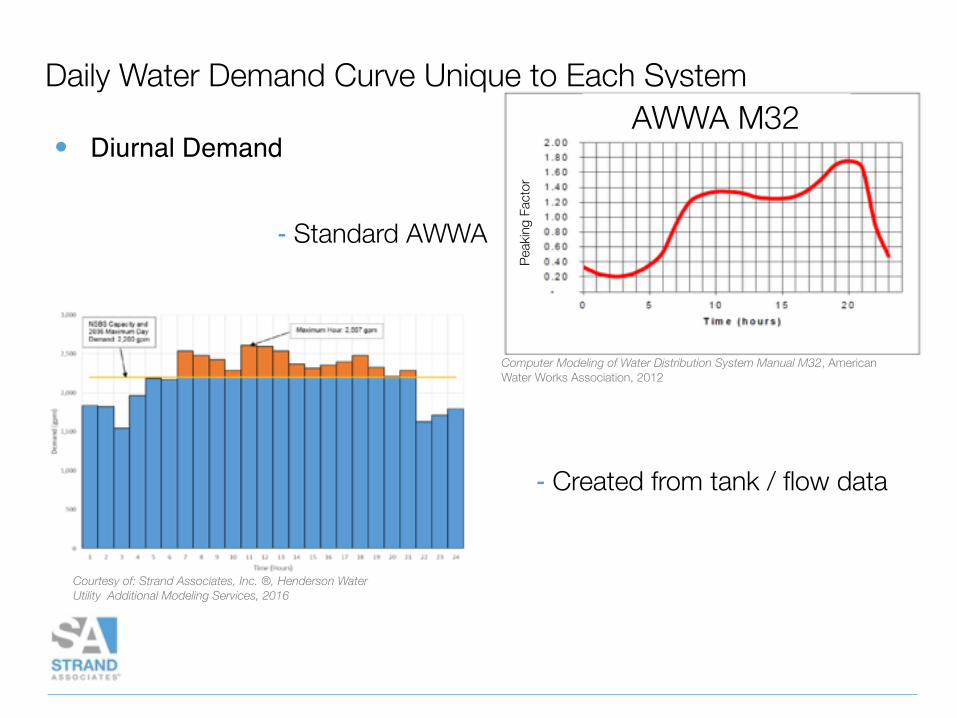
Daily Water Demand Curve Unique to Each System
• Diurnal DemandAWWA M32
Peak
ing F
acto
r
Computer Modeling of Water Distribution System Manual M32, American Water Works Association, 2012
Courtesy of: Strand Associates, Inc. ®, Henderson Water Utility Additional Modeling Services, 2016
- Created from tank / flow data
- Standard AWWA

Controls Play Big Role in Model Development
• Logical Controls – Based on System Hydraulics
• Simple Controls – Based on Time
• SCADA
Courtesy of: Strand Associates, Inc. ®, Central City River Water Pumping Station and Water Treatment Plant Expansion, 2012
Water Quality Modeling Goes Beyond System Hydraulics
• Utilizes the water model to simulate movement of water and constituents through a distribution system
• Models the growth/decay of constituents
- Water Age
- Chlorine(-amine) Residuals
- Phosphates
- DBPs
- Source Blending
- Temperature

How is Water Quality Modeling Accomplished?
• Based on conservation of mass and reaction kinetics, the following apply1:
- Advective transport in pipes
- Mixing in Storage Facilities
- Bulk Reactions
- Mixing at Pipe Junctions
1(Rossman et al. 1993)
Hydraulic Model
WQ Model
WQ Results
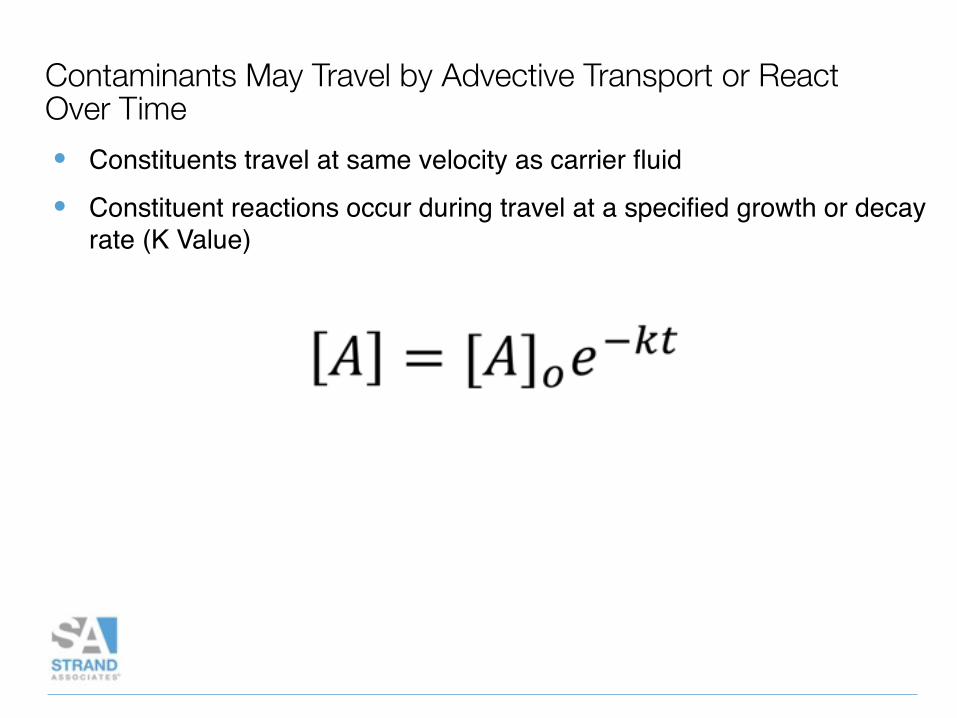
Contaminants May Travel by Advective Transport or React Over Time• Constituents travel at same velocity as carrier fluid
• Constituent reactions occur during travel at a specified growth or decay rate (K Value)
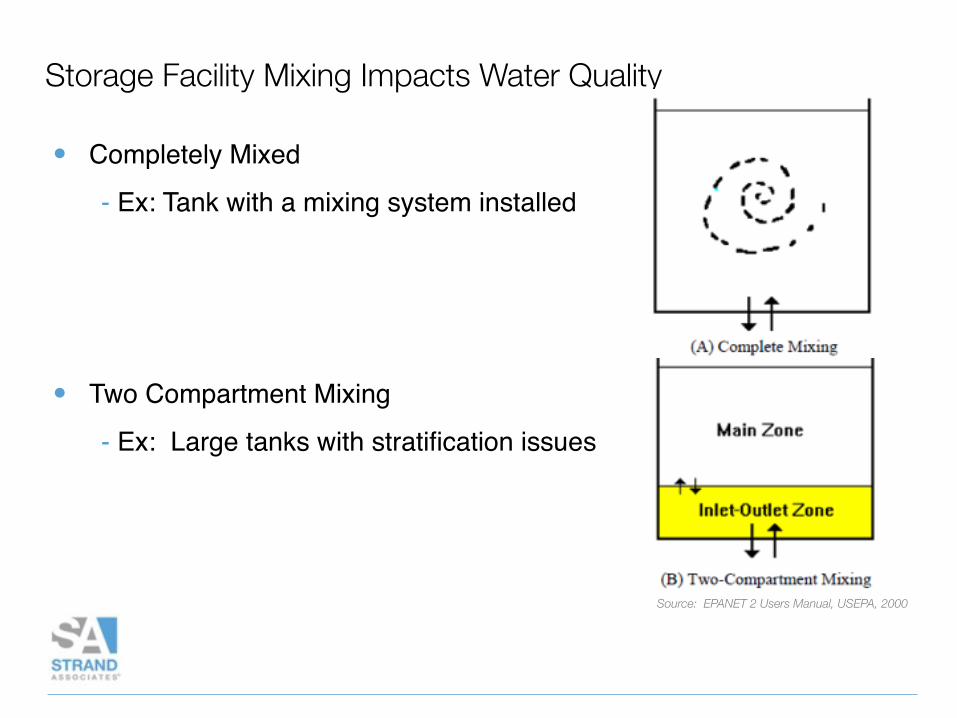
Storage Facility Mixing Impacts Water Quality
• Completely Mixed
- Ex: Tank with a mixing system installed
• Two Compartment Mixing
- Ex: Large tanks with stratification issues
Source: EPANET 2 Users Manual, USEPA, 2000
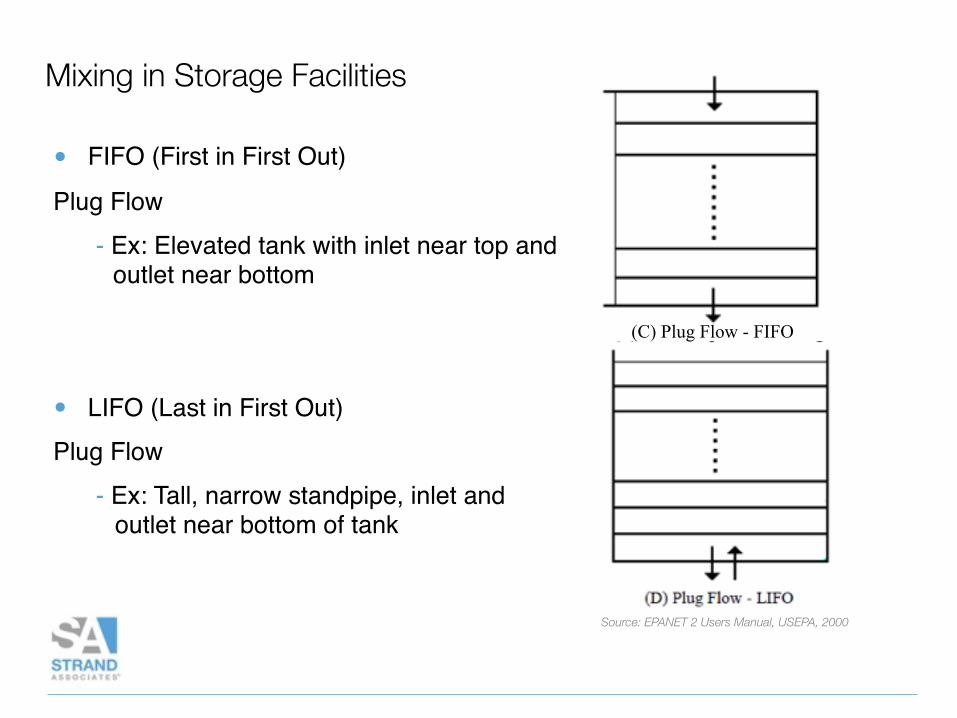
Mixing in Storage Facilities
• FIFO (First in First Out)
Plug Flow- Ex: Elevated tank with inlet near top and
outlet near bottom
• LIFO (Last in First Out) Plug Flow
- Ex: Tall, narrow standpipe, inlet and outlet near bottom of tank
Source: EPANET 2 Users Manual, USEPA, 2000
(C) Plug Flow - FIFO
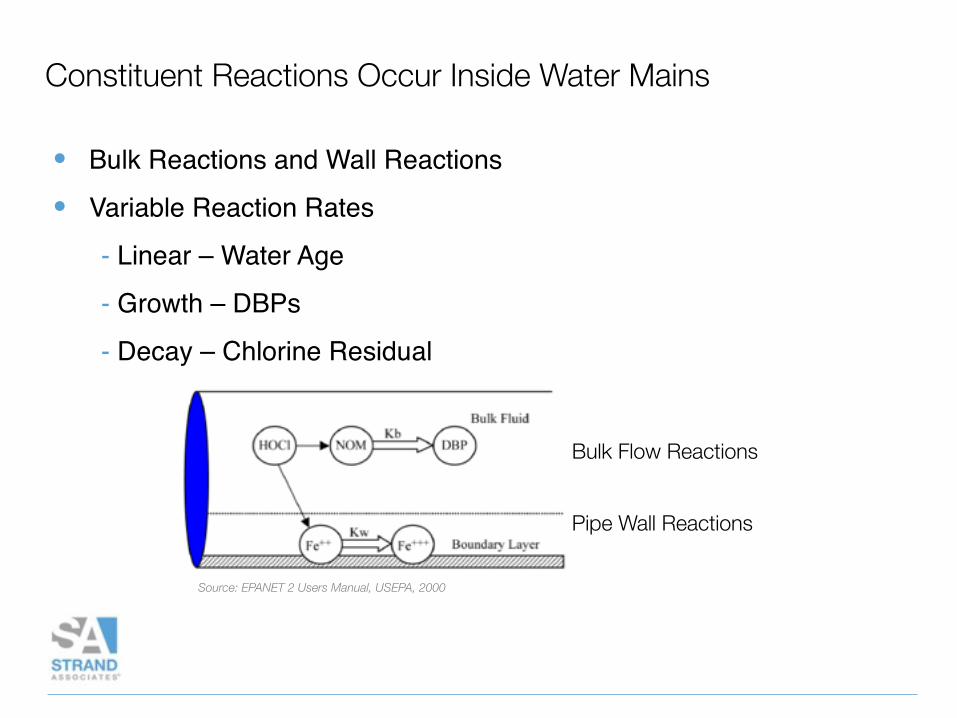
Constituent Reactions Occur Inside Water Mains
• Bulk Reactions and Wall Reactions
• Variable Reaction Rates
- Linear – Water Age
- Growth – DBPs
- Decay – Chlorine Residual
Bulk Flow Reactions
Pipe Wall Reactions
Source: EPANET 2 Users Manual, USEPA, 2000
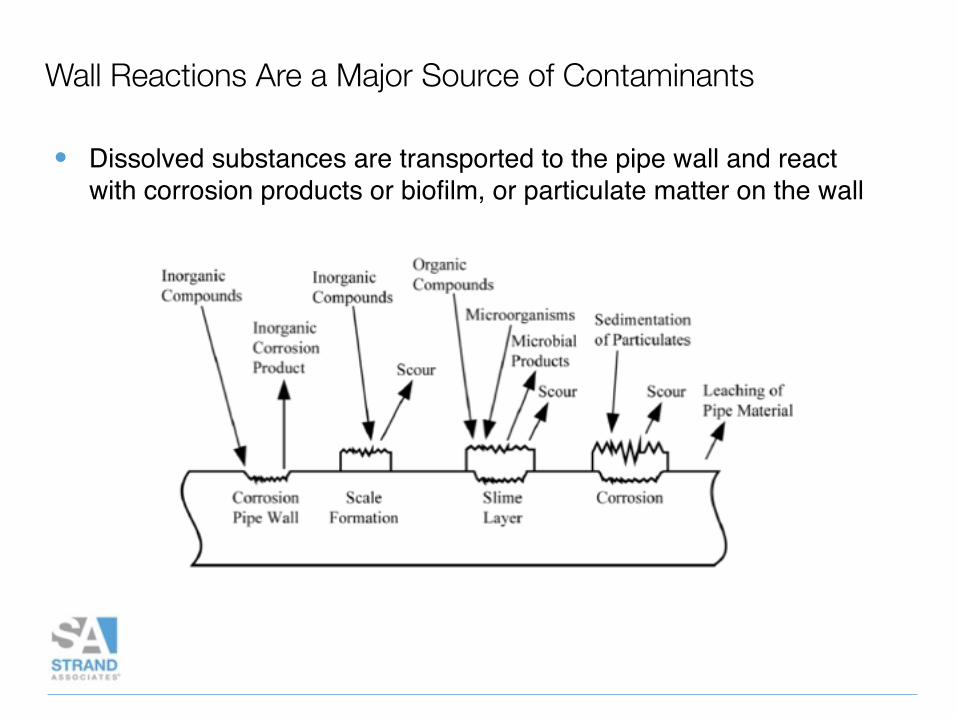
Wall Reactions Are a Major Source of Contaminants
• Dissolved substances are transported to the pipe wall and react with corrosion products or biofilm, or particulate matter on the wall
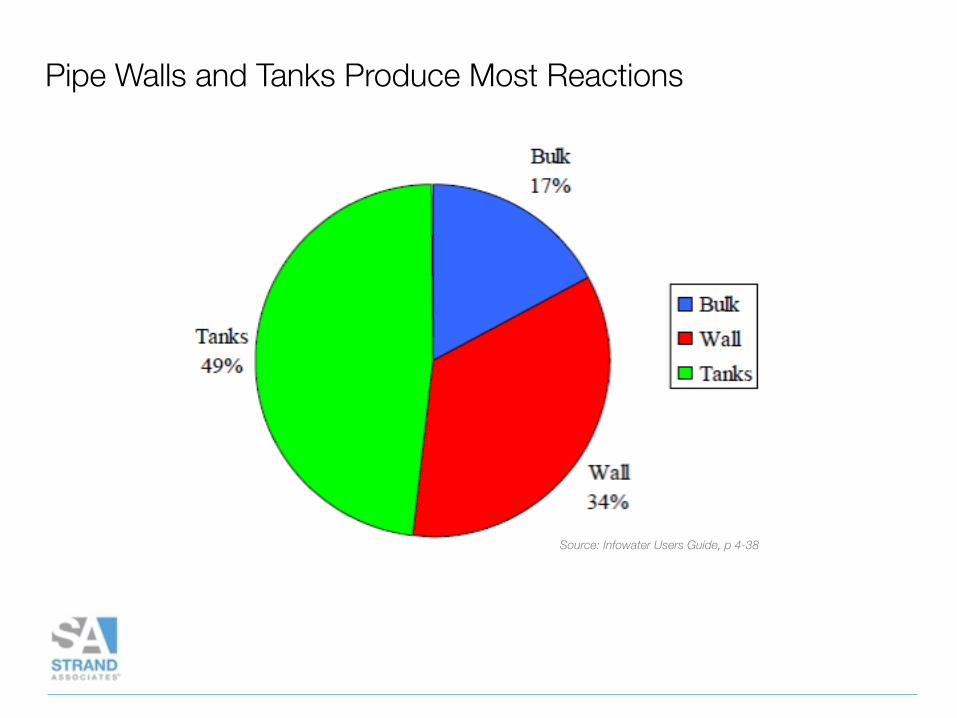
Pipe Walls and Tanks Produce Most Reactions
Source: Infowater Users Guide, p 4-38

Water Quality Model Calibration Increases Confidence
• Verification of Water Quality Results
• Constituent Residuals/Concentrations
- Compare Model Results to Actual Sample Data
• Water Age
- Tracer Study
Good System Models Return Many Financial Benefits
• Issue Resolution Cost = $0 to $?????
• Identify unintended consequences
• Prevent future issues
• Quickly review numerous alternatives
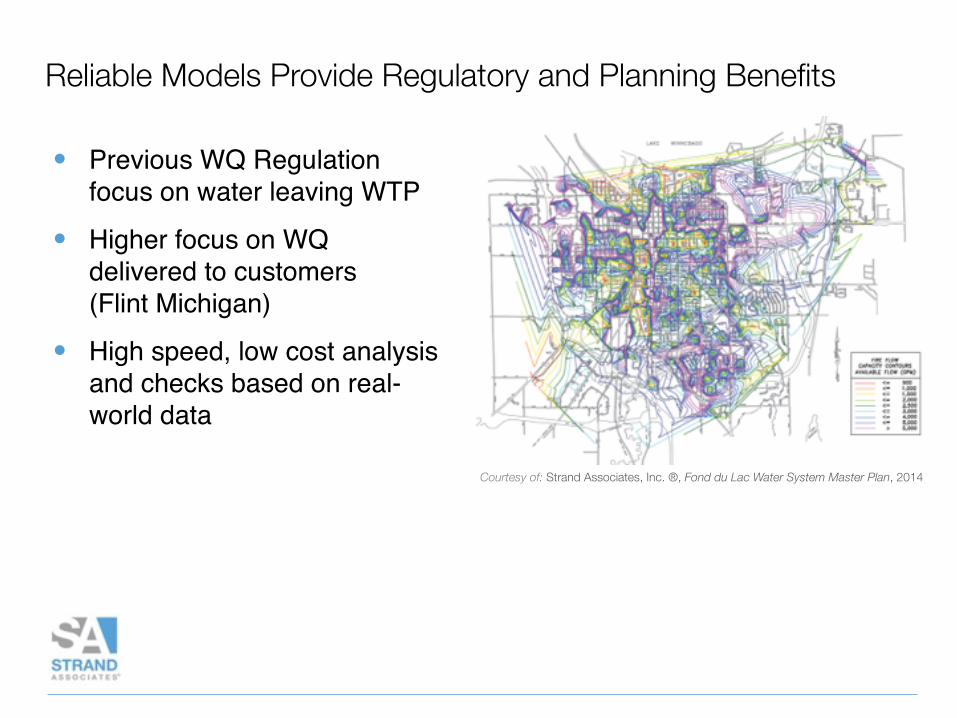
Reliable Models Provide Regulatory and Planning Benefits
• Previous WQ Regulation focus on water leaving WTP
• Higher focus on WQ delivered to customers(Flint Michigan)
• High speed, low cost analysis and checks based on real-world data
Courtesy of: Strand Associates, Inc. ®, Fond du Lac Water System Master Plan, 2014
Models Improve Success of Common WQ Resolution Strategies• Flushing Strategies
• Zone Boundary “Bleed Water” strategies
• Operational Changes
• Tank Mixing
• Appropriate Water Main Sizing
• Eliminate Dead Ends
• Modeling Case Studies
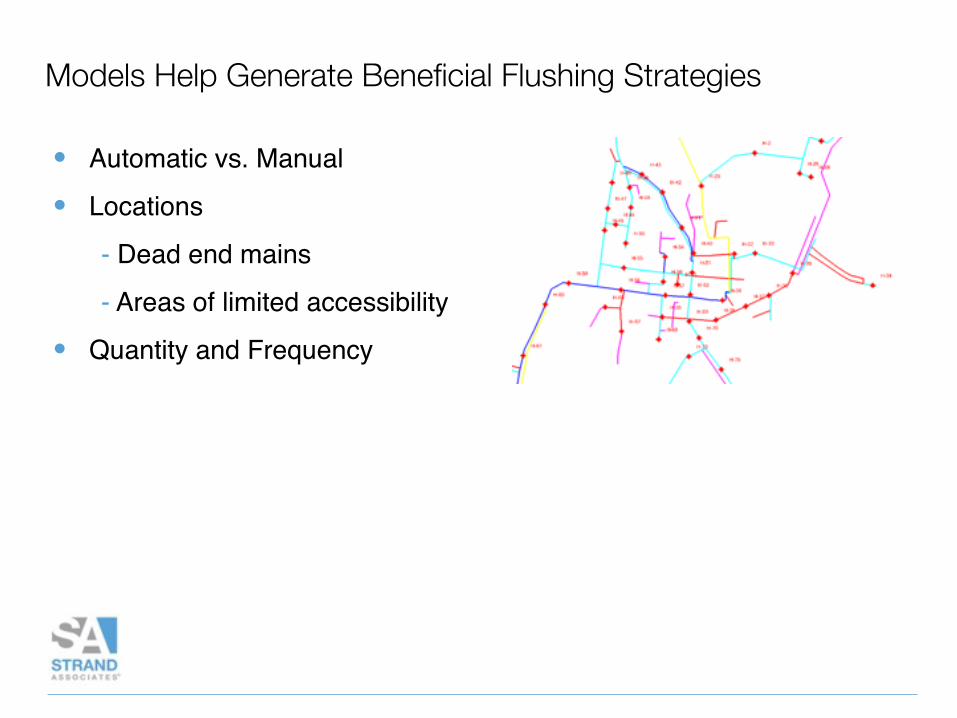
Models Help Generate Beneficial Flushing Strategies
• Automatic vs. Manual
• Locations
- Dead end mains
- Areas of limited accessibility
• Quantity and Frequency
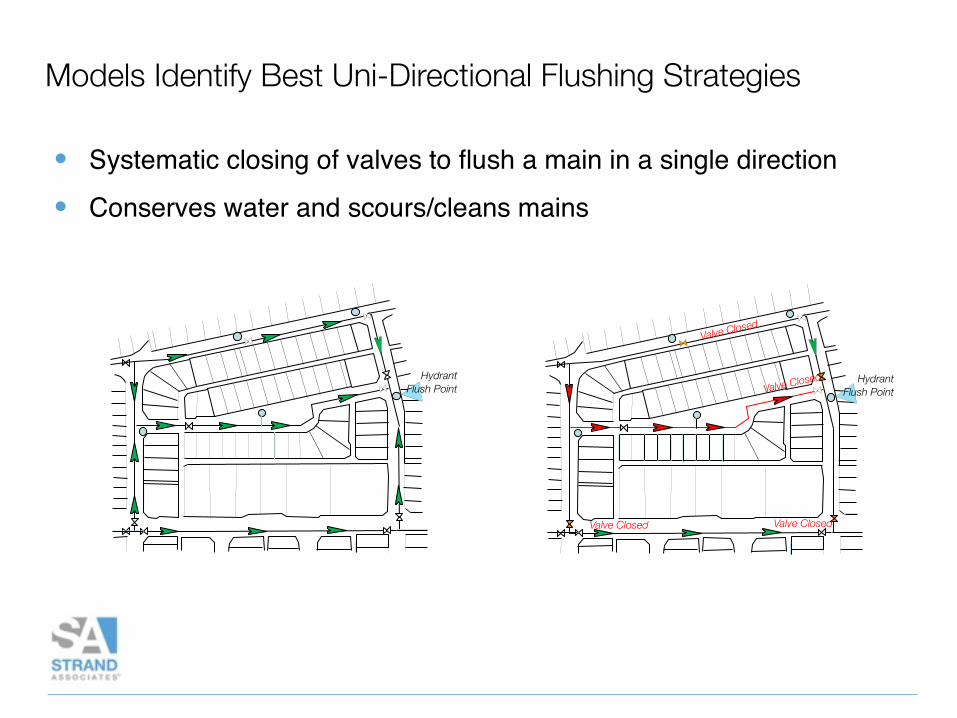
Models Identify Best Uni-Directional Flushing Strategies
• Systematic closing of valves to flush a main in a single direction
• Conserves water and scours/cleans mains
Hydrant Flush Point
Valve Closed
Valve Closed
Valve Closed
Valve Closed
Hydrant Flush Point
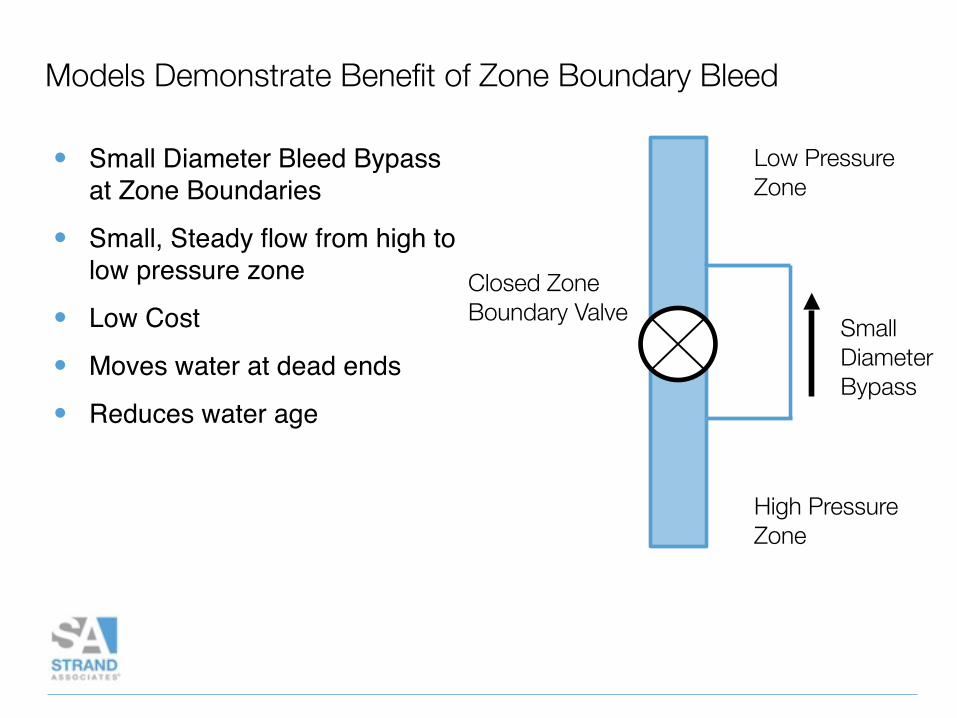
Models Demonstrate Benefit of Zone Boundary Bleed
• Small Diameter Bleed Bypass at Zone Boundaries
• Small, Steady flow from high to low pressure zone
• Low Cost
• Moves water at dead ends
• Reduces water age
Closed Zone Boundary Valve
High Pressure Zone
Low Pressure Zone
Small Diameter Bypass
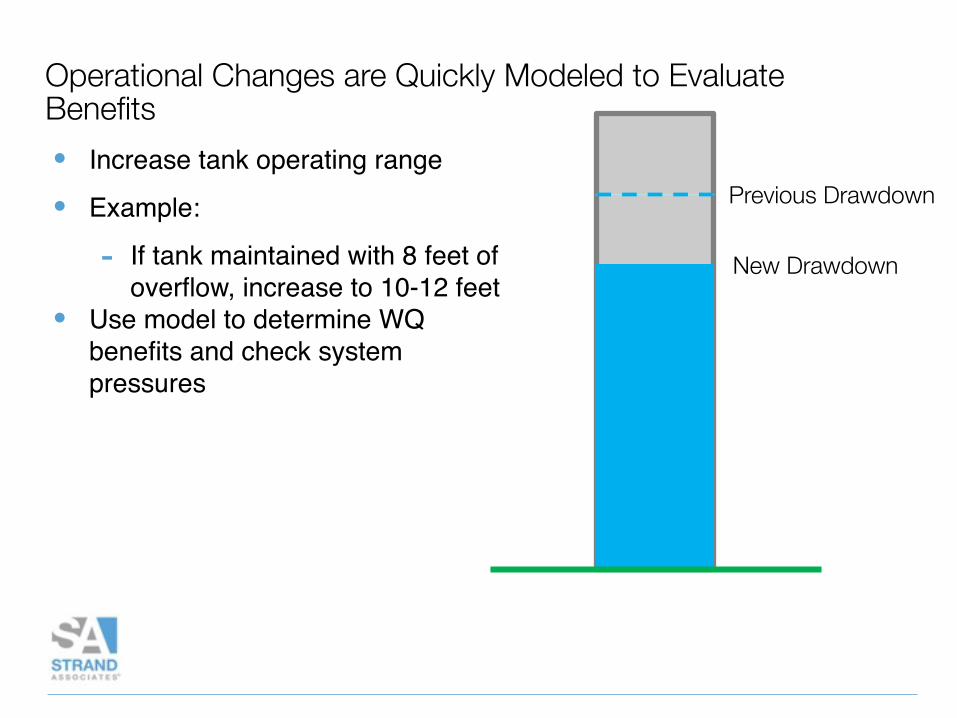
Operational Changes are Quickly Modeled to Evaluate Benefits• Increase tank operating range
• Example:
- If tank maintained with 8 feet of overflow, increase to 10-12 feet
• Use model to determine WQ benefits and check system pressures
Previous Drawdown
New Drawdown
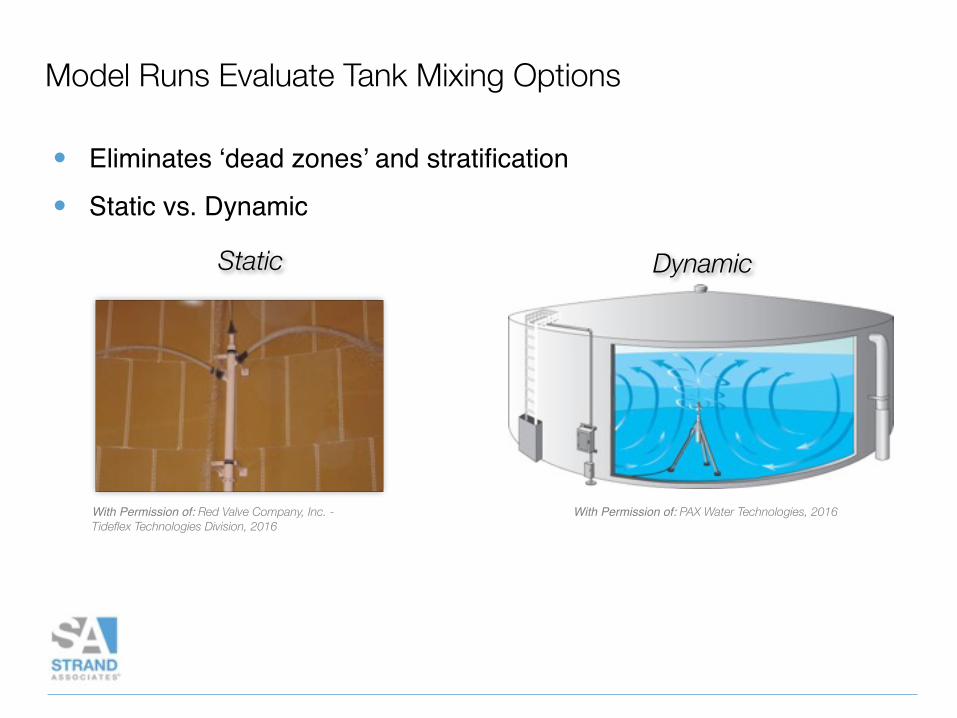
Model Runs Evaluate Tank Mixing Options
• Eliminates ‘dead zones’ and stratification
• Static vs. Dynamic
Static Dynamic
With Permission of: PAX Water Technologies, 2016With Permission of: Red Valve Company, Inc. - Tideflex Technologies Division, 2016

Modeling Water Main Size Changes Avoids Water Age Problems and Saves Money• Larger Mains are Not Always Better!
• Larger Diameter = More System Volume
• More System Volume = Higher Water Age
• Use combination of Hydraulic and WQ Modeling to Determine Size
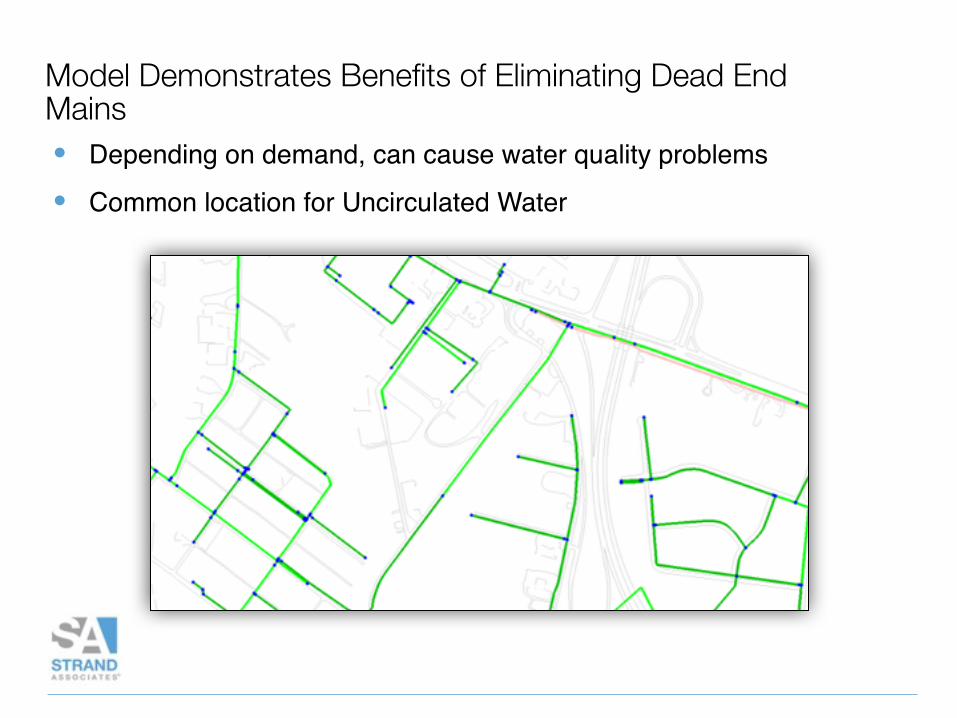
Model Demonstrates Benefits of Eliminating Dead End Mains• Depending on demand, can cause water quality problems
• Common location for Uncirculated Water
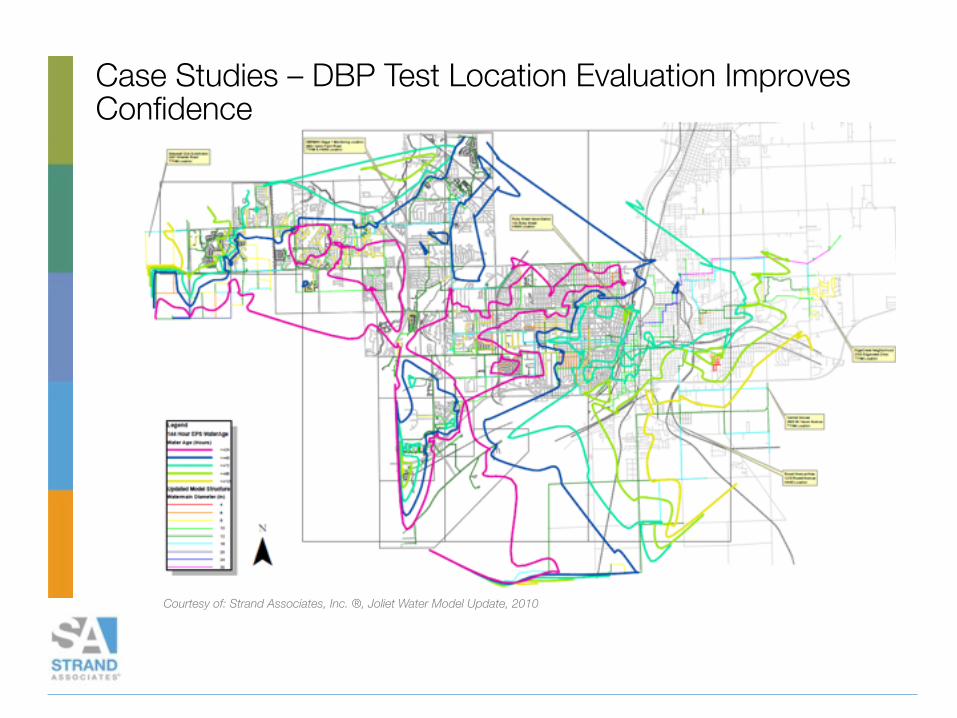
Case Studies – DBP Test Location Evaluation Improves Confidence
Courtesy of: Strand Associates, Inc. ®, Joliet Water Model Update, 2010
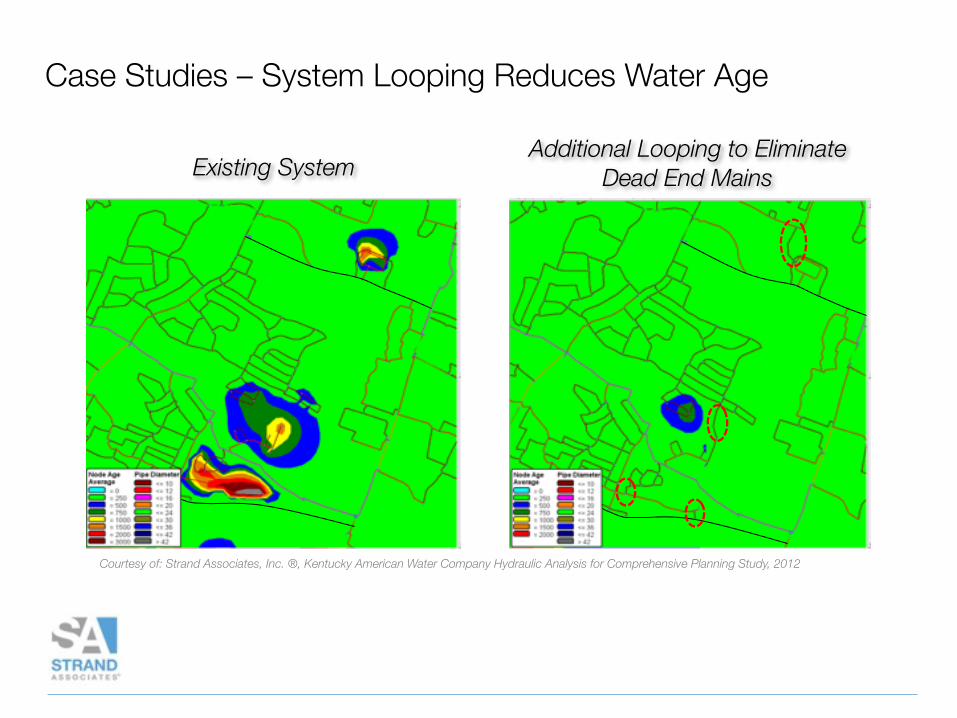
Case Studies – System Looping Reduces Water Age
Existing SystemAdditional Looping to Eliminate
Dead End Mains
Courtesy of: Strand Associates, Inc. ®, Kentucky American Water Company Hydraulic Analysis for Comprehensive Planning Study, 2012

Case Studies – Modeled Looping Demonstrates Improvements to Water Age
Existing System Additional Looping to Eliminate Dead End Mains
Courtesy of: Strand Associates, Inc. ®, Harrison County Water Association Water Distribution Disinfection Byproducts Analysis, 2014
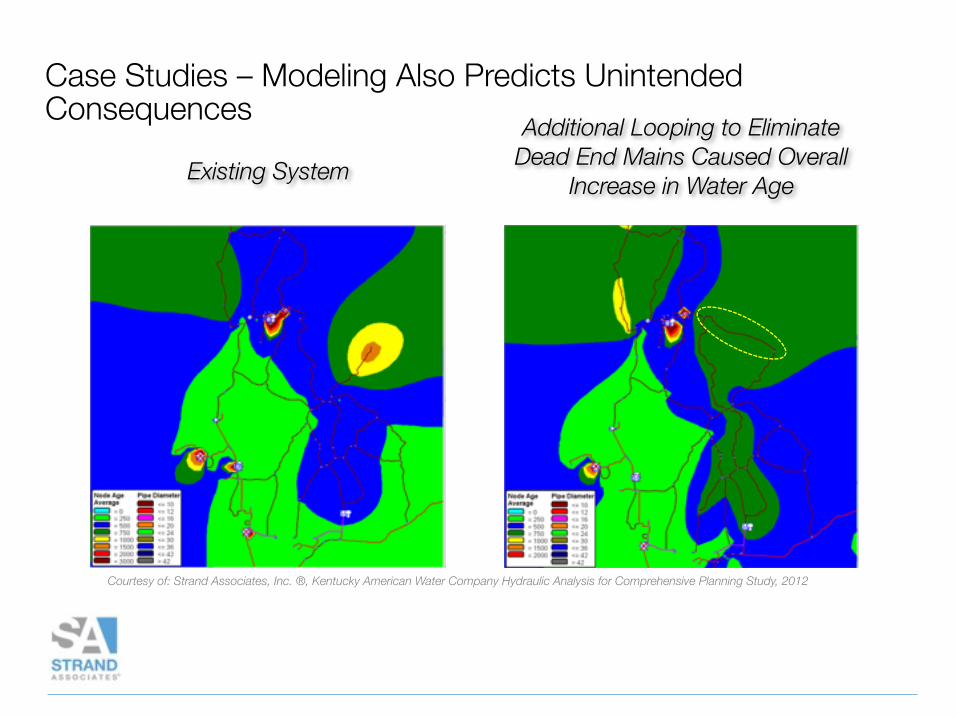
Case Studies – Modeling Also Predicts Unintended Consequences
Existing System
Additional Looping to Eliminate Dead End Mains Caused Overall
Increase in Water Age
Courtesy of: Strand Associates, Inc. ®, Kentucky American Water Company Hydraulic Analysis for Comprehensive Planning Study, 2012
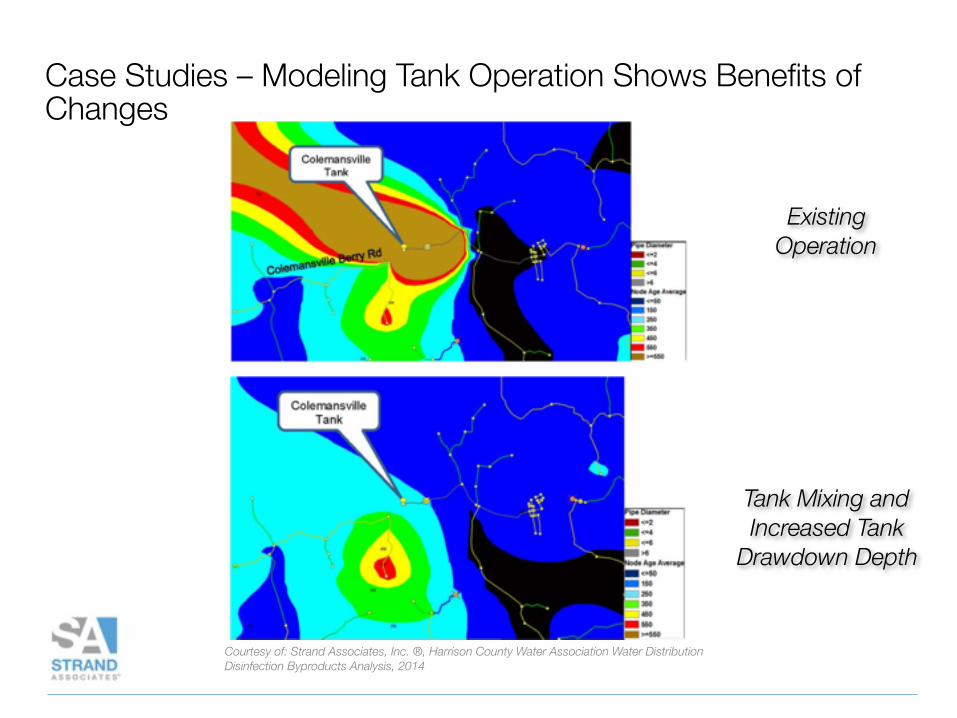
Case Studies – Modeling Tank Operation Shows Benefits of Changes
Existing Operation
Tank Mixing and Increased Tank
Drawdown Depth
Courtesy of: Strand Associates, Inc. ®, Harrison County Water Association Water Distribution Disinfection Byproducts Analysis, 2014
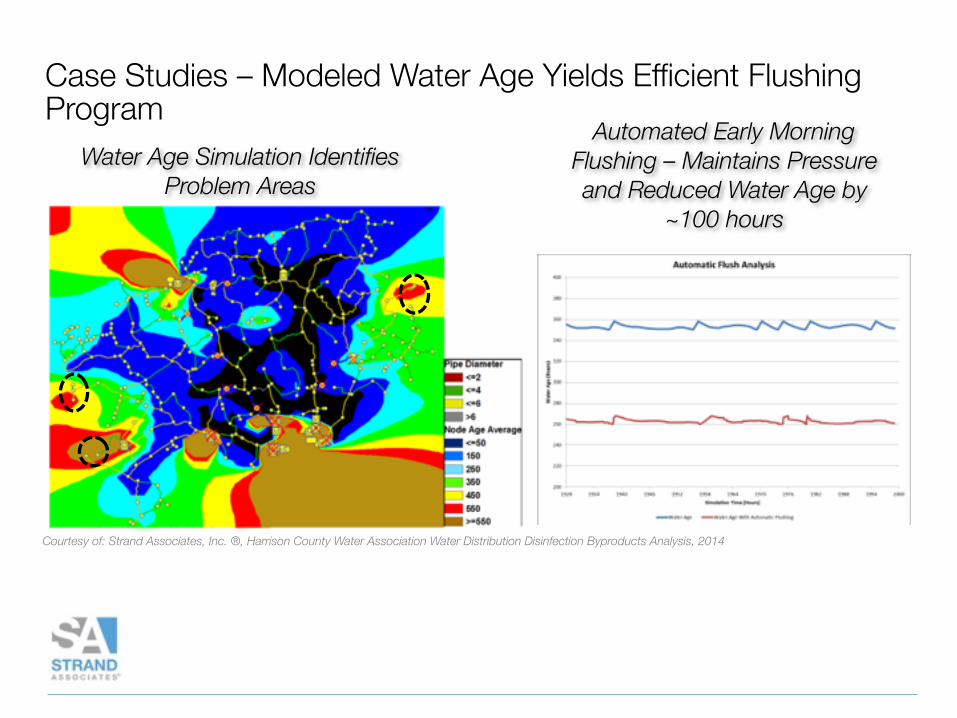
Case Studies – Modeled Water Age Yields Efficient Flushing Program
Water Age Simulation Identifies Problem Areas
Automated Early Morning Flushing – Maintains Pressure and Reduced Water Age by
~100 hours
Courtesy of: Strand Associates, Inc. ®, Harrison County Water Association Water Distribution Disinfection Byproducts Analysis, 2014
Case Studies – Model of Storage Tanks Demonstrates Benefit of Operational Changes• System with 8 ground storage tanks
• Each filled and drained 1/3 each day, labor intensive operation
• Used model to develop a Rotating Tank Cycle with 3 Groups
• Showed a simpler operation without compromising service to customers
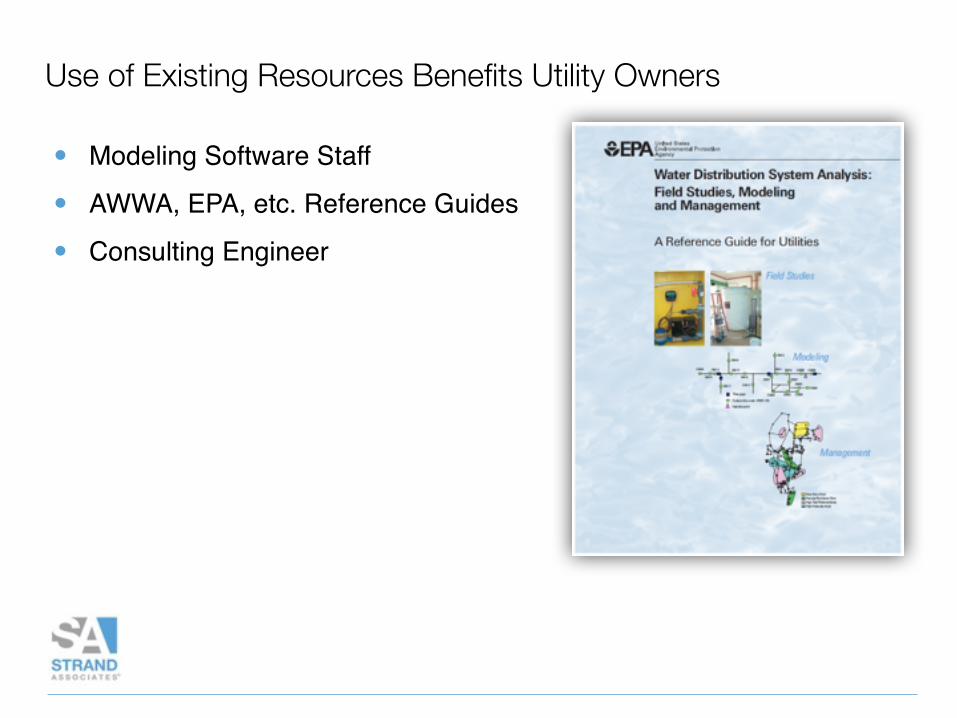
Use of Existing Resources Benefits Utility Owners
• Modeling Software Staff
• AWWA, EPA, etc. Reference Guides
• Consulting Engineer
Today’s Water System Model Predicts and Helps to Resolve Water Quality Issues
Questions?
Jim McNulty, P.G. Strand Associates, Inc.
(812) 372-9911 [email protected]

Thank you!


![Lect.No.15 (Second Semester) Water Conveyance …uotechnology.edu.iq/dep-building/LECTURE/dams and water/third_class...Water & Hydraulic Structures Branch / 3rd Class [Hydraulic Lectures]](https://img.pdfslide.us/doc/110x75/5ac370ed7f8b9a5c558bc114/lectno15-second-semester-water-conveyance-and-waterthirdclasswater.jpg)


![Water and Hydraulic rdStructures Branch/3 Class Hydraulic Structures … and... · 2018-01-19 · Water and Hydraulic rdStructures Branch/3 Class [Hydraulic Structures] ... pipe must](https://img.pdfslide.us/doc/110x75/5b7b13707f8b9abf2d8d73c9/water-and-hydraulic-rdstructures-branch3-class-hydraulic-structures-and.jpg)