Embed Size (px)
Citation preview

International Research Journal of Engineering and Technology (IRJET) e-ISSN: 2395 -0056
Volume: 03 Issue: 03 | Mar-2016 www.irjet.net p-ISSN: 2395-0072
© 2016, IRJET ISO 9001:2008 Certified Journal Page 1022
Hydraulic modeling of water supply network using EPANET
Shivalingaswami.S.Halagalimath1, Vijaykumar.H2, Nagaraj.S.Patil3
1P.G Student, Water and Land Management, Department of PG studies, VTU, Belagavi, Karnataka, India. 2Assistant professor, Water and Land Management, Department of PG Studies, VTU, Belagavi, Karnataka, India. 3Associat professor, Water and Land Management, Department of PG Studies, VTU, Belagavi, Karnataka, India.
---------------------------------------------------------------------***---------------------------------------------------------------------
Abstract - This work shows the use of EPANET software in the design of the water distribution network. EPANET is a programming tool that performs extended period simulation of hydraulic and water quality behavior within pressurized pipe networks. A network consists of links (pipes), nodes (pipe junctions), pumps, valves and storage tanks or reservoirs. EPANET imprint the flow of water in every pipe, the pressure at every node, the height of water in each tank, and the absorption of a chemical sort throughout the network, EPANET is designed to be a research tool for improving our kind of the movement and future of drinking water constituents within distribution network. It can be used for much different type of applications in distribution network study. In this paper it was used to carry out the hydraulic study of the distribution network in the study area. The collected results are verified that the pressures at all nodes and the flows with their velocities at all links are beneficial enough to provide tolerable water to the network of the study area.
Key Words: Epanet, Analysis and Water Distribution Networks
1. INTRODUCTION Water distribution system is hydraulic frameworks consisting of aspect such as are pipes, tanks reservoirs pumps and valves etc. It is necessary to supply water to the public; efficient water supply is of foremost importance in designing a new water distribution network or in spanning the existing one. It is also necessary to investigate and establish a good network ensuring sufficient head. Determination of flows and pressure head in network pipes has been of great amount and concern for those winding with designs, construction and conservation of public water distribution systems. Analysis and design of pipes networks create a relatively complex problem, especially if the network rest of range of pipes as frequently occurs in water distribution systems of large urban areas. In the vacancy of significant fluid acceleration, the behaviour of a network can be determined by a continuance of even state conditions, which form a small but vital component for assessing the adequacy of a network. Such an study is needed each time changing arrangement of consumption or delivery are significant or, added features such as cater of water, extension of booster pumps, pressure regulating valves or
storage tanks, change the system. This study aimed at performing the hydraulic analysis of Bagalkot (Navanagar) sector number 64, 65 and 66 water distribution network using Epanet.
2. Study Area Bagalkot is a city situated in the northern part of the Karnataka India. Geographically, it is situated at the co-ordinates 16.18°N 75.7°E , and located along the banks of the River Ghataprabha, it’s have at an average elevation of 533 meters above sea level. Due to construction of Almatti reservoir, effect of back water of this reservoir some half of the city has been submerged. This place is shifted to new area called Navanagar; the city Bagalkot is the Asia’s largest area which is rehabilited.
3. METHODOLOGY 3.1 Data requirement
The data used for this study are; contour map, road network map, water demand, population, and also finally EPANET software.
3.2 Methodology The total demand was obtained after including the
population of the study area as 13104, also the study area comes under the urban settlement, as a result of this development, the standards from the Central Public Health Environment Engineering Organisation manual on water demand was used, for this study 135 L/C/D is considered. The demand is calculated at particular junction by (the total fifty percent of length of pipe which meets the particular node multiplied by demand factor). After that, the following steps were carried to analyse the hydraulic modelling of the water distribution network: 1. Import input base map from the auto cad. For complex networks can also use software called epacad. 2. Edit the properties of each links, node, and tanks such as diameter, length of pipe, elevation, base demand, staging height e.t.c. respectively. 3. Select a set of analysis options 4. Run a hydraulic analysis
International Research Journal of Engineering and Technology (IRJET) e-ISSN: 2395 -0056
Volume: 03 Issue: 03 | Mar-2016 www.irjet.net p-ISSN: 2395-0072
© 2016, IRJET ISO 9001:2008 Certified Journal Page 1023
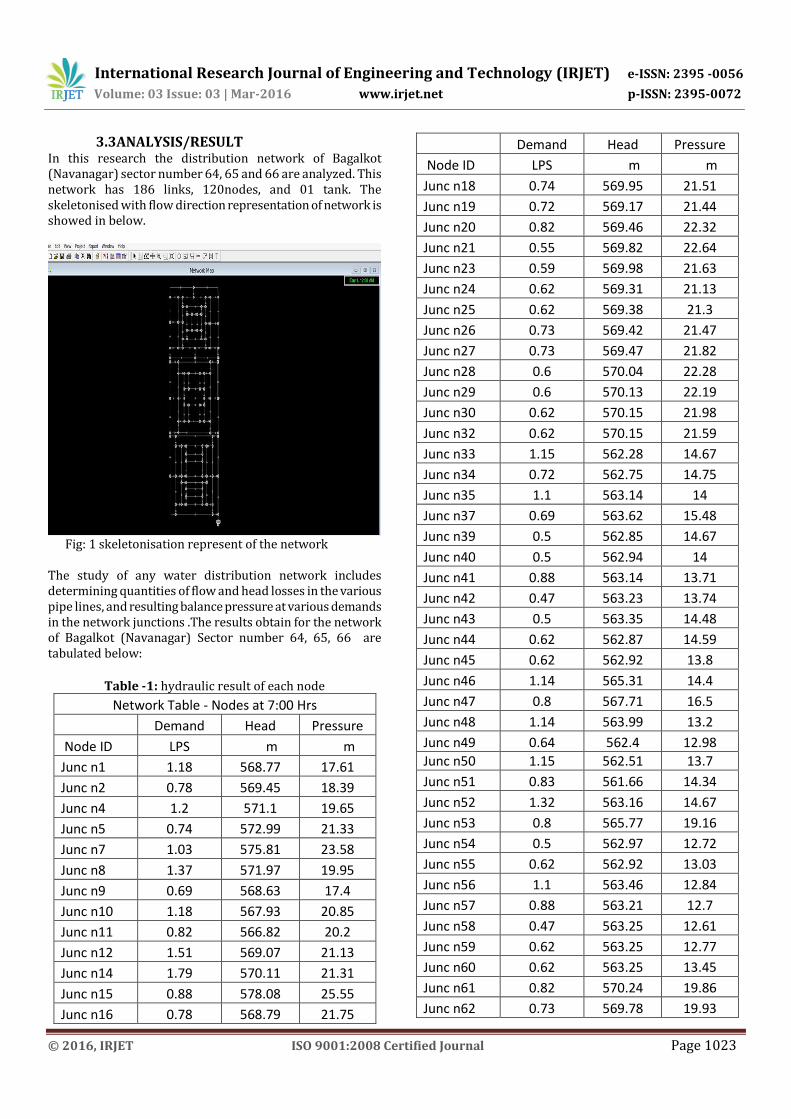
3.3ANALYSIS/RESULT In this research the distribution network of Bagalkot (Navanagar) sector number 64, 65 and 66 are analyzed. This network has 186 links, 120nodes, and 01 tank. The skeletonised with flow direction representation of network is showed in below.
Fig: 1 skeletonisation represent of the network The study of any water distribution network includes determining quantities of flow and head losses in the various pipe lines, and resulting balance pressure at various demands in the network junctions .The results obtain for the network of Bagalkot (Navanagar) Sector number 64, 65, 66 are tabulated below:
Table -1: hydraulic result of each node
Network Table - Nodes at 7:00 Hrs
Demand Head Pressure
Node ID LPS m m
Junc n1 1.18 568.77 17.61
Junc n2 0.78 569.45 18.39
Junc n4 1.2 571.1 19.65
Junc n5 0.74 572.99 21.33
Junc n7 1.03 575.81 23.58
Junc n8 1.37 571.97 19.95
Junc n9 0.69 568.63 17.4
Junc n10 1.18 567.93 20.85
Junc n11 0.82 566.82 20.2
Junc n12 1.51 569.07 21.13
Junc n14 1.79 570.11 21.31
Junc n15 0.88 578.08 25.55
Junc n16 0.78 568.79 21.75
Demand Head Pressure
Node ID LPS m m
Junc n18 0.74 569.95 21.51
Junc n19 0.72 569.17 21.44
Junc n20 0.82 569.46 22.32
Junc n21 0.55 569.82 22.64
Junc n23 0.59 569.98 21.63
Junc n24 0.62 569.31 21.13
Junc n25 0.62 569.38 21.3
Junc n26 0.73 569.42 21.47
Junc n27 0.73 569.47 21.82
Junc n28 0.6 570.04 22.28
Junc n29 0.6 570.13 22.19
Junc n30 0.62 570.15 21.98
Junc n32 0.62 570.15 21.59
Junc n33 1.15 562.28 14.67
Junc n34 0.72 562.75 14.75
Junc n35 1.1 563.14 14
Junc n37 0.69 563.62 15.48
Junc n39 0.5 562.85 14.67
Junc n40 0.5 562.94 14
Junc n41 0.88 563.14 13.71
Junc n42 0.47 563.23 13.74
Junc n43 0.5 563.35 14.48
Junc n44 0.62 562.87 14.59
Junc n45 0.62 562.92 13.8
Junc n46 1.14 565.31 14.4
Junc n47 0.8 567.71 16.5
Junc n48 1.14 563.99 13.2
Junc n49 0.64 562.4 12.98
Junc n50 1.15 562.51 13.7
Junc n51 0.83 561.66 14.34
Junc n52 1.32 563.16 14.67
Junc n53 0.8 565.77 19.16
Junc n54 0.5 562.97 12.72
Junc n55 0.62 562.92 13.03
Junc n56 1.1 563.46 12.84
Junc n57 0.88 563.21 12.7
Junc n58 0.47 563.25 12.61
Junc n59 0.62 563.25 12.77
Junc n60 0.62 563.25 13.45
Junc n61 0.82 570.24 19.86
Junc n62 0.73 569.78 19.93

International Research Journal of Engineering and Technology (IRJET) e-ISSN: 2395 -0056
Volume: 03 Issue: 03 | Mar-2016 www.irjet.net p-ISSN: 2395-0072
© 2016, IRJET ISO 9001:2008 Certified Journal Page 1024
Demand Head Pressure
Node ID LPS m m
Junc n64 0.6 570.29 20.37
Junc n65 0.6 570.29 20.26
Junc n66 0.72 569.48 19.04
Junc n67 0.62 569.43 19.57
Junc n68 0.62 569.43 19.51
Junc n69 0.73 569.48 19.74
Junc n70 0.72 562.86 13.73
Junc n71 0.56 562.89 14.01
Junc n72 0.62 562.89 14.15
Junc n74 0.69 564.08 13.17
Junc n75 0.5 563.34 12.69
Junc n76 0.62 563.3 13.05
Junc n77 0.7 563.3 14.01
Junc n79 0.59 571.72 20.92
Junc n81 0.62 570.76 20.47
Junc n83 0.62 570.37 20.27
Junc n84 1.64 559.98 14.87
Junc n85 0.71 559.99 14.23
Junc n86 0.69 559.99 14.88
Junc n87 1.11 560.04 13.96
Junc n88 0.76 560.21 13.13
Junc n89 0.54 559.99 14.8
Junc n90 0.52 560 14.54
Junc n91 0.63 560.04 13.73
Junc n92 0.5 560.07 13.4
Junc n93 0.54 560.19 12.96
Junc n94 0.57 560 14.24
Junc n95 0.49 560 13.78
Junc n96 0.49 560 13.29
Junc n97 0.57 560.04 13.03
Junc n98 0.49 560 13.59
Junc n99 0.49 560 13.14
Juncn100 1.32 560.73 12.63
Juncn101 0.22 561.39 12.1
Juncn102 0.56 560.93 12.23
Juncn103 1 560.19 12.24
Juncn104 1.36 560.03 13.29
Juncn107 1.36 559.99 14.67
Juncn108 1 560.06 14.37
Juncn109 0.76 560.43 13.65
Juncn110 0.78 561.15 13.98
Demand Head Pressure
Node ID LPS m m
Juncn112 0.54 560.01 13.67
Juncn113 0.71 560.39 12.73
Juncn114 0.76 560.39 12.12
Juncn115 0.54 560.31 12.19
Juncn116 0.5 560.12 12.57
Juncn117 0.57 560.04 12.54
Juncn118 0.49 560.01 12.72
Juncn119 0.49 560 12.9
Juncn120 1.11 560.13 12.74
Juncn121 0.52 560.01 13.1
Juncn122 0.63 560.1 13.22
Juncn123 0.57 560 13.58
Juncn124 0.49 560 13.08
Juncn126 0.49 560 13.32
Junc 1 1.15 564.83 17.22
Junc 115 1.5 568.66 17.43
Junc 116 1.53 575.67 23.44
Junc 117 0.86 562.44 13.01
Junc 118 0.77 563.89 13.09
Junc 119 0.35 560.93 12.23
Junc 120 0.72 561.34 12.05
Tank 01 -91.4 581.44 13.83
Table -2: hydraulic result of each link
Network Table - Links at 7:00 Hrs
Flow Velocity Unit Head
loss Friction Factor
Link ID LPS m/s m/km
Pipe p1 -7.97 1.25 17.08 0.019
Pipe p3 -7.94 1.25 16.97 0.019
Pipe p5 29.26 1.9 22.08 0.017
Pipe p7 3.51 0.55 3.75 0.022
Pipe p8 11.33 1.78 32.78 0.018
Pipe p9 -7.19 1.13 14.12 0.02
Pipe p12 -9.91 1.56 25.57 0.019
Pipe p15 -9 1.41 21.39 0.019
Pipe p16 -3.59 0.56 3.91 0.022
Pipe p17 -4.62 0.73 6.23 0.021
Pipe p18 -3.73 0.59 4.2 0.022
Pipe p19 -2.8 0.44 2.46 0.022
Pipe p20 -7.23 1.14 14.27 0.02
Pipe p22 -2.72 0.43 2.34 0.023

International Research Journal of Engineering and Technology (IRJET) e-ISSN: 2395 -0056
Volume: 03 Issue: 03 | Mar-2016 www.irjet.net p-ISSN: 2395-0072
© 2016, IRJET ISO 9001:2008 Certified Journal Page 1025
Flow Velocity Unit Head
loss Friction Factor
Link ID LPS m/s m/km
Pipe p24 -1.58 0.25 0.86 0.024
Pipe p25 -3.18 0.5 3.11 0.022
Pipe p28 -6.02 0.95 10.16 0.02
Pipe p29 -3.63 0.57 3.98 0.022
Pipe p32 -2.1 0.33 1.44 0.023
Pipe p33 -3.27 0.51 3.29 0.022
Pipe p34 -2.39 0.38 1.84 0.023
Pipe p35 -1.43 0.23 0.71 0.025
Pipe p37 -14.09 2.21 49.08 0.018
Pipe p38 10.64 1.12 10.97 0.019
Pipe p40 1.88 0.3 1.18 0.024
Pipe p41 6.76 1.06 12.58 0.02
Pipe p42 -6.07 0.95 10.3 0.02
Pipe p43 -8.44 1.33 19 0.019
Pipe p45 2.3 0.36 1.71 0.023
Pipe p46 0.4 0.06 0.07 0.03
Pipe p47 -1.66 0.26 0.93 0.024
Pipe p49 4.92 0.77 6.99 0.021
Pipe p50 1.31 0.21 0.6 0.025
Pipe p51 -0.55 0.09 0.12 0.028
Pipe p52 -1.06 0.17 0.4 0.026
Pipe p53 -0.46 0.07 0.09 0.029
Pipe p54 0.41 0.06 0.07 0.03
Pipe p55 1.35 0.21 0.64 0.025
Pipe p56 9.91 1.56 25.58 0.019
Pipe p57 9.54 1.5 23.81 0.019
Pipe p58 8.05 1.26 17.38 0.019
Pipe p59 3.19 0.5 3.13 0.022
Pipe p60 0.87 0.14 0.28 0.027
Pipe p61 4.49 0.71 5.89 0.021
Pipe p62 4.31 0.68 5.48 0.021
Pipe p63 3.05 0.48 2.89 0.022
Pipe p64 2.82 0.44 2.49 0.022
Pipe p65 5.4 0.85 8.3 0.02
Pipe p66 2.25 0.35 1.65 0.023
Pipe p67 -1.63 0.26 0.91 0.024
Pipe p68 2.33 0.37 1.76 0.023
Pipe p69 2 0.31 1.32 0.024
Pipe p70 4.1 0.65 5 0.021
Pipe p71 6.19 0.97 10.68 0.02
Flow Velocity Unit Head
loss Friction Factor
Link ID LPS m/s m/km
Pipe p73 1.25 0.2 0.56 0.025
Pipe p74 -1.39 0.22 0.67 0.025
Pipe p75 0.04 0.01 0.01 0.064
Pipe p76 0.7 0.11 0.19 0.028
Pipe p77 1.51 0.24 0.79 0.025
Pipe p78 3.11 0.49 2.99 0.022
Pipe p79 -5.21 0.82 7.76 0.02
Pipe p83 4.64 0.73 6.27 0.021
Pipe p84 2.07 0.33 1.41 0.023
Pipe p85 -0.04 0.01 0.01 0.031
Pipe p86 -2.3 0.36 1.71 0.023
Pipe p87 -5.19 0.82 7.72 0.02
Pipe p88 -1.99 0.31 1.31 0.024
Pipe p89 -4.79 0.75 6.65 0.021
Pipe p90 -2.06 0.32 1.39 0.024
Pipe p92 -1.28 0.2 0.58 0.025
Pipe p93 -1.57 0.25 0.84 0.024
Pipe p94 -1.49 0.23 0.76 0.025
Pipe p97 4.66 0.73 6.33 0.021
Pipe p98 4.6 0.72 6.18 0.021
Pipe p99 1.63 0.26 0.9 0.024
Pipe p100 -4.69 0.74 6.39 0.021
Pipe p103 -0.29 0.05 0.04 0.032
Pipe p104 -2.14 0.34 1.5 0.023
Pipe p105 -4.13 0.65 5.05 0.021
Pipe p106 -0.37 0.06 0.06 0.031
Pipe p107 -3.22 0.51 3.19 0.022
Pipe p108 -6.55 1.03 11.86 0.02
Pipe p109 2.71 0.43 2.31 0.023
Pipe p110 -0.56 0.09 0.12 0.028
Pipe p111 -1.21 0.19 0.52 0.025
Pipe p112 -2.19 0.34 1.56 0.023
Pipe p113 -0.6 0.09 0.14 0.028
Pipe p114 -1.35 0.21 0.63 0.025
Pipe p115 -1.11 0.17 0.44 0.026
Pipe p116 -3.42 0.54 3.57 0.022
Pipe p117 -0.03 0.01 0.6 0.02
Pipe p118 -0.54 0.09 0.12 0.029
Pipe p119 -1.74 0.27 1.01 0.024
Pipe p120 -0.3 0.05 0.04 0.03

International Research Journal of Engineering and Technology (IRJET) e-ISSN: 2395 -0056
Volume: 03 Issue: 03 | Mar-2016 www.irjet.net p-ISSN: 2395-0072
© 2016, IRJET ISO 9001:2008 Certified Journal Page 1026
Flow Velocity Unit Head
loss Friction Factor
Link ID LPS m/s m/km
Pipe p123 5.09 0.8 7.46 0.021
Pipe p124 2.22 0.35 1.6 0.023
Pipe p129 -1.43 0.23 0.71 0.025
Pipe p130 -3.43 0.54 3.59 0.022
Pipe p131 -8.2 1.29 18 0.019
Pipe p132 3.01 0.47 2.82 0.022
Pipe p133 0.09 0.01 0.01 0.041
Pipe p134 1.17 0.18 0.49 0.025
Pipe p135 0.93 0.15 0.32 0.026
Pipe p136 -0.34 0.05 0.05 0.031
Pipe p137 -0.28 0.04 0.04 0.032
Pipe p138 0.24 0.04 0.03 0.032
Pipe p139 -0.87 0.14 0.28 0.027
Pipe p140 -1 0.16 0.37 0.026
Pipe p141 -5.5 0.87 8.61 0.02
Pipe p143 2.92 0.46 2.66 0.022
Pipe p144 -1.88 0.3 1.18 0.024
Pipe p145 2.91 0.46 2.64 0.022
Pipe p146 -1.05 0.17 0.4 0.026
Pipe p147 -4 0.63 4.77 0.021
Pipe p148 2.96 0.47 2.73 0.022
Pipe p149 0.49 0.08 0.1 0.029
Pipe p150 -1.81 0.28 1.1 0.024
Pipe p151 0.86 0.13 0.27 0.027
Pipe p152 0.08 0.01 0.01 0.012
Pipe p153 -0.7 0.11 0.19 0.028
Pipe p154 -1.77 0.28 1.06 0.024
Pipe p155 -2.85 0.45 2.54 0.022
Pipe p156 -0.3 0.05 0.04 0.031
Pipe p157 -2.01 0.32 1.33 0.024
Pipe p158 -0.8 0.13 0.24 0.027
Pipe p159 -4.26 0.67 5.36 0.021
Pipe p160 1.88 0.3 1.17 0.024
Pipe p161 1.84 0.29 1.13 0.024
Pipe p162 1.2 0.19 0.51 0.025
Pipe p163 0.31 0.05 0.04 0.031
Pipe p164 -0.23 0.04 0.02 0.033
Pipe p165 0.32 0.05 0.04 0.03
Pipe p167 -1.9 0.3 1.2 0.024
Pipe p168 0.38 0.06 0.06 0.03
Flow Velocity Unit Head
loss Friction Factor
Link ID LPS m/s m/km
Pipe p172 11.99 1.89 36.41 0.018
Pipe p173 17.28 2.72 71.6 0.017
Pipe p174 -17.7 2.78 74.88 0.017
Pipe p175 -39.14 3.19 65.71 0.016
Pipe p178 -4.25 0.67 5.34 0.021
Pipe 3 -0.77 0.12 0.22 0.027
Pipe 5 4.38 0.69 5.65 0.021
Pipe 6 -7.11 1.12 13.84 0.02
Pipe 7 -20.04 2.11 35.45 0.017
Pipe 9 -2.39 0.38 1.83 0.023
Pipe 10 0.56 0.09 0.13 0.028
Pipe 11 -4.22 0.66 5.27 0.021
Pipe 14 -10.11 1.59 26.52 0.019
Pipe 15 -8.46 1.33 19.08 0.019
Pipe 16 -2.8 0.44 2.46 0.022
Pipe 17 -4.54 0.71 6.01 0.021
Pipe 18 -2.07 0.32 1.4 0.023
Pipe 19 -7.62 1.2 15.72 0.019
Pipe 20 -4.02 0.63 4.81 0.021
Pipe 21 0.55 0.09 0.12 0.028
Pipe 22 0.02 0.01 0.02 0.01
Pipe 23 -0.17 0.03 0.01 0.032
Pipe 24 -11.83 1.86 35.49 0.018
Pipe 1 -24.25 1.98 27.07 0.017
Pipe p14 -40.55 2.63 40.39 0.016
Pipe 12 -16.66 2.62 66.92 0.017
Pipe 13 -91.4 4.55 94.98 0.014
Pipe 25 -10.15 1.6 26.75 0.019
Pipe 26 -4.82 0.76 6.74 0.021
Pipe 2 -0.32 0.05 0.04 0.031
Pipe 176 -16.66 2.62 66.92 0.017
Pipe 177 -16.66 2.62 66.92 0.017
Pipe 178 -8.79 1.38 20.47 0.019
Pipe 179 -5.97 0.94 10 0.02
Pipe 180 -6.07 0.95 10.32 0.02
Pipe 181 0.8 0.13 0.26 0.028
Pipe 182 6.52 1.03 11.79 0.02
Pipe 183 10.6 1.67 28.97 0.018
Pipe 184 3.81 0.6 4.35 0.021
Pipe 185 -7.28 1.14 14.44 0.019

International Research Journal of Engineering and Technology (IRJET) e-ISSN: 2395 -0056
Volume: 03 Issue: 03 | Mar-2016 www.irjet.net p-ISSN: 2395-0072
© 2016, IRJET ISO 9001:2008 Certified Journal Page 1027
Flow Velocity Unit Head
loss Friction Factor
Link ID LPS m/s m/km
Pipe 188 5.73 0.9 9.27 0.02
Pipe 189 12.47 1.96 39.14 0.018
Pipe 190 -10.56 1.66 28.8 0.018
Pipe 191 -3.28 0.51 3.29 0.022
Pipe 192 -39.04 4.11 121.88 0.016
4. CONCLUSIONS The main view of this research is to analyze the water distribution network and lookout the deficiencies (if any) in it is analysis, establishment and its usage. At the end of the analysis it was found that the resulting pressures at all the nodes and the links velocities are satisfy enough to provide water to the study area.
REFERENCES [1] Adeniran, A.E., and Oyelowo, M.A. (2013). An EPANET
Analysis of water distribution network of the University of Lagos, Journal of engineering research, volume 18, issue: 2, pp 71-83
[2] Dr. G. Venkata Ramanaa , Ch. V. S. S. Sudheerb , B.Rajasekharc ( 2015 ) “Network analysis of water distribution system in rural areas using EPANET” 13th Computer Control for Water Industry Conference, CCWI 2015
[3] Samiu A(July 2013) “Design of NDA Water Distribution Network Using EPANET” International Journal of Emerging Science and Engineering (IJESE)ISSN: 2319–6378, Volume-1, Issue-9.
[4] Waikham, S.I., and Mehta, J.D. (2015). “Optimization of Limayat zone water distribution system using EPANET”, IRJET, Volume 2, issue: 04, pp1494-1498.
[5] Cross, H. (1936). “Analysis of flow in networks of conduits or Conductors.” Engineering Experiment Station, University of Illinois, Bulletin No. 286
[6] McPherson M.B.~ E.C. Bolls, Jr., D.A. Brock, E.B. Cobb, H.A.Cornell, J.E. Flack, F. Holden, F.P. Linaweaver, Jr., R.C.
McWhinnie, J.C. Neill, and R.V. Alson, Priorities in distribution research and applied development needs, J.Amer. Water Works Association, 66(9), 507 - 509, 1974.
[7] Shamir U., and C.D. Howard, Water distribution system analysis, J.Hydraulics Dfv., Proc. Amer. Soc. Civil Engineers, 94 (HYl),219-234, 1968.K. Elissa, “Title of paper if known,” unpublished.
[8] Cross, H. (1936). “Analysis of flow in networks of conduits or Conductors.” Engineering Experiment Station, University of Illinois,Bulletin No. 286
[9] Rossman, L.A. (1993). “EPANET, Users Manual.” Risk ReductionEngineering Laboratory, U.S. Environmental Protection Agency,Cincinnati,Ohio.
[10] Mays, L.W. (2000). Water Distribution System Handbook, L. W.Maysed.,McGraw Hill, New York. Pg409 - 482, pg 469.
BIOGRAPHIES
Mr. Shivalingaswami .S .Halagalimath is
currently in pursuance of his Master's degree
in Water and Land Management, Department
of P.G. Studies, VTU, Belagavi. He has broadly
worked on Hydraulic modeling of water
distribution system using EPANET. His research interests on
Water Quality modeling and Hydraulic modeling for different
area in Karnataka.
Mr.Vijaykumar.H is now working as assistant
professor, Water and Land Management,
Department of P.G Studies, VTU, Belagavi. He
has two Years of experience in teaching field.
Dr.Nagaraj.S.Patil is presently working as
associate Professor, Water & Land
Management, Department of P.G. Studies,
VTU, and Belagavi. He has 12 years
experience in teaching field and guiding Ph.D.
students in the field of Water resource and Environmental
Engineering. He is professional membership in MISTE