Embed Size (px)
Citation preview
Journal of Earth Sciences and Geotechnical Engineering, vol. 3, no. 4, 2013, 125-145
ISSN: 1792-9040 (print), 1792-9660 (online)
Scienpress Ltd, 2013
Hydraulic Conductivity Measurement of Compacted Clay
Soil Liners for Waste Containment Structures
Putera Agung1, Budi Damianto2 and Sony Pramusandi3
Abstract
Method for in situ measurement of hydraulic conductivity (k) has been developed and
procedures for laboratory testing have been modified. Method and procedure are aimed to
obtain the significant hydraulic conductivity value and to avoid the effects of cracks or
dmax)
from standard and modified compaction test (ASTM D 698 – 91). Each test result uses a
sample taken from dry side; wet side and on optimum moisture content (wopt) or OMC.
First of all before the falling head test (ASTM D 1804 – 02/ASTM 180485 – 03) uses the
leachate liquid (Pondok Rajeg landfill), a solution of 0.005 CaSO4 is flown through the
sample and the hydraulic gradient equals 200. Hydraulic conductivity measurement of the
falling head test using a leachate liquid starts from the pore volume of flow > 2 until the
constant of hydraulic conductivity values is obtained. From the test results, the samples of
3” have hydraulic conductivity value in the range 10-10 to 10-9 cm/sec, and the samples of
10” have a range between 10-8 and 10-7 cm/sec. Generally, the research concludes that the
magnification of sample size influences hydraulic conductivity values on each falling
head test.
Keywords: Clay soil liner, leachate, falling head test, hydraulic conductivity.
1 Introduction
Compacted fine-grained soils (e.g. clay) are widely used as soil liners and cover the floor
of waste containment structures or landfills. The primary purpose is to minimize some
contamination to the natural ground water caused by the leachate permeation. The
hydraulic conductivity value of compacted clay liner is extremely importance (Daniel,
1987). A solid clay liner must have hydraulic conductivity values that are sufficiently low.
Measurements must be performed using the laboratory test on specimens or samples taken
from field, or using the large – scale measurement for in situ test techniques. Tests can be
1Civil Engineering – Politeknik Negeri Jakarta. 2Civil Engineering – Politeknik Negeri Jakarta. 3Civil Engineering – Politeknik Negeri Jakarta.

126 Putera Agung, Budi Damianto and Sony Pramusandi
conducted on the previous construction or prior to construction.
Several studies from literature shows that the hydraulic conductivity values of compacted
soil are influenced significantly by volume or dimension of block samples (Daniel, 1984;
Day and Daniel, 1985; Elsbury et al, 1988). From these studies, the measurements on
small samples produces the hydraulic conductivity values lower than the measurements
obtained from big samples. The measurement results on small sample also indicate the
values lower than the values of the large – scale of in situ test results. It can be concluded
that the measurements on small – samples cannot represent the existing field condition.
The article presents a logical alternative to conduct the measurement hydraulic
conductivity using the standard laboratory tests on the big enough of samples size to
simulate the existing field conditions. Laboratory tests can be performed rapidly and the
data results obtained more accurate. Furthermore, methods to perform standard laboratory
tests can be developed from the standard to ensure consistency of laboratory data results
through the Falling Head Test (ASTM D 1804-02/ASTM 180485-03). This research has
modified the Falling Head Test to measure the hydraulic conductivity from clay liner
samples. The research study has selected 2 (two) sizes or dimensions of the clay liner
samples, where they can be compared each other in the later. The study uses a sample of
clay liner diameter of 3” with the thickness of 1.0 cm and a diameter 10” with the
thickness 8.0 cm.
2 Background
2.1 Discrepancies Data Results of Hydraulic Conductivity Test
Daniel (1984) conducted and compared data results of hydraulic conductivity values in
laboratory using the different volume or dimension samples. Daniel (1984) found that
hydraulic conductivity values from big sample were generally reaching 10 to 1000 times
larger than small sample. Based on these results, Daniel (1984) concluded that main
problem relating with laboratory hydraulic conductivity tests on small samples is inability
to detect distribution of cracks; soft fissures at the time of test.
Day and Daniel (1985) concluded that hydraulic conductivity values from the big samples
were controlled by macro pores that were located between porous stone or sand and clay
samples. Elsbury et al (1988) also showed that the hydraulic conductivity from the larger
samples could reach values 4 to 5 times than hydraulic conductivity values measured in
small samples.
2.2 Similarities Data Results of Hydraulic Conductivity Test
Several investigators (Lahti et al (1987); Reades et al (1990); Gordon et al (1989);
Johnson et al (1990)) also observed the relationship between small and big sample on the
hydraulic conductivity at laboratory works. They found that generally, the previous
research results produce a wide variation of relationship between small and big samples
used on the laboratory testing.
2.3 Current Laboratory Works for Hydraulic Conductivity Test
The objective of current research study is also to control the quality Falling Head test

Hydraulic Conductivity of Compacted Clay Soil Liners 127
(ASTM D 1804 – 02/ASTM 180485 – 03) to measure the hydraulic conductivity from
laboratory tests. All samples are compacted using devices or tools of standard or modified
compaction test.
3 Testing Procedures
Experiments are conducted on samples with diameter 3” and thickness 1.0 cm; and
diameter 10” and thickness 8.0 cm, respectively. All test samples are conducted in the
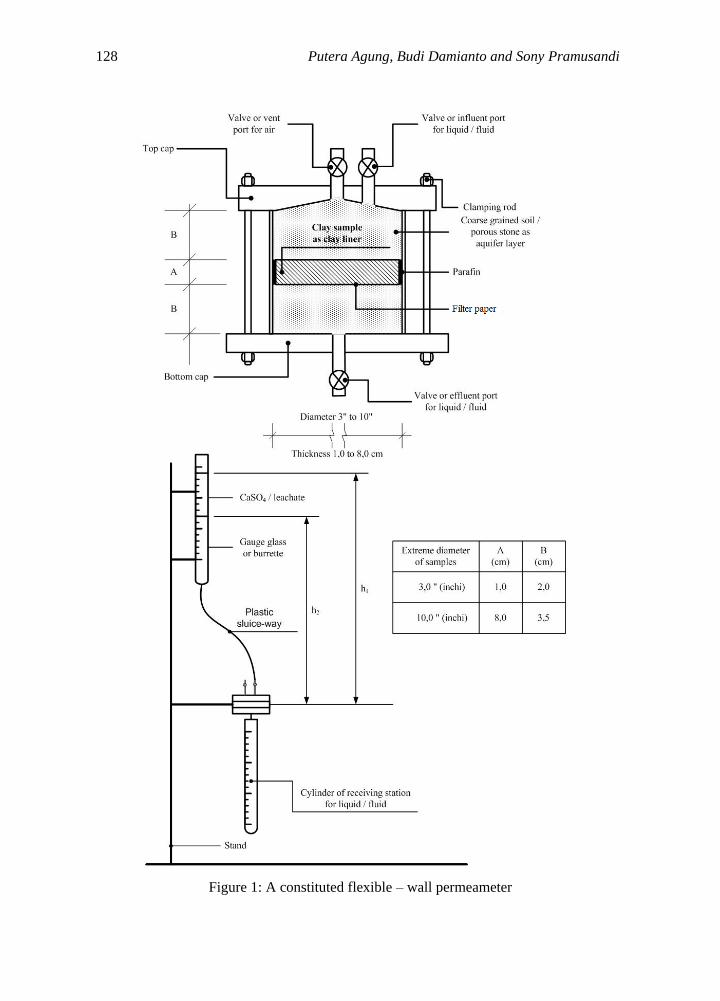
laboratory using a constituted flexible – wall permeameter as shown as in Fig. 1.
3.1 Laboratory Test
The soil properties of samples are evaluated by general standard testing for fine grained
dmax) and optimum moisture content (OMC) or (wopt) was determined
by standard compaction test and both the data results were compared to the data result
from the modified compaction test; hydraulic conductivity (k) value measured by a
constituted flexible – wall permeameter.
Generally, flow chart of testing procedure performed at soil mechanic and foundation
laboratory of Civil Engineering of Politeknik Negeri Jakarta (PNJ) or State Polytechnic
Jakarta is shown on Figure 2 Diameter of clay samples as soil liners used in this study is 3”
(inches) and 10” (inches). Study uses standard solution of 0.005 N CaSO4 during
saturation process.
128 Putera Agung, Budi Damianto and Sony Pramusandi
Figure 1: A constituted flexible – wall permeameter

Hydraulic Conductivity of Compacted Clay Soil Liners 129
Figure 2: Flow chart research study

130 Putera Agung, Budi Damianto and Sony Pramusandi
Table 1: General soil properties of Beji clay
No. Soil properties Result
1. Natural water content (w) (%) 45.7
2. Bulk density ( m) (gr/cm3) 1.6
3. Specific gravity (Gs) 2.68
4.
Atterberg limits:
a. Liquid limit (LL), (%) 90.0
b. Plastic limit (PL), (%) 44.8
c. Plasticity index (PI), (%) 45.2
d. Shrinkage limit (SL), (%) 24.9
5. Sieve analysis (weight of 500 gr)
passed on sieve No. 200 (gr) 491,1
6. Hydrometer analysis
(% diameter < 0.002 mm) (%) 80 – 90 (clay)
The saturation process is stopped when the pore volume of flow larger than or equals 2.0,
and then the solution of 0.005 N CaSO4 is substituted by leachate. Clay soils used in this
study are taken from around Kecamatan Beji, Kota Depok and leachate sample was taken
from waste disposal area (WDA) Pondok Rajeg, Cilodong, Sukmajaya. Soil properties
results are shown in Table 1 and the chemical contents of leachate from Depok landfill
(WDA) are shown in Table 2.
The chemical contents of Depok clay are shown in Table 3 where all samples were tested
at Laboratory of Chemical Department, University of Indonesia (UI), Depok Campus.
Based on the Table 3, it can be predicted that all clays mineral are very tiny crystalline
substances evolved primarily from chemical weathering of certain rock-forming minerals
(Holtz and Kovac, 1981). Chemically, they are hydrous aluminosilicates plus other
metallic ions. From chemical composition, the soil has kaolinite or illite minerals in a
large fraction; while montmorillonite exists in a small fraction.
Based on Table 1, mean natural water content of soil samples is 45.7 %, where according
to Bowles (1977) the water content is less than 60 % for dry surface condition. Specific
gravity (Gs) is 2.68, based on NAFAC (1971) the specific gravity of clay is between 2.5 to
2.9. Soil has mean grain size less than 0.002 mm and it can be classified as MH & OH
based on Unified Soil Classification System (USCS). From Table 2, it can be known that
the leachate has the high concentration of BOD and COD. In addition to the leachate has
a high value of fatty acid; pH; smell; the leachate also has an ammonia, N organic, Zn,
Mg, Cl, Pb and small number of the other of heavy metal. Based on geotechnical and
geology map for Kota Depok, soil layers at Beji location is red latosol with fine texture
and came from uncemented of andesite tuff (initial of soil layer is 28) (Figure 3).

Hydraulic Conductivity of Compacted Clay Soil Liners 131
Table 2: Chemical contents of leachate
Chemical elements unit
Alkalinity PP 10.0
MD 22.2
pH 8.2
CO2 0.0
Cl 15.0
Water hardness 13.2
Total of CaCO3 22.2
Ammonia (NH4-N) 51.6
Nitrate (N03-N) 2.3
Nitrite (NO2-NO) 0.5
Phosphate (PO4) 0.9
Sulphate (SO4) 44.5
DO / DIS Oxygen (O2) 4.8
COD / dichromate 1,326.0
BOD 785.0
Detergent 3.9
Phenol -
Magnesium (Mg) 7.0
Plumbum (Pb) 0.4
Zinc -
(Source : Dinas Kebersihan dan Pertamanan tahun 1996, Pemda Kotatip Depok)
Note: unit (mg/l), excepted for pH
3.2 Data Results Analysis
Mean of water line reading (0.005N CaSO4 solution and leachate) at the cylinder of
gauge – glass (or burette) on falling head test (ASTM) were observed and recorded, then
the hydraulic conductivity (k) values are determined by the equation:
1
2
ha .Lk 2.303 log
A.t h (1)
All measurements of hydraulic conductivity (k) are plotted on graphic relationship
between hydraulic conductivity (k) vs. time (day) for reading.

132 Putera Agung, Budi Damianto and Sony Pramusandi
Table 3: Chemical content of Depok clay
(Laboratory of chemical department – University of Indonesia)
No. Chemical
element Result Unit Method
1 Magnesium (Mg2+) 194.0 ppm AAS
2 Sodium (Na+) 70.5 ppm AAS
3 Potassium (K+) 245.3 ppm AAS
4 Calcium (Ca++) 14.2 ppm AAS
5 Chloride (Cl-) 37.9 ppm Ion-meter
6 Sulphate (SO42-) 261.3 ppm Spectrometer
7 Silicate (SiO2) 49.0 % Gravimetric
8 pH 7.6 - pH meter
Note: ppm = part per million
Figure 3: Identification of soil sample based on the geotechnical and geology map of
Kotatip Depok, West Java (2005)
4 Results and Discussion
4.1 Characteristic of Compacted Clay
Data results of standard compaction test are shown in Figure 3. Hydraulic conductivity (k)
are evaluated with using 3 (three) zones of water content, such as: dry side; optimum
point; and wet side as shown as in Figures 4a and 4b based on relationship between water
content and particle orientation in standard compaction test as well as the suggestion from
Lambe (1958).

Hydraulic Conductivity of Compacted Clay Soil Liners 133
4.2 Hydraulic Conductivity Values
The relationships between hydraulic conductivity of Beji clay liner and time are shown in
Figure 5 (diameter of sample 3” and thickness 1.0 cm) and Figure 6 (diameter of sample
10” and thickness 8.0 cm). 3 (three) condition of water content were taken from condition
of dry side; optimum point (OMC); and wet side from the results of standard compaction
test (Figures 4a and 4b).
Figure 3: Results of standard vs. modified test

134 Putera Agung, Budi Damianto and Sony Pramusandi
Figure 4a: Samples from location (1)
Figure 4b: Samples from location (2)

Hydraulic Conductivity of Compacted Clay Soil Liners 135
Figure 5: Hydraulic conductivity (k) vs. time (day) on sample of diameter 3”
and thickness 1.0 cm
Figure 6: Hydraulic conductivity (k) vs. time (day) on sample of diameter 10”
and thickness 8.0 cm

136 Putera Agung, Budi Damianto and Sony Pramusandi
4.2.1 Dry side condition where wc < wopt
Figures 5 and 6 show the influences of leachate to hydraulic conductivity values for
compacted clay using standard compaction test based on the water content in dry side
zone. In both figures indicate that hydraulic conductivity values decrease after solution
standard of 0.005 N CaSO4 substituted by leachate. Hydraulic conductivity values back to
enlarge gradually, however after few days, hydraulic conductivity clay liner tends to
constant and slightly decreased.
The deriving process of hydraulic conductivity value was caused by Na+ cation of
leachate, then it would be occurred by attracted force between Na+ and Ca2+ contained in
solution of 0.005 N CaSO4. The reduction of cation valence on pore water (based on
Gouy – Chapman Equation) caused double layer thickness become to enlarge, so that
flow line becomes small. On the contrary, the raising of hydraulic conductivity value was
caused by increasing electrolyte concentration in pore water, furthermore thickness of
double layer becomes small, and finally to enlarge flow line. However, the values of
hydraulic conductivity by using the leachate are always smaller than from the beginning
when using solution of 0.005 N CaSO4.
Generally, all samples of compacted clay liner (diameter 3” thickness 1.0 cm; and
diameter 10” thickness 8.0 cm) in dry side zone produces many pores and particle
orientation more flocculated, so that double layer become to enlarge due to increase ion
concentration and very difficult back to decrease. The decreasing of hydraulic
conductivity values may be caused by solid particles contained in leachate and covers or
catches all pores of compacted clay sample, finally to decrease flow line.
4.2.2 OMC point condition where wc = wopt
Hydraulic conductivity values of OMC condition are smaller than dry side condition and
takes time any longer than before. Thus, it would be concluded that leachate is hard to
penetrate or pass through the soil pores (extra or intra particle), it can be followed air
content more and more decreasingly. However, after a few time, hydraulic conductivity
values back to increase gradually closing to previous hydraulic conductivity value.
Because of degree of density produced on OMC is higher than dry or wet sides, soil pores
become small, and particle orientation tends to more dispersed. The deriving of cation
valence in pore water was caused Na+ cation contained of leachate. For this condition,
thickness of double layer and particle orientation of clay liner are constant caused
increasing concentration of ion. It can be concluded that the flow line can be slightly
retained by decreasing of void ratio or porosity of the compacted clay in OMC condition.
And, the hydraulic conductivity becomes smaller caused by the retained flow.
4.2.3 Wet side condition where wc > wopt
For this condition is almost same with optimum point. It would be caused by more
dispersed particle orientation in a little stream flow, so that thickness of double layer of
clay liner is constant. The deriving of hydraulic conductivity value is caused by solid
particle contained leachate and covering pores of clay liner, and furthermore flow line
become small.

Hydraulic Conductivity of Compacted Clay Soil Liners 137
4.2.4 Relationship between k – d – w
According to hydraulic conductivity test results using a constituted flexible – wall
permeameter and diameter sample of 3” and 10” with different thickness, generally it
shows that leachate strongly influences hydraulic conductivity (k) value of clay liner.
Some fluctuations of hydraulic conductivity value caused leachate flow are very
influenced by particle orientation of clay liner. Hydraulic conductivity value at dry side
zone is always larger than wet side zone, although both zones are compacted with same
energy. Typical relationships between k; dry density (d); and water content (w) for
sample size of 3 are shown at Figures 7 (a and b). And, typical relationships between k;
dry density (d); and water content (w) for sample size of 10 are shown at Figures 8 (a and
b).
Figure 7a: Relationship between k vs. d for sample diameter of 3”
and thickness of 1.0 cm
From Figures 7 and 8, it can be concluded that the dry density (d) and water content (w)
values for 3 (three) condition of samples, such as: dry; OMC; and wet conditions,
respectively, can influence hydraulic conductivity values. The hydraulic conductivity
values are more decreased when dry density and water content are more and more
increased. Hydraulic conductivity values on dry side are higher the values on wet side.

138 Putera Agung, Budi Damianto and Sony Pramusandi
Figure 7b: Relationship between k vs. w for sample diameter of 3” and thickness of 1.0
cm
Figure 8a: Relationship between k vs. d for sample diameter of 10” and thickness of 8.0
cm

Hydraulic Conductivity of Compacted Clay Soil Liners 139
Figure 8a: Relationship between k vs. w for sample diameter of 10”
and thickness of 8.0 cm
4.3 Representative of sample size
From both samples (diameter 3” and 10” with the different thickness), significantly it can
be known that there are some difference of hydraulic conductivity values when both
samples was flown by 0.005 N CaSO4 and leachate (Daniel, 1984; Day and Daniel, 1985;
Elsbury et al, 1988). And, generally, it can be concluded that measurements performed on
small samples produce some deviations of hydraulic conductivity results if they are
compared by the bigger samples. Table 4 shows the results of using small and big samples
for the measurement of hydraulic conductivity. Figure 9 shows that the effects of
enlargement of clay liner samples from 3” to 10”, the hydraulic conductivity become a
small increase, and the hydraulic conductivity values can vary from 10 to 100 times of the
sample size smaller for larger sample.
From Figure 9 shows that hydraulic conductivity values on diameter sample of 3” tends to
occur some deviations and moreover it can close to zero (0). Whereas the sample of 10”
diameter is relatively more reflects existing condition in field, although it requires
large-scale test in field. In such a way that it can be concluded generally, the size of
sample in falling head test strongly influences hydraulic conductivity values on the dry;
OMC; and wet conditions.

140 Putera Agung, Budi Damianto and Sony Pramusandi
Table 4: Comparison of hydraulic conductivity values between the sample sizes of 3” and
10” diameter
Sample conditions
Hydraulic conductivity (k) (cm/sec) values
Diameter of sample 3” Diameter of sample 10”
Flow line 0.005 N CaSO4 Leachate 0.005 N CaSO4 Leachate
Dry side 1.117 . 10-8 5.377 . 10-9 3.568 . 10-7 2.104 . 10-7
OMC 9.920 . 10-10 7.681 . 10-10 2.422 . 10-7 9.554 x 10⁻⁸
Wet side 5.756 . 10-10 3.561 . 10-10 9.733 . 10-8 4.150 . 10-8
Figures 9: Hydraulic conductivity (k) vs. time (day)
The results of measurement show that the difference of hydraulic conductivity values
from sample diameter of 3” and 10”. The values obtained for sample diameter of 3” are
1.117 x 10⁻⁸ to 5.756 x 10⁻¹⁰ cm/sec for flow of 0.005 N CaSO4 and 5.377 x 10⁻⁹ to 3.561
x 10-10 cm/sec for flow of leachate. Whereas the test using enlargement to sample
diameter of 10”, hydraulic conductivity values reach 3.568 x 10⁻⁷ to 9.733 x 10⁻⁸ cm/sec

Hydraulic Conductivity of Compacted Clay Soil Liners 141
for flow of 0.005 N CaSO4 and 2.104 x 10⁻⁷ to 4.150 x 10⁻⁸ cm/sec for flow of leachate.
According to Benson et al, 1998, that sample having small diameter (diameter ≤ 3”)
cannot show the existing condition of field, the enlargement of sample size are always
followed by the change of hydraulic conductivity values significantly.
From both sizes of sample of 3” and 10” shows the significant difference to the hydraulic
conductivity values when they are flown by standard solution of CaSO4 and leachate. It
can be concluded that these results can support some previous evaluation of hydraulic
conductivity performed by Daniel (1984); Day and Daniel (1985); and Elsbury et al
(1988). All measurement results of hydraulic conductivity are found that generally, the
measurements conducted by smaller samples obtain the deviation values significantly
from the larger size of samples tested by falling head test. The sample sizes of 10” are
more representative and closes to field condition, although these results has to be
compared to the results of the in situ test. Thus, it can be concluded that the enlargement
of sample size can influence the hydraulic conductivity values.
5 Discussion
Values of hydraulic conductivity are also depended on the characteristic of leachate liquid.
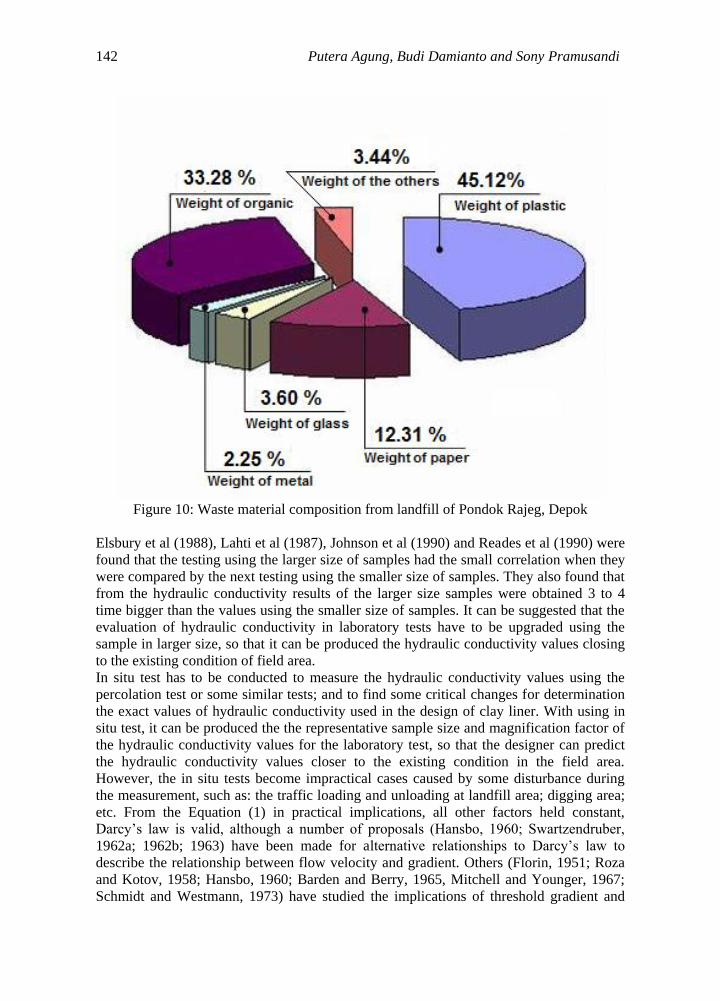
From the observation in study area, type of waste material where the leachate obtained
consists of 45.12 % plastic material; and 33.28 % paper material; the percentage for other
materials are shown in Fig. 10. These kind of waste materials shows that source of waste
material were come from settlement area; road or highway; industries; building or office
building; old or new building rubble; and waste material from building renovation. The
other of waste material properties are: water content 44 %; weight volume around 0.20
gr/cm3; volatile content 84 %; ash content 16 %; and temperature between 30 to 34o C.
From observation to the falling head laboratory test, the values of hydraulic conductivity
can be influenced by the leachate containing the more solid material composition. The
solid material has the potential to reduce the pore space of compacted clay during flow
takes place. It can be assumed that the more dense material accumulates and impedes the
flow, so that the pore space reduces into smaller.
The previous researcher concluded that from 3 (three) of falling head testing for soil liner
performed using the magnification of samples were obtained mean difference of hydraulic
conductivity values between 10 to 100 times than the values reached for smaller samples.
Some constraints existed for the testing of smaller samples can usually cause any
conditions of soil sample becoming more solid, so that almost the pore spaces are more
compressed. However, this reality becomes more difference when the testing uses bigger
size of samples. The bigger size of samples can be influenced by soft or wide fissures;
side spaces condition which are not compressed; and or some hydraulic problems during
testing which are available on the larger size of samples (Daniel, 1984). Furthermore, Day
and Daniel (1985) concluded that from 2 (two) prototypes of hydraulic conductivity soil
liner testing of the big size samples were produced the pore spaces larger than the smaller
samples. It can be concluded that all samples which have the smaller size are not
representative for using in the clay liner design.
142 Putera Agung, Budi Damianto and Sony Pramusandi
Figure 10: Waste material composition from landfill of Pondok Rajeg, Depok
Elsbury et al (1988), Lahti et al (1987), Johnson et al (1990) and Reades et al (1990) were
found that the testing using the larger size of samples had the small correlation when they
were compared by the next testing using the smaller size of samples. They also found that
from the hydraulic conductivity results of the larger size samples were obtained 3 to 4
time bigger than the values using the smaller size of samples. It can be suggested that the
evaluation of hydraulic conductivity in laboratory tests have to be upgraded using the
sample in larger size, so that it can be produced the hydraulic conductivity values closing
to the existing condition of field area.
In situ test has to be conducted to measure the hydraulic conductivity values using the
percolation test or some similar tests; and to find some critical changes for determination
the exact values of hydraulic conductivity used in the design of clay liner. With using in
situ test, it can be produced the the representative sample size and magnification factor of
the hydraulic conductivity values for the laboratory test, so that the designer can predict
the hydraulic conductivity values closer to the existing condition in the field area.
However, the in situ tests become impractical cases caused by some disturbance during
the measurement, such as: the traffic loading and unloading at landfill area; digging area;
etc. From the Equation (1) in practical implications, all other factors held constant,
Darcy’s law is valid, although a number of proposals (Hansbo, 1960; Swartzendruber,
1962a; 1962b; 1963) have been made for alternative relationships to Darcy’s law to
describe the relationship between flow velocity and gradient. Others (Florin, 1951; Roza
and Kotov, 1958; Hansbo, 1960; Barden and Berry, 1965, Mitchell and Younger, 1967;
Schmidt and Westmann, 1973) have studied the implications of threshold gradient and
Hydraulic Conductivity of Compacted Clay Soil Liners 143
nonlinearity on seepage and consolidation. Gradient used in laboratory determinations of
hydraulic conductivity and consolidation behavior are higher than is the case for the field
conditions under study. A gradient-dependent hydraulic conductivity in such a case could
be the cause of substantial discrepancies between laboratory – measured and field values
of coefficient of consolidation.
The other macro tests are required to understand subsequently some changes of the
hydraulic conductivity values caused by the changes of consolidation parameter, such as:
index of compression (Cc); coefficient of consolidation (Cv); index of volume changes
(mv); and the volume changes of waste material working on the solid clay liner. The
important observations are the deviations of hydraulic gradient caused by the damage of
the layer between waste material and clay liner (e.g. geotextile, etc), deviations of
hydraulic gradient can influence hydraulic conductivity values. To find out in more detail
of clay particle orientation after the flow line of leachate, it would be required some micro
tests, such as: scanning electron microscope (SEM); electron microscope; X-ray test, etc.
These tests are needed to know the condition of pore spaces (intra or extra particle). From
these test, it can be learned that the hydraulic conductivity depends on clay content;
sedimentation procedure; compression rate; and electrolyte concentration. Subsequent
behavior is quite sensitive to the type and concentration of electrolyte used for permeation
and the total throughput volume of permeant (Hardcastle and Mitchell, 1974). Mitchell
and Younger (1967) suggested to study the particle migrations, as reflected by changes in
pore pressure distribution with time in the direction of flow. Some observations to change
of chemical composition from samples after the stream of leachate are also required to
find out the change of mechanical properties or shear strength parameters of the clay liner,
such as: cohesion (c); friction angle (); and the others.
Finally, from several tests performed to measure hydraulic conductivity values for solid
clay liner in landfill area, there are many information which has to be known, such as:
size of sample; density; clay particle orientation; clay content, etc. However, the
important factor in laboratory test performance related with the selected sample size are
some variables depended on sample preparation; devices; and laboratory procedure. The
previous study on field test has to be collected, so that it can be designed the
representative solid clay liner size to monitor the changes of the hydraulic conductivity
after construction.
6. Conclusions and recommendations
The size of representative sample for measurement of hydraulic conductivity of
compacted soil liner (clay soil from Beji-Kota Depok) depends on the method and quality
of construction. If the soil is compacted poorly (e.g. dry of the line of optimum or with
low compaction effort), the representative sample size has to be large. However, when the
soil is well compacted (wet of the line of optimum or with high compaction effort), the
representative size is small. However, a key factor controlling the representative sample
size is the results of field test.
The experimental results suggest that field – scale hydraulic conductivity can be measured
on specimens with a diameter of at least 10” and a thickness of 8.0 cm for a wide variety
of construction conditions. Block samples size are recommended for measurement the
hydraulic conductivity in situ test after construction. Some observations before the filed

144 Putera Agung, Budi Damianto and Sony Pramusandi
tests are required to avoid some disturbance during measurement the hydraulic
conductivity.
The influence samples size of diameter 3” to 10” on experiments using falling head tests
can produce the hydraulic conductivity values significantly where enlargement factor
around 10 – 100 times.
Representative density of clay liner for waste containment structures can be selected by
compaction condition using water content of wet side 40 % until liquid limit value ((LL)
≤ 90%), definitely with controlling workability compaction in field, because the clay soil
is very hard to compact on high water content.
Prevention of leachate infiltration to high water table at around of waste containment
structures can use clay liner with dry density (γd) = 1.261 gr/cm3 and wet side condition
(40 %). Moreover, if it would be required, it also can use optimum point condition ((γd) =
1.495 gr/cm3 and optimum moisture content = 25.50 %) added leachate filter material
using coarse grained layers; geotextile; etc.
The monitoring works are required to guarantee the constant of hydraulic conductivity
during life time of planning. Consequences, in situ tests have to be conducted
periodically. Some other constraints that can influence the measurement of the hydraulic
conductivity should be avoided such as: a traffic loading and unloading of waste material;
and the changes of waste material volume.
ACKNOWLEDGEMENTS: The author wish to express their sincere gratitude to the
P2M of Directorate of Higher Education, Department of National Education Republic of
Indonesia and Politeknik Negeri Jakarta or State Polytechnic of Jakarta (PNJ) for research
fund of “Dosen Muda” 2007 based on contract No.003/SP2H/PP/DP2M/III/2007; the city
government of Depok; and Laboratory of chemical department – UI. Since their support,
the authors can give valuable contribution to research development of geotechnical
engineering in PNJ generally, and problem solving for determination of hydraulic
conductivity parameter of solid clay liner especially, also for the basic design of waste
containment structure of Pondok – Rajeg, Kota Depok. The research has suggested to the
representative sample size for solid clay liner at laboratory works.
References
[1] Benson, C., H., and Hardianto, F., S, Representative sample size for hydraulic
conductivity measurement of compacted soil liners for waste containment structures,
Proceeding: Geoteknik di Indonesia Menjelang Milenium ke – 3, 1998, pp. VII –
33 – VII – 52.
[2] Barden, L., and Berry, P.L, Consolidation of normally consolidated clay. Journal of
the soil mechanics and foundation division, ASCE, 91, No. SM5, (1965), 15 – 36.
[3] Daniel, D., E, Predicting hydraulic conductivity of clay liners. Journal of
Geotechnical Engineering, ASCE, 110(2), (1984), 285-300.
[4] Daniel, D., E, Earthen liners for land disposal facilities. Geotechnical Practice for
Waste Disposal ’87, GSP No. 13, ASCE, (1987), 21 – 39.
[5] Dinas Kebersihan dan Pertamanan. Buku data Pemda Kotatip Depok, (1996).
[6] Pemda Kotatip Depok. Peta Geoteknik dan Geologi Kotatip Depok, Jawa Barat.
(2005).

Hydraulic Conductivity of Compacted Clay Soil Liners 145
[7] Elsbury, B., R. et al, Field and laboratory testing of compacted soil liner,” Report to
USEPA for Contract No. 68-03-3250, (1988), Cincinnati, Ohio.
[8] Florin, V.A, Consolidation of earth media and seepage under conditions of variable
porosity and consideration of the influence of bound water. Izvestia Academy of
Science, USSR, Section of Technology Science, No. 11, (1951), 1625 – 1649.
[9] Hansbo, S, Consolidation of clay with special reference to the influence of vertical
sand drains. Proceeding, 18, Swedish Geotechnical Institute, Stockholm, (1960).
[10] Hardcastle, J.H., and Mitchell, J.K, Electrolyte concentration-permeability
relationships in sodium illite-silt mixtures. Clays and clay minerals, 22(2), (1974),
143 – 154.
[11] Johnson, G., et al, Field verification of clay liner hydraulic conductivity. In Waste
Containment System: Construction, Regulation and Performance, GSP, No. 26,
ASCE, New York, (1990), 226 – 245.
[12] Lambe. The Structure of compacted clay, JSMFD, ASCE, 84, No. SM 2, (1958).
[13] Mitchell, J.K., and Younger, J.S, Abnormalities in hydraulic flow through
fine-grained soils. ASTM Special Technical Publication 417, (1967), 106 – 141.
[14] Lahti, L., et al, Quality assurance monitoring of a large clay liner, Geotechnical
Practice for Waste Disposal ’87, GSP N0. 13, ASCE, (1987), 640 – 654.
[15] Reades, D, et al, Detailed history of clay liner performance. In Waste Containment
Systems Construction, Regulation and Performance, GSP No. 26, ASCE, New York,
(1990), 156 – 174.
[16] Roza, S.A., and Kotov, A. L, Experimental studies of the creep of soil skeletons.
Zapiski Trudonovo Krasmorro Znamemo gornono institute um G. A. Plakhanova,
34(2), (1958), 203 – 213.
[17] Swartzendruber, D, Modification of Darcy’s law for the flow of water in soils, Soil
science, 93, (1962a), 27 – 29.
[18] Swartzendruber, D, Non-Darcy’s behavior and flow behavior in liquid-saturated
porous media. Journal of Geophysical Research, 67(13), (1962b), 5205 – 5213.
[19] Swartzendruber, D, Non-Darcy behavior and flow of water in unsaturated soils. Soil
science of America, Proceedings, (1963), 491 – 495.
[20] Schmidt, J.D., and Westmann, R.A.. Consolidation of porous media with non-Darcy
flow, Journal of the Engineering Mechanics Division, ASCE, 99, No. EM6, (1973),
1201 – 1216.


![[27] (41030748) Influence of Salt Solutions on the Swelling Pressure and Hydraulic Conductivity of Compacted GMZ01 Bentonite](https://img.pdfslide.us/doc/110x75/55cf868d550346484b98c0a7/27-41030748-influence-of-salt-solutions-on-the-swelling-pressure-and-hydraulic.jpg)


![On yield stress of compacted clays - Springer · 2018-12-12 · ries require high plastic clays to be compacted for the formation of earth fill barri-[4 , 5].According to clay barriers](https://img.pdfslide.us/doc/110x75/5fa09869c21d5e76532f8c14/on-yield-stress-of-compacted-clays-springer-2018-12-12-ries-require-high-plastic.jpg)