Embed Size (px)
Citation preview
28
HHyyddrrooddyynnaammiicc bbeehhaavviioorr aanndd
mmaassss ttrraannssffeerr ccooeeffffiicciieennttss ooff
ssiinnggllee lliiqquuiidd ddrroopp iinn eexxttrraaccttiioonn
ccoolluummnn
Asso. Prof. Dr, Hani A. Dammag
Department of Chemical Engineering –
College of Engineering & Petroleum - Hadhramout
University of Science & Technology,
Republic of Yemen – Mukalla
Corresponding author Email :

29
HHyyddrrooddyynnaammiicc bbeehhaavviioorr aanndd mmaassss Prof. Dr. Hani A. Dammag
Vol.(5).lssue (9) 2013 Alandalus For Social and Applied Sciences
30
HHyyddrrooddyynnaammiicc bbeehhaavviioorr aanndd mmaassss Prof. Dr. Hani A. Dammag
Vol.(5).lssue (9) 2013 Alandalus For Social and Applied Sciences
Hydrodynamic behavior and mass transfer coefficients of single liquid drop in extraction column
Abstract
Hydrodynamic behavior and mass transfer of several liquid-liquid system has been measured in 150.0 mm column diameter. The column was operated in tow different modes as a spray tower and a perforated plate tower. Experiments were performed using different chemical systems and different needles to obtain drops of different diameters. The relationship between the terminal velocity (Vt) and the down flow of the continuous phase was examined experimentally. Mass transfer coefficients (MTCS) have been measured for single liquid drops rising through non flowing and flowing water and have been compared with the coefficients measured for free rise conditions in an empty column for different systems. The MTCS were determined as a function of drop size, mass transfer direction and down flow of the continuous phase. From the data obtained, it is concluded that the drop size is key variable affecting hydrodynamics and mass transfer processes. The relative velocities between drops and the down-flowing continuous phase were found to decrease as a down flow rate increased. The effect of continuous phase velocity on The MTC is relatively significant with a slight increase in drop size occurring with increasing flow rate. The degree of enhancement of the dispersed phase film coefficients for mass transfer due to the presence of plates has been ascertained. Finally the coefficients for mass transfer from the dispersed phase into the continuous
31
HHyyddrrooddyynnaammiicc bbeehhaavviioorr aanndd mmaassss Prof. Dr. Hani A. Dammag
Vol.(5).lssue (9) 2013 Alandalus For Social and Applied Sciences
phase ( d c) are slightly higher than those for the opposite direction, ( c d ). Keywords: Extraction columns, Hydrodynamic behavior, single liquid drop, mass transfer. 1. Introduction : In the field of solvent extraction processes various types of equipment have been developed during the last few decades. Therefore the user is faced with the critical choice between contactors and most of the time has to decide according to subjective criteria. Nowadays various extractors which are operated with and without a supply of mechanical energy are available in industry spray and perforated-palate ( sieve plate ) columns are commonly used in commercial liquid –liquid extraction systems. In these towers many drops are formed simultaneously and rise ( or fall ) in a swarm. Spray columns are the simplest of liquid –liquid extractors for contacting the continuous phase with counter current stream of the dispersed phase droplets. Spray column have been little used in industry despite their simplicity, high though put and low cost. This is because the lack of internals results in a strong circulatory flow of continuous phase in the same direction as the droplets, with a return flow around the column wall (1). Consequently, these column approach the fully back mixed conditions with a performance equivalent to only1-2 stages. Hence, it is used only when the number of overall
32
HHyyddrrooddyynnaammiicc bbeehhaavviioorr aanndd mmaassss Prof. Dr. Hani A. Dammag
Vol.(5).lssue (9) 2013 Alandalus For Social and Applied Sciences
transfer units involved in the separation process is relatively small. One of the ways to increase the mass transfer rates between the dispersed and the continuous phase is to provide for frequent coalescence and redispersion of the drops especially for the systems which show high internal circulation in the drop during formation at orifice or nozzles (2). Perforated plate extraction towers are unique in the they provide repeated coalescence and redispersion for the drops and offer the advantage of cross flow of the continuous phase in addition to yielding high extraction coefficients with practically no axial mixing. The perforated plate columns may be considered as a series of short spray columns arranged one above the other. In practical, however, thee are numerous application of liquid-liquid extraction where perforated columns are preferred (3). 2. Scope of present work:
The improvement of the design method of any type of column depends on the understanding of drop size, drop velocities, residence time distribution and mass transfer coefficients. The rate of mass transfer is affected by the rate of the formation of the droplets, their rate of passage through the continuous phase and finally their rate of coalescence. Mass transfer to and from drops moving in a continuous phase is common to many industrial processes, especially those involving liquid-liquid extraction and liquid phase reaction. The information obtained from simple
33
HHyyddrrooddyynnaammiicc bbeehhaavviioorr aanndd mmaassss Prof. Dr. Hani A. Dammag
Vol.(5).lssue (9) 2013 Alandalus For Social and Applied Sciences
single drop experiments supply the fundamental data required for modeling and may be used to predict the behavior of extraction columns. Observation of liquid-liquid extraction form single drops has advantage that the extraction can be carried out under known conditions of interfacial area and time of contact. The results should be directly applicable to spray towers and perforated-plate extractors and should help to explain the mechanism of mass transfer in other types of equipment. In the previous paper (4), we presented experimental results on mass transfer rate for the following systems: toluene – acetone – water, toluene – acetic acid – water and kerosene – benzoic acid – water. The present work aims at the prediction of mass transfer rates from single drop to a continuous phase and investigate the effect of drop size, mass transfer direction, height of compartment and continuous phase velocity on the mass transfer coefficients of single liquid drop in a perforated plate ( sieve-plate ) and spray columns using different systems. Since, knowledge of particle velocity is of fundamental importance for the description of mass transfer process, in order to estimate mass transfer to or from droplets, it is necessary to consider some aspects of the fluid mechanics of a single particle in free motion through a continuous fluid phase. Aspects which are directly related to mass transfer are the particle velocity relative to the continuous phase (5). Hence, the relevant hydrodynamics to mass transfer consideration will first be reviewed briefly, with
34
HHyyddrrooddyynnaammiicc bbeehhaavviioorr aanndd mmaassss Prof. Dr. Hani A. Dammag
Vol.(5).lssue (9) 2013 Alandalus For Social and Applied Sciences
drop size and terminal velocity because the primary focus of this paper on mass transfer of single liquid drop. 3.Systems : The systems investigated in this work were, toluene/ water (system 1 ) and kerosene / water ( system 2) for hydrodynamic studies, toluene / phenol/water ( system 1 ) and toluene/ benzoic acid / water ( system 2 ) for mass transfer studies. The physical properties of the systems used are given in tables 1, 2. The dispersed phase is specified first, followed by the solute and the continuous phase. The main difference between the liquid-liquid systems which were selected was interfacial tension which was regards as the primary characteristic of each system (6). Phenol and benzoic acid were selected as the solutes in this work since it is non-corrosive, permitting common materials of construction to be used; it also has the advantage the analysis of the column sample is comparatively simple . Solute concentration were determined by measurement of relative absorbency of ultraviolet ray where a spectrophotometer ( UV160 Shimadzu ) was used for measurement of relative absorbency of the sample placed in 2 mm size cell. Calibration charts for relative absorbency against concentration were prepared by measuring the relative absorbency of solutions of known solute concentration. The organic liquid were special- grad chemicals and were used without concentration of each
35
HHyyddrrooddyynnaammiicc bbeehhaavviioorr aanndd mmaassss Prof. Dr. Hani A. Dammag
Vol.(5).lssue (9) 2013 Alandalus For Social and Applied Sciences
solute, used in this work was 1000 ppm with transfer from aqueous to organic.
Table 1 : Physical properties of the systems used (hydrodynamic studies )
System 1: toluene / water
рc (kg/m3 )
рd ( kg/m3 )
μc ( kg/ms.103
)
μd ( kg/ms.103
)
γ ( mN/m )
998 862 0.98 0.59 34
System 2: kerosene / water
988 807 1.1 1.47 42
Table 2: Physical properties of the systems studied (mass transfer studies ).
System 1: toluene / phenol / water
рc (kg/m3 )
рd ( kg/m3 )
μc ( kg/ms.103
)
μd ( kg/ms.103
)
γ ( mN/m )
998 876 1.01 0.61 43.5
System 2: toluene / benzoic acid / water
999 796 1.08 1.65 38.5
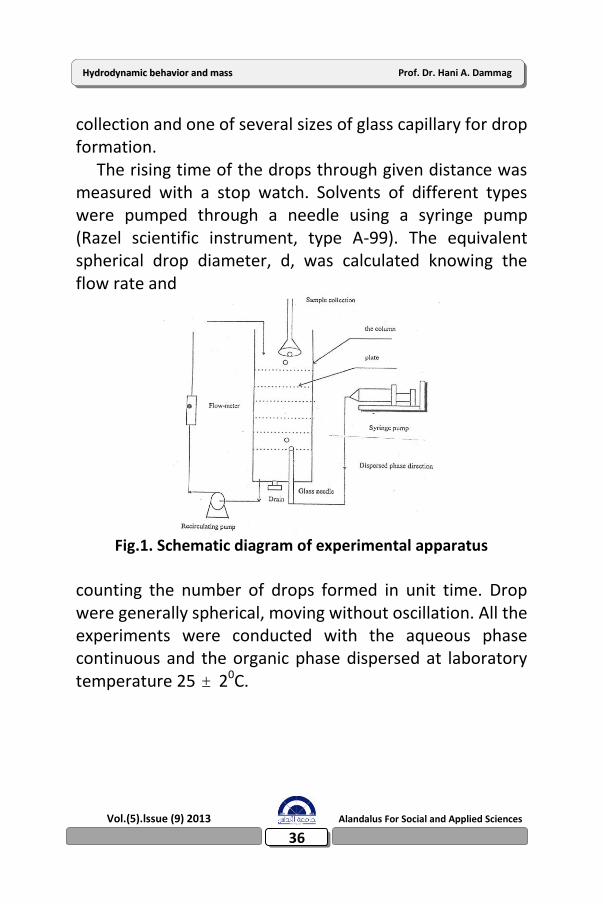
3.1 Single drop apparatus: The experimental apparatus were essentially the same as described in the previous paper by the authors . A summary of column details is given in table 3. A schematic diagram of the apparatus is shown in fig.1, Main parts of the apparatus consisted of Perspex glass extraction column 0.150m diameter, a glass funnel for sample
36
HHyyddrrooddyynnaammiicc bbeehhaavviioorr aanndd mmaassss Prof. Dr. Hani A. Dammag
Vol.(5).lssue (9) 2013 Alandalus For Social and Applied Sciences
collection and one of several sizes of glass capillary for drop formation. The rising time of the drops through given distance was measured with a stop watch. Solvents of different types were pumped through a needle using a syringe pump (Razel scientific instrument, type A-99). The equivalent spherical drop diameter, d, was calculated knowing the flow rate and
Fig.1. Schematic diagram of experimental apparatus
counting the number of drops formed in unit time. Drop were generally spherical, moving without oscillation. All the experiments were conducted with the aqueous phase continuous and the organic phase dispersed at laboratory temperature 25 20C.
37
HHyyddrrooddyynnaammiicc bbeehhaavviioorr aanndd mmaassss Prof. Dr. Hani A. Dammag
Vol.(5).lssue (9) 2013 Alandalus For Social and Applied Sciences
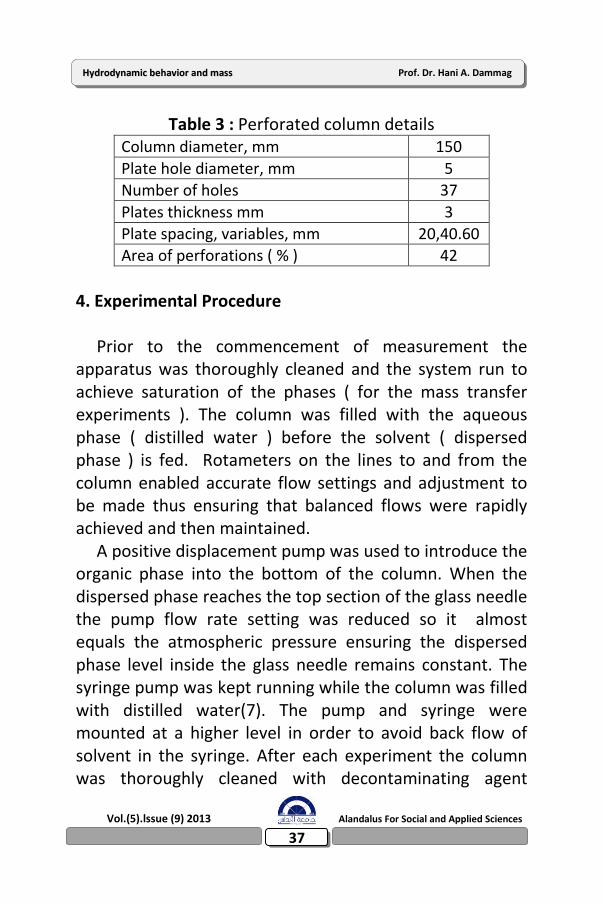
Table 3 : Perforated column details Column diameter, mm 150
Plate hole diameter, mm 5
Number of holes 37
Plates thickness mm 3
Plate spacing, variables, mm 20,40.60
Area of perforations ( % ) 42
4. Experimental Procedure Prior to the commencement of measurement the apparatus was thoroughly cleaned and the system run to achieve saturation of the phases ( for the mass transfer experiments ). The column was filled with the aqueous phase ( distilled water ) before the solvent ( dispersed phase ) is fed. Rotameters on the lines to and from the column enabled accurate flow settings and adjustment to be made thus ensuring that balanced flows were rapidly achieved and then maintained. A positive displacement pump was used to introduce the organic phase into the bottom of the column. When the dispersed phase reaches the top section of the glass needle the pump flow rate setting was reduced so it almost equals the atmospheric pressure ensuring the dispersed phase level inside the glass needle remains constant. The syringe pump was kept running while the column was filled with distilled water(7). The pump and syringe were mounted at a higher level in order to avoid back flow of solvent in the syringe. After each experiment the column was thoroughly cleaned with decontaminating agent
38
HHyyddrrooddyynnaammiicc bbeehhaavviioorr aanndd mmaassss Prof. Dr. Hani A. Dammag
Vol.(5).lssue (9) 2013 Alandalus For Social and Applied Sciences
(Decon 90) to prevent the problem of contamination. Experiments were performed using different glass needles to obtain drop of different size. The equivalent spherical drop diameter was calculated, knowing the flow rate from the syringe pump and counting the number of drops formed and measuring the time if formation, using an electronic stop watch. At least 300 drops were timed for each run, after a period that is enough to reach the steady state conditions (8). Drops were spaced more than 30 mm apart typically, sufficient to avoid interactions according to skelland (9). In the perforated column, the droplet leaving the plates were allowed to rise a measured distance through the aqueous phase before being collected by suction through a small inverted funnel. The interfacial area in the funnel was kept small by occasionally pulling the drops into a pipette. 5.Inerpretation of data:
The overall mass transfer coefficients for drops of known size may be measure by passing solvent drops of known composition through an aqueous phase of known composition and collecting drops in an inverted glass funnel at the top of the column (10). Collection of solvent drops in a glass funnel, covering about a quarter of the cross-section area of the column, was found satisfactory. The funnel was immersed to an extent such that the interface where drops coalesced was in the funnel stem, (11).
39
HHyyddrrooddyynnaammiicc bbeehhaavviioorr aanndd mmaassss Prof. Dr. Hani A. Dammag
Vol.(5).lssue (9) 2013 Alandalus For Social and Applied Sciences
Analysis of solvent drops after passage through the column in a known time allows an overall time-averaged mass transfer coefficient to be calculated from the following equation:
V dc / dt= k od Ad ( C - C* ). (1) Integrating eq. (1) yields. ( Co – Ci ) / ( C* – Ci ) = ( 1 – exp ( -6 kod t /d )), (2) Kod = - ( d / 6t ) In ( 1 – E ), (3)
Where: E = ( Ci – Co ) / ( Ci – C* ) and Ci is the inlet and Co outlet solvent concentration, and since there was no solute initially in the water, the drop concentration in equilibrium with the aqueous phase, C* = 0. Drop formation time at the needle was easily found by counting drops at a fixed flow rate over a given time. This drop formation was included in the time used for calculating drop diameter (d). 6. Results and discussion:
6.1. Hydrodynamic terminal velocities of single drops
Study of the formation and character of movement of drops is an important for understanding the extraction process. The terminal velocity of a liquid drop in liquid medium is the free fall or rise, depending on the relative density, velocity of a single isolated drop in the gravitational field. Experimental values of terminal velocities of single drop falling or rising in
40
HHyyddrrooddyynnaammiicc bbeehhaavviioorr aanndd mmaassss Prof. Dr. Hani A. Dammag
Vol.(5).lssue (9) 2013 Alandalus For Social and Applied Sciences
liquid –liquid systems have been correlated by Hu and kintener (12), klee and treyball (13), Johnson and Braida (14), and Grace (15). The latter utilized data from several sources and conducted many experiments of their own, enabling their correlation to cover a wide range of variables.
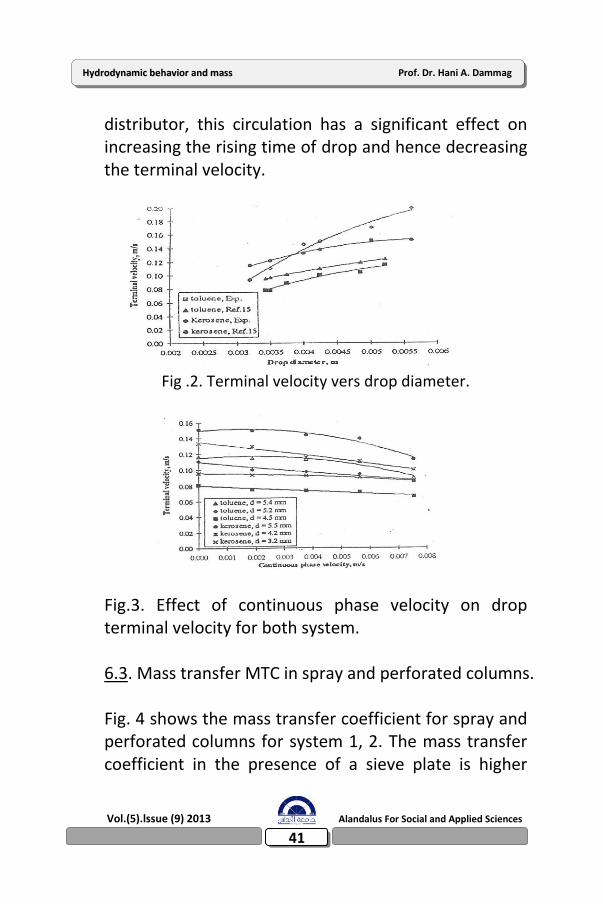
The experimental terminal velocities of our systems are plotted versus drop diameter in fig 2. Also shown are the terminal velocities for these drop rising singly as predicted by the correlation of Grace for comparison with measured values. The terminal velocity is observed to increase with increasing droplet diameter. The reasonable agreement indicates that all drops in this work experienced some internal circulation.
6.2. Effect of Continuous phase velocity
Fig. 3 shows the profile of down flow of the continuous phase against the terminal velocity under various flow rates conditions. The terminal velocity decreases as the down flow rate increases, this due to the increase on the residence time of the drop inside the column. On account of this drag and skin friction increase which apparently cause a decrease in the terminal velocity. This suggested that drops were taking a longer path through the column dependent on the down flow. Since liquid were initially circulate over the top cross sectional area of the column using a liquid
41
HHyyddrrooddyynnaammiicc bbeehhaavviioorr aanndd mmaassss Prof. Dr. Hani A. Dammag
Vol.(5).lssue (9) 2013 Alandalus For Social and Applied Sciences
distributor, this circulation has a significant effect on increasing the rising time of drop and hence decreasing the terminal velocity.
Fig .2. Terminal velocity vers drop diameter.
Fig.3. Effect of continuous phase velocity on drop terminal velocity for both system.
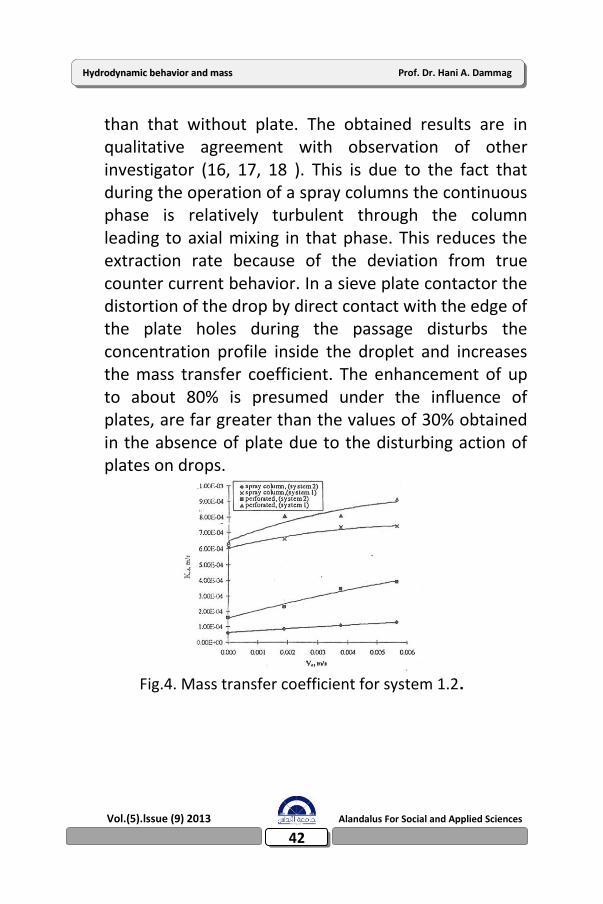
6.3. Mass transfer MTC in spray and perforated columns.
Fig. 4 shows the mass transfer coefficient for spray and perforated columns for system 1, 2. The mass transfer coefficient in the presence of a sieve plate is higher
42
HHyyddrrooddyynnaammiicc bbeehhaavviioorr aanndd mmaassss Prof. Dr. Hani A. Dammag
Vol.(5).lssue (9) 2013 Alandalus For Social and Applied Sciences
than that without plate. The obtained results are in qualitative agreement with observation of other investigator (16, 17, 18 ). This is due to the fact that during the operation of a spray columns the continuous phase is relatively turbulent through the column leading to axial mixing in that phase. This reduces the extraction rate because of the deviation from true counter current behavior. In a sieve plate contactor the distortion of the drop by direct contact with the edge of the plate holes during the passage disturbs the concentration profile inside the droplet and increases the mass transfer coefficient. The enhancement of up to about 80% is presumed under the influence of plates, are far greater than the values of 30% obtained in the absence of plate due to the disturbing action of plates on drops.
Fig.4. Mass transfer coefficient for system 1.2.
43
HHyyddrrooddyynnaammiicc bbeehhaavviioorr aanndd mmaassss Prof. Dr. Hani A. Dammag
Vol.(5).lssue (9) 2013 Alandalus For Social and Applied Sciences
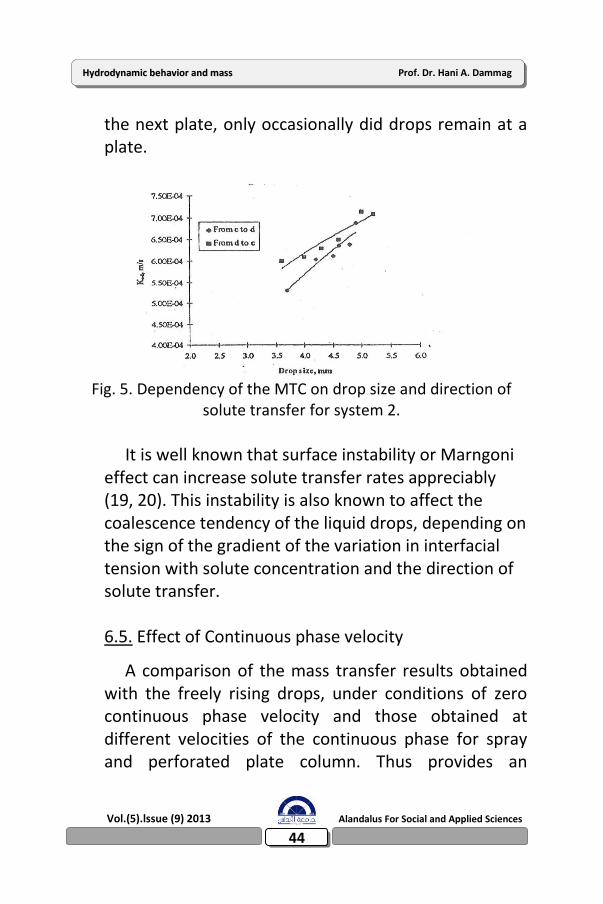
6.4. Effect of drop size and direction of solute transfer
Fig. 5 shows the dependence of the average mass transfer coefficient on drop size and direction of the mass transfer for system 2. The coefficients of mass transfer from the continuous to the dispersed appears (c d) to be rather smaller than those obtained for the opposite direction of transfer (d c). The difference in the coefficient is, however, small. With slightly increase in drop size from (d c). It is significant, however, that the result follows the same trends as those for the opposite direction of transfer. Direct comparison of the results is difficult owing to the variation of drop size with direction of solute transfer. With solute transfer from (d c) the drop size increased. This effect can be attributed to the increase in coalescence tendency of the drops promoted by the direction of solute direction. Values for the larger drops are bounded by the Handlos- Baron and the Hadamard relation for circulating drops. In addition the mechanism of mass transfer is known to be dependent on drop size, with the mass transfer mechanism varying from ,molecular diffusion for very small drops, which behave as a rigid spheres, to the development of internal droplet circulation, oscillation and turbulent eddy transfer mechanisms as the drop size is increased. Drop size produced were always less than plate hole size, drop would hit plates, move sideways, then move upward to
44
HHyyddrrooddyynnaammiicc bbeehhaavviioorr aanndd mmaassss Prof. Dr. Hani A. Dammag
Vol.(5).lssue (9) 2013 Alandalus For Social and Applied Sciences
the next plate, only occasionally did drops remain at a plate.
Fig. 5. Dependency of the MTC on drop size and direction of
solute transfer for system 2.
It is well known that surface instability or Marngoni effect can increase solute transfer rates appreciably (19, 20). This instability is also known to affect the coalescence tendency of the liquid drops, depending on the sign of the gradient of the variation in interfacial tension with solute concentration and the direction of solute transfer.
6.5. Effect of Continuous phase velocity
A comparison of the mass transfer results obtained with the freely rising drops, under conditions of zero continuous phase velocity and those obtained at different velocities of the continuous phase for spray and perforated plate column. Thus provides an
45
HHyyddrrooddyynnaammiicc bbeehhaavviioorr aanndd mmaassss Prof. Dr. Hani A. Dammag
Vol.(5).lssue (9) 2013 Alandalus For Social and Applied Sciences
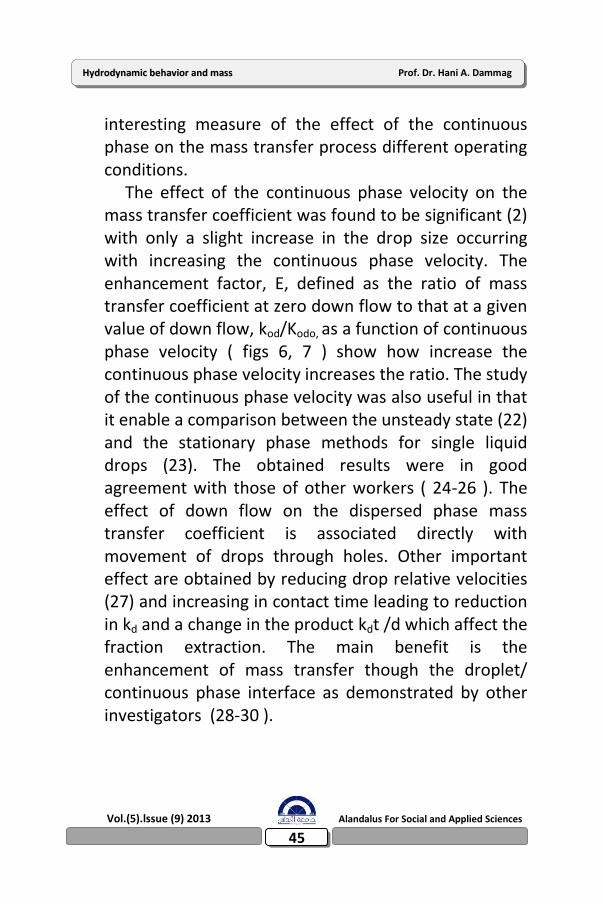
interesting measure of the effect of the continuous phase on the mass transfer process different operating conditions. The effect of the continuous phase velocity on the mass transfer coefficient was found to be significant (2) with only a slight increase in the drop size occurring with increasing the continuous phase velocity. The enhancement factor, E, defined as the ratio of mass transfer coefficient at zero down flow to that at a given value of down flow, kod/Kodo, as a function of continuous phase velocity ( figs 6, 7 ) show how increase the continuous phase velocity increases the ratio. The study of the continuous phase velocity was also useful in that it enable a comparison between the unsteady state (22) and the stationary phase methods for single liquid drops (23). The obtained results were in good agreement with those of other workers ( 24-26 ). The effect of down flow on the dispersed phase mass transfer coefficient is associated directly with movement of drops through holes. Other important effect are obtained by reducing drop relative velocities (27) and increasing in contact time leading to reduction in kd and a change in the product kdt /d which affect the fraction extraction. The main benefit is the enhancement of mass transfer though the droplet/ continuous phase interface as demonstrated by other investigators (28-30 ).
46
HHyyddrrooddyynnaammiicc bbeehhaavviioorr aanndd mmaassss Prof. Dr. Hani A. Dammag
Vol.(5).lssue (9) 2013 Alandalus For Social and Applied Sciences
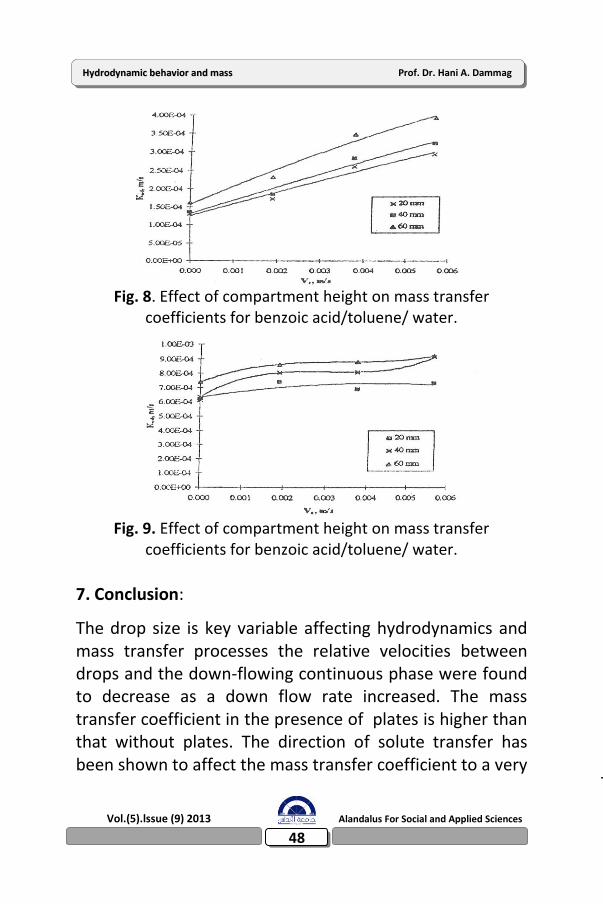
6.6. Effect of compartment height
The mass transfer coefficients slightly increased by increasing the height through which drops raise after leaving the plate ( fig 8, 9 ). This indicated that much of the mass transfer occurred at or near perforation at which the drops were formed. For liquid- liquid extraction, it can be concluded that efficiencies in the order of 70% to 80% are normally obtained for a perforated plate. The degree of enhancement of the dispersed phase film coefficient due to the presence of plates has been ascertainec. The experiments using variable rise heights indicate that most of the mass transfer occurs within a few centimeters of the plate. These considerations might suggest that a multi-plate column with high efficiency could be designed with a very close plate spacing. A common plate design with a free area of 42% was used throughout the experiments.
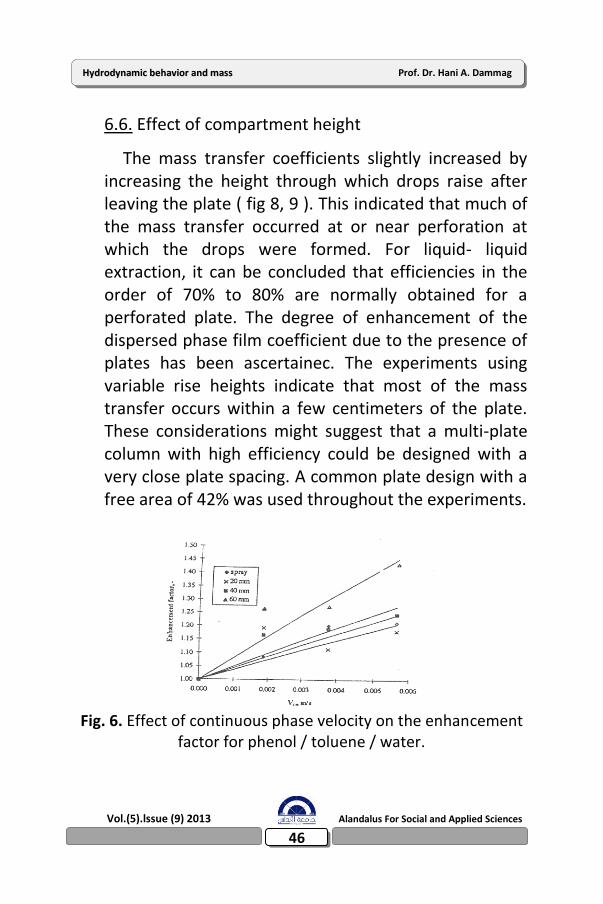
Fig. 6. Effect of continuous phase velocity on the enhancement
factor for phenol / toluene / water.
47
HHyyddrrooddyynnaammiicc bbeehhaavviioorr aanndd mmaassss Prof. Dr. Hani A. Dammag
Vol.(5).lssue (9) 2013 Alandalus For Social and Applied Sciences
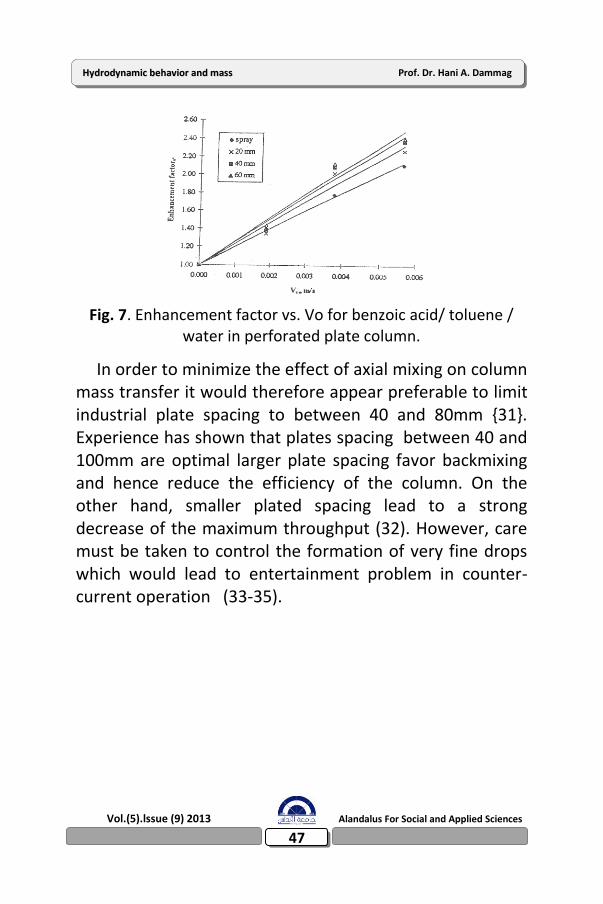
Fig. 7. Enhancement factor vs. Vo for benzoic acid/ toluene /
water in perforated plate column.
In order to minimize the effect of axial mixing on column mass transfer it would therefore appear preferable to limit industrial plate spacing to between 40 and 80mm {31}. Experience has shown that plates spacing between 40 and 100mm are optimal larger plate spacing favor backmixing and hence reduce the efficiency of the column. On the other hand, smaller plated spacing lead to a strong decrease of the maximum throughput (32). However, care must be taken to control the formation of very fine drops which would lead to entertainment problem in counter-current operation (33-35).
48
HHyyddrrooddyynnaammiicc bbeehhaavviioorr aanndd mmaassss Prof. Dr. Hani A. Dammag
Vol.(5).lssue (9) 2013 Alandalus For Social and Applied Sciences
Fig. 8. Effect of compartment height on mass transfer
coefficients for benzoic acid/toluene/ water.
Fig. 9. Effect of compartment height on mass transfer
coefficients for benzoic acid/toluene/ water.
7. Conclusion:
The drop size is key variable affecting hydrodynamics and mass transfer processes the relative velocities between drops and the down-flowing continuous phase were found to decrease as a down flow rate increased. The mass transfer coefficient in the presence of plates is higher than that without plates. The direction of solute transfer has been shown to affect the mass transfer coefficient to a very
49
HHyyddrrooddyynnaammiicc bbeehhaavviioorr aanndd mmaassss Prof. Dr. Hani A. Dammag
Vol.(5).lssue (9) 2013 Alandalus For Social and Applied Sciences
significant effect. The coefficients for mass transfer from the dispersed phase into the continuous phase direction (d c) are slightly higher than that for the opposite direction of transfer(c d). The mass transfer coefficient were found to be enhanced by circulation of the continuous phase. The effect of continuous phase velocity on the mass transfer coefficient is relatively significant with a slight increase in the drop size occurring with increasing flow rate. The mass transfer coefficient slightly increased by increasing the height through which drops raise after leaving the plate. Acknowledgement:
The author wish to express his thanks to Prof. H.A. farag and Prof. M Abdu razei. faculty of engineering Alexandria University for heir guidance and helpful comments. Notations : d Drop diameter m, c d Continuous to dispersed phase solute direction, d c Dispersed to continuous phase solute direction, E Degree of extraction, ( Ci – Co )/ (Ci – C* ), Kc , kd Contin. And disp. Phase mass, transfer coefficient, m/s kod Overall mass transfer coefficient, m/s. tf , tr Drop formation time, drop rise time respectively, s. VC , Vd Continuous phase velocity, dispersed phase velocity, m/s.
50
HHyyddrrooddyynnaammiicc bbeehhaavviioorr aanndd mmaassss Prof. Dr. Hani A. Dammag
Vol.(5).lssue (9) 2013 Alandalus For Social and Applied Sciences
Greek Letter μ Viscosity kg/m s. р Density kg/m3, and γ Interfacial tension, mN/m Subscripts c Continuous, and d Dispersed
References
51
HHyyddrrooddyynnaammiicc bbeehhaavviioorr aanndd mmaassss Prof. Dr. Hani A. Dammag
Vol.(5).lssue (9) 2013 Alandalus For Social and Applied Sciences
1. W.J. Andreson,. And H.R.C. Pratt, Chem. Eng. Sic., Vol.33(8), pp.995-1002 (1978).
2. .S. Laddha and T.E. Degaleesan, Transport Phenomena 3. J. D. Thornoron, The Science and Practice of liquid-liquid
Extraction, Oxford University Press, Oxford (1992) 4. Dammag. H. A., and Tekatshov C.M., First International Conference on Computational Methods in Multiphase Flow, University of Bitbsk , Rep. Belarusian, 11-13 July ., Book of Conference, pp 22-31 (1997).
4. J. Temos, H R. C. Pratt and G. W. Stevens, Chem. Eng., Vol. 51(1). pp.27-36 (2006)
5. - T. Misek, J. Schroter, EFCE Pub. Series (46), London(1985).
6. J. C. Godfrey, and M. J. Slater., Trans. IChmE., 69(A), pp.130-141 (1991)
7. P. J. Bailes, J. Gledhill, J. c. Godfrey, and M. J. Slater, Chem. Eng. Res.Des. Vol.64, Januarym pp.43-55 (1986).
8. A.H. P. Skaelland, and N. C. Vasti, Can j. Chem. Eng, Sci., Vol.63,2 pp. 233-245 (1985).
9. M.J. Slater, M. H. I., Baird, and T.B. Liang, Chem. Eng. Sci., Vol.63,2, pp. 233- 245 (1988)
10. - Z. fan, J.O. Oloidi, M.J. Salter, Chem. Eng. Res. Des. Vol.65, pp.243- 250 (1987)
11. Hu. And R. C. Kinter, AlChE J., pp.42-48 (2005) 12. A.J. Klee and R.E. Treybal, AIChE, Vol.2(4), pp.444 (1956). 13. A.J. Klee and R.E. Treybal, AIChE, Vol.2(4), pp.444 (1956). 14. - J. R. Grace, T.H. Wairegi, and T. H. Nguyen, Trans,
IChmE., Vol, 54,(3) pp167-173 (1979).
52
HHyyddrrooddyynnaammiicc bbeehhaavviioorr aanndd mmaassss Prof. Dr. Hani A. Dammag
Vol.(5).lssue (9) 2013 Alandalus For Social and Applied Sciences
15. B. Hoting, M. qi. And A. Vogelpohl, Proceeding ISEC 93, York, pp. 453-460 (1993).
16. H. Haverland, and M. J. Slater, chap. 10 in liquid Extraction Equipment, eds by Slater, M.J. and Godfery, J.c., pub, J. wiley and Sons, NY (1994).
17. D. H. Chen, and W.Y Fei, Solvent pp. 1523-1533 (1999) 18. H. Stawistowski, Interfacial Phenomena Extraction, C.
Hanson, ed,. Pergamon Press, Oxford (1971). 19. S. J. Proctor, M. W. Biddulph and K. R. Krishnamurthy,
AIChE, Vol.44 (4), pp.831-835 (2008). 20. M. A. Hashem, Proceeding of 3rd International
Conference RETBE, 2000, Faculty of Eng. Alexandria University, Egypt 18-20, Nov. (2000).
21. O. Levenspiel and W.K. Smith, Chem. Eng. Sci., Vol. 6, 227-232 (1957).
22. M. E. A. El-Hassan, Scott, D,S. and Wakao, N. Chem. Eng. Sci. Vol. 37, pp. 1151-1162 (1982).
23. J. Ingham, M.J. Slater and J. Retamales , Trans. IChmE,. Vol.73(A), pp.492-496 (1995).
24. – J. C. Godfrey, D.A. Houltion, S. T. Marley, A. Marrocchelli. and M. J. Slater, Chem.Eng.Res. Des., Vol.66 (5), pp 1039-1047 (2000).
25. H. D. Doan, and M.E. Fayed, Ind. Eng. Chem. Res., Vol. 39 (4), 445-456 (2000).
26. M. A. Hashem, and M.J. Slater, Proceeding of Fluid Mixing 5 Conference organized by the AICheE., University of Pradford, 4-5 July (1996).
27. W. Kowalski, and Z. Ziolkowski, Int.Vhme. Eng, Vol. 21,pp 232-237 (1981).
53
HHyyddrrooddyynnaammiicc bbeehhaavviioorr aanndd mmaassss Prof. Dr. Hani A. Dammag
Vol.(5).lssue (9) 2013 Alandalus For Social and Applied Sciences
28. P. J. Bailes, Ind. Chem. Process Des. Dev., Vol. 20, pp.564-570 (1977).
29. G. H. Sedahmed, A. M. El-kayar, H. A. Farag and S.A. Noseir, The Chemical Eng. Vol. 62, pp. 61-66 (1996).
30. I. Komasawa, and J. Ingham, Chem. Eng. Sci. Vol. 33, pp. 541-546 (1978).
31. H. W. Brandt, K. H. Reissinger, and J Schroter, Chem. Eng. Tech., Vol. 50 (5), pp. 345-354 (1978).
32. – M. H. I. Baird, S Vijayan, N,V. Rama and A. Rohatgi, The Canadian J. of Chem. Eng., Vol. 67, pp 787-800 (1989
33. Y. Kang, Y.J. Cho, K.J. Woo, K.I. Kim, and S. D. Kim, Chem, Eng. Sci, Vol. 55 (2) pp 411-419 (2000).
34. B. Z. Dlugogorski, S.A. Margabi, and G. J. Jameson, Chem.Sci., Vol.54 (8), pp.4007- 4082 (1999).
54
HHyyddrrooddyynnaammiicc bbeehhaavviioorr aanndd mmaassss Prof. Dr. Hani A. Dammag
Vol.(5).lssue (9) 2013 Alandalus For Social and Applied Sciences
ج السموك الهيدروديناويكي ووعاون انتقاه ألكتمه لمقطرة الوحيدة ألسائمه في أبرا
الاستخلاص
د. هاىي أحمد قاسه دماج ،
قسه الهيدسة الكينيائية، كمـــية الهيدســـة والبتـــرول - أستاذ الهيدسة الكينيائية المشارك
المكلا -الجنهورية الينيية-جامعة حضرموت لمعموو والتكيولوجيا
لأظىة تم في ذا البخث قاس وعاون اتقاه الكتم السمك الهدرداوك
وةةةي تم يلةةةعن العىةةةد في ظةةةاو 051عدةةةد وةةة السةةةا ن في عىةةةد ق ةةةز
مختمف كبرج اتلةار رةزج اةا وةقبة تم ء ةزاج التبةارخ را ةت دا
أظىةة كىا ةة مختمفةة أارةةط امخ أق ةةار مختمفةة رةةد ا ةةه عمةة
الق ةز يةير م وعةده ق زامخ امخ أحبا مختمف تم درا ة العققة رة ةزع
السةةزا لم ةةر السةةا ن عمةة السةةزع كةةذلم تم قةةاس وعاوةةن اتقةةاه الكتمةة
لمق ز الحد السا م أ اج اعدا في المةاج السةاك المةاج المتخةزك وقارة
بةي التا ج رتمم في رةزج انتلةار تم يدةد وعاوةن اتقةاه الكتمة كدالة
الق ةةةز ا ةةةةا اتقةةةاه الكتمةةةة الهةةةدرداوك اتقةةةةاه الكتمةةة ا السةةةةزع
السةةب لمق ةةز يةة ف كمىةةا ساد السةةزا العكسةة ا يةةير م ةةزع ال ةةر
المستىز عم وعده اتقاه الكتم اضح سةبا وةز سةاد في حبةي الق ةز كمىةا
اتقةةاه الكتمةة تبةة ل ةةد سادمخ ةةزع ال ةةر المسةةتىز ا در ةة التعبةةن في
ال ا قد يققت أخما فةن وعةاوقمخ اتقةاه الكتمة وة ال ةر الملةتت ء
ال ر المستىز أعم و في ان ا العكس أ و المستىز ء الملتت
الكمىةةةةامخ ألمفتاحةةةة لاأرةةةةزاج ان ةةةةت قدي السةةةةمك الهةةةةدرداوك الق ةةةةز
ن اتقاه ألكتم الحد ألسا م ي وعاو


![Construction material ssss[1]](https://img.pdfslide.us/doc/110x75/557c603dd8b42a3e2c8b47b1/construction-material-ssss1.jpg)


![Construction material ssss[1,k]](https://img.pdfslide.us/doc/110x75/5593688e1a28ab8a2d8b4723/construction-material-ssss1k.jpg)