Embed Size (px)
Citation preview

Hybrid Web Service Orchestration
Nikos KyprianouT
HE
U N I V E RS
IT
Y
OF
ED I N B U
RG
H
Master of Science
Computer Science
School of Informatics
University of Edinburgh
2008
Abstract
A service orchestration model which distributes the data flow while retaining the con-
trol flow centralised is the subject of this paper. More specifically, experiments were
devised and executed to determine its applicability as a superior substitute to tradi-
tional service orchestration models. The main criterion for superiority has been the
completion time for executing workflows of web service operations.
The experiment results indicate that indeed it is possible to have improvements
over the traditional orchestration model. However, it is also possible to misconfigure
the hybrid model, in which case the benefits may not only vanish, but it might be more
costly than the traditional model.
i

Acknowledgements
I will only acknowledge the mortal souls that have helped me on my way so far. Specif-
ically for this thesis, I would like to acknowledge the help my housemates, Nishad
Manerikar and Simone Fulvio Rollini have given me. Their knowledge of gnuplot
and LATEX, and more importantly their willingness and eagerness to help, cannot re-
main unacknowledged. Dr. Chris Brown, though slightly cynical and disbelieving,
managed to patch up my symptoms one by one to the extent where I could work on
this project. For that I can be nothing but thankful. I would also like to thank Archi-
mandrite Raphael Pavouris and Hieromonk Avraamy Neyman, not for any religious
reasons, but because they had always expressed what I interpreted as genuine interest
in my progress with the paper. Last, I’d like to thank Jano Van Hemert, Jon Weiss-
man and Adam Barker for not only chosing me for this project, but also for supporting
me throughout (though I have to admint Adam’s ”Good stuff” comments continue to
puzzle me).
Acknowledgements are free, yet their value can be priceless. I would like to thank
all my partners in crime that kept me company when it was past my bed-time and more
importantly, when it was past theirs. Not only did you keep my mind from idling down,
you also kept up my enthusiasm for completing this project. I thank all who asked me
how I was doing, and meant either my health or my thesis. I would like to thank you
for reading this section. I worked hard on this project, but completing this section has
given me greater joy.
I saved thanking my family for last. Not because I wouldn’t be here without them.
Perhaps I would. Not because they’ve spent a large sum of money on my education
over the year. Not even because they’ve supported me over the years. I may sound
selfish or just immature saying this, but I always took that as a given and an obligation.
I want to acknowledge them because it feels unapologetically right.
ii

Declaration
I declare that this thesis was composed by myself, that the work contained herein is
my own except where explicitly stated otherwise in the text, and that this work has not
been submitted for any other degree or professional qualification except as specified.
(Nikos Kyprianou)
iii

To Tefkros. I owed you one, and I still do. This is so I don’t forget that.
iv
Table of Contents
1 Introduction 1
2 Background 32.1 Web services . . . . . . . . . . . . . . . . . . . . . . . . . . . . . . 3
2.2 Web service composition . . . . . . . . . . . . . . . . . . . . . . . . 4
2.3 Workflow execution paradigms . . . . . . . . . . . . . . . . . . . . . 4
2.3.1 Orchestration model . . . . . . . . . . . . . . . . . . . . . . 4
2.3.2 Choreography model . . . . . . . . . . . . . . . . . . . . . . 5
2.3.3 Alternative model: Decentralised orchestration . . . . . . . . 5
2.3.4 Alternative model: Service Invocation Triggers . . . . . . . . 7
2.3.5 Alternative model: Hybrid orchestration . . . . . . . . . . . . 7
3 Hybrid orchestration model 93.1 Proxy . . . . . . . . . . . . . . . . . . . . . . . . . . . . . . . . . . 9
3.1.1 Proxy-Proxy (P-P) interaction . . . . . . . . . . . . . . . . . 9
3.1.2 Proxy-Workflow Web Service (P-WWS) interaction . . . . . 10
3.1.3 Proxy-Workflow Engine (P-WE) interaction . . . . . . . . . . 10
3.1.4 Storage . . . . . . . . . . . . . . . . . . . . . . . . . . . . . 11
3.1.5 State . . . . . . . . . . . . . . . . . . . . . . . . . . . . . . 11
3.1.6 Data handling . . . . . . . . . . . . . . . . . . . . . . . . . . 12
3.2 Workflow Web Service (WWS) . . . . . . . . . . . . . . . . . . . . . 12
3.3 Workflow engine . . . . . . . . . . . . . . . . . . . . . . . . . . . . 13
4 Implementation 144.1 Implementation architecture . . . . . . . . . . . . . . . . . . . . . . 14
4.1.1 Workflow Engine . . . . . . . . . . . . . . . . . . . . . . . . 14
4.1.2 P-WWS bundle . . . . . . . . . . . . . . . . . . . . . . . . . 15
4.2 Implementation details . . . . . . . . . . . . . . . . . . . . . . . . . 15
v
4.2.1 Workflow Engine . . . . . . . . . . . . . . . . . . . . . . . . 15
4.2.2 WWS . . . . . . . . . . . . . . . . . . . . . . . . . . . . . . 17
4.2.3 Proxy . . . . . . . . . . . . . . . . . . . . . . . . . . . . . . 17
5 Experiment design 215.1 Workflow patterns . . . . . . . . . . . . . . . . . . . . . . . . . . . . 21
5.1.1 Sequence . . . . . . . . . . . . . . . . . . . . . . . . . . . . 22
5.1.2 Fan-in . . . . . . . . . . . . . . . . . . . . . . . . . . . . . . 22
5.1.3 Fan-out . . . . . . . . . . . . . . . . . . . . . . . . . . . . . 23
5.2 Network characteristics . . . . . . . . . . . . . . . . . . . . . . . . . 24
5.2.1 Network topology . . . . . . . . . . . . . . . . . . . . . . . 24
5.2.2 Network load . . . . . . . . . . . . . . . . . . . . . . . . . . 25
5.3 Workflow characteristics . . . . . . . . . . . . . . . . . . . . . . . . 25
5.3.1 Data size . . . . . . . . . . . . . . . . . . . . . . . . . . . . 25
5.3.2 Workflow fragments . . . . . . . . . . . . . . . . . . . . . . 25
5.4 Proxy characteristics . . . . . . . . . . . . . . . . . . . . . . . . . . 26
5.4.1 Number of proxies . . . . . . . . . . . . . . . . . . . . . . . 26
5.4.2 Proxy placement . . . . . . . . . . . . . . . . . . . . . . . . 27
6 Experiment configuration 286.1 Results capture . . . . . . . . . . . . . . . . . . . . . . . . . . . . . 28
6.1.1 Proxy logging . . . . . . . . . . . . . . . . . . . . . . . . . . 28
6.1.2 Workflow engine logging . . . . . . . . . . . . . . . . . . . . 29
6.2 Experiment execution configuration . . . . . . . . . . . . . . . . . . 29
6.3 Software environment . . . . . . . . . . . . . . . . . . . . . . . . . . 30
6.4 Node configuration . . . . . . . . . . . . . . . . . . . . . . . . . . . 31
6.4.1 Workflow nodes . . . . . . . . . . . . . . . . . . . . . . . . 31
6.4.2 Engine nodes . . . . . . . . . . . . . . . . . . . . . . . . . . 31
6.5 University of Edinburgh configuration . . . . . . . . . . . . . . . . . 32
6.6 PlanetLab configuration . . . . . . . . . . . . . . . . . . . . . . . . . 32
7 Experiment results analysis 347.1 Basic experiments . . . . . . . . . . . . . . . . . . . . . . . . . . . . 34
7.2 Local LAN configuration . . . . . . . . . . . . . . . . . . . . . . . . 35
7.2.1 Workflow pattern: seq if . . . . . . . . . . . . . . . . . . . . 35
7.2.2 Workflow pattern: seq ninf . . . . . . . . . . . . . . . . . . . 40
vi
7.2.3 Comparison of seq if and seq ninf . . . . . . . . . . . . . . . 43
7.2.4 Workflow pattern: fan-in . . . . . . . . . . . . . . . . . . . . 47
7.2.5 Workflow pattern: fan-out . . . . . . . . . . . . . . . . . . . 52
7.3 Remote LAN configuration . . . . . . . . . . . . . . . . . . . . . . . 56
7.3.1 Workflow pattern: seq if . . . . . . . . . . . . . . . . . . . . 58
7.3.2 Workflow pattern: seq ninf . . . . . . . . . . . . . . . . . . . 61
7.3.3 Workflow pattern: fan-in . . . . . . . . . . . . . . . . . . . . 61
7.3.4 Workflow pattern: fan-out . . . . . . . . . . . . . . . . . . . 63
7.4 PlanetLab configuration . . . . . . . . . . . . . . . . . . . . . . . . . 64
7.4.1 4-node configurations . . . . . . . . . . . . . . . . . . . . . . 65
7.4.2 8-node configurations . . . . . . . . . . . . . . . . . . . . . . 70
7.4.3 16-node configuration: World . . . . . . . . . . . . . . . . . 72
7.5 Targeted tests . . . . . . . . . . . . . . . . . . . . . . . . . . . . . . 73
7.5.1 Node location . . . . . . . . . . . . . . . . . . . . . . . . . . 73
7.5.2 Web services per proxy . . . . . . . . . . . . . . . . . . . . . 74
7.6 General comments . . . . . . . . . . . . . . . . . . . . . . . . . . . 75
8 Discussion 778.1 Conclusions . . . . . . . . . . . . . . . . . . . . . . . . . . . . . . . 77
8.2 Future work . . . . . . . . . . . . . . . . . . . . . . . . . . . . . . . 78
A Experiment configuration properties 80
B Possible optimisations 83B.1 Data handling . . . . . . . . . . . . . . . . . . . . . . . . . . . . . . 83
B.2 Web service extensions support . . . . . . . . . . . . . . . . . . . . . 84
B.3 Message optimisation . . . . . . . . . . . . . . . . . . . . . . . . . . 85
B.4 Simpified proxy stack . . . . . . . . . . . . . . . . . . . . . . . . . . 86
Bibliography 87
vii
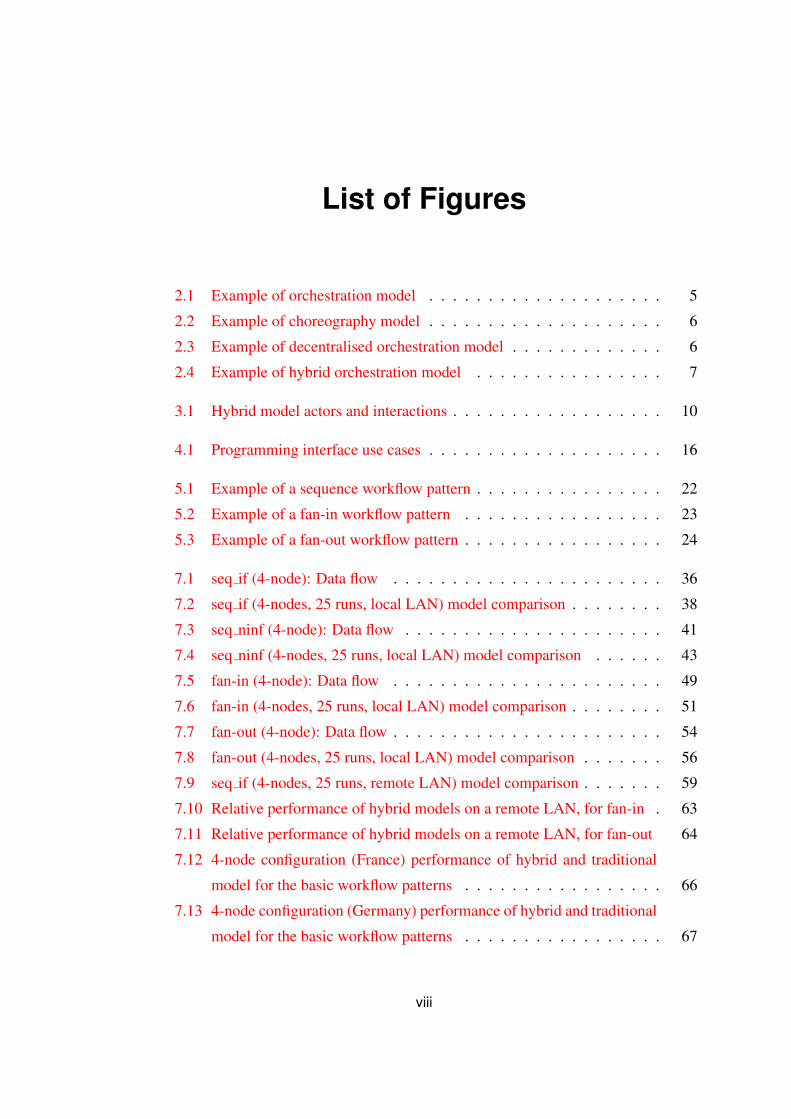
List of Figures
2.1 Example of orchestration model . . . . . . . . . . . . . . . . . . . . 5
2.2 Example of choreography model . . . . . . . . . . . . . . . . . . . . 6
2.3 Example of decentralised orchestration model . . . . . . . . . . . . . 6
2.4 Example of hybrid orchestration model . . . . . . . . . . . . . . . . 7
3.1 Hybrid model actors and interactions . . . . . . . . . . . . . . . . . . 10
4.1 Programming interface use cases . . . . . . . . . . . . . . . . . . . . 16
5.1 Example of a sequence workflow pattern . . . . . . . . . . . . . . . . 22
5.2 Example of a fan-in workflow pattern . . . . . . . . . . . . . . . . . 23
5.3 Example of a fan-out workflow pattern . . . . . . . . . . . . . . . . . 24
7.1 seq if (4-node): Data flow . . . . . . . . . . . . . . . . . . . . . . . 36
7.2 seq if (4-nodes, 25 runs, local LAN) model comparison . . . . . . . . 38
7.3 seq ninf (4-node): Data flow . . . . . . . . . . . . . . . . . . . . . . 41
7.4 seq ninf (4-nodes, 25 runs, local LAN) model comparison . . . . . . 43
7.5 fan-in (4-node): Data flow . . . . . . . . . . . . . . . . . . . . . . . 49
7.6 fan-in (4-nodes, 25 runs, local LAN) model comparison . . . . . . . . 51
7.7 fan-out (4-node): Data flow . . . . . . . . . . . . . . . . . . . . . . . 54
7.8 fan-out (4-nodes, 25 runs, local LAN) model comparison . . . . . . . 56
7.9 seq if (4-nodes, 25 runs, remote LAN) model comparison . . . . . . . 59
7.10 Relative performance of hybrid models on a remote LAN, for fan-in . 63
7.11 Relative performance of hybrid models on a remote LAN, for fan-out 64
7.12 4-node configuration (France) performance of hybrid and traditional
model for the basic workflow patterns . . . . . . . . . . . . . . . . . 66
7.13 4-node configuration (Germany) performance of hybrid and traditional
model for the basic workflow patterns . . . . . . . . . . . . . . . . . 67
viii
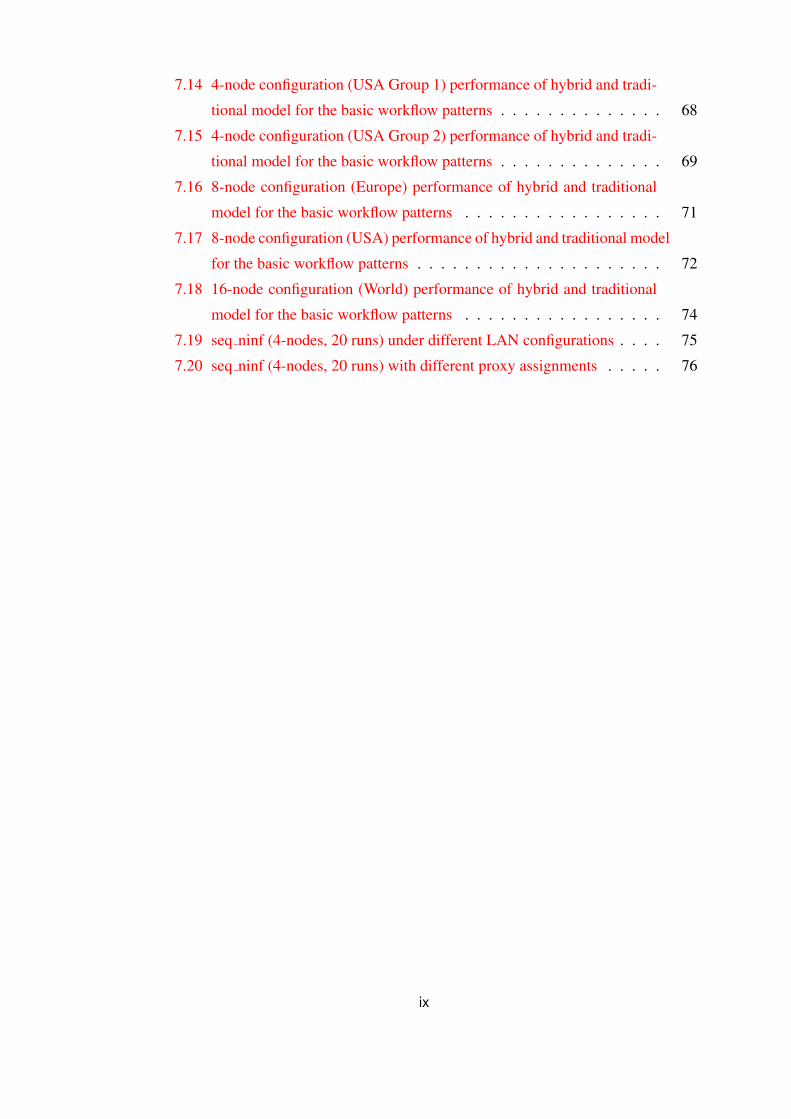
7.14 4-node configuration (USA Group 1) performance of hybrid and tradi-
tional model for the basic workflow patterns . . . . . . . . . . . . . . 68
7.15 4-node configuration (USA Group 2) performance of hybrid and tradi-
tional model for the basic workflow patterns . . . . . . . . . . . . . . 69
7.16 8-node configuration (Europe) performance of hybrid and traditional
model for the basic workflow patterns . . . . . . . . . . . . . . . . . 71
7.17 8-node configuration (USA) performance of hybrid and traditional model
for the basic workflow patterns . . . . . . . . . . . . . . . . . . . . . 72
7.18 16-node configuration (World) performance of hybrid and traditional
model for the basic workflow patterns . . . . . . . . . . . . . . . . . 74
7.19 seq ninf (4-nodes, 20 runs) under different LAN configurations . . . . 75
7.20 seq ninf (4-nodes, 20 runs) with different proxy assignments . . . . . 76
ix
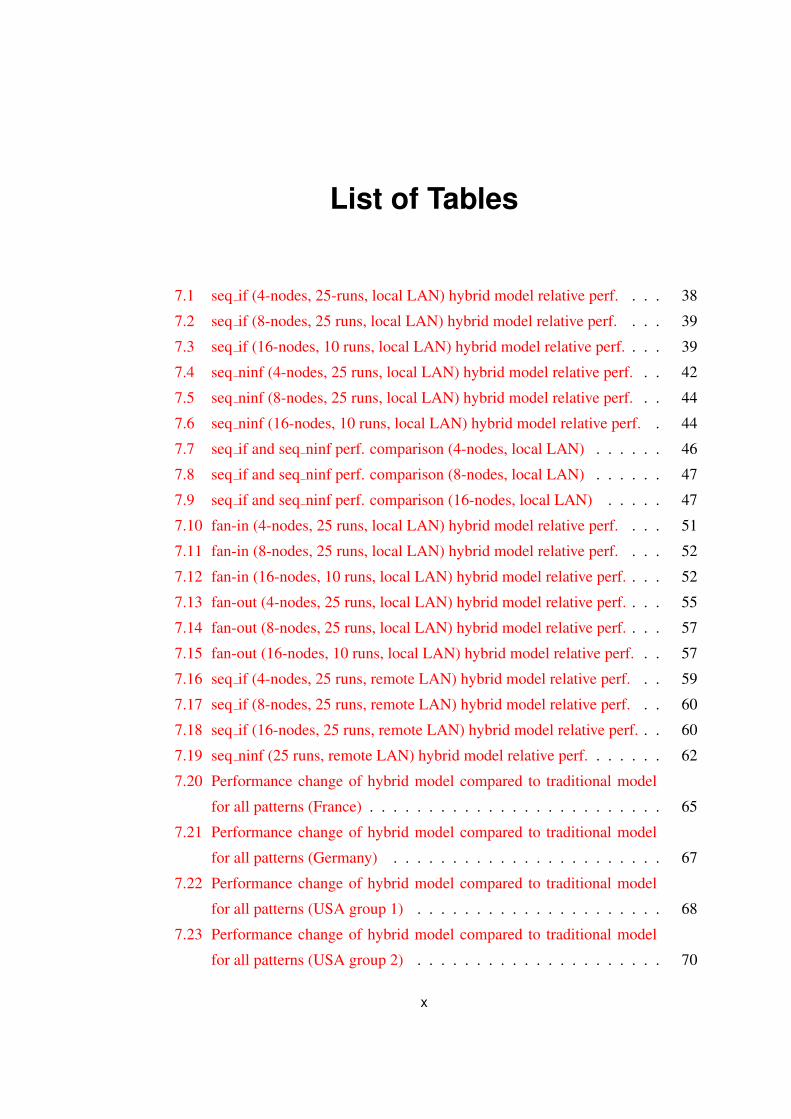
List of Tables
7.1 seq if (4-nodes, 25-runs, local LAN) hybrid model relative perf. . . . 38
7.2 seq if (8-nodes, 25 runs, local LAN) hybrid model relative perf. . . . 39
7.3 seq if (16-nodes, 10 runs, local LAN) hybrid model relative perf. . . . 39
7.4 seq ninf (4-nodes, 25 runs, local LAN) hybrid model relative perf. . . 42
7.5 seq ninf (8-nodes, 25 runs, local LAN) hybrid model relative perf. . . 44
7.6 seq ninf (16-nodes, 10 runs, local LAN) hybrid model relative perf. . 44
7.7 seq if and seq ninf perf. comparison (4-nodes, local LAN) . . . . . . 46
7.8 seq if and seq ninf perf. comparison (8-nodes, local LAN) . . . . . . 47
7.9 seq if and seq ninf perf. comparison (16-nodes, local LAN) . . . . . 47
7.10 fan-in (4-nodes, 25 runs, local LAN) hybrid model relative perf. . . . 51
7.11 fan-in (8-nodes, 25 runs, local LAN) hybrid model relative perf. . . . 52
7.12 fan-in (16-nodes, 10 runs, local LAN) hybrid model relative perf. . . . 52
7.13 fan-out (4-nodes, 25 runs, local LAN) hybrid model relative perf. . . . 55
7.14 fan-out (8-nodes, 25 runs, local LAN) hybrid model relative perf. . . . 57
7.15 fan-out (16-nodes, 10 runs, local LAN) hybrid model relative perf. . . 57
7.16 seq if (4-nodes, 25 runs, remote LAN) hybrid model relative perf. . . 59
7.17 seq if (8-nodes, 25 runs, remote LAN) hybrid model relative perf. . . 60
7.18 seq if (16-nodes, 25 runs, remote LAN) hybrid model relative perf. . . 60
7.19 seq ninf (25 runs, remote LAN) hybrid model relative perf. . . . . . . 62
7.20 Performance change of hybrid model compared to traditional model
for all patterns (France) . . . . . . . . . . . . . . . . . . . . . . . . . 65
7.21 Performance change of hybrid model compared to traditional model
for all patterns (Germany) . . . . . . . . . . . . . . . . . . . . . . . 67
7.22 Performance change of hybrid model compared to traditional model
for all patterns (USA group 1) . . . . . . . . . . . . . . . . . . . . . 68
7.23 Performance change of hybrid model compared to traditional model
for all patterns (USA group 2) . . . . . . . . . . . . . . . . . . . . . 70
x

7.24 Performance change of hybrid model compared to traditional model
for all patterns (Europe) . . . . . . . . . . . . . . . . . . . . . . . . . 71
7.25 Performance change of hybrid model compared to traditional model
for all patterns (USA) . . . . . . . . . . . . . . . . . . . . . . . . . . 73
7.26 Performance change of hybrid model compared to traditional model
for all patterns (World) . . . . . . . . . . . . . . . . . . . . . . . . . 73
xi
Chapter 1
Introduction
As applications continue to move away from the desktop and onto the network, the
importance of well-performing web applications increases. Whereas many of the mi-
gratory desktop applications make their transition as lightweight web applications with
few data demands, not all applications are created equal. The applications used by
collaborating scientists and academics around the world, in their attempts to cure life’s
ills and solve problems of unimaginable complexity, are very often data-intensive. And
while mankind’s will may be strong and the required processing power readily avail-
able, the fickle ether that is today’s network cloud, is increasingly becoming a bot-
tleneck. This is because traditionally, the data being transferred collapses to a single
point, the application coordinator. Successful attempts at eliminating this bottleneck
could quite realistically have profound effects on the world as we know it.
Communicating the data required or produced by data-intensive web applications
may have a high cost, both in terms of time and the use of network resources. This is
especially true in this age of wide-spread deployment of services over the web. Appli-
cation developers are integrating these services in order to form a logically cohesive,
yet loosely coupled, new application, or workflow. And whereas the developers simply
coordinate the different services, the system designers are looking at ways of optimis-
ing the performance of such workflows.
This paper attempts to evaluate the performance of a proposed alternative to exist-
ing workflow execution models. The hybrid orchestration model attempts to eliminate
the bottlenecks in today’s centrally-coordinated models. It does so my relieving the
load of the central bottleneck by keeping data closer to where it is used.
In this paper, we will investigate under which conditions the proposed model achieves
its goals, or whether it is inherently a better model. The limitations of this proposed
1

Chapter 1. Introduction 2
model are another area to be investigated, as are the environments in which it oper-
ates. Underlying the entire paper is the hypothesis being tested: does the hybrid or-
chestration model have a better performance executing workflows that the traditional
centralised orchestration model?
The model itself is described in further detail in Chapter 3, followed by a descrip-
tion of its implementation (Chapter 4) which was used for carrying out this paper’s
experiments. The purpose of the experiments (Chapter 5), their configuration (Chapter
6) and their results (Chapter 7) follows. The paper concludes with alternative solutions
and possible further work. Our first task however is to take a closer look at the domain
in which the model is to operate.
Chapter 2
Background
By combining functionality provided by multiple applications new, composite appli-
cation can be created. The topic of this paper is the analysis of a proposed model for
coordinating and executing such composite applications which are distributed over a
network. This chapter introduces the domain within which the proposed model oper-
ates and describes the alternatives.
2.1 Web services
Service-oriented architecture (SOA) is an architectural paradigm where software appli-
cations are built using loosely coupled distributed services. A SOA defines the services
of which a system is composed and how they interact in order to accomplish a certain
system behaviour. As an example, ordering a travel package online is presented as a
single application, but could involve the use of a number of services (e.g., selecting a
hotel, an airline, renting a car).
Web services architecture [1] is an attempt at standardising services for SOA for
web applications using simple, interoperable standards (XML, WSDL, SOAP, etc).
Web services are described as a software system that allows machine-to-machine in-
teraction over a communication network.
The Web Services Description Language (WSDL) [2] is used to describe the web
service interface. An XML document written using WSDL for a web service will
provide how a web service will be invoked, what input is expected and what output is
returned.
Simple Object Access Protocol (SOAP) [3] defines the semantics for the data being
exchanged. When a web service request is made, the web service expects the data to be
3
Chapter 2. Background 4
XML which conforms to the SOAP, as defined in the web service WSDL description.
Though the SOAP specification did not place requirements on which transport protocol
it should be used with, the Web Services Interoperability organisation has mandated
that HTTP always be used [4].
2.2 Web service composition
Whereas a single web service should provide a single service (or a family of related
services), an application may need to access different web services in order to provide
its solution. Such applications are commonly referred to as composite applications.
A web service used by a composite application satisfies a request for a specific
operation (which would be a single step in the application logic). The sequence of tasks
executed when following the application logic is the composite application’s workflow.
For instance, in an on-line ticket ordering composite application, web services
would be used to provide individual tasks of the workflow. A web service opera-
tion could be used to check whether a particular seat is available. The workflow of the
application however, would include selecting an event, the seat section, the seat itself,
repeating the steps in order to select another seat, and purchasing the tickets.
Data-intensive workflows are characterised by communication patterns of high vol-
ume of data. In compute-intensive workflows, heavy computing/processing is an im-
portant part of the workflow. In data-centric workflows the aim is to route data so that
it is available when needed.
2.3 Workflow execution paradigms
An important aspect of web service composition is the approach taken to coordinate its
execution. Two differing paradigms have been put forth as possible solutions for this
issue: web service orchestration and web service choreography.
2.3.1 Orchestration model
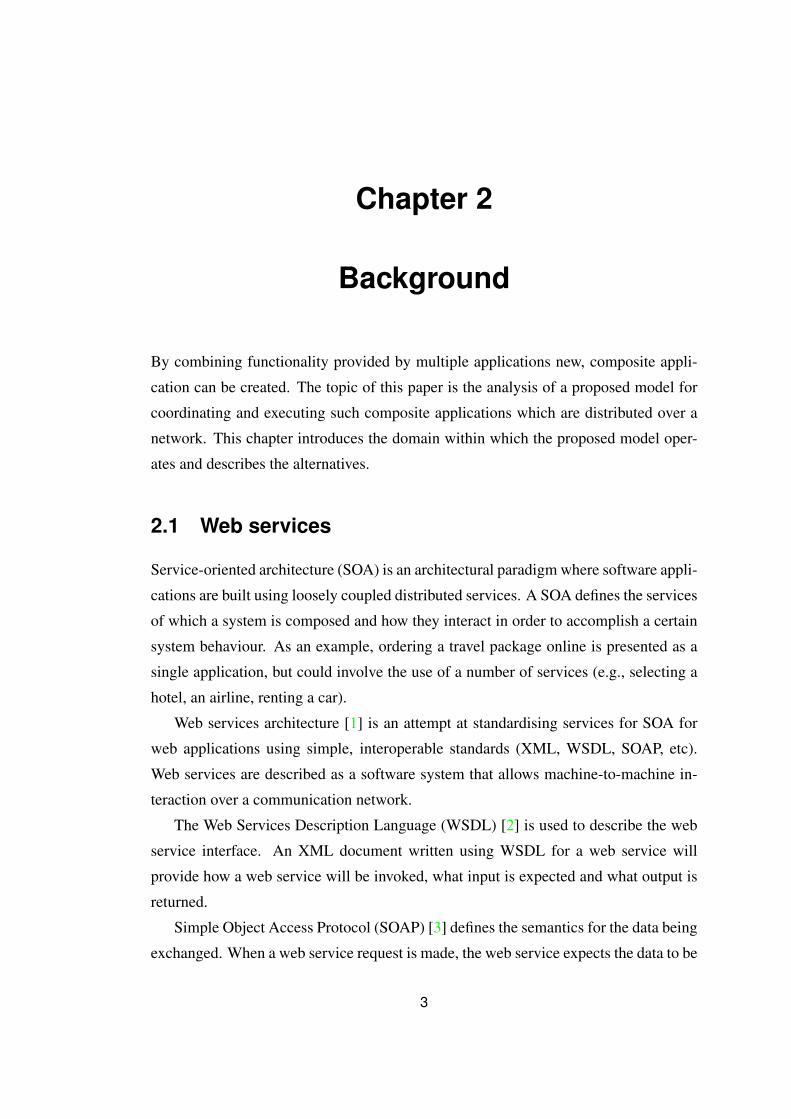
Service orchestration (Figure 2.1) is a centralised approach which discriminates be-
tween control and data flow. Control flow are the tasks needed to control/orchestrate
the workflow, whereas data flow relates to the the tasks that compose the actual ap-
plication. In service orchestration, all communication is routed via a central process
Chapter 2. Background 5
(workflow engine) for both the control and data flow.
Figure 2.1: Orchestration: The workflow engine orchestrates the workflow by coordi-
nating the invocation of the web services
In the web service world, Web Services Business Process Execution Language
(WS-BPEL) [5] has become the de facto standard for orchestration. With WS-BPEL,
the workflow can be defined without the need to modify any of the services, with the
central process providing the workflow logic.
2.3.2 Choreography model
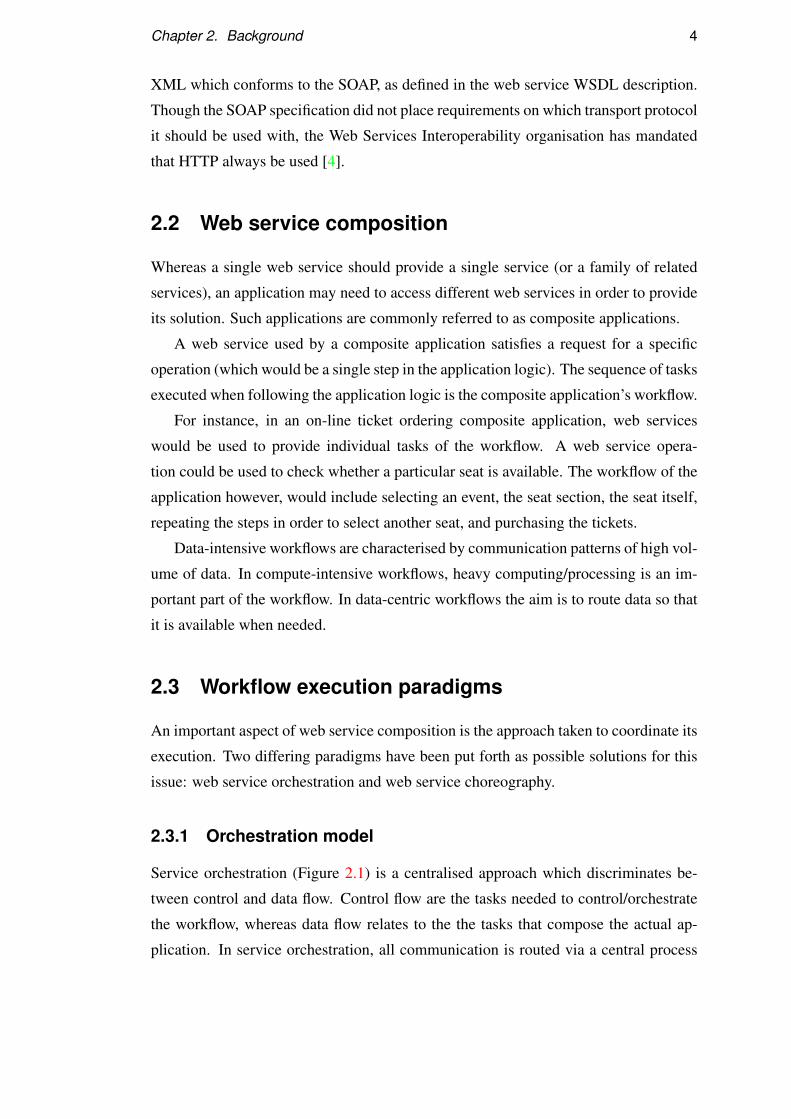
Service choreography (Figure 2.2) does away with the centralised process and instead
each collaborating service is aware of its part in the workflow. In this decentralised
approach, the collaborating services exchange messages in order to coordinate execu-
tion of the workflow. Note that in order for this collaboration to take place, the web
services need to be modified so that they are aware of the workflows they are involved
in.
A specification has been put forth for web service choreography in the Web Ser-
vices Choreography Description Language (WS-CDL) [6]. This approach has so far
not been widely used, nor are there many implementations of the specification.
2.3.3 Alternative model: Decentralised orchestration
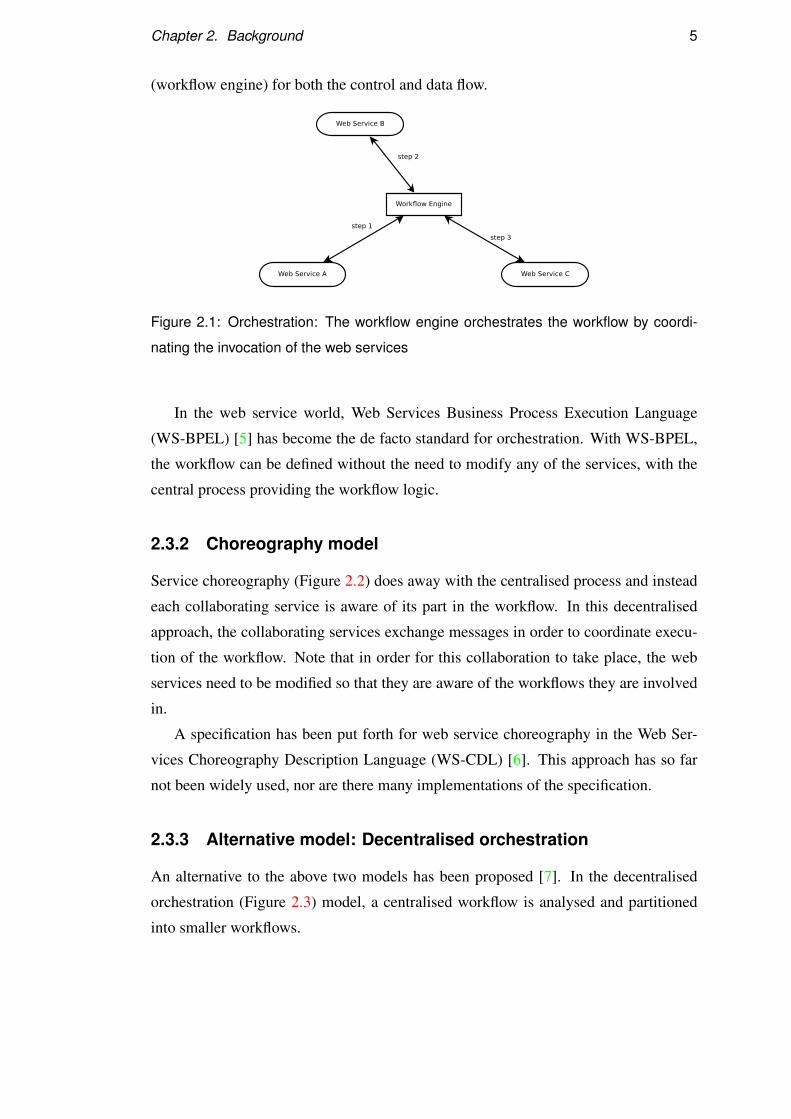
An alternative to the above two models has been proposed [7]. In the decentralised
orchestration (Figure 2.3) model, a centralised workflow is analysed and partitioned
into smaller workflows.
Chapter 2. Background 6
Figure 2.2: Choreography: The web services coordinate each other’s invocations in
order to complete the workflow
Figure 2.3: Decentralised orchestration: Each workflow engine orchestrates its own
partition of the overall workflow.
Multiple workflow engines are used to execute the partitioned workflows (each
executing its own partition). This removes potential bottlenecks that would exist had a
central workflow engine been used.
Decentralised orchestration was found to minimise the amount of communication
in the workflow. This approach increases the complexity of the workflow design and
execution, while deadlock can be introduced.
The general approach to this model is similar to that of parallel programming.
The program (workflow) is partitioned, and a different processor (workflow engine)
executes the workflow.
Chapter 2. Background 7
2.3.4 Alternative model: Service Invocation Triggers
Service Invocation Triggers [8] act as proxies for each service invocation. To do this,
the workflow needs to be fragmented into simple (with no loops, no conditionals, se-
quential) fragments. Triggers are created for each invocation and they are aware of
data-dependencies.
By knowing which response is associated with which trigger, the receipt of that
response triggers the invocation. Since the requests are handled by the triggers, the
intermediate results never reach the web service client. This is an obtrusive solution
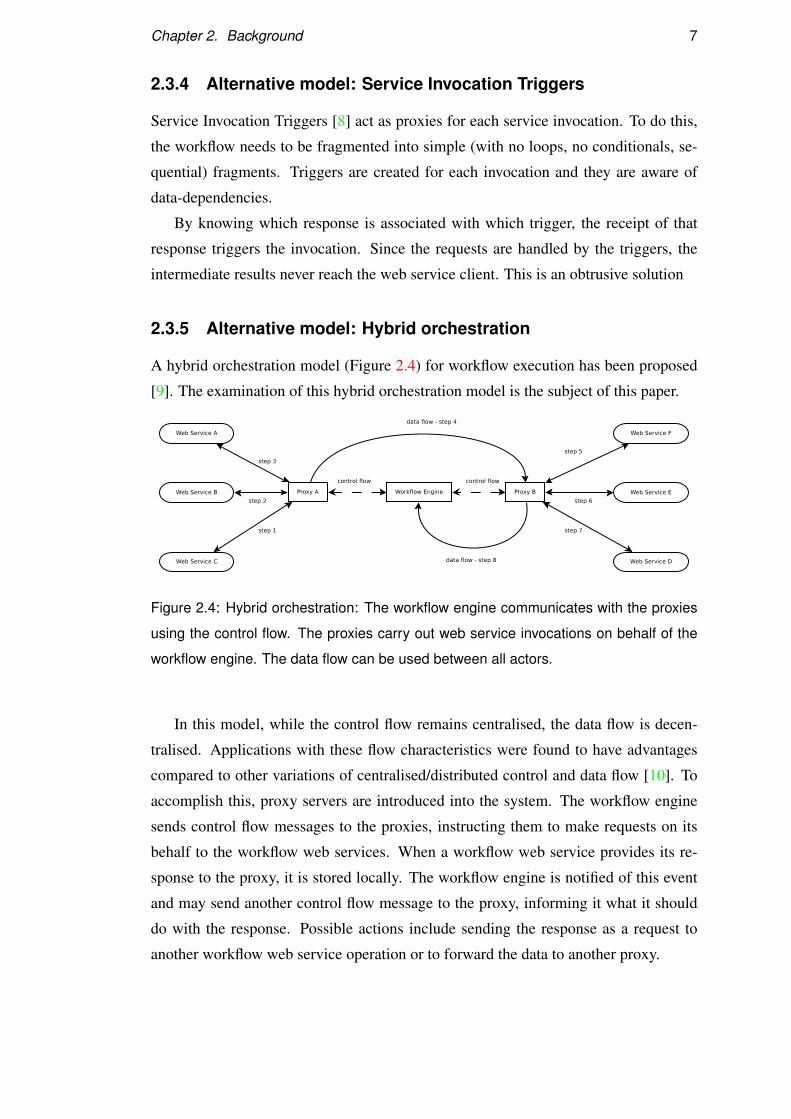
2.3.5 Alternative model: Hybrid orchestration
A hybrid orchestration model (Figure 2.4) for workflow execution has been proposed
[9]. The examination of this hybrid orchestration model is the subject of this paper.
Figure 2.4: Hybrid orchestration: The workflow engine communicates with the proxies
using the control flow. The proxies carry out web service invocations on behalf of the
workflow engine. The data flow can be used between all actors.
In this model, while the control flow remains centralised, the data flow is decen-
tralised. Applications with these flow characteristics were found to have advantages
compared to other variations of centralised/distributed control and data flow [10]. To
accomplish this, proxy servers are introduced into the system. The workflow engine
sends control flow messages to the proxies, instructing them to make requests on its
behalf to the workflow web services. When a workflow web service provides its re-
sponse to the proxy, it is stored locally. The workflow engine is notified of this event
and may send another control flow message to the proxy, informing it what it should
do with the response. Possible actions include sending the response as a request to
another workflow web service operation or to forward the data to another proxy.

Chapter 2. Background 8
As observed in [11] the placement of the proxies may improve the performance
of the hybrid model as compared to the traditional orchestration model. For example,
under the traditional model, all data would have to be sent to the workflow engine
which may be at a remote location (compared to the web services). In the hybrid model
a proxy can be placed closer to the web services (for instance in the same domain),
thereby incurring a lower cost for data transfer. Besides locality, proxies may be placed
at interesting sites, which are defined as sites which provide some added benefit to the
overall workflow.
Chapter 3
Hybrid orchestration model
The contribution of the hybrid model is the introduction of the proxy. The proxy
is partnered with the workflow engine, but attempts to be a non-disruptive extension
to the traditional orchestration model. This chapter examines how the proxy can be
designed in order to satisfy this requirement, since the features made available by the
proxy define how a traditional workflow engine can interact with it to execute the
worfklow.
3.1 Proxy
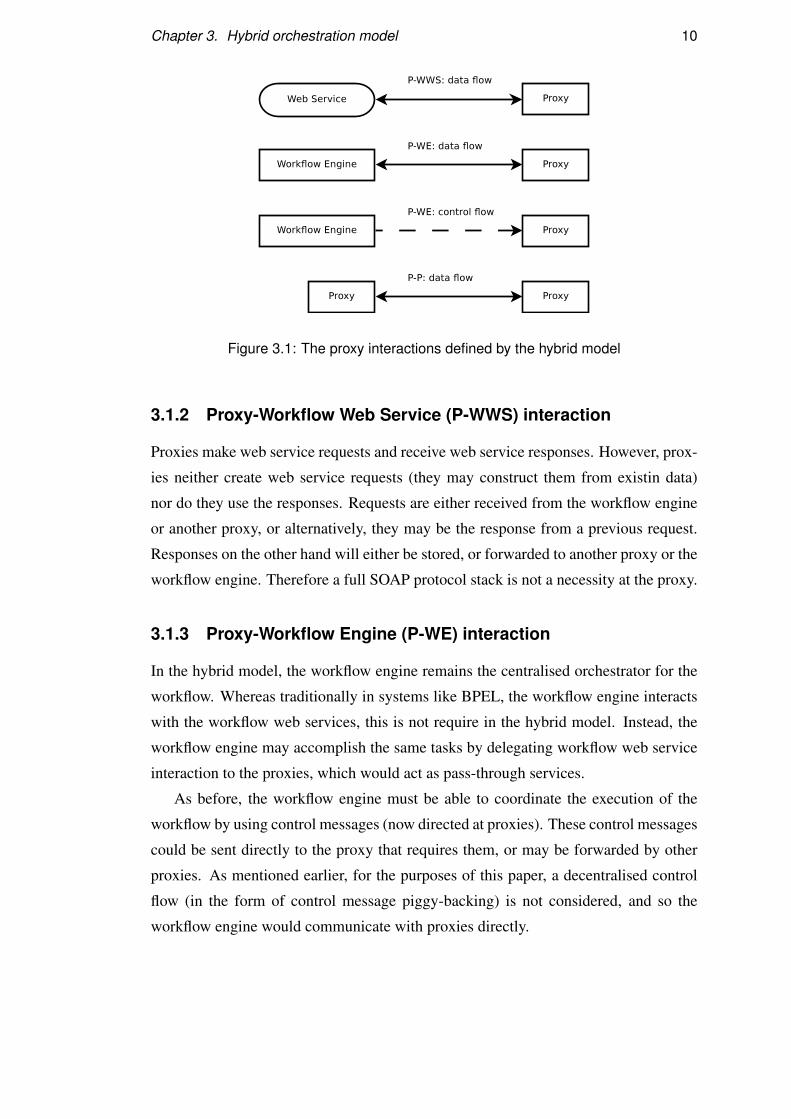
Proxies will need to interact with three actors (Figure 3.1): the workflow engine, other
proxies and the workflow web services. Examining the interaction proxies may have
with each of these actors exposes the desired interface for the proxies. The expectation
is that the minimising the cost of data handling and communicating control flow mes-
sages is not as beneficial as minimising the cost of communicating the large data flows
associated with the workflows.
3.1.1 Proxy-Proxy (P-P) interaction
In the hybrid model, data flow is decentralised. Instead of sending all data back to the
workflow engine, data may remain on the proxy. In order for the workflow to continue,
the data on a proxy, would have to be sent to other proxies. This requirement implies
that a mechanism exists for proxies to exchange data messages.
9
Chapter 3. Hybrid orchestration model 10
Figure 3.1: The proxy interactions defined by the hybrid model
3.1.2 Proxy-Workflow Web Service (P-WWS) interaction
Proxies make web service requests and receive web service responses. However, prox-
ies neither create web service requests (they may construct them from existin data)
nor do they use the responses. Requests are either received from the workflow engine
or another proxy, or alternatively, they may be the response from a previous request.
Responses on the other hand will either be stored, or forwarded to another proxy or the
workflow engine. Therefore a full SOAP protocol stack is not a necessity at the proxy.
3.1.3 Proxy-Workflow Engine (P-WE) interaction
In the hybrid model, the workflow engine remains the centralised orchestrator for the
workflow. Whereas traditionally in systems like BPEL, the workflow engine interacts
with the workflow web services, this is not require in the hybrid model. Instead, the
workflow engine may accomplish the same tasks by delegating workflow web service
interaction to the proxies, which would act as pass-through services.
As before, the workflow engine must be able to coordinate the execution of the
workflow by using control messages (now directed at proxies). These control messages
could be sent directly to the proxy that requires them, or may be forwarded by other
proxies. As mentioned earlier, for the purposes of this paper, a decentralised control
flow (in the form of control message piggy-backing) is not considered, and so the
workflow engine would communicate with proxies directly.
Chapter 3. Hybrid orchestration model 11
3.1.4 Storage
The proxy will need to store responses from web services. As scientific workflows
may deal with large volumes of data, and the proxy may be handling multiple requests
concurrently, keeping responses in memory may not be feasible. Whether or not to
write responses to permanent storage cannot be determined by the workflow engine,
as the proxy may be handling requests from multiple workflow engines. This role
will instead be the responsibility of the proxy and will be based on the current state
(and available resources) of the machine on which it executes. This introduces a level
of non-determinism into the performance evaluation of the hybrid approach since the
varying workload of the machine impacts the performance of the proxy. A force-write
policy could be enforced so that all data is always written to permanent storage, though
this too may hamper performance.
3.1.5 State
Whether or not proxies need to maintain state depends largely on whether a syn-
chronous or asynchronous communication model is implemented for P-WE interac-
tion. With asynchronous communication, the workflow engine would instruct the
proxy on what action to execute and then terminate its connection. The proxy would
perform the required action and once completed, initiate a new connection with the
workflow engine. To accomplish this, it would have to maintain state information for
pending requests, possibly by mapping task identifiers to network ports/connections.
If synchronous communication is used, then it is possible to relax the state main-
tenance requirements. With synchronous communication, the workflow engine keeps
its connection (per request) to the proxy open, waiting for its response. This is the
approach taken in the paper.
Irrespective of the communication model used, some state will always need to be
maintained at the proxy. This is because it will need to store web service responses
which may be used for any number of different web service requests. In other words,
there is no guarantee that a web service response will be consumed immediately.
The proxy is also in a position to help the workflow engine in optimising the work-
flow through the use of statistics. Although analysis of the statistics may not be the
responsibility of the proxy, the proxies need to record metrics that can be analysed. For
example, for each request-response pair, the size of the request and response should be
recorded, as should the delay between making the request and when the first bytes of
Chapter 3. Hybrid orchestration model 12
the response are received. This is especially true for the purposes of this paper, where
the performance of the hybrid model needs to be analysed.
3.1.6 Data handling
As web services are developed by multiple organisations, the web services involved in
a workflow may not share a common interface. This could extend both to the message
and type formats used. Some scenarios where data transformations might be needed:
1. Typed values: One web service may indicate a boolean value with an integer
type, another with a text value, and yet another could use boolean value.
2. Headers: One web service may require headers for all its messages, whereas
another might not.
3. General transformations: The output of one web service operation cannot be sup-
plied as input to another web service operation unaltered. It might be necessary
to drop elements, add new ones or somehow modify the response.
For the purposes of this paper, data transformation will not be used. It is further
assumed that a web service response may be used to construct a request for any other
web service invocation.
3.2 Workflow Web Service (WWS)
Web services used in existing workflows may not be available inside the experiment
test bed for this project. Therefore, web services will have to be otherwise provided.
One such way is by introducing a simple web service into the system that can be used
to construct new workflows.
Computation costs of the WWS are not an issue for this project, since its purpose
is to examine the effect of performance due to communication costs. As existing web
services (or data sources) will not be available in the experiment test bed, the web
services used should be able to generate data to be included in their responses. To
be able to be used as input for other web services, the specification of the input and
output data should be compatible (considering data transformations will not be used).
To allow for variability in the experiments conducted, the amount of data returned by
WWS should be configurable
Chapter 3. Hybrid orchestration model 13
3.3 Workflow engine
In the traditional model, the workflow engine may maintain state (e.g., for each current
workflow execution instance, what are the requests that are pending) of the different
WWS in order to determine what to do next in the workflow. The introduction of prox-
ies however, necessitates that state be maintained for them as well. State information
in this case could be what data exist on which proxies, with what identifiers are they
tagged, etc.
Chapter 4
Implementation
With the basic design of the hybrid model (and its proxy) already defined, this chapter
takes a look at a concrete implementation of the entire model. The interface to the
WWS and the proxy are explained, and a brief overview of the workflow engine im-
plementation is given. The following sections detail the implementation of the proxy
architecture and address the reasons behind taking certain implementation decisions.
4.1 Implementation architecture
The implementation of the hybrid model used in this project consists of two compo-
nents, the P-WWS bundle and the workflow engine. P-WWS contains an implementa-
tion of a basic workflow web service and a proxy. The workflow engine components
contains an implementation of a simple traditional workflow engine, a hybrid workflow
engine, as well as functionality needed for executing workflow tests.
4.1.1 Workflow Engine
The workflow engine controls the execution of workflows. In the traditional model,
the workflow engine interacts directly with the web services by making web service
operation requests and processing the responses. In the hybrid workflow architecture,
at the very least, the workflow engine must be able to communicate with the proxies.
It is also possible that the workflow engine interacts with some web services directly.
This could be the case when proxies are not available or when the cost of invoking its
operations directly lowers the overall cost of the workflow.
14
Chapter 4. Implementation 15
4.1.2 P-WWS bundle
A proxy is used to interact with the WWS (making requests), proxies (forwarding data)
and workflow engines (workflow control data). Since it interacts with web services, it
should contain a SOAP-capable web service client.
P-WE communication is not bound by this restriction. That is, a non-standard,
non-SOAP family of protocols could be used for the interaction of proxies with the
workflow engine. It should be noted, that traditional workflow engines have been
designed to interact with web services. As the project aims to examine the behaviour
of the hybrid model with existing workflow engines, minimal changes to these engines
should be made. This would be the case if the proxy was also a web service itself. This
would allow the workflow engine to continue to act as a web service client, but instead
of interacting with WWS, it would interact with their corresponding proxies.
Similarly, P-P communication need not be based on SOAP. For the purposes of
this project this liberty was not taken. Since proxies can act as web services and web
service clients, they have been implemented to provide web service operations so that
proxies communicate between themselves over SOAP.
The P-WWS bundle also includes a workflow web service, i.e., one that could be
used in a workflow. Although existing web services could be used, this bundle includes
a simple web service providing a trivial operation. One reason behind this simplifica-
tion is the need to minimise the processing time of the workflows. Existing web ser-
vices could introduce a variable processing time which might not be controllable. In
addition, the experiment test bed may not lend itself for deployment of real-world web
services for building a workflow.
4.2 Implementation details
The following section describes the programming interface for the different compo-
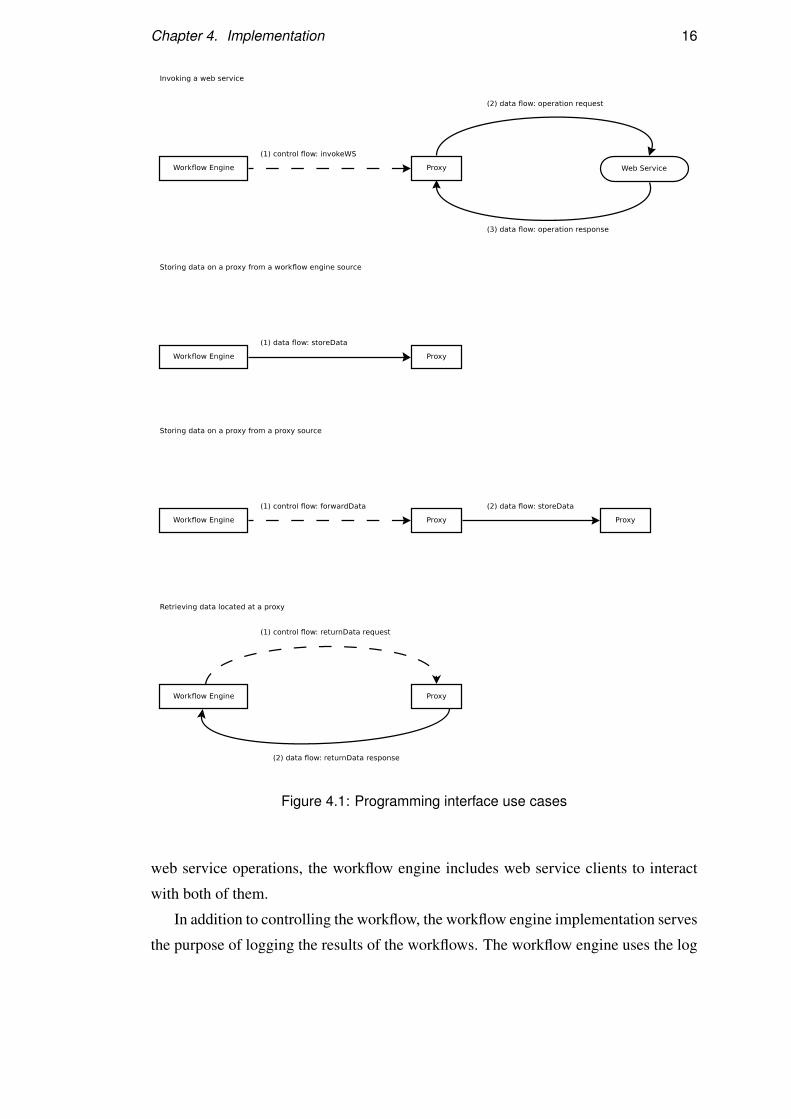
nents of the software system. Figure 4.1 summarises the programming interface by
presenting the system’s use cases.
4.2.1 Workflow Engine
The implemented workflow engine provides the functionality of a traditional workflow
engine, as well as the ability to interact with proxies of the hybrid workflow architec-
ture. As all interactions with proxies and workflow web services are of the form of
Chapter 4. Implementation 16
Figure 4.1: Programming interface use cases
web service operations, the workflow engine includes web service clients to interact
with both of them.
In addition to controlling the workflow, the workflow engine implementation serves
the purpose of logging the results of the workflows. The workflow engine uses the log
Chapter 4. Implementation 17
results to calculate certain statistical metrics at runtime. These logs and metrics form
the basis of the experimental results and their analysis. The workflow engine is also
responsible for loading the experiment configurations
4.2.2 WWS
The web services used in the workflows all share the same interface. Only one opera-
tion is available as part of the web service implementation.
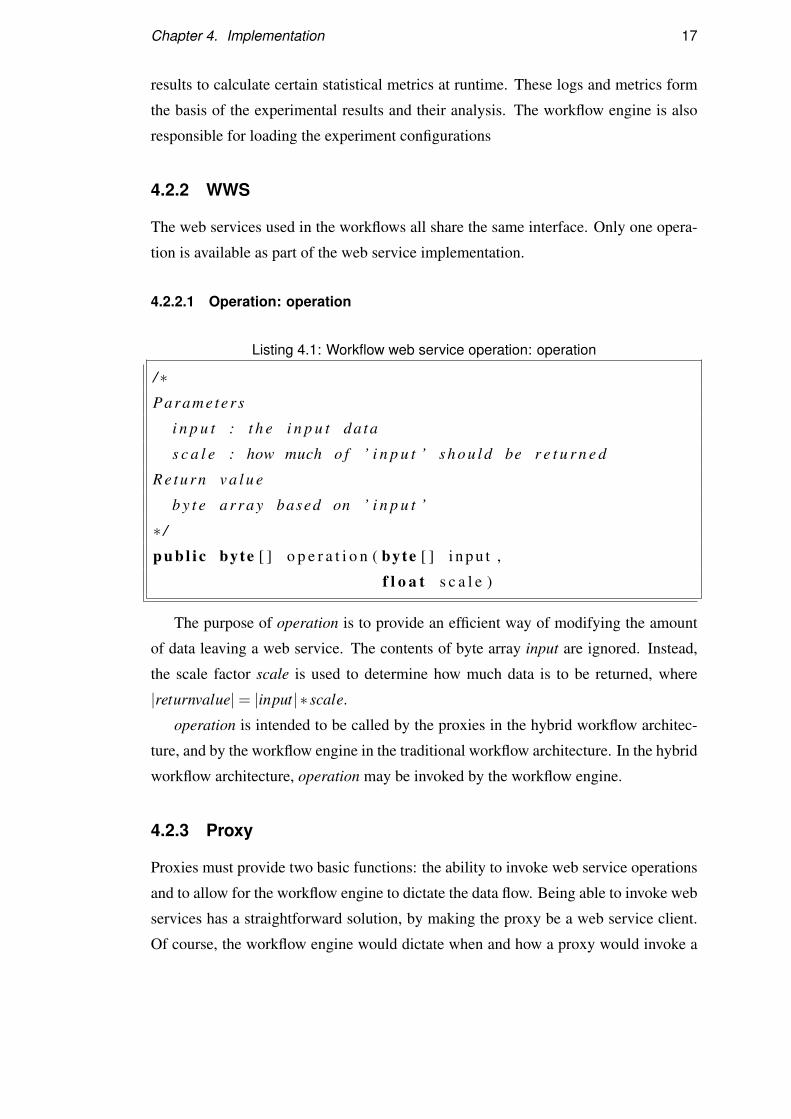
4.2.2.1 Operation: operation
Listing 4.1: Workflow web service operation: operation
/∗Parame ter s
i n p u t : t h e i n p u t da ta
s c a l e : how much o f ’ i n p u t ’ s h o u l d be r e t u r n e d
Re tu rn v a l u e
b y t e a r r a y based on ’ i n p u t ’
∗ /
p u b l i c byte [ ] o p e r a t i o n ( byte [ ] i n p u t ,
f l o a t s c a l e )
The purpose of operation is to provide an efficient way of modifying the amount
of data leaving a web service. The contents of byte array input are ignored. Instead,
the scale factor scale is used to determine how much data is to be returned, where
|returnvalue|= |input| ∗ scale.
operation is intended to be called by the proxies in the hybrid workflow architec-
ture, and by the workflow engine in the traditional workflow architecture. In the hybrid
workflow architecture, operation may be invoked by the workflow engine.
4.2.3 Proxy
Proxies must provide two basic functions: the ability to invoke web service operations
and to allow for the workflow engine to dictate the data flow. Being able to invoke web
services has a straightforward solution, by making the proxy be a web service client.
Of course, the workflow engine would dictate when and how a proxy would invoke a
Chapter 4. Implementation 18
web service. The workflow engine would also be responsible for controlling the data
flow between proxies and for controlling the data flow between itself and the proxies.
These basic functions are provided by the proxy operations invokeWS, forwardData,
storeData and returnData. These are exposed as web service operations.
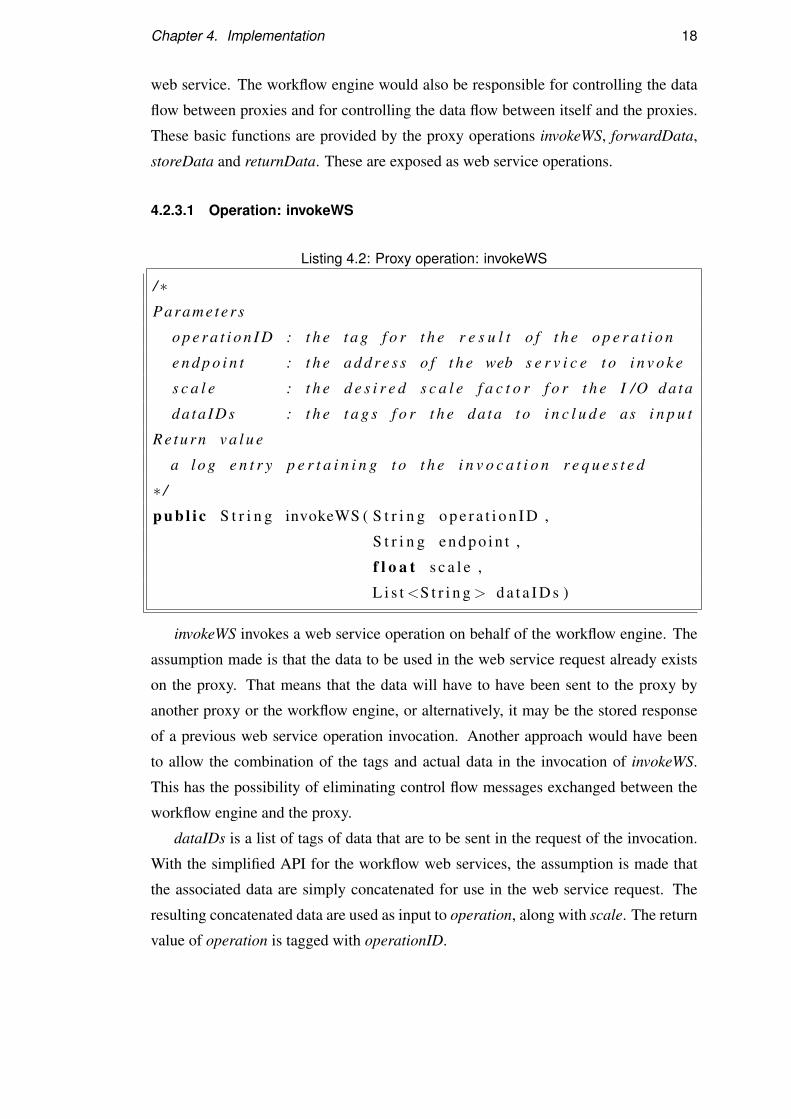
4.2.3.1 Operation: invokeWS
Listing 4.2: Proxy operation: invokeWS
/∗Parame ter s
o p e r a t i o n I D : t h e t a g f o r t h e r e s u l t o f t h e o p e r a t i o n
e n d p o i n t : t h e a d d r e s s o f t h e web s e r v i c e t o i n v o k e
s c a l e : t h e d e s i r e d s c a l e f a c t o r f o r t h e I /O da ta
da ta IDs : t h e t a g s f o r t h e da ta t o i n c l u d e as i n p u t
Re tu rn v a l u e
a l o g e n t r y p e r t a i n i n g t o t h e i n v o c a t i o n r e q u e s t e d
∗ /
p u b l i c S t r i n g invokeWS ( S t r i n g o p e r a t i o n I D ,
S t r i n g e n d p o i n t ,
f l o a t s c a l e ,
L i s t <S t r i n g > d a t a I D s )
invokeWS invokes a web service operation on behalf of the workflow engine. The
assumption made is that the data to be used in the web service request already exists
on the proxy. That means that the data will have to have been sent to the proxy by
another proxy or the workflow engine, or alternatively, it may be the stored response
of a previous web service operation invocation. Another approach would have been
to allow the combination of the tags and actual data in the invocation of invokeWS.
This has the possibility of eliminating control flow messages exchanged between the
workflow engine and the proxy.
dataIDs is a list of tags of data that are to be sent in the request of the invocation.
With the simplified API for the workflow web services, the assumption is made that
the associated data are simply concatenated for use in the web service request. The
resulting concatenated data are used as input to operation, along with scale. The return
value of operation is tagged with operationID.
Chapter 4. Implementation 19
The tag for the response is provided by the workflow engine. This means that the
only information the workflow engine would require would be the log entry for the
invocation. The workflow engine is able to determine how long its request takes to be
executed, but the proxy provides it with information about how long it takes for it to
invoke the workflow web service operation. It is assumed that the difference between
the two times is the sum of the communication costs between proxy and the workflow
engine, with the processing time of the request at the proxy.
As all web services deployed in the workflow share the same API, invokeWS allows
for their invocation using a single web service client. endpoint is used to direct the
invocation to the correct web service.
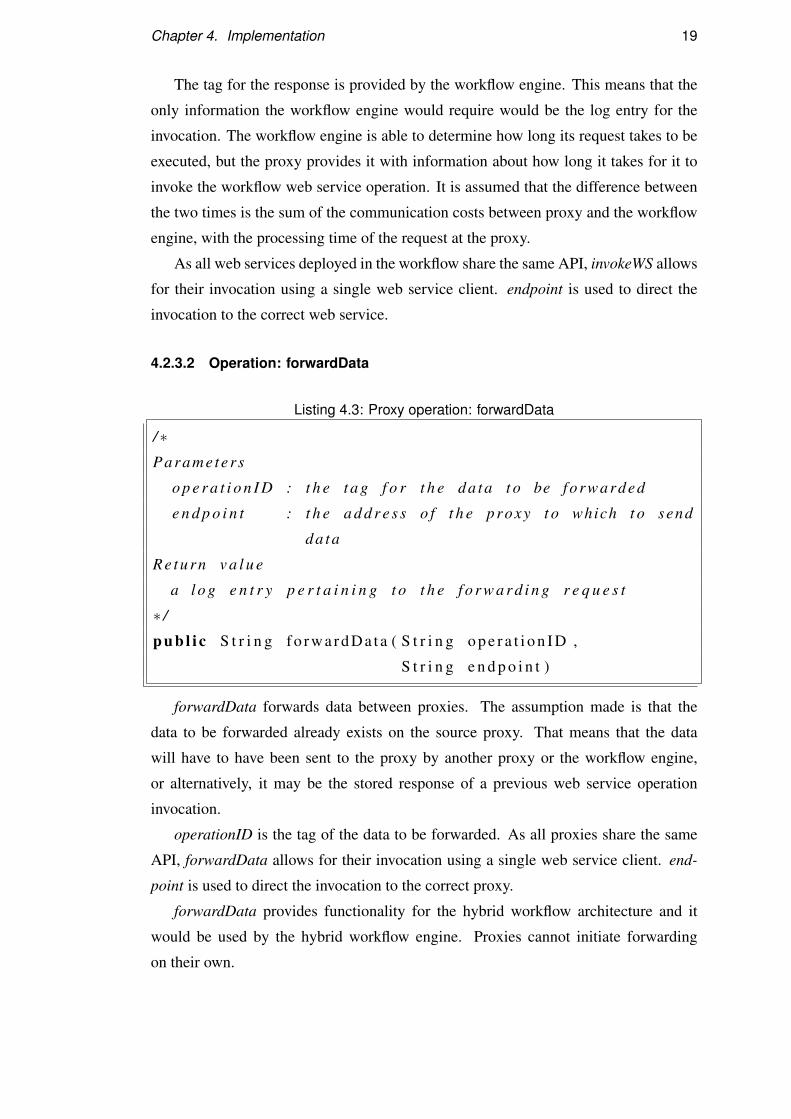
4.2.3.2 Operation: forwardData
Listing 4.3: Proxy operation: forwardData
/∗Parame ter s
o p e r a t i o n I D : t h e t a g f o r t h e da ta t o be forwarded
e n d p o i n t : t h e a d d r e s s o f t h e proxy t o which t o send
da ta
Re tu rn v a l u e
a l o g e n t r y p e r t a i n i n g t o t h e f o r w a r d i n g r e q u e s t
∗ /
p u b l i c S t r i n g f o r w a r d D a t a ( S t r i n g o p e r a t i o n I D ,
S t r i n g e n d p o i n t )
forwardData forwards data between proxies. The assumption made is that the
data to be forwarded already exists on the source proxy. That means that the data
will have to have been sent to the proxy by another proxy or the workflow engine,
or alternatively, it may be the stored response of a previous web service operation
invocation.
operationID is the tag of the data to be forwarded. As all proxies share the same
API, forwardData allows for their invocation using a single web service client. end-
point is used to direct the invocation to the correct proxy.
forwardData provides functionality for the hybrid workflow architecture and it
would be used by the hybrid workflow engine. Proxies cannot initiate forwarding
on their own.
Chapter 4. Implementation 20
forwardData can be thought of as the source operation for forwarding, with store-
Data acting as the sink operation. That is, the workflow engine invokes forwardData
on a proxy, which in turn invokes storeData on the proxy defined by endpoint.
4.2.3.3 Operation: storeData
Listing 4.4: Proxy operation: storeData
/∗Parame ter s
o p e r a t i o n I D : t h e t a g f o r t h e da ta t o be s t o r e d
da ta : t h e da ta t o be s t o r e d
Re tu rn v a l u e
none
∗ /
p u b l i c vo id s t o r e D a t a ( S t r i n g o p e r a t i o n I D ,
byte [ ] d a t a )
storeData accepts data from proxies and the hybrid workflow engine for storing on
the proxy.
operationID is the tag with which data will be stored.
4.2.3.4 Operation: returnData
Listing 4.5: Proxy operation: returnData
/∗Parame ter s
o p e r a t i o n I D : t h e t a g f o r t h e da ta t o r e t u r n
Re tu rn v a l u e
t h e da ta ta gg ed w i t h ’ o p e r a t i o n I D ’
∗ /
p u b l i c byte [ ] r e t u r n D a t a ( S t r i n g o p e r a t i o n I D )
returnData returns data that is stored on a proxy to the hybrid workflow engine.
operationID is the tag of the data to be returned to the workflow engine. The
assumption is that the data to be returned already exists on the proxy.
Chapter 5
Experiment design
In scientific workflows and data-intensive workflows in general, the performance of
the workflow is defined by the communication cost associated with its data flow. The
hybrid model attempts to minimise the cost of the data flow by placing proxies close
to the sources or sinks of the data. Due to the centralised nature of the traditional
model, the data flow passes through the workflow engine for each web service oper-
ation invocation. The introduction of proxies in the hybrid orchestration model alters
the performance by modifying the path of the data flow. The purpose of the experi-
ments carried out is to observe and analyse the behaviour of various workflows (and
workflow variables) when using the hybrid model.
5.1 Workflow patterns
As with software design patters, workflow patterns have been identified to solve partic-
ular problems [12]. Workflow patterns are general patterns of communication within a
workflow. Of particular interest for this project are patterns which affect the data flow.
Three basic workflow pattern families have been identified for inclusion in the
experiments. These workflow patterns were chosen because are basic cases which all
workflows would include. In addition, they can be linked to make workflows which
may mirror realistic distributed composite applications.
In the sequential workflow, one step of the workflow cannot be executed (or alterna-
tively, cannot be completed), until the previous step completes. A sequential workflow
could be useful for pipelined applications. Fan-in workflows are those where a num-
ber of services feed into another. With fan-out workflows, one service sends data to
multiple services.
21
Chapter 5. Experiment design 22
5.1.1 Sequence
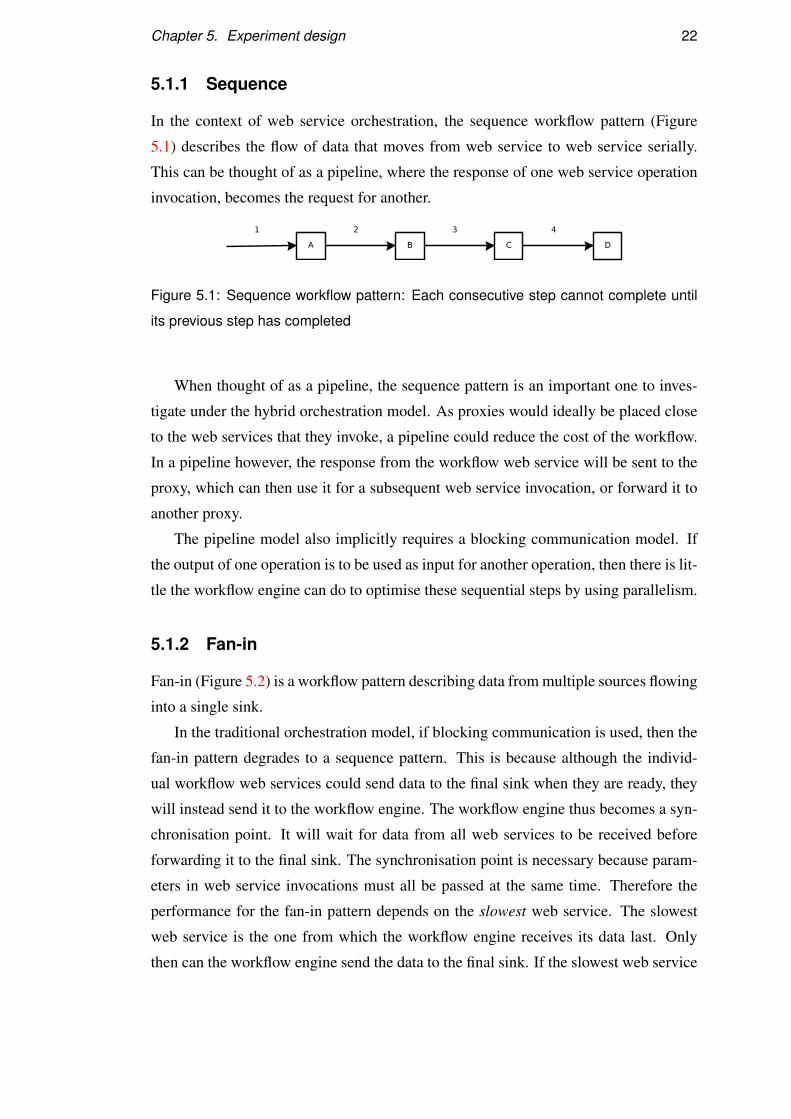
In the context of web service orchestration, the sequence workflow pattern (Figure
5.1) describes the flow of data that moves from web service to web service serially.
This can be thought of as a pipeline, where the response of one web service operation
invocation, becomes the request for another.
Figure 5.1: Sequence workflow pattern: Each consecutive step cannot complete until
its previous step has completed
When thought of as a pipeline, the sequence pattern is an important one to inves-
tigate under the hybrid orchestration model. As proxies would ideally be placed close
to the web services that they invoke, a pipeline could reduce the cost of the workflow.
In a pipeline however, the response from the workflow web service will be sent to the
proxy, which can then use it for a subsequent web service invocation, or forward it to
another proxy.
The pipeline model also implicitly requires a blocking communication model. If
the output of one operation is to be used as input for another operation, then there is lit-
tle the workflow engine can do to optimise these sequential steps by using parallelism.
5.1.2 Fan-in
Fan-in (Figure 5.2) is a workflow pattern describing data from multiple sources flowing
into a single sink.
In the traditional orchestration model, if blocking communication is used, then the
fan-in pattern degrades to a sequence pattern. This is because although the individ-
ual workflow web services could send data to the final sink when they are ready, they
will instead send it to the workflow engine. The workflow engine thus becomes a syn-
chronisation point. It will wait for data from all web services to be received before
forwarding it to the final sink. The synchronisation point is necessary because param-
eters in web service invocations must all be passed at the same time. Therefore the
performance for the fan-in pattern depends on the slowest web service. The slowest
web service is the one from which the workflow engine receives its data last. Only
then can the workflow engine send the data to the final sink. If the slowest web service
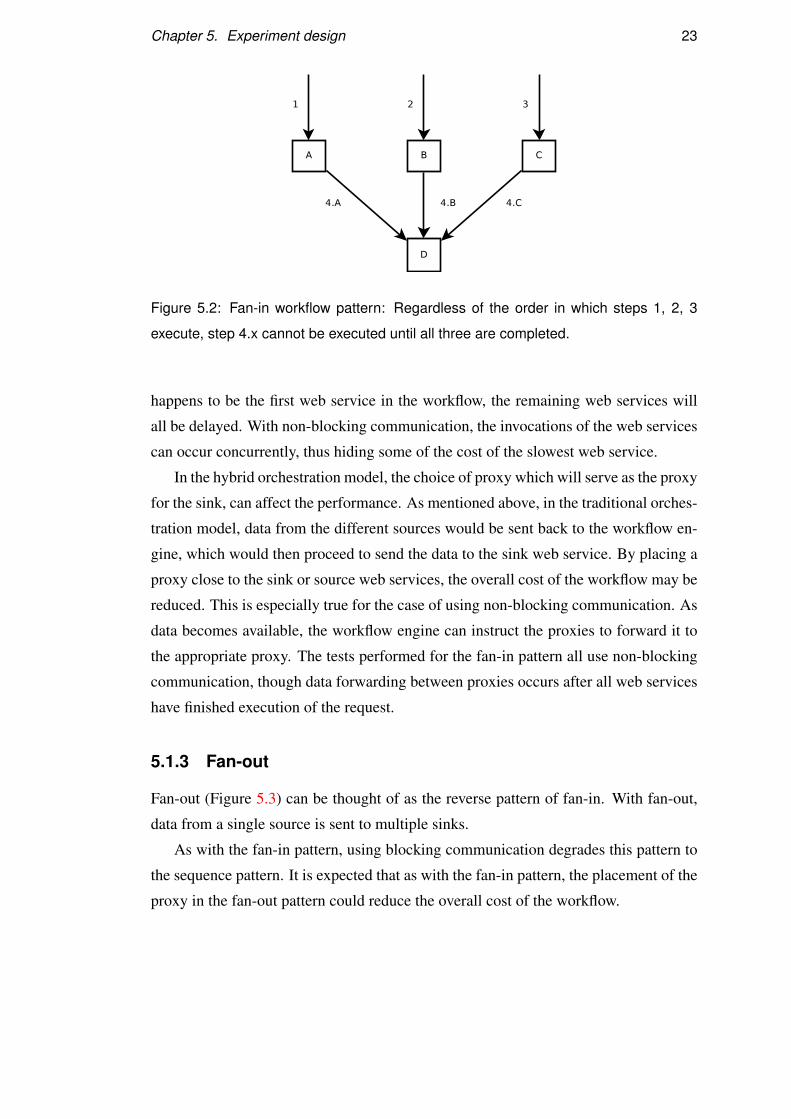
Chapter 5. Experiment design 23
Figure 5.2: Fan-in workflow pattern: Regardless of the order in which steps 1, 2, 3
execute, step 4.x cannot be executed until all three are completed.
happens to be the first web service in the workflow, the remaining web services will
all be delayed. With non-blocking communication, the invocations of the web services
can occur concurrently, thus hiding some of the cost of the slowest web service.
In the hybrid orchestration model, the choice of proxy which will serve as the proxy
for the sink, can affect the performance. As mentioned above, in the traditional orches-
tration model, data from the different sources would be sent back to the workflow en-
gine, which would then proceed to send the data to the sink web service. By placing a
proxy close to the sink or source web services, the overall cost of the workflow may be
reduced. This is especially true for the case of using non-blocking communication. As
data becomes available, the workflow engine can instruct the proxies to forward it to
the appropriate proxy. The tests performed for the fan-in pattern all use non-blocking
communication, though data forwarding between proxies occurs after all web services
have finished execution of the request.
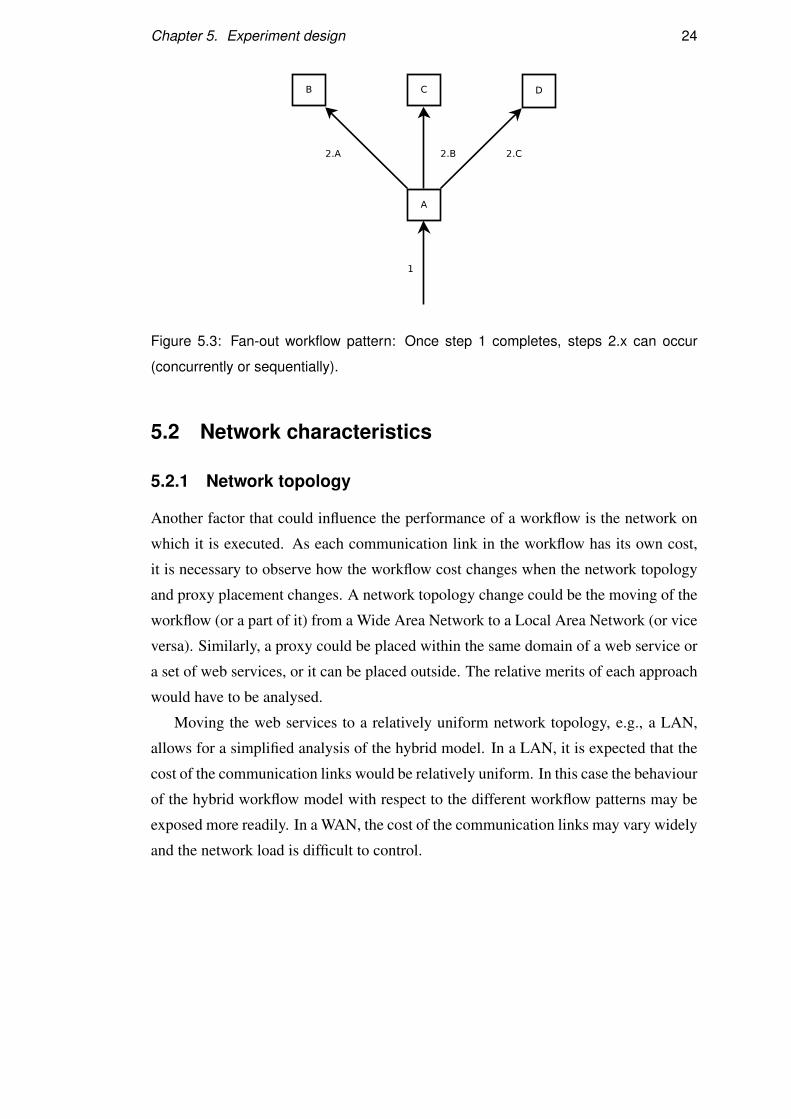
5.1.3 Fan-out
Fan-out (Figure 5.3) can be thought of as the reverse pattern of fan-in. With fan-out,
data from a single source is sent to multiple sinks.
As with the fan-in pattern, using blocking communication degrades this pattern to
the sequence pattern. It is expected that as with the fan-in pattern, the placement of the
proxy in the fan-out pattern could reduce the overall cost of the workflow.
Chapter 5. Experiment design 24
Figure 5.3: Fan-out workflow pattern: Once step 1 completes, steps 2.x can occur
(concurrently or sequentially).
5.2 Network characteristics
5.2.1 Network topology
Another factor that could influence the performance of a workflow is the network on
which it is executed. As each communication link in the workflow has its own cost,
it is necessary to observe how the workflow cost changes when the network topology
and proxy placement changes. A network topology change could be the moving of the
workflow (or a part of it) from a Wide Area Network to a Local Area Network (or vice
versa). Similarly, a proxy could be placed within the same domain of a web service or
a set of web services, or it can be placed outside. The relative merits of each approach
would have to be analysed.
Moving the web services to a relatively uniform network topology, e.g., a LAN,
allows for a simplified analysis of the hybrid model. In a LAN, it is expected that the
cost of the communication links would be relatively uniform. In this case the behaviour
of the hybrid workflow model with respect to the different workflow patterns may be
exposed more readily. In a WAN, the cost of the communication links may vary widely
and the network load is difficult to control.
Chapter 5. Experiment design 25
5.2.2 Network load
Another factor worth considering, is the load of the network on which the workflow is
executed. This will allow investigation of the relative responsiveness of the hybrid and
traditional orchestration models to network load. This investigation may also expose
relative merits between the different workflow patterns (e.g., which pattern degrades
faster).
5.3 Workflow characteristics
Besides the workflow patterns mentioned above, other parameters characterise work-
flows. Examining the performance of the hybrid model as these parameters change is
the subject of this project, and thus focus is placed on these experiments.
5.3.1 Data size
The overall size of the data flow of a workflow can be used as a good rule of thumb for
comparing the traditional and hybrid models. Note that for the same workflow, the two
models may need to transfer data flows different sizes. In fact, introducing an arbitrary
number of proxies in the workflow means that the difference can be significant.
Data size as a workflow parameter can also be used for scalability analysis. That is,
how the performance of the proxies degrades as the data size of the messages increases.
Such analysis is also useful at the individual message level and not just at the workflow
level. In this case, it is useful to see how large a single message can be considering the
proxy performance, and whether any such analysis carries to other network topologies.
5.3.2 Workflow fragments
The hybrid model attempts to eliminate the communication between WWS and the
workflow engine by storing intermediate results on the proxies. There are two cases
however, where the data flow must utilise the P-WE links.
• Start of the workflow. When data needs to be supplied in the first step of the
workflow, then the workflow engine will have to supply such data over the P-WE
link.
• End of the workflow. When the final WWS contains data that will have to be
made available at the workflow engine, it will transmitted over the P-WE link.
Chapter 5. Experiment design 26
There are many real world scenarios where it is expected that the communication
links between the proxies and the workflow engine would be the most expensive links
in the workflow. For example, the workflow engine may be in Europe, whereas the
WWS (and in the hybrid model the proxies) may be in North America. The hybrid
model in this case is expected to benefit by using the transatlantic links only for the
control flow.
This may not be possible for all workflows, but it is useful to consider this situ-
ation with respect to workflow fragments. Workflow fragments are arbitrary parts of
a workflow examined in isolation. By examining scenarios which do not use the first
and last P-WE communication links for the data flow, it should be possible to infer the
behaviour of the hybrid model for arbitrary workflow fragments.
5.4 Proxy characteristics
Proxies are an introduced variable into orchestration under the hybrid model. Thus, it
must be determined how they affect the performance of the execution of the workflows.
5.4.1 Number of proxies
If we take a workflow to be a static entity, then by moving it to the hybrid model,
certain liberties can be taken. One such liberty would be the number of proxies in the
execution of the workflow.
For example, one could assign one proxy for the entire workflow. This could be the
case if the workflow web services are all close together and the workflow engine is at
a distant location (where closeness is defined by the cost of network communication).
In this case, it might be preferable to place a single proxy close to the workflow web
services. This proxy would then in effect mirror the actions of the workflow engine,
but without incurring the cost of the expensive P-WE communication link for its data
flow.
Alternatively, multiple proxies could be utilised in the execution of the workflow.
This could be useful for distributing the workload of the proxies, or if a workflow-
specific routing scheme is desired.

Chapter 5. Experiment design 27
5.4.2 Proxy placement
Where to place a proxy is another issue that needs to be investigated. Regardless of the
number of proxies used in a workflow, where they are placed can affect the workflow’s
performance.
A simple scenario would be the case of using a single proxy for a group of workflow
web services. Whether the proxy is placed close to the most heavily used communica-
tion link (in terms of data transferred), or whether it is placed close to the most often
used communication link, would be something worth investigating.
Chapter 6
Experiment configuration
To be able to provide a useful analysis of the experiment results, certain factors per-
taining to the experiments need to be controlled. Besides the experiment execution
parameters, the experiment test bed needs to be controlled.
6.1 Results capture
Results capture occurs in proxies and the workflow engines. Although individual re-
sults may be logged at the proxies, the logs for each workflow iteration are available
only at the worflow engine.
6.1.1 Proxy logging
The basic metric for analysis of the performance of workflows is the time take to
complete both the entire workflow and its individual component tasks. The proxies
use timers to determine the time needed to communicate with web services and other
proxies. The proxies would thus be primarily responsible for recording the time take to
complete tasks that they initiate. The actions recorded by proxies are the time taken to
forward data to another proxy and the time taken to invoke a web service and receive
the result. These recorded events are returned to the workflow engine as the result of
the web service operation that triggered them.
As analysis of the recorded logs happens at the workflow engine, any data that it
could use for the analysis would have to be supplied by the proxies. The proxies thus
return metadata related to the tasks that they log on behalf of the workflow engine.
Besides the time taken to complete an operation, the proxies also return the amount of
28
Chapter 6. Experiment configuration 29
data sent and received. The proxy or web service being invoked is also identified in
the log.
6.1.2 Workflow engine logging
Similar to the proxies, the workflow engine has timers that record the time taken to
complete an operation as well as the time needed to execute a single workflow. In the
case of the workflow engines, all individual tasks are timed. Tasks in this case would
be invocations of the proxies, or when working in the standard orchestration mode,
invocations of the individual web services.
Although proxies log the tasks that they initiate, the workflow engine needs to
do the same for the tasks that it delegates to the proxies. For example, invoking a
web service may take a proxy 1 second to complete, whereas the time elapsed for the
workflow engine may be much higher. Any events logged by proxies are inserted in the
log in the appropriate positions as nested events. As with the proxies’ logging system,
metadata are also recorded at the workflow engine.
The workflow engine is in a better position to record results at the workflow level
as it has a complete view of the workflows being executed. The workflow engine is
aware of the total amount of data to be sent through the system as well as the time
needed to complete it. These data are included at the end of each workflow iteration
and are a primary source for data analysis.
6.1.2.1 Log processing
The workflow engine has additional responsibilities besides the execution of work-
flows and capturing the log events for such executions. In fact, it is also responsible
for performing basic processing of the log results of the different iterations of the work-
flow executions. This basic processing involves calculating the average and standard
deviation for the recorded times of the different iterations.
6.2 Experiment execution configuration
Many of the tests executed are similar in many aspects and share the same program-
matic specification. It is therefore desirable to have a method for configuring their
parameters for each different test or for each iteration. The configuration system used
in the experiments software system makes use of text-based properties files.
Chapter 6. Experiment configuration 30
On initiating a specific experiment, its associated properties files are loaded as well.
The parameters configurable via the properties files include:
• number of iterations to execute (for each configuration of the experiment)
• the set of nodes to use for the experiment
• the basic data size to use in the experiment
Sample configuration files are listed in Appendix A.
6.3 Software environment
The experiments software system is composed of two parts, the proxy (with its asso-
ciated web service) and the workflow engine. Both developed systems are based on
Java technology. The P-WWS bundle is deployed as a set of two web services, while
the workflow engine is a stand-alone application which acts as a web service client.
The proxies are deployed on workflow nodes, while workflow engines are deployed on
engine nodes.
• Java Runtime Environment. The software system is written entirely in the Java
programming language. Java [13] is a language which has been designed to write
programs that execute on a platform-independent virtual machine. Regardless of
the actual virtual machine implementation, the programs executed use the same
programming interface. The Java Runtime Environment, JRE, includes such a
virtual machine. As the test bed on which the experiments will be executed is not
controllable, it is desirable to be able to write the software system in a language
that enables portability. New nodes could be added to the workflow by simply
copying over the software system to a computer with the JRE.
• Application container. An application container hosts web applications. In
the case of the experiments software system, these web applications are web
services.
One purpose of the application container is to expose the web services through
HTTP. Another is to provide the SOAP stack with which messages sent to web
services or sent by the web services are processed correctly.
Chapter 6. Experiment configuration 31
Jetty [14] is the application container selected for these experiments. The reason
for choosing Jetty is its small size. Having a small size, a pre-configured instal-
lation of Jetty can be uploaded on new nodes in order to test new configurations.
• JAX-WS. The Java API for XML Web Services (JAX-WS) [15] is a specifica-
tion for developing SOAP web services in Java. A reference implementation
is made available from Sun Microsystems through the Metro project [16]. The
Java Architecture for XML Binding (JAXB) [17] is a library that comes with
JAX-WS and handles the serialisation and deserialisation of SOAP messages.
6.4 Node configuration
6.4.1 Workflow nodes
Each computer participating in a workflow hosts a P-WWS bundle. As these are Java-
based, a Java Runtime Environment (JRE) is needed, with a minimum version of 1.5.
As libraries needed by the software system (JAXB) were not bundled with all JRE
implementations since 1.5, these were added to each system.
In order to be able to host the web services of the experiments software system,
an application container (Jetty) is used. Although the required version (jetty6) was
not available as an installation option in the deployed environments, a pre-configured
instance was copied to each node. The pre-configured instance included the JAX-WS
libraries and the P-WWS bundle.
6.4.2 Engine nodes
Each computer acting as a workflow engine contains workflow configurations and web
service clients for interacting with the P-WWS bundle. The implementation of the
workflow engine and the web service clients is Java-based and requires a JRE. The
particular implementation of the web service clients requires a minimum version of
1.5. Similarly to the workflow node machines, additional JAXB libraries are needed
in order to use the web service clients. The JAX-WS 2.1 library which includes the
appropriate JAXB library was added to each engine node.
Chapter 6. Experiment configuration 32
6.5 University of Edinburgh configuration
A pool of computers from the University of Edinburgh Distributed Informatics Com-
puting Environment (DICE) [18] LAN were selected as workflow nodes for this con-
figuration. These machines are all located in the same building and are connected
to the network via a 100Mb network connection. All these machines share the same
hardware environment and operating system.
These machines use a distributed file system. This allowed uploading of a pre-
configured Jetty installation on one machine from which all others could also start the
installation.
In addition to these similarly matched machines, select servers were chosen to act
as the engine nodes. One of these machines was from the pool of workflow nodes,
while another was a server located in a geographically isolated location. This server is
connected to the LAN through the University’s WAN.
6.6 PlanetLab configuration
PlanetLab [19] is a network of computers contributed by various institutions across the
world. Currently consisting of over 900 machines, it allows the contributing members
to restrict access to these nodes.
Each machine provides a basic Linux environment (Fedora Core 4 - kernel 2.6.12)
into which a PlanetLab user can log into remotely. The PlanetLab user can then con-
figure the software environment by installing additional software through the Fedora
application environment provided.
The set-up process for a PlanetLab workflow node included:
• install Java 1.70 IcedTea in order to be able to run the software system
• upload the pre-configured Jetty installation
• update the JAXB libraries in the system with those included in the pre-configured
Jetty installation
For the engine nodes, the workflow engine was also uploaded, together with the
experiment configurations.
The nodes selected were based on their geographical location. A minimum of
five nodes were selected from France and Germany, while a minimum of nine were

Chapter 6. Experiment configuration 33
selected from the US. These sites were selected to simulate plausible collaborations
using workflows. The engine nodes were selected to be remote servers for the same
reason.
For example, one could imagine a Russian scientist accessing a workflow com-
posed of French and German services in order to study the Arian 5 space simulations.
Alternatively, a CERN employee might need to distribute data across several locations
in order to parallelise their processing.
It is worth noting that in both configurations, very little control can be exercised
over the workload and resource allocations to each node. PlanetLab has a network
throttling policy and can modify on the fly the network resources allocated to each
user on a specific machine. The DICE nodes used in the University LAN can also
experience widely varying workloads, as they may be in use remotely by multiple
students.
Chapter 7
Experiment results analysis
The experiments devised and executed for this project fall under two categories. The
first is the set of basic experiments which includes a set of tests which simply compare
the execution of a workflow using the traditional and the hybrid model. The second
is the set of experiments which attempt to isolate a specific parameter in the hybrid
model and to examine how it affects the execution of workflows.
7.1 Basic experiments
As it is desirable to examine the hybrid model in real-life workflow conditions, the
experiments were devised to simulate some of the conditions that occur in scientific
workflows.
A common scenario in which scientific workflows are executed is that of collab-
orating universities or institutions. It could be the case that these organisations are
located in the same network or geographical domain. In other situations, the collabo-
ration may cross both network and geographical boundaries.
Another factor which may be variable in the scientific workflows, is that of the
workflow engine placement. The workflow may be served from within a domain, but
could also be served from a remote location or organisation.
Local Area Network (LAN) experiments were executed on the the University of
Edinburgh network. Two basic configurations of the workflows being tested were ex-
ecuted. In both configurations the P-WWS bundle is deployed on machines that are
connected via a network switch. The differentiating factor is the placement of the
workflow engine.
34
Chapter 7. Experiment results analysis 35
7.2 Local LAN configuration
In the first configuration, the workflow engine is deployed on a computer that is also
connected to the workflow web services via a network switch. In fact, all the workflow
and engine nodes are in the same building.
The reasoning for choosing this configuration for testing is the assumption of com-
munication link equality. All machines are local. The communication cost between
any two machines is low.
If we make the assumption that the communication cost is also uniform, then the
problem of evaluating the hybrid model performance, is that of comparing the number
of links used. If the hybrid model uses more communication links for a workflow than
the equivalent traditional model does, then it would be expected that it would be a more
expensive model.
Three workflow patterns were executed for this configuration: fan-in, fan-out and
sequence. The sequence workflow pattern was executed twice, once using the initial
and final communication links and another by avoiding transferring data via these links.
7.2.1 Workflow pattern: seq if
7.2.1.1 Experiment configuration
For the sequence pattern which uses both the first and last communication links for
the data flow (seq if), three different workflow sizes (4-node, 8-node, 16-node) were
tested. The data flows as in a pipeline with no data transformations (i.e., the output
of one operation is the input for the next operation). Because no data transformations
are performed, and the web service simply replies with the same data it received, this
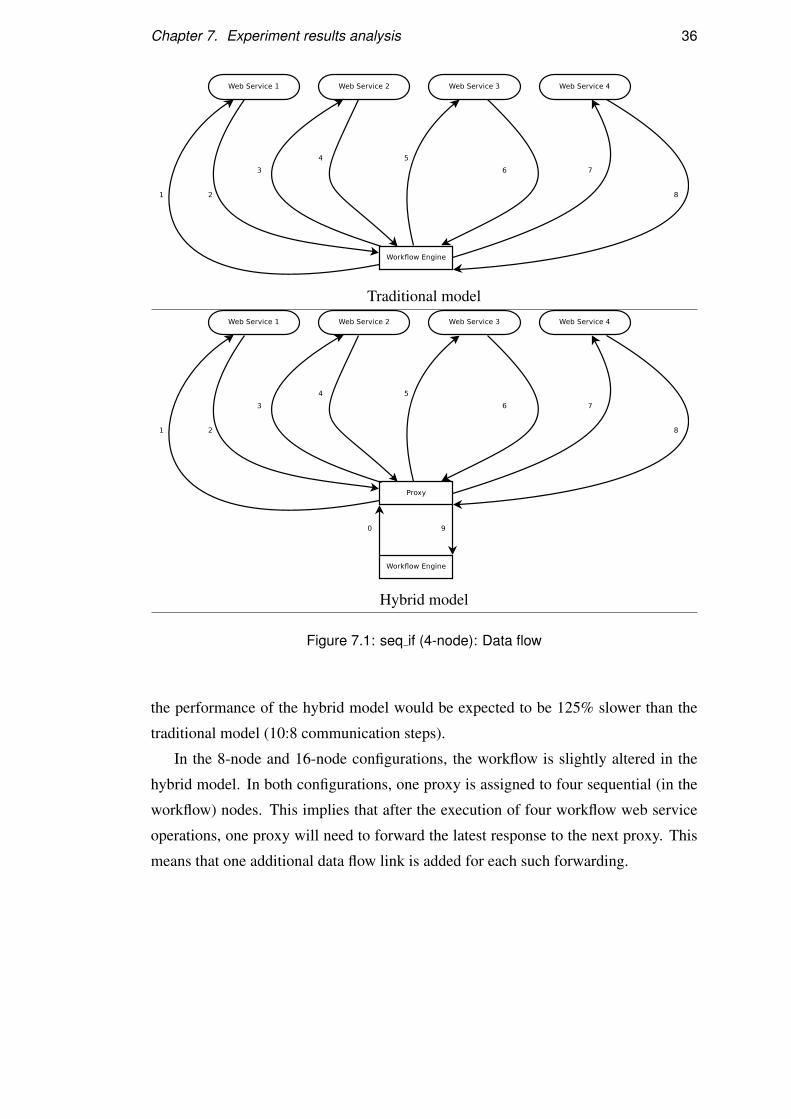
workflow is equivalent to echoing the initial data throughout the workflow.
Taking the 4 node configuration as an example (Figure 7.1), the one can easily
see that in the traditional model, there would be 8 communication steps between the
proxies and the workflow engine. In the hybrid model, this depends on the number of
proxies used. In the base case of sharing a single proxy, then there would be 8 commu-
nication steps between the proxy and the 4 web services, and 2 communication steps
between the proxy and the workflow engine. Since the workflow engine, the proxy
and the workflow web services, are all hosted on different machines of the same LAN,
one would expect the cost of the communication steps to be equal. Assuming the mes-
sage processing and workflow web service operation processing costs are negligible,
Chapter 7. Experiment results analysis 36
Traditional model
Hybrid model
Figure 7.1: seq if (4-node): Data flow
the performance of the hybrid model would be expected to be 125% slower than the
traditional model (10:8 communication steps).
In the 8-node and 16-node configurations, the workflow is slightly altered in the
hybrid model. In both configurations, one proxy is assigned to four sequential (in the
workflow) nodes. This implies that after the execution of four workflow web service
operations, one proxy will need to forward the latest response to the next proxy. This
means that one additional data flow link is added for each such forwarding.
Chapter 7. Experiment results analysis 37
7.2.1.2 Results analysis
Table 7.1 presents the performance difference between the hybrid and traditional mod-
els for a 4-node configuration of equivalent workflows. The experiment was executed
on the localised LAN, and a single shared proxy was used for the hybrid model exe-
cution of the workflow. The table shows that the predicted 125% performance change
is always within the observed performance range of the hybrid model for the specific
workflow model.
When one observes just the average change in performance, a trend is noticeable.
As the size of the data flow increases, the hybrid model becomes increasingly slower
compared to the traditional model. A possible explanation for this observed result is
that as the data flow becomes larger, the processing cost of the data increases. Although
the processing cost at the workflow web services should remain the same, the message
processing cost does not. The messages are processed both at the proxy and the work-
flow web services. The processing cost at the proxy is an introduced cost that does not
exist in the traditional model and can partly explain the performance degradation.
When the data flow size is 96MB the average performance degradation is lower
than 125%. When observing the raw metrics, one can attribute this to a larger standard
deviation in the execution times.
As can be seen in the table and Figure 7.2, the hybrid model has a degraded perfor-
mance when compared to the execution of the equivalent workflow in the traditional
model. The figure also illustrates how the standard deviation increases as the data flow
size increases.
In the 8-node and 16-node configurations, additional data links were added for the
use of forwarding data between proxies. In a localised LAN configuration, these links
would have an equivalent cost to the other data flow links, and so it would be expected
that the performance of the hybrid approach would further degrade. Using the assump-
tions made earlier for the 4-node configuration, then the performance degradation for
the 8-node configuration would be 118.75%, while for the 16-node configuration it
would be 115.63%. This shows that the per-node performance actually increases as
the workflow size increases.
Tables 7.2 and 7.3 appear to verify this claim. In the tables, the performance degra-
dation of the hybrid model is similar to the 4-node configuration for the equivalent
data flow sizes. Although similar however, as more nodes are added, the performance
degradation of the hybrid model is decreased. The small change however could imply
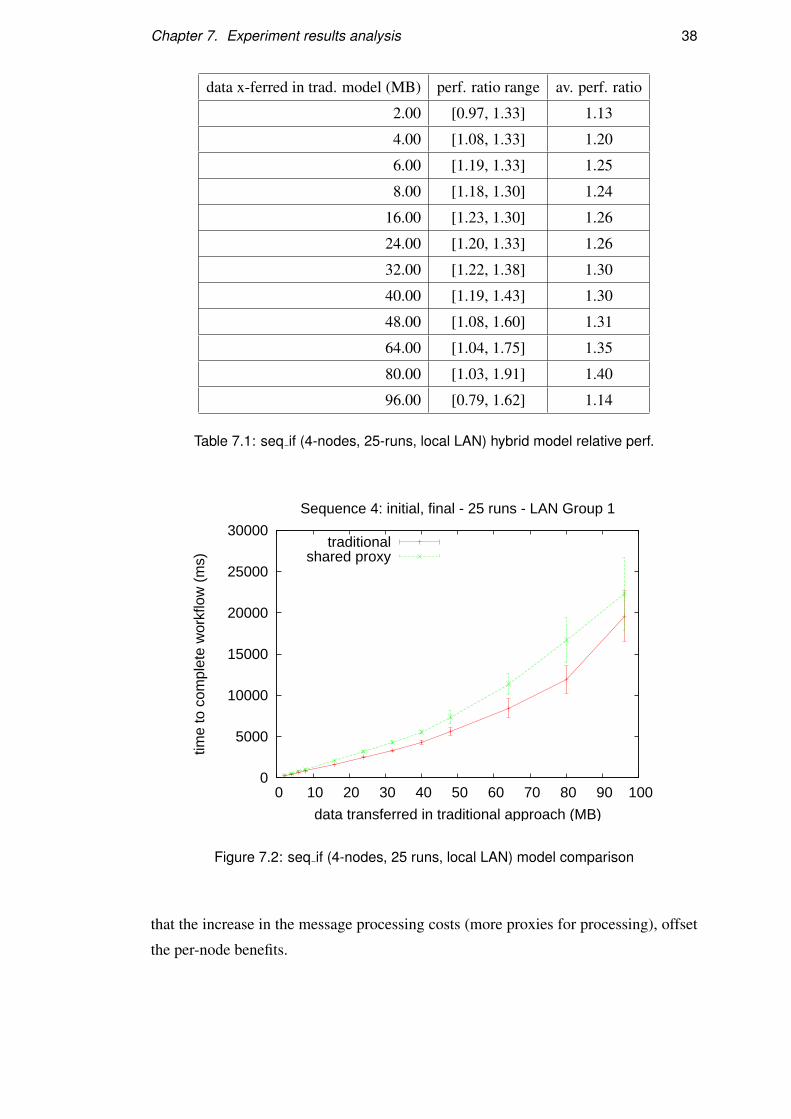
Chapter 7. Experiment results analysis 38
data x-ferred in trad. model (MB) perf. ratio range av. perf. ratio
2.00 [0.97, 1.33] 1.13
4.00 [1.08, 1.33] 1.20
6.00 [1.19, 1.33] 1.25
8.00 [1.18, 1.30] 1.24
16.00 [1.23, 1.30] 1.26
24.00 [1.20, 1.33] 1.26
32.00 [1.22, 1.38] 1.30
40.00 [1.19, 1.43] 1.30
48.00 [1.08, 1.60] 1.31
64.00 [1.04, 1.75] 1.35
80.00 [1.03, 1.91] 1.40
96.00 [0.79, 1.62] 1.14
Table 7.1: seq if (4-nodes, 25-runs, local LAN) hybrid model relative perf.
0
5000
10000
15000
20000
25000
30000
0 10 20 30 40 50 60 70 80 90 100
time
to c
ompl
ete
wor
kflo
w (
ms)
data transferred in traditional approach (MB)
Sequence 4: initial, final - 25 runs - LAN Group 1
traditionalshared proxy
Figure 7.2: seq if (4-nodes, 25 runs, local LAN) model comparison
that the increase in the message processing costs (more proxies for processing), offset
the per-node benefits.
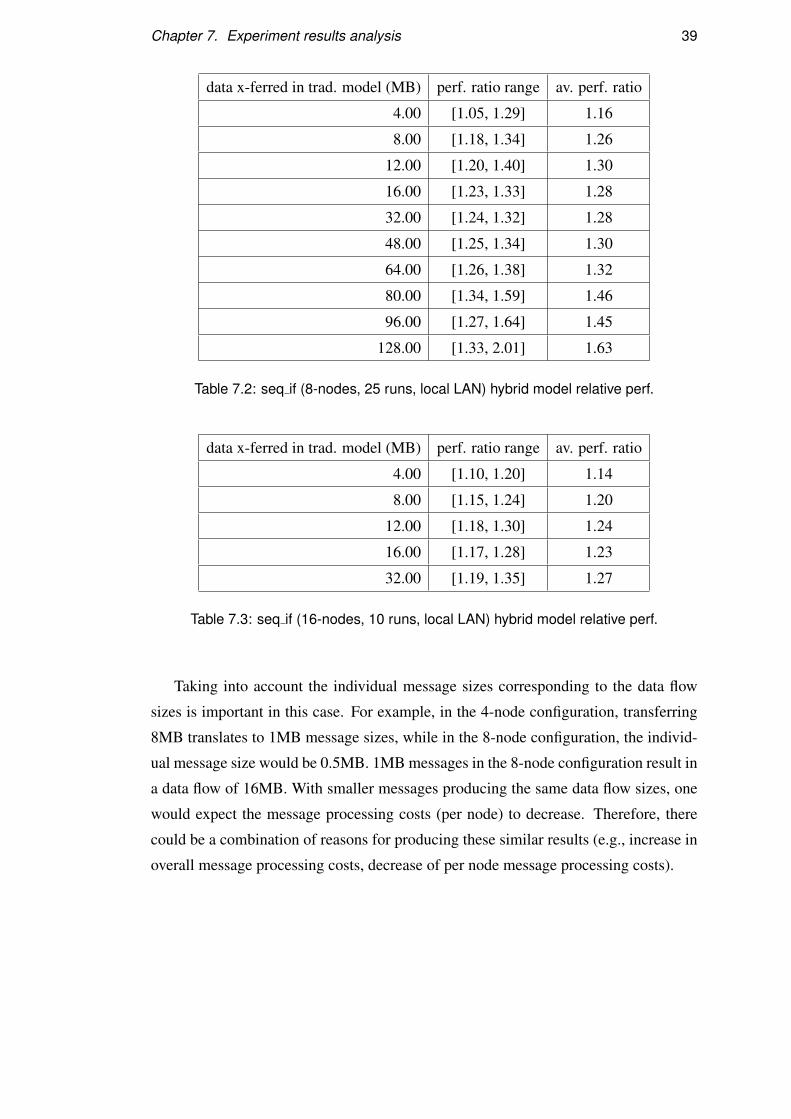
Chapter 7. Experiment results analysis 39
data x-ferred in trad. model (MB) perf. ratio range av. perf. ratio
4.00 [1.05, 1.29] 1.16
8.00 [1.18, 1.34] 1.26
12.00 [1.20, 1.40] 1.30
16.00 [1.23, 1.33] 1.28
32.00 [1.24, 1.32] 1.28
48.00 [1.25, 1.34] 1.30
64.00 [1.26, 1.38] 1.32
80.00 [1.34, 1.59] 1.46
96.00 [1.27, 1.64] 1.45
128.00 [1.33, 2.01] 1.63
Table 7.2: seq if (8-nodes, 25 runs, local LAN) hybrid model relative perf.
data x-ferred in trad. model (MB) perf. ratio range av. perf. ratio
4.00 [1.10, 1.20] 1.14
8.00 [1.15, 1.24] 1.20
12.00 [1.18, 1.30] 1.24
16.00 [1.17, 1.28] 1.23
32.00 [1.19, 1.35] 1.27
Table 7.3: seq if (16-nodes, 10 runs, local LAN) hybrid model relative perf.
Taking into account the individual message sizes corresponding to the data flow
sizes is important in this case. For example, in the 4-node configuration, transferring
8MB translates to 1MB message sizes, while in the 8-node configuration, the individ-
ual message size would be 0.5MB. 1MB messages in the 8-node configuration result in
a data flow of 16MB. With smaller messages producing the same data flow sizes, one
would expect the message processing costs (per node) to decrease. Therefore, there
could be a combination of reasons for producing these similar results (e.g., increase in
overall message processing costs, decrease of per node message processing costs).
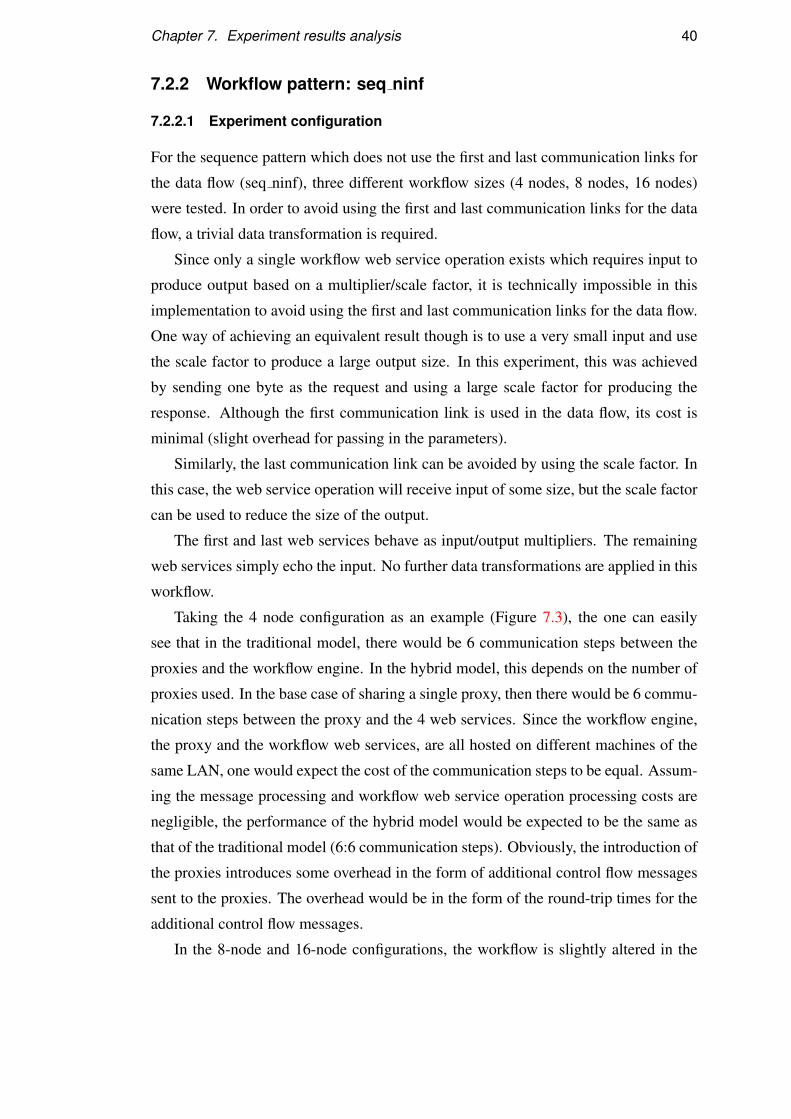
Chapter 7. Experiment results analysis 40
7.2.2 Workflow pattern: seq ninf
7.2.2.1 Experiment configuration
For the sequence pattern which does not use the first and last communication links for
the data flow (seq ninf), three different workflow sizes (4 nodes, 8 nodes, 16 nodes)
were tested. In order to avoid using the first and last communication links for the data
flow, a trivial data transformation is required.
Since only a single workflow web service operation exists which requires input to
produce output based on a multiplier/scale factor, it is technically impossible in this
implementation to avoid using the first and last communication links for the data flow.
One way of achieving an equivalent result though is to use a very small input and use
the scale factor to produce a large output size. In this experiment, this was achieved
by sending one byte as the request and using a large scale factor for producing the
response. Although the first communication link is used in the data flow, its cost is
minimal (slight overhead for passing in the parameters).
Similarly, the last communication link can be avoided by using the scale factor. In
this case, the web service operation will receive input of some size, but the scale factor
can be used to reduce the size of the output.
The first and last web services behave as input/output multipliers. The remaining
web services simply echo the input. No further data transformations are applied in this
workflow.
Taking the 4 node configuration as an example (Figure 7.3), the one can easily
see that in the traditional model, there would be 6 communication steps between the
proxies and the workflow engine. In the hybrid model, this depends on the number of
proxies used. In the base case of sharing a single proxy, then there would be 6 commu-
nication steps between the proxy and the 4 web services. Since the workflow engine,
the proxy and the workflow web services, are all hosted on different machines of the
same LAN, one would expect the cost of the communication steps to be equal. Assum-
ing the message processing and workflow web service operation processing costs are
negligible, the performance of the hybrid model would be expected to be the same as
that of the traditional model (6:6 communication steps). Obviously, the introduction of
the proxies introduces some overhead in the form of additional control flow messages
sent to the proxies. The overhead would be in the form of the round-trip times for the
additional control flow messages.
In the 8-node and 16-node configurations, the workflow is slightly altered in the
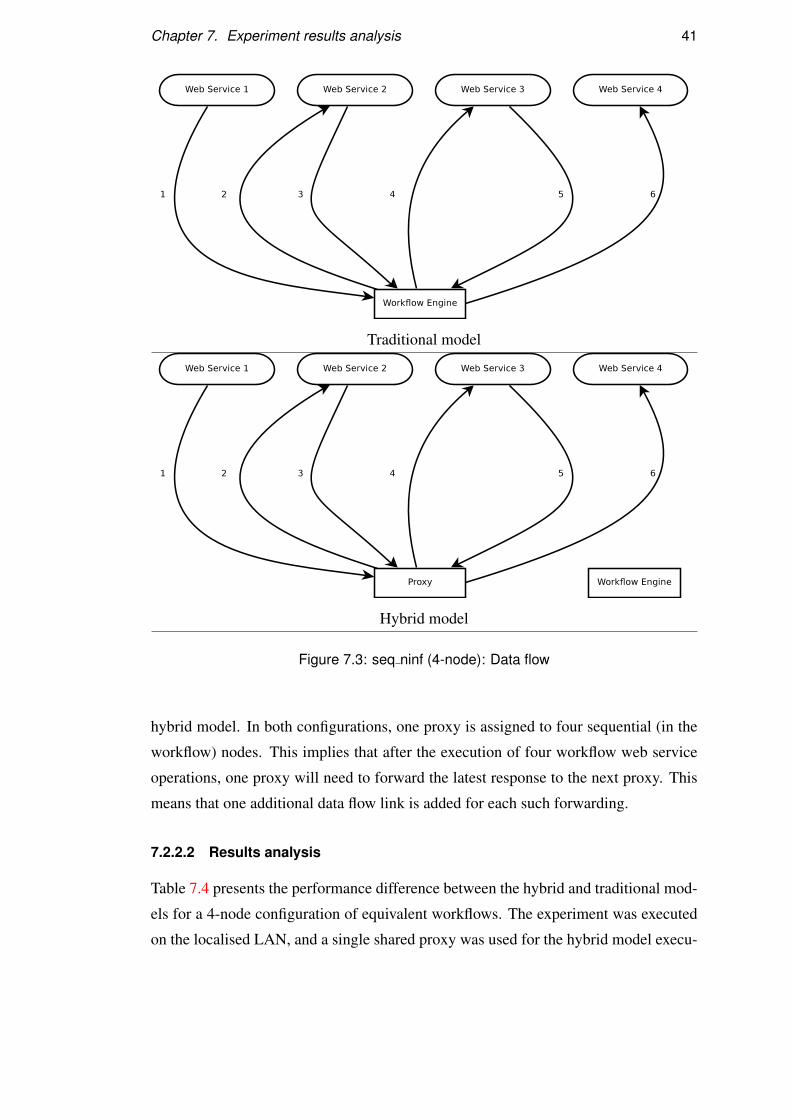
Chapter 7. Experiment results analysis 41
Traditional model
Hybrid model
Figure 7.3: seq ninf (4-node): Data flow
hybrid model. In both configurations, one proxy is assigned to four sequential (in the
workflow) nodes. This implies that after the execution of four workflow web service
operations, one proxy will need to forward the latest response to the next proxy. This
means that one additional data flow link is added for each such forwarding.
7.2.2.2 Results analysis
Table 7.4 presents the performance difference between the hybrid and traditional mod-
els for a 4-node configuration of equivalent workflows. The experiment was executed
on the localised LAN, and a single shared proxy was used for the hybrid model execu-
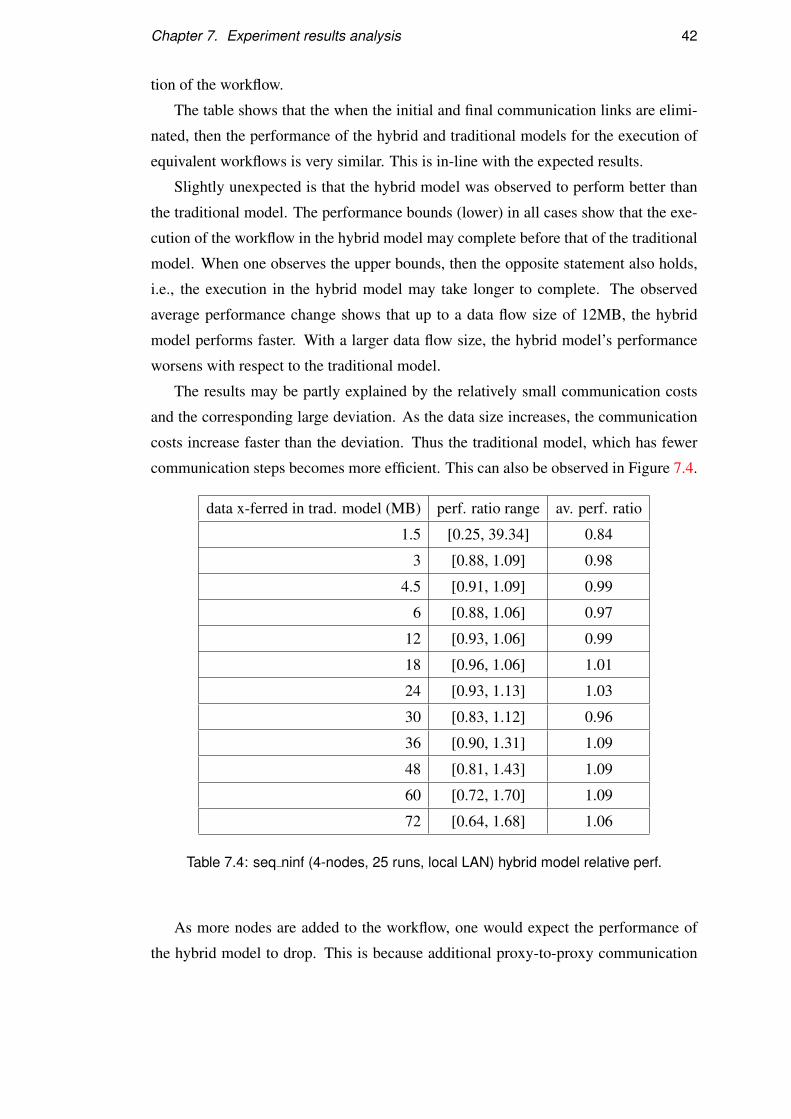
Chapter 7. Experiment results analysis 42
tion of the workflow.
The table shows that the when the initial and final communication links are elimi-
nated, then the performance of the hybrid and traditional models for the execution of
equivalent workflows is very similar. This is in-line with the expected results.
Slightly unexpected is that the hybrid model was observed to perform better than
the traditional model. The performance bounds (lower) in all cases show that the exe-
cution of the workflow in the hybrid model may complete before that of the traditional
model. When one observes the upper bounds, then the opposite statement also holds,
i.e., the execution in the hybrid model may take longer to complete. The observed
average performance change shows that up to a data flow size of 12MB, the hybrid
model performs faster. With a larger data flow size, the hybrid model’s performance
worsens with respect to the traditional model.
The results may be partly explained by the relatively small communication costs
and the corresponding large deviation. As the data size increases, the communication
costs increase faster than the deviation. Thus the traditional model, which has fewer
communication steps becomes more efficient. This can also be observed in Figure 7.4.
data x-ferred in trad. model (MB) perf. ratio range av. perf. ratio
1.5 [0.25, 39.34] 0.84
3 [0.88, 1.09] 0.98
4.5 [0.91, 1.09] 0.99
6 [0.88, 1.06] 0.97
12 [0.93, 1.06] 0.99
18 [0.96, 1.06] 1.01
24 [0.93, 1.13] 1.03
30 [0.83, 1.12] 0.96
36 [0.90, 1.31] 1.09
48 [0.81, 1.43] 1.09
60 [0.72, 1.70] 1.09
72 [0.64, 1.68] 1.06
Table 7.4: seq ninf (4-nodes, 25 runs, local LAN) hybrid model relative perf.
As more nodes are added to the workflow, one would expect the performance of
the hybrid model to drop. This is because additional proxy-to-proxy communication
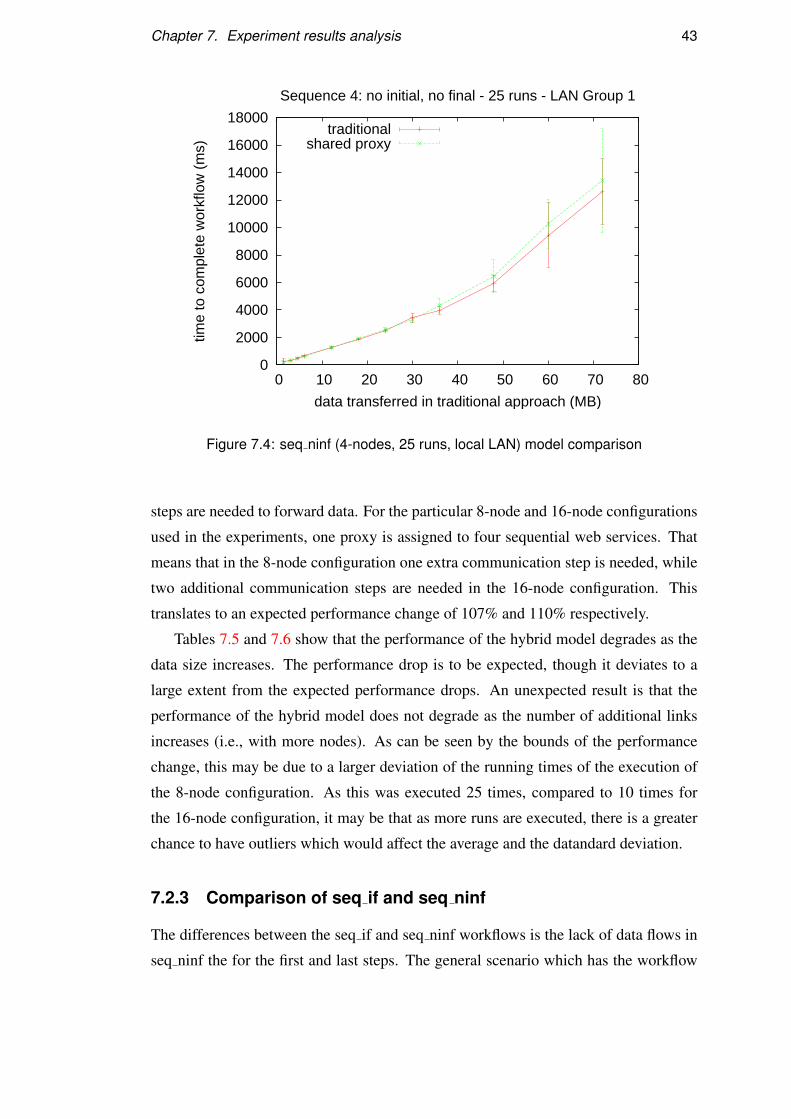
Chapter 7. Experiment results analysis 43
0
2000
4000
6000
8000
10000
12000
14000
16000
18000
0 10 20 30 40 50 60 70 80
time
to c
ompl
ete
wor
kflo
w (
ms)
data transferred in traditional approach (MB)
Sequence 4: no initial, no final - 25 runs - LAN Group 1
traditionalshared proxy
Figure 7.4: seq ninf (4-nodes, 25 runs, local LAN) model comparison
steps are needed to forward data. For the particular 8-node and 16-node configurations
used in the experiments, one proxy is assigned to four sequential web services. That
means that in the 8-node configuration one extra communication step is needed, while
two additional communication steps are needed in the 16-node configuration. This
translates to an expected performance change of 107% and 110% respectively.
Tables 7.5 and 7.6 show that the performance of the hybrid model degrades as the
data size increases. The performance drop is to be expected, though it deviates to a
large extent from the expected performance drops. An unexpected result is that the
performance of the hybrid model does not degrade as the number of additional links
increases (i.e., with more nodes). As can be seen by the bounds of the performance
change, this may be due to a larger deviation of the running times of the execution of
the 8-node configuration. As this was executed 25 times, compared to 10 times for
the 16-node configuration, it may be that as more runs are executed, there is a greater
chance to have outliers which would affect the average and the datandard deviation.
7.2.3 Comparison of seq if and seq ninf
The differences between the seq if and seq ninf workflows is the lack of data flows in
seq ninf the for the first and last steps. The general scenario which has the workflow
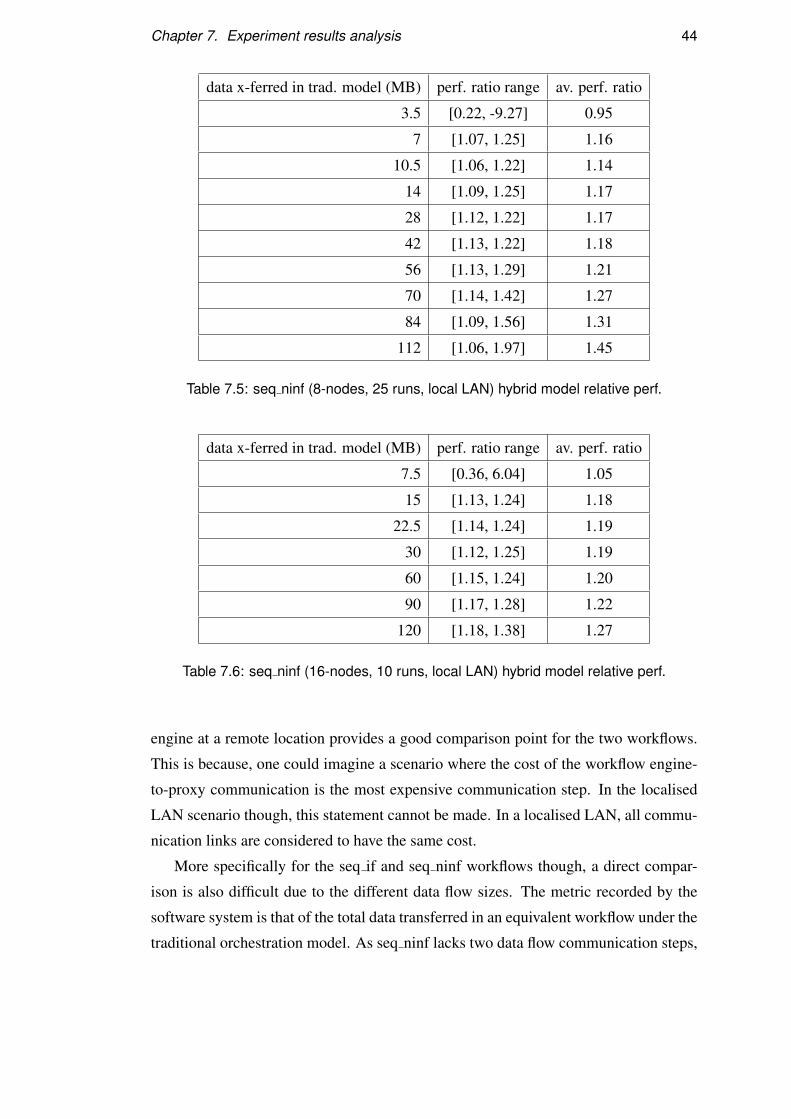
Chapter 7. Experiment results analysis 44
data x-ferred in trad. model (MB) perf. ratio range av. perf. ratio
3.5 [0.22, -9.27] 0.95
7 [1.07, 1.25] 1.16
10.5 [1.06, 1.22] 1.14
14 [1.09, 1.25] 1.17
28 [1.12, 1.22] 1.17
42 [1.13, 1.22] 1.18
56 [1.13, 1.29] 1.21
70 [1.14, 1.42] 1.27
84 [1.09, 1.56] 1.31
112 [1.06, 1.97] 1.45
Table 7.5: seq ninf (8-nodes, 25 runs, local LAN) hybrid model relative perf.
data x-ferred in trad. model (MB) perf. ratio range av. perf. ratio
7.5 [0.36, 6.04] 1.05
15 [1.13, 1.24] 1.18
22.5 [1.14, 1.24] 1.19
30 [1.12, 1.25] 1.19
60 [1.15, 1.24] 1.20
90 [1.17, 1.28] 1.22
120 [1.18, 1.38] 1.27
Table 7.6: seq ninf (16-nodes, 10 runs, local LAN) hybrid model relative perf.
engine at a remote location provides a good comparison point for the two workflows.
This is because, one could imagine a scenario where the cost of the workflow engine-
to-proxy communication is the most expensive communication step. In the localised
LAN scenario though, this statement cannot be made. In a localised LAN, all commu-
nication links are considered to have the same cost.
More specifically for the seq if and seq ninf workflows though, a direct compar-
ison is also difficult due to the different data flow sizes. The metric recorded by the
software system is that of the total data transferred in an equivalent workflow under the
traditional orchestration model. As seq ninf lacks two data flow communication steps,
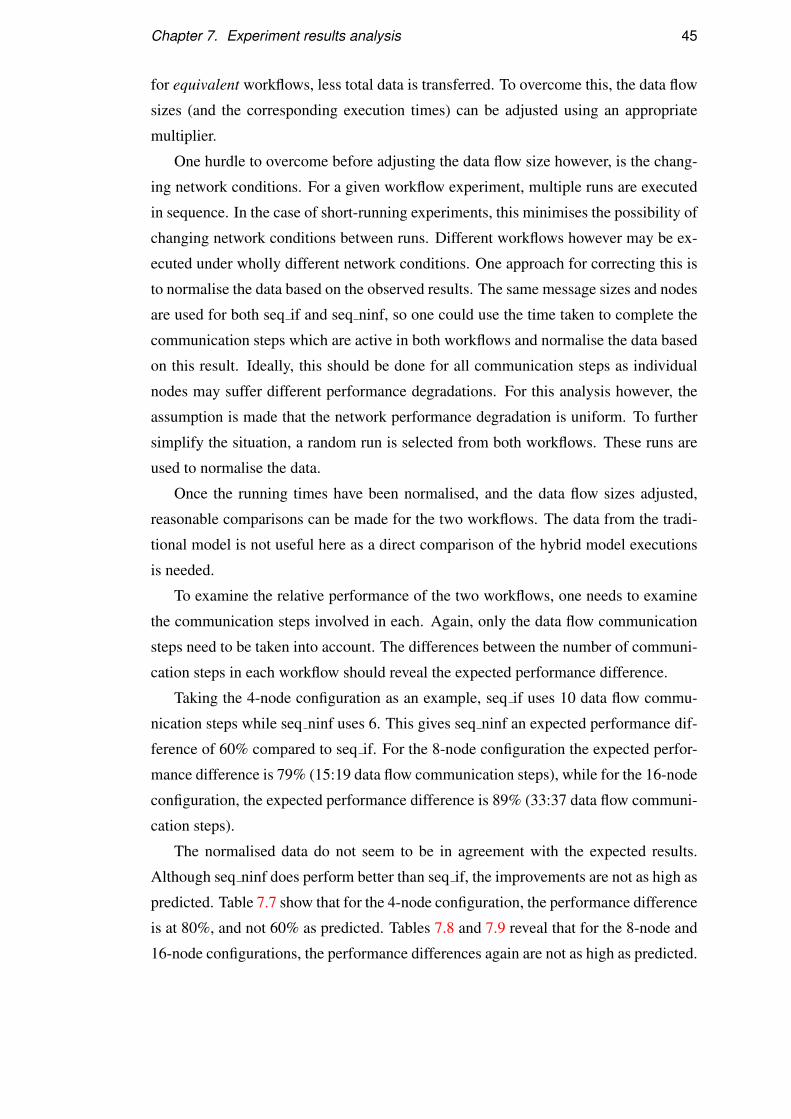
Chapter 7. Experiment results analysis 45
for equivalent workflows, less total data is transferred. To overcome this, the data flow
sizes (and the corresponding execution times) can be adjusted using an appropriate
multiplier.
One hurdle to overcome before adjusting the data flow size however, is the chang-
ing network conditions. For a given workflow experiment, multiple runs are executed
in sequence. In the case of short-running experiments, this minimises the possibility of
changing network conditions between runs. Different workflows however may be ex-
ecuted under wholly different network conditions. One approach for correcting this is
to normalise the data based on the observed results. The same message sizes and nodes
are used for both seq if and seq ninf, so one could use the time taken to complete the
communication steps which are active in both workflows and normalise the data based
on this result. Ideally, this should be done for all communication steps as individual
nodes may suffer different performance degradations. For this analysis however, the
assumption is made that the network performance degradation is uniform. To further
simplify the situation, a random run is selected from both workflows. These runs are
used to normalise the data.
Once the running times have been normalised, and the data flow sizes adjusted,
reasonable comparisons can be made for the two workflows. The data from the tradi-
tional model is not useful here as a direct comparison of the hybrid model executions
is needed.
To examine the relative performance of the two workflows, one needs to examine
the communication steps involved in each. Again, only the data flow communication
steps need to be taken into account. The differences between the number of communi-
cation steps in each workflow should reveal the expected performance difference.
Taking the 4-node configuration as an example, seq if uses 10 data flow commu-
nication steps while seq ninf uses 6. This gives seq ninf an expected performance dif-
ference of 60% compared to seq if. For the 8-node configuration the expected perfor-
mance difference is 79% (15:19 data flow communication steps), while for the 16-node
configuration, the expected performance difference is 89% (33:37 data flow communi-
cation steps).
The normalised data do not seem to be in agreement with the expected results.
Although seq ninf does perform better than seq if, the improvements are not as high as
predicted. Table 7.7 show that for the 4-node configuration, the performance difference
is at 80%, and not 60% as predicted. Tables 7.8 and 7.9 reveal that for the 8-node and
16-node configurations, the performance differences again are not as high as predicted.
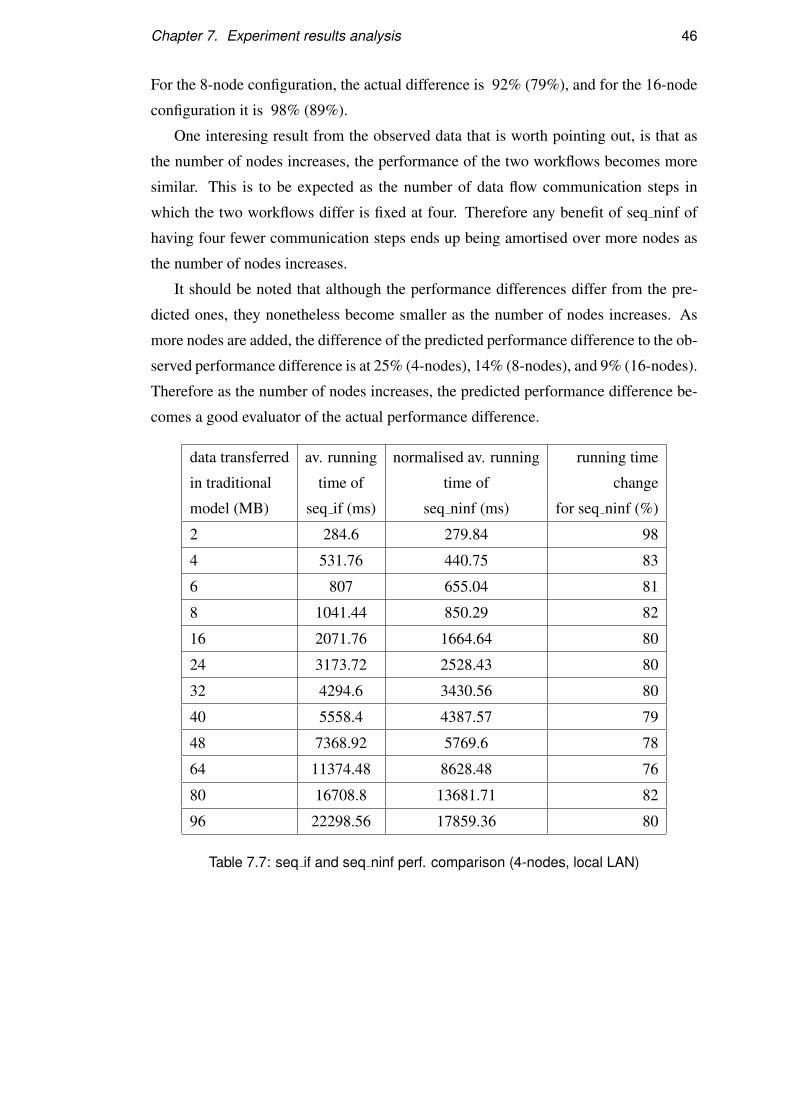
Chapter 7. Experiment results analysis 46
For the 8-node configuration, the actual difference is 92% (79%), and for the 16-node
configuration it is 98% (89%).
One interesing result from the observed data that is worth pointing out, is that as
the number of nodes increases, the performance of the two workflows becomes more
similar. This is to be expected as the number of data flow communication steps in
which the two workflows differ is fixed at four. Therefore any benefit of seq ninf of
having four fewer communication steps ends up being amortised over more nodes as
the number of nodes increases.
It should be noted that although the performance differences differ from the pre-
dicted ones, they nonetheless become smaller as the number of nodes increases. As
more nodes are added, the difference of the predicted performance difference to the ob-
served performance difference is at 25% (4-nodes), 14% (8-nodes), and 9% (16-nodes).
Therefore as the number of nodes increases, the predicted performance difference be-
comes a good evaluator of the actual performance difference.
data transferred av. running normalised av. running running time
in traditional time of time of change
model (MB) seq if (ms) seq ninf (ms) for seq ninf (%)
2 284.6 279.84 98
4 531.76 440.75 83
6 807 655.04 81
8 1041.44 850.29 82
16 2071.76 1664.64 80
24 3173.72 2528.43 80
32 4294.6 3430.56 80
40 5558.4 4387.57 79
48 7368.92 5769.6 78
64 11374.48 8628.48 76
80 16708.8 13681.71 82
96 22298.56 17859.36 80
Table 7.7: seq if and seq ninf perf. comparison (4-nodes, local LAN)
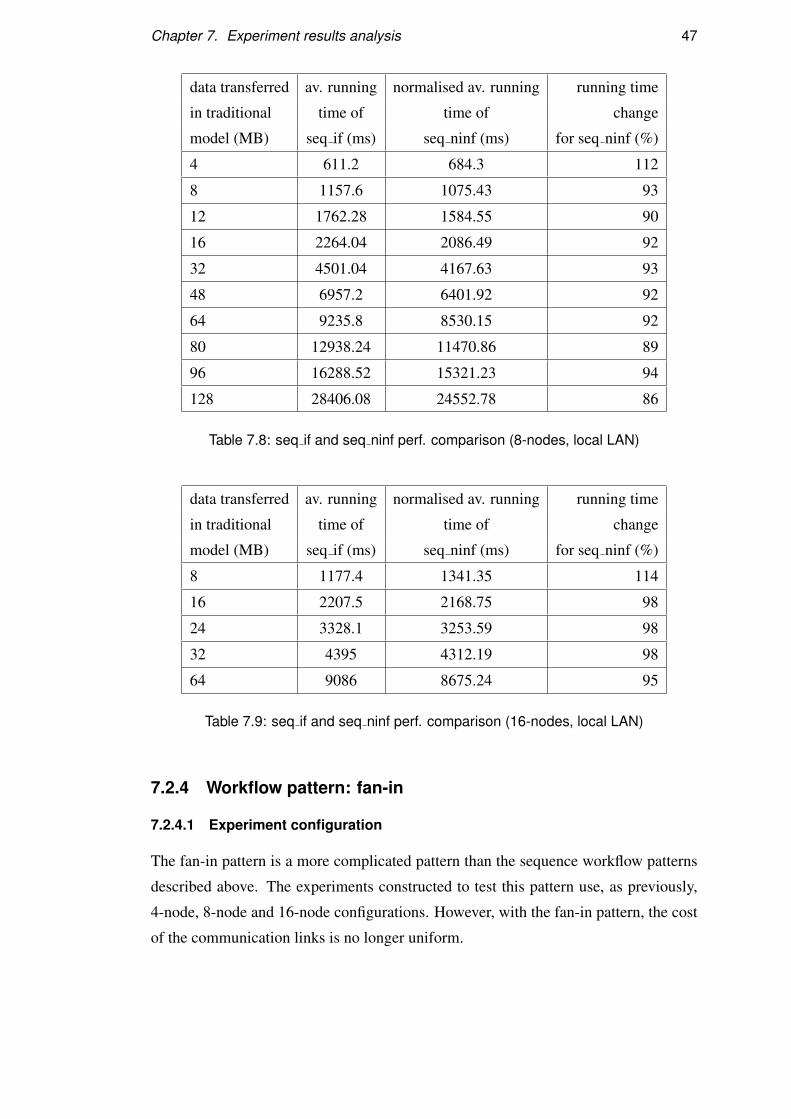
Chapter 7. Experiment results analysis 47
data transferred av. running normalised av. running running time
in traditional time of time of change
model (MB) seq if (ms) seq ninf (ms) for seq ninf (%)
4 611.2 684.3 112
8 1157.6 1075.43 93
12 1762.28 1584.55 90
16 2264.04 2086.49 92
32 4501.04 4167.63 93
48 6957.2 6401.92 92
64 9235.8 8530.15 92
80 12938.24 11470.86 89
96 16288.52 15321.23 94
128 28406.08 24552.78 86
Table 7.8: seq if and seq ninf perf. comparison (8-nodes, local LAN)
data transferred av. running normalised av. running running time
in traditional time of time of change
model (MB) seq if (ms) seq ninf (ms) for seq ninf (%)
8 1177.4 1341.35 114
16 2207.5 2168.75 98
24 3328.1 3253.59 98
32 4395 4312.19 98
64 9086 8675.24 95
Table 7.9: seq if and seq ninf perf. comparison (16-nodes, local LAN)
7.2.4 Workflow pattern: fan-in
7.2.4.1 Experiment configuration
The fan-in pattern is a more complicated pattern than the sequence workflow patterns
described above. The experiments constructed to test this pattern use, as previously,
4-node, 8-node and 16-node configurations. However, with the fan-in pattern, the cost
of the communication links is no longer uniform.
Chapter 7. Experiment results analysis 48
The basic workflow for these experiments is that data is received (in parallel) from
all but one workflow web service. The responses are then combined and sent to the
remaining workflow web service. This final request is therefore equal to the sum of all
the previous communication steps. This gives the overall communication costs for the
pattern in the hybrid model as 6 data flow steps (4-nodes), 22 data flow steps (8-nodes),
and 54 data flow steps (16-nodes).
The increase in the communication steps of the 8-node and 16-node configurations
is due to the fact that the introduction of proxies necessitates additional communica-
tion steps. Once a response is received by a proxy from a workflow web service, if
that proxy is not the proxy responsible for the final workflow web service operation
invocation, then it must forward the data to that proxy.
As with seq ninf, the initial and final communication links are not used. In fact,
as can be seen in Figure 7.5, the communication between workflow engine and the
proxies does not involve any data flow communication.
Taking the 4-node configuration as an example (Figure 7.5), and assuming the mes-
sage size for all but the last workflow web service are the same, there would be 6
communication steps between the proxies and the workflow engine. (3 for the first 3
workflow web services, and a cumulative cost of 3 steps for the final workflow web
service).
In the hybrid model, this depends on the number of proxies used. As in the pre-
vious workflow pattern experiments, a single shared proxy is used. With this proxy
configuration, there would be 6 communication steps between the proxy and the 4 web
services.
With a single proxy, there is no need to forward data, and thus no more data flow
communication steps are needed. Since the workflow engine, the proxy and the work-
flow web services, are all hosted on different machines of the same LAN, one would
expect the cost of the communication steps to be equal. Assuming the message pro-
cessing and workflow web service operation processing costs are negligible, the perfor-
mance of the hybrid model would be expected to be the same as the traditional model.
However, this does not take into account the additional control flow messages needed
to coordinate the proxies. When the additional control flow messages are taken into
account, one would expect the performance of the hybrid model to be lower than that
of the traditional model.
In the case of the 8-node and 16-node configurations, then the expected perfor-
mance is more easily determined. All data at proxies will need to make their way to
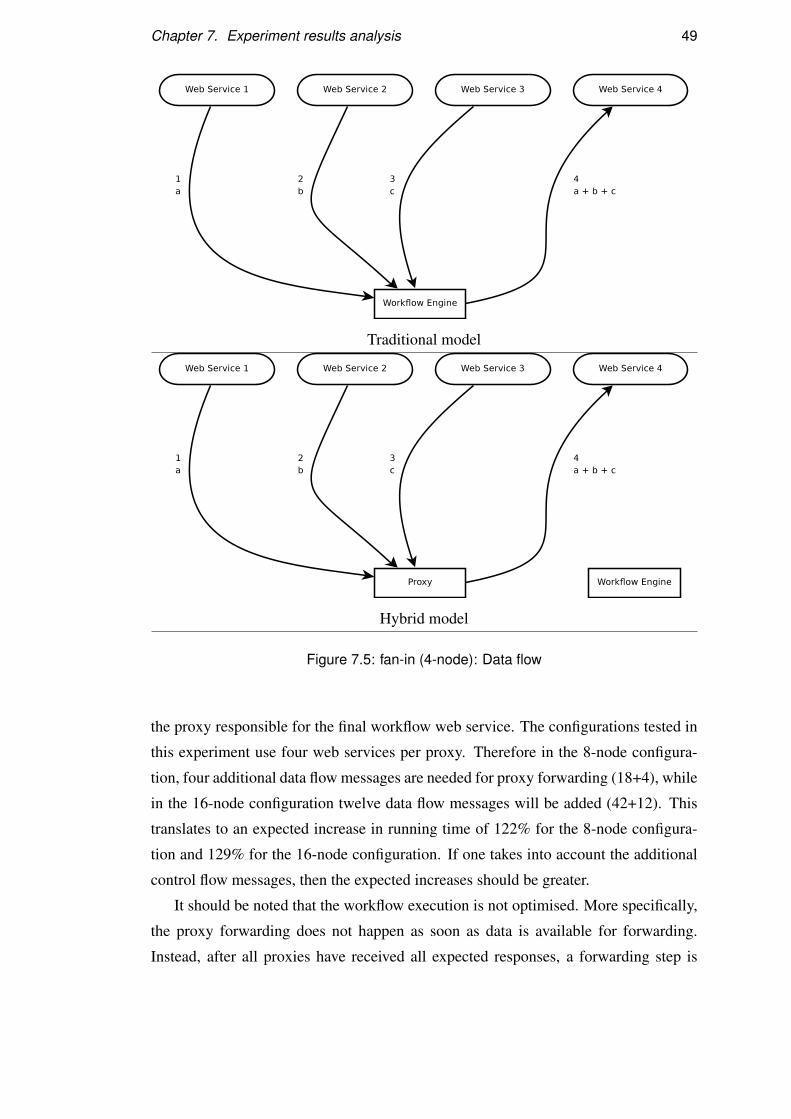
Chapter 7. Experiment results analysis 49
Traditional model
Hybrid model
Figure 7.5: fan-in (4-node): Data flow
the proxy responsible for the final workflow web service. The configurations tested in
this experiment use four web services per proxy. Therefore in the 8-node configura-
tion, four additional data flow messages are needed for proxy forwarding (18+4), while
in the 16-node configuration twelve data flow messages will be added (42+12). This
translates to an expected increase in running time of 122% for the 8-node configura-
tion and 129% for the 16-node configuration. If one takes into account the additional
control flow messages, then the expected increases should be greater.
It should be noted that the workflow execution is not optimised. More specifically,
the proxy forwarding does not happen as soon as data is available for forwarding.
Instead, after all proxies have received all expected responses, a forwarding step is
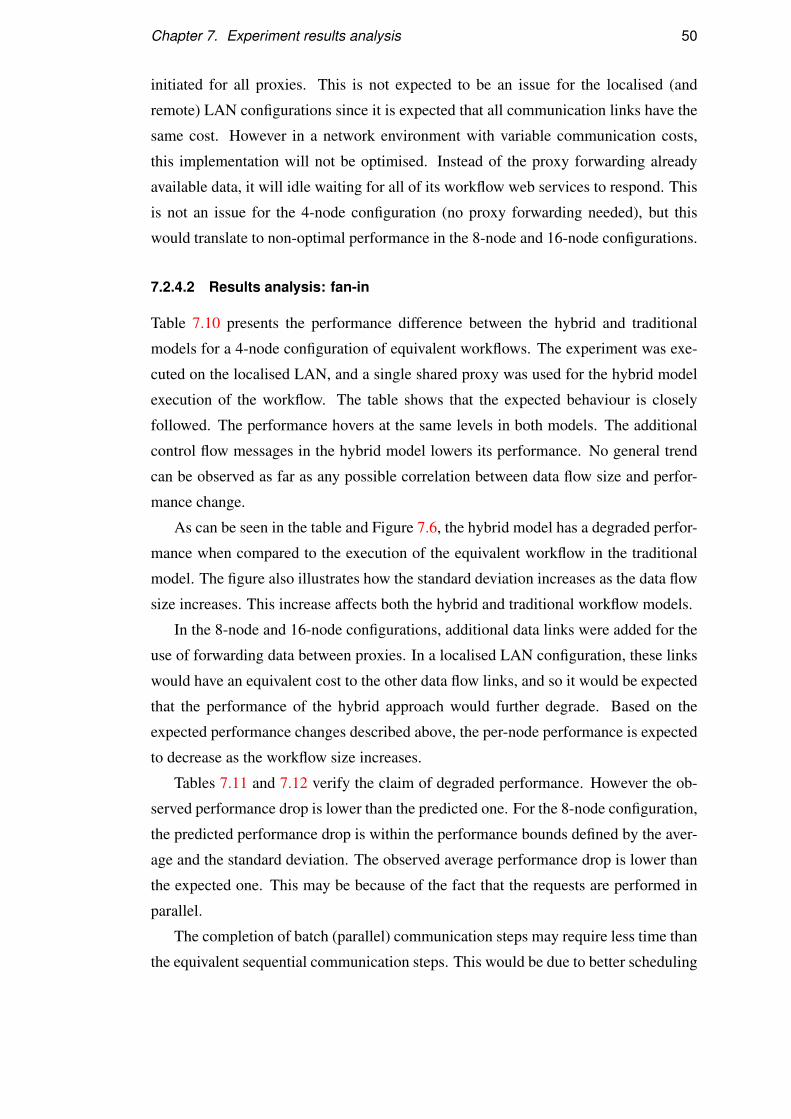
Chapter 7. Experiment results analysis 50
initiated for all proxies. This is not expected to be an issue for the localised (and
remote) LAN configurations since it is expected that all communication links have the
same cost. However in a network environment with variable communication costs,
this implementation will not be optimised. Instead of the proxy forwarding already
available data, it will idle waiting for all of its workflow web services to respond. This
is not an issue for the 4-node configuration (no proxy forwarding needed), but this
would translate to non-optimal performance in the 8-node and 16-node configurations.
7.2.4.2 Results analysis: fan-in
Table 7.10 presents the performance difference between the hybrid and traditional
models for a 4-node configuration of equivalent workflows. The experiment was exe-
cuted on the localised LAN, and a single shared proxy was used for the hybrid model
execution of the workflow. The table shows that the expected behaviour is closely
followed. The performance hovers at the same levels in both models. The additional
control flow messages in the hybrid model lowers its performance. No general trend
can be observed as far as any possible correlation between data flow size and perfor-
mance change.
As can be seen in the table and Figure 7.6, the hybrid model has a degraded perfor-
mance when compared to the execution of the equivalent workflow in the traditional
model. The figure also illustrates how the standard deviation increases as the data flow
size increases. This increase affects both the hybrid and traditional workflow models.
In the 8-node and 16-node configurations, additional data links were added for the
use of forwarding data between proxies. In a localised LAN configuration, these links
would have an equivalent cost to the other data flow links, and so it would be expected
that the performance of the hybrid approach would further degrade. Based on the
expected performance changes described above, the per-node performance is expected
to decrease as the workflow size increases.
Tables 7.11 and 7.12 verify the claim of degraded performance. However the ob-
served performance drop is lower than the predicted one. For the 8-node configuration,
the predicted performance drop is within the performance bounds defined by the aver-
age and the standard deviation. The observed average performance drop is lower than
the expected one. This may be because of the fact that the requests are performed in
parallel.
The completion of batch (parallel) communication steps may require less time than
the equivalent sequential communication steps. This would be due to better scheduling
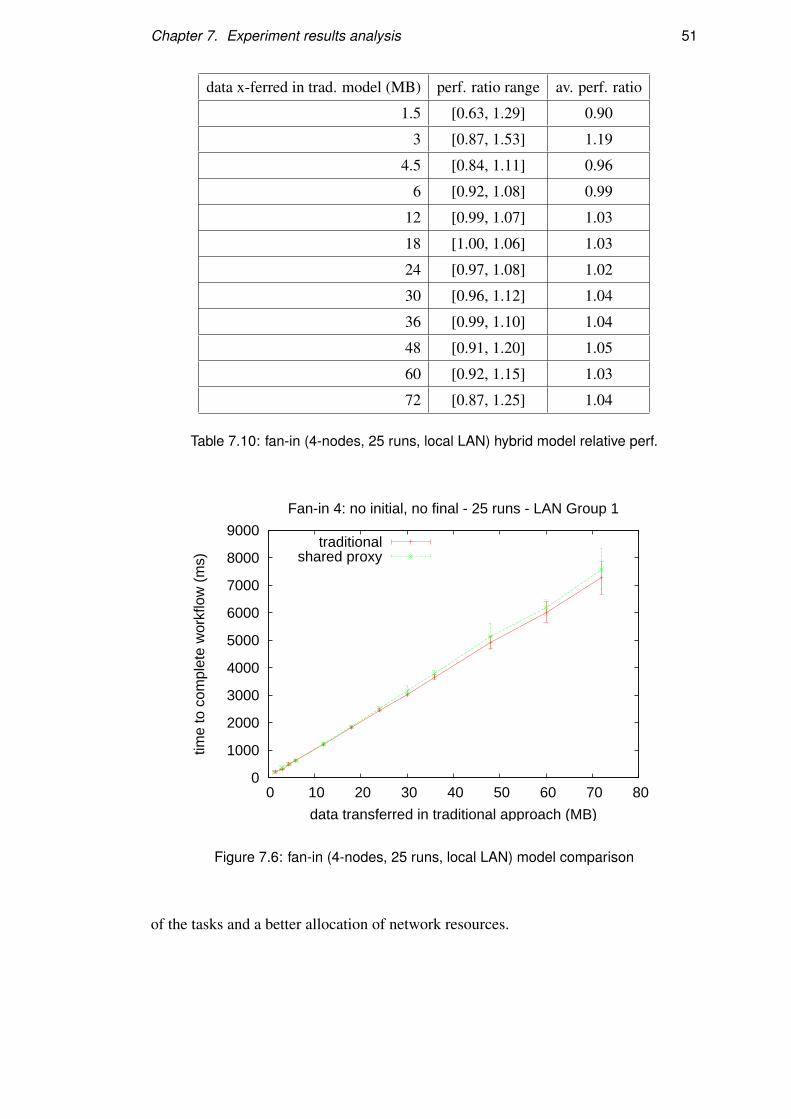
Chapter 7. Experiment results analysis 51
data x-ferred in trad. model (MB) perf. ratio range av. perf. ratio
1.5 [0.63, 1.29] 0.90
3 [0.87, 1.53] 1.19
4.5 [0.84, 1.11] 0.96
6 [0.92, 1.08] 0.99
12 [0.99, 1.07] 1.03
18 [1.00, 1.06] 1.03
24 [0.97, 1.08] 1.02
30 [0.96, 1.12] 1.04
36 [0.99, 1.10] 1.04
48 [0.91, 1.20] 1.05
60 [0.92, 1.15] 1.03
72 [0.87, 1.25] 1.04
Table 7.10: fan-in (4-nodes, 25 runs, local LAN) hybrid model relative perf.
0
1000
2000
3000
4000
5000
6000
7000
8000
9000
0 10 20 30 40 50 60 70 80
time
to c
ompl
ete
wor
kflo
w (
ms)
data transferred in traditional approach (MB)
Fan-in 4: no initial, no final - 25 runs - LAN Group 1
traditionalshared proxy
Figure 7.6: fan-in (4-nodes, 25 runs, local LAN) model comparison
of the tasks and a better allocation of network resources.
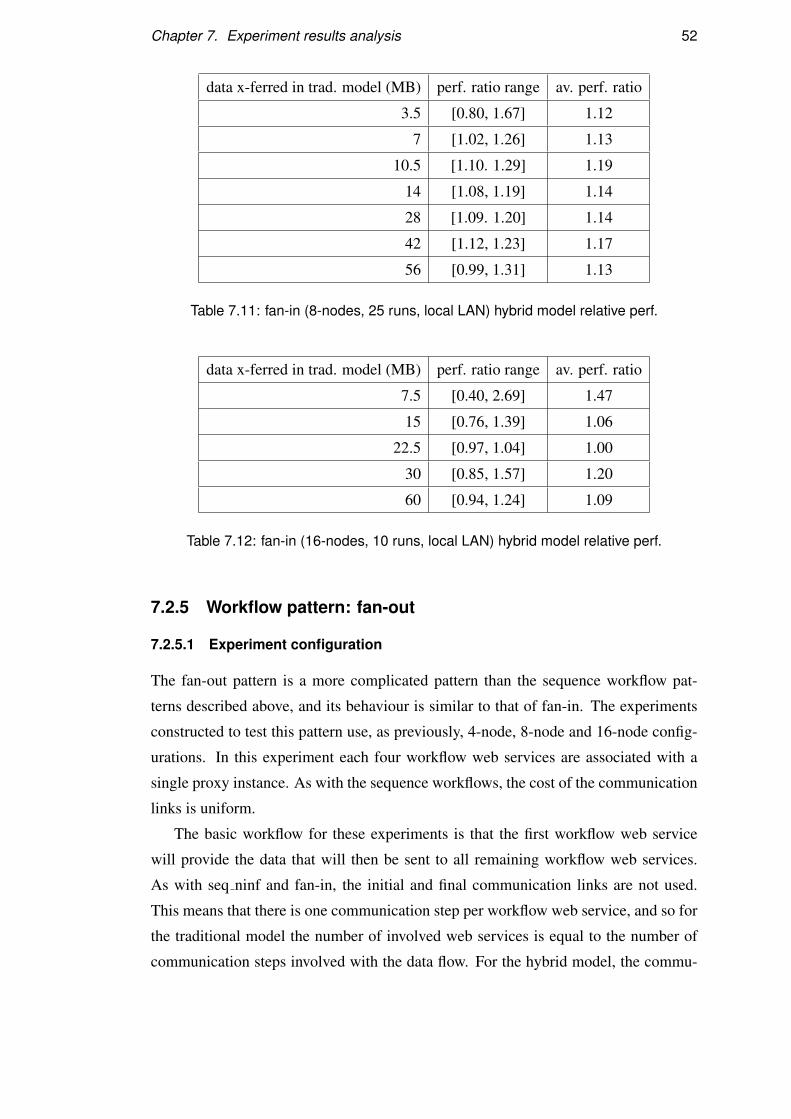
Chapter 7. Experiment results analysis 52
data x-ferred in trad. model (MB) perf. ratio range av. perf. ratio
3.5 [0.80, 1.67] 1.12
7 [1.02, 1.26] 1.13
10.5 [1.10. 1.29] 1.19
14 [1.08, 1.19] 1.14
28 [1.09. 1.20] 1.14
42 [1.12, 1.23] 1.17
56 [0.99, 1.31] 1.13
Table 7.11: fan-in (8-nodes, 25 runs, local LAN) hybrid model relative perf.
data x-ferred in trad. model (MB) perf. ratio range av. perf. ratio
7.5 [0.40, 2.69] 1.47
15 [0.76, 1.39] 1.06
22.5 [0.97, 1.04] 1.00
30 [0.85, 1.57] 1.20
60 [0.94, 1.24] 1.09
Table 7.12: fan-in (16-nodes, 10 runs, local LAN) hybrid model relative perf.
7.2.5 Workflow pattern: fan-out
7.2.5.1 Experiment configuration
The fan-out pattern is a more complicated pattern than the sequence workflow pat-
terns described above, and its behaviour is similar to that of fan-in. The experiments
constructed to test this pattern use, as previously, 4-node, 8-node and 16-node config-
urations. In this experiment each four workflow web services are associated with a
single proxy instance. As with the sequence workflows, the cost of the communication
links is uniform.
The basic workflow for these experiments is that the first workflow web service
will provide the data that will then be sent to all remaining workflow web services.
As with seq ninf and fan-in, the initial and final communication links are not used.
This means that there is one communication step per workflow web service, and so for
the traditional model the number of involved web services is equal to the number of
communication steps involved with the data flow. For the hybrid model, the commu-
Chapter 7. Experiment results analysis 53
nication costs for the pattern as used in the experiment, are 4 data flow steps (4-node
configuration).
With a single proxy, there is no need to forward data, and thus no more data flow
communication steps are needed. Since the workflow engine, the proxy and the work-
flow web services, are all hosted on different machines of the same LAN, one would
expect the cost of the communication steps to be equal. Assuming the message pro-
cessing and workflow web service operation processing costs are negligible, the perfor-
mance of the hybrid model would be expected to be the same as the traditional model.
However, this does not take into account the additional control flow messages needed
to coordinate the proxies. When the additional control flow messages are taken into
account, one would expect the performance of the hybrid model to be lower than that
of the traditional model.
In the case of the 8-node and 16-node configurations, then the expected perfor-
mance is more easily determined. All data at proxies will need to make their way
to the proxy responsible for the final workflow web service. Therefore in the 8-node
configuration, one additional data flow message is needed for proxy forwarding (8+1),
while in the 16-node configuration three data flow messages will be added (16+3). This
translates to an expected increase in running time of 113% for the 8-node configura-
tion and 119% for the 16-node configuration. If one takes into account the additional
control flow messages, then the expected increases should be greater.
The increase in the communication steps of the 8-node and 16-node configurations
is due to the fact that the introduction of proxies necessitates additional communication
steps. When the first workflow web service provides its response to its associated
proxy, that proxy will be notified by the workflow engine to forward the data to the
proxies responsible for the invocation of the remaining workflow web services (with
the exception of the workflow web services it is responsible for). The number of times
the original data will need to be forwarded is one less than the number of proxies in
the workflow.
As with fan-in, the communication between workflow engine and the proxies does
not involve any data flow communication (Figure 7.7).
7.2.5.2 Results analysis
Table 7.13 presents the performance difference between the hybrid and traditional
models for a 4-node configuration of equivalent workflows. The experiment was exe-
cuted on the localised LAN, and a single shared proxy was used for the hybrid model
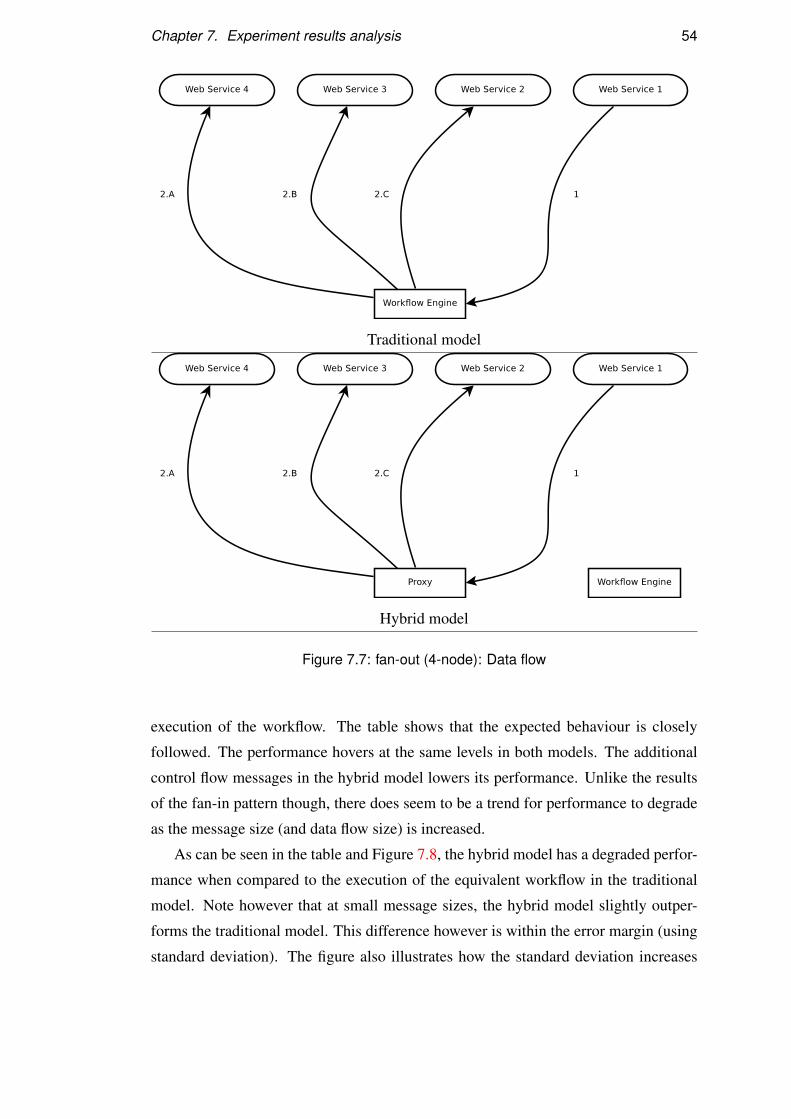
Chapter 7. Experiment results analysis 54
Traditional model
Hybrid model
Figure 7.7: fan-out (4-node): Data flow
execution of the workflow. The table shows that the expected behaviour is closely
followed. The performance hovers at the same levels in both models. The additional
control flow messages in the hybrid model lowers its performance. Unlike the results
of the fan-in pattern though, there does seem to be a trend for performance to degrade
as the message size (and data flow size) is increased.
As can be seen in the table and Figure 7.8, the hybrid model has a degraded perfor-
mance when compared to the execution of the equivalent workflow in the traditional
model. Note however that at small message sizes, the hybrid model slightly outper-
forms the traditional model. This difference however is within the error margin (using
standard deviation). The figure also illustrates how the standard deviation increases
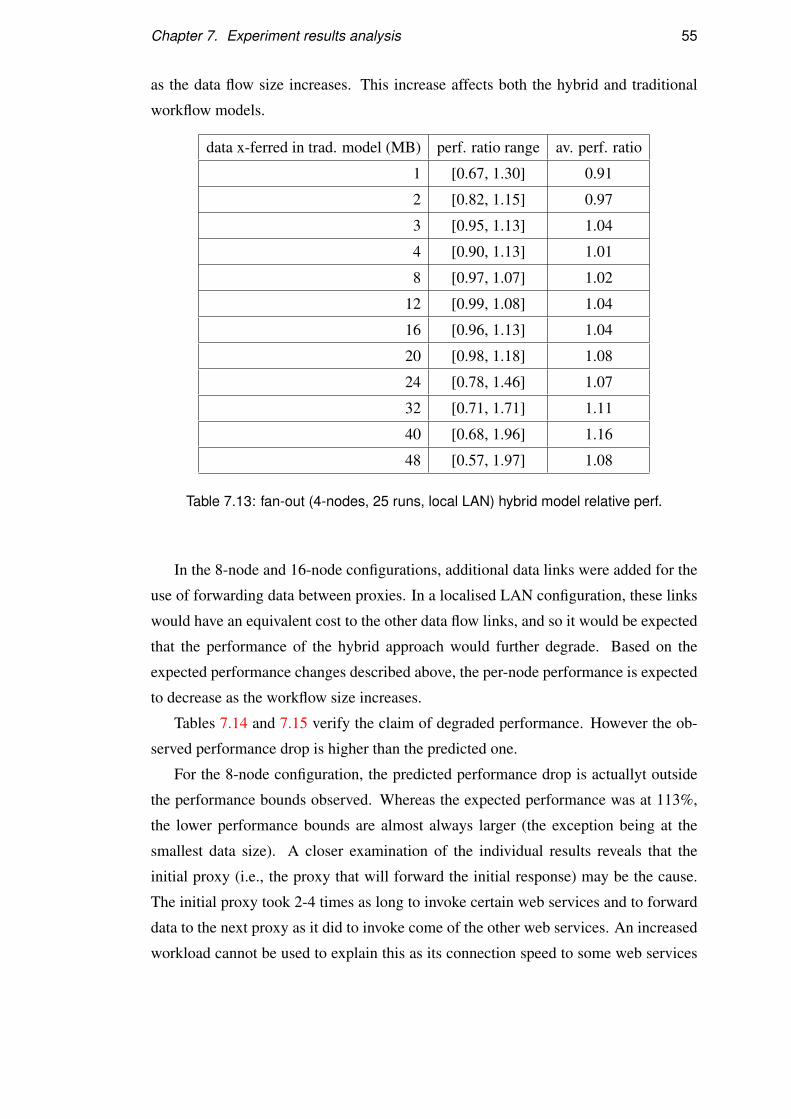
Chapter 7. Experiment results analysis 55
as the data flow size increases. This increase affects both the hybrid and traditional
workflow models.
data x-ferred in trad. model (MB) perf. ratio range av. perf. ratio
1 [0.67, 1.30] 0.91
2 [0.82, 1.15] 0.97
3 [0.95, 1.13] 1.04
4 [0.90, 1.13] 1.01
8 [0.97, 1.07] 1.02
12 [0.99, 1.08] 1.04
16 [0.96, 1.13] 1.04
20 [0.98, 1.18] 1.08
24 [0.78, 1.46] 1.07
32 [0.71, 1.71] 1.11
40 [0.68, 1.96] 1.16
48 [0.57, 1.97] 1.08
Table 7.13: fan-out (4-nodes, 25 runs, local LAN) hybrid model relative perf.
In the 8-node and 16-node configurations, additional data links were added for the
use of forwarding data between proxies. In a localised LAN configuration, these links
would have an equivalent cost to the other data flow links, and so it would be expected
that the performance of the hybrid approach would further degrade. Based on the
expected performance changes described above, the per-node performance is expected
to decrease as the workflow size increases.
Tables 7.14 and 7.15 verify the claim of degraded performance. However the ob-
served performance drop is higher than the predicted one.
For the 8-node configuration, the predicted performance drop is actuallyt outside
the performance bounds observed. Whereas the expected performance was at 113%,
the lower performance bounds are almost always larger (the exception being at the
smallest data size). A closer examination of the individual results reveals that the
initial proxy (i.e., the proxy that will forward the initial response) may be the cause.
The initial proxy took 2-4 times as long to invoke certain web services and to forward
data to the next proxy as it did to invoke come of the other web services. An increased
workload cannot be used to explain this as its connection speed to some web services
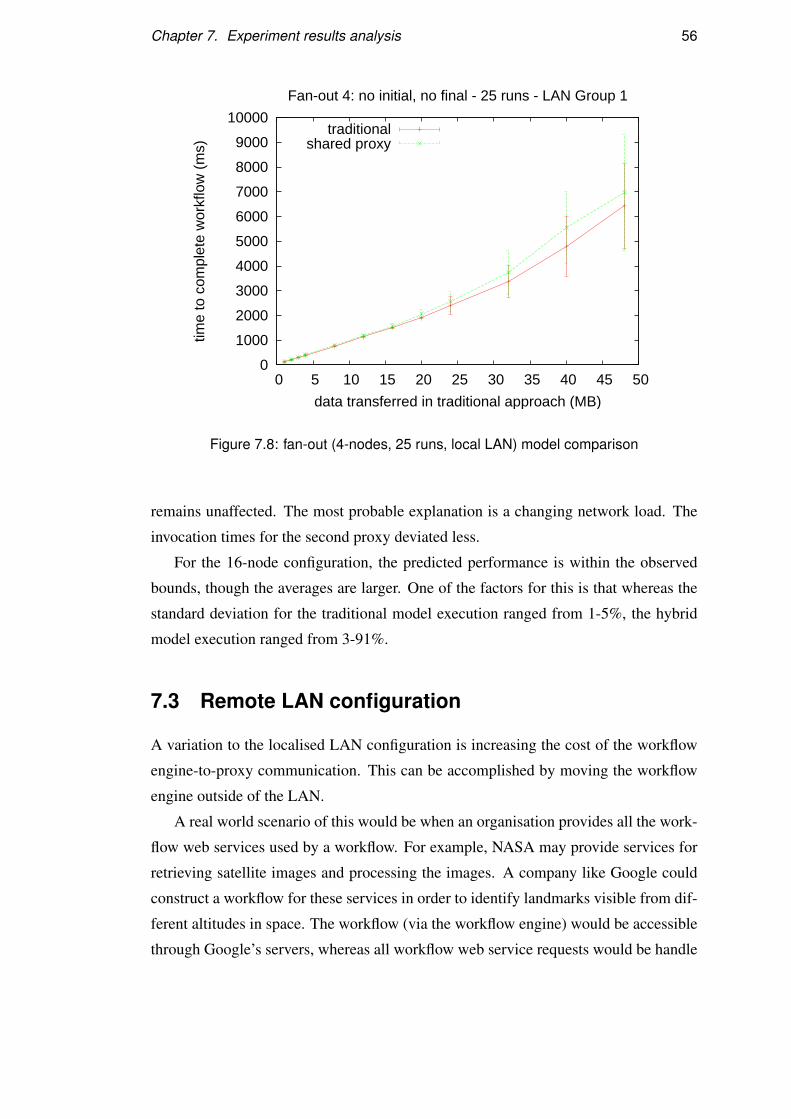
Chapter 7. Experiment results analysis 56
0
1000
2000
3000
4000
5000
6000
7000
8000
9000
10000
0 5 10 15 20 25 30 35 40 45 50
time
to c
ompl
ete
wor
kflo
w (
ms)
data transferred in traditional approach (MB)
Fan-out 4: no initial, no final - 25 runs - LAN Group 1
traditionalshared proxy
Figure 7.8: fan-out (4-nodes, 25 runs, local LAN) model comparison
remains unaffected. The most probable explanation is a changing network load. The
invocation times for the second proxy deviated less.
For the 16-node configuration, the predicted performance is within the observed
bounds, though the averages are larger. One of the factors for this is that whereas the
standard deviation for the traditional model execution ranged from 1-5%, the hybrid
model execution ranged from 3-91%.
7.3 Remote LAN configuration
A variation to the localised LAN configuration is increasing the cost of the workflow
engine-to-proxy communication. This can be accomplished by moving the workflow
engine outside of the LAN.
A real world scenario of this would be when an organisation provides all the work-
flow web services used by a workflow. For example, NASA may provide services for
retrieving satellite images and processing the images. A company like Google could
construct a workflow for these services in order to identify landmarks visible from dif-
ferent altitudes in space. The workflow (via the workflow engine) would be accessible
through Google’s servers, whereas all workflow web service requests would be handle
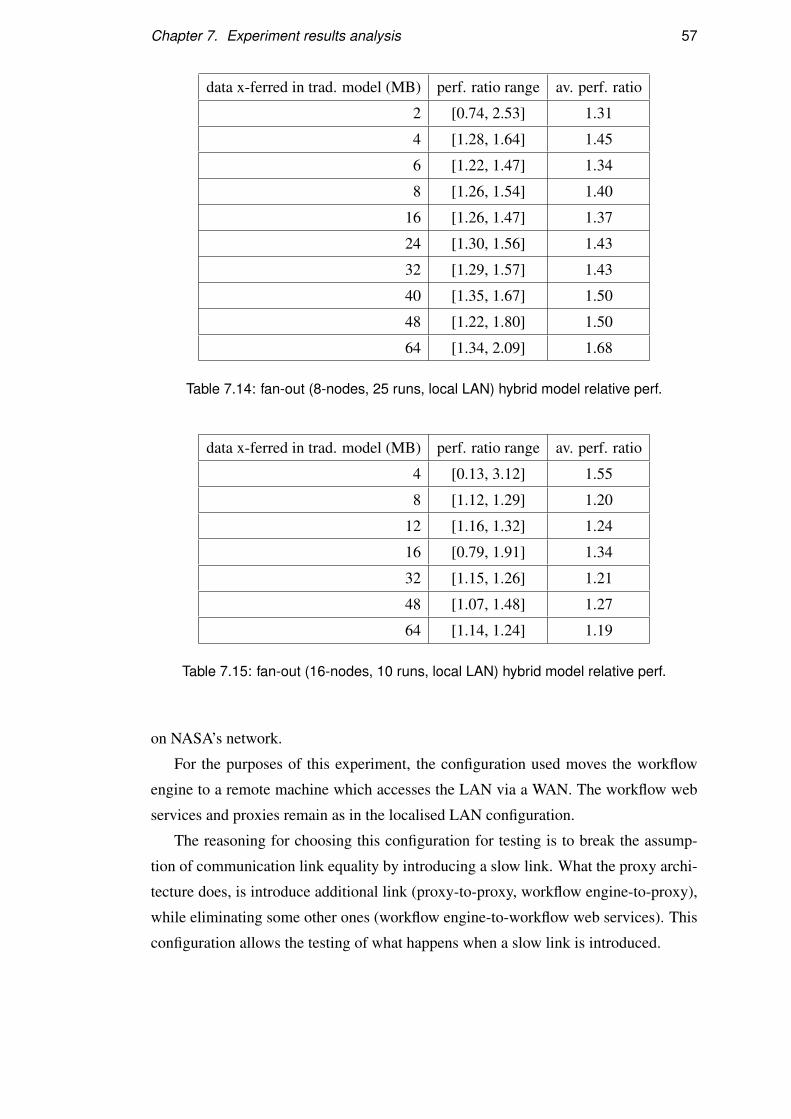
Chapter 7. Experiment results analysis 57
data x-ferred in trad. model (MB) perf. ratio range av. perf. ratio
2 [0.74, 2.53] 1.31
4 [1.28, 1.64] 1.45
6 [1.22, 1.47] 1.34
8 [1.26, 1.54] 1.40
16 [1.26, 1.47] 1.37
24 [1.30, 1.56] 1.43
32 [1.29, 1.57] 1.43
40 [1.35, 1.67] 1.50
48 [1.22, 1.80] 1.50
64 [1.34, 2.09] 1.68
Table 7.14: fan-out (8-nodes, 25 runs, local LAN) hybrid model relative perf.
data x-ferred in trad. model (MB) perf. ratio range av. perf. ratio
4 [0.13, 3.12] 1.55
8 [1.12, 1.29] 1.20
12 [1.16, 1.32] 1.24
16 [0.79, 1.91] 1.34
32 [1.15, 1.26] 1.21
48 [1.07, 1.48] 1.27
64 [1.14, 1.24] 1.19
Table 7.15: fan-out (16-nodes, 10 runs, local LAN) hybrid model relative perf.
on NASA’s network.
For the purposes of this experiment, the configuration used moves the workflow
engine to a remote machine which accesses the LAN via a WAN. The workflow web
services and proxies remain as in the localised LAN configuration.
The reasoning for choosing this configuration for testing is to break the assump-
tion of communication link equality by introducing a slow link. What the proxy archi-
tecture does, is introduce additional link (proxy-to-proxy, workflow engine-to-proxy),
while eliminating some other ones (workflow engine-to-workflow web services). This
configuration allows the testing of what happens when a slow link is introduced.
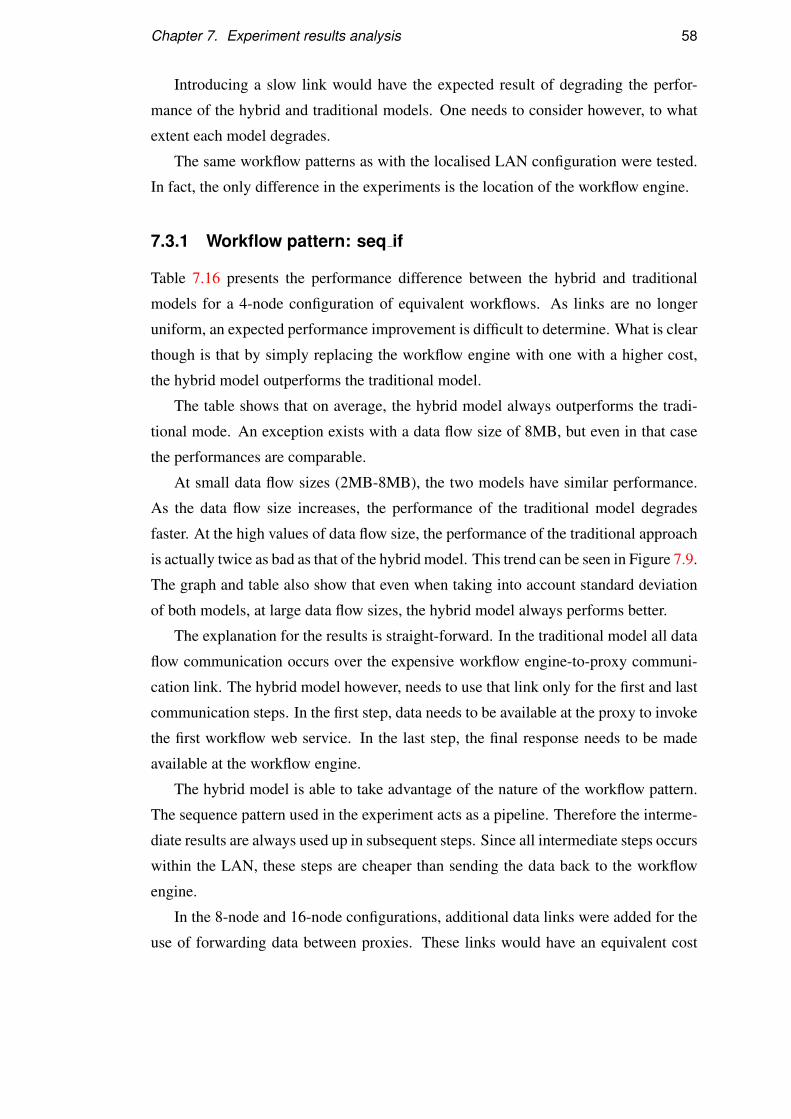
Chapter 7. Experiment results analysis 58
Introducing a slow link would have the expected result of degrading the perfor-
mance of the hybrid and traditional models. One needs to consider however, to what
extent each model degrades.
The same workflow patterns as with the localised LAN configuration were tested.
In fact, the only difference in the experiments is the location of the workflow engine.
7.3.1 Workflow pattern: seq if
Table 7.16 presents the performance difference between the hybrid and traditional
models for a 4-node configuration of equivalent workflows. As links are no longer
uniform, an expected performance improvement is difficult to determine. What is clear
though is that by simply replacing the workflow engine with one with a higher cost,
the hybrid model outperforms the traditional model.
The table shows that on average, the hybrid model always outperforms the tradi-
tional mode. An exception exists with a data flow size of 8MB, but even in that case
the performances are comparable.
At small data flow sizes (2MB-8MB), the two models have similar performance.
As the data flow size increases, the performance of the traditional model degrades
faster. At the high values of data flow size, the performance of the traditional approach
is actually twice as bad as that of the hybrid model. This trend can be seen in Figure 7.9.
The graph and table also show that even when taking into account standard deviation
of both models, at large data flow sizes, the hybrid model always performs better.
The explanation for the results is straight-forward. In the traditional model all data
flow communication occurs over the expensive workflow engine-to-proxy communi-
cation link. The hybrid model however, needs to use that link only for the first and last
communication steps. In the first step, data needs to be available at the proxy to invoke
the first workflow web service. In the last step, the final response needs to be made
available at the workflow engine.
The hybrid model is able to take advantage of the nature of the workflow pattern.
The sequence pattern used in the experiment acts as a pipeline. Therefore the interme-
diate results are always used up in subsequent steps. Since all intermediate steps occurs
within the LAN, these steps are cheaper than sending the data back to the workflow
engine.
In the 8-node and 16-node configurations, additional data links were added for the
use of forwarding data between proxies. These links would have an equivalent cost
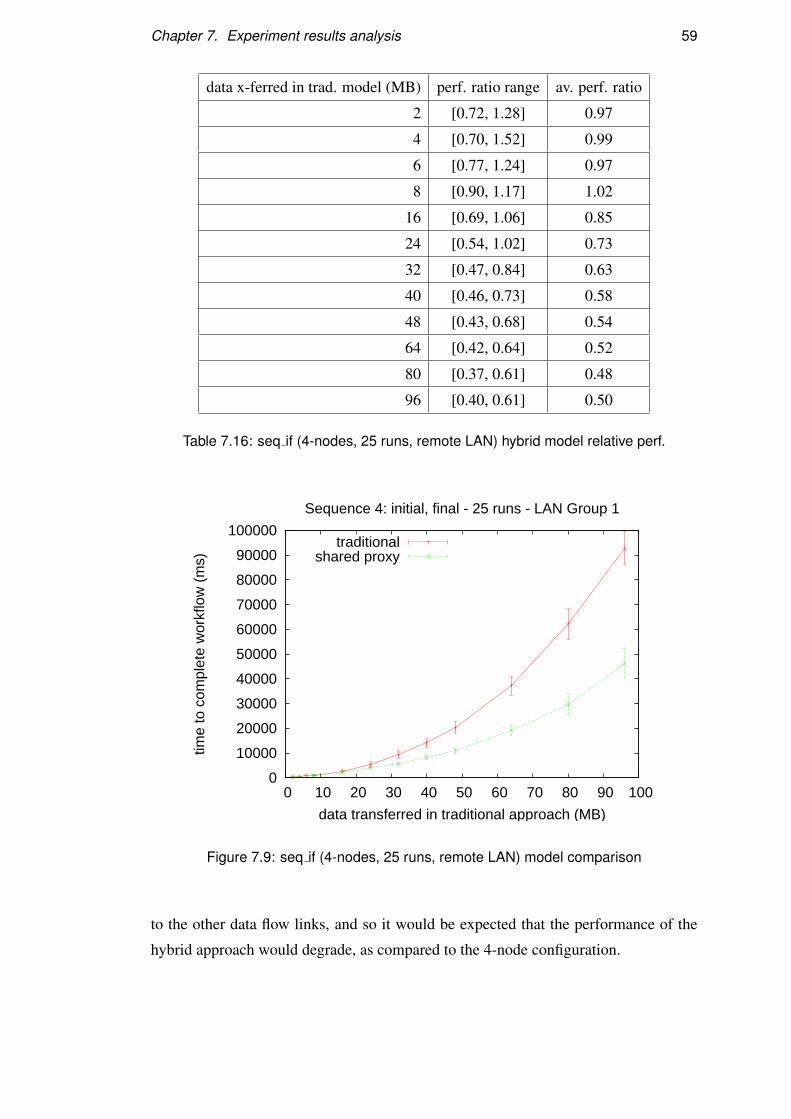
Chapter 7. Experiment results analysis 59
data x-ferred in trad. model (MB) perf. ratio range av. perf. ratio
2 [0.72, 1.28] 0.97
4 [0.70, 1.52] 0.99
6 [0.77, 1.24] 0.97
8 [0.90, 1.17] 1.02
16 [0.69, 1.06] 0.85
24 [0.54, 1.02] 0.73
32 [0.47, 0.84] 0.63
40 [0.46, 0.73] 0.58
48 [0.43, 0.68] 0.54
64 [0.42, 0.64] 0.52
80 [0.37, 0.61] 0.48
96 [0.40, 0.61] 0.50
Table 7.16: seq if (4-nodes, 25 runs, remote LAN) hybrid model relative perf.
0
10000
20000
30000
40000
50000
60000
70000
80000
90000
100000
0 10 20 30 40 50 60 70 80 90 100
time
to c
ompl
ete
wor
kflo
w (
ms)
data transferred in traditional approach (MB)
Sequence 4: initial, final - 25 runs - LAN Group 1
traditionalshared proxy
Figure 7.9: seq if (4-nodes, 25 runs, remote LAN) model comparison
to the other data flow links, and so it would be expected that the performance of the
hybrid approach would degrade, as compared to the 4-node configuration.
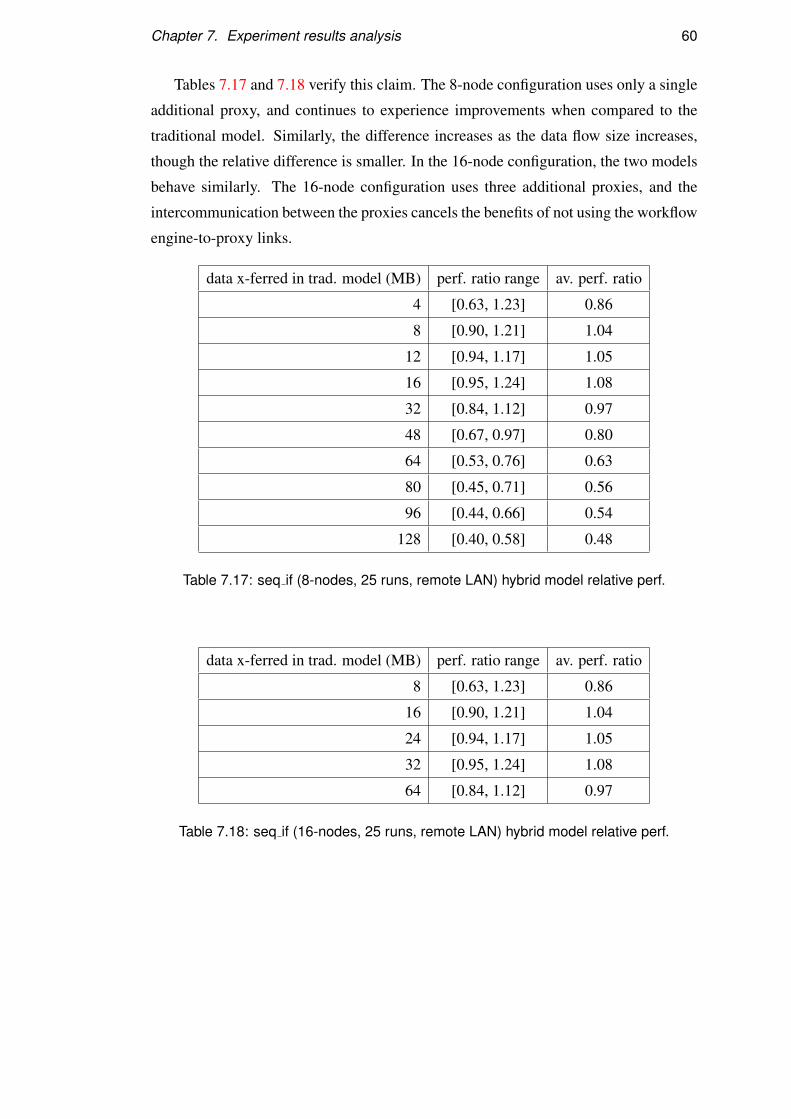
Chapter 7. Experiment results analysis 60
Tables 7.17 and 7.18 verify this claim. The 8-node configuration uses only a single
additional proxy, and continues to experience improvements when compared to the
traditional model. Similarly, the difference increases as the data flow size increases,
though the relative difference is smaller. In the 16-node configuration, the two models
behave similarly. The 16-node configuration uses three additional proxies, and the
intercommunication between the proxies cancels the benefits of not using the workflow
engine-to-proxy links.
data x-ferred in trad. model (MB) perf. ratio range av. perf. ratio
4 [0.63, 1.23] 0.86
8 [0.90, 1.21] 1.04
12 [0.94, 1.17] 1.05
16 [0.95, 1.24] 1.08
32 [0.84, 1.12] 0.97
48 [0.67, 0.97] 0.80
64 [0.53, 0.76] 0.63
80 [0.45, 0.71] 0.56
96 [0.44, 0.66] 0.54
128 [0.40, 0.58] 0.48
Table 7.17: seq if (8-nodes, 25 runs, remote LAN) hybrid model relative perf.
data x-ferred in trad. model (MB) perf. ratio range av. perf. ratio
8 [0.63, 1.23] 0.86
16 [0.90, 1.21] 1.04
24 [0.94, 1.17] 1.05
32 [0.95, 1.24] 1.08
64 [0.84, 1.12] 0.97
Table 7.18: seq if (16-nodes, 25 runs, remote LAN) hybrid model relative perf.
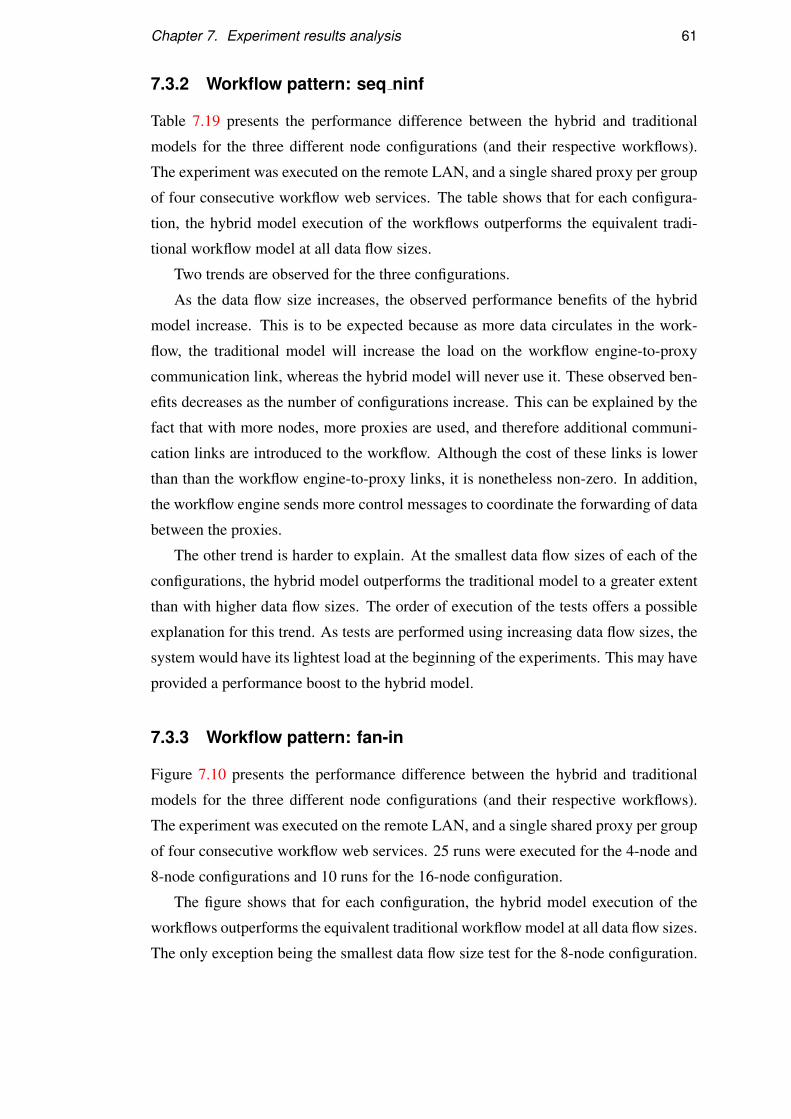
Chapter 7. Experiment results analysis 61
7.3.2 Workflow pattern: seq ninf
Table 7.19 presents the performance difference between the hybrid and traditional
models for the three different node configurations (and their respective workflows).
The experiment was executed on the remote LAN, and a single shared proxy per group
of four consecutive workflow web services. The table shows that for each configura-
tion, the hybrid model execution of the workflows outperforms the equivalent tradi-
tional workflow model at all data flow sizes.
Two trends are observed for the three configurations.
As the data flow size increases, the observed performance benefits of the hybrid
model increase. This is to be expected because as more data circulates in the work-
flow, the traditional model will increase the load on the workflow engine-to-proxy
communication link, whereas the hybrid model will never use it. These observed ben-
efits decreases as the number of configurations increase. This can be explained by the
fact that with more nodes, more proxies are used, and therefore additional communi-
cation links are introduced to the workflow. Although the cost of these links is lower
than than the workflow engine-to-proxy links, it is nonetheless non-zero. In addition,
the workflow engine sends more control messages to coordinate the forwarding of data
between the proxies.
The other trend is harder to explain. At the smallest data flow sizes of each of the
configurations, the hybrid model outperforms the traditional model to a greater extent
than with higher data flow sizes. The order of execution of the tests offers a possible
explanation for this trend. As tests are performed using increasing data flow sizes, the
system would have its lightest load at the beginning of the experiments. This may have
provided a performance boost to the hybrid model.
7.3.3 Workflow pattern: fan-in
Figure 7.10 presents the performance difference between the hybrid and traditional
models for the three different node configurations (and their respective workflows).
The experiment was executed on the remote LAN, and a single shared proxy per group
of four consecutive workflow web services. 25 runs were executed for the 4-node and
8-node configurations and 10 runs for the 16-node configuration.
The figure shows that for each configuration, the hybrid model execution of the
workflows outperforms the equivalent traditional workflow model at all data flow sizes.
The only exception being the smallest data flow size test for the 8-node configuration.
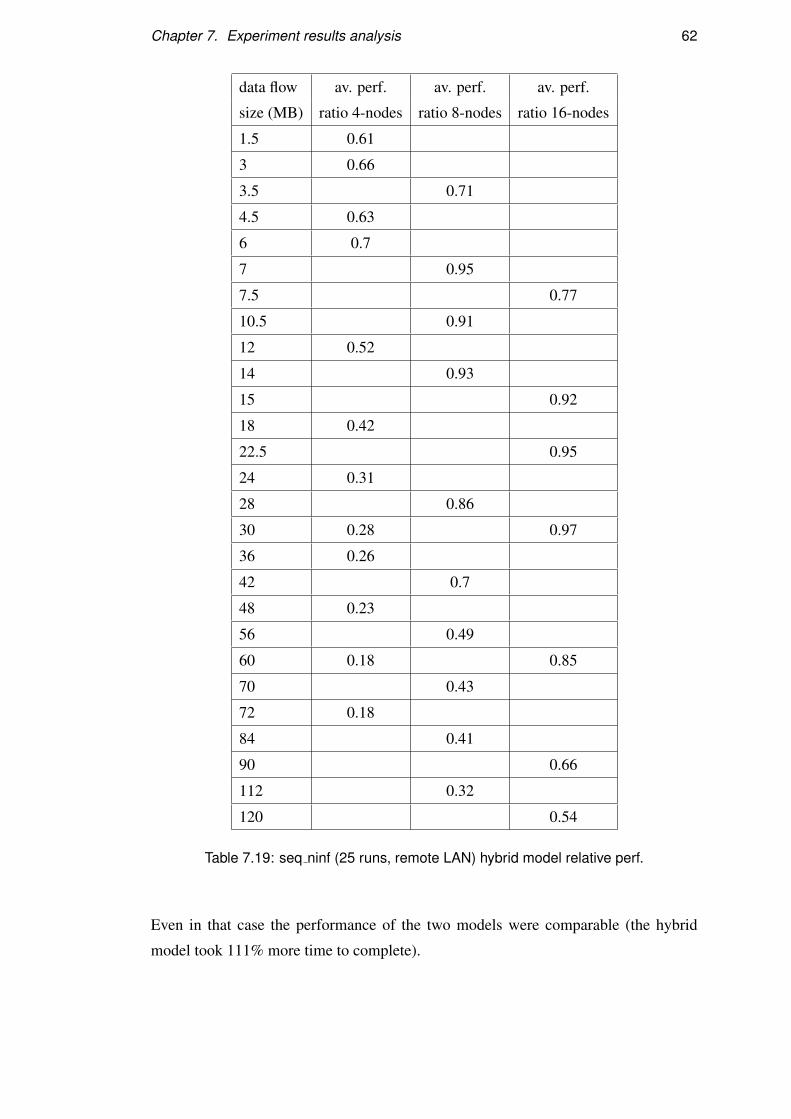
Chapter 7. Experiment results analysis 62
data flow av. perf. av. perf. av. perf.
size (MB) ratio 4-nodes ratio 8-nodes ratio 16-nodes
1.5 0.61
3 0.66
3.5 0.71
4.5 0.63
6 0.7
7 0.95
7.5 0.77
10.5 0.91
12 0.52
14 0.93
15 0.92
18 0.42
22.5 0.95
24 0.31
28 0.86
30 0.28 0.97
36 0.26
42 0.7
48 0.23
56 0.49
60 0.18 0.85
70 0.43
72 0.18
84 0.41
90 0.66
112 0.32
120 0.54
Table 7.19: seq ninf (25 runs, remote LAN) hybrid model relative perf.
Even in that case the performance of the two models were comparable (the hybrid
model took 111% more time to complete).
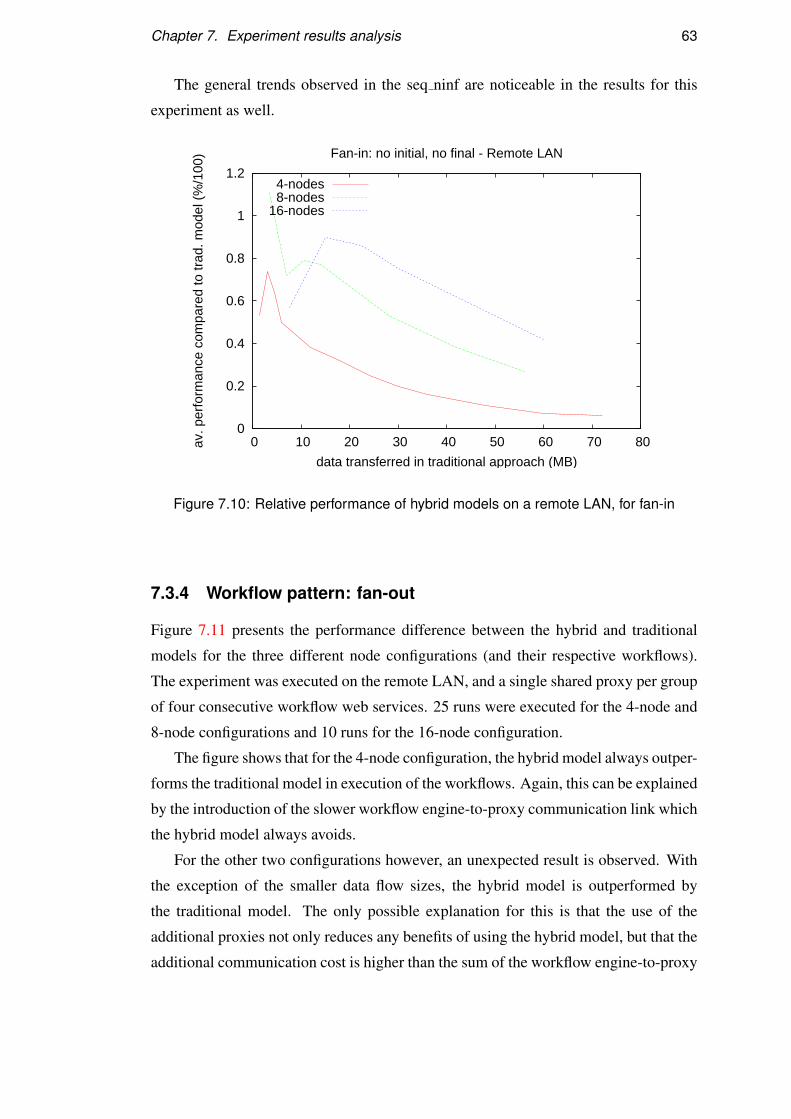
Chapter 7. Experiment results analysis 63
The general trends observed in the seq ninf are noticeable in the results for this
experiment as well.
0
0.2
0.4
0.6
0.8
1
1.2
0 10 20 30 40 50 60 70 80av. p
erfo
rman
ce c
ompa
red
to tr
ad. m
odel
(%
/100
)
data transferred in traditional approach (MB)
Fan-in: no initial, no final - Remote LAN
4-nodes8-nodes
16-nodes
Figure 7.10: Relative performance of hybrid models on a remote LAN, for fan-in
7.3.4 Workflow pattern: fan-out
Figure 7.11 presents the performance difference between the hybrid and traditional
models for the three different node configurations (and their respective workflows).
The experiment was executed on the remote LAN, and a single shared proxy per group
of four consecutive workflow web services. 25 runs were executed for the 4-node and
8-node configurations and 10 runs for the 16-node configuration.
The figure shows that for the 4-node configuration, the hybrid model always outper-
forms the traditional model in execution of the workflows. Again, this can be explained
by the introduction of the slower workflow engine-to-proxy communication link which
the hybrid model always avoids.
For the other two configurations however, an unexpected result is observed. With
the exception of the smaller data flow sizes, the hybrid model is outperformed by
the traditional model. The only possible explanation for this is that the use of the
additional proxies not only reduces any benefits of using the hybrid model, but that the
additional communication cost is higher than the sum of the workflow engine-to-proxy
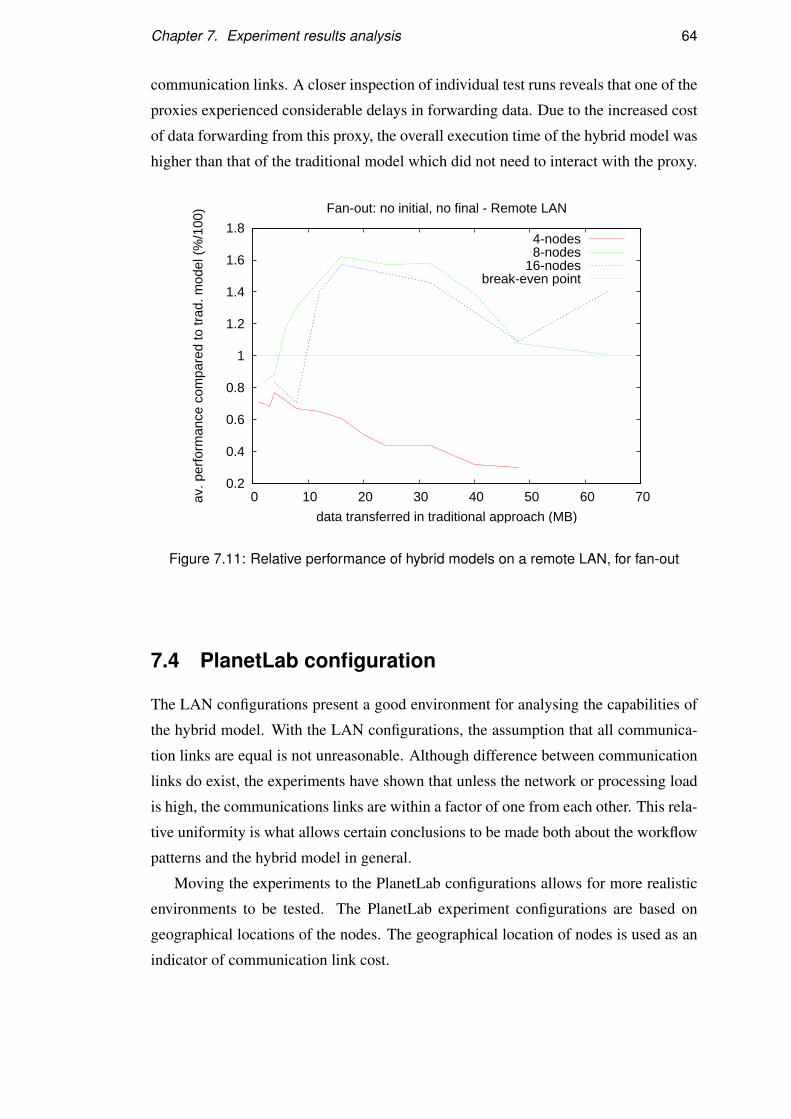
Chapter 7. Experiment results analysis 64
communication links. A closer inspection of individual test runs reveals that one of the
proxies experienced considerable delays in forwarding data. Due to the increased cost
of data forwarding from this proxy, the overall execution time of the hybrid model was
higher than that of the traditional model which did not need to interact with the proxy.
0.2
0.4
0.6
0.8
1
1.2
1.4
1.6
1.8
0 10 20 30 40 50 60 70av. p
erfo
rman
ce c
ompa
red
to tr
ad. m
odel
(%
/100
)
data transferred in traditional approach (MB)
Fan-out: no initial, no final - Remote LAN
4-nodes8-nodes
16-nodesbreak-even point
Figure 7.11: Relative performance of hybrid models on a remote LAN, for fan-out
7.4 PlanetLab configuration
The LAN configurations present a good environment for analysing the capabilities of
the hybrid model. With the LAN configurations, the assumption that all communica-
tion links are equal is not unreasonable. Although difference between communication
links do exist, the experiments have shown that unless the network or processing load
is high, the communications links are within a factor of one from each other. This rela-
tive uniformity is what allows certain conclusions to be made both about the workflow
patterns and the hybrid model in general.
Moving the experiments to the PlanetLab configurations allows for more realistic
environments to be tested. The PlanetLab experiment configurations are based on
geographical locations of the nodes. The geographical location of nodes is used as an
indicator of communication link cost.
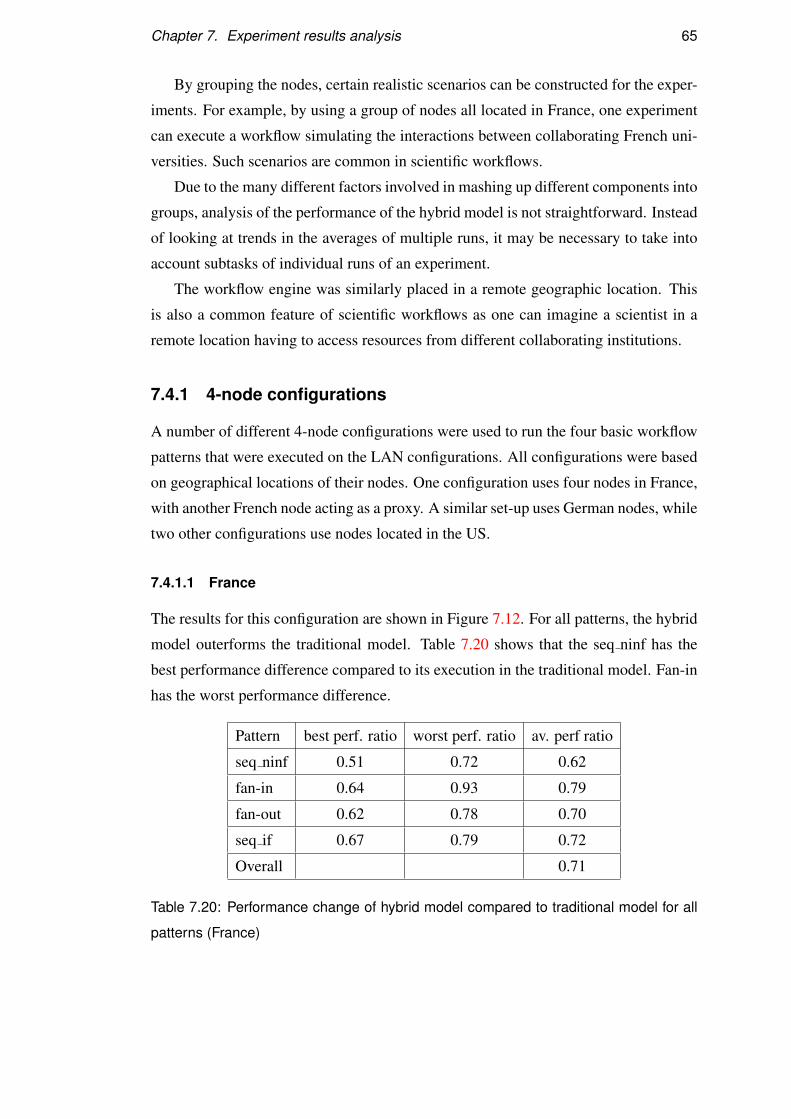
Chapter 7. Experiment results analysis 65
By grouping the nodes, certain realistic scenarios can be constructed for the exper-
iments. For example, by using a group of nodes all located in France, one experiment
can execute a workflow simulating the interactions between collaborating French uni-
versities. Such scenarios are common in scientific workflows.
Due to the many different factors involved in mashing up different components into
groups, analysis of the performance of the hybrid model is not straightforward. Instead
of looking at trends in the averages of multiple runs, it may be necessary to take into
account subtasks of individual runs of an experiment.
The workflow engine was similarly placed in a remote geographic location. This
is also a common feature of scientific workflows as one can imagine a scientist in a
remote location having to access resources from different collaborating institutions.
7.4.1 4-node configurations
A number of different 4-node configurations were used to run the four basic workflow
patterns that were executed on the LAN configurations. All configurations were based
on geographical locations of their nodes. One configuration uses four nodes in France,
with another French node acting as a proxy. A similar set-up uses German nodes, while
two other configurations use nodes located in the US.
7.4.1.1 France
The results for this configuration are shown in Figure 7.12. For all patterns, the hybrid
model outerforms the traditional model. Table 7.20 shows that the seq ninf has the
best performance difference compared to its execution in the traditional model. Fan-in
has the worst performance difference.
Pattern best perf. ratio worst perf. ratio av. perf ratio
seq ninf 0.51 0.72 0.62
fan-in 0.64 0.93 0.79
fan-out 0.62 0.78 0.70
seq if 0.67 0.79 0.72
Overall 0.71
Table 7.20: Performance change of hybrid model compared to traditional model for all
patterns (France)
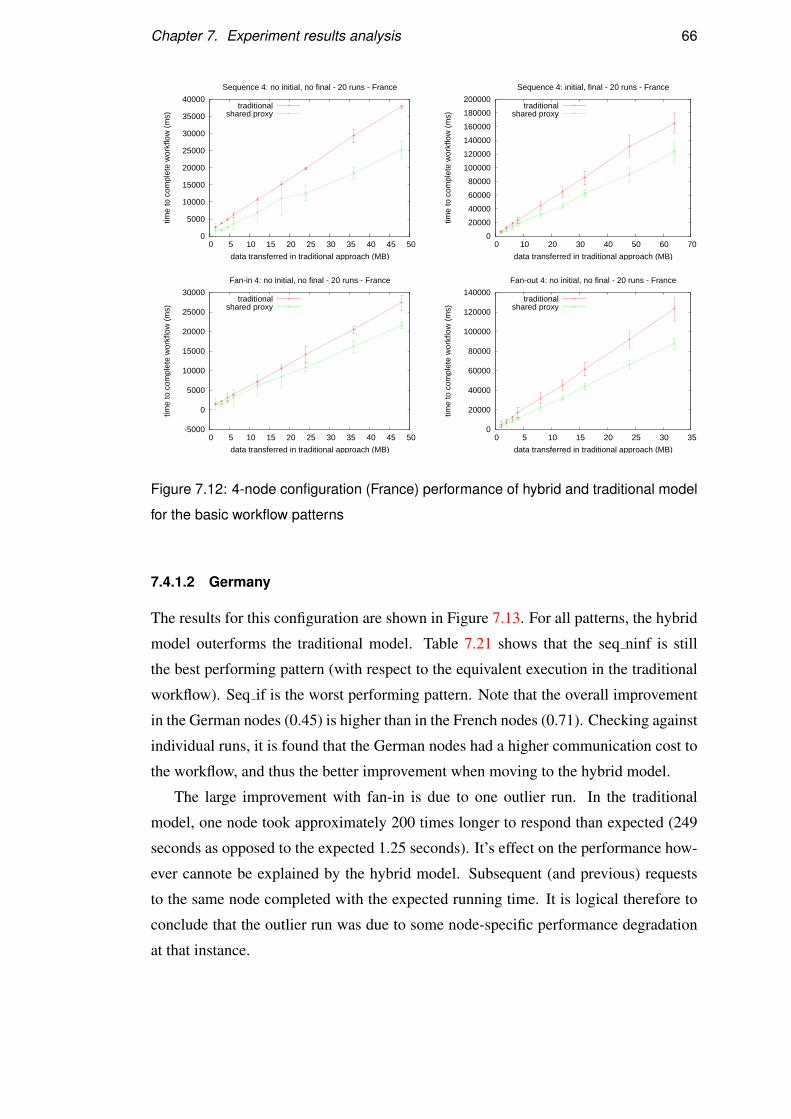
Chapter 7. Experiment results analysis 66
0
5000
10000
15000
20000
25000
30000
35000
40000
0 5 10 15 20 25 30 35 40 45 50
time
to c
ompl
ete
wor
kflo
w (
ms)
data transferred in traditional approach (MB)
Sequence 4: no initial, no final - 20 runs - France
traditionalshared proxy
0
20000
40000
60000
80000
100000
120000
140000
160000
180000
200000
0 10 20 30 40 50 60 70
time
to c
ompl
ete
wor
kflo
w (
ms)
data transferred in traditional approach (MB)
Sequence 4: initial, final - 20 runs - France
traditionalshared proxy
-5000
0
5000
10000
15000
20000
25000
30000
0 5 10 15 20 25 30 35 40 45 50
time
to c
ompl
ete
wor
kflo
w (
ms)
data transferred in traditional approach (MB)
Fan-in 4: no initial, no final - 20 runs - France
traditionalshared proxy
0
20000
40000
60000
80000
100000
120000
140000
0 5 10 15 20 25 30 35tim
e to
com
plet
e w
orkf
low
(m
s)data transferred in traditional approach (MB)
Fan-out 4: no initial, no final - 20 runs - France
traditionalshared proxy
Figure 7.12: 4-node configuration (France) performance of hybrid and traditional model
for the basic workflow patterns
7.4.1.2 Germany
The results for this configuration are shown in Figure 7.13. For all patterns, the hybrid
model outerforms the traditional model. Table 7.21 shows that the seq ninf is still
the best performing pattern (with respect to the equivalent execution in the traditional
workflow). Seq if is the worst performing pattern. Note that the overall improvement
in the German nodes (0.45) is higher than in the French nodes (0.71). Checking against
individual runs, it is found that the German nodes had a higher communication cost to
the workflow, and thus the better improvement when moving to the hybrid model.
The large improvement with fan-in is due to one outlier run. In the traditional
model, one node took approximately 200 times longer to respond than expected (249
seconds as opposed to the expected 1.25 seconds). It’s effect on the performance how-
ever cannote be explained by the hybrid model. Subsequent (and previous) requests
to the same node completed with the expected running time. It is logical therefore to
conclude that the outlier run was due to some node-specific performance degradation
at that instance.
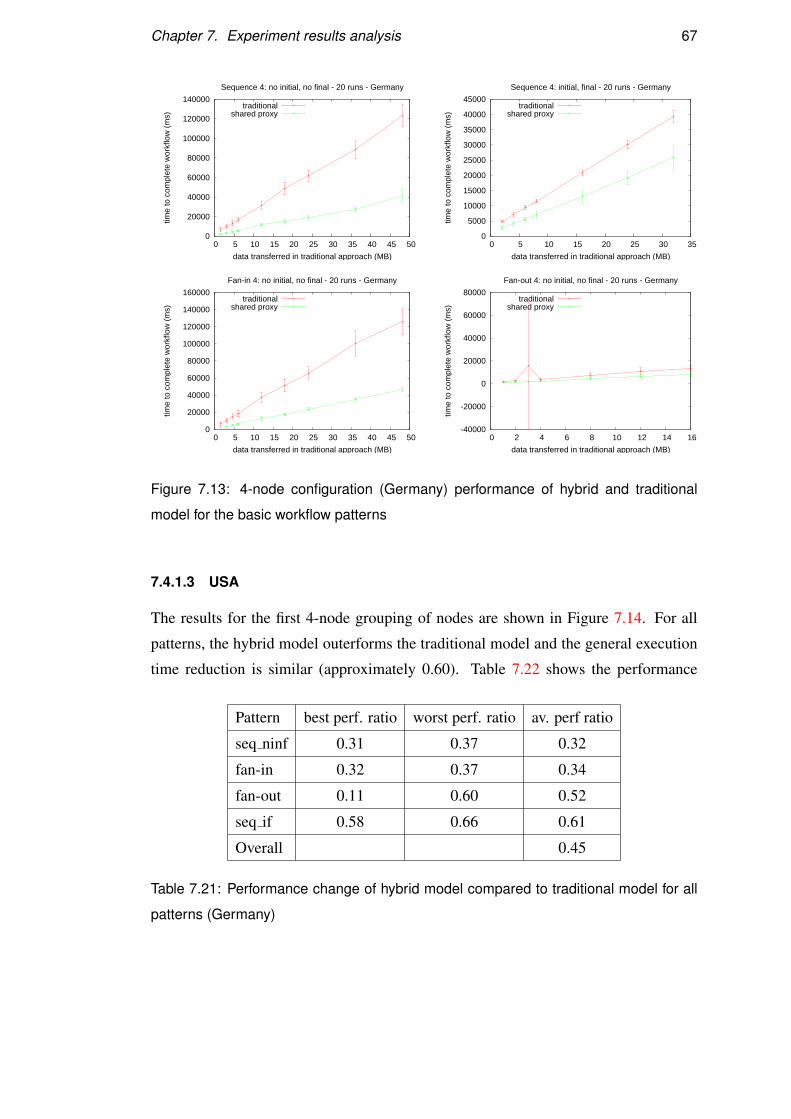
Chapter 7. Experiment results analysis 67
0
20000
40000
60000
80000
100000
120000
140000
0 5 10 15 20 25 30 35 40 45 50
time
to c
ompl
ete
wor
kflo
w (
ms)
data transferred in traditional approach (MB)
Sequence 4: no initial, no final - 20 runs - Germany
traditionalshared proxy
0
5000
10000
15000
20000
25000
30000
35000
40000
45000
0 5 10 15 20 25 30 35
time
to c
ompl
ete
wor
kflo
w (
ms)
data transferred in traditional approach (MB)
Sequence 4: initial, final - 20 runs - Germany
traditionalshared proxy
0
20000
40000
60000
80000
100000
120000
140000
160000
0 5 10 15 20 25 30 35 40 45 50
time
to c
ompl
ete
wor
kflo
w (
ms)
data transferred in traditional approach (MB)
Fan-in 4: no initial, no final - 20 runs - Germany
traditionalshared proxy
-40000
-20000
0
20000
40000
60000
80000
0 2 4 6 8 10 12 14 16tim
e to
com
plet
e w
orkf
low
(m
s)data transferred in traditional approach (MB)
Fan-out 4: no initial, no final - 20 runs - Germany
traditionalshared proxy
Figure 7.13: 4-node configuration (Germany) performance of hybrid and traditional
model for the basic workflow patterns
7.4.1.3 USA
The results for the first 4-node grouping of nodes are shown in Figure 7.14. For all
patterns, the hybrid model outerforms the traditional model and the general execution
time reduction is similar (approximately 0.60). Table 7.22 shows the performance
Pattern best perf. ratio worst perf. ratio av. perf ratio
seq ninf 0.31 0.37 0.32
fan-in 0.32 0.37 0.34
fan-out 0.11 0.60 0.52
seq if 0.58 0.66 0.61
Overall 0.45
Table 7.21: Performance change of hybrid model compared to traditional model for all
patterns (Germany)
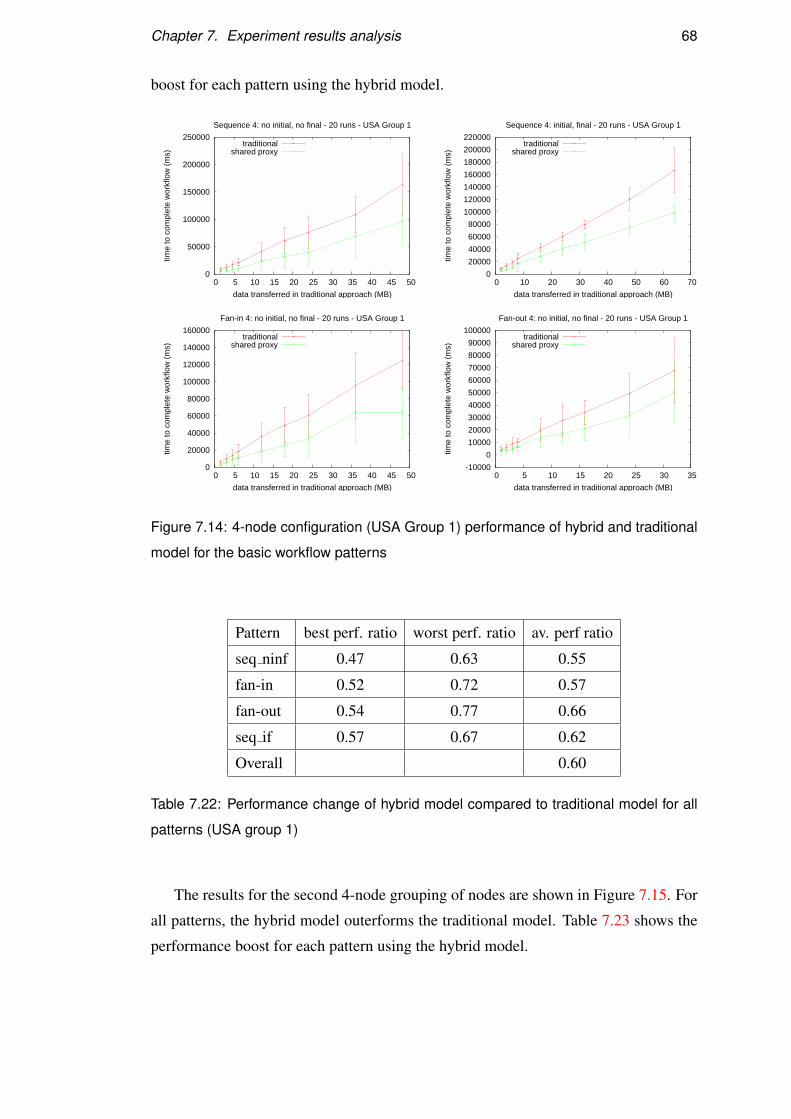
Chapter 7. Experiment results analysis 68
boost for each pattern using the hybrid model.
0
50000
100000
150000
200000
250000
0 5 10 15 20 25 30 35 40 45 50
time
to c
ompl
ete
wor
kflo
w (
ms)
data transferred in traditional approach (MB)
Sequence 4: no initial, no final - 20 runs - USA Group 1
traditionalshared proxy
0
20000
40000
60000
80000
100000
120000
140000
160000
180000
200000
220000
0 10 20 30 40 50 60 70
time
to c
ompl
ete
wor
kflo
w (
ms)
data transferred in traditional approach (MB)
Sequence 4: initial, final - 20 runs - USA Group 1
traditionalshared proxy
0
20000
40000
60000
80000
100000
120000
140000
160000
0 5 10 15 20 25 30 35 40 45 50
time
to c
ompl
ete
wor
kflo
w (
ms)
data transferred in traditional approach (MB)
Fan-in 4: no initial, no final - 20 runs - USA Group 1
traditionalshared proxy
-10000
0
10000
20000
30000
40000
50000
60000
70000
80000
90000
100000
0 5 10 15 20 25 30 35
time
to c
ompl
ete
wor
kflo
w (
ms)
data transferred in traditional approach (MB)
Fan-out 4: no initial, no final - 20 runs - USA Group 1
traditionalshared proxy
Figure 7.14: 4-node configuration (USA Group 1) performance of hybrid and traditional
model for the basic workflow patterns
Pattern best perf. ratio worst perf. ratio av. perf ratio
seq ninf 0.47 0.63 0.55
fan-in 0.52 0.72 0.57
fan-out 0.54 0.77 0.66
seq if 0.57 0.67 0.62
Overall 0.60
Table 7.22: Performance change of hybrid model compared to traditional model for all
patterns (USA group 1)
The results for the second 4-node grouping of nodes are shown in Figure 7.15. For
all patterns, the hybrid model outerforms the traditional model. Table 7.23 shows the
performance boost for each pattern using the hybrid model.
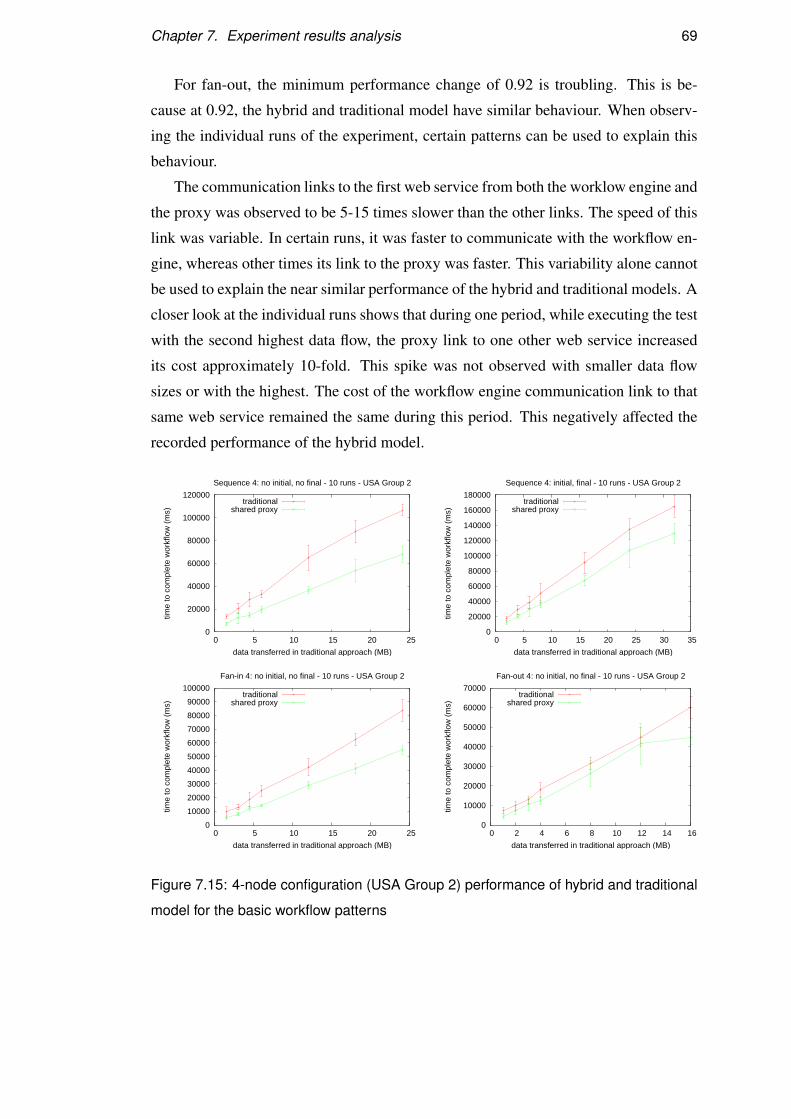
Chapter 7. Experiment results analysis 69
For fan-out, the minimum performance change of 0.92 is troubling. This is be-
cause at 0.92, the hybrid and traditional model have similar behaviour. When observ-
ing the individual runs of the experiment, certain patterns can be used to explain this
behaviour.
The communication links to the first web service from both the worklow engine and
the proxy was observed to be 5-15 times slower than the other links. The speed of this
link was variable. In certain runs, it was faster to communicate with the workflow en-
gine, whereas other times its link to the proxy was faster. This variability alone cannot
be used to explain the near similar performance of the hybrid and traditional models. A
closer look at the individual runs shows that during one period, while executing the test
with the second highest data flow, the proxy link to one other web service increased
its cost approximately 10-fold. This spike was not observed with smaller data flow
sizes or with the highest. The cost of the workflow engine communication link to that
same web service remained the same during this period. This negatively affected the
recorded performance of the hybrid model.
0
20000
40000
60000
80000
100000
120000
0 5 10 15 20 25
time
to c
ompl
ete
wor
kflo
w (
ms)
data transferred in traditional approach (MB)
Sequence 4: no initial, no final - 10 runs - USA Group 2
traditionalshared proxy
0
20000
40000
60000
80000
100000
120000
140000
160000
180000
0 5 10 15 20 25 30 35
time
to c
ompl
ete
wor
kflo
w (
ms)
data transferred in traditional approach (MB)
Sequence 4: initial, final - 10 runs - USA Group 2
traditionalshared proxy
0
10000
20000
30000
40000
50000
60000
70000
80000
90000
100000
0 5 10 15 20 25
time
to c
ompl
ete
wor
kflo
w (
ms)
data transferred in traditional approach (MB)
Fan-in 4: no initial, no final - 10 runs - USA Group 2
traditionalshared proxy
0
10000
20000
30000
40000
50000
60000
70000
0 2 4 6 8 10 12 14 16
time
to c
ompl
ete
wor
kflo
w (
ms)
data transferred in traditional approach (MB)
Fan-out 4: no initial, no final - 10 runs - USA Group 2
traditionalshared proxy
Figure 7.15: 4-node configuration (USA Group 2) performance of hybrid and traditional
model for the basic workflow patterns
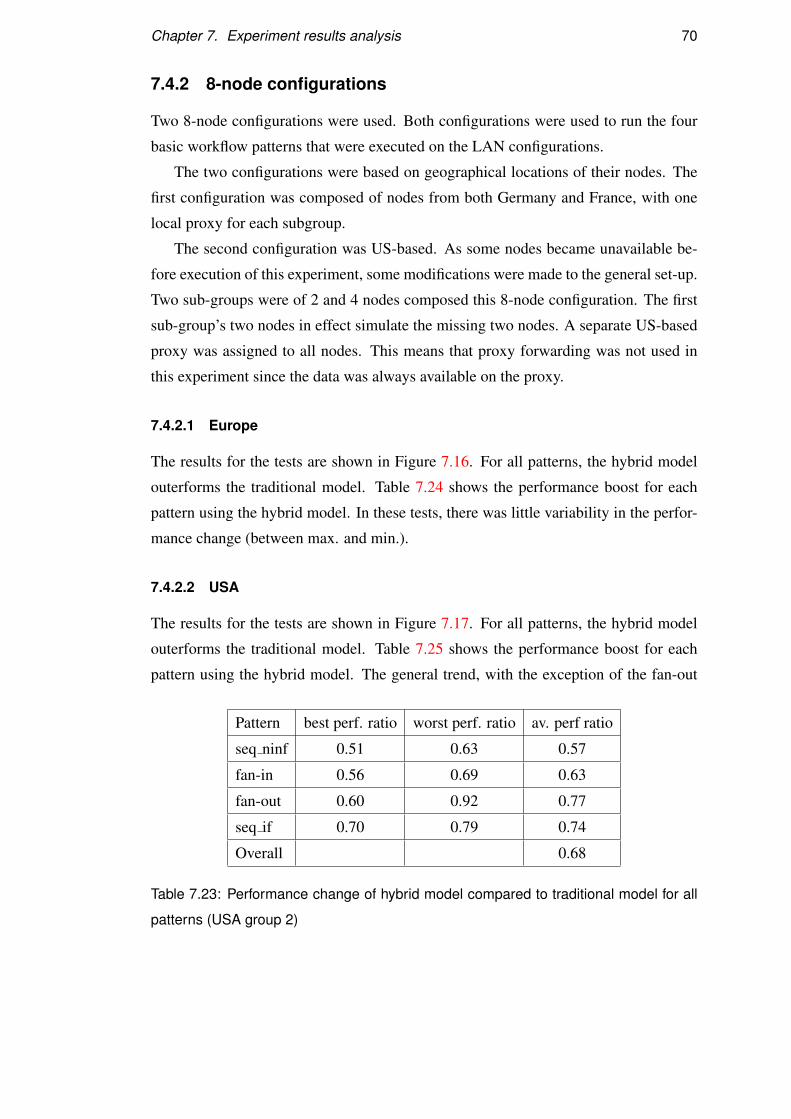
Chapter 7. Experiment results analysis 70
7.4.2 8-node configurations
Two 8-node configurations were used. Both configurations were used to run the four
basic workflow patterns that were executed on the LAN configurations.
The two configurations were based on geographical locations of their nodes. The
first configuration was composed of nodes from both Germany and France, with one
local proxy for each subgroup.
The second configuration was US-based. As some nodes became unavailable be-
fore execution of this experiment, some modifications were made to the general set-up.
Two sub-groups were of 2 and 4 nodes composed this 8-node configuration. The first
sub-group’s two nodes in effect simulate the missing two nodes. A separate US-based
proxy was assigned to all nodes. This means that proxy forwarding was not used in
this experiment since the data was always available on the proxy.
7.4.2.1 Europe
The results for the tests are shown in Figure 7.16. For all patterns, the hybrid model
outerforms the traditional model. Table 7.24 shows the performance boost for each
pattern using the hybrid model. In these tests, there was little variability in the perfor-
mance change (between max. and min.).
7.4.2.2 USA
The results for the tests are shown in Figure 7.17. For all patterns, the hybrid model
outerforms the traditional model. Table 7.25 shows the performance boost for each
pattern using the hybrid model. The general trend, with the exception of the fan-out
Pattern best perf. ratio worst perf. ratio av. perf ratio
seq ninf 0.51 0.63 0.57
fan-in 0.56 0.69 0.63
fan-out 0.60 0.92 0.77
seq if 0.70 0.79 0.74
Overall 0.68
Table 7.23: Performance change of hybrid model compared to traditional model for all
patterns (USA group 2)
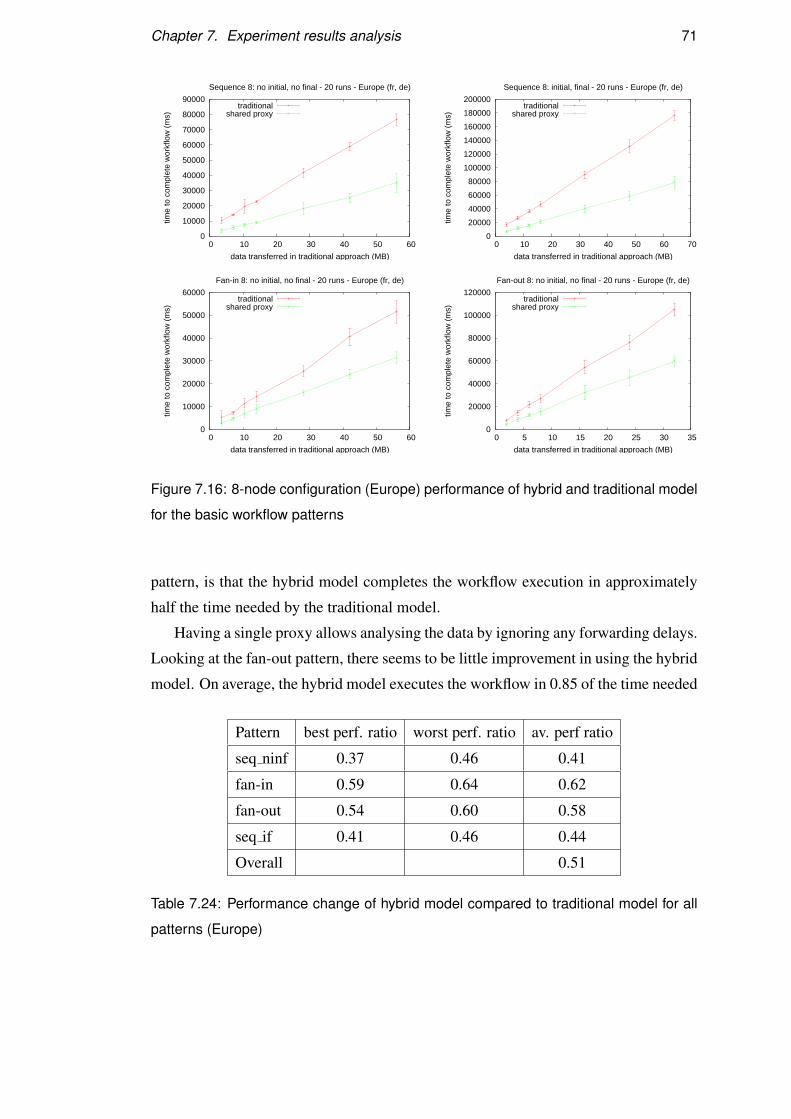
Chapter 7. Experiment results analysis 71
0
10000
20000
30000
40000
50000
60000
70000
80000
90000
0 10 20 30 40 50 60
time
to c
ompl
ete
wor
kflo
w (
ms)
data transferred in traditional approach (MB)
Sequence 8: no initial, no final - 20 runs - Europe (fr, de)
traditionalshared proxy
0
20000
40000
60000
80000
100000
120000
140000
160000
180000
200000
0 10 20 30 40 50 60 70
time
to c
ompl
ete
wor
kflo
w (
ms)
data transferred in traditional approach (MB)
Sequence 8: initial, final - 20 runs - Europe (fr, de)
traditionalshared proxy
0
10000
20000
30000
40000
50000
60000
0 10 20 30 40 50 60
time
to c
ompl
ete
wor
kflo
w (
ms)
data transferred in traditional approach (MB)
Fan-in 8: no initial, no final - 20 runs - Europe (fr, de)
traditionalshared proxy
0
20000
40000
60000
80000
100000
120000
0 5 10 15 20 25 30 35tim
e to
com
plet
e w
orkf
low
(m
s)data transferred in traditional approach (MB)
Fan-out 8: no initial, no final - 20 runs - Europe (fr, de)
traditionalshared proxy
Figure 7.16: 8-node configuration (Europe) performance of hybrid and traditional model
for the basic workflow patterns
pattern, is that the hybrid model completes the workflow execution in approximately
half the time needed by the traditional model.
Having a single proxy allows analysing the data by ignoring any forwarding delays.
Looking at the fan-out pattern, there seems to be little improvement in using the hybrid
model. On average, the hybrid model executes the workflow in 0.85 of the time needed
Pattern best perf. ratio worst perf. ratio av. perf ratio
seq ninf 0.37 0.46 0.41
fan-in 0.59 0.64 0.62
fan-out 0.54 0.60 0.58
seq if 0.41 0.46 0.44
Overall 0.51
Table 7.24: Performance change of hybrid model compared to traditional model for all
patterns (Europe)
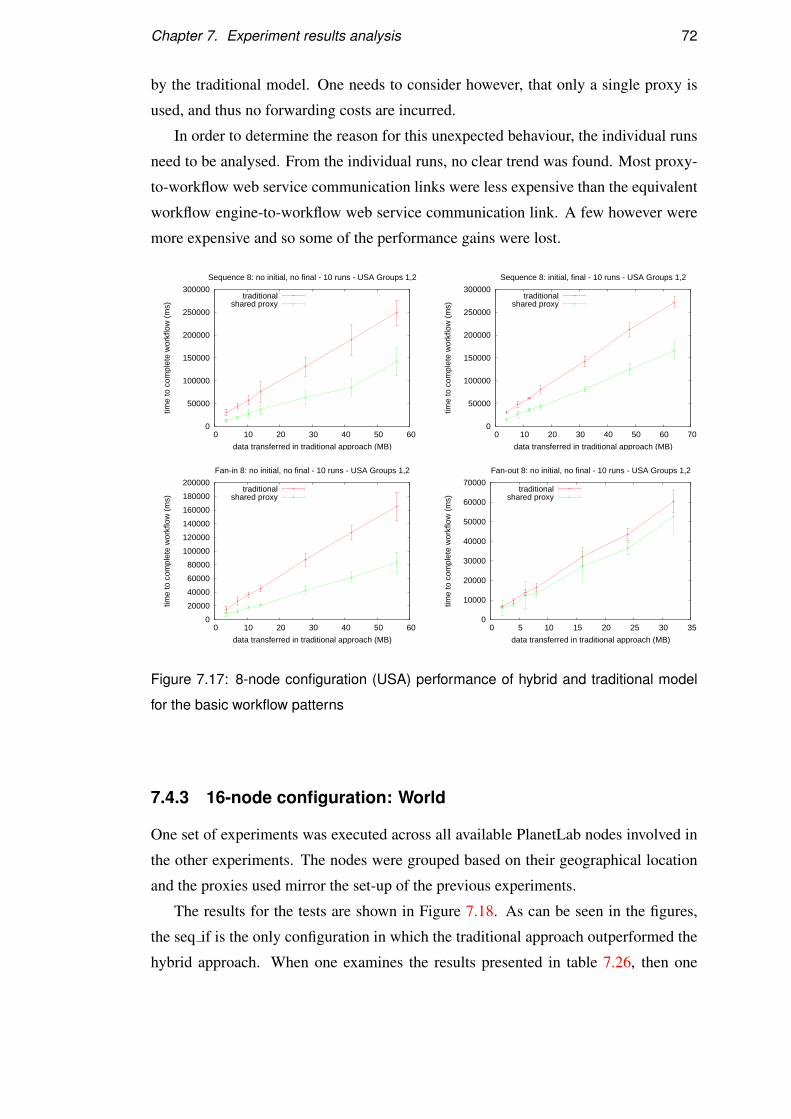
Chapter 7. Experiment results analysis 72
by the traditional model. One needs to consider however, that only a single proxy is
used, and thus no forwarding costs are incurred.
In order to determine the reason for this unexpected behaviour, the individual runs
need to be analysed. From the individual runs, no clear trend was found. Most proxy-
to-workflow web service communication links were less expensive than the equivalent
workflow engine-to-workflow web service communication link. A few however were
more expensive and so some of the performance gains were lost.
0
50000
100000
150000
200000
250000
300000
0 10 20 30 40 50 60
time
to c
ompl
ete
wor
kflo
w (
ms)
data transferred in traditional approach (MB)
Sequence 8: no initial, no final - 10 runs - USA Groups 1,2
traditionalshared proxy
0
50000
100000
150000
200000
250000
300000
0 10 20 30 40 50 60 70tim
e to
com
plet
e w
orkf
low
(m
s)data transferred in traditional approach (MB)
Sequence 8: initial, final - 10 runs - USA Groups 1,2
traditionalshared proxy
0
20000
40000
60000
80000
100000
120000
140000
160000
180000
200000
0 10 20 30 40 50 60
time
to c
ompl
ete
wor
kflo
w (
ms)
data transferred in traditional approach (MB)
Fan-in 8: no initial, no final - 10 runs - USA Groups 1,2
traditionalshared proxy
0
10000
20000
30000
40000
50000
60000
70000
0 5 10 15 20 25 30 35
time
to c
ompl
ete
wor
kflo
w (
ms)
data transferred in traditional approach (MB)
Fan-out 8: no initial, no final - 10 runs - USA Groups 1,2
traditionalshared proxy
Figure 7.17: 8-node configuration (USA) performance of hybrid and traditional model
for the basic workflow patterns
7.4.3 16-node configuration: World
One set of experiments was executed across all available PlanetLab nodes involved in
the other experiments. The nodes were grouped based on their geographical location
and the proxies used mirror the set-up of the previous experiments.
The results for the tests are shown in Figure 7.18. As can be seen in the figures,
the seq if is the only configuration in which the traditional approach outperformed the
hybrid approach. When one examines the results presented in table 7.26, then one
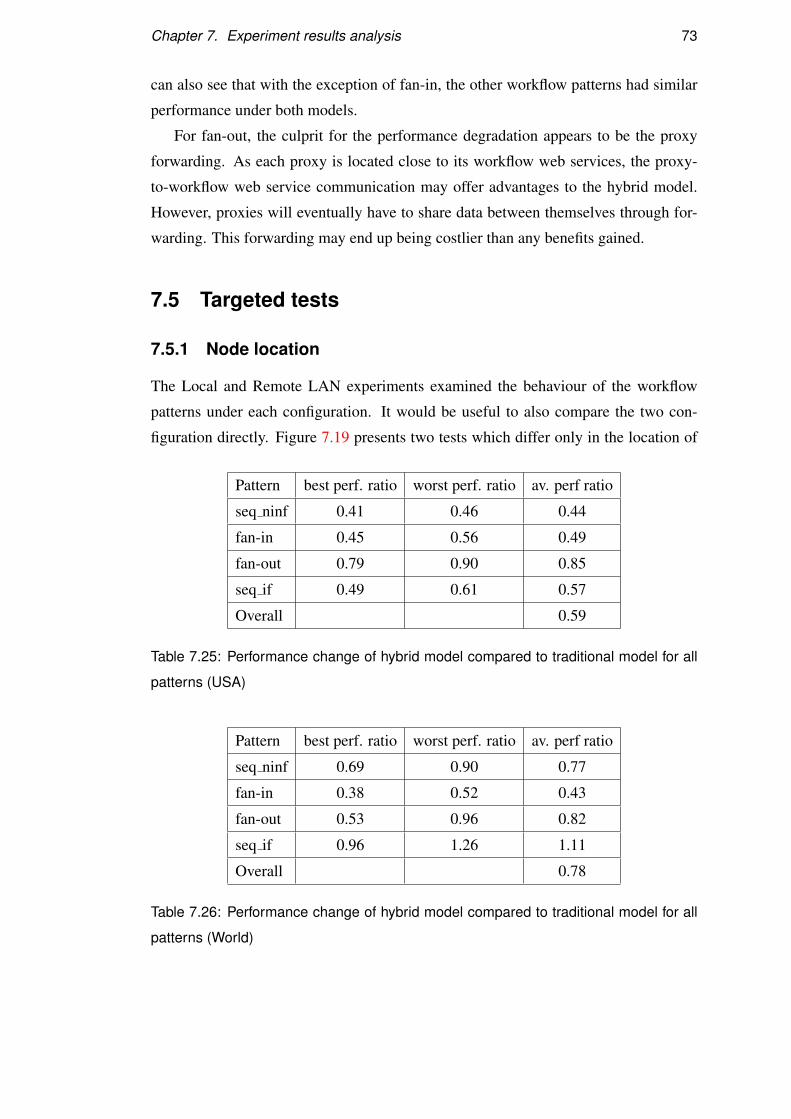
Chapter 7. Experiment results analysis 73
can also see that with the exception of fan-in, the other workflow patterns had similar
performance under both models.
For fan-out, the culprit for the performance degradation appears to be the proxy
forwarding. As each proxy is located close to its workflow web services, the proxy-
to-workflow web service communication may offer advantages to the hybrid model.
However, proxies will eventually have to share data between themselves through for-
warding. This forwarding may end up being costlier than any benefits gained.
7.5 Targeted tests
7.5.1 Node location
The Local and Remote LAN experiments examined the behaviour of the workflow
patterns under each configuration. It would be useful to also compare the two con-
figuration directly. Figure 7.19 presents two tests which differ only in the location of
Pattern best perf. ratio worst perf. ratio av. perf ratio
seq ninf 0.41 0.46 0.44
fan-in 0.45 0.56 0.49
fan-out 0.79 0.90 0.85
seq if 0.49 0.61 0.57
Overall 0.59
Table 7.25: Performance change of hybrid model compared to traditional model for all
patterns (USA)
Pattern best perf. ratio worst perf. ratio av. perf ratio
seq ninf 0.69 0.90 0.77
fan-in 0.38 0.52 0.43
fan-out 0.53 0.96 0.82
seq if 0.96 1.26 1.11
Overall 0.78
Table 7.26: Performance change of hybrid model compared to traditional model for all
patterns (World)
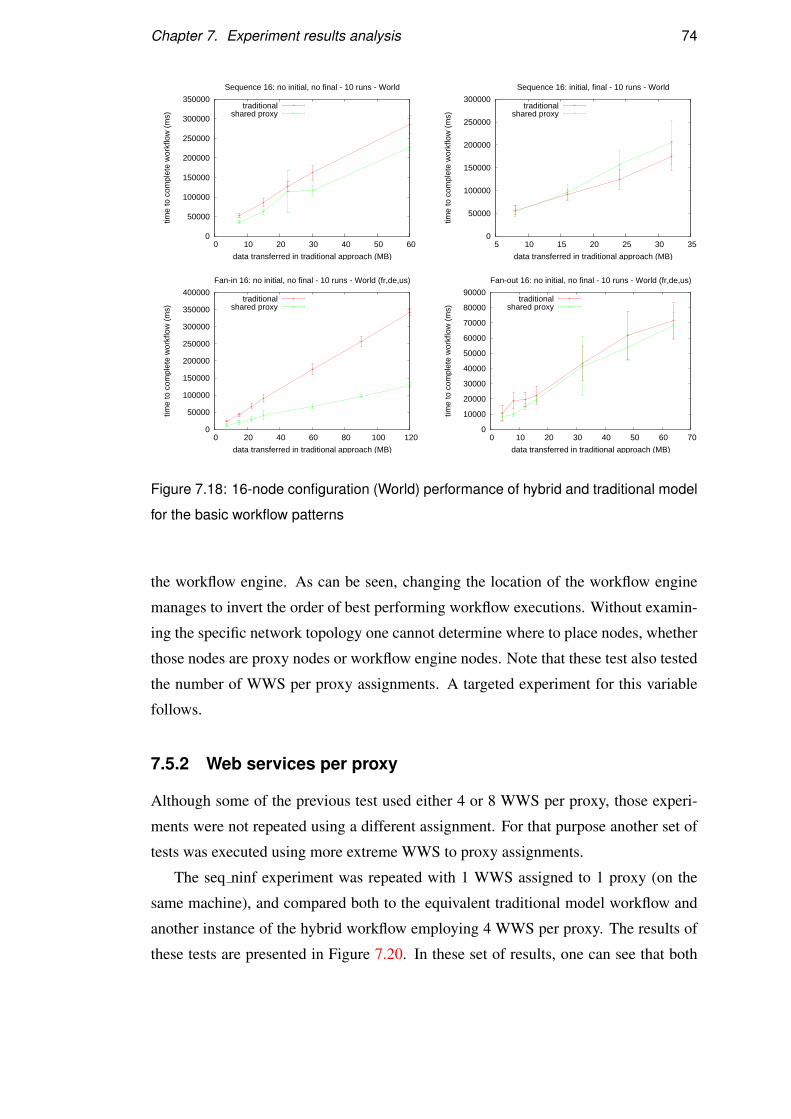
Chapter 7. Experiment results analysis 74
0
50000
100000
150000
200000
250000
300000
350000
0 10 20 30 40 50 60
time
to c
ompl
ete
wor
kflo
w (
ms)
data transferred in traditional approach (MB)
Sequence 16: no initial, no final - 10 runs - World
traditionalshared proxy
0
50000
100000
150000
200000
250000
300000
5 10 15 20 25 30 35
time
to c
ompl
ete
wor
kflo
w (
ms)
data transferred in traditional approach (MB)
Sequence 16: initial, final - 10 runs - World
traditionalshared proxy
0
50000
100000
150000
200000
250000
300000
350000
400000
0 20 40 60 80 100 120
time
to c
ompl
ete
wor
kflo
w (
ms)
data transferred in traditional approach (MB)
Fan-in 16: no initial, no final - 10 runs - World (fr,de,us)
traditionalshared proxy
0
10000
20000
30000
40000
50000
60000
70000
80000
90000
0 10 20 30 40 50 60 70tim
e to
com
plet
e w
orkf
low
(m
s)data transferred in traditional approach (MB)
Fan-out 16: no initial, no final - 10 runs - World (fr,de,us)
traditionalshared proxy
Figure 7.18: 16-node configuration (World) performance of hybrid and traditional model
for the basic workflow patterns
the workflow engine. As can be seen, changing the location of the workflow engine
manages to invert the order of best performing workflow executions. Without examin-
ing the specific network topology one cannot determine where to place nodes, whether
those nodes are proxy nodes or workflow engine nodes. Note that these test also tested
the number of WWS per proxy assignments. A targeted experiment for this variable
follows.
7.5.2 Web services per proxy
Although some of the previous test used either 4 or 8 WWS per proxy, those experi-
ments were not repeated using a different assignment. For that purpose another set of
tests was executed using more extreme WWS to proxy assignments.
The seq ninf experiment was repeated with 1 WWS assigned to 1 proxy (on the
same machine), and compared both to the equivalent traditional model workflow and
another instance of the hybrid workflow employing 4 WWS per proxy. The results of
these tests are presented in Figure 7.20. In these set of results, one can see that both
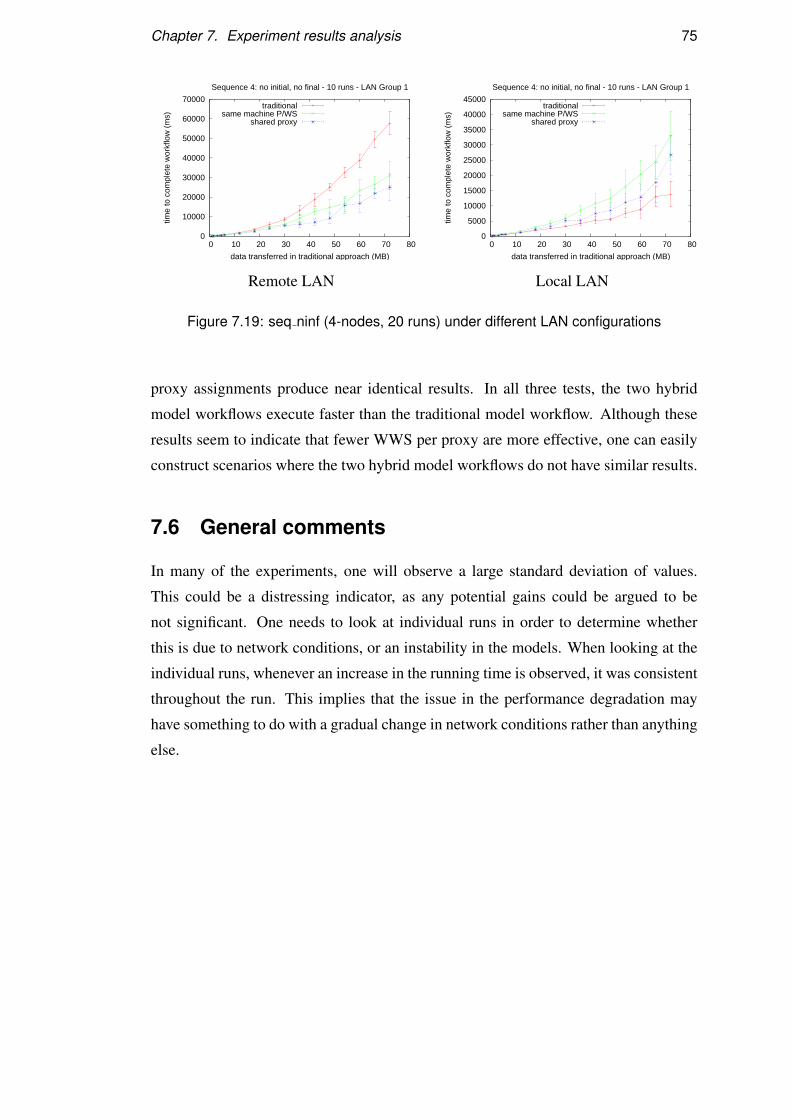
Chapter 7. Experiment results analysis 75
0
10000
20000
30000
40000
50000
60000
70000
0 10 20 30 40 50 60 70 80
time
to c
ompl
ete
wor
kflo
w (
ms)
data transferred in traditional approach (MB)
Sequence 4: no initial, no final - 10 runs - LAN Group 1
traditionalsame machine P/WS
shared proxy
0
5000
10000
15000
20000
25000
30000
35000
40000
45000
0 10 20 30 40 50 60 70 80
time
to c
ompl
ete
wor
kflo
w (
ms)
data transferred in traditional approach (MB)
Sequence 4: no initial, no final - 10 runs - LAN Group 1
traditionalsame machine P/WS
shared proxy
Remote LAN Local LAN
Figure 7.19: seq ninf (4-nodes, 20 runs) under different LAN configurations
proxy assignments produce near identical results. In all three tests, the two hybrid
model workflows execute faster than the traditional model workflow. Although these
results seem to indicate that fewer WWS per proxy are more effective, one can easily
construct scenarios where the two hybrid model workflows do not have similar results.
7.6 General comments
In many of the experiments, one will observe a large standard deviation of values.
This could be a distressing indicator, as any potential gains could be argued to be
not significant. One needs to look at individual runs in order to determine whether
this is due to network conditions, or an instability in the models. When looking at the
individual runs, whenever an increase in the running time is observed, it was consistent
throughout the run. This implies that the issue in the performance degradation may
have something to do with a gradual change in network conditions rather than anything
else.
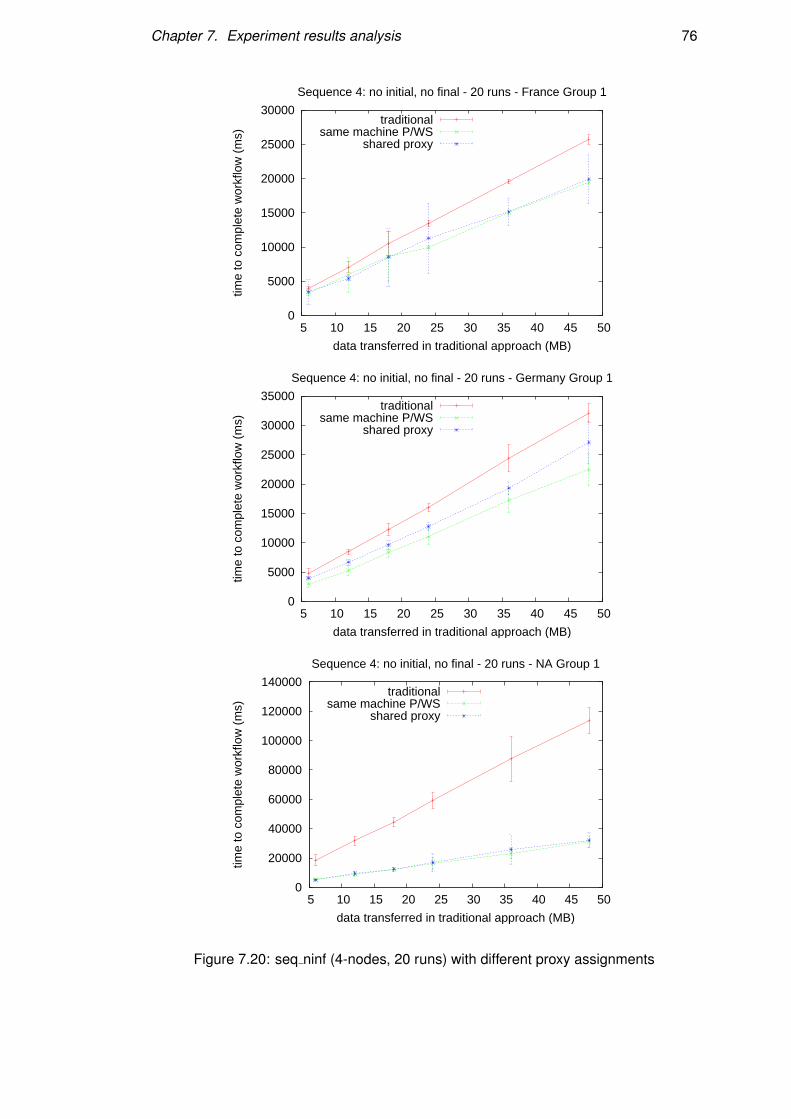
Chapter 7. Experiment results analysis 76
0
5000
10000
15000
20000
25000
30000
5 10 15 20 25 30 35 40 45 50
time
to c
ompl
ete
wor
kflo
w (
ms)
data transferred in traditional approach (MB)
Sequence 4: no initial, no final - 20 runs - France Group 1
traditionalsame machine P/WS
shared proxy
0
5000
10000
15000
20000
25000
30000
35000
5 10 15 20 25 30 35 40 45 50
time
to c
ompl
ete
wor
kflo
w (
ms)
data transferred in traditional approach (MB)
Sequence 4: no initial, no final - 20 runs - Germany Group 1
traditionalsame machine P/WS
shared proxy
0
20000
40000
60000
80000
100000
120000
140000
5 10 15 20 25 30 35 40 45 50
time
to c
ompl
ete
wor
kflo
w (
ms)
data transferred in traditional approach (MB)
Sequence 4: no initial, no final - 20 runs - NA Group 1
traditionalsame machine P/WS
shared proxy
Figure 7.20: seq ninf (4-nodes, 20 runs) with different proxy assignments
Chapter 8
Discussion
Would a statement concerning a potential performance vantage the hybrid model may
have over the traditional model be conclusive or elusive? Previous results [11] indicate
that beyond some message data size, the hybrid model outperforms the traditional
model. This chapter attempts to address this issue by identify the relevant results and
analyses produced by this project.
8.1 Conclusions
When one talks of whether or not the hybrid model has met its goals, it is important
to establish the constraints within which this is judged. For example, the local LAN
experiments have shown that this is not an environment where a proxy architecture
would be beneficial. This of course would be a logical conclusion. If all links in a
workflow have the same cost, and new links are added, then the cost would be higher.
Once the workflow engine was moved most workflows became 2-5 times faster
than their equivalent traditional model ones. A LAN workflow with an external work-
flow engine is a reasonable configuration, though the PlanetLab testing would obvi-
ously be the most representative of real-world collaboration environments.
When executing experiments on PlanetLab encouraging results were observed.
With the exception of one experiment which had a degraded performance when com-
pared to the traditional model, all others saw improvements, with a 9-fold improvement
also being observed. Most promising however was that in all cases, when all the work-
flow patterns were taken into account, the overall change was always beneficial and
ranged from 128% to 222% improvement. This is important as it implies that even if
one pattern is misbehaving, a workflow, which will probably be composed of an ar-
77
Chapter 8. Discussion 78
ray of patterns, will still experience improvements with the hybrid model. This result
is especially useful since that enables end-to-end workflow to be executed while still
obtaining an improvement (and not just workflow patterns).
One observation is that no single parameter can be used as a reliable predictor for
the performance of the hybrid model. Using message data size without taking into
account network topology is useless, as is taking into account network topology with-
out taking into account network load. Nevertheless, one can use reasonable indicators
to make predictions about the performance. For example, one could reasonably use
relative distance or network speed as an indicator as to whether introducing the hybrid
model (and its proxies) would improve the workflow execution time.
It would be safe to say that the hybrid model has met its goals, though its static
configuration diminishes some of its potential benefits.
8.2 Future work
Having discussed the benefits of the hybrid model, our attention can turn at what else
may be done in the future.
Although the overall results were promising, their unpredicability should dictate
the direction taken in the future. One problem with the approach taken in this project
is that the software system was static. The proxy assignments were determined prior
to the begining of each experiment and they were not modified during testing.
Being able to dynamic change the overlay workflow (overlay being the set of prox-
ies used), would allow the system to better tolerate unpredictable system behaviour.
The current approach is beneficial if the proxies are chosen after examinint historical
flow data. It would still be unable to overcome unpredictable behaviour, but in a sta-
ble network, this may not be an issue. Injecting dynamic choices into the workflow
adds complexity to the system, but may improve its tolerance to unexpected network
conditions.
A dynamic optimiser could also decide when a proxy should be avoided, so that
the workflow engine invokes a web service directly. Experiments which combine the
traditional and hybrid model have not yet been performed.
Another area that could be improved is the API for the proxy. The workflow engine,
as implemented (with the proxy) for this project, needed to send additional control
flow messages in order to achieve certain tasks. For example, it first had to invoke
storeData on a proxy and then send a control message to instruct it to invokeWS with

Chapter 8. Discussion 79
the stored data. Although as the message size increases the cost of the control message
is absorbed into the cost of sending the data, such delays could be avoided.
In addition, it may be worth investigating whether some choreography features
could be added to the proxy. For example, the proxy could be informed of the next x
operations in the workflow, and it would be able to determine whether it needs to do
anything in the meantime (e.g., forward data).
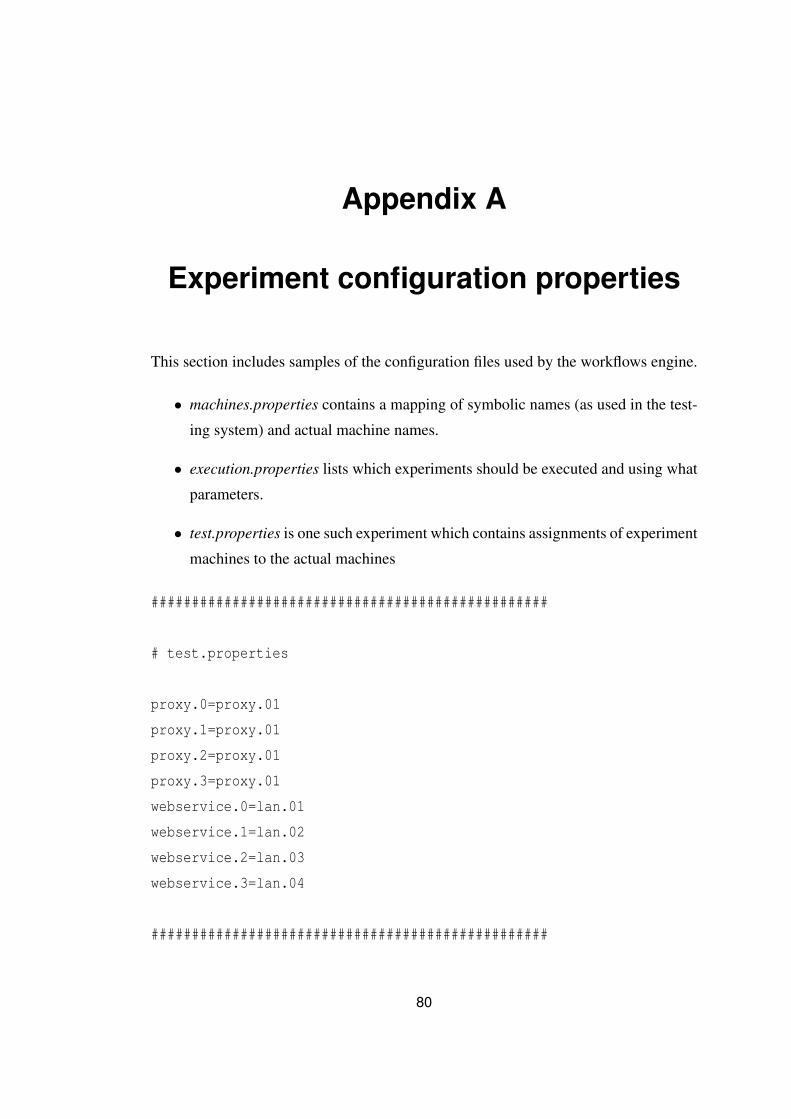
Appendix A
Experiment configuration properties
This section includes samples of the configuration files used by the workflows engine.
• machines.properties contains a mapping of symbolic names (as used in the test-
ing system) and actual machine names.
• execution.properties lists which experiments should be executed and using what
parameters.
• test.properties is one such experiment which contains assignments of experiment
machines to the actual machines
#################################################
# test.properties
proxy.0=proxy.01
proxy.1=proxy.01
proxy.2=proxy.01
proxy.3=proxy.01
webservice.0=lan.01
webservice.1=lan.02
webservice.2=lan.03
webservice.3=lan.04
#################################################
80

Appendix A. Experiment configuration properties 81
#################################################
# machines.properties
# University of Edinburgh - AT 4.12 lab
lan.01=rosberg.inf.ed.ac.uk:18181
lan.02=wurz.inf.ed.ac.uk:18181
lan.03=brundle.inf.ed.ac.uk:18181
lan.04=hakkinen.inf.ed.ac.uk:18181
proxy.01=piquet.inf.ed.ac.uk:18181
# University of Edinburgh - AT 5 North lab
lan.05=axna.inf.ed.ac.uk:18181
lan.06=langraw.inf.ed.ac.uk:18181
lan.07=crane.inf.ed.ac.uk:18181
lan.08=rode.inf.ed.ac.uk:18181
proxy.02=ain.inf.ed.ac.uk:18181
# University of Edinburgh - AT 5 North lab
lan.09=turbitail.inf.ed.ac.uk:18181
lan.10=monotreme.inf.ed.ac.uk:18181
lan.11=yarpha.inf.ed.ac.uk:18181
lan.12=tapley.inf.ed.ac.uk:18181
proxy.03=farsorr.inf.ed.ac.uk:18181
# University of Edinburgh - AT 5 West lab
lan.13=nannup.inf.ed.ac.uk:18181
lan.14=yallingup.inf.ed.ac.uk:18181
lan.15=busselton.inf.ed.ac.uk:18181
lan.16=vasse.inf.ed.ac.uk:18181
proxy.04=jak.inf.ed.ac.uk:18181
#################################################

Appendix A. Experiment configuration properties 82
#################################################
# execution.properties
# experimentName is the name by which the project is referred to
# testName is the name by which an experiment can be loaded
# iterations is the number of times to repeat the test
# config is the name of the properties files with the node assignment
# values are comma separated numbers representing the basic data unit
# size for the experiment
experimentName=testName%iterations%config%values
#################################################
Appendix B
Possible optimisations
The hybrid model was expected to be a non-intrusive substitute to the existing cen-
tralised orchestration model. As such, it has been designed so that it make minimal
requirements of its environment or it’s interacting peers. This has meant that certain
features which may have improved its performance had to be excluded.
If one were to do away with the existing traditional orchestration model, then it’s
possible that some of these conditions would be relaxed. Alternatively, one could
consider employing these ideas for the proxy-proxy communication or perhaps even
P-WE communication. Such a solution would be non-disruptive to the workflow web
services.
B.1 Data handling
Although ignored in this project, data transformation may be necessary in workflows
and it may be worth considering how the proxy could be change to accommodate for
this.
One approach is to extend the proxy so that it performs data transformations and
processing. If the proxy performed the data transformations independently, then the
hybrid model would no longer be flexible (i.e., changing the web service interface
requires altering the proxies). As the workflow engine has global knowledge about
the workflow web services it supports, it can inform the appropriate proxy of how to
manipulate the data. This would increase the size (and possibly number) of control
messages exchanged, but would avoid transferring the data to the workflow engine for
processing.
Another approach would be to provide web services which can process messages
83
Appendix B. Possible optimisations 84
between web service operation invocations, i.e., introduce additional flows in the work-
flow. As the hybrid model is considered to be non-disruptive, this approach would not
be suitable.
The final approach would be to allow the workflow engine to perform the data
transformations locally. That is, whenever the data needs to be transformed before it
is used by some workflow web service, the proxy which contains the data would be
instructed to send the data back to the workflow engine.
Which approach should be used is debatable and may very well depend on the
existing workflow. If in the current workflow the workflow engine and transforms
the data, it would be beneficial to delegate such tasks to the proxies (and incurring
additional control flow costs). If the current workflow already uses web services for its
transformations, then the issue is mute as the transformation is considered to be part of
the workflow. Note that in scientific workflows (moreso than in business workflows),
the web services might already be tightly coupled, so such issues might not arise.
If the proxies are able to transform the data, further optimisations to the workflow
might be possible. For example, if a transformation increases the size of a message,
then unaltered message can be sent to the proxy handling the next invocation and let it
transform the data.
B.2 Web service extensions support
The web services considered in this project are those for which synchronous commu-
nication would not create problems (e.g., TCP connection timeouts). There are many
cases where asynchronous communication would be beneficial. An example of this
would be the invocation of a long-running web service operation. The time between
invocation and return of the response (i.e., propagation, processing and computation),
may exceed any connection timeouts used. Asynchronous communication would al-
low for the connection to be closed and for the web service to initiate a new connection
when it has the data ready. A solution to this issue is provided by WS-Addressing, a
web service extension which allows the invoker to provide the address to which the
response should be sent.
WS-Addressing and other web service extensions are not considered in this project,
though they have been identified as useful to scientific workflows [20]. This is because
there is no guarantee that the web services used in a workflow would employ or support
web service extensions. One could argue that the introduction of proxies (if imple-
Appendix B. Possible optimisations 85
mented as web services) into the orchestration model would allow for the use of web
service extensions, at least for the proxy-proxy communication. However, one needs
to also consider the deployment of the proxy. If implemented as web services, then the
web services would be deployed in an application container. The optimal deployment
for proxies would be to be deployed in the same container as the web services it will
be invoking. Since no guarantees can be made that all involved web containers would
support the relevant web service extensions, this situation is also not considered.
This conforms to the general notion of scope described above. If an existing work-
flow employed web service extensions, then the hybrid workflow will continue to use
the extensions. The caveat in this case is that the workflow semantics (and web ser-
vices) may need to be altered to incorporate the proxies. This may be necessary for
example with security extensions that restrict who may invoke web service operations.
B.3 Message optimisation
A number of different approach could be used to improve the SOAP message process-
ing of the proxy architecture. Currently the project exchanged base64 binary messages,
which are converted from binary to text in order to be sent over the SOAP message.
• Encode the message. This could be a custom encoding or some other binary
encoding.
• Modify the message fragmentation. It may not always be possible to process
the largest of messages. Message fragmentation for web services makes this
possible,
• XML Infoset + SOAP Message Transmission Optimization Mechanism (MTOM).
When dealing with binary data, the MTOM solution (which uses XML Infoset)
stored binary data separately.
• Abandon the SOAP stack. Message exchange could continue using just TCP.
• Single control connection. Control flow messages could always be directed to
a well-known server. Having an open control flow connection would avoid the
overhead of opening a new connection.
• HTTP-gzip. HTTP allows for data to be posted in a zip format. As SOAP will
use the HTTP, then it may be useful to compress the payload.

Appendix B. Possible optimisations 86
B.4 Simpified proxy stack
The proxy acts as a passthrough for all its actions. Data is provided by the workflow
engine (or the workflow web services) as are control messages to be acted upon. The
SOAP overhead however is imposed on all interactions of the proxy, as it continues to
behave as a web application.
The proxy could be simplified by letting it assume that anything received from
another proxy, workflow engine or workflow web service, is valid. It could operate at
a lower level protocol (e.g., TCP) and avoid much of the message processing costs.
Bibliography
[1] Hugo Haas, Mike Champion, David Booth, Eric Newcomer, David Or-chard, Christopher Ferris, and Francis McCabe. Web services architec-ture. W3C note, W3C, February 2004. http://www.w3.org/TR/2004/NOTE-ws-arch-20040211/.
[2] Erik Christensen, Francisco Curbera, Greg Meredith, and Sanjiva Weerawarana.Web services description language (wsdl) 1.1. W3C note, W3C, March 2001.http://www.w3.org/TR/2001/NOTE-wsdl-20010315.
[3] Don Box, David Ehnebuske, Gopal Kakivaya, Andrew Layman, Noah Mendel-sohn, Henrik Frystyk Nielsen, Satish Thatte, and Dave Winer. Simple objectaccess protocol (soap) 1.1. W3C note, W3C, May 2000. http://www.w3.org/TR/2000/NOTE-SOAP-20000508/.
[4] Web Services Interoperability Organization. Ws-i basic profile 1.2. http://www.ws-i.org/Profiles/BasicProfile-1_2(WGAD).html.
[5] OASIS WSBPEL Technical Committee. Oasis web services business processexecution language (wsbpel). Technical report, OASIS, April 2007.
[6] Nickolas Kavantzas, David Burdett, Gregory Ritzinger, Tony Fletcher, andYves Lafon. Web services choreography description language version 1.0.W3C working draft, W3C, December 2004. http://www.w3.org/TR/2004/WD-ws-cdl-10-20041217/.
[7] Girish B. Chafle, Sunil Chandra, Vijay Mann, and Mangala Gowri Nanda. Decen-tralized orchestration of composite web services. In WWW Alt. ’04: Proceedingsof the 13th international World Wide Web conference on Alternate track papers& posters, pages 134–143, New York, NY, USA, 2004. ACM.
[8] Walter Binder, Ion Constantinescu, and Boi Faltings. Service invocation triggers:A lightweight routing infrastructure for decentralized workflow orchestration. InAINA ’06: Proceedings of the 20th International Conference on Advanced In-formation Networking and Applications - Volume 2 (AINA’06), pages 917–921,Washington, DC, USA, 2006. IEEE Computer Society.
[9] Adam Barker, Jon Weissman, and Jano van Hemert. Orchestraing data-centricworkflows. In The 8th IEEE International Symposium on Cluster Computing andthe Grid (CCGrid 2008). IEEE, May 2008.
87
Bibliography 88
[10] David Liu, Kincho H. Law, and Gio Wiederhold. Analysis of integration modelsfor service composition. In WOSP ’02: Proceedings of the 3rd internationalworkshop on Software and performance, pages 158–165, New York, NY, USA,2002. ACM.
[11] Adam Barker, Jon Weissman, and Jano van Hemert. Eliminating the middle man:Distributing dataflow in scientific workflows.
[12] W. M. P. Van Der Aalst, A. H. M. Ter Hofstede, B. Kiepuszewski, and A. P.Barros. Workflow patterns. Distrib. Parallel Databases, 14(1):5–51, 2003.
[13] Sun Microsystems. Java. http://java.sun.com/.
[14] Mort Bay Consulting. Jetty. http://www.mortbay.org/jetty-6/.
[15] Sun Microsystems. Java api for xml web services. https://jax-ws.dev.java.net/.
[16] Sun Microsystems. Metro web services stack. https://metro.dev.java.net/.
[17] Sun Microsystems. Java architecture for xml binding. https://jaxb.dev.java.net/.
[18] Distributed informatics computing environment project. http://www.dice.inf.ed.ac.uk.
[19] Planet lab. http://www.planet-lab.org.
[20] Srinath Perera and Dennis Gannon. Web Service Extensions for Scientifi Work-flows. In HPDC2006 Workshop on Workflows in Support of Large-Scale Science(WORKS06), Paris, France, June 2006.