Embed Size (px)
Citation preview
INL/EXT-06-01262
U.S. Department of Energy
FreedomCAR & Vehicle Technologies Program
Hybrid Electric Vehicle End-of-Life Testing On Honda Insights, Honda Gen I
Civics and Toyota Gen I Priuses
TECHNICAL REPORT
James Francfort Donald Karner Ryan Harkins
Joseph Tardiolo
February 2006
Idaho National Laboratory
Operated by Battelle Energy Alliance
INL/EXT-06-01262
U.S. Department of Energy FreedomCAR & Vehicle Technologies Program
Hybrid Electric Vehicle End-of-Life Testing On Honda Insights, Honda Gen I Civics and Toyota Gen I
Priuses
James Francforti Donald Karner and Ryan Harkinsii
Joseph Tardioloiii
February 2006
Idaho National Laboratory Transportation Technology Department
Idaho Falls, Idaho 83415
Prepared for the U.S. Department of Energy
Assistant Secretary for Energy Efficiency and Renewable Energy Under DOE Idaho Operations Office
Contract DE-AC07-05ID14517
i Idaho National Laboratory ii Electric Transportation Applications iii Exponent Failure Analysis Associates
Disclaimer
This document highlights work sponsored by agencies of the U.S. Government. Neither the U.S. Government nor any agency thereof, nor any of their employees, makes any warranty, express or implied, or assumes any legal liability or responsibility for the accuracy, completeness, or usefulness of any information, apparatus, product, or process disclosed, or represents that its use would not infringe privately owned rights. Reference herein to any specific commercial product, process, or service by trade name, trademark, manufacturer, or otherwise does not necessarily constitute or imply its endorsement, recommendation, or favoring by the U.S. Government or any agency thereof. The views and opinions of authors expressed herein do not necessarily state or reflect those of the U.S. Government or any agency thereof.
ii
ABSTRACT
This technical report details the end-of-life fuel efficiency and battery testing on two model year 2001 Honda Insight hybrid electric vehicles (HEVs), two model year 2003 Honda Civic HEVs, and two model year 2002 Toyota Prius HEVs. The end-of-life testing was conducted after each vehicle has been operated for approximately 160,000 miles. This testing was conducted by the U.S. Department of Energy’s (DOE) Advanced Vehicle Testing Activity (AVTA). The AVTA is part of DOE’s FreedomCAR and Vehicle Technologies Program.
SAE J1634 fuel efficiency testing was performed on the six HEVs with the air conditioning (AC) on and off. The AC on and off test results are compared to new vehicle AC on and off fuel efficiencies for each HEV model. The six HEVs were all end-of-life tested using new-vehicle coast down coefficients. In addition, one of each HEV model was also subjected to fuel efficiency testing using coast down coefficients obtained when the vehicles completed 160,000 miles of fleet testing. Traction battery pack capacity and power tests were also performed on all six HEVs during the end-of-life testing in accordance with the FreedomCAR Battery Test Manual For Power-Assist Hybrid Electric Vehicles procedures.
When using the new-vehicle coast down coefficients (Phase I testing), 11 of 12 HEV tests (each HEV was tested once with the AC on and once with the AC off) had increases in fuel efficiencies compared to the new vehicle test results. The end-of-life fuel efficiency tests using the end-of-life coast down coefficients (Phase II testing) show decreases in fuel economies in five of six tests (three with the AC on and three with it off).
All six HEVs experienced decreases in battery capacities, with the two Insights having the highest remaining capacities and the two Priuses having the lowest remaining capacities.
The AVTA’s end-of-life testing activities discussed in this report were conducted by the Idaho National Laboratory; the AVTA testing partner Electric Transportation Applications, and by Exponent Failure Analysis Associates.
iii
CONTENTS ABSTRACT................................................................................................................................................. iii
INTRODUCTION AND BACKGROUND.................................................................................................. 1
END-OF-LIFE SAE J1634 FUEL EFFICIENCY TESTING ...................................................................... 2
End-of-life SAE J1634 Testing Description....................................................................................... 2
End-of-life SAE J1634 Testing Results.............................................................................................. 2
Phase II Fuel Efficiency and Battery Capacity Expanded per Mile ................................................... 4
End-of-life Phase II Fuel Efficiency Test Results Versus Onboard Fuel Efficiency Display ............ 5
END-OF-LIFE BATTERY TESTING ......................................................................................................... 5
End-of-life Battery Test Methods....................................................................................................... 5
End-of-life Battery Test Results ......................................................................................................... 6
DISCUSSION OF END-OF-LIFE TESTING RESULTS............................................................................ 7
CONCLUSIONS........................................................................................................................................... 8
REFERENCES ............................................................................................................................................. 9
APPENDIX – A VEHICLE PICTURES.................................................................................................... 10
iv
Hybrid Electric Vehicle End-of-Life Testing On Honda Insights, Honda Gen I Civics and Toyota Gen I Priuses
INTRODUCTION AND BACKGROUND
The U.S. Department of Energy, FreedomCAR and Vehicle Technologies’ Advanced Vehicle Testing Activity (AVTA) conducts hybrid electric vehicle (HEV) testing to support the AVTA’s goal of providing benchmark data of emerging technologies for technology modeling, and research and development programs conducted by DOE and its industry partners. The HEV testing results are also provided to fleet managers and the general public to support their vehicle acquisition processes.
The AVTA uses the following three primary HEV test methods: • Baseline performance testing is conducted on dynamometers and closed test tracks, allowing for a
highly-controlled and repeatable testing environment and vehicle-to-vehicle comparisons of the testing results
• Accelerated reliability fleet testing places HEVs in commercial fleets where 160,000 miles of fuel use, repairs, maintenance, and life-cycle costs (including insurance and depreciation costs) are collected for each vehicle within 36 months. The fleet testing provides a very real-world element to the testing process
• End-of-life vehicle and battery testing, which is conducted on a HEV after it accumulated 160,000 test miles, characterizes the effects of high mileage on fuel efficiency and traction battery pack capacity.
During end-of-life testing, each 160,000-miles HEV is subjected to SAE J1634 fuel efficiency retesting with and without the air conditioning (AC) on. SAE J1634 testing is also performed on HEV models with the AC on and off when the vehicles are new, as part of the Baseline Performance testing. In addition, traction battery pack capacity and power tests were performed during end-of-life testing in accordance with the FreedomCAR Battery Test Manual For Power-Assist Hybrid Electric Vehicles procedures.1 The battery tests consist of a static capacity test with a low discharge rate and the Hybrid Pulse Power Characterization (HPPC) test with a short duration, high discharge rate, to simulate peak loading observed during the SAE J1634 driving cycle. Other than manufacturer-recommended scheduled maintenance and preparation requirements for each test procedure, none of the vehicles or their traction battery packs are specially prepped for any of the tests.
Two model year 2001 Honda Insight HEVs (see Appendix A for vehicle pictures), two model year 2003 Honda Civic HEVs, and two model year 2002 Toyota Prius HEVs were the first group of HEVs to undergo end-of-life testing. The end-of-life battery and vehicle testing methods and results for these six HEVs are presented in this report. Note that one of the Insights (Insight 2) was end-of-life tested at 146,000 miles. This Insight’s transmission and other components required repairs that were deemed too expensive to undertake at 146,000 miles.
This report only discusses the end-of-life testing conducted on the first generation Prius (model year 2002) and the first generation Civic (model year 2003). The AVTA end-of-life testing activities discussed in this report were conducted by the Idaho National Laboratory; by its testing partner, Electric Transportation Applications, Phoenix, Arizona; and by Exponent Failure Analysis Associates.
1
END-OF-LIFE SAE J1634 FUEL EFFICIENCY TESTING
End-of-life SAE J1634 Testing Description
Prior to traction battery capacity testing, each HEV that participated in the 160,000 miles fleet test was subjected to SAE J1634 testing in accordance with test procedure ETA-HTP03, dated May 1, 2004.2 This procedure consists of testing each HEV on a double-roller, single-drive-axle chassis dynamometer operating in an environmentally controlled test chamber in accordance with the operational and temperature requirements of SAE J1634. A total of four Urban Driving Schedule (UDS) test cycles and four Highway Fuel Efficiency Test (HWFET) driving cycles were performed on each vehicle with the AC off and then with the AC on maximum. The UDS (1372 seconds) and the HWFET (764 seconds) are conducted on a dynamometer in the following manner: two UUDS and two HWFET schedules are conducted, followed by a 10 minute rest, and then two additional UDS and two additional HWFET schedules are conducted (UDS, UDS, HWFET, HWFET, 10 minute rest, UDS, UDS, HWFET, HWFET). The test vehicle parameters recorded include roller speed, accumulated distance, indicated traction battery pack voltage, indicated traction battery pack current, and ambient temperature.
Fuel efficiency testing was conducted in two phases. Phase I tested all six of the fleet test HEVs on the dynamometer using road load coefficients obtained from baseline performance testing of the HEVs prior to fleet testing (i.e. when the vehicles were new or nearly new). These road load coefficients were also used to obtain fuel efficiency test results for the new HEVs during baseline performance testing. The objective of Phase I fuel efficiency testing was to determine if the degradation in battery capacity over 160,000 miles of fleet testing resulted in a parallel degradation in fuel efficiency. The road load coefficients obtained from baseline performance testing were used to ensure that the vehicle was tested after 160,000 miles of fleet testing under the same loading conditions for which it was tested when it was new (during baseline performance testing), thereby allowing a more direct comparison of fuel efficiency testing results obtained when the vehicle was new (baseline performance testing) with fuel efficiency testing results obtained after 160,000 miles of fleet testing. It should be noted that road load coefficients obtained for Phase I fuel efficiency testing were obtained from one vehicle of each HEV model. Road load coefficients obtained during baseline performance testing were obtained from vehicles identical to the fleet test HEVs, but not the actual fleet test vehicle.
In Phase II fuel efficiency testing, one of the two 160,000 mile Toyota Priuses, one of the two 160,000 mile Honda Insights and one of the two 160,000 mile Honda Civics tested in Phase I were coast down tested in accordance with procedure ETA HTP01, dated November 1, 2004.3 This procedure implements the requirements of SAE J1263 for obtaining road load coefficients from test-track-obtained coast down data. These road load coefficients were then used to conduct SAE J1634 fuel efficiency tests. The results of this testing more accurately reflect the actual fuel efficiency of the HEVs tested after 160,000 miles of fleet testing and include effects of not only battery degradation (as in Phase I testing), but changes in drivetrain efficiency, rolling resistance and aerodynamic drag.
To summarize, all six Insight, Civic and Prius end-of-life (160,000 miles) HEVs were SAE J1634 tested during Phase I testing, and only one of each end-of-life HEV model was SAE J1634-tested during Phase II testing. Phase I and Phase II testing both included conducting the SAE J1634 tests with the AC on and with the AC off.
End-of-life SAE J1634 Testing Results
The fuel efficiency test results from Phase I and Phase II were compared with the fuel efficiency test results obtained on each of the HEV models during baseline performance testing (new or nearly new
2
vehicles). Although the fuel efficiency data presented as new for each vehicle type was not collected specifically on the vehicles tested in Phase I and Phase II, it is reasonable to assert that a new vehicle, when tested under standardized conditions (which is the case for the data presented as new in this section), should yield a fuel efficiency result representative of the vehicles tested in Phase I and Phase II when they were similarly new. Therefore, for the sake of comparison, the data presented as new will be used as the baseline for comparison to characterize the fuel efficiency findings for each of the end-of-life HEVs.
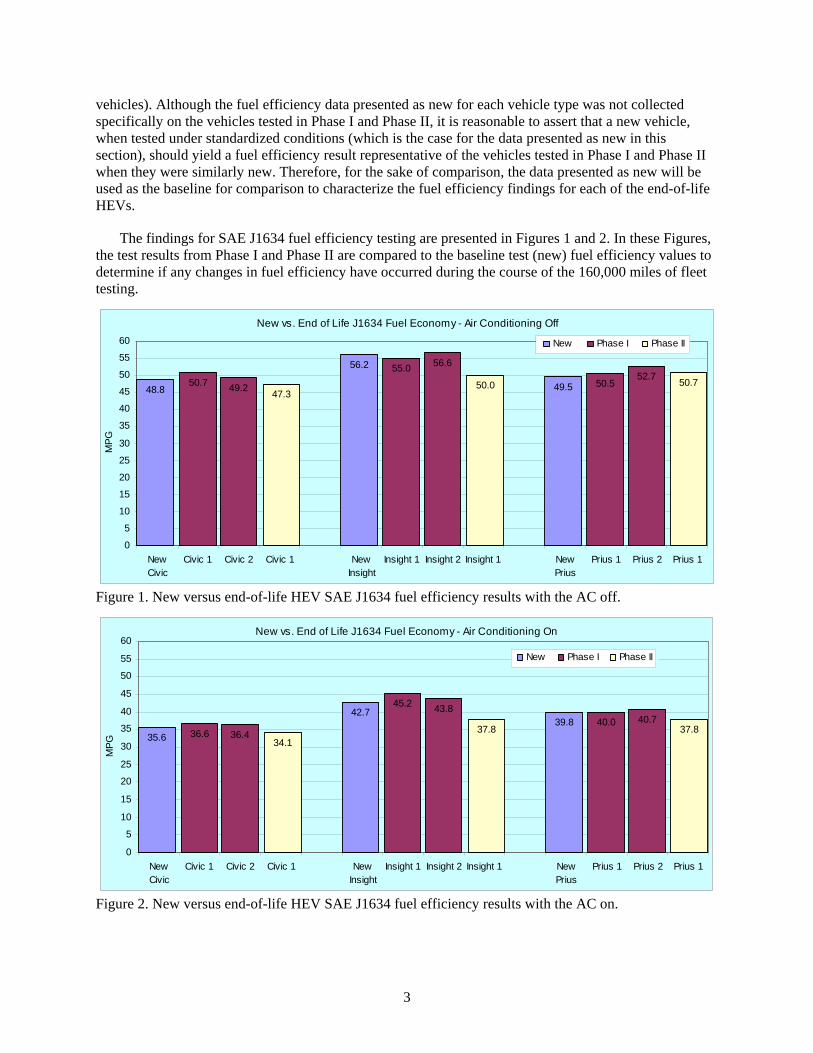
The findings for SAE J1634 fuel efficiency testing are presented in Figures 1 and 2. In these Figures, the test results from Phase I and Phase II are compared to the baseline test (new) fuel efficiency values to determine if any changes in fuel efficiency have occurred during the course of the 160,000 miles of fleet testing.
New vs. End of Life J1634 Fuel Economy - Air Conditioning Off
48.8
56.2
49.550.7 49.2
55.0 56.6
50.552.7
47.350.0 50.7
0
5
10
15
20
25
30
35
40
45
50
55
60
NewCivic
Civic 1 Civic 2 Civic 1 NewInsight
Insight 1 Insight 2 Insight 1 NewPrius
Prius 1 Prius 2 Prius 1
MPG
New Phase I Phase II
Figure 1. New versus end-of-life HEV SAE J1634 fuel efficiency results with the AC off.
New vs. End of Life J1634 Fuel Economy - Air Conditioning On
35.6
42.739.8
36.6 36.4
45.2 43.840.0 40.7
34.137.8 37.8
0
5
10
15
20
25
30
35
40
45
50
55
60
NewCivic
Civic 1 Civic 2 Civic 1 NewInsight
Insight 1 Insight 2 Insight 1 NewPrius
Prius 1 Prius 2 Prius 1
MPG
New Phase I Phase II
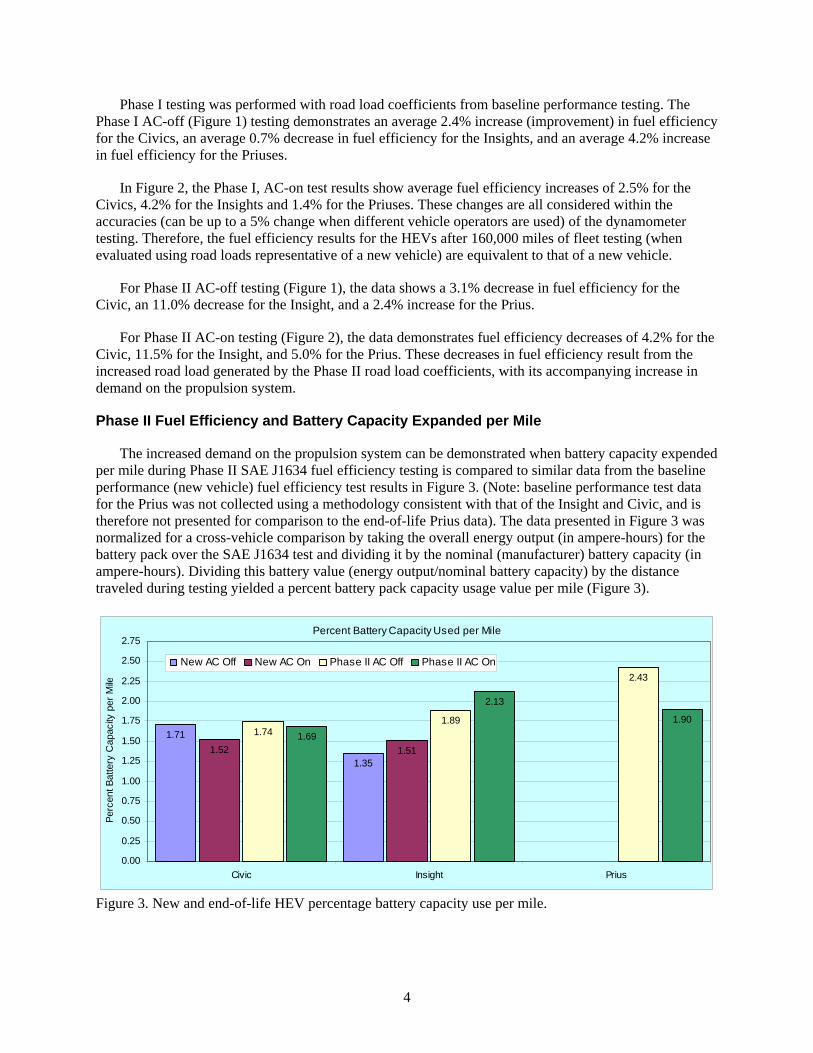
Figure 2. New versus end-of-life HEV SAE J1634 fuel efficiency results with the AC on.
3
Phase I testing was performed with road load coefficients from baseline performance testing. The Phase I AC-off (Figure 1) testing demonstrates an average 2.4% increase (improvement) in fuel efficiency for the Civics, an average 0.7% decrease in fuel efficiency for the Insights, and an average 4.2% increase in fuel efficiency for the Priuses.
In Figure 2, the Phase I, AC-on test results show average fuel efficiency increases of 2.5% for the Civics, 4.2% for the Insights and 1.4% for the Priuses. These changes are all considered within the accuracies (can be up to a 5% change when different vehicle operators are used) of the dynamometer testing. Therefore, the fuel efficiency results for the HEVs after 160,000 miles of fleet testing (when evaluated using road loads representative of a new vehicle) are equivalent to that of a new vehicle.
For Phase II AC-off testing (Figure 1), the data shows a 3.1% decrease in fuel efficiency for the Civic, an 11.0% decrease for the Insight, and a 2.4% increase for the Prius.
For Phase II AC-on testing (Figure 2), the data demonstrates fuel efficiency decreases of 4.2% for the Civic, 11.5% for the Insight, and 5.0% for the Prius. These decreases in fuel efficiency result from the increased road load generated by the Phase II road load coefficients, with its accompanying increase in demand on the propulsion system.
Phase II Fuel Efficiency and Battery Capacity Expanded per Mile
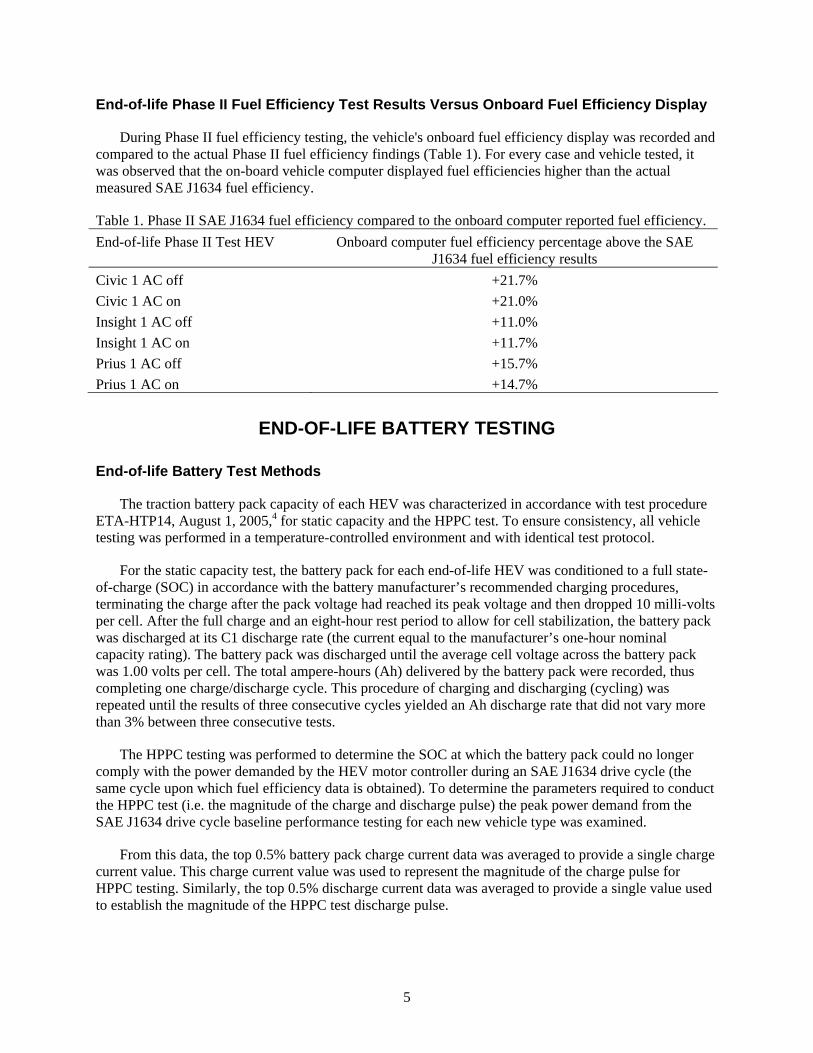
The increased demand on the propulsion system can be demonstrated when battery capacity expended per mile during Phase II SAE J1634 fuel efficiency testing is compared to similar data from the baseline performance (new vehicle) fuel efficiency test results in Figure 3. (Note: baseline performance test data for the Prius was not collected using a methodology consistent with that of the Insight and Civic, and is therefore not presented for comparison to the end-of-life Prius data). The data presented in Figure 3 was normalized for a cross-vehicle comparison by taking the overall energy output (in ampere-hours) for the battery pack over the SAE J1634 test and dividing it by the nominal (manufacturer) battery capacity (in ampere-hours). Dividing this battery value (energy output/nominal battery capacity) by the distance traveled during testing yielded a percent battery pack capacity usage value per mile (Figure 3).
Percent Battery Capacity Used per Mile
1.71
1.351.52 1.51
1.741.89
2.43
1.69
2.13
1.90
0.00
0.25
0.50
0.75
1.00
1.25
1.50
1.75
2.00
2.25
2.50
2.75
Civic Insight Prius
Perc
ent B
atte
ry C
apac
ity p
er M
ile
New AC Off New AC On Phase II AC Off Phase II AC On
Figure 3. New and end-of-life HEV percentage battery capacity use per mile.
4
End-of-life Phase II Fuel Efficiency Test Results Versus Onboard Fuel Efficiency Display
During Phase II fuel efficiency testing, the vehicle's onboard fuel efficiency display was recorded and compared to the actual Phase II fuel efficiency findings (Table 1). For every case and vehicle tested, it was observed that the on-board vehicle computer displayed fuel efficiencies higher than the actual measured SAE J1634 fuel efficiency.
Table 1. Phase II SAE J1634 fuel efficiency compared to the onboard computer reported fuel efficiency. End-of-life Phase II Test HEV Onboard computer fuel efficiency percentage above the SAE
J1634 fuel efficiency results Civic 1 AC off +21.7% Civic 1 AC on +21.0% Insight 1 AC off +11.0% Insight 1 AC on +11.7% Prius 1 AC off +15.7% Prius 1 AC on +14.7%
END-OF-LIFE BATTERY TESTING
End-of-life Battery Test Methods
The traction battery pack capacity of each HEV was characterized in accordance with test procedure ETA-HTP14, August 1, 2005,4 for static capacity and the HPPC test. To ensure consistency, all vehicle testing was performed in a temperature-controlled environment and with identical test protocol.
For the static capacity test, the battery pack for each end-of-life HEV was conditioned to a full state-of-charge (SOC) in accordance with the battery manufacturer’s recommended charging procedures, terminating the charge after the pack voltage had reached its peak voltage and then dropped 10 milli-volts per cell. After the full charge and an eight-hour rest period to allow for cell stabilization, the battery pack was discharged at its C1 discharge rate (the current equal to the manufacturer’s one-hour nominal capacity rating). The battery pack was discharged until the average cell voltage across the battery pack was 1.00 volts per cell. The total ampere-hours (Ah) delivered by the battery pack were recorded, thus completing one charge/discharge cycle. This procedure of charging and discharging (cycling) was repeated until the results of three consecutive cycles yielded an Ah discharge rate that did not vary more than 3% between three consecutive tests.
The HPPC testing was performed to determine the SOC at which the battery pack could no longer comply with the power demanded by the HEV motor controller during an SAE J1634 drive cycle (the same cycle upon which fuel efficiency data is obtained). To determine the parameters required to conduct the HPPC test (i.e. the magnitude of the charge and discharge pulse) the peak power demand from the SAE J1634 drive cycle baseline performance testing for each new vehicle type was examined.
From this data, the top 0.5% battery pack charge current data was averaged to provide a single charge current value. This charge current value was used to represent the magnitude of the charge pulse for HPPC testing. Similarly, the top 0.5% discharge current data was averaged to provide a single value used to establish the magnitude of the HPPC test discharge pulse.
5
With the magnitude of the charge and discharge pulse established, the battery pack was subjected to a single pulse discharge and single pulse charge at each percent SOC level, starting at 90% and decrementing at 10% SOC intervals until the battery pack voltage reached an average of 0.8 volts per cell.
Between each test cycle, which consisted of one charge/discharge pulse at each percent SOC level, the battery pack was discharged at its C1 rate to reach the next 10% SOC interval. Upon reaching the termination criterion, the percent SOC and its equivalent Ah rating were recorded.
Although summarized above, a more detailed account of the HPPC test protocol included fully charging each battery pack by performing one C1 cycle as described in the static capacity test, followed by a one-hour rest period to allow for cell stabilization. At the end of this rest period, the battery was discharged at the C1 rate until it reached 90% SOC based on the nominal C1 Ah rating of the battery, (i.e. nominal C1 battery rating in Ah times 0.9). Immediately following a one-hour rest period, the battery pack was subjected to a ten-second discharge pulse of the discharge magnitude determined in the method above. A forty-second rest period was observed followed by a ten-second current charge pulse of the charge magnitude determined in the method above. After the discharge/charge pulse, the battery pack was discharged at a C1 rate until it reached 80% SOC, immediately followed by a one-hour rest period. This pulse sequence was continued, removing 10% of SOC each time, until the battery pack voltage averaged 0.8 volts per cell during the C1 discharge portion, at which point the test was terminated (the battery pack voltage was protection-limited to an average 0.8 volts per cell). If the voltage reached an average of 0.8 volts per cell at any point during a discharge pulse, the current was decreased until the pulse duration was complete. In this way, the battery pack was protected from over-discharge. An upper limit of 1.8 volts per cell was also placed on the battery during the charge pulse portion of the test to protect the battery from overcharge.
End-of-life Battery Test Results
Since the initial traction battery pack capacity of each HEV was not determined when the vehicle was new, the characterization results obtained from the end-of-life testing were compared to the nominal (manufacturer) rated battery capacity.
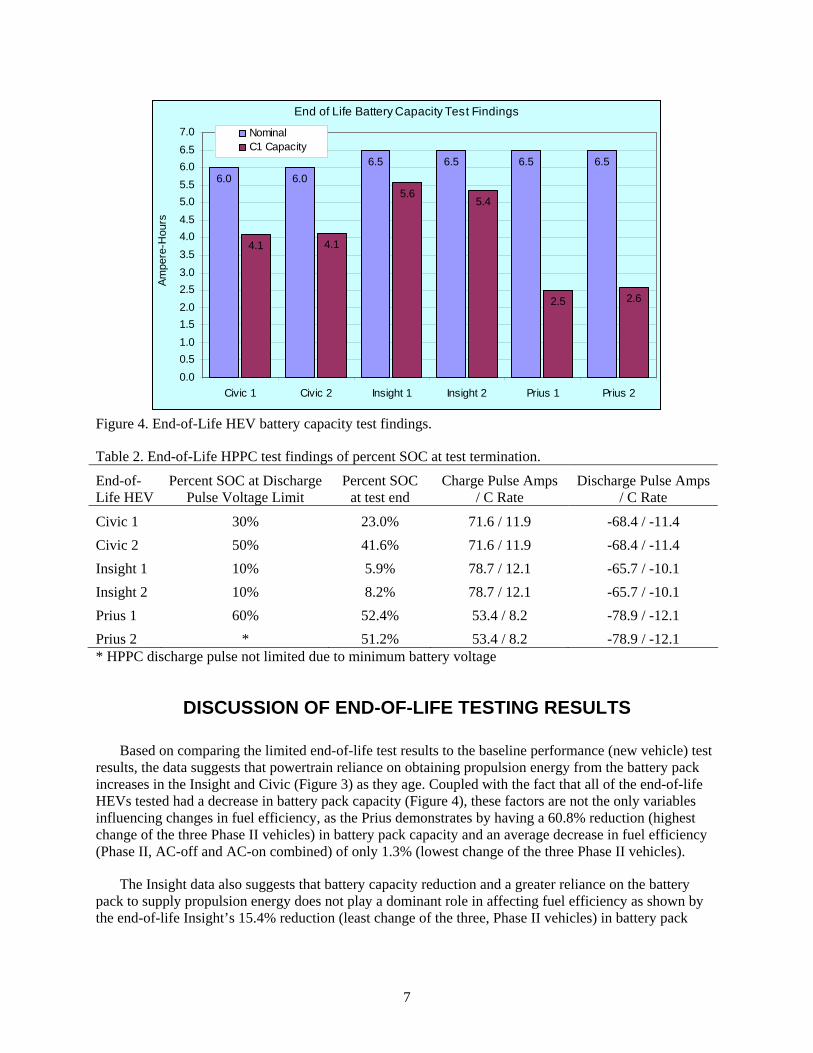
For static battery pack capacity testing, each end-of-life HEV demonstrated a reduced battery pack capacity (Figure 4). The two Civics demonstrated an average of 68.3% of battery pack capacity remaining, the two Insights an average of 84.6% of battery pack capacity remaining, and the two Priuses an average of 39.2% of battery pack capacity remaining.
The HPPC findings (Table 2) suggest a qualitative measure of the capability (range of working capacity) of each end-of-life HEV battery pack to meet a short-term, high-load demand that is representative of a typical drive cycle. Although in the future, an updated test procedure will require the HPPC test to be performed on new HEV battery packs, HPPC testing was not performed on the six subject HEVs (160,000 miles end-of-life fleet test) when the vehicles were new. The corresponding percent SOC at termination and the SOC step at which a discharge pulse was limited, as determined by HPPC testing, is displayed in Table 2. The lower the percentage SOC displayed in Table 2, the greater its capability is to meet the power demand of the motor controller at the discharge loads observed during the HPPC test. All batteries tested were capable of absorbing the charge pulses without reaching the voltage limit placed on them, including the charge pulse at 90% SOC. Therefore it is reasonable to conclude that the battery’s ability to absorb energy had not degraded as a result of 160,000 miles of fleet testing. Also displayed in Table 2 are the pulse charge and pulse discharge currents used in the HPPC testing, as well as their corresponding C Rate (the current value divided by the battery’s nominal C1 rating).
6
End of Life Battery Capacity Test Findings
6.0 6.06.5 6.5 6.5 6.5
4.1 4.1
5.65.4
2.5 2.6
0.00.51.01.52.02.53.03.54.04.55.05.56.06.57.0
Civic 1 Civic 2 Insight 1 Insight 2 Prius 1 Prius 2
Ampe
re-H
ours
NominalC1 Capacity
Figure 4. End-of-Life HEV battery capacity test findings.
Table 2. End-of-Life HPPC test findings of percent SOC at test termination.
End-of-Life HEV
Percent SOC at Discharge Pulse Voltage Limit
Percent SOC at test end
Charge Pulse Amps / C Rate
Discharge Pulse Amps / C Rate
Civic 1 30% 23.0% 71.6 / 11.9 -68.4 / -11.4 Civic 2 50% 41.6% 71.6 / 11.9 -68.4 / -11.4 Insight 1 10% 5.9% 78.7 / 12.1 -65.7 / -10.1 Insight 2 10% 8.2% 78.7 / 12.1 -65.7 / -10.1 Prius 1 60% 52.4% 53.4 / 8.2 -78.9 / -12.1 Prius 2 * 51.2% 53.4 / 8.2 -78.9 / -12.1 * HPPC discharge pulse not limited due to minimum battery voltage
DISCUSSION OF END-OF-LIFE TESTING RESULTS
Based on comparing the limited end-of-life test results to the baseline performance (new vehicle) test results, the data suggests that powertrain reliance on obtaining propulsion energy from the battery pack increases in the Insight and Civic (Figure 3) as they age. Coupled with the fact that all of the end-of-life HEVs tested had a decrease in battery pack capacity (Figure 4), these factors are not the only variables influencing changes in fuel efficiency, as the Prius demonstrates by having a 60.8% reduction (highest change of the three Phase II vehicles) in battery pack capacity and an average decrease in fuel efficiency (Phase II, AC-off and AC-on combined) of only 1.3% (lowest change of the three Phase II vehicles).
The Insight data also suggests that battery capacity reduction and a greater reliance on the battery pack to supply propulsion energy does not play a dominant role in affecting fuel efficiency as shown by the end-of-life Insight’s 15.4% reduction (least change of the three, Phase II vehicles) in battery pack
7
capacity and 11.2% decrease (highest change of the three, Phase II vehicles) in fuel efficiency (Phase II, AC-off and AC-on combined).
Other factors that may have affected fuel efficiency in the baseline and end-of-life comparisons are drivetrain efficiency changes, sample size (greater funding would allow a higher number of vehicles participating in the end-of-life testing) and vehicle operator variability (future testing will make it a goal to limit the use of different vehicle operators).
As a byproduct of fuel efficiency testing, it was observed that obtaining specific road load (coast down) coefficients for each vehicle prior to Phase II testing resulted in a change in fuel efficiency for the vehicles that participated in Phase I and Phase II. Although not conclusive—based on the limited sample size—the end-of-life vehicles, due to their somewhat varied driving history, may well press the consideration to re-establish coast down coefficients. The concern does not normally arise when testing a new production vehicle, as it is a common industry practice to use coast down coefficients established on a new vehicle of the same type (make, model, and year) when performing fuel efficiency testing. However, the nature of end-of-life testing, and the corresponding vehicle condition that may result from this testing, may very well require the re-establishment of coast down coefficients to ensure the usefulness of this laboratory test procedure in predicting life-cycle fuel costs. As shown in Table 3, a suggested trend or correlation appears between changes in coast down times (55-45 mph) and changes in fuel efficiency.
Table 3. Phase I and Phase II fuel efficiency change due to retested coast down times. End-of-life HEV
55 to 45 mph %change
20 to 10 mpg% change
% Change in fuel efficiencyPhase I & II AC off
% Change in fuel efficiencyPhase I & II AC on
Change in fuel efficiency
Civic -7.5% -14.3% -5.3% -6.6% -6.0%Insight -16.0% -36.1% -10.4% -15.1% -12.8%Prius -3.5% -21.1% -1.7% -6.3% -4.0%
CONCLUSIONS
• The results for the end-of-life (160,000 miles) static battery testing suggest that the two Civics have remaining battery capacities of about 68% and the two Insights have remaining battery capacities of about 85%. The two end-of-life Priuses have remaining battery capacities of about 39%.
• The end-of-life (160,000 miles) Phase I SAE J1634 fuel efficiency tests show increases in fuel economies in 11 of 12 tests (six with the AC on and five with it off) for the six HEVs in end-of-life testing (Figures 1 and 2). Compared to a new Insight, one Insight had a small decrease (1.2 mpg) during the SAE J1634 test with the AC off. The greatest increase was for a Prius at 3.2 mpg.
• The end-of-life (160,000 miles) Phase II SAE J1634 fuel efficiency tests show decreases in fuel economies in five of six tests (three with the AC on and three with it off) for the three HEVs in end-of-life Phase II testing (Figures 1 and 2). The Honda Insights had decreases of 4.9 mpg with the AC on and 6.2 mpg with the AC off, the Honda Civics had decreases of 1.5 mpg with the AC on and off, and the Priuses had an increase of 1.2 mpg without AC and a decrease of 2.0 mpg with AC. These findings do not indicate any appreciable fuel efficiency loss with the exception of the Honda Insight, which demonstrated a slight decrease even when considering the use of different drivers between baseline and Phase II testing.
8
• Although SAE J1634 testing was performed with a small sample size, the data demonstrated no distinct correlation between battery degradation (reduction in battery capacity) and fuel efficiency loss (reduction in fuel efficiency). The data indicated that the power demand on the batteries had increased, their capacity (to hold charge) had diminished, and yet fuel efficiency degradation was not directly proportional to either of these factors.
• Consideration will be given to performing end-of-life coast-down testing and using the derived coefficients for end-of-life SAE J1634 testing.
REFERENCES
1. FreedomCAR Battery Test Manual For Power-Assist Hybrid Electric Vehicles. DOE/ID-11069. Idaho National Engineering and Environmental Laboratory. Draft. April 2003.
2. Implementation of SAE J1634 May 93 – Electric Vehicle Energy Consumption and Range Test Procedure. ETA-HTP03. Electric Transportation Applications. May 1, 2004
3. Implementation of SAE Standard J1263. Road Load Measurement and Dynamometer Simulation Using Coast Down Techniques. ETA HTP01. Electric Transportation Applications. November 1, 2004.
4. Hybrid Electric Vehicle Battery End-of-Life Testing. ETA-HTP14. Electric Transportation Applications. August 1, 2005
9
APPENDIX – A VEHICLE PICTURES
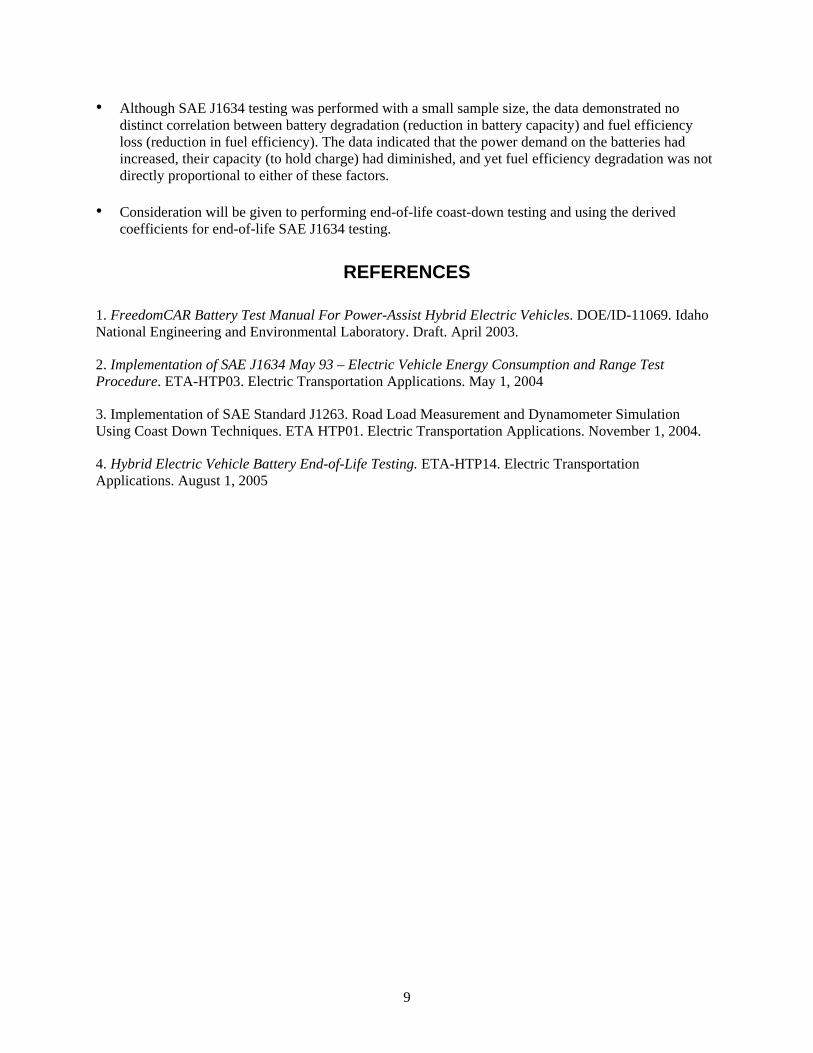
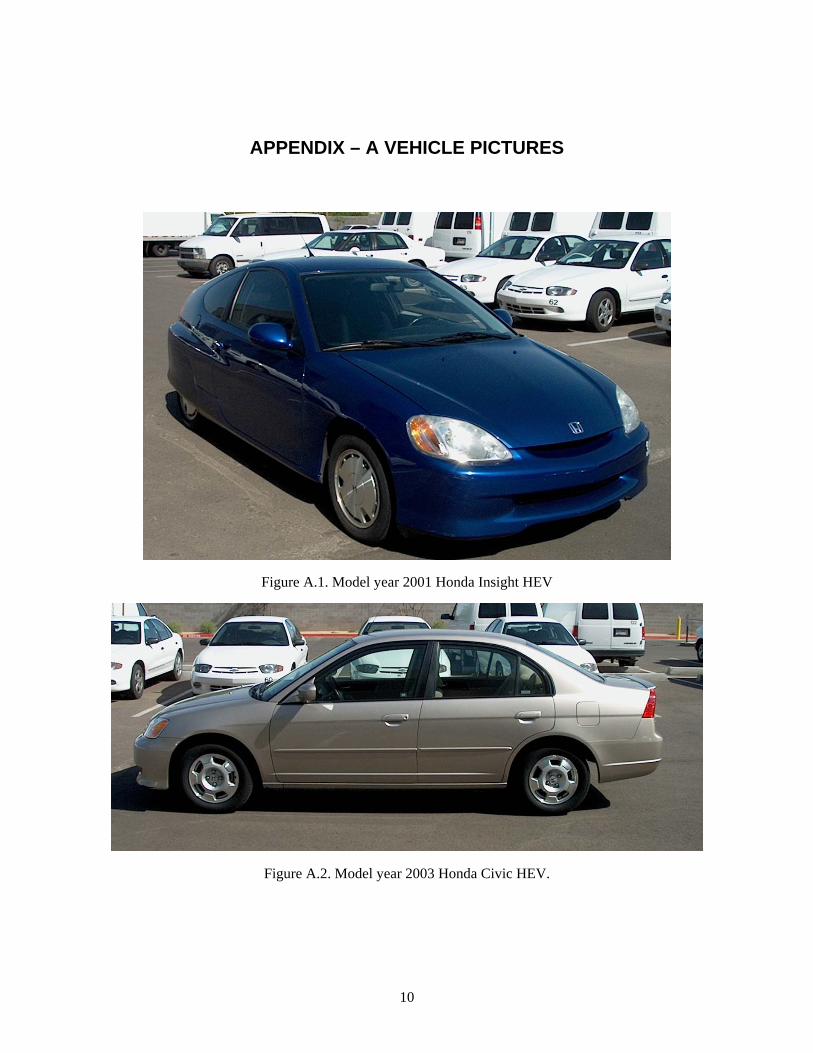
Figure A.1. Model year 2001 Honda Insight HEV
Figure A.2. Model year 2003 Honda Civic HEV.
10
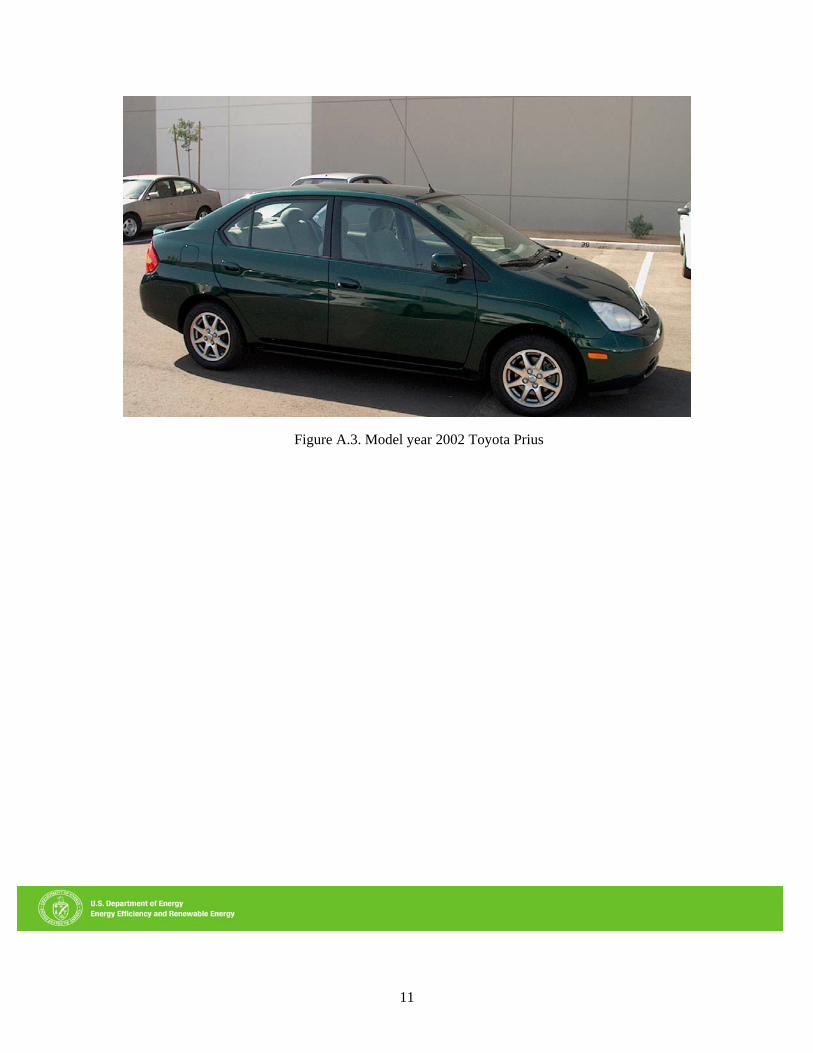
Figure A.3. Model year 2002 Toyota Prius
11