Embed Size (px)
Citation preview

HY19 Result Presentation27 February 2019
G E N E S I S E N E R G Y L I M I T E D
Marc England – CHIEF EXECUTIVE OFFICERChris Jewell – CHIEF FINANCIAL OFFICER

AGENDA
Genesis Energy Limited 1H FY19 Result Presentation 2.
1 Key Highlights
2 Financial Performance
3 Operational and Strategic Update
4 Outlook

Key Highlights
,
Genesis Energy Limited 1H FY19 Result Presentation 4.
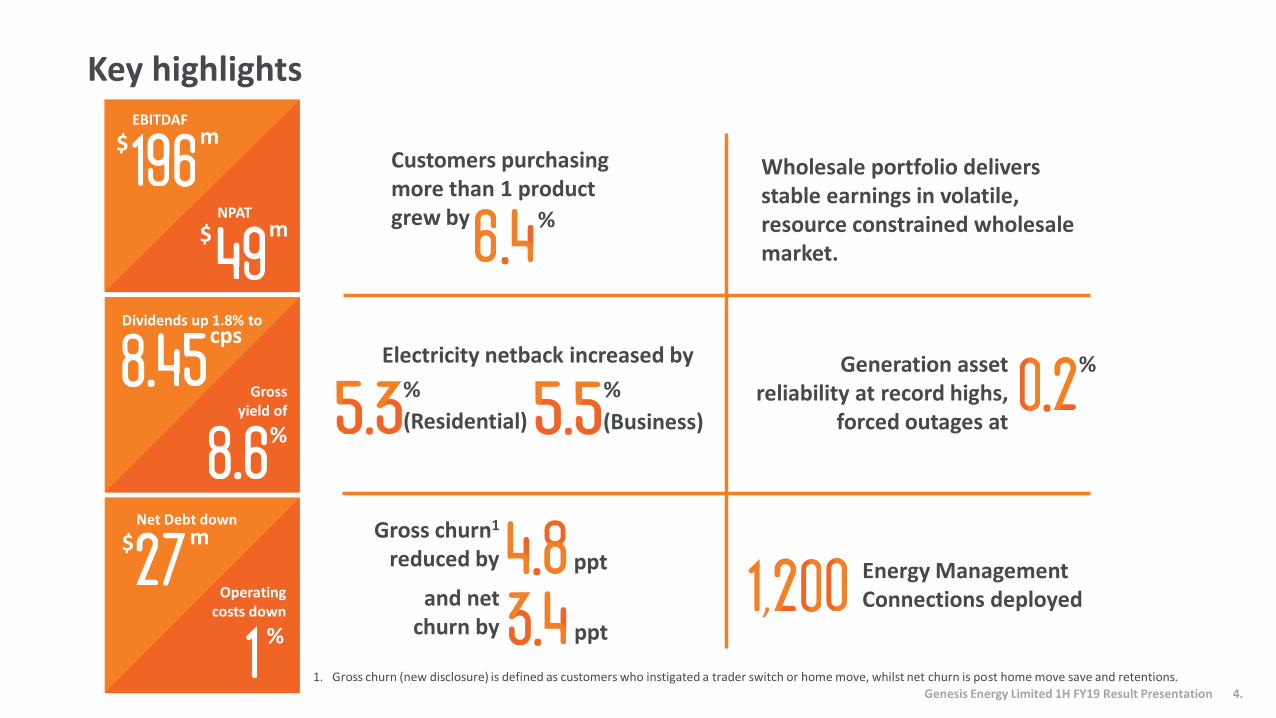
Key highlights
Genesis Energy Limited 1H FY19 Result Presentation 4.
Generation asset reliability at record highs,
forced outages at
Energy Management Connections deployed
NPAT
Net Debt down
Wholesale portfolio delivers stable earnings in volatile, resource constrained wholesale market.
EBITDAF
$ m
$ m
Gross yield of
Dividends up 1.8% tocps
.%
.
$ m
%
Operating costs down
.%
Gross churn1
reduced by
and net churn by
. ppt
. ppt
Electricity netback increased by
.%
(Business).%
(Residential)
1. Gross churn (new disclosure) is defined as customers who instigated a trader switch or home move, whilst net churn is post home move save and retentions.
Customers purchasing more than 1 product grew by
.%
Genesis Energy Limited 1H FY19 Result Presentation 4.

Financial Performance

198
2841.8
150
199
130
27
8.30cps
1,183
196
49 43.3
148
171
111
37
8.45cps
1,156
EBITDAF NPAT UnderlyingEarnings
ControllableOperating Costs
Operating Cashflow Free Cash Flow Capital Expenditure Interim Dividend Net Debt
$ MILLIONS HY18 HY19
321
— EBITDAF of $196m, underlying earnings up 4%, with operating costs down and net debt down $27m
FINANCIAL HIGHLIGHTS
HY19 financial summary1
- 2% + 78% + 4% - 1% + 37%- 15% + 2% - 2%
1. Comparable HY18 financials have been restated in line with note 1 of Genesis’ financial statements, accounting for the adoption of NZ IFRS 9 Financial Instruments and NZ IFRS 15 Revenue from Contracts with Customers. No other comparable periods have been adjusted.
2. Free cash flow represents EBITDAF less cash tax paid, net interest costs and stay in business capital expenditure.3. Net Debt is shown on a separate scale to other financial comparisons, and shows the change in Net Debt over the period from FY18 ($1,183m).
- 14%
Genesis Energy Limited 1H FY19 Result Presentation 6.

DIVIDEND (CPS) & PAYOUT HISTORY
8.00 8.20 8.20
8.30 8.45
87%
72%
87%
64%78%
-15%
5%
25%
45%
65%
85%
105%
125%
145%
5.50
6.00
6.50
7.00
7.50
8.00
8.50
9.00
HY15 HY16 HY17 HY18 HY19
Dividends (cps) % of Free Cash Flow
Dividends— Interim dividend of 8.45 cps declared (up 1.8%), with 80% imputation, representing a 8.6% gross yield1
Genesis Energy Limited 1H FY19 Result Presentation 7.
1. Gross yield based on the rolling 12 month dividend cps and closing share price of $2.61 as at 31 December 2018.2. Free cash flow represents EBITDAF less cash tax paid, net interest costs and stay in business capital expenditure.
• An Interim dividend of 8.45 cps, 80% imputed, will have a record date of 4 April 2019, payable to shareholders on 18 April 2019.
• Supplementary dividend of 1.1929 cps payment to non-resident shareholders.
• The Dividend Reinvestment Plan (DRP) continues to be offered at 2.5% discount, with an opt-in cut off date as at 4 April 2019. DRP pricing will be notified to shareholders on 10 April 2019.
• Pay-out ratio as a percentage of free cash flow2 is 78%.
HY19 vs HY18 EBITDAF
$ MILLIONS
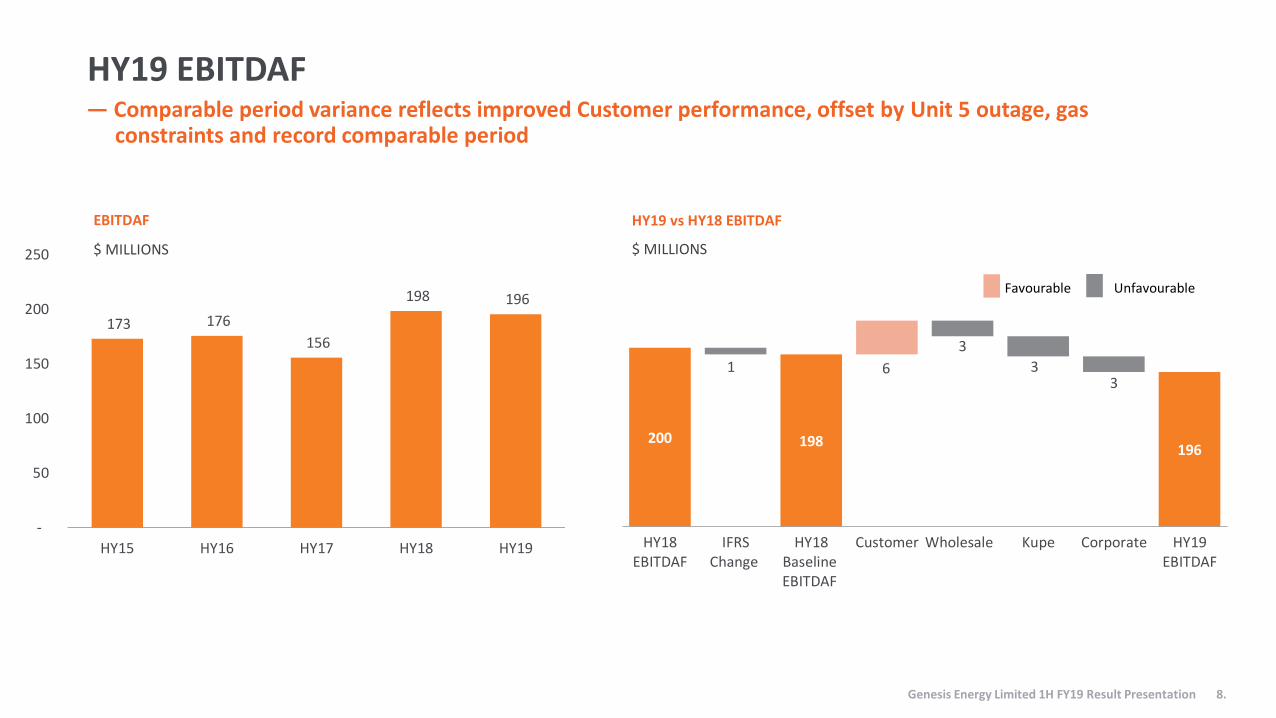
— Comparable period variance reflects improved Customer performance, offset by Unit 5 outage, gas constraints and record comparable period
HY19 EBITDAF
Genesis Energy Limited 1H FY19 Result Presentation 8.
200 198196
1
3
33
6
HY18EBITDAF
IFRSChange
HY18BaselineEBITDAF
Customer Wholesale Kupe Corporate HY19EBITDAF
Favourable Unfavourable
173 176
156
198 196
-
50
100
150
200
250
HY15 HY16 HY17 HY18 HY19
EBITDAF
$ MILLIONS

57 56
62
11
1
12
3
2
HY18EBITDAF
IFRS Change HY18BaselineEBITDAF
ResidentialGross
Margin
ResidentialOpex
Bad Debts B2B Growth LPG Growth Other HY19EBITDAF
Segment EBITDAF
KUPE EBITDAF HY18 TO HY19
CUSTOMER EBITDAF HY18 TO HY19
WHOLESALE EBITDAF HY18 TO HY19
Favourable Unfavourable
2
Genesis Energy Limited 1H FY19 Result Presentation 9.
106 104
74
9
HY18 EBITDAF Trading Result Unit 5 Outage Market Making HY19 EBITDAF
• Customer improved performance in LPG, Business margins and reduced operating expenses and bad debts.
• Wholesale performance stable but moderated by swaption calls, gas constraints and an extended Unit 5 outage. GWAP up $50/MWh to $146/MWh however total generation volume down 467 GWh.
• Kupe benefited from stronger fuel prices, however result was offset by reduced production.
• Corporate costs increased by $2.5m due to lower capitalisation of technology teams.
5653
6 22
7
HY18 EBITDAF Higher Fuel Prices(Net of Hedges)
Lower Production Oil Yield Decline Oil Sales Timing HY19 EBITDAF
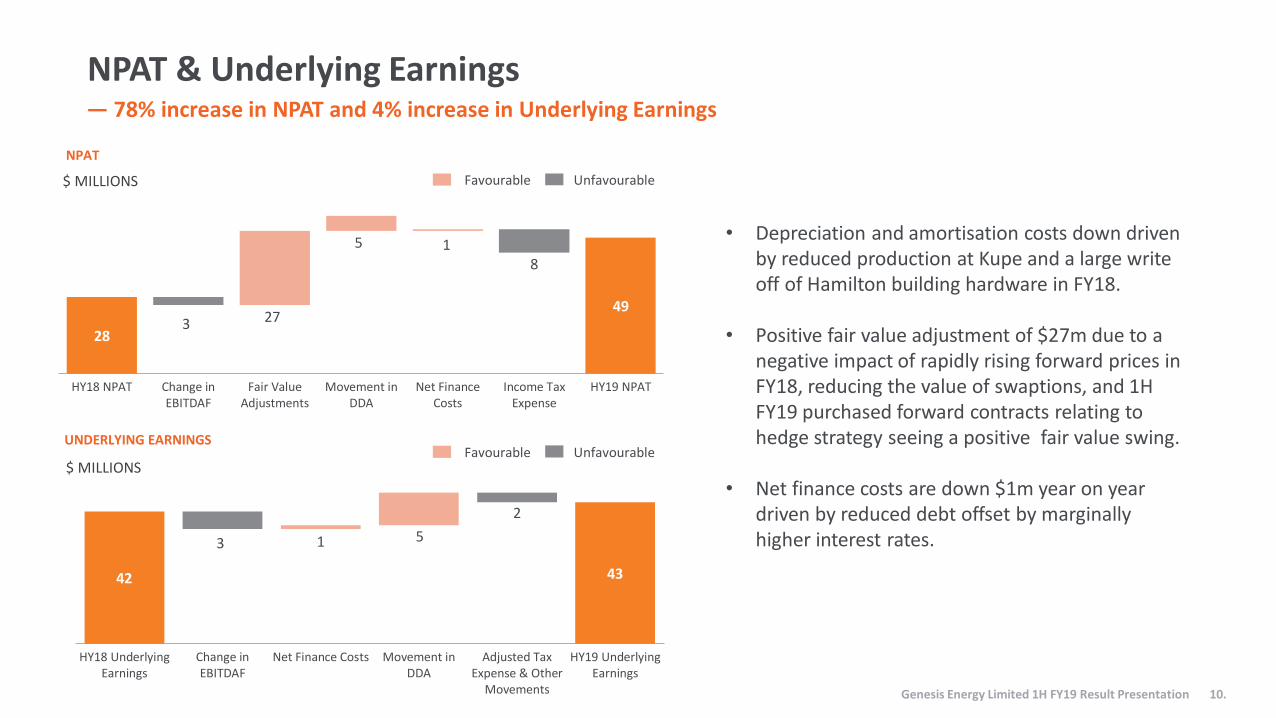
28
493
8
27
5 1
HY18 NPAT Change inEBITDAF
Fair ValueAdjustments
Movement inDDA
Net FinanceCosts
Income TaxExpense
HY19 NPAT
UNDERLYING EARNINGS
NPAT & Underlying Earnings— 78% increase in NPAT and 4% increase in Underlying Earnings
Favourable Unfavourable$ MILLIONS
Genesis Energy Limited 1H FY19 Result Presentation 10.
42 43
3
2
1 5
HY18 UnderlyingEarnings
Change inEBITDAF
Net Finance Costs Movement inDDA
Adjusted TaxExpense & Other
Movements
HY19 UnderlyingEarnings
NPAT
$ MILLIONS Favourable Unfavourable
• Depreciation and amortisation costs down driven by reduced production at Kupe and a large write off of Hamilton building hardware in FY18.
• Positive fair value adjustment of $27m due to a negative impact of rapidly rising forward prices in FY18, reducing the value of swaptions, and 1H FY19 purchased forward contracts relating to hedge strategy seeing a positive fair value swing.
• Net finance costs are down $1m year on year driven by reduced debt offset by marginally higher interest rates.

150 148
23
1
2
HY18 OperatingExpenses
LPG Expansion Bad Debts Marketing &Communication
LowerCapitalisation of
Technology Costs
HY19 OperatingExpenses
142 144 138 150 148
HY15 HY16 HY17 HY18 HY19
$ MILLIONS
CONTROLLABLE OPERATING EXPENSES1
CONTROLLABLE OPERATING EXPENSE BRIDGE
Controllable operating expenses— Controllable operating expenses down 1% on pcp
Favourable Unfavourable$ MILLIONS
Genesis Energy Limited 1H FY19 Result Presentation 11.
2
1. Controllable operating expenses refers to employee benefits plus other operating expenses.2. Represents costs associated with LPG growth offset by synergies from cost to deliver savings
• Costs have stabilised at HY18 levels following a period of investment.
• Increased focus on bad debts is improving results.
• Improved loyalty and brand performance enabling reduced marketing costs.
• Technology teams have spent less time this half year on capital projects.

Capital expenditure— Total capital expenditure at HY19 was $37m, FY19 guidance being up to $85m
CAPITAL EXPENDITURE1
• Stay in business capex (SIB) was $30m, significant projects included:
₋ Huntly U5 planned maintenance, Kupe LPG plant maintenance, station crane upgrades, Tuaigenerator refurbishments, Tokaanu auxiliary generator upgrade, Rangipo fire protection upgrade.
• Other capex includes ($7m):₋ LPG depot expansion and growth projects,
development of Energy Management products, Huntly U5 gas turbine performance upgrades and Kupe Phase 2 Development feasibility study.
1. Capital expenditure excludes M&A activities.
FY15 FY16 FY17 FY18 FY19 YTD
Wholesale Customer LPG Operations
Kupe Technology & Digital Corporate
$ MILLIONS
4440
47
80
37
Genesis Energy Limited 1H FY19 Result Presentation 12.

NET DEBT AND NET DEBT/EBITDAF RATIO1
905833
1,212 1,183 1,156
2.5 2.6
3.3
3.0 2.9
0.0
0.5
1.0
1.5
2.0
2.5
3.0
3.5
4.0
4.5
5.0
0
200
400
600
800
1000
1200
FY15 FY16 FY17 FY18 HY19
Net debt Net debt/EBITDAF Target debt ratio band (2.4 to 3.0)
Capital structure
— Net debt reduced by $27 million, credit metrics improving and within target band
• S&P reaffirmed BBB+ credit rating in January 2019
• $240m of Capital Bonds maturing in FY 2049 were issued on 16 July 2018 at a coupon rate of 4.65%. $200m of existing Capital Bonds with a coupon rate of 6.19% were redeemed at the same time.
• Dividend reinvestment plan (DRP) in place since the FY18 interim dividend with 29% of holders currently participating, representing 22% of all shares, and $38 million raised to date.
• Average debt tenor has increased to 12.3 years, from 11.4 years. Bank funding facilities have been renegotiated to achieve a longer tenor at a reduced overall cost.
1. Standard and Poor’s make a number of adjustments to Net Debt and EBITDAF for the purpose of calculating credit metrics. The most significant of these is the 50% equity treatment attributed to the Capital Bonds. HY19 calculation is based on actual debt at 31 December 2018 and the mid-point of the EBITDAF guidance range for FY19.
Genesis Energy Limited 1H FY19 Result Presentation 13.

Operational and Strategic Update

350,000
355,000
360,000
365,000
370,000
375,000
380,000
96%
98%
100%
102%
104%
106%
108%
Jan
-18
Feb
-18
Mar
-18
Ap
r-18
May
-18
Jun
-18
Jul-
18
Au
g-18
Sep
-18
Oct
-18
No
v-1
8
Dec
-18
Customers CLV Index (LHS)
8%
35%
0%
10%
20%
30%
40%
Jan
-18
Feb
-18
Mar
-18
Ap
r-18
May
-18
Jun
-18
Jul-
18
Au
g-18
Sep
-18
Oct
-18
No
v-1
8
Dec
-18
NPS - Genesis 3 Month Rolling Promoter - Genesis 3 Month Rolling
Customer brand, loyalty & engagement— Focus on multi-fuels and loyalty continues to drive down churn
RESIDENTIAL CUSTOMER GROSS2 CHURN DOWN 4.8 ppt, NET CHURN DOWN 3.4 ppt (HY AVERGAES)BRAND NPS UP 6 ppt AND PROMOTER SCORE UP 3 ppt IN 12 MONTHS
+6 ppt
+3 ppt
Genesis Energy Limited 1H FY19 Result Presentation 15.
DUAL FUEL CUSTOMERS1 UP 6.4% GROWTH AND CHURN DOWN TO 8.1% RESIDENTIAL CUSTOMER NUMBERS DOWN 1%, CUSTOMER LIFE VALUE INDEX3 (CLV) UP 6%
0%
2%
4%
6%
8%
10%
12%
94,000
96,000
98,000
100,000
102,000
Jan
-18
Feb
-18
Mar
-18
Ap
r-18
May
-18
Jun
-18
Jul-
18
Au
g-18
Sep
-18
Oct
-18
No
v-1
8
Dec
-18
Customers > 1 Product Dual Fuel Churn (RHS)
YoY GE Multi-fuel customers up 6.4%
CLV up 6%
1. Genesis residential customers, excluding EOL, with churn based on a 3 month rolling average.2. Gross churn (new disclosure) is defined as customers who instigated a trader switch or home move, whilst net churn is post home move save and retentions.3. Customer Lifetime Value is the margin for each customer, discounted over its expected tenure.
20.5%17.0% 17.1%
1.00
0.87 0.86
30.0%
50.0%
70.0%
90.0%
0.0%
10.0%
20.0%
30.0%
1H FY18 2H FY18 1H FY19
Net Churn Gross Churn Index
0%
20%
40%
60%
80%
Abandonment Grade of Service
HY18 HY19
1
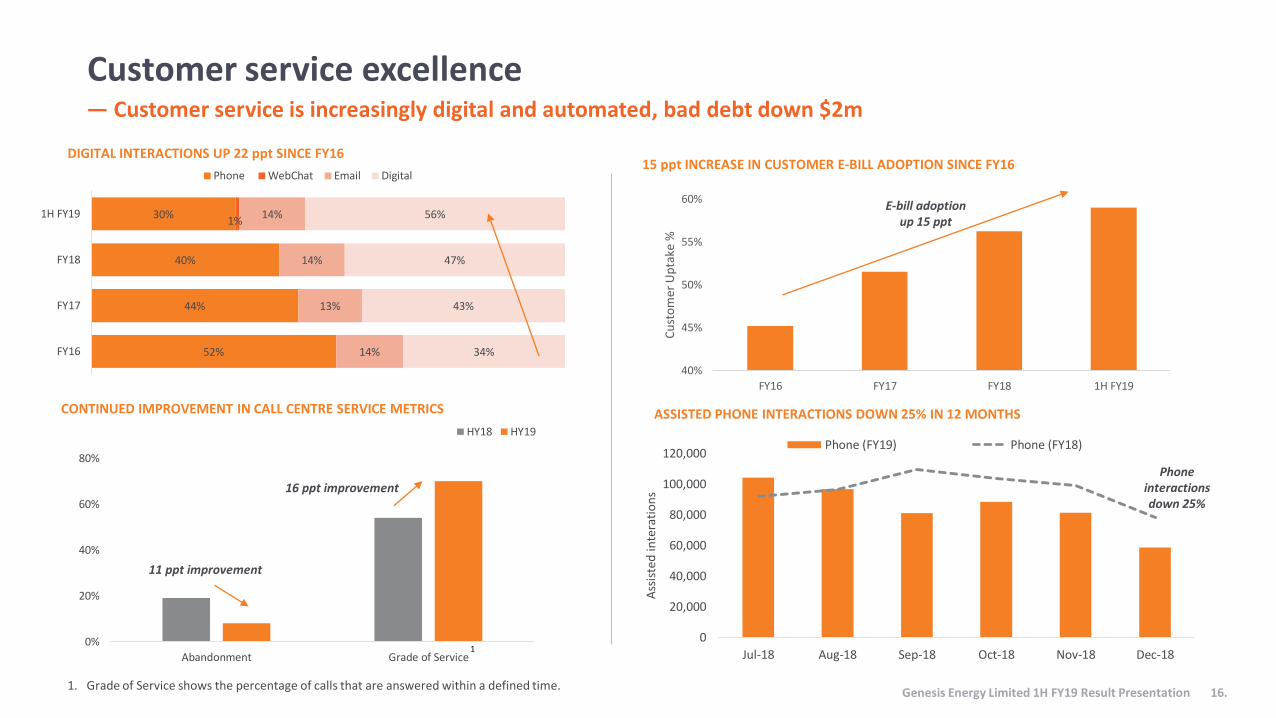
Customer service excellence— Customer service is increasingly digital and automated, bad debt down $2m
DIGITAL INTERACTIONS UP 22 ppt SINCE FY1615 ppt INCREASE IN CUSTOMER E-BILL ADOPTION SINCE FY16
Genesis Energy Limited 1H FY19 Result Presentation 16.
40%
45%
50%
55%
60%
FY16 FY17 FY18 1H FY19
Cu
sto
mer
Up
take
%
52%
44%
40%
30%1%
14%
13%
14%
14%
34%
43%
47%
56%
FY16
FY17
FY18
1H FY19
Phone WebChat Email Digital
CONTINUED IMPROVEMENT IN CALL CENTRE SERVICE METRICS
11 ppt improvement
16 ppt improvement
ASSISTED PHONE INTERACTIONS DOWN 25% IN 12 MONTHS
E-bill adoption up 15 ppt
1. Grade of Service shows the percentage of calls that are answered within a defined time.
0
20,000
40,000
60,000
80,000
100,000
120,000
Jul-18 Aug-18 Sep-18 Oct-18 Nov-18 Dec-18A
ssis
ted
inte
rati
on
s
Phone (FY19) Phone (FY18)
Phone interactions down 25%
$110
$115
$50
$70
$90
$110
$130
1,450
1,500
1,550
1,600
1,650
1,700
HY18 HY19
Sale
s V
olu
me
(GW
h)
Sales Volume Netback
$10.3 $10.3
$8.0
$9.0
$10.0
$11.0
$12.0
1,500
1,550
1,600
1,650
1,700
HY18 HY19
Sale
s V
olu
me
(GJ)
Sales Volume Netback
$762$745
$600
$650
$700
$750
$800
$850
7,250
7,500
7,750
8,000
8,250
8,500
8,750
HY18 HY19
Sale
s V
olu
me
(t)
Sales Volume Netback
$740
$861
$350
$550
$750
10,500
10,600
10,700
10,800
10,900
11,000
HY18 HY19
Sale
s V
olu
me
(t)
Sales Volume Netback
$87
$92
$50
$70
$90
$110
1,300
1,350
1,400
1,450
1,500
1,550
HY18 HY19
Sale
s V
olu
me
(GW
h)
Sales Volume Netback
$7.9 $7.8
$6.0
$7.0
$8.0
$9.0
$10.0
2,250
2,450
2,650
2,850
3,050
HY18 HY19
Sale
s V
olu
em (G
J)
Sales Volume Netback
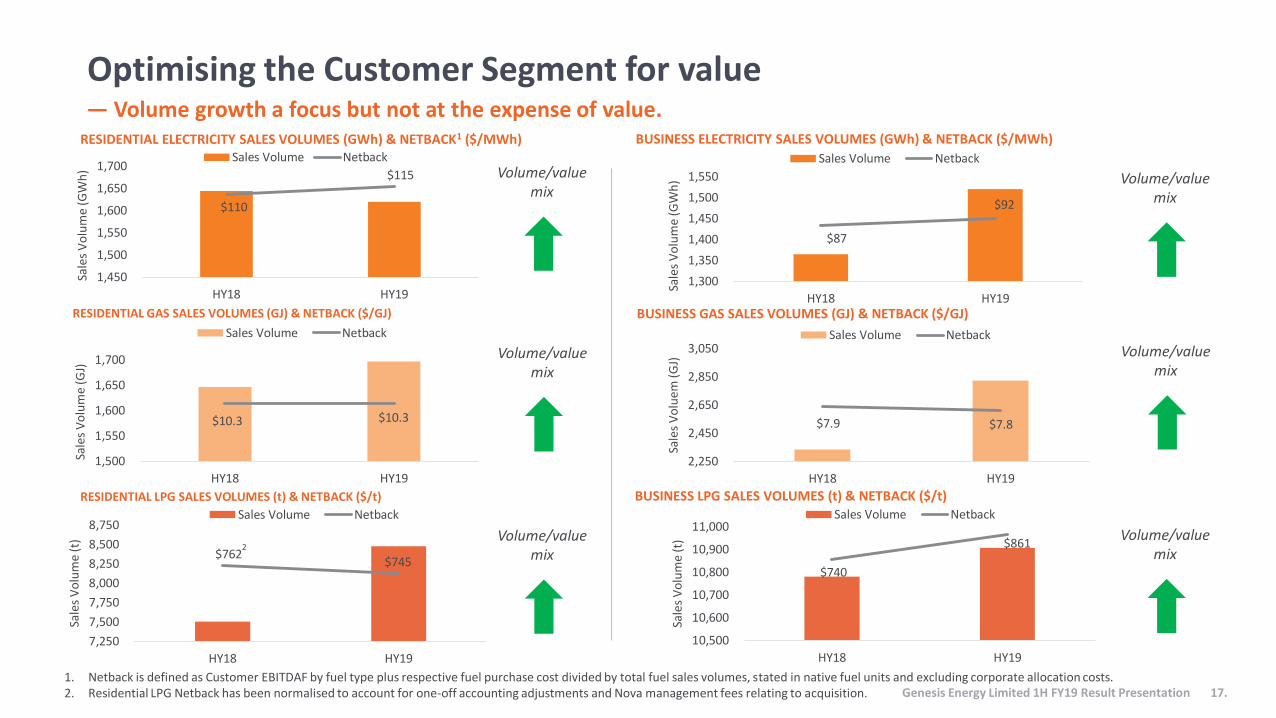
Optimising the Customer Segment for value— Volume growth a focus but not at the expense of value.
BUSINESS GAS SALES VOLUMES (GJ) & NETBACK ($/GJ)RESIDENTIAL GAS SALES VOLUMES (GJ) & NETBACK ($/GJ)
BUSINESS ELECTRICITY SALES VOLUMES (GWh) & NETBACK ($/MWh)RESIDENTIAL ELECTRICITY SALES VOLUMES (GWh) & NETBACK1 ($/MWh)
BUSINESS LPG SALES VOLUMES (t) & NETBACK ($/t)RESIDENTIAL LPG SALES VOLUMES (t) & NETBACK ($/t)
Volume/value mix
Volume/value mix
Volume/value mix
Volume/value mix
Volume/value mix
Volume/value mix
2
1. Netback is defined as Customer EBITDAF by fuel type plus respective fuel purchase cost divided by total fuel sales volumes, stated in native fuel units and excluding corporate allocation costs.2. Residential LPG Netback has been normalised to account for one-off accounting adjustments and Nova management fees relating to acquisition. Genesis Energy Limited 1H FY19 Result Presentation 17.

0.5
0.7
0.9
1.1
1.3
1.5
Jan
-18
Feb
-18
Mar
-18
Ap
r-18
May
-18
Jun
-18
Jul-
18
Au
g-18
Sep
-18
Oct
-18
No
v-1
8
Dec
-18
Sto
rage
as
% o
f A
vera
ge
National Storage Band Storage as % of Average
$0
$100
$200
$300
$400
$500
$600
Jul-18 Aug-18 Sep-18 Oct-18 Nov-18 Dec-18
$/M
Wh
Benmore (BEN2201) Otahuhu (OTA2201)
Gas shortages
Rankines crucial for national security of supply — Wholesale result moderated by gas shortages, planned 50-day Unit 5 outage, low storage and swaption calls
Genesis Energy Limited 1H FY19 Result Presentation 18.
SHORTAGE OF BOTH GAS AND WATER DRIVES WHOLESALE PRICE VOLATILITY, GWAP1 OF $146 MWH UP 52%
HVDC outage
A TIGHTER WHOLESALE MARKET RESPONDS QUICKLY TO HYDRO SHORTAGES
UNEXPECTED GAS SHORTAGES CREATE FURTHER ELECTRICITY SUPPLY SHORTAGES TOTAL GENERATION DOWN 12% TO 3,403 GWH HOWEVER RANKINES PERFORM WELL IN THEIR ROLE AS BACKUP TO THE MARKET FOR HYDRO AND GAS SHORTAGES
0
50
100
150
200
250
Jul-18 Aug-18 Sep-18 Oct-18 Nov-18 Dec-18G
Wh
Genesis Customers Backup Unit 5 (Pohokura & Planned Outage)
Backup Swaption Partners Backup Other Retailers & Spot Customers
Low storage
Low storage
U5 outage
1. GWAP is the average price received for generation, $/MWh.
0
50
100
150
200
250
Jan
-18
Feb
-18
Mar
-18
Ap
r-18
May
-18
Jun
-18
Jul-
18
Au
g-18
Sep
-18
Oct
-18
No
v-1
8
Dec
-18
TJ/D
ay
Pohokura Gas Deliveries Methanex DemandGas shortage,
higher gas demandGas shortage, lower gas demand
High storage

0.0
0.2
0.4
0.6
0.8
1.0
1.2
1.4
1.6
Jul-18 Aug-18 Sep-18 Oct-18 Nov-18 Dec-18
Pro
du
ctio
n (G
enes
is S
har
e, P
Je)
Gas Oil LPG
0.2% 0.2% 0.3% 0.1% 0.1% 0.3%0%
5%
10%
15%
20%
0%
20%
40%
60%
80%
100%
Jul-18 Aug-18 Sep-18 Oct-18 Nov-18 Dec-18
Forc
ed O
uta
ge F
acto
r (F
OF)
%
Equ
ipm
ent
Ava
ilab
ility
Fac
tor
(EA
F) %
Monthly EAF Monthly FOF
CONTINUED HIGH PLANT RELIABILITY – UNIT 5 MAINTENANCE DELIVERED ON TIME AND BELOW BUDGET
Plant reliability key in volatile market— However market making costs increase sharply due to ASX volatility
KUPE PRODUCTION DOWN DUE TO PLANNED MAINTENANCE (GENESIS SHARE, PJe)
Genesis Energy Limited 1H FY19 Result Presentation 19.
0
50
100
150
200
250
May
-16
Jul-
16
Sep
-16
No
v-1
6
Jan
-17
Mar
-17
May
-17
Jul-
17
Sep
-17
No
v-1
7
Jan
-18
Mar
-18
May
-18
Jul-
18
Sep
-18
No
v-1
8
MW
Quarterly ASX Contracts Monthly ASX Contracts Over-The-Counter Contracts
UNIT 5 OUTAGE COVERED THROUGH DERIVATIVE MARKET LIQUIDITY (NOVEMBER HEDGES ONLY)
VOLUNTARY MARKET MAKER COSTS INCREASE WITH VOLATILITY
Planned Maintenance at Kupe (coincided with Unit 5 Outage)
-$3.5
-$2.5
-$1.5
-$0.5
Jul-18 Aug-18 Sep-18 Oct-18 Nov-18 Dec-18
Mar
ket
Mak
ing
Loss
es Mill
ion
s
Unit 5 Outage
• Volatility results in market making losses, driven by financial market participants.
• ASX is a vital tool for portfolio risk management (see below).• Market making is voluntary and Genesis supports a review of
the current arrangements to ensure fair cost structures exists.

Enabling a more sustainable future
Caring for our environment
Building strong communities
Powering New Zealand
Genesis signed up to EV 100, a global businessinitiative driving the switch to EVs. December 2018
We’re driving electric -
now part of Genesis fleet
Whio population boosted
ducks released January 2019
EVs
November 2018
Ohope Beach School joins School-gen solar programmeNovember 2018
Emirates Team New Zealand & School-gen partner to bring STEM to schoolsDecember 2018
Genesis wins YWCA Equal Pay AwardNovember 2018
February 2019
School-gen Trust launches, providing
of STEM funding for schools
$,
November 2018
Employee volunteering revitalised
Hours already given back to communities
+
Waverley Wind Farm partnership announcedOctober 2018
MOU signed with DETA Consulting for energy management services to businessesOctober 2018
Genesis joins the NZ Hydrogen Association, supporting development of low emission fuel sourcesFebruary 2018
Bottles gas for Business launched –usage sensors minimize wasteOctober 2018
Genesis Energy Limited 1H FY19 Result Presentation 20.

Outlook and guidance— Updated guidance for FY19 EBITDAF is $360 to $375 million
Market Outlook
• 2H FY19 – wholesale market remains volatile with ongoing gas outages, drier conditions, uncertainty in the availability of competitor thermal plant. The FY19 guidance range reflects these conditions.
• Longer term electricity market supply and demand fundamentals continue to improve:
• 4th potline at Tiwai has been reinstated. ASX Year 3 OTA forward curve has lifted $15 to trade at $90/MWh since July 18.
• Uncertainty in longer term gas supply market remains, beyond current outage phase.
FY19 Guidance
• FY19 EBITDAF guidance range is $360 to $375 million subject to hydrological conditions, gas availability, any material events, one-off expenses or other unforeseeable circumstances.
• FY19 capital expenditure guidance is unchanged at up to $85 million.
FY20 Guidance
• Beach Energy has confirmed a 35 day shutdown of Kupe for cyclical maintenance – FY20 EBITDAF impact of $8 to $10 million.
Genesis Energy Limited 1H FY19 Result Presentation 22.

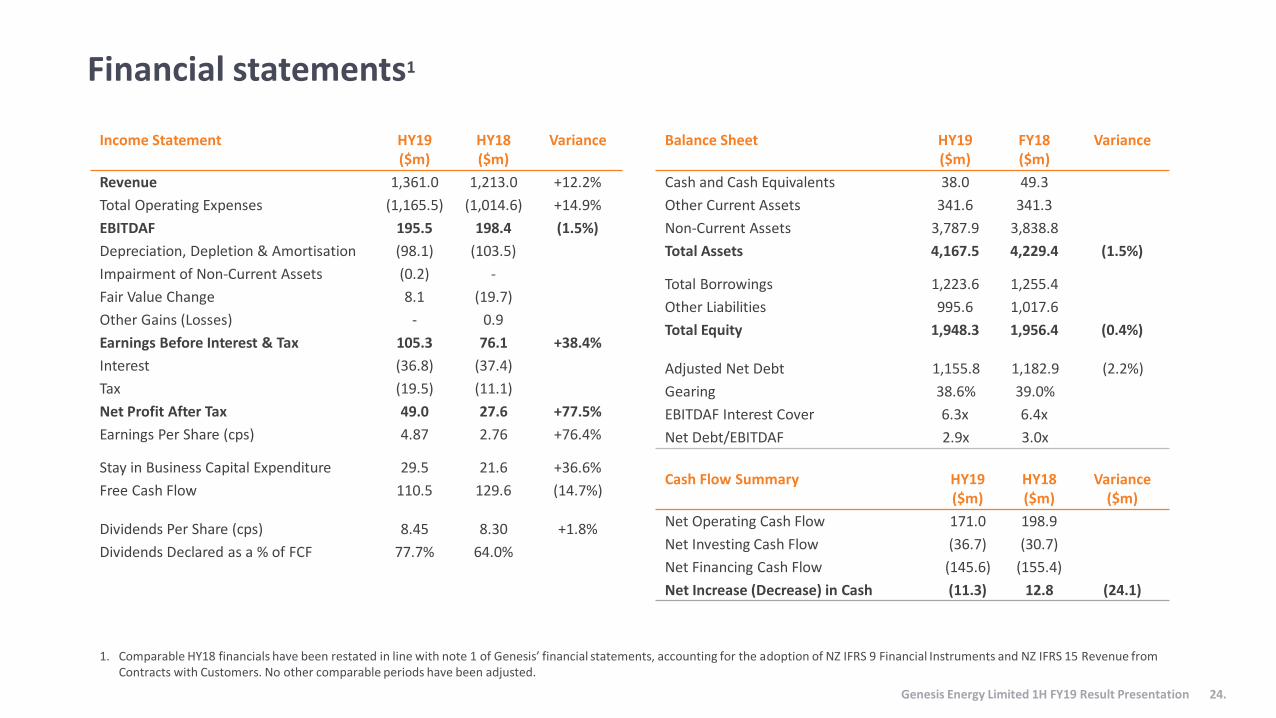
Balance Sheet HY19($m)
FY18($m)
Variance
Cash and Cash Equivalents 38.0 49.3
Other Current Assets 341.6 341.3
Non-Current Assets 3,787.9 3,838.8
Total Assets 4,167.5 4,229.4 (1.5%)
Total Borrowings 1,223.6 1,255.4
Other Liabilities 995.6 1,017.6
Total Equity 1,948.3 1,956.4 (0.4%)
Adjusted Net Debt 1,155.8 1,182.9 (2.2%)
Gearing 38.6% 39.0%
EBITDAF Interest Cover 6.3x 6.4x
Net Debt/EBITDAF 2.9x 3.0x
Income Statement HY19($m)
HY18($m)
Variance
Revenue 1,361.0 1,213.0 +12.2%
Total Operating Expenses (1,165.5) (1,014.6) +14.9%
EBITDAF 195.5 198.4 (1.5%)
Depreciation, Depletion & Amortisation (98.1) (103.5)
Impairment of Non-Current Assets (0.2) -
Fair Value Change 8.1 (19.7)
Other Gains (Losses) - 0.9
Earnings Before Interest & Tax 105.3 76.1 +38.4%
Interest (36.8) (37.4)
Tax (19.5) (11.1)
Net Profit After Tax 49.0 27.6 +77.5%
Earnings Per Share (cps) 4.87 2.76 +76.4%
Stay in Business Capital Expenditure 29.5 21.6 +36.6%
Free Cash Flow 110.5 129.6 (14.7%)
Dividends Per Share (cps) 8.45 8.30 +1.8%
Dividends Declared as a % of FCF 77.7% 64.0%
Cash Flow Summary HY19($m)
HY18($m)
Variance($m)
Net Operating Cash Flow 171.0 198.9
Net Investing Cash Flow (36.7) (30.7)
Net Financing Cash Flow (145.6) (155.4)
Net Increase (Decrease) in Cash (11.3) 12.8 (24.1)
Financial statements1
Genesis Energy Limited 1H FY19 Result Presentation 24.
1. Comparable HY18 financials have been restated in line with note 1 of Genesis’ financial statements, accounting for the adoption of NZ IFRS 9 Financial Instruments and NZ IFRS 15 Revenue from Contracts with Customers. No other comparable periods have been adjusted.
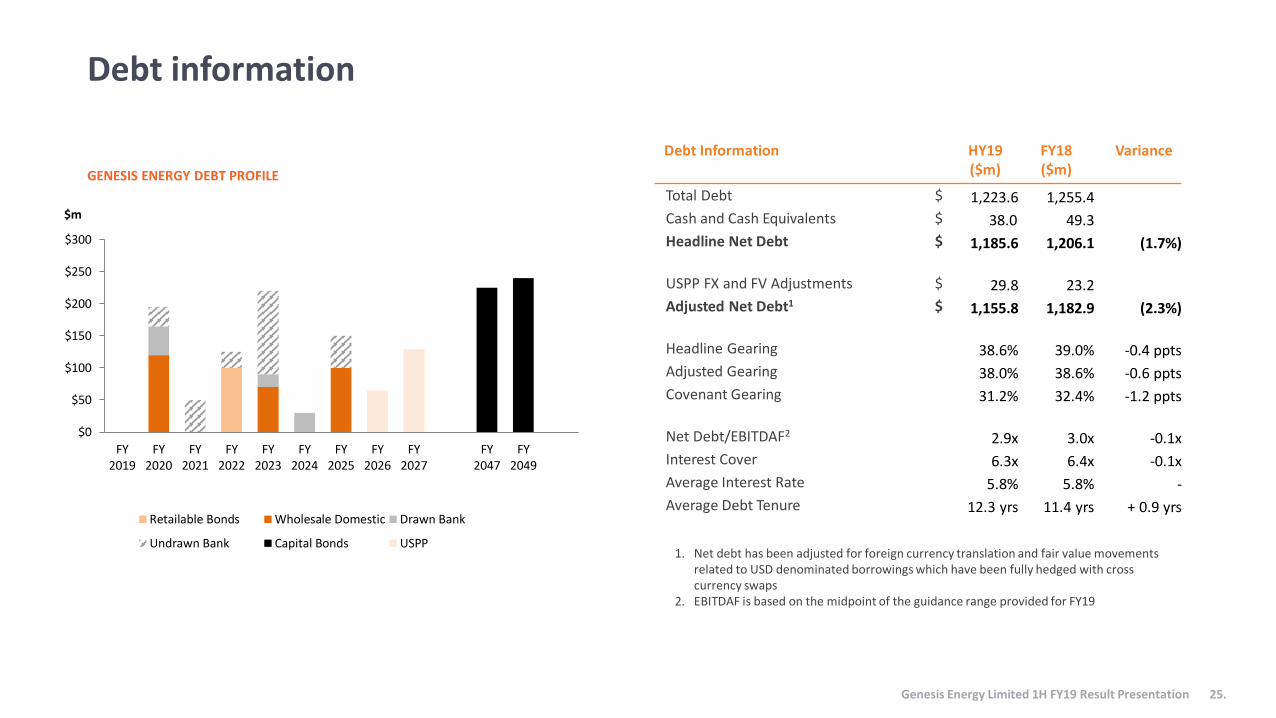
Debt Information HY19($m)
FY18($m)
Variance
Total Debt $ 1,223.6 1,255.4
Cash and Cash Equivalents $ 38.0 49.3
Headline Net Debt $ 1,185.6 1,206.1 (1.7%)
USPP FX and FV Adjustments $ 29.8 23.2
Adjusted Net Debt1 $ 1,155.8 1,182.9 (2.3%)
Headline Gearing 38.6% 39.0% -0.4 ppts
Adjusted Gearing 38.0% 38.6% -0.6 ppts
Covenant Gearing 31.2% 32.4% -1.2 ppts
Net Debt/EBITDAF2 2.9x 3.0x -0.1x
Interest Cover 6.3x 6.4x -0.1x
Average Interest Rate 5.8% 5.8% -
Average Debt Tenure 12.3 yrs 11.4 yrs + 0.9 yrs
1. Net debt has been adjusted for foreign currency translation and fair value movements related to USD denominated borrowings which have been fully hedged with cross currency swaps
2. EBITDAF is based on the midpoint of the guidance range provided for FY19
GENESIS ENERGY DEBT PROFILE
Debt information
Genesis Energy Limited 1H FY19 Result Presentation 25.
$0
$50
$100
$150
$200
$250
$300
FY2019
FY2020
FY2021
FY2022
FY2023
FY2024
FY2025
FY2026
FY2027
FY2047
FY2049
$m
Retailable Bonds Wholesale Domestic Drawn Bank
Undrawn Bank Capital Bonds USPP

Wholesale Key Information HY19 HY18 Variance
EBITDAF ($ millions) 103.8 106.4 (2.4%)
Renewable Generation (GWh) 1,713 1,697 +0.9%
Thermal Generation (GWh) 1,690 2,173 (22.2%)
Total Generation (GWh) 3,403 3,870 (12.1%)
GWAP ($/MWh) $146.32 $96.16 +52.2%
LWAP/GWAP Ratio 97% 103% +6 ppts
Weighted Average Fuel Cost ($/MWh) $33.90 $35.72 (5.1%)
Coal/Gas Mix (Rankines only) 85/15 62/38
Kupe Key Information HY19 HY18 Variance
EBITDAF ($m) 52.5 55.7 (5.7%)
Gas Production (PJ) 5.7 6.1 (6.6%)
Gas Sales (PJ) 5.5 6.1 (9.8%)
Oil Production (kbbl) 235 281 (16.4%)
Oil Sales (kbbl) 168 241 (30.3%)
LPG Production (kt) 23.6 22.4 +5.4%
LPG Sales (kt) 23.7 22.7 +4.4%
Average Brent Crude Oil (USD/bbl) $71.52 $56.74 +26.0%
Realised Oil Price (NZD/bbl) $91.12 $78.24 +16.5%
Operational highlights
Genesis Energy Limited 1H FY19 Result Presentation 26.
Customer Key Information HY19 HY18 Variance
EBITDAF ($ millions) 61.7 56.1 +10.0%
Electricity Netback ($/MWh) $103.98 $99.75 +4.2%
Gas Netback ($/GJ) $8.73 $8.91 (2.0%)
LPG Netback ($/t) $810.26 $781.86 +3.6%
Customers with > 1 Fuel 113,549 105,758
Electricity Only Customers 335,332 345,832
Gas Only Customers 17,440 18,509
LPG Only Customers 34,770 34,534
Total Customers 501,091 504,633 (0.7%)
Total Electricity, Gas and LPG ICP’s 674,387 667,273 +1.1%
Volume Weighted Average Electricity Selling Price – Resi ($/MWh)
$251.62 $248.52 +1.2%
Volume Weighted Average Electricity Selling Price – SME ($/MWh)
$220.02 $216.03 +1.8%
Volume Weighted Average Electricity Selling Price – C&I ($/MWh)
$126.20 $120.45 +4.8%
Volume Weighted Average Gas Selling Price ($/GJ)
$24.25 $25.59 (5.2%)
Volume Weighted Average LPG Selling Price ($/tonne)
$1,764.42 $1,828.90 (3.5%)
Customer Electricity Sales (GWh) 3,139 3,008 +4.4%
Customer Gas Sales (PJ) 4.5 4.0 +12.5%
Customer LPG Sales (tonnes) 19,380 18,281 +6.0%
Health & Safety Information HY19 HY18 Variance
Total Recordable Injury Frequency Rate 1.11 1.44 (0.33pt)

Disclaimer
This presentation has been prepared by Genesis Energy Limited (‘Genesis Energy’) for information purposes only. The information in this presentation is of a general nature and does not purport to be complete nor does it contain all the information required for an investor to evaluate an investment. This presentation may contain projections or forward-looking statements regarding a variety of items. Such forward-looking statements are based upon current expectations and involve risks and uncertainties. Actual results may differ materially from those stated in any forward-looking statement based on a number of important factors and risks.
Although management may indicate and believe that the assumptions underlying the forward-looking statements are reasonable, any of the assumptions could prove inaccurate or incorrect and, therefore, there can be no assurance that the results contemplated in the forward-looking statements will be realised. EBITDAF, underlying profit and free cash flow are non-GAAP (generally accepted accounting practice) measures. While all reasonable care has been taken in compiling this presentation, to the maximum extentpermitted by law Genesis Energy accepts no responsibility for any errors or omissions and no representation is made as to theaccuracy, completeness or reliability of the information. This presentation does not constitute investment advice.
Genesis Energy Limited 1H FY19 Result Presentation 27.