Embed Size (px)
Citation preview
Abacus Property Group – 2018 Half Year Results Presentation
‘It’s all about the property’
HY18 Results Presentation
187 Todd Road, Port Melbourne VIC
Abacus Property Group – 2018 Half Year Results Presentation
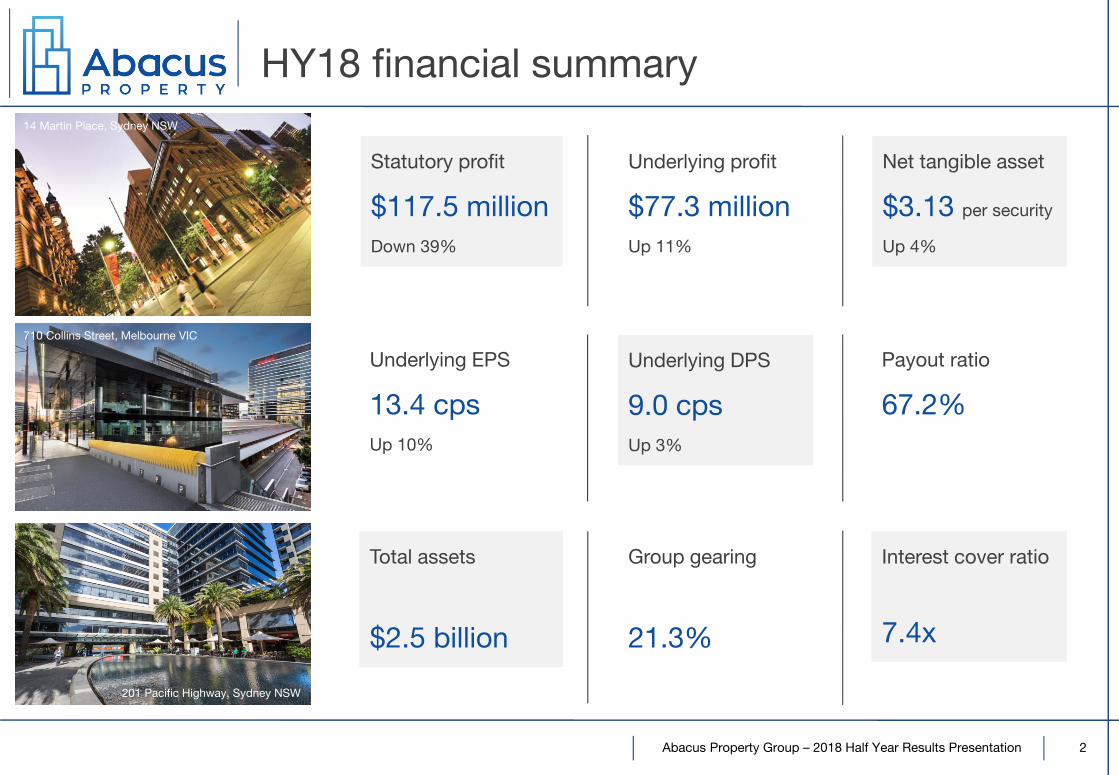
HY18 financial summary
2
Statutory profit
$117.5 millionDown 39%
Underlying profit
$77.3 millionUp 11%
Underlying EPS
13.4 cpsUp 10%
Payout ratio
67.2%
710 Collins Street, Melbourne VIC
14 Martin Place, Sydney NSW
Underlying DPS
9.0 cpsUp 3%
Net tangible asset
$3.13 per security
Up 4%
Total assets
$2.5 billion
Interest cover ratio
7.4x
Group gearing
21.3%
201 Pacific Highway, Sydney NSW
Abacus Property Group – 2018 Half Year Results Presentation 3
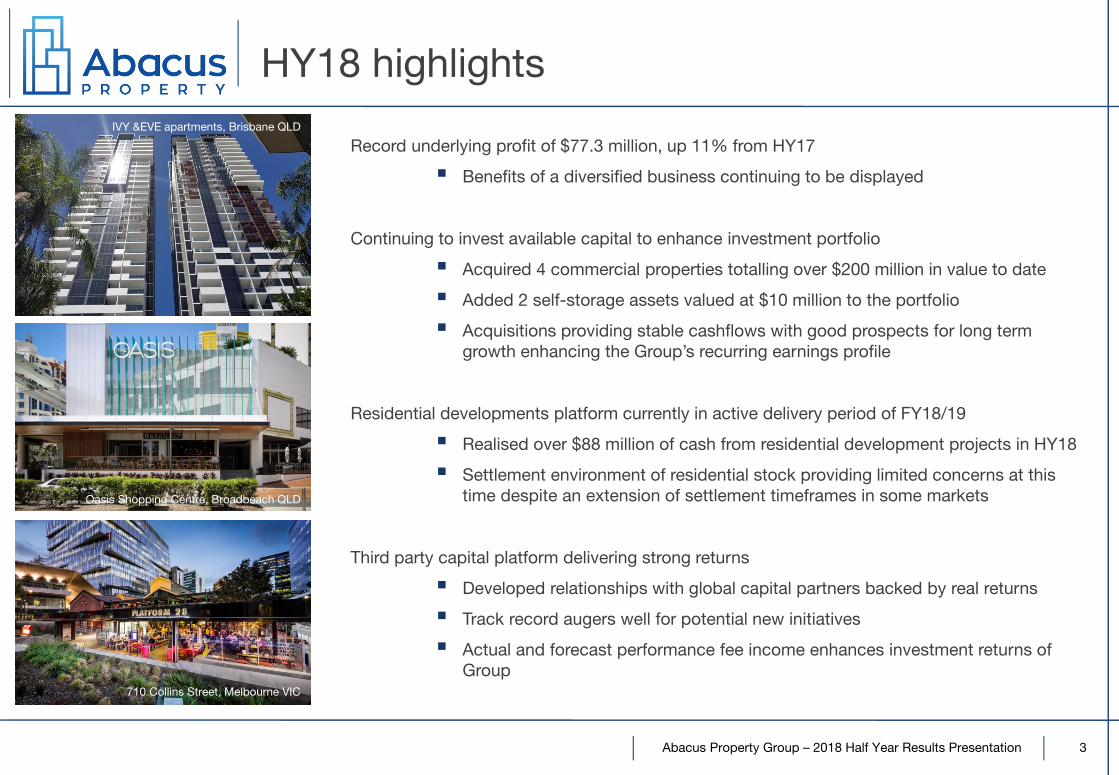
Record underlying profit of $77.3 million, up 11% from HY17
Benefits of a diversified business continuing to be displayed
Continuing to invest available capital to enhance investment portfolio
Acquired 4 commercial properties totalling over $200 million in value to date
Added 2 self-storage assets valued at $10 million to the portfolio
Acquisitions providing stable cashflows with good prospects for long term growth enhancing the Group’s recurring earnings profile
Residential developments platform currently in active delivery period of FY18/19
Realised over $88 million of cash from residential development projects in HY18
Settlement environment of residential stock providing limited concerns at this time despite an extension of settlement timeframes in some markets
Third party capital platform delivering strong returns
Developed relationships with global capital partners backed by real returns
Track record augers well for potential new initiatives
Actual and forecast performance fee income enhances investment returns of Group
710 Collins Street, Melbourne VIC
Oasis Shopping Centre, Broadbeach QLD
IVY &EVE apartments, Brisbane QLD
HY18 highlights
Abacus Property Group – 2018 Half Year Results Presentation
Financial results and capital management
324 Queen Street, Brisbane QLD
Abacus Property Group – 2018 Half Year Results Presentation
Diversified business delivers strong results
5
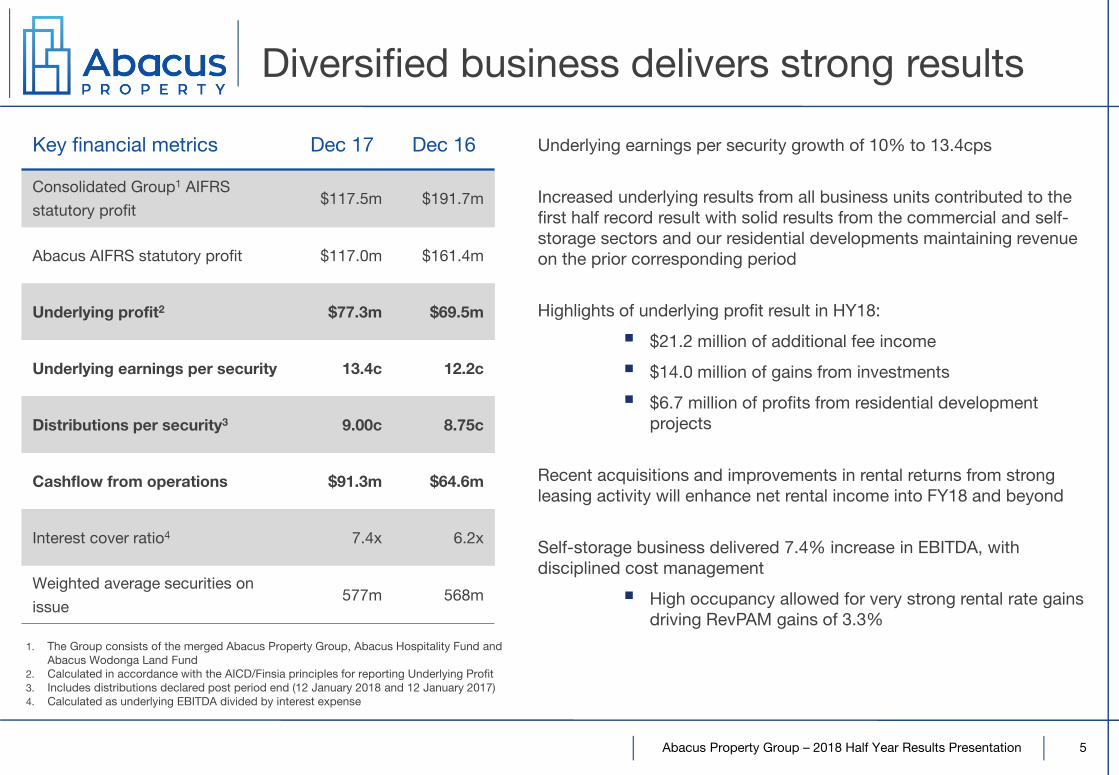
Key financial metrics Dec 17 Dec 16
Consolidated Group1 AIFRS
statutory profit$117.5m $191.7m
Abacus AIFRS statutory profit $117.0m $161.4m
Underlying profit2 $77.3m $69.5m
Underlying earnings per security 13.4c 12.2c
Distributions per security3 9.00c 8.75c
Cashflow from operations $91.3m $64.6m
Interest cover ratio4 7.4x 6.2x
Weighted average securities on
issue577m 568m
1. The Group consists of the merged Abacus Property Group, Abacus Hospitality Fund and Abacus Wodonga Land Fund
2. Calculated in accordance with the AICD/Finsia principles for reporting Underlying Profit3. Includes distributions declared post period end (12 January 2018 and 12 January 2017)4. Calculated as underlying EBITDA divided by interest expense
Underlying earnings per security growth of 10% to 13.4cps
Increased underlying results from all business units contributed to the first half record result with solid results from the commercial and self-storage sectors and our residential developments maintaining revenue on the prior corresponding period
Highlights of underlying profit result in HY18:
$21.2 million of additional fee income
$14.0 million of gains from investments
$6.7 million of profits from residential development projects
Recent acquisitions and improvements in rental returns from strong leasing activity will enhance net rental income into FY18 and beyond
Self-storage business delivered 7.4% increase in EBITDA, with disciplined cost management
High occupancy allowed for very strong rental rate gains driving RevPAM gains of 3.3%
Abacus Property Group – 2018 Half Year Results Presentation 6
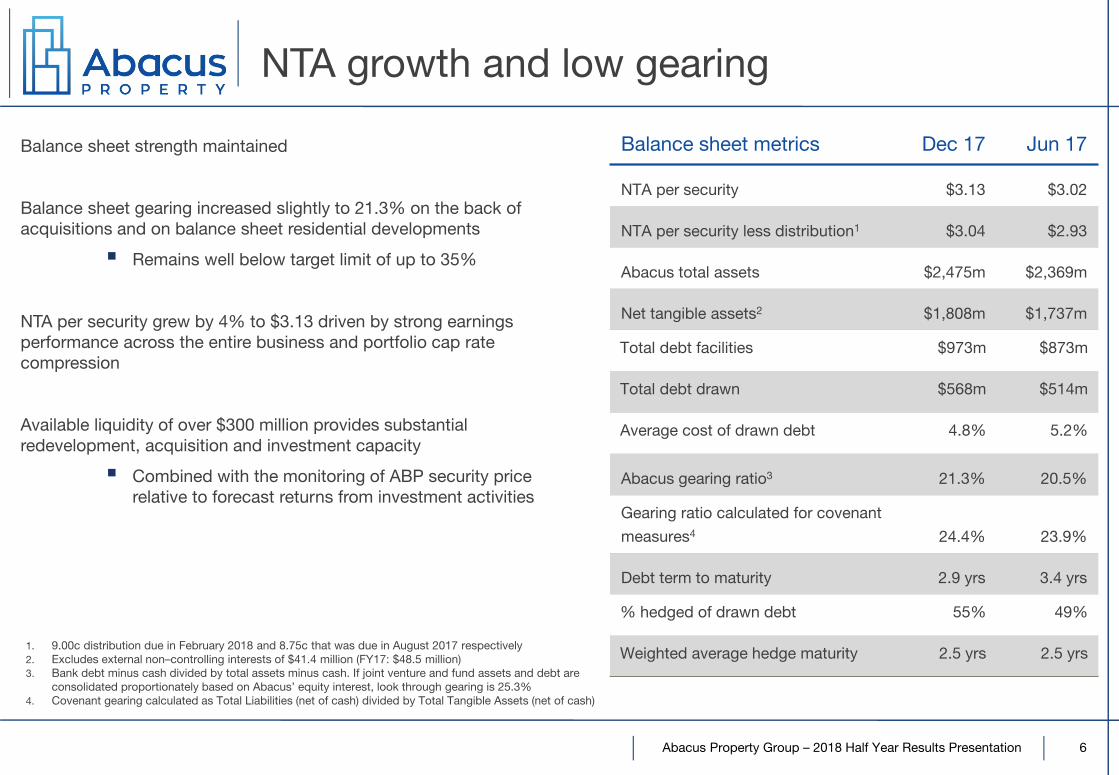
Balance sheet metrics Dec 17 Jun 17
NTA per security $3.13 $3.02
NTA per security less distribution1 $3.04 $2.93
Abacus total assets $2,475m $2,369m
Net tangible assets2 $1,808m $1,737m
Total debt facilities $973m $873m
Total debt drawn $568m $514m
Average cost of drawn debt 4.8% 5.2%
Abacus gearing ratio3 21.3% 20.5%
Gearing ratio calculated for covenant
measures4 24.4% 23.9%
Debt term to maturity 2.9 yrs 3.4 yrs
% hedged of drawn debt 55% 49%
Weighted average hedge maturity 2.5 yrs 2.5 yrs1. 9.00c distribution due in February 2018 and 8.75c that was due in August 2017 respectively2. Excludes external non–controlling interests of $41.4 million (FY17: $48.5 million)3. Bank debt minus cash divided by total assets minus cash. If joint venture and fund assets and debt are
consolidated proportionately based on Abacus’ equity interest, look through gearing is 25.3%4. Covenant gearing calculated as Total Liabilities (net of cash) divided by Total Tangible Assets (net of cash)
Balance sheet strength maintained
Balance sheet gearing increased slightly to 21.3% on the back of acquisitions and on balance sheet residential developments
Remains well below target limit of up to 35%
NTA per security grew by 4% to $3.13 driven by strong earnings performance across the entire business and portfolio cap rate compression
Available liquidity of over $300 million provides substantial redevelopment, acquisition and investment capacity
Combined with the monitoring of ABP security price relative to forecast returns from investment activities
NTA growth and low gearing
Abacus Property Group – 2018 Half Year Results Presentation
Investment portfolio overview
710 Collins Street. Melbourne VIC
Abacus Property Group – 2018 Half Year Results Presentation 8
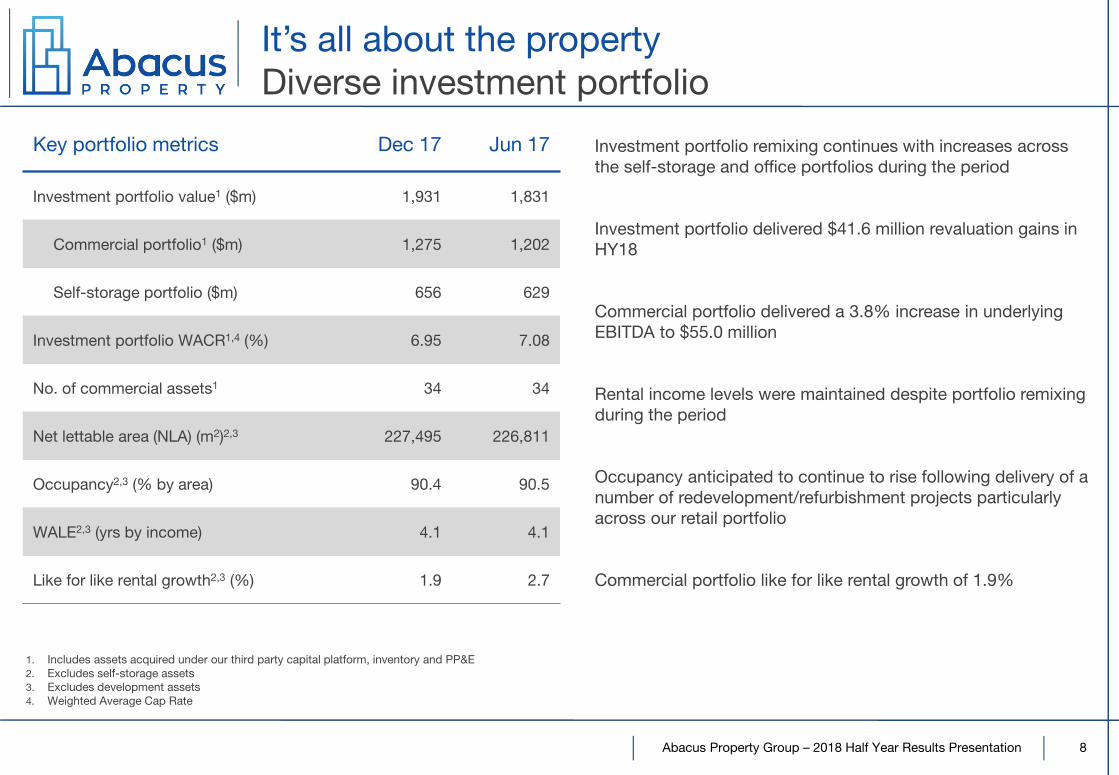
Investment portfolio remixing continues with increases across the self-storage and office portfolios during the period
Investment portfolio delivered $41.6 million revaluation gains in HY18
Commercial portfolio delivered a 3.8% increase in underlying EBITDA to $55.0 million
Rental income levels were maintained despite portfolio remixing during the period
Occupancy anticipated to continue to rise following delivery of a number of redevelopment/refurbishment projects particularly across our retail portfolio
Commercial portfolio like for like rental growth of 1.9%
Key portfolio metrics Dec 17 Jun 17
Investment portfolio value1 ($m) 1,931 1,831
Commercial portfolio1 ($m) 1,275 1,202
Self-storage portfolio ($m) 656 629
Investment portfolio WACR1,4 (%) 6.95 7.08
No. of commercial assets1 34 34
Net lettable area (NLA) (m2)2,3 227,495 226,811
Occupancy2,3 (% by area) 90.4 90.5
WALE2,3 (yrs by income) 4.1 4.1
Like for like rental growth2,3 (%) 1.9 2.7
1. Includes assets acquired under our third party capital platform, inventory and PP&E 2. Excludes self-storage assets3. Excludes development assets4. Weighted Average Cap Rate
It’s all about the propertyDiverse investment portfolio
Abacus Property Group – 2018 Half Year Results Presentation 9
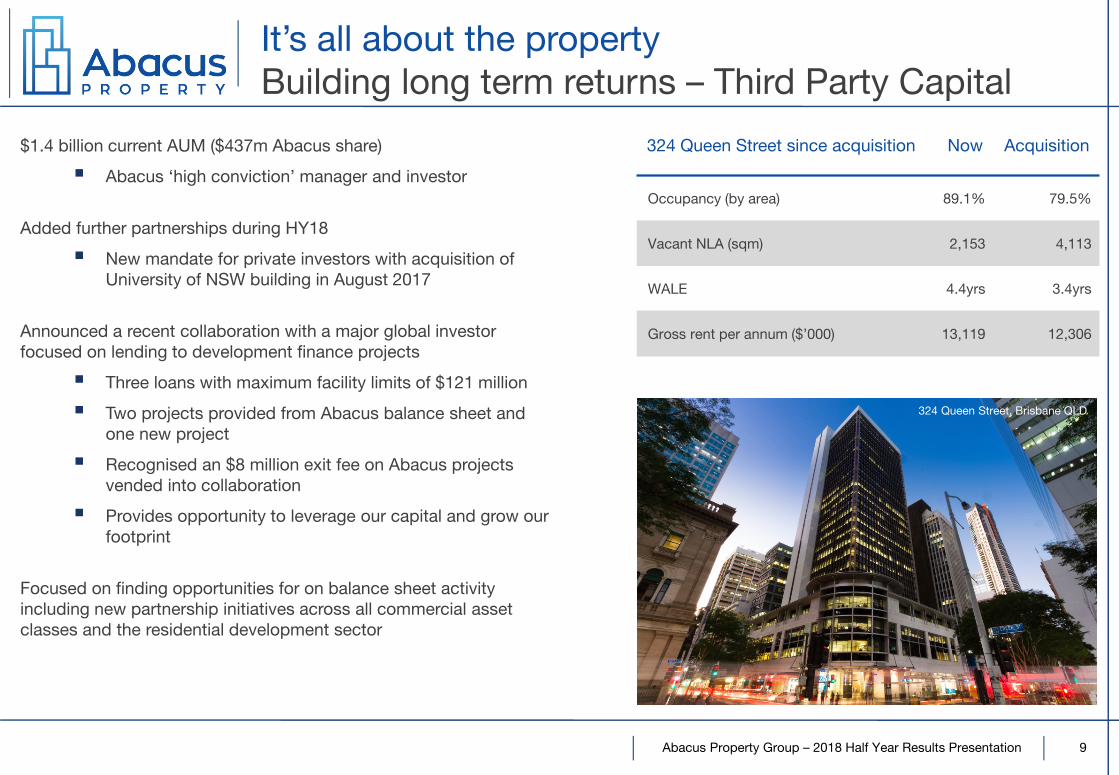
It’s all about the propertyBuilding long term returns – Third Party Capital
$1.4 billion current AUM ($437m Abacus share)
Abacus ‘high conviction’ manager and investor
Added further partnerships during HY18
New mandate for private investors with acquisition of University of NSW building in August 2017
Announced a recent collaboration with a major global investor focused on lending to development finance projects
Three loans with maximum facility limits of $121 million
Two projects provided from Abacus balance sheet and one new project
Recognised an $8 million exit fee on Abacus projects vended into collaboration
Provides opportunity to leverage our capital and grow our footprint
Focused on finding opportunities for on balance sheet activity including new partnership initiatives across all commercial asset classes and the residential development sector
324 Queen Street, Brisbane QLD
324 Queen Street since acquisition Now Acquisition
Occupancy (by area) 89.1% 79.5%
Vacant NLA (sqm) 2,153 4,113
WALE 4.4yrs 3.4yrs
Gross rent per annum ($’000) 13,119 12,306
Abacus Property Group – 2018 Half Year Results Presentation 10
Key focus is acquiring assets that will create value over the long term
Office:
Yield spread between CBD and metropolitan/fringe assets remains meaningful
Greater tenant stability in city fringe markets than in the CBD which can fluctuate wildly with economic cycles
To benefit from greater tenant stability requires landlords to focus on assets with a point of difference which will attract/retain tenants
There is a growing recognition that office landlords have to recognise the specific expectations of millennials
Tenant stability, incentive environment and greater affordability drives investment returns
Abacus therefore is looking for assets with low relative base rents and solid cashflows in city fringe locations
Locations with either low upcoming supply or areas of gentrification/urban renewal
Main focus areas include Melbourne and Sydney fringe markets
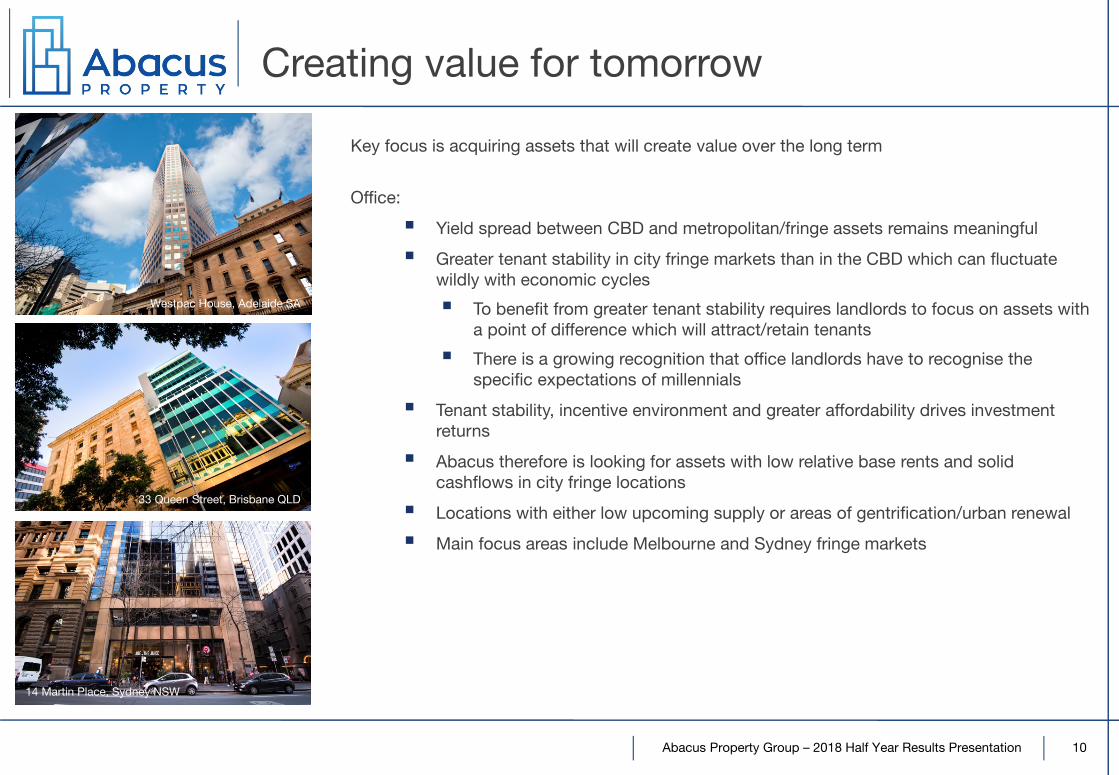
14 Martin Place, Sydney NSW
33 Queen Street, Brisbane QLD
Westpac House, Adelaide SA
Creating value for tomorrow
Abacus Property Group – 2018 Half Year Results Presentation 11
Self-storage:
Self-storage industry has performed strongly over the last 5 years driven by increased demand from Australian consumers
Key external drivers suggest continued growth in demand for storage space over the medium term
Increased levels of urbanisation
Increasing levels of online shopping
High levels of housing transfers
Larger industry operators have remained aggressive acquirers of established facilities pushing yields lower and putting pressure of investment returns
Abacus will continue to expand and grow our exposure to the sector
Growth through acquisition of established facilities remains possible although competition is strong
Abacus anticipates growth through development of new facilities via conversion of non-storage assets into self-storage facilities as the best use of capital at this point in the cycle
Abacus will also progress expansion programs across its existing portfolio to maximise returns
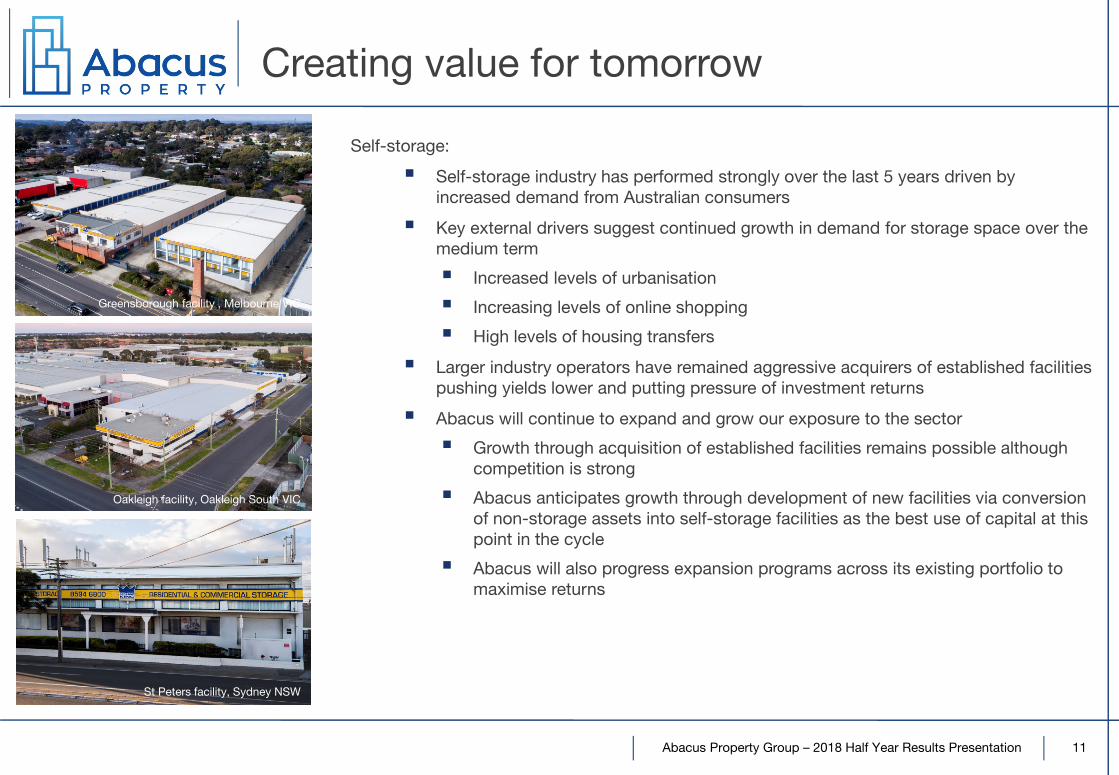
St Peters facility, Sydney NSW
Oakleigh facility, Oakleigh South VIC
Greensborough facility , Melbourne VIC
Creating value for tomorrow
Abacus Property Group – 2018 Half Year Results Presentation 12
Retail:
The retail landscape is in a state of flux
Physical retail will remain robust – irrelevant and unremarkable retail is dead
Retail thematic focused on Buying vs Shopping
Buying is focussed on task orientated, seeking value and convenience – drives our super convenience thematic for sub-regional and neighbourhood centres
Shopping is experiential, social, tactile with access to physical stores paramount – driving the super regional thematic
Abacus is focused on inner suburban traders that dominate the convenience markets with proximity to transport hubs with sufficient parking infrastructure
Assets with ability to incorporate up to 3 national brand supermarkets and minimal discretionary retail. This defines our super convenience model which should enable our centres to control their catchment
Investigating options for potential third party investors to partner with
Industrial:
Abacus has only a small exposure to industrial properties, seeing our self-storage portfolio as a surrogate
Historically our greatest returns in industrial have resulted from assets on large parcels of land
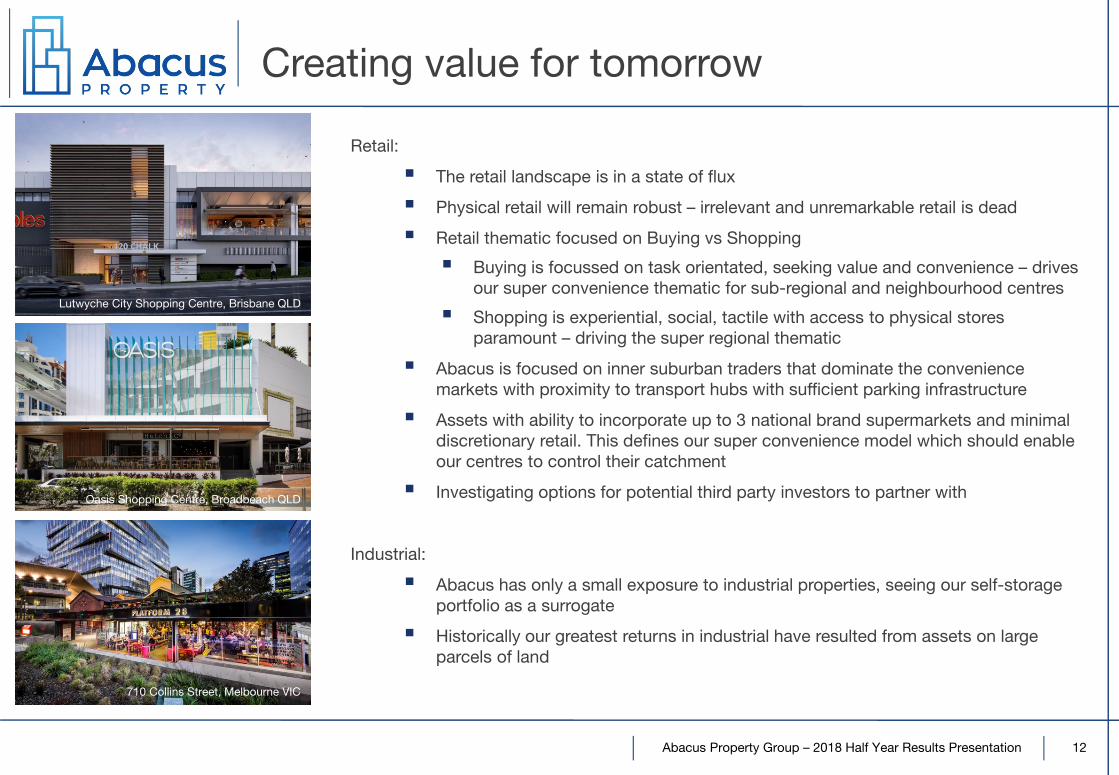
710 Collins Street, Melbourne VIC
Oasis Shopping Centre, Broadbeach QLD
Lutwyche City Shopping Centre, Brisbane QLD
Creating value for tomorrow
Abacus Property Group – 2018 Half Year Results Presentation
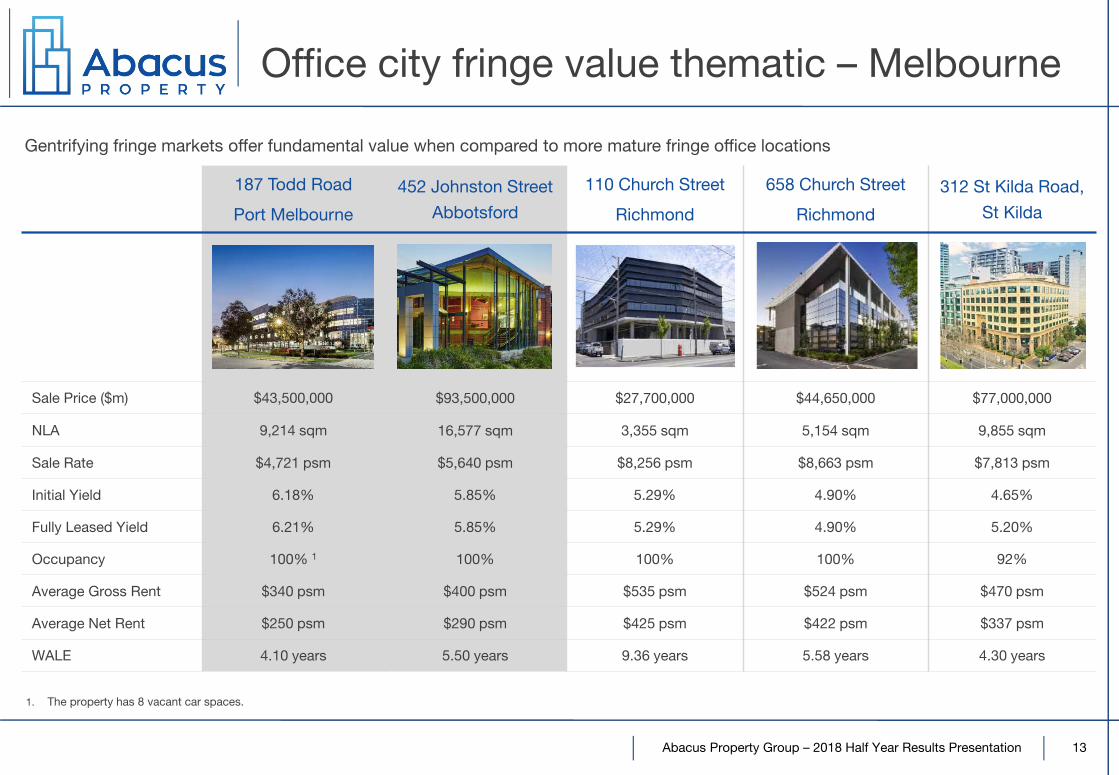
187 Todd Road
Port Melbourne
452 Johnston Street
Abbotsford
110 Church Street
Richmond
658 Church Street
Richmond
312 St Kilda Road,
St Kilda
Sale Price ($m) $43,500,000 $93,500,000 $27,700,000 $44,650,000 $77,000,000
NLA 9,214 sqm 16,577 sqm 3,355 sqm 5,154 sqm 9,855 sqm
Sale Rate $4,721 psm $5,640 psm $8,256 psm $8,663 psm $7,813 psm
Initial Yield 6.18% 5.85% 5.29% 4.90% 4.65%
Fully Leased Yield 6.21% 5.85% 5.29% 4.90% 5.20%
Occupancy 100% 1 100% 100% 100% 92%
Average Gross Rent $340 psm $400 psm $535 psm $524 psm $470 psm
Average Net Rent $250 psm $290 psm $425 psm $422 psm $337 psm
WALE 4.10 years 5.50 years 9.36 years 5.58 years 4.30 years
Office city fringe value thematic – Melbourne
Gentrifying fringe markets offer fundamental value when compared to more mature fringe office locations
1. The property has 8 vacant car spaces.
13
Abacus Property Group – 2018 Half Year Results Presentation
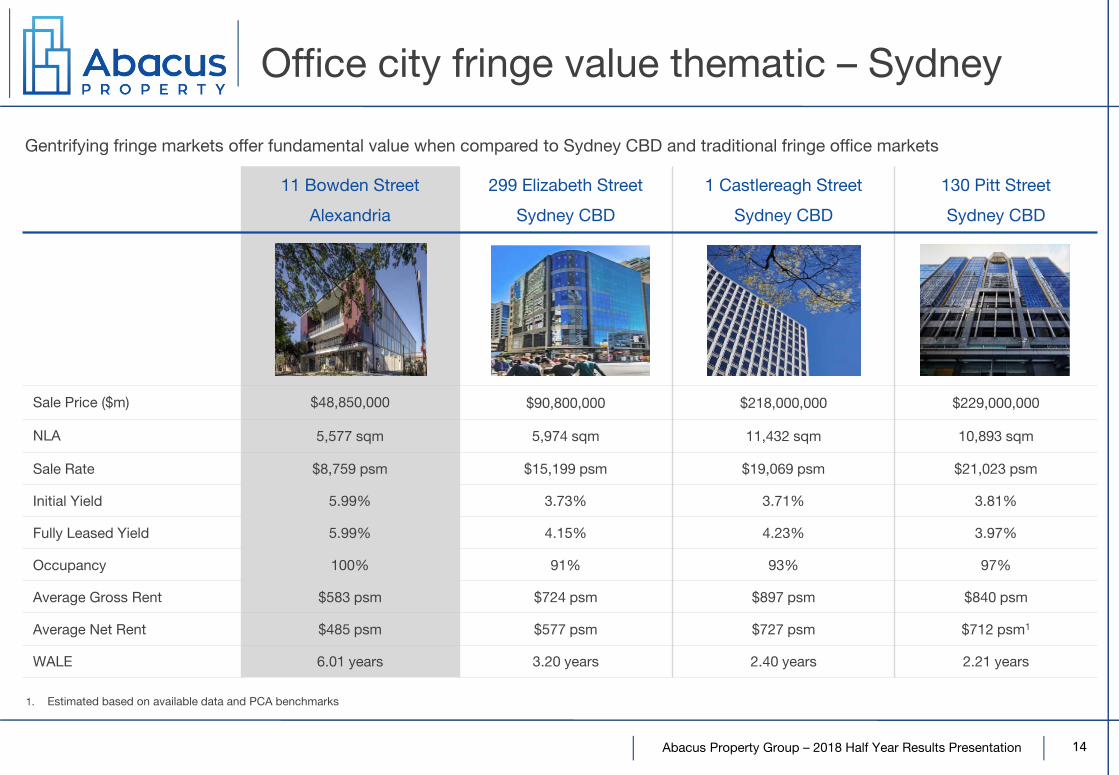
11 Bowden Street
Alexandria
299 Elizabeth Street
Sydney CBD
1 Castlereagh Street
Sydney CBD
130 Pitt Street
Sydney CBD
Sale Price ($m) $48,850,000 $90,800,000 $218,000,000 $229,000,000
NLA 5,577 sqm 5,974 sqm 11,432 sqm 10,893 sqm
Sale Rate $8,759 psm $15,199 psm $19,069 psm $21,023 psm
Initial Yield 5.99% 3.73% 3.71% 3.81%
Fully Leased Yield 5.99% 4.15% 4.23% 3.97%
Occupancy 100% 91% 93% 97%
Average Gross Rent $583 psm $724 psm $897 psm $840 psm
Average Net Rent $485 psm $577 psm $727 psm $712 psm1
WALE 6.01 years 3.20 years 2.40 years 2.21 years
14
Gentrifying fringe markets offer fundamental value when compared to Sydney CBD and traditional fringe office markets
1. Estimated based on available data and PCA benchmarks
Office city fringe value thematic – Sydney
Abacus Property Group – 2018 Half Year Results Presentation
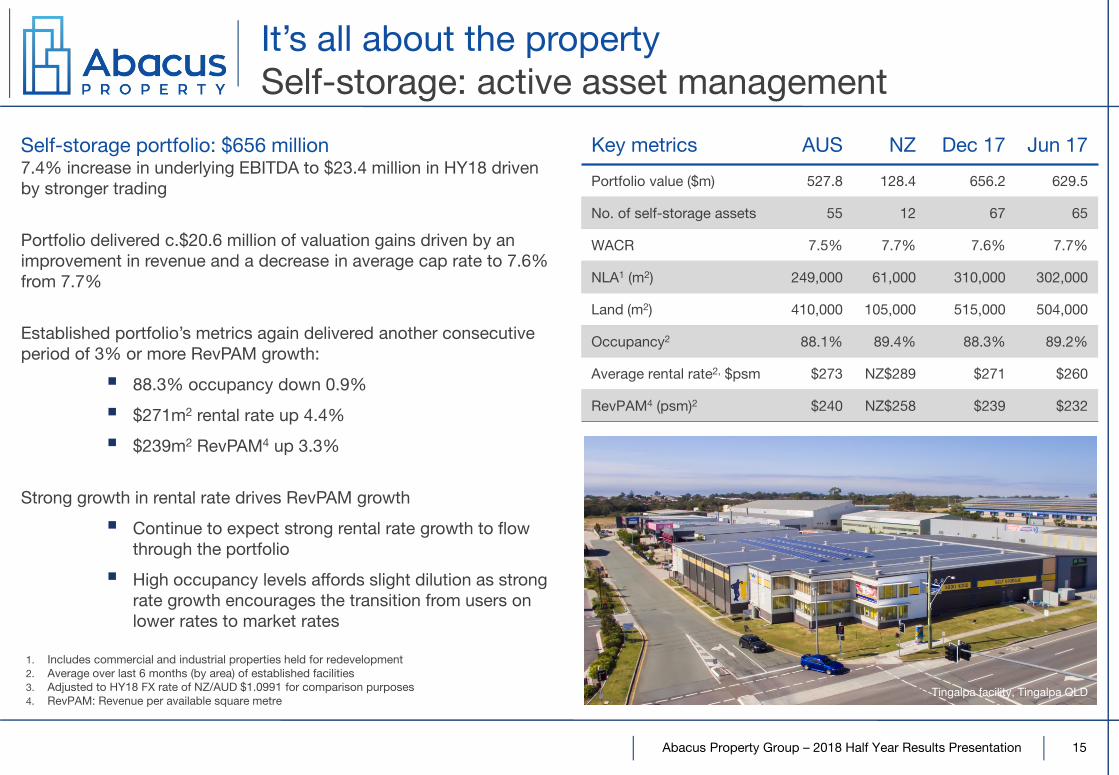
7.4% increase in underlying EBITDA to $23.4 million in HY18 driven by stronger trading
Portfolio delivered c.$20.6 million of valuation gains driven by an improvement in revenue and a decrease in average cap rate to 7.6% from 7.7%
Established portfolio’s metrics again delivered another consecutive period of 3% or more RevPAM growth:
88.3% occupancy down 0.9%
$271m2 rental rate up 4.4%
$239m2 RevPAM4 up 3.3%
Strong growth in rental rate drives RevPAM growth
Continue to expect strong rental rate growth to flow through the portfolio
High occupancy levels affords slight dilution as strong rate growth encourages the transition from users on lower rates to market rates
1. Includes commercial and industrial properties held for redevelopment2. Average over last 6 months (by area) of established facilities3. Adjusted to HY18 FX rate of NZ/AUD $1.0991 for comparison purposes4. RevPAM: Revenue per available square metre
Key metrics AUS NZ Dec 17 Jun 17
Portfolio value ($m) 527.8 128.4 656.2 629.5
No. of self-storage assets 55 12 67 65
WACR 7.5% 7.7% 7.6% 7.7%
NLA1 (m2) 249,000 61,000 310,000 302,000
Land (m2) 410,000 105,000 515,000 504,000
Occupancy2 88.1% 89.4% 88.3% 89.2%
Average rental rate2, $psm $273 NZ$289 $271 $260
RevPAM4 (psm)2 $240 NZ$258 $239 $232
15
Self-storage portfolio: $656 million
It’s all about the propertySelf-storage: active asset management
Tingalpa facility, Tingalpa QLD
Abacus Property Group – 2018 Half Year Results Presentation 16
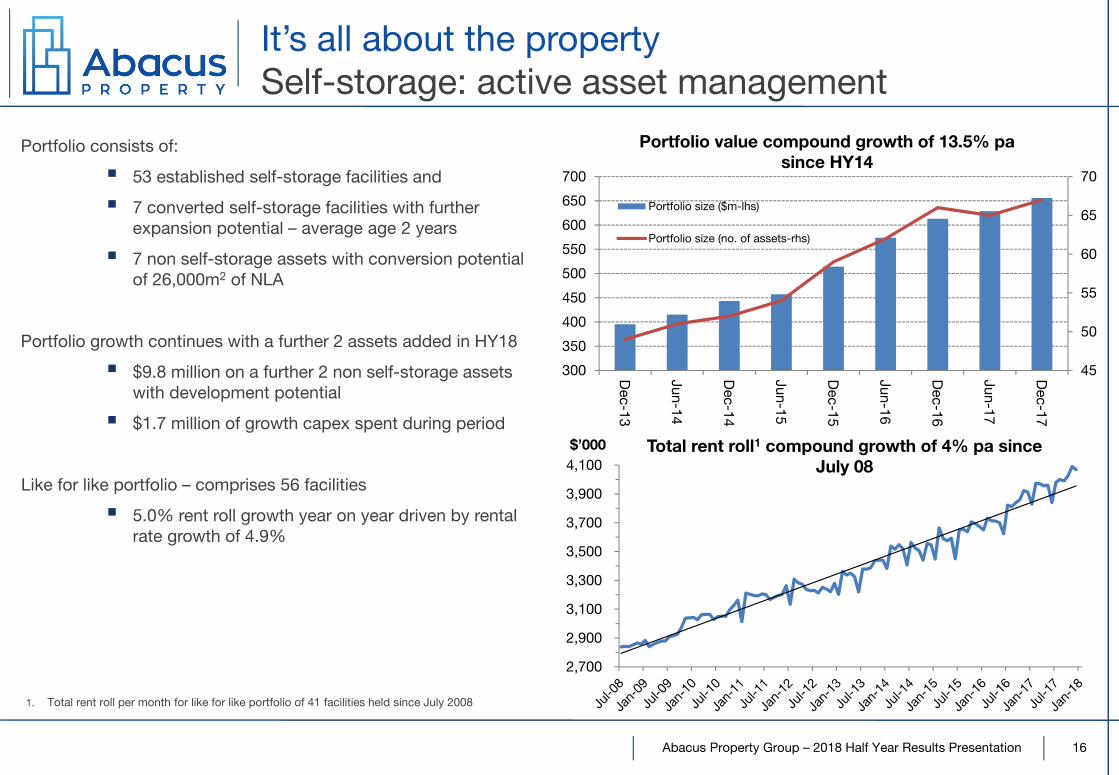
Portfolio consists of:
53 established self-storage facilities and
7 converted self-storage facilities with further expansion potential – average age 2 years
7 non self-storage assets with conversion potential of 26,000m2 of NLA
Portfolio growth continues with a further 2 assets added in HY18
$9.8 million on a further 2 non self-storage assets with development potential
$1.7 million of growth capex spent during period
Like for like portfolio – comprises 56 facilities
5.0% rent roll growth year on year driven by rental rate growth of 4.9%
It’s all about the propertySelf-storage: active asset management
2,700
2,900
3,100
3,300
3,500
3,700
3,900
4,100$’000 Total rent roll1 compound growth of 4% pa since
July 08
1. Total rent roll per month for like for like portfolio of 41 facilities held since July 2008
45
50
55
60
65
70
300
350
400
450
500
550
600
650
700
Dec-13
Jun-14
Dec-14
Jun-15
Dec-15
Jun-16
Dec-16
Jun-17
Dec-17
Portfolio value compound growth of 13.5% pa since HY14
Portfolio size ($m-lhs)
Portfolio size (no. of assets-rhs)
Abacus Property Group – 2018 Half Year Results Presentation
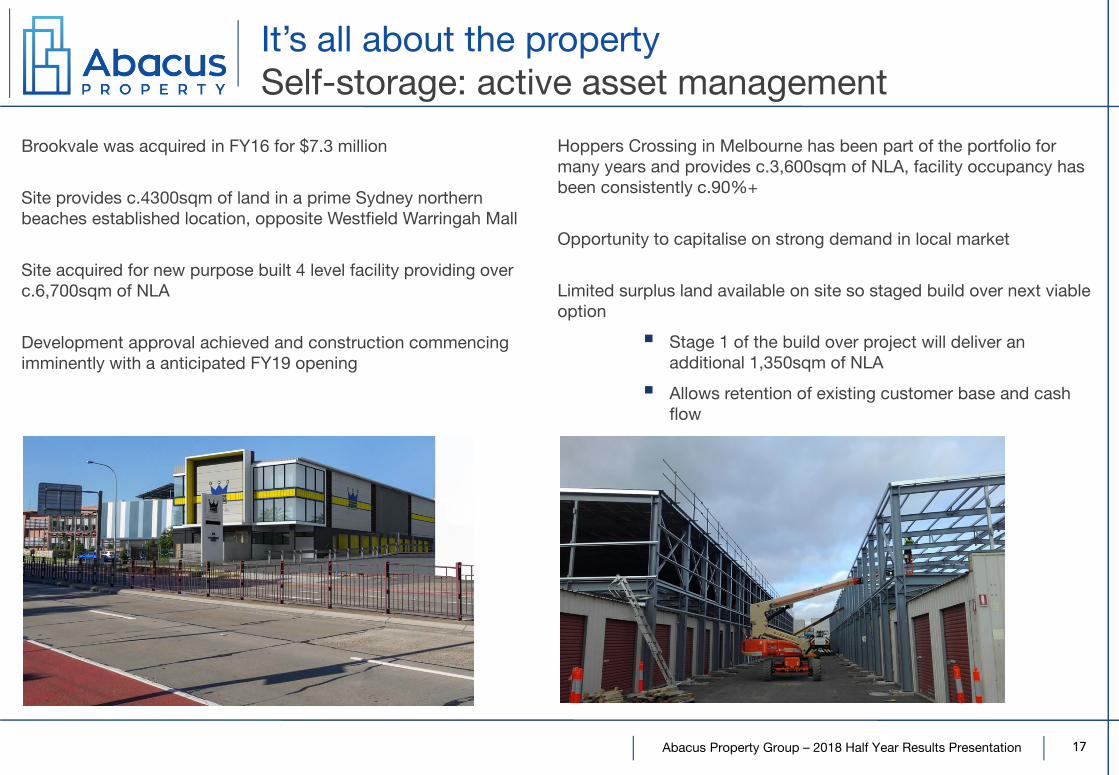
Brookvale was acquired in FY16 for $7.3 million
Site provides c.4300sqm of land in a prime Sydney northern beaches established location, opposite Westfield Warringah Mall
Site acquired for new purpose built 4 level facility providing over c.6,700sqm of NLA
Development approval achieved and construction commencing imminently with a anticipated FY19 opening
17
It’s all about the propertySelf-storage: active asset management
Hoppers Crossing in Melbourne has been part of the portfolio for many years and provides c.3,600sqm of NLA, facility occupancy has been consistently c.90%+
Opportunity to capitalise on strong demand in local market
Limited surplus land available on site so staged build over next viable option
Stage 1 of the build over project will deliver an additional 1,350sqm of NLA
Allows retention of existing customer base and cash flow
Abacus Property Group – 2018 Half Year Results Presentation
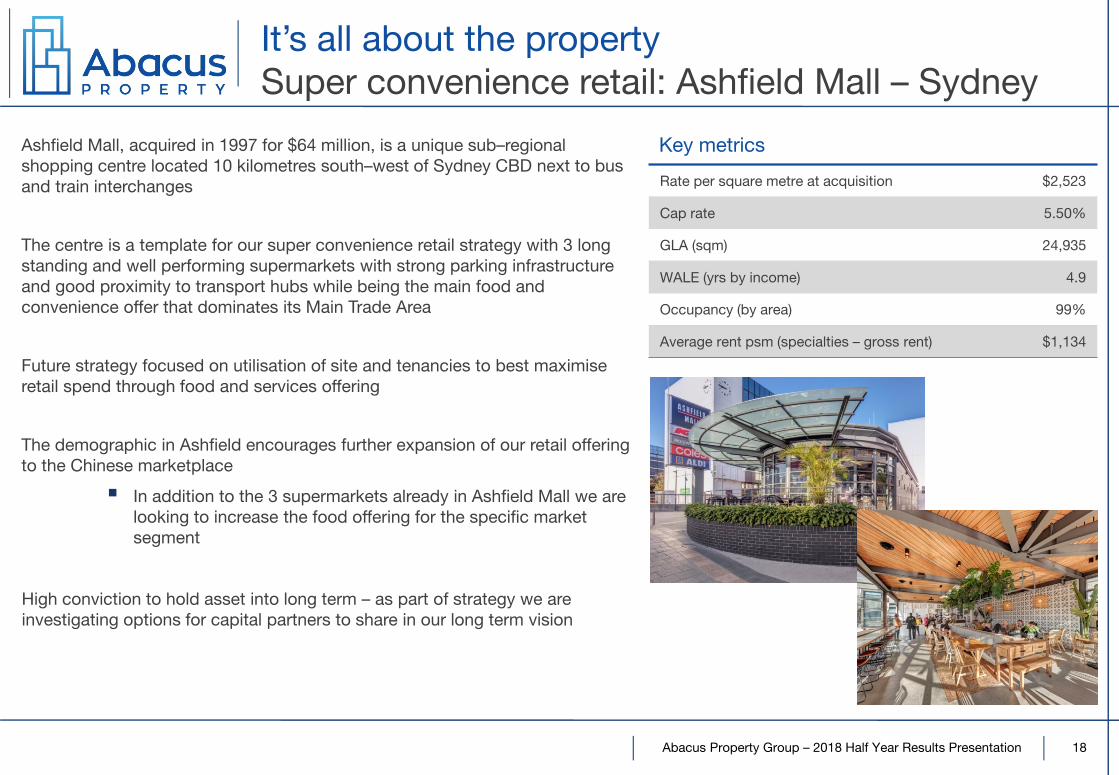
Ashfield Mall, acquired in 1997 for $64 million, is a unique sub–regional shopping centre located 10 kilometres south–west of Sydney CBD next to bus and train interchanges
The centre is a template for our super convenience retail strategy with 3 long standing and well performing supermarkets with strong parking infrastructure and good proximity to transport hubs while being the main food and convenience offer that dominates its Main Trade Area
Future strategy focused on utilisation of site and tenancies to best maximise retail spend through food and services offering
The demographic in Ashfield encourages further expansion of our retail offering to the Chinese marketplace
In addition to the 3 supermarkets already in Ashfield Mall we are looking to increase the food offering for the specific market segment
High conviction to hold asset into long term – as part of strategy we are investigating options for capital partners to share in our long term vision
Key metrics
Rate per square metre at acquisition $2,523
Cap rate 5.50%
GLA (sqm) 24,935
WALE (yrs by income) 4.9
Occupancy (by area) 99%
Average rent psm (specialties – gross rent) $1,134
18
It’s all about the propertySuper convenience retail: Ashfield Mall – Sydney
Abacus Property Group – 2018 Half Year Results Presentation
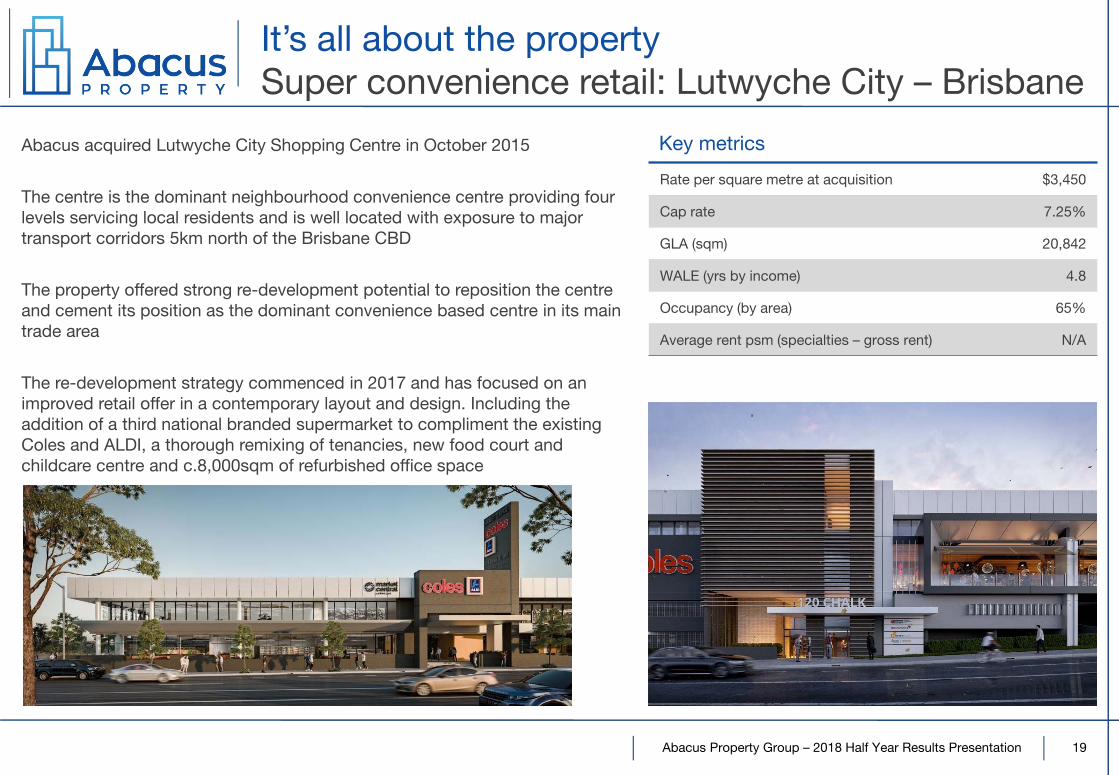
Abacus acquired Lutwyche City Shopping Centre in October 2015
The centre is the dominant neighbourhood convenience centre providing four levels servicing local residents and is well located with exposure to major transport corridors 5km north of the Brisbane CBD
The property offered strong re-development potential to reposition the centre and cement its position as the dominant convenience based centre in its main trade area
The re-development strategy commenced in 2017 and has focused on an improved retail offer in a contemporary layout and design. Including the addition of a third national branded supermarket to compliment the existing Coles and ALDI, a thorough remixing of tenancies, new food court and childcare centre and c.8,000sqm of refurbished office space
Key metrics
Rate per square metre at acquisition $3,450
Cap rate 7.25%
GLA (sqm) 20,842
WALE (yrs by income) 4.8
Occupancy (by area) 65%
Average rent psm (specialties – gross rent) N/A
19
It’s all about the propertySuper convenience retail: Lutwyche City – Brisbane
Abacus Property Group – 2018 Half Year Results Presentation
Developments overview
The Eminence residential development, Carlton, Melbourne VIC
Abacus Property Group – 2018 Half Year Results Presentation
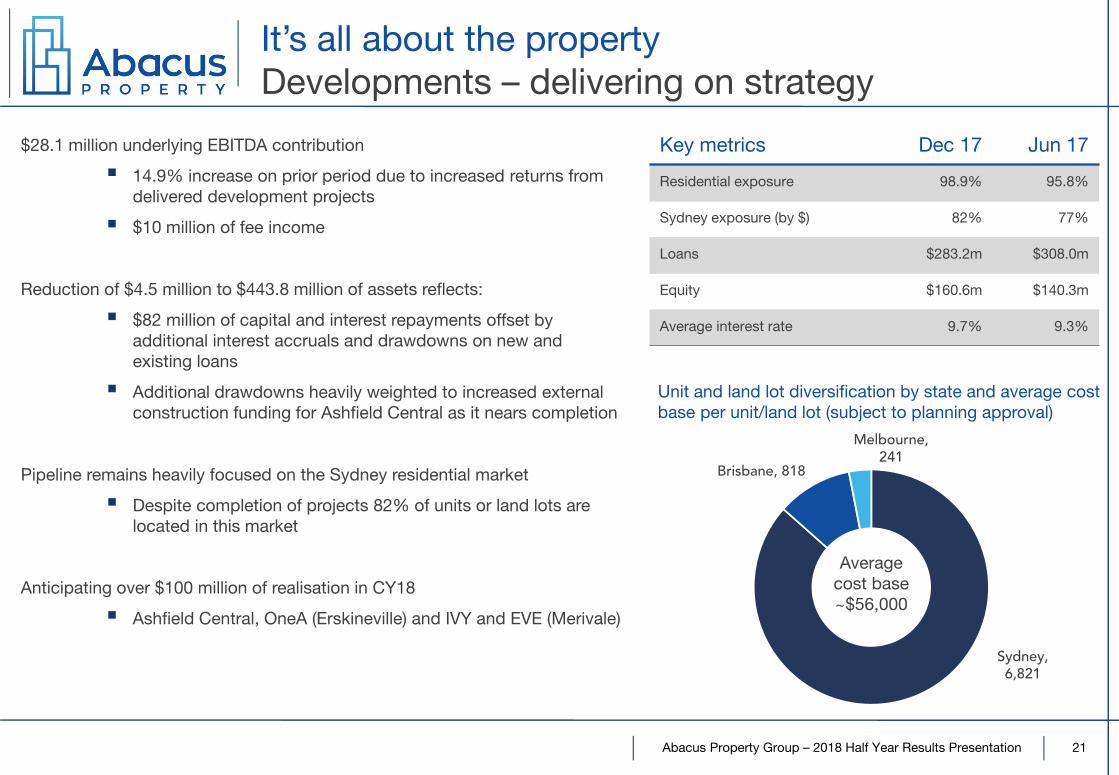
Sydney, 6,821
Brisbane, 818
Melbourne, 241
$28.1 million underlying EBITDA contribution
14.9% increase on prior period due to increased returns from delivered development projects
$10 million of fee income
Reduction of $4.5 million to $443.8 million of assets reflects:
$82 million of capital and interest repayments offset by additional interest accruals and drawdowns on new and existing loans
Additional drawdowns heavily weighted to increased external construction funding for Ashfield Central as it nears completion
Pipeline remains heavily focused on the Sydney residential market
Despite completion of projects 82% of units or land lots are located in this market
Anticipating over $100 million of realisation in CY18
Ashfield Central, OneA (Erskineville) and IVY and EVE (Merivale)
Key metrics Dec 17 Jun 17
Residential exposure 98.9% 95.8%
Sydney exposure (by $) 82% 77%
Loans $283.2m $308.0m
Equity $160.6m $140.3m
Average interest rate 9.7% 9.3%
21
Unit and land lot diversification by state and average cost base per unit/land lot (subject to planning approval)
Average cost base ~$56,000
It’s all about the propertyDevelopments – delivering on strategy
Abacus Property Group – 2018 Half Year Results Presentation 22
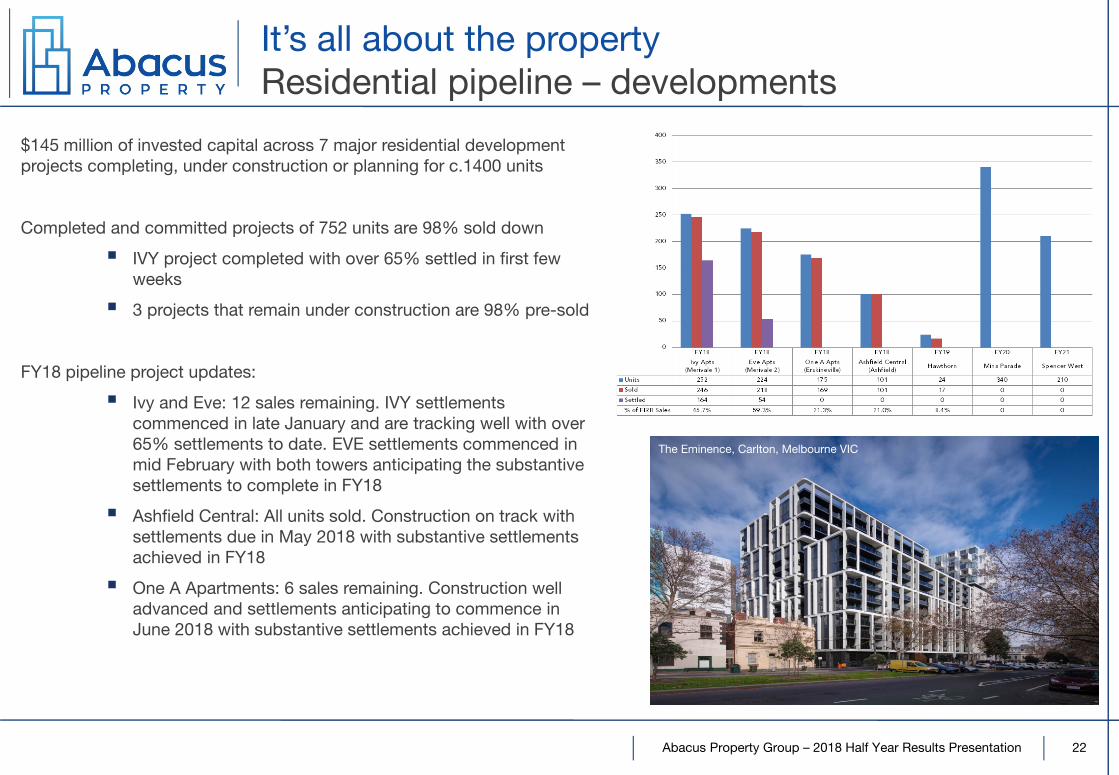
$145 million of invested capital across 7 major residential development projects completing, under construction or planning for c.1400 units
Completed and committed projects of 752 units are 98% sold down
IVY project completed with over 65% settled in first few weeks
3 projects that remain under construction are 98% pre-sold
FY18 pipeline project updates:
Ivy and Eve: 12 sales remaining. IVY settlements commenced in late January and are tracking well with over 65% settlements to date. EVE settlements commenced in mid February with both towers anticipating the substantive settlements to complete in FY18
Ashfield Central: All units sold. Construction on track with settlements due in May 2018 with substantive settlements achieved in FY18
One A Apartments: 6 sales remaining. Construction well advanced and settlements anticipating to commence in June 2018 with substantive settlements achieved in FY18
Spice, Brisbane QLD
It’s all about the propertyResidential pipeline – developments
The Eminence, Carlton, Melbourne VIC
Abacus Property Group – 2018 Half Year Results Presentation 23
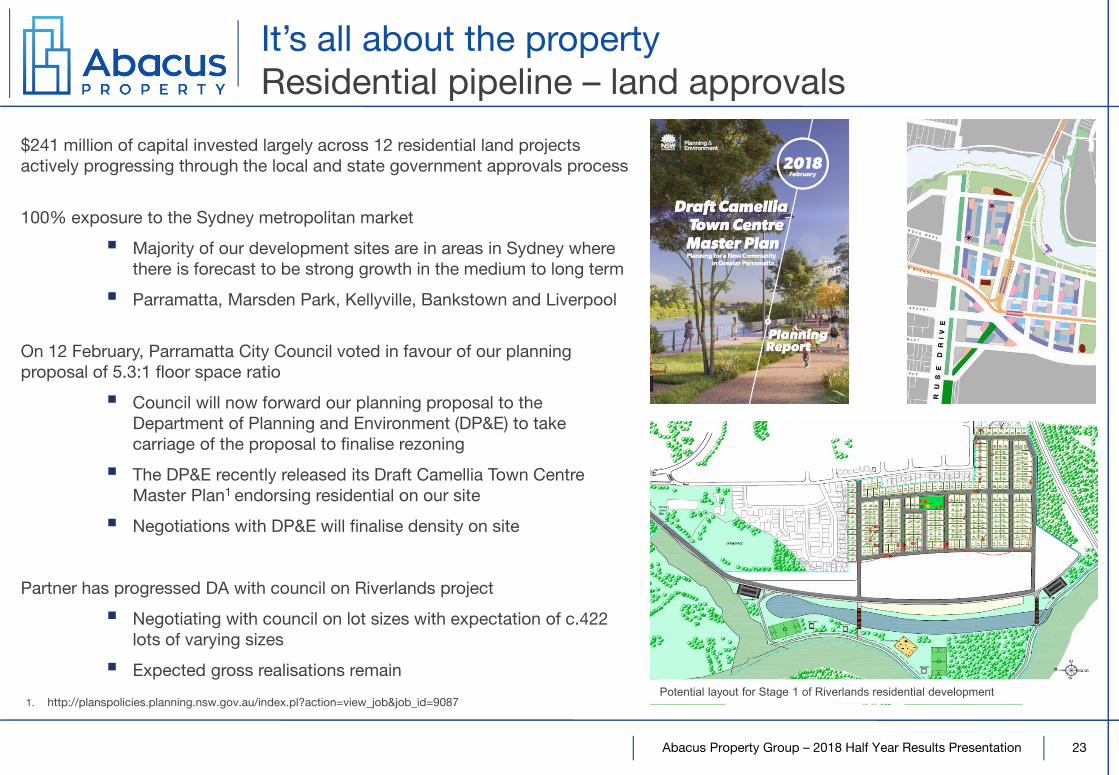
$241 million of capital invested largely across 12 residential land projects actively progressing through the local and state government approvals process
100% exposure to the Sydney metropolitan market
Majority of our development sites are in areas in Sydney where there is forecast to be strong growth in the medium to long term
Parramatta, Marsden Park, Kellyville, Bankstown and Liverpool
On 12 February, Parramatta City Council voted in favour of our planning proposal of 5.3:1 floor space ratio
Council will now forward our planning proposal to the Department of Planning and Environment (DP&E) to take carriage of the proposal to finalise rezoning
The DP&E recently released its Draft Camellia Town Centre Master Plan1 endorsing residential on our site
Negotiations with DP&E will finalise density on site
Partner has progressed DA with council on Riverlands project
Negotiating with council on lot sizes with expectation of c.422 lots of varying sizes
Expected gross realisations remain
It’s all about the propertyResidential pipeline – land approvals
1. http://planspolicies.planning.nsw.gov.au/index.pl?action=view_job&job_id=9087Potential layout for Stage 1 of Riverlands residential development
Abacus Property Group – 2018 Half Year Results Presentation
Summary
Artist’s impression of Ashfield Central residential development, Sydney NSW
Abacus Property Group – 2018 Half Year Results Presentation
Summary – strong value proposition
25
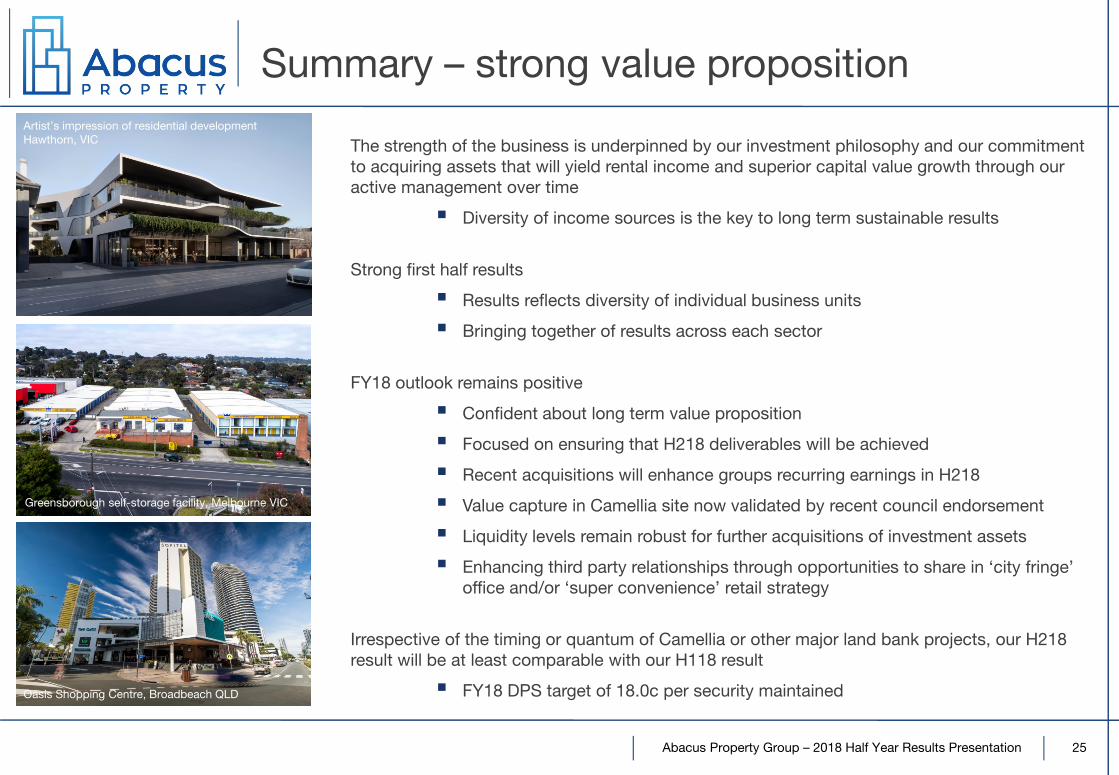
Oasis Shopping Centre, Broadbeach QLD
Greensborough self-storage facility, Melbourne VIC
Artist’s impression of residential development Hawthorn, VIC The strength of the business is underpinned by our investment philosophy and our commitment
to acquiring assets that will yield rental income and superior capital value growth through our active management over time
Diversity of income sources is the key to long term sustainable results
Strong first half results
Results reflects diversity of individual business units
Bringing together of results across each sector
FY18 outlook remains positive
Confident about long term value proposition
Focused on ensuring that H218 deliverables will be achieved
Recent acquisitions will enhance groups recurring earnings in H218
Value capture in Camellia site now validated by recent council endorsement
Liquidity levels remain robust for further acquisitions of investment assets
Enhancing third party relationships through opportunities to share in ‘city fringe’ office and/or ‘super convenience’ retail strategy
Irrespective of the timing or quantum of Camellia or other major land bank projects, our H218 result will be at least comparable with our H118 result
FY18 DPS target of 18.0c per security maintained
Abacus Property Group – 2018 Half Year Results Presentation
Important information
26
The information provided in this document is general, and may not be suitable for the specific purposes of any user of this document. It is not financial advice or a recommendation to acquire Abacus Property Group securities (ASX: ABP). Abacus Property Group believes that the information in this document is correct (although not complete or comprehensive) and does not make any specific representations regarding its suitability for any purpose. Users of this document should obtain independent professional advice before relying on this document as the basis for making any investment decision and should also refer to Abacus Property Group’s financial statements lodged with the ASX for the period to which this document relates.This document contains non-AIFRS financial information that Abacus Property Group uses to assess performance and distribution levels. That information is calculated in accordance with the AICD/Finsia principles and is not audited.
Any forecasts or other forward looking statements contained in this presentation are based on assumptions concerning future events and market conditions. Actual results may vary from forecasts and any variations may be materially positive or negative.
The information in this document is current only as at the date of this document, and that information may not be updated to reflect subsequent changes.
To the extent permitted by law, the members of Abacus Property Group and those officers responsible for the preparation of this document disclaim all responsibility for damages and loss incurred by users of this document as a result of the content of,or any errors or omissions in, this document.
Abacus Property Group:
Abacus Group Holdings Limited ACN: 080 604 619
Abacus Group Projects Limited ACN: 104 066 104
Abacus Funds Management Limited ACN: 007 415 590 AFSL No. 227819
Abacus Storage Funds Management Limited ACN: 109 324 834 AFSL No. 277357
Abacus Storage Operations Limited ACN: 112 457 075