Embed Size (px)
Citation preview

Hwk Ans Key

Experimental Errors & Uncertainty
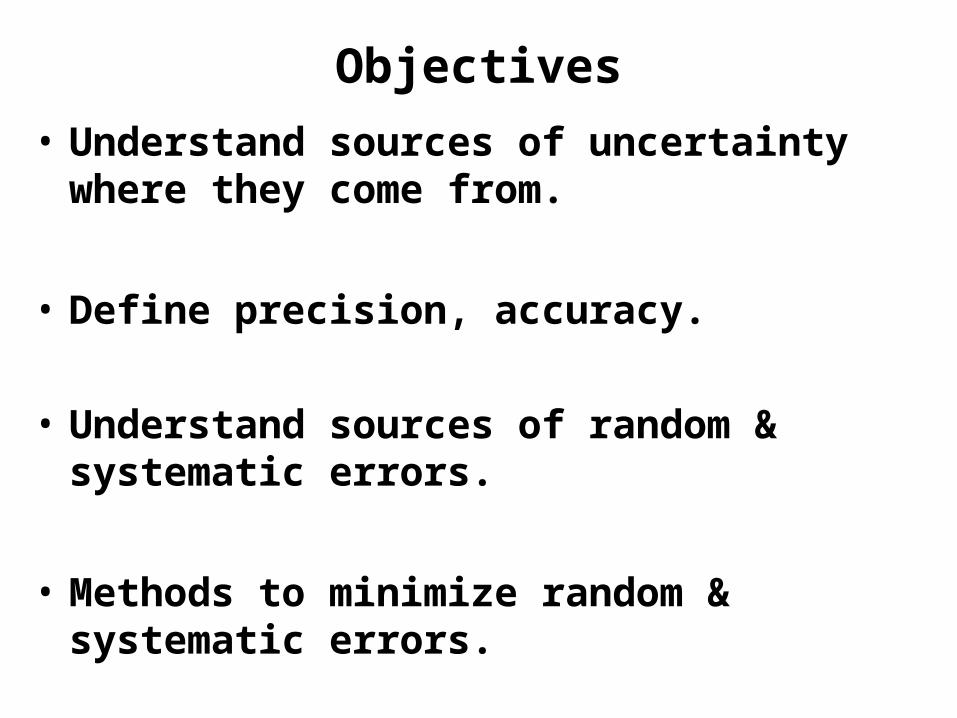
Objectives
• Understand sources of uncertainty where they come from.
• Define precision, accuracy.
• Understand sources of random & systematic errors.
• Methods to minimize random & systematic errors.
Errors/Uncertainties
Mistakes Happen –but there are no small mistakes if you
are a civil engineer.
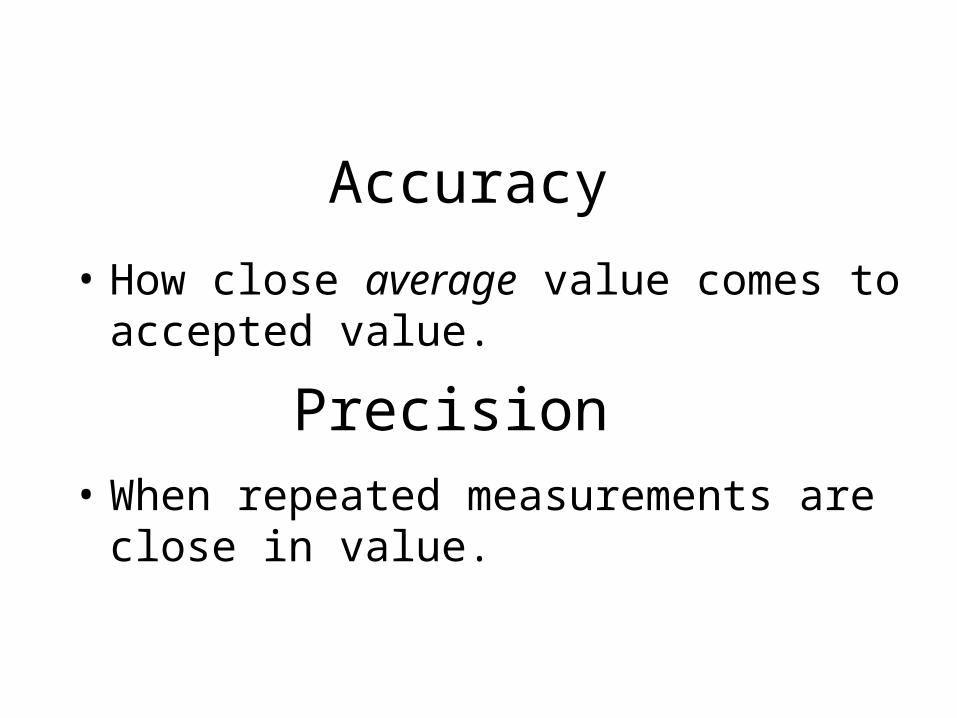
Accuracy
• How close average value comes to accepted value.
Precision • When repeated measurements are close in
value.
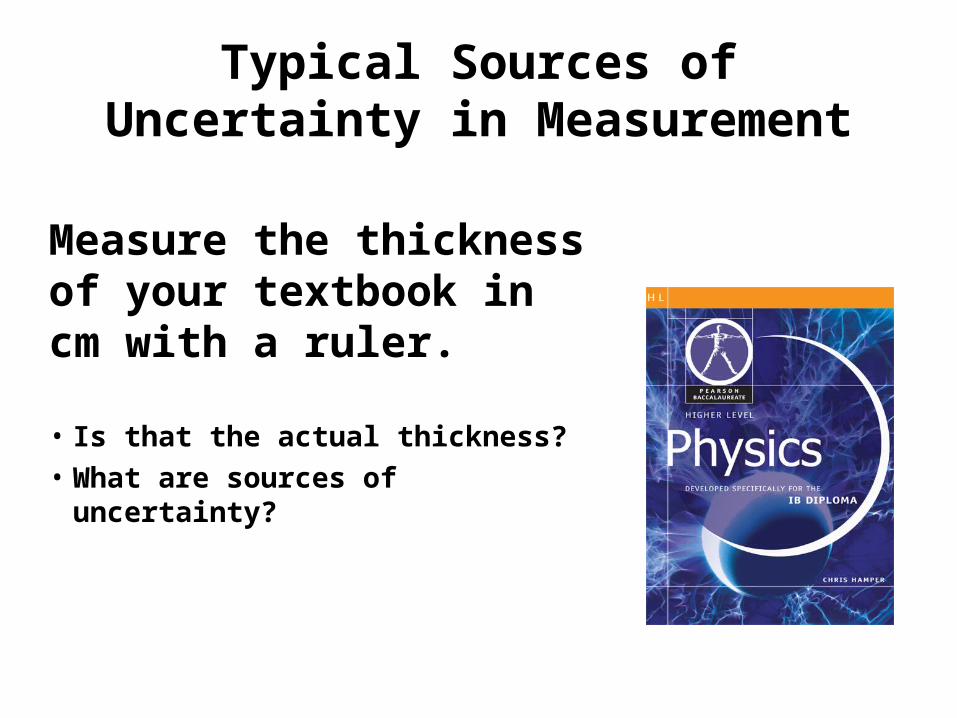
Typical Sources of Uncertainty in Measurement
Measure the thickness of your textbook in cm with a ruler.
• Is that the actual thickness?
• What are sources of uncertainty?
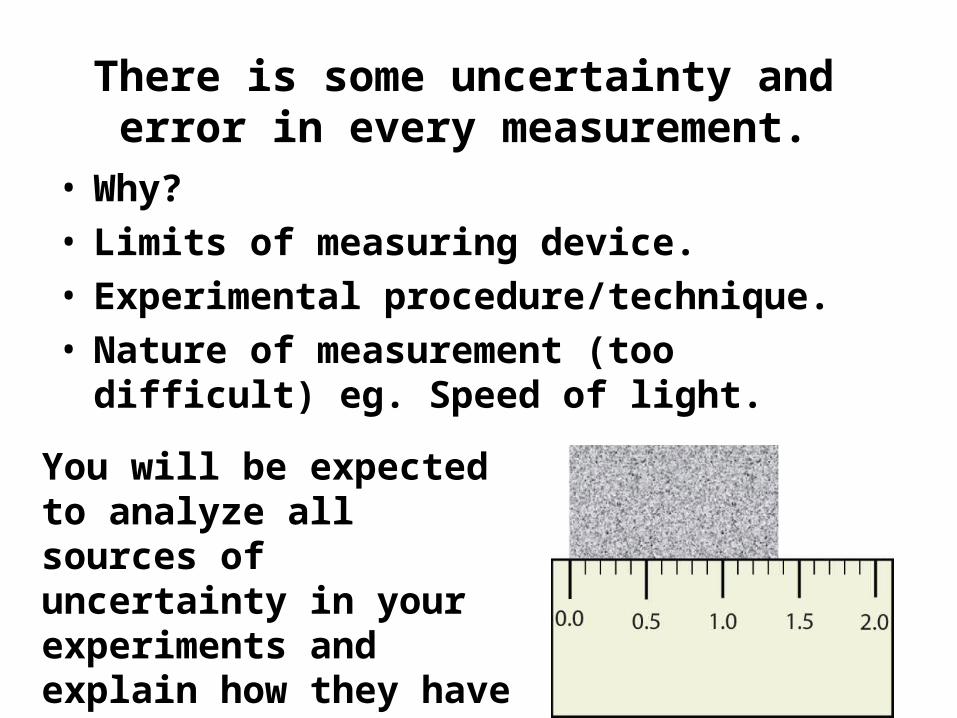
There is some uncertainty and error in every measurement.
• Why?
• Limits of measuring device.
• Experimental procedure/technique.
• Nature of measurement (too difficult) eg. Speed of light.
You will be expected to analyze all sources of uncertainty in your experiments and explain how they have affected your results.
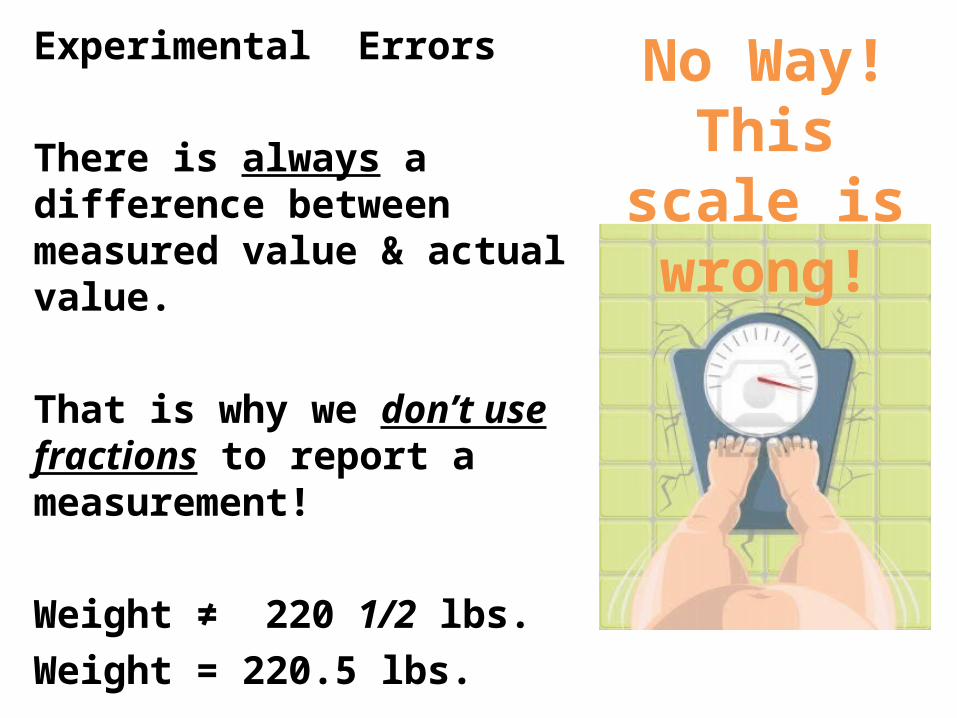
No Way! This
scale is wrong!
Experimental Errors
There is always a difference between measured value & actual value.
That is why we don’t use fractions to report a measurement!
Weight ≠ 220 1/2 lbs.
Weight = 220.5 lbs.
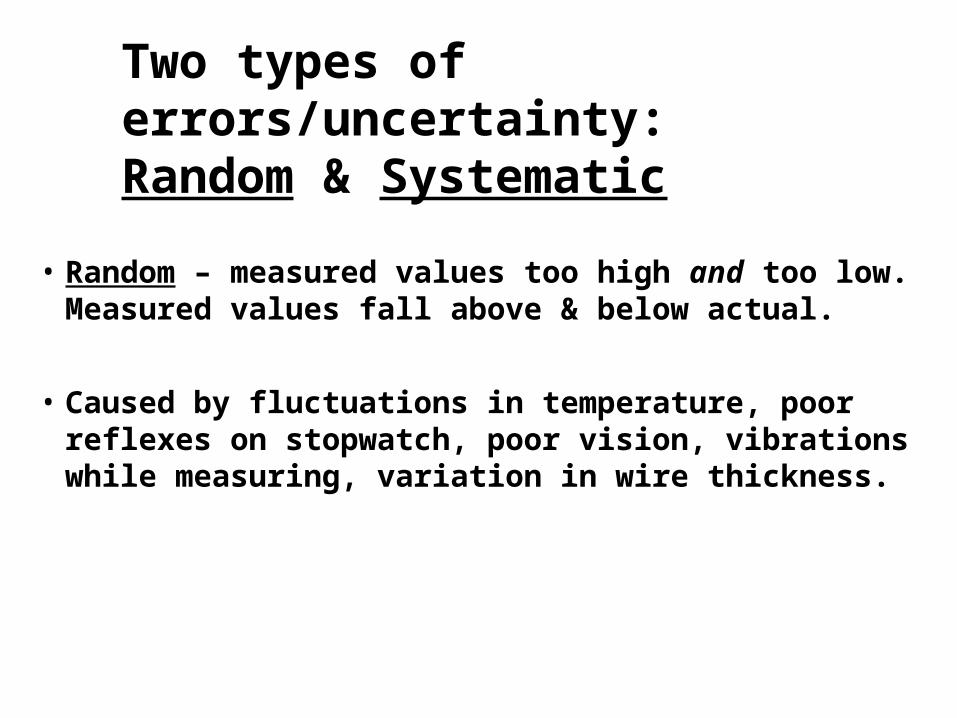
• Random – measured values too high and too low. Measured values fall above & below actual.
• Caused by fluctuations in temperature, poor reflexes on stopwatch, poor vision, vibrations while measuring, variation in wire thickness.
Two types of errors/uncertainty: Random & Systematic
True or False: Doing more experimental trials should reduce random error?
True
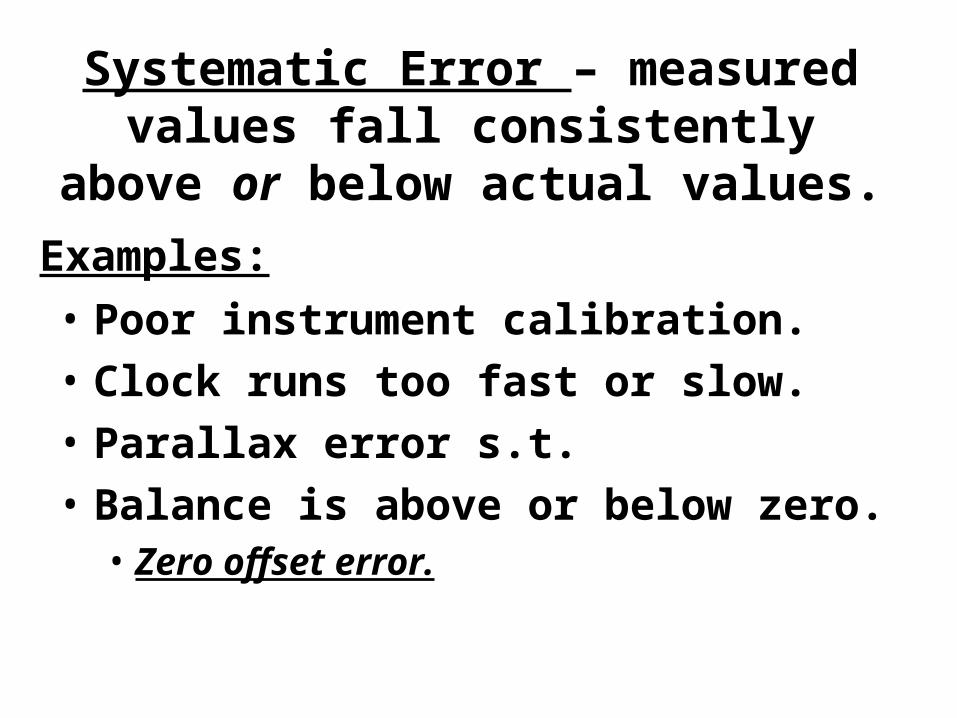
Systematic Error – measured values fall consistently above or below actual
values.
• Poor instrument calibration. • Clock runs too fast or slow. • Parallax error s.t.• Balance is above or below zero. • Zero offset error.
Examples:
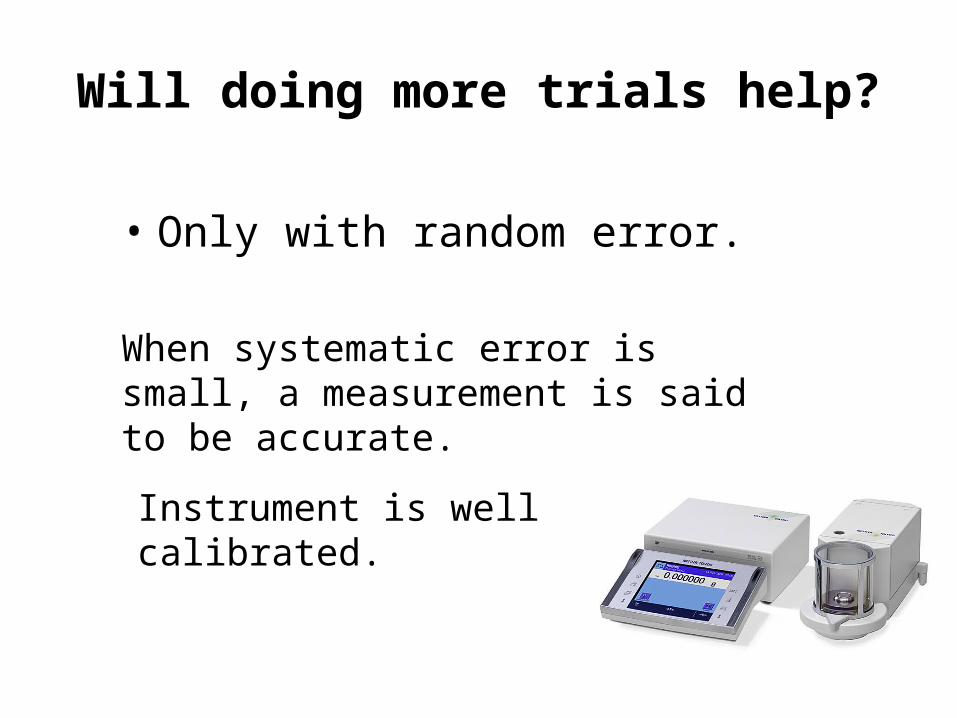
Will doing more trials help?
• Only with random error.
When systematic error is small, a measurement is said to be accurate.
Instrument is well calibrated.
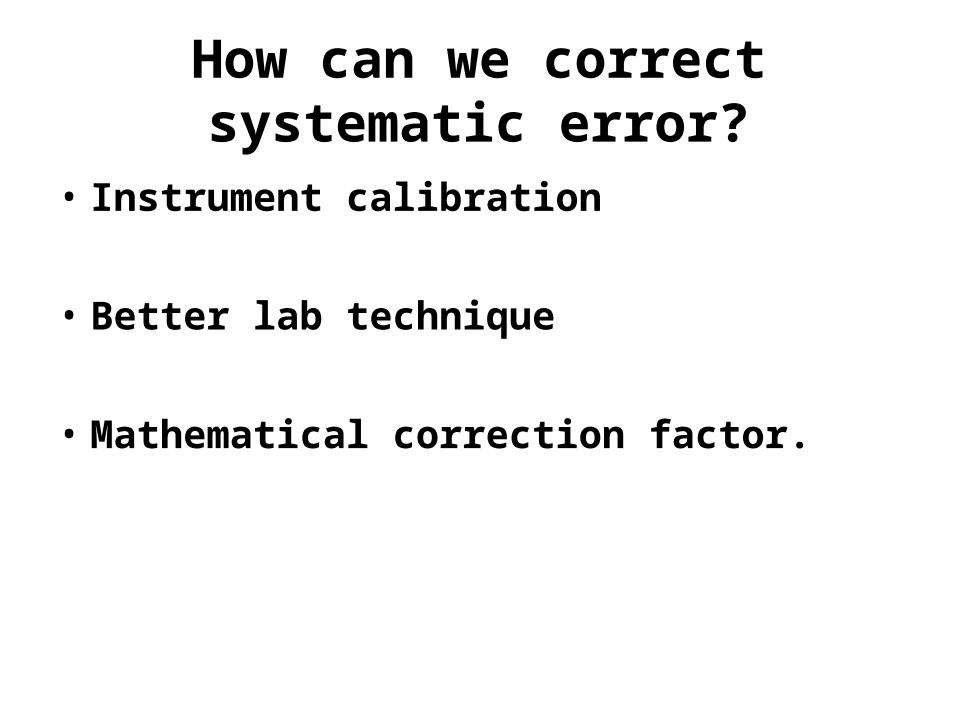
How can we correct systematic error?
• Instrument calibration
• Better lab technique
• Mathematical correction factor.
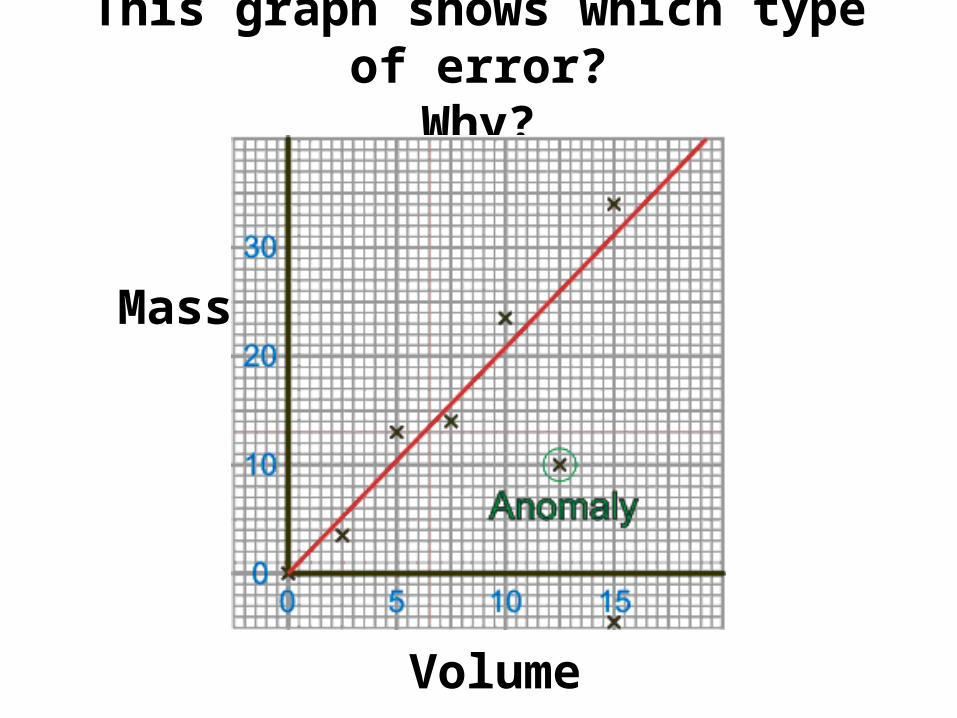
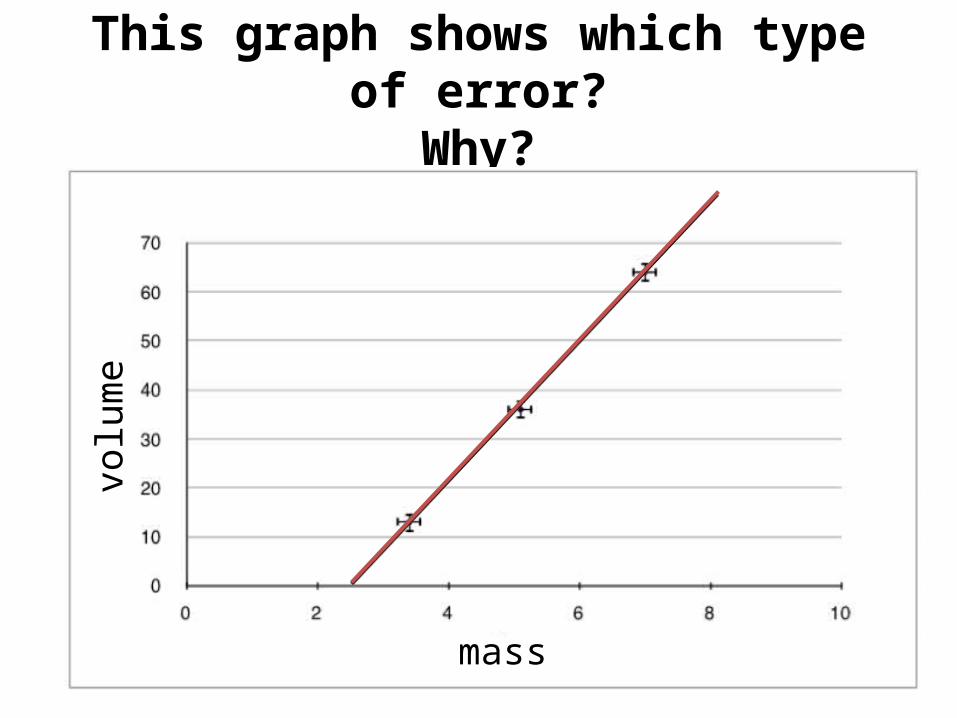
This graph shows which type of error?Why?
Mass
Volume
This graph shows which type of error?Why?
mmass
volume
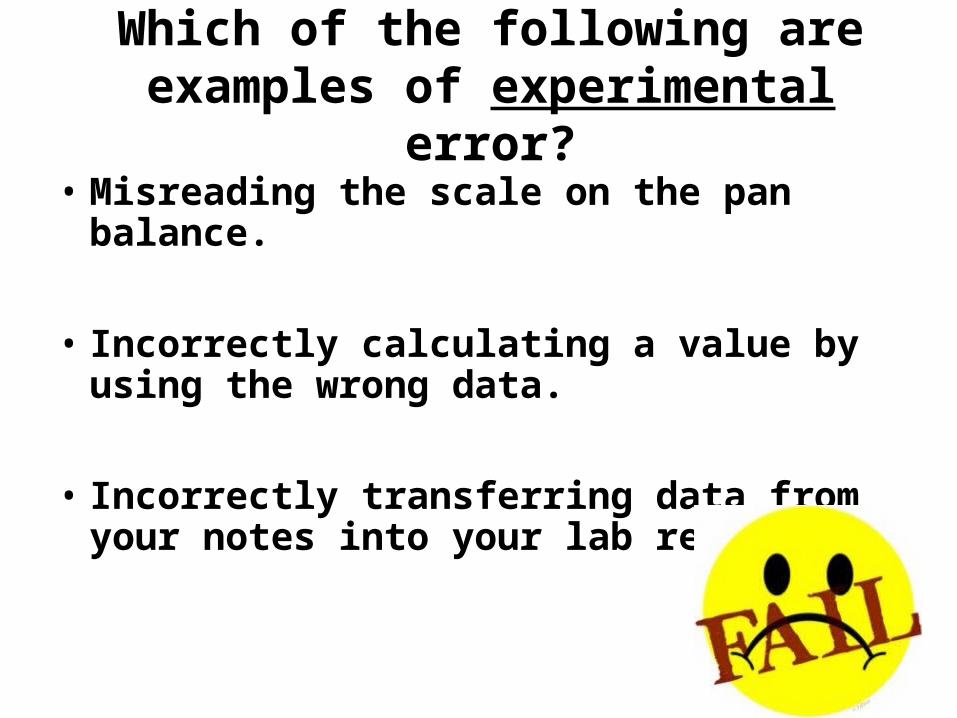
Which of the following are examples of experimental error?
• Misreading the scale on the pan balance.
• Incorrectly calculating a value by using the wrong data.
• Incorrectly transferring data from your notes into your lab report.
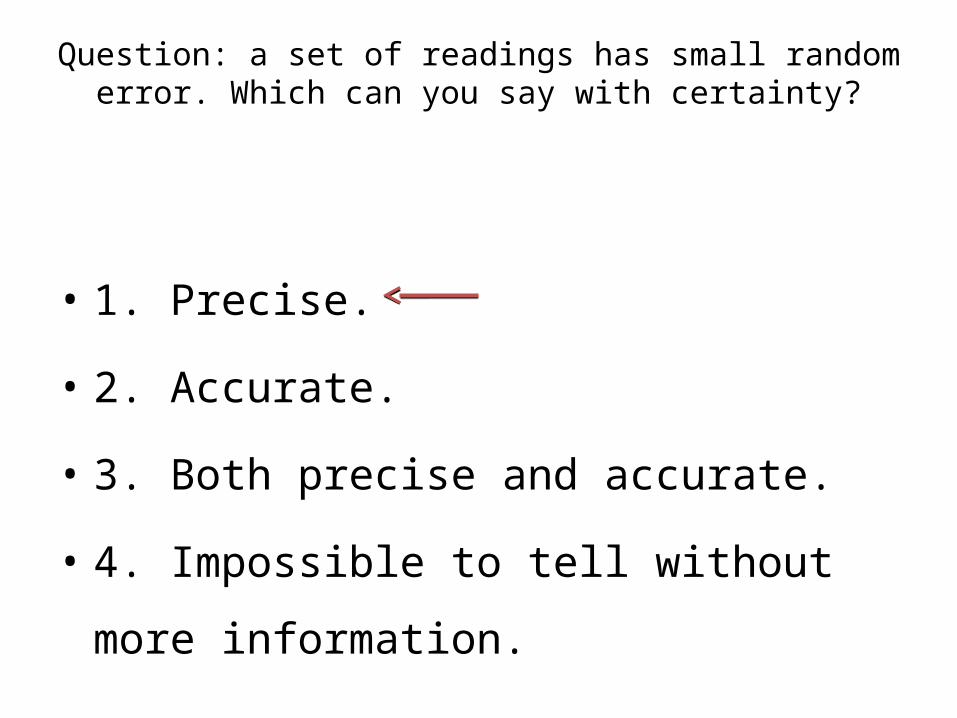
Question: a set of readings has small random error. Which can you say with certainty?
• 1. Precise.
• 2. Accurate.
• 3. Both precise and accurate.
• 4. Impossible to tell without more
information.
Film Clip: The difference of precision and Accuracy Ted 5:00 Min.
• https://www.youtube.com/watch?v=hRAFPdDppzs
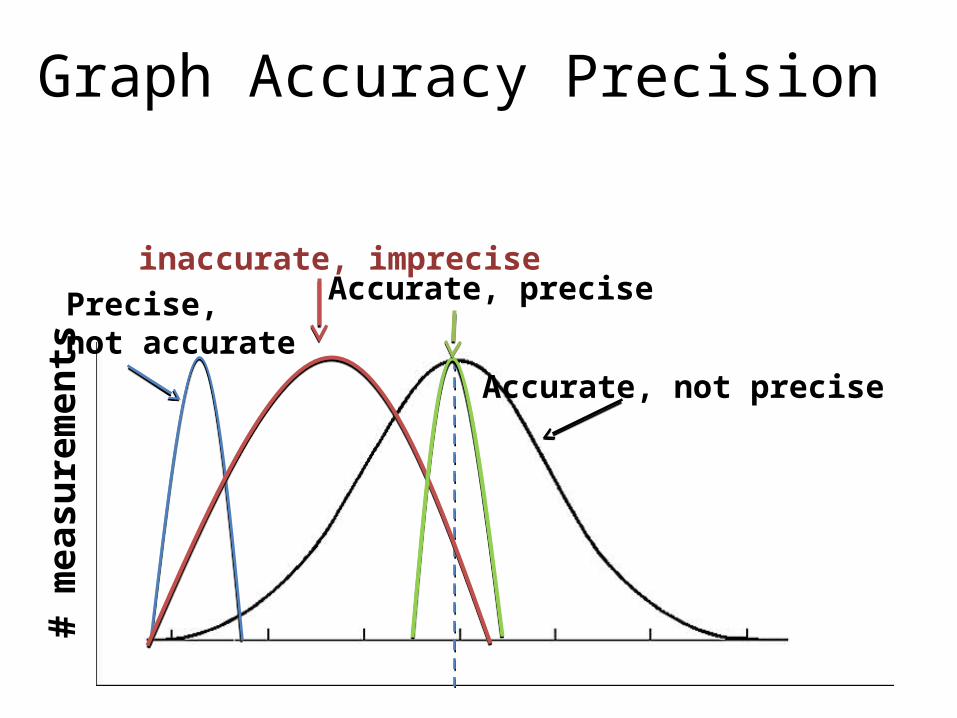
Graph Accuracy Precision
Accurate, not precise
Accurate, precisePrecise, not accurate
inaccurate, imprecise
# m
easu
rem
ents
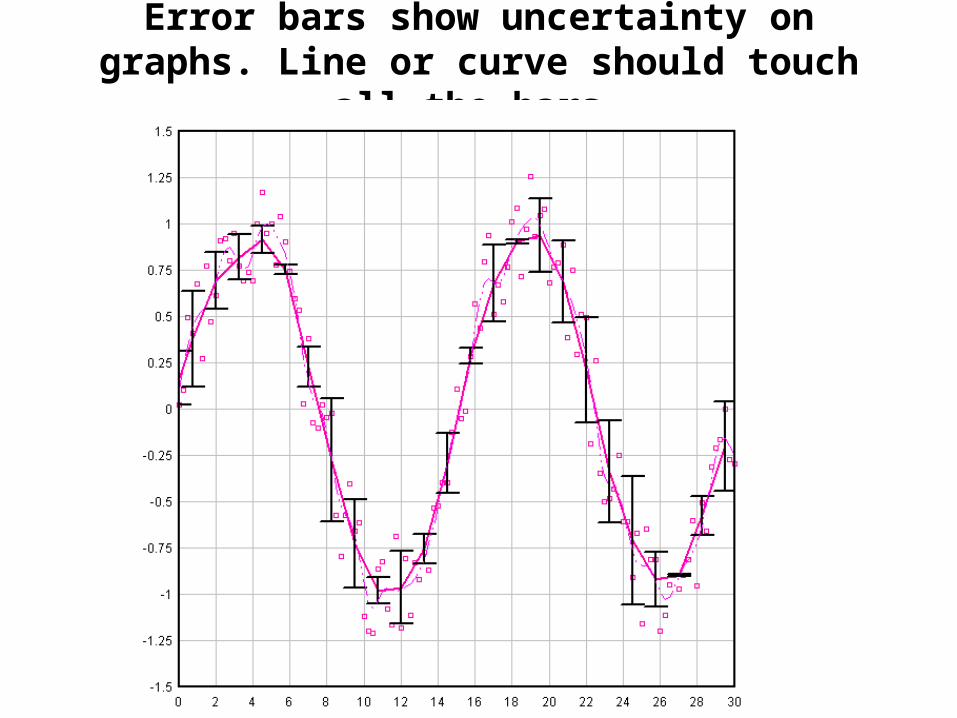
Error bars show uncertainty on graphs. Line or curve should touch all the bars.
• In class precision & accuracy sheet & IB MC questions.


![SI520 Hwk 7 Part 2_[Revision]_changlaw](https://img.pdfslide.us/doc/110x75/577cd4da1a28ab9e78994bb7/si520-hwk-7-part-2revisionchanglaw.jpg)