Embed Size (px)
Citation preview

3 Radiation
Virtually all the information we get in astronomy comes to us as electromag-
netic radiation (radio, infrared, visible, UV, X-ray, or gamma ray), in other
words as photons.
3.1 Photon description of light
3.1.1 Photons
Light (or any EM radiation) comes in discrete particles called photons. The
basic principles are
they move in straight lines at the speed of light c,
they carry energy E and momentum p (each photon has some particular
energy E),
they are conserved in number, except if emitted or absorbed by a
charged particle (e.g. the electron in an atom).
Each photon's E and p are related by
E = pc :
Note that p is the magnitude of the 3-vector momentum p
p = jpj :
3.1.2 Phase space density
A big part of understanding radiation is just bookkeeping on the positions
and directions of the photons: it's not just the number (density) of photons at
25

each point that matters, but also the distribution of which way they are going,
and of what energies they have. Since the momentum vector p encapsulates
both the latter concepts (direction and energy) it is useful to think, at some
instant in time, of each photon being at a point in a 6-dimensional space of
position and momentum:
(x; y; z; px; py; pz) :
(I can only draw 2 of the dimensions:)
dp
dx
x
px
x
The phase space densityN is the number of photons dN per 6-dimensional
unit phase space:
dN = N dx dy dz dpx dpy dpz Nd3x d
3p :
Things get more interesting if we decide to keep track of the momentumpart
of phase space in spherical, not Cartesian coordinates.
pz
py
px
d p = p dpd3 2 Ω
Ωd is a solid angle
26

Then,
d3p = p
2dp d =
1
c3E2dE d :
So, for photons in a xed energy interval dE around E, d3p is proportional to
the solid angle element d that encompasses their directions and to E2dE.
We should here say a word about the notation d for solid angle; it is
measured in steradians, a unit such that the full 2-sphere is 4 steradians,
i.e. Zsphere
d = 4 :
In spherical polar coordinates, d decomposes into the two orthogonal direc-
tions,
d = sin dd' = d(cos )d' :
θ ϕsin d
θd
If we consider photons moving in one direction and normally incident on
a detector, then d3x is related to their ux:
27

Q
dz
Q is area = dx dydz is thickness of slab ofphotons moving at speed c
Photons in volume dx dy dz will slam into wall in a time dz=c. So,
(number per volume) =1
c(number per area per time);
or
d3x = c dx dy| z
normal aread2
dt c d2 dt :
Why do we care? Because of a very famous, subtle theorem of mechanics:
Liouville's Theorem: Phase space density of particles is constant along
the trajectory of any freely moving particle.
28

Example: Compare photons close to and far from an extended source like
a star:
star
photons here are diffuse inphysical space (low density)but highly collimated inangle (high density).
photons here are crowded in physicalspace (high density) but spread outin solid angle (direction)
So, dilution of photon density is always accompanied by increased colli-
mation in a precise quantitative relationship!
3.1.3 Brightness
Let's compute the total energy dE in a small volume of phase space
dE = EdN = ENd3x d
3p
= EN (cd2 dt)1
c3E2dE d
=E3N=c
2d2 dt dE d
Id2 dt dE d :
Here we have dened
I = NE3=c
2:
We see that I is the energy in photons per (normally incident) area per
time per solid angle per photon energy interval dE. I is called the \specic
intensity" or \brightness" of a radiation eld at a particular point, in a
particular direction, at a particular energy.
29
Note that since N is conserved (Liouville) and E is constant for each
photon, I is conserved too! If you look at a source while moving farther and
farther away, its brightness (in this context often called \surface brightness")
doesn't change. It gets smaller but not dimmer (per unit apparent size).
All optical systems indeed satisfy Liouville's Theorem. One implication is
that no telescope, however large, can make a scene look brighter than it looks
to the naked eye. It can only make it look bigger. However, for very small
\unresolved" sources like stars, bigger eectively is brighter, since there is
more light in the resolution element.
CCD detectors and photographic emulsions don't measure surface bright-
ness (as the eye does), but rather respond to total energy deposited per area
of collector. For these, a bigger telescope, gathering more total photons, is
advantageous. We will come back to this topic later.
3.2 Wave description of light
3.2.1 Waves
Because of quantum mechanics \wave-particle duality," photons also can
exhibit wave-like properties. In fact, in the classical limit of many photons,
they are described by the classical Maxwell equations of electromagnetism.
Basic principles:
Relation between frequency and wavelength :
=c
Two linear polarizations
Re ection from conducting surfaces (e.g. the aluminized surface of a
telescope mirror)
30

Refraction in lenses by the \principle of least time"
Interference eects
Finite resolution of an aperture: A telescope of aperture (diameter) D
cannot distinguish directions any ner than about
=
D(in radians)
The light from unresolved \point" sources is seen as blurred into a spot
of about this radius.
3.2.2 Connection between particle and wave descriptions
The energy of a photon (a quantum concept) is related to the frequency of
the photon (a classical concept) by Planck's famous
E = h
where h = 6:63 1027erg sec is Planck's constant. One way to visualize the
photon as both a particle and wave is to think of it as a propagating wave
packet.
The more monochromatic (small E or ) the photon, the longer the
wave packet. This is why it is easy to do interference demonstrations with
laser light (very monochromatic) but quite dicult with white light (large
). The relation between length of wave packet and frequency (or energy,
or momentum) localization is of course the Heisenberg uncertainty principle.
31

Notice that
dE = hd :
3.3 Radiation units
3.3.1 Specic intensity I
It is more common to characterize light intensity on a \per frequency" basis
than on a \per photon energy" basis. In terms of our old I (brightness) we
dene
I IdE
d= hI :
Then, the rst two equations in 3.13 above become
phase space density N =I
3
c2
h4
and
dE = Id2 dt d d
with I having the units energy per (normal incidence) area per time per
frequency interval per solid angle, that is, erg s1 cm2ster1Hz1.
I is a function of:
position in space
direction under consideration
photon frequency under consideration
(possibly, though not usually) time
32

3.3.2 Specic intensity I
Occasionally one wants to do the energy bookkeeping in terms of wavelength
instead of frequency . On then denes I by the relation
jI dj = jI dj
So that dE = I d2 dt d d. (The absolute value bars are to be sure that
energy comes out positive.) Using = c=,dd = c
2=
2
c:
So
I =2
cI =
c
2I :
Do not be confused by these extra factors of or . They are just bookkeep-
ing to make \per frequency" and \per wavelength" come out consistently
when describing the same amount of energy.
3.3.3 Net ux
If we want to know the total energy deposited onto a specic element of area
dA (on a detector, say), we integrate up the specic intensity coming from
solid angle elements in all directions. However, they do not all get equal
weight: the farther they are from normal incidence, the less \projected area"
of detector is available to them.
normal direction
d Ω
dA
θ
33

The net ux F (units erg cm2 s1Hz1) is thus
F =ZI cos d :
In spherical coordinates, d = sin d d' = d cos d'. What are the limits
of integration? If dA represents an opaque detector, goes from 0 to 90.
On the other hand, if dA is transparent, then goes from 0 to 180, and
the cos weighting is negative on the back side (90 < < 180).
For an isotropic radiation eld I is not a function of or ', and one sees
that the net ux (including from the back) is exactly zero.
As before we can do the bookkeeping \per wavelength" instead of \per
frequency," with
F 2
cF =
c
2F :
F is the energy ux per area per time per wavelength interval. In fact, it is
exactly the same quantity that we called f in the table of UBV photometry
in 2.2.1.
Note that we are always free to integrate up all the dierent frequencies
and obtain total integrated ux:
F =ZF d =
ZF d (erg s1 cm2)
I =ZI d =
ZI d (erg s1cm2ster1)
3.3.4 Energy density and radiation pressure
We already saw (3.1.2) that energy ux in a given direction is related to
the energy density of photons moving in that direction by a factor of c: the
block of photons smashes into the detector at that speed. Integrating over all
directions, the total energy density at a point, due to photons with energies
34

between and + d, is
u d =1
c
ZI d
d
and the total energy density is
u =Zu d =
1
c
Z ZI d d :
Pressure is force per area, or momentum transfer per area per time. Con-
sider photons bouncing back and forth between parallel perfect mirrors of
area A and separation L.
L
A
Each photon contributes u = E=(AL) to the energy density (since the
volume is AL). Each photon gives a momentum transfer 2p each time it
bounces o the mirror (+p goes to p, so the dierence is 2p). These bounces
occur (on a given mirror) every 2L=c time, so the photon's contribution to
the pressure is
P =2p
A(2L=c)=
pc
LA=
E
LA= u :
Adding up all the photons, we would nd
P = u (but wait!)
We have forgotten that photons are moving at dierent angles. A photon
moving at angle to the normal still contributes E=(AL) to u, but
35

L
θθ
the momentum transfer is now only 2p cos , and also it takes longer between
bounces,
t =2L=C
cos :
Therefore
P = cos2 u :
Adding up all the photons is the same as averaging an isotropic distribution
over cos2 :
hcos2 i =
RRcos2 d sin d'RR
d sin d'
=2R 0 cos2 sin d
2R 0 sin d
=
R 11
2dR 1
1 d=
1
3
(where we set = cos ). Another way to get this result is by symmetry:
Consider a randomly oriented unit vector, (x; y; z), with x2 + y
2 + z2 = 1.
Since there is nothing special about the x; y, or z directions with respect to
the unit sphere, we must have
hx2i = hy2i = hz2i :
But
hx2i + hy2i+ hz2i = hx2 + y
2 + z2i = h1i = 1 ;
so each one must be 1/3. Note that in spherical coordinates z = cos , and
we are done.
36
In either case, our nal result is
P =1
3u :
The pressure of isotropic radiation is exactly 1/3 its energy density.
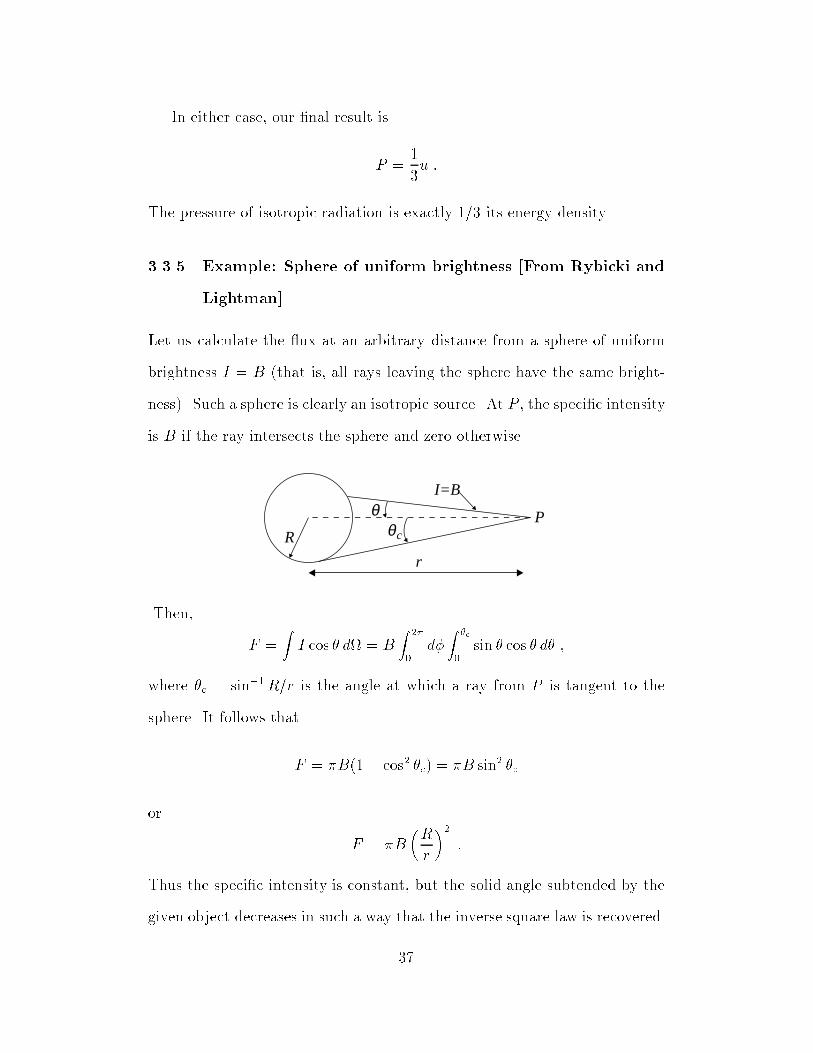
3.3.5 Example: Sphere of uniform brightness [From Rybicki and
Lightman]
Let us calculate the ux at an arbitrary distance from a sphere of uniform
brightness I = B (that is, all rays leaving the sphere have the same bright-
ness). Such a sphere is clearly an isotropic source. At P , the specic intensity
is B if the ray intersects the sphere and zero otherwise.
RP
I=B
r
cθθ
Then,
F =ZI cos d = B
Z 2
0d
Z c
0sin cos d ;
where c = sin1R=r is the angle at which a ray from P is tangent to the
sphere. It follows that
F = B(1 cos2 c) = B sin2 c
or
F = B
R
r
2:
Thus the specic intensity is constant, but the solid angle subtended by the
given object decreases in such a way that the inverse square law is recovered.
37

A useful result is obtained by setting r = R:
F = B :
That is, the ux at a surface of uniform brightness B is simply B.
3.4 Telescopes
3.4.1 Astronomical Telescopes
All modern telescopes (optical, radio, X-ray) are mirrors, not lenses. How-
ever, mirror optics is just lens optics folded over:
L
D D
L
Since it is easier to draw lenses, we will use the left hand gure, but you
should mentally translate it to the right-hand one. D is the aperture, L the
focal length.
The basic rules of ray tracing are:
rays go through center of lens unde ected
parallel rays get converged and come together at the focal length
That is all we need to get:
38

D
d
δθδθ δl
L
This is the basic \prime focus" astronomical telescope. The detector (CCD
array) goes at the focus. The \image scale" is the ratio of physical distance
at the focus to angular distance in the sky, and it depends only on the focal
length (see gure),
l
= L or
l= 1=L :
For example, the 16.8 m focal length of the Palomar 200 inch corresponds to
12 arcsec/mm (check this!)
The eld of view is determined by the focal length and the size of the
detector (d in the gure)
FOV = d=L :
In the above example, a CCD array of diameter 60 mm = 6 cm would have
a eld of view of
60mm12 arcsec
1 mm
1 arcmin
60 arcsec= 12 arcmin = 0:2 :
What is the relation between the surface brightness of an object in the
sky (a planet or galaxy, say) and the ux (energy per area per time) in its
image on the detector? We multiply I by the area of the lens (mirror) and
39

by the area conversion factor from sterradians to cm2 on the detector:
F (detector) = I (source)D
2
4
l
!2
=
4I
D
L
2:
The quantity L=D is called the f number of the telescope, written \f=#,"
so
F =
4I=(f=#)
2:
Notice that the image plane ux does not depend on the size of the telescope,
but only on its f=#. Photographers are familiar with this fact: a light meter
dictates an f=# and shutter speed, independent of the focal length of the
lens.
The Palomar 20000 is a \slow" telescope, about f=3:5 (that is, f=# = 3:5).
Modern telescopes are often between f=1:75 and (state of the art) f=1:25.
That is, they are \short" (focal length) and \wide" (aperture). If image ux
depends only on f -number, why not make tiny little fast (f=1:25) telescopes
| Palomar in your pocket or Keck in your khakis? Answers:
For bright objects (e.g. planets) we want the large image scale to get
more pixels (resolution elements on the detector) across the image.
For faint objects (e.g. distant galaxies) we are photon-starved and care
not so much about energy per unit area on the focal plane as about
total number of photons from the object per time, which scales as D2.
3.4.2 Telescopes you look through (e.g. binoculars)
This is not astronomy, but it once was, and you might be interested.
40
eyeball
eyepiece
pdD
δθδθ
angle δϕ
foca
lpl
ane
lL
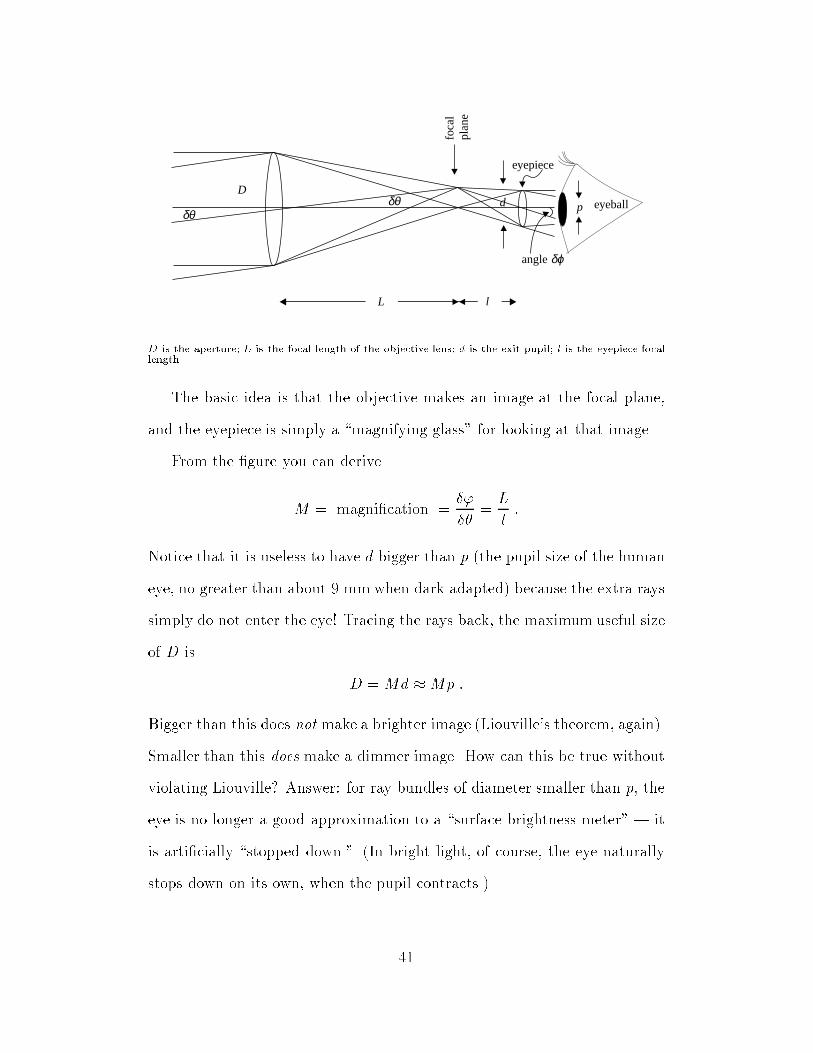
D is the aperture; L is the focal length of the objective lens; d is the exit pupil; l is the eyepiece focallength
The basic idea is that the objective makes an image at the focal plane,
and the eyepiece is simply a \magnifying glass" for looking at that image.
From the gure you can derive
M = magnication ='
=
L
l:
Notice that it is useless to have d bigger than p (the pupil size of the human
eye, no greater than about 9 mm when dark adapted) because the extra rays
simply do not enter the eye! Tracing the rays back, the maximum useful size
of D is
D = Md Mp :
Bigger than this does not make a brighter image (Liouville's theorem, again).
Smaller than this does make a dimmer image. How can this be true without
violating Liouville? Answer: for ray bundles of diameter smaller than p, the
eye is no longer a good approximation to a \surface brightness meter" | it
is articially \stopped down." (In bright light, of course, the eye naturally
stops down on its own, when the pupil contracts.)
41

3.5 Thermal (\Black Body") Radiation
3.5.1 Black Body radiation is universal
There are many dierent specic processes that can produce radiation (en-
ergy level changes in atoms, for example). These dierent processes can and
do produce dierent spectra, that is, dierent functional forms for the depen-
dence of I on . It is therefore an amazing fact that all systems in thermal
equilibrium at a temperature T produce the same universal spectrum, called
the Planck or black body spectrum
I = B(T ) :
The reason for this involves both some statistical mechanics and some quan-
tum mechanics. Roughly it is that the electromagnetic degrees of freedom of
the system come to the same thermal equilibrium as the mechanical (motion
of particles) degrees of freedom, each one getting a mean energy of
energy in each
degree of freedom
!=
1
2kT
where T is the temperature and k = 1:3806 1016 erg=K is Boltzman's
constant (really just a unit conversion to go from the historical but arbitrary
temperature unit of \degrees" to the natural temperature unit of ergs).
The huge importance of the Planck spectrum in astrophysics is because
many things we see are perfectly | or very nearly | in thermal equilibrium.
So the Planck spectrum is almost the universal spectrum of astrophysics.
Example 1: The surface of the Sun is nearly a black body emitter at
5770 K.
Example 2: Looking at the \dark" night sky, we are actually looking at the
42

cooling remnant radiation of the big bang | virtually a perfect black body
at T = 2:73K.
3.5.2 Derivation of the Planck spectrum
In other courses you will learn to count the degrees of freedom (modes) in
the electromagnetic eld and derive the Planck spectrum.
However, we can jump to the answer using things we already know, if I
just tell you a couple of \predigested" results from quantum mechanics and
statistical mechanics.
You have probably already seen the so-called \Boltzmann factor" that
gives the relative probability of something acquiring an energy E when it
has a temperature T ,
probability / eE=kT
:
For example, this is used to get the density law for an isothermal atmosphere
by putting E = mAgh (mA is the mass of an air molecule),
/ emAgh=kT :
The Boltzman factor eE=kT is actually the classical approximation (valid for
the atmosphere problem) to a deeper quantum mechanical result which we
now describe.
Remember phase space density, the number of particles per unit d3x d3p?
In quantum mechanics there is a natural unit (a kind of \quantum") for
phase space volume, and it is Planck's constant, cubed!
one quantum unit
of phase space
!= h
3:
43

The occupation number of a quantum system is the number of particles in
one quantum unit of phase space, or in terms of the phase space density N
occupation number = Nh3:
The deep result on thermal systems is that they have a universal mean oc-
cupation number given by
occupation number =1
eE=kT 1:
Notice that if E kT the 1 is negligible and we recover the classical result.
There are two fundamentally dierent kinds of particles in the universe
Fermions obey Pauli exclusion principleuse +1 above
includes protons, neutrons, electrons
Bosons \like to clump"
can correspond to classical wave elds use 1 above
include photons, gravitons
Now lets put the pieces together, using the result in 3.3.1 that relates N
and I
B(T ) = I =N
3h4
c2= (occupation number)
h3
c2
= 2h
3
c2
1
eE=kT 1=
2h3=c2
eh=kT 1:
Where did the extra factor of 2 come from in the last two equations? It is
the two polarizations of photons. Each one separately gets the occupation
number (eE=kT 1)1, and I counts both of them!
As before (Section 3.3.2) we have the option of accounting for the intensity
on a per-wavelength instead of per-frequency basis,
B =2
cB =
c
2B :
44

Since wavelength is easier to measure for light than frequency, one more
frequently sees B and I in observational contexts. A graph of B(T ) shows
that hotter T 's indeed give both
overall greater intensity everywhere, and
peak at shorter wavelengths.
2000 K
1750 K
1500 K
1250 K
0 1 2 3 4 5λ
B (
T)
λ
in mλ µ
3.5.3 Asymptotics of the Planck spectrum
For h kT , there is an exponential fall-o in brightness. This is called the
\Wien limit." It is why you cannot get a tan under an ordinary incandescent
light-bulb: The temperature of its lament is around 2700 K, and so it makes
almost no UV.
For h kT the exponential can be expanded
exp
h
kT
! 1 =
h
kT+
so that for hv kT , we have the Rayleigh-Jeans law:
B(T ) 22
c2kT :
45

Notice that this result does not contain Planck's constant. It was originally
derived by assuming a mean energy E = kT , the classical equipartition value
for the energy of an electromagnetic wave (12kT in each of two polarizations).
A plot of the Planck function over many decades of frequency, I, and tem-
perature shows clearly the asymptotic regimes (see gure on next page).
You can see why things are called \red hot" when the Wien limit is just
barely poking into the red from the infrared; then \white hot" when the peak
of B(T ) is at the eye's maximum visibility (about 6000 K); then \blue hot"
when the eye's sensitivity is completely in the Rayleigh-Jeans regime. There
is nothing \hotter than blue hot," because higher temperature just increases
the Rayleigh-Jeans spectrum's amplitude, linearly with T , without changing
the functional form of its 2 dependence on frequency.
46

B
22
1 Κ
10 Κ
610 ΚΚ710
Κ105
Κ410
10 Κ3
102 Κ
810 Κ
10 10 10 10 10 10 10 10106104 8 10 12 14 16 18 20
10−12106 104 102 10 −4 10−6 10−8 10−101 10 −2
10−12106 104 102 10−6 10−101 10 −2
10−16
10−12
10−8
10−20
104
108
−410
1
1012 10
10
10
10
10
10−10
10−5
105
1010
1015
1020
25
35
40
45
1
30
10 10 10 10106 108 1010 1012 1014 16 18 20 22
λ (cm)
λ (cm)
v(Hz)
v(Hz)B
ν(e
rg s
eccm
Hz
ster
−1−1
−1−2
)
(erg
sec
cmH
zst
er−1
−1−1
−2)
νB
λB
λ
The peak of the black-body spectrum is found, letting x = h=kT , as
follows:
0 =d
dx
x3
ex 1
!=
3x2(ex 1) x3ex
(ex 1)2
) x = 3(1 ex)
) (e.g. by trial and error) x 2:82 ;
so at the peak
hmax = 2:82kT
47
or
max
T= 5:88 1010Hz=K :
Notice that the extra powers of in
B(T ) = B(T )
dd = c
2B(T )
shifts its peak a bit relative to B , so at the maximum of B (you can check
this)
h
c
max
=kT = 4:97
or
maxT = 0:290 cmK (\Wien's displacement law.")
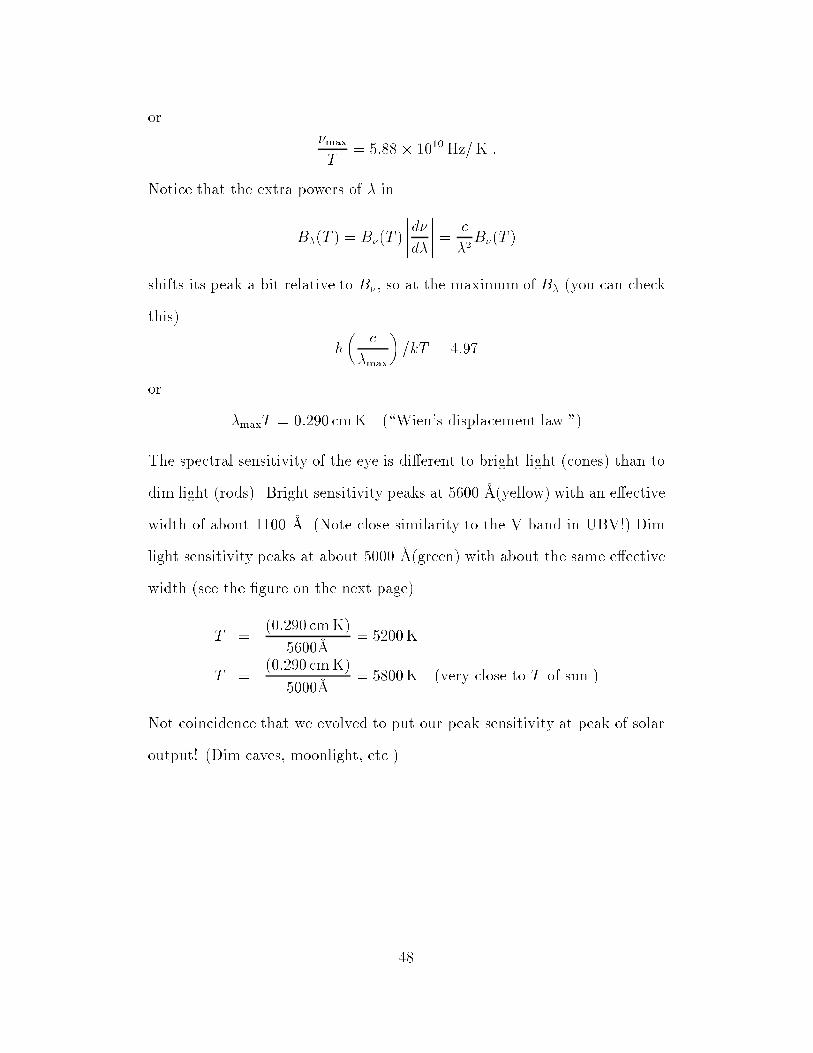
The spectral sensitivity of the eye is dierent to bright light (cones) than to
dim light (rods). Bright sensitivity peaks at 5600 A(yellow) with an eective
width of about 1100 A. (Note close similarity to the V band in UBV!) Dim
light sensitivity peaks at about 5000 A(green) with about the same eective
width (see the gure on the next page).
T =(0:290 cmK)
5600A= 5200K
T =(0:290 cmK)
5000A= 5800K (very close to T of sun.)
Not coincidence that we evolved to put our peak sensitivity at peak of solar
output! (Dim caves, moonlight, etc.)
48

350 400 450 500 550 600 650 700 7500.0
0.1
0.2
0.3
0.4
0.5
0.6
0.7
0.8
0.9
1.0
Rel
ativ
e V
isib
ility
violet blue green yellow orange red
(nm)λ
cones"Photopic"bright light
red looks"black" in dim light
rods"Scotopic"dim light
3.5.4 Integral of the Planck spectrum: Stephan-Boltzman law
What is the total energy density in an isotropic radiation eld at constant
temperature (e.g. inside a furnace, or a star)?
From 3.3.4 we calculate
u =1
c
Z ZI d d =
4
c
ZId
=4
c
Z2h3=c2
eh=kT 1d
=4
c
2h
c2
kT
h
!4 Z1
0
x3dx
ex 1
where x h=kT . The integral is just a number . You can do it numerically,
or look it up in a table of integrals. (Some day you should learn how to do
it by contour integration.)
The answer is 4=15, so
u =85
15
k4
h3c3T4 aT
4
49

where a is called the \radiation density constant" and has the value
a = 7:56464 1015 erg cm3K4:
Next: What is the emergent ux from a black body surface? That is, how
many ergs per second does it emit per unit area? In 3.3.5 we already obtained
the result
F = B
relating ux and brightness, so
F =
ZI d =
c
4u (from above)
=ac
4T4 T
4:
The physical constant = ac=4 is called the Stefan-Boltzmann constant and
has the value
= 5:66956 105 erg cm2 s1K4:
Example 1: A sphere of radius 7:0 1010 cm has a temperature of 5770K.
What is its luminosity?
L = 4r2F = 4r2T 4
= 4(7:0 1010 cm)2(5770K)4(5:67 105 erg cm2 s1K4)
= 3:9 1033 erg= s :
Example 2: How many watts of total luminous power are emitted by the
standard \candle" that denes the lumen (1=60 cm2 at 2044 K)?
L = AT4 =
1
60cm2(2044K)4(5:67 105 erg cm2 s1K4)
= 5:25 106 erg= s = 0:525W :
50

In a real candle, many times this much power, perhaps 100, is carried o
convectively by hot air. Note that at T = 2044K (melting point of platinum)
max =0:290 cm K
2044 K= 14000A (infrared!)
So the \candle" is extremely red | we are seeing only its Wien-limit
tail. Lumens and lux are so-called \photometric" (apparent) units, which
therefore implicitly include the human eye's sensitivity, as opposed to \ra-
diometric" units, which are in absolute c.g.s. At more visible colors there are
therefore many more lumens per watt than the value 2 that we got above
for the dull red glow of melting platinum. At 5550 A, there is a peak of 680
lumens per watt. The lumens per watt conversion at other wavelengths is
this value times a standardized form of the sensitivity curve shown above
(3.5.3). Light bulbs are often labeled with their lumens value as well as their
wattage. For example, a typical 100W bulb may yield 1710 lumens for 750
hours.
3.5.5 Color temperature and brightness temperature
Color Temperature. Often a spectrum is measured to have a shape more or
less of blackbody form, but not necessarily of the proper absolute value. For
example, by measuring F from an unresolved source we cannot nd I unless
we know the distance to the source and its physical size. By tting the data
to a blackbody curve without regard to vertical scale, a color temperature Tc
is obtained. Often the \tting" procedure is nothing more than estimating
the peak of the spectrum and applying Wien's displacement law to nd a
temperature." [Rybicki and Lightman]
For example, the color temperature of moonlight is very nearly the same
51

as that of sunlight. Long-exposure color pictures by moonlight appear in nor-
mal colors, despite the inability of your eye's cones to function at moonlight
levels.
Brightness Temperature. The Planck spectrum is monotonic with
temperature at each and every frequency (see previous gure). Therefore a
measurement of I at any single frequency determines a temperature, called
the \brightness temperature." Of course, identifying this temperature with
a real physical temperature of the emitting object depends on knowing the
the rest of the spectrum also ts a black body shape. The Planck spectrum
by denition has the same brightness temperature at all frequencies.
The brightness temperature of the night sky is 200 300K where the
atmosphere is opaque, and as low as 3K (cosmic microwave background
temperature) in atmospheric \windows" of transparency.
0.1 nm 1 nm 10 nm 100 nm 1 µm 100 µm10 µm 1 cm 10 cm 1 m 10 m 100 m0
1
wavelength
tran
smis
sion
Atmosphere is opaque
Optical window
Atmosphere is opaque
Radio window
Atmosphere is opaque
2.2µ
3 -
5µ8
- 12
µ
Note the \infrared windows" at 2:2; 3 5; 8 12, as well as the large
optical and radio windows. UV and X-ray astronomy can only be done from
space.
3.5.6 Radiative temperature balance of the Earth
In the most naive model, the Earth maintains that temperature at which it
radiates (in the infrared) exactly the same average power as it receives from
the Sun. Note that the Sun illuminates R2 of projected Earth area, while
52

the actual surface area is 4R2, so the average \insolation" (as it is called)
is 1/4 the solar constant
F ins =1
4 1400w=m2
3:5 105 erg s1 cm2:
The outgoing infrared ux at temperature T is T 4, so:
5:67 105 erg cm2 s1K4
T4 = 3:5 105 erg s1 cm2
) T = 280K = 7 C = 44 F chilly!
The reason the Earth is actually warmer than this is because of the
\greenhouse eect." Atmospheric gasses absorb the IR emitted from the
ground and re-radiate it to space. You might think that this is a \wash,"
but not so, as the following gure shows:
visi
ble
IR IRIR
2I I
I
I
greenhousegases H O, CO22
You see that the ground must radiate twice the incident ux I to stay in
equilibrium. Thus,
(5:67 105)T 4K = 7:0 105
) TK = 333K = 60C = 140 F hot!
The reason it is not this hot is that the greenhouse is not totally absorb-
ing (note the partial \windows" between 8 and 20 in the gure in Section
3.5.5). You can see why there are environmental worries about increasing
the greenhouse gasses, however!
53

Keep in mind that the above calculations are idealized, because clouds
re ect sunlight directly, and because transport of heat from equatorial to
polar regions (by weather and ocean currents) is a big eect. It must still be
true, however, that net solar ux in equals total IR ux out when averaged
over time and latitude.
3.5.7 The spectral sequence of stars
Stars are classied observationally primarily by their color temperature |
because, historically, this can be measured without knowing the distance.
Before black body radiation was understood, an alphabetic sequence was de-
veloped empirically. This spectral sequence correlates not only strongly with
color temperature, but also (not surprisingly) with the appearance of dier-
ent absorption lines, because the ability of atoms in the outer atmospher of a
star to absorb light depends on their ionization state and, thus, temperature.
The Spectral Sequence
Spectral Color B-V color Temperature Spectral lines Examplesclass Index (K)
O Blue-violet :35 28;000 50;000 Ionized atoms, Naos ( Pup),
especially helium Mintaka ( Ori)
B Blue-white :16 10;000 28;000 Neutral helium, Spica ( Vir),
some hydrogen Rigel ( Ori)
A White +:13 7;500 10;000 Strong hydrogen, Sirus ( CMa),some ionized Vega ( Lyr)metals
F Yellow-white +:42 6;000 7; 500 Hydrogen and ionized Canopus ( Car),
metals such as Procyon ( CMi)calcium and iron
G Yellow +:70 5;000 6; 000 Ionized calcium and Sun,both neutral and Capella ( Aur)ionized metals
K Orange +1:2 3;500 5; 000 Neutral metals Arcturus ( Boo),Aldebraran ( Tau)
M Red-orange +1:2 2;500 3; 500 Strong titanium oxide Antares ( Sco),
and some neutral Betelgeuse ( Ori)calcium
54

9>>>>>>>>>>>>>>>>>>>>>>>=>>>>>>>>>>>>>>>>>>>>>>>;
Here we are seeing the Rayleigh-Jeans
continua, ux proportional to
temperature, with relativelysmall and few absorption features.(Compare shape of curves in the gurein Section 3.5.2)
here we clearly see the peak
of the Planck function, around 4500 A
the Sun ts in here (G5)
9>>>>>>>>>>>>>>>>>>>>=>>>>>>>>>>>>>>>>>>>>;
Here we are on the Wien tail,
with lots of messy absorption
lines and molecular bands.
55

Within each spectral class there are ner steps: : : : B0, B1, B2,: : :B9,
A0, A1: : :A9. etc. B5 is a typical B star. The Sun is a typical G star, that
is, G5. When astronomers nally knew the distances to enough stars to get
their absolute magnitudes or luminosities, and plotted these against their
spectral types or color temperatures, they got a big surprise:
Barnard's star
Procyon B
Sirius B
SunAltair
Procyon APollux
Arcturus AldebaranMira
Antares
BetelgeuseDenebRigel
Sirius A
VegaRegulus
+15
+10
+5
0
−10
−5
O5 B0 A0 F0 G0 K0 M0 M8
(dim)
(Hot) (Cool)Spectral Type or Temperature
Abs
olut
e m
agni
tude
or
Lum
inos
ity
(bright)
The stars are not randomly scattered, but ordered in some weird way! Uh,
oh; call in the astrophysicists! This kind of diagram is called a Hertzsprung-
Russell or H-R diagram. Ejnar Hertzsprung discovered it in 1905, and Henry
Morris Russell re-discovered it nearly 10 years later. (News travelled slow
then. There were very few astronomers in the world and not many interna-
tional conferences.)
56

3.6 Radiation emission mechanisms brie y described
Black body radiation is radiation that has come to thermal equilibrium and
lost the memory of its original \creation." Sometimes, however, we are able
to see photons directly as produced by the underlying microscopic processes.
These need not have a Planck spectrum. What, microscopically, causes the
radiation we see? The direct cause is always the same: acceleration of a
charge creates radiation. The radiation is generally classied according to
what causes the acceleration. We will list here three of the most important
mechanisms. (You will learn much more about this in Astronomy 150.)
3.6.1 Synchrotron radiation
Relativistic electrons being accelerated by magnetic elds (moving in helical
patterns around eld lines):
radiation emitted
e
B
-
Radiation is intense; often highly polarized; usually power-law spectrum.
cut-off at lowfrequency mayappear
log may bend/break at high frequency.
v
log vIvI v α-
α ~ 0.5 but may be~0 or ~2!
is proportional to
Radio emission; traces very energetic regions.
57
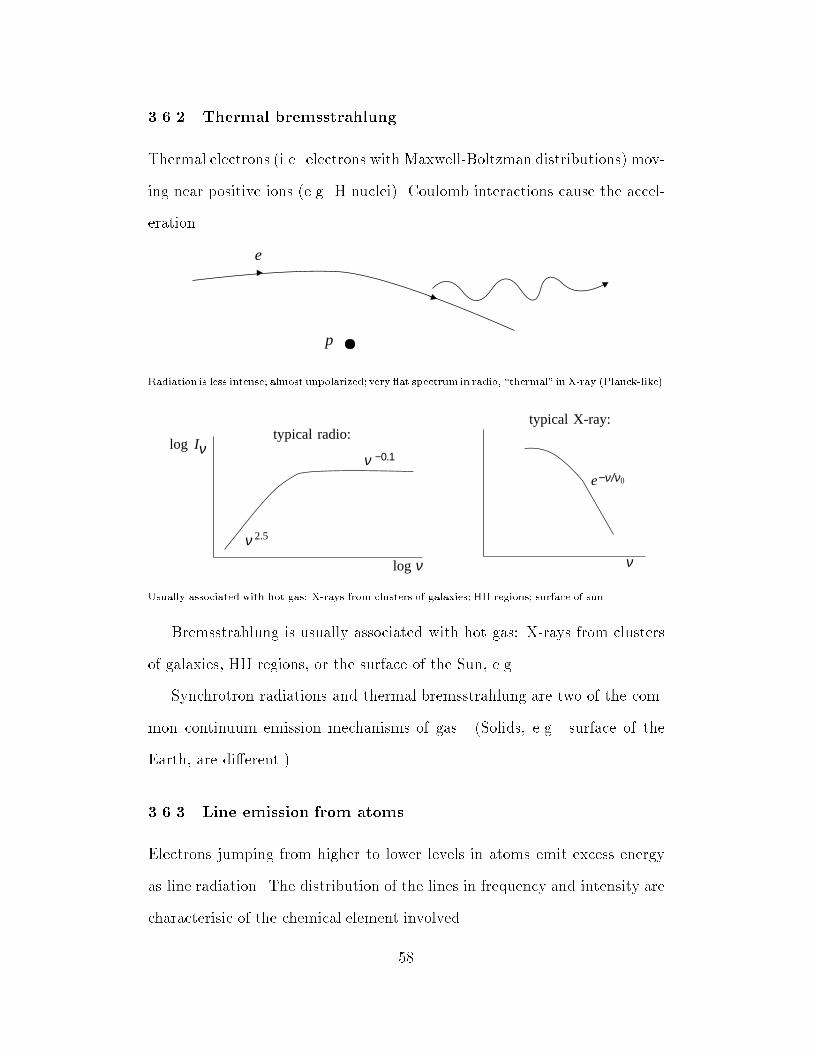
3.6.2 Thermal bremsstrahlung
Thermal electrons (i.e. electrons with Maxwell-Boltzman distributions) mov-
ing near positive ions (e.g. H nuclei). Coulomb interactions cause the accel-
eration.
e
p
Radiation is less intense; almost unpolarized; very at spectrum in radio, \thermal" in X-ray (Planck-like).
typical radio:typical X-ray:
e−ν/ν0
ν
ν
ννlog
−0.1
2.5
Iνlog
Usually associated with hot gas: X-rays from clusters of galaxies; HII regions; surface of sun.
Bremsstrahlung is usually associated with hot gas: X-rays from clusters
of galaxies, HII regions, or the surface of the Sun, e.g.
Synchrotron radiations and thermal bremsstrahlung are two of the com-
mon continuum emission mechanisms of gas. (Solids, e.g. surface of the
Earth, are dierent.)
3.6.3 Line emission from atoms
Electrons jumping from higher to lower levels in atoms emit excess energy
as line radiation. The distribution of the lines in frequency and intensity are
characterisic of the chemical element involved.
58

unbound statesEnergy
0
e-
ε h εν =
Ιν
ν
Spectrum
Seen from hot gas (may see lines from many types of atom simultaneously). Molecules also make lines.
There are also absorption spectra, radiation absorbed by cooler material
(lines or continuum), the inverse process.
59