Embed Size (px)
Citation preview
HVAC Permitting: A Study to Inform IOU
HVAC Programs
Pacific Gas and Electric Company
Prepared by DNV GL
10/10/2014
CALMAC ID: PGE0349.01
DNV GL - Energy
Copyright © 2014, DNV GL (KEMA, Inc.)
This document, and the information contained herein, is the exclusive, confidential and proprietary
property of KEMA, Inc. and is protected under the trade secret and copyright laws of the United States
and other international laws, treaties and conventions. No part of this work may be disclosed to any third
party or used, reproduced or transmitted in any form or by any means, electronic or mechanical,
including photocopying and recording, or by any information storage or retrieval system, without first
receiving the express written permission of KEMA, Inc. Except as otherwise noted, all trademarks
appearing herein are proprietary to KEMA, Inc.
DNV GL - Energy i October 10, 2014
Table of Contents
Executive Summary ................................................................................................................... 1-1 1.
Permit Rates .................................................................................................................... 1-3 1.1
Permitting Effect on QI Baseline Assumptions ............................................................ 1-4 1.2
1.2.1 Duct Leakage ........................................................................................................... 1-4
1.2.2 System Airflow ......................................................................................................... 1-5
1.2.3 System Sizing ........................................................................................................... 1-5
Introduction .............................................................................................................................. 2-6 2.
IOU HVAC Programs Targeted for This Study ........................................................................ 3-7 3.
3.1.1 Permit Requirements for Program Participants ................................................... 3-7
3.1.2 Residential Code Compliance Program ................................................................ 3-8
3.1.3 QI Residential Rebate Program ............................................................................. 3-8
3.1.4 QI Program Workpaper Assumptions .................................................................. 3-9
3.1.5 Title 24 Residential Requirements Relative to QI Workpaper Assumptions .... 3-9
Permitting Rate ........................................................................................................................ 4-11 4.
Data Sources .................................................................................................................. 4-12 4.1
Data Collection ................................................................................................................ 4-1 4.2
4.2.1 Permit Data Collection and Sampling Processes .................................................. 4-1
4.2.2 Permit Data Collection Sample Design for Upstream Data ................................ 4-2
4.2.3 Compliance Data Collection from HERs Rater Registries .................................. 4-3
Methods to Determine Permit Rates ............................................................................ 4-3 4.3
Permit Rate Results ....................................................................................................... 4-5 4.4
Permitting Effect on QI Workpaper Baseline Assumptions.................................................... 5-7 5.
5.1.1 Duct Leakage ........................................................................................................... 5-7
5.1.2 System Airflow ........................................................................................................ 5-8
5.1.3 Cooling System Sizing ............................................................................................ 5-9
Conclusions............................................................................................................................... 6-12 6.
Permit Rate Conclusions .............................................................................................. 6-12 6.1
Conclusions on Permitting Effect on QI Workpaper Baseline Assumptions............ 6-13 6.2
Glossary ...................................................................................................................................... 7-1 7.
References................................................................................................................................... 8-1 8.
Appendix: Geographic Distribution of Building Departments ............................................... 9-1 9.
DNV GL - Energy ii October 10, 2014
List of Figures
Figure 1: Total Duct Leakage for QI Non-Participants .................................................................. 5-8
Figure 2: Distribution of Airflow per Ton for QI Non-Participants .............................................. 5-9
Figure 3: Distribution of ACCA Manual J System Sizing for QI Non-Participants .................... 5-11
Figure 4: Northern California Building Departments..................................................................... 9-1
Figure 5: Central Valley Building Departments ............................................................................. 9-2
Figure 6: Southern California Building Departments .................................................................... 9-2
List of Tables
Table 1: Incentive Structure for the Code Compliance program ................................................... 3-8
Table 2: Data Source Matrix ............................................................................................................. 4-1
Table 3: Rate of Permitting by Sample Type .................................................................................. 4-5
Table 4: Total Duct Leakage for QI Non-Participants ....................................................................5-7
Table 5: Airflow per Ton for QI Non-Participants ......................................................................... 5-8
DNV GL - Energy 1-1 October 10, 2014
Executive Summary 1.
California’s evolving and complex energy regulatory environment and diverse climates make it
challenging for investor owned utilities (IOUs) to implement heating, ventilation and air
conditioning (HVAC) incentive programs uniformly across service territories. A major concern
for IOUs is whether replacement HVAC systems that are incentivized under such programs are
obtaining permits by the local code enforcement agencies as required by law. Energy code
requirements are specific to the geographic location of an HVAC system (climate zone or CZ)
and conditions set by the existence of supportive hardware for the system (e.g., new or replaced
ducting), and are up to the discretion of local building regulatory agencies to enforce. These
factors make it difficult for IOUs to implement programs with uniform standards and
requirements across the service territories as well as ensure that incentivized HVAC
replacements are permitted. This report focuses on complete HVAC system replacements,
referred to as a “change-out” throughout.1
Pacific Gas and Electric Company (PG&E) asked DNV GL to answer two primary questions. The
first was to estimate the proportion of change-outs that applied for a mechanical permit as
required by local building code. The second was to find out to what extent energy efficiency
performance differs for three energy-related metrics (duct leakage, airflow, and system sizing) in
residential change-outs that did and did not receive a permit.
The answers provided in this evaluation are meant to inform the 2013-2104 pilot HVAC
Residential Code Compliance Program (referred to as Code Compliance, throughout) and
provide feedback for the residential HVAC Quality Installation (QI) Program, which has been in
existence since 2010. The two programs focus on different issues related to HVAC change-outs,
but have a common goal of improved system performance that leads to reduced electric energy
and power consumption. They also share an assumption that is tested in this study; that getting
a permit, which activates energy code requirements, will result in optimal HVAC unit
performance.
The QI program assumptions use only a subset of the mechanical change-out requirements set
by the Standards and do not take into account local jurisdiction differences. This allows for
1 There are two types of HVAC replacements defined by the 2008 California Energy Commission
(CEC) Title 24, Part 6 Energy Code Standards (Standards): (1) a new or replacement space-
conditioning system, and (2) an altered space-conditioning system. The Standards define it as a
space conditioning system that is altered by the installation or replacement of the air handler
and outdoor condensing unit of a split system air conditioner or heat pump.
http://www.energy.ca.gov/2008publications/CEC-400-2008-001/CEC-400-2008-001-CMF.PDF
DNV GL - Energy 1-2 October 10, 2014
uniform program delivery across the IOUs, but it is a considerable limitation of this study, which
used data from its recent evaluation. This study also used sampling methods from multiple data
sources, so the findings aren’t statistically rigorous enough to extrapolate to the entire state. The
findings are only intended to inform QI and Code Compliance program implementers.
The Code Compliance program began in the 2013-2014 program cycle and is still in its infancy,
but IOUs expect the incentive to be available the third quarter of 2014. The program has
collected preliminary data to develop a baseline of permit rates pulled from a few local building
departments that are served by the program. The baseline data will eventually serve as a
measure of change due to program intervention, but currently is intended to provide a reference
point to inform program planners on the frequency of permitting by providing statewide
estimates across several code enforcement agencies. The data does not establish an absolute
baseline given the statistical rigor applied and potential biases that may exist in one or more of
the secondary data sources used. The program is further defined in Section 3.1.1 of this report.
The activities in this study included searching for evidence of mechanical permits in a sample of
350 commercial- and residential-change-outs at 109 local code enforcement agencies (referred
to as building departments or BDs throughout the report). The sample contained both program
incentivized and non-incentivized equipment. Throughout this report, non-incentivized
equipment is defined as HVAC change-outs that did not receive an IOU-sponsored incentive and
incentivized equipment as incentivized change-outs. A sub-sample of sites was also used to test
QI program assumptions for the three program measures—duct leakage, airflow, and system
sizing.
The on-site sample in this report was derived from DNV GL’s previous evaluation,
measurement, and verification (EM&V) of the 2010-2012 QI program for the California Public
Utility Commission (CPUC), the government entity that approves energy savings. In that study,
consultants conducted field tests on a sample of participant homes and compared it with a
closely matching sample of non-participant homes. The non-participant sample was used to test
the QI assumptions for the three program measures.
This study also leveraged secondary data from a variety of sources including program tracking
data, market saturation studies, and impact evaluations. A brief and list description of the
secondary data sources, including CPUC work orders (WO) used in this report is as follows:
HVAC Market Effects Study (CPUC WO54): Telephone surveys identified recent
HVAC replacement installations among residential and commercial customers.
California Lighting and Appliance Saturation Study (referred to as CLASS):
Telephone calls with follow-up on-site inspections identified replacement installations
among residential customers.
DNV GL - Energy 1-3 October 10, 2014
Commercial Saturation Study (CPUC WO24 referred to as CSS): Telephone
calls with follow-up on-site inspections identified replacement installations among
commercial customers.
Upstream Commercial Incentive Program Tracking Data (referred to as
Upstream): The participants were HVAC distributors, no contact with customers who
received new equipment. The study leveraged tracking data of high efficiency HVAC
installations at commercial businesses for program years 2010-2012.
Quality Installation Residential Rebate Program Impact Evaluation (CPUC
WO32 referred to as QI):2 No participant contact. Telephone calls with non-
participants followed by on-site inspections identified replacement installations among
residential customers whose HVAC systems had characteristics of the participant
population for program years 2010-2012.
The secondary data sources are defined in 4.1 (Table 2: Data Source Matrix), the primary data
collection methodology defined in Section 4.1, and the results are defined in Section 4.3.
Permit Rates 1.1
The rate of permitting was derived from the frequency of known HVAC change-outs that
obtained permits. The identification process of HVAC change-outs is described in detail in
Section 4.
DNV GL consultants searched for evidence of commercial and residential mechanical permits
for 350 HVAC unit change-outs from 109 of the 530 local departments responsible for building
codes throughout California. The residential and commercial data sources contained samples of
permits for unitary HVAC installations (package and split systems) from 2010 to 2012.
Incentivized equipment is defined as those change-outs that did receive an IOU-sponsored
incentive and non-incentivized equipment change-outs that did not.
The first piece of information obtained was the frequency of permitting. The following permit
rates were found by category:
Non-Participant Residential 38 percent (there was no participant residential sample
because HVAC programs have permitting requirements)
Non-Participant Commercial 13 percent
Upstream Participant Commercial 32 percent (SCE service territory)
Upstream Participant Commercial 26 percent (PG&E service territory)
2 DNV GL, Quality Installation (QI) Residential Rebate Program Impact Evaluation, in process
DNV GL - Energy 1-4 October 10, 2014
Approximately 8 percent of the commercial sample was excluded and filed as inconclusive due
to lack of sufficient permit record detail.
Common expectations for permit rates for HVAC change-outs are in the range of 10-30 percent3,
and in general, permit rates among non-incentivized equipment were in line with these
expectations. The Upstream program tracking data, which provided a substantial source of data
for this study, did not track permit rates. However, it was anticipated that permit rates would be
greater because the equipment sold exceeded code efficiency requirements and therefore buyers
would be more likely to obtain permits for greater efficiency equipment.
Permitting Effect on QI Baseline Assumptions 1.2
Program administrators estimate energy savings for measures using assumptions and
calculations, which are found in a document commonly referred to as a workpaper. Program
administrators submit their workpapers to the CPUC for approval.4
The CPUC QI impact evaluation assessed workpaper baseline assumptions through site tests
and inspections. This study adds to that body of knowledge by providing data for each site on
whether a permit was on record at the local BD for the change-out. The results of this study are
relative to the QI workpaper baseline assumptions for duct leakage, minimum airflow, and
system sizing.
The core of data collection efforts for this study was matching the addresses of all recent change-
outs with permit records from the appropriate jurisdiction. In addition to permit verification
data, consultants sought measurement data to compare to workpaper assumptions. Consultants
had limited success acquiring data from Home Energy Rating System (HERS) registry
companies due to privacy policies intended to protect customers and contractors. The QI impact
evaluation study conducted on-site visits of 50 residential sites that were non-incentivized
equipment in QI programs. This sample was used to test the QI baseline assumptions for the
three program measures in this study.
1.2.1 Duct Leakage
The QI program requirement for duct leakage states that leakage must be below 15 percent of
nominal airflow. Duct leakage test results from a previous impact evaluation study of the
3 G. William Pennington, “Underground Economy: Contractors Failure to Pull Permits for Residential HVAC Replacements” Testimony to the Little Hoover Commission, 27 March 2014 pg.1-17 4 The process of developing workpapers can be found on the CPUC website under non-DEER workpaper values for energy efficiency measures: http://www.cpuc.ca.gov/PUC/energy/Energy+Efficiency/exantereiew.htm
DNV GL - Energy 1-5 October 10, 2014
program found that in the non-participant sample, many sites had duct leakage in excess of 15
percent, but on average duct leakage was lower than the QI program assumption, which was 24
percent.
1.2.2 System Airflow
The QI program requirement for system airflow is a minimum of 400 cubic feet per minute
(CFM) per ton of cooling capacity. Data from the QI program evaluation showed that many non-
participant sites had lower airflow, 298 CFM/ton to 315 CFM/ton, than the QI program
assumption of 350 CFM/ton. The range of airflow distributions are reported in Table 5.
1.2.3 System Sizing
The QI workpaper assumes program incentivized equipment are sized properly and non-
incentivized equipment are oversized on average by 20 percent. System sizing calculations
provide an estimate of the amount of heating and cooling needed for a building. The Air
Conditioning Contractors of America (ACCA) Manual J calculator A was used to estimate
cooling loads in this study.5 Consultants collected data relevant to the calculation at a sample of
buildings and used the data to develop the ACCA Manual J-based system-sizing model for all QI
residential non-incentivized equipment. The calculated size was then compared to the installed
tonnage to determine the amount of over- or under-sizing. On average, the QI residential non-
incentivized equipment systems were oversized by 13 percent.
5 ACAA Manual J Calculator Website - http://www.acca.org/technical-manual/manual-j/
DNV GL - Energy 2-6 October 10, 2014
Introduction 2.
In 2008, the CPUC’s Energy Division (ED) published The California Energy Efficiency Strategic
Plan (plan) that established significant residential and commercial energy objectives. The plan
goal is for a 50 percent permit rate by 2015 and a permit rate greater than 90 percent by 2020.6
The plan assumes that getting a permit, which activates energy code requirements, will result in
more efficient HVAC change-outs than without a permit. A major concern IOUs have about the
plan is whether HVAC change-outs are obtaining permits as required by the Standards. To help
California’s HVAC sector achieve the goals described in this plan, CPUC developed an HVAC
Action Plan with contributions from ED staff, California’s IOUs, the Western HVAC
Performance Alliance, and other HVAC stakeholders.
IOUs have two main questions about the savings assumptions for HVAC change-outs: First,
what portion of HVAC change-out projects in the residential and small commercial markets
apply for and receive permits, and second, whether and how much energy is saved through the
procedures that permitting requires.
This study draws on data from recent HVAC installations collected by market studies and
impact evaluations sponsored by the California Public Utilities Commission (CPUC) to address
the two research questions:
1. What proportion of the sample applied for a mechanical permit as required by code local building department?
2. To what extent does energy efficiency performance differ between installations that receive a permit and those that did not for three energy-related measures—duct leakage, airflow, and system sizing?
DNV GL conducted a small-scale study on permitting for HVAC system change-outs using data
from prior HVAC Impact and Market Effects Studies, CLASS and CSS studies, and Upstream
program tracking data to estimate a baseline for energy savings from HVAC change-outs. PG&E
anticipates the results of this research will inform future program planning. The core benefit of
performing this small-scale research study such was that it utilized existing data in place of the
most expensive and time-consuming of the activities: identification, recruitment, and on-site
testing of the installation quality, which was needed to answer the research questions.
The programs of interest are defined in Section 3. The permit rate data and analysis are
described in Section 4 and the effect of permitting on QI baseline assumption is described in
Section 5. The report concludes with summary and discussion relative to future programs.
6 California Long-term Energy Efficiency Strategic Plan, Goal 1 in Section 6-Page 54,: http://www.energy.ca.gov/ab758/documents/CAEnergyEfficiencyStrategicPlan_Jan2011.pdf
DNV GL - Energy 3-7 October 10, 2014
IOU HVAC Programs Targeted for This Study 3.
The IOUs administer numerous HVAC programs, but this study tests assumptions made in the
QI program workpaper and serves as a point of reference on the permit rate for the Code
Compliance pilot program. This chapter provides program permitting requirements in general
and briefly describes the programs, QI program workpaper assumptions, and relevant Title 24,
Part 6 requirements.
3.1.1 Permit Requirements for Program Incentivized equipment
In 2011 and 2012 the IOUs added language to their incentive forms to address minimum
efficiency standards and permit requirements for appliance, electronics, and other end uses that
have efficiency or permit requirements. The IOUs also provided a set of guidelines for their
customers to follow.7 The language added to incentives was effectively an affirmation that a
permit was obtained:
appropriate, and followed applicable permitting requirements for this
installation.
The justification for these changes is in response to Senate Bill 4548 and described in the
“Testimony to the Little Hoover Commission,” 9 which explains how the IOUs were required by
the California Attorney General’s Office to address this issue of paying rebates for potentially
unpermitted units. As explained in the testimony, the affirmation and guidelines was effectively
a compromise, after much legal discussion, the IOUs asserted they were not legally obligated to
act as an enforcement agency and enforce permitting of rebated units.
The two HVAC programs described in this report, Code Compliance and the SCE QI Program,
both require evidence of permits as opposed to an affirmation and they require Home Energy
Raters (HERS) compliance forms. Because the SCE QI program required permits for the
submission of a rebate (although they do not distinguish between permitted and “final permits”)
researchers did not seek for evidence of them and did not have a residential participant sample
to compare to the residential non-incentivized equipment as it relates to permitting. The
7 Guide for HVAC System https://www.socalgas.com/for-your-business/rebates/hvac-systems.shtml 8 Energy Efficiency Standards, Senate Bill 454, 05 July 2011, http://www.leginfo.ca.gov/pub/11-12/bill/sen/sb_0451-0500/sb_454_cfa_20110701_170632_asm_comm.html
9 G. William Pennington, “Underground Economy: Contractors Failure to Pull Permits for Residential
HVAC Replacements” Testimony to the Little Hoover Commission, 27 March 2014 pg.1-17;
http://www.lhc.ca.gov/studies/activestudies/underground%20economy/March%20Testimony/Pennington%20Testimony.pdf
DNV GL - Energy 3-8 October 10, 2014
Upstream program did not require evidence of permits since i the program is targeted to
distributors to increase stocking and sales of high efficient HVAC equipment.
3.1.2 Residential Code Compliance Program
In 2013 the CPUC directed the IOUs to implement the residential Code Compliance program.
The program aims to increase the rate of permitting by providing incentives to residential
customers who complete a HVAC permit. And to distributors who voluntarily participate by
collecting and submitting a Home Energy Rating System (HERS) unique ID and job compliance
forms (Table 1). The incentives can be shared in part or in full with contractors.
Table 1: Incentive Structure for the Residential Code Compliance Program
Entity Receiving the Incentive Incentive Amount Objective
Distributor or Contractor $100 Collect and submit HERS registry unique ID and job compliance forms (CF-1R).10
Residential Customers $200 Obtain finalized permit for job.
The Code Compliance pilot will be offered to customers beginning the 3rd or 4th quarter of 2014
depending on the IOU. The program will be offering in the Fresno area by PG&E, the Coachella
Valley and Palm Springs areas by SCE and SoCalGas, and San Diego County by SDGE.11
3.1.3 QI Residential Rebate Program
As implied, the QI rebate program aims to improve the installation of newly replaced HVAC
systems. During the 2010-12 program cycle the QI program was only offered by SCE for
residential customers in its service territory.12 Rebates were capped at approximately $1,000.
HVAC contractors installing units under this program must adhere to ENERGY STAR® QI
guidelines and permit and compliance requirements. The program’s implementation contractor
is Conservation Services Group (CSG). Since 2010, CSG has required contractors to submit a
permit for projects under this program. According to program staff, a permit is required;
however, the program does not require a “final” permit.13 The program website also states HERS
10 HERS ID is the proof that the HERS verification process has been initiated; CF-1R is one of the certificates of compliance filed during the permitting process; other types may apply according to the job type and stage of the process.
12 In 2012-14 program years PG&E offered the QI program, but in a different capacity, as an educational program not an incentive program that claims savings. 13 Conservation Service Group, personal communication, August 11, 2014.
DNV GL - Energy 3-9 October 10, 2014
compliance test forms are required (CF-4R and 6R); however, copies of the forms are not a
submission requirement.
3.1.4 QI Program Workpaper Assumptions
SCE’s residential QI incentive program is intended to eliminate three common problems that
can reduce the efficiency of a newly installed unit: low airflow, improper refrigerant charge, and
duct leakage. This research study applied workpaper assumptions made by the program to
samples of incentivized equipment and non-incentivized equipment.
Energy savings estimates in the program workpaper assume quality installation practices that
exceed common installation practices. Therefore, workpaper estimated savings are the result of
improved installation procedures for the new HVAC system. The savings from the system
replacement with a higher efficiency unit are relatively simple to estimate and are documented
in the CEC- and CPUC-sponsored Database for Energy Efficient Resources (DEER).14 However,
the savings from quality installation practices present unique challenges. Interactive effects
between QI program practices and installation of high-efficiency equipment further complicate
the issue.
In order to determine the impact of a QI, and even its definition, a number of studies were
reviewed by IOUs. The review of these studies resulted in a set of IOU workpaper assumptions
that focused on three issues that could impact savings—system oversizing, incorrect low airflow,
and leaky ducts. The workpaper identified the basis for quality installation savings as:
Equipment sizing: HVAC units are typically over-sized by 20 percent, but incentivized
equipment in incentive program is assumed to have correctly sized systems.
Low Airflow: Fans provide low airflow of only 350 CFM/ton. Incentivized equipment
is assumed to have correct fan settings at the recommended 400 CFM/ton.
Duct Leakage: When ducts are not properly sealed the assumed baseline leakage (total
air handling unit flow leakage) is 24 percent. In contrast, program participant systems
are assumed to be half that at 12 percent leakage.15
3.1.5 Title 24 Residential Requirements Relative to QI Workpaper
Assumptions
This section covers Title 24 prescriptive requirements for residential HVAC system change-outs
as it pertains to QI program measures and workpaper assumptions. The data available from site
visits focused on QI workpaper assumptions and therefore do not cover all aspects of the
14 http://www.energy.ca.gov/deer/ 15 DEER 2005 Measure D03-458 was used as the basis for savings.
DNV GL - Energy 3-10 October 10, 2014
Standards. The following list differentiates between the workpaper assumptions that were tested
in the QI site data and key aspects that were not.
Duct test and sealing is required in climate zones 2 and 9 through 16 when ducts are
extended or HVAC equipment is replaced.16 The QI workpaper assumes average leakage
rates for incentivized equipment and non-incentivized equipment regardless of climate
zone.
Airflow must be greater than 350 CFM/ton of nominal cooling, and a fan watt draw of
less than 0.58 W/CFM within climate zone 10 through 15.17 Airflow assumptions were
made by the QI workpaper regardless of climate zone. Fan watt draw was not assessed in
this report since it was not a QI workpaper assumption.
Title 24 does have specific sizing requirements, but requires that loads are calculated for
the new system. The QI workpaper made specific assumptions about oversizing outside
the program. DNV GL analysts evaluated the sizing of equipment and used the same load
calculation procedures and software, ACCA Manual J, that was selected by the
program.18
Refrigerant charge is also part of the Standards. For residential HVAC change-outs,
measured and verified refrigerant charge is required (section 152(b) 1 Fii). Refrigerant
charge was not assessed in this report since it was not a QI workpaper assumption.
16 In Climate Zones 2 and 9-16, if more than 40 linear feet of new or replacement ducts are installed in unconditioned space to serve the addition, the ducts are to be sealed and tested per §152(b)1D. 17 In climate zones 10-15 when a new or replacement space-conditioning system is installed, the central forced air fan of split system air conditioners and heat pumps must simultaneously, in every zonal control mode, demonstrate an airflow of greater than 350 CFM/ton of nominal cooling, and a fan watt draw of less than 0.58 W/CFM in accordance with the procedures in Reference Residential Appendix RA3.3 18 The Standards do not set limits on the sizing of equipment, but they do require that loads be calculated for new systems. Oversized equipment typically operates less efficiently and can create comfort problems due to excessive cycling and high airflow. Acceptable load calculation procedures include methods described in the ASHRAE Handbook – Equipment, ASHRAE Handbook – Applications, ASHRAE Handbook – Fundamentals, SMACNA Residential Comfort System Installation Manual, or ACCA Manual J.”
DNV GL - Energy 4-11 October 10, 2014
Permitting Rate 4.
There are several ways to estimate a permit rate, but all methods are resource intensive and use
varying sources of information to inform the equation. In general, there is a top-down approach
that makes high-level estimates and a bottom-up approach that estimates permits because on
number of customers randomly sampled and then extrapolates the data back to the population.
Examples of top-down methods could include one of the following:
1. 𝑃𝑒𝑟𝑚𝑖𝑡 𝑅𝑎𝑡𝑒 = 𝑁𝑜. 𝑃𝑒𝑟𝑚𝑖𝑡𝑠 𝑃𝑢𝑙𝑙𝑒𝑑 ÷ 𝑇𝑜𝑡𝑎𝑙 𝑁𝑜. 𝐶𝑒𝑛𝑡𝑟𝑎𝑙 𝐴𝐶 𝑈𝑛𝑖𝑡𝑠 𝑆𝑜𝑙𝑑 (𝐻𝐴𝐷𝑅𝐼 𝑜𝑟 𝐼𝐻𝐴𝐶𝐼 𝐷𝑎𝑡𝑎)
2. 𝑃𝑒𝑟𝑚𝑖𝑡 𝑅𝑎𝑡𝑒 = 𝑁𝑜. 𝑃𝑒𝑟𝑚𝑖𝑡𝑠 𝑃𝑢𝑙𝑙𝑒𝑑 ÷ 𝐸𝑠𝑡𝑖𝑚𝑎𝑡𝑒𝑑 𝑁𝑜. 𝑜𝑓 𝐴𝑛𝑛𝑢𝑎𝑙 𝑅𝑒𝑝𝑙𝑎𝑐𝑒𝑚𝑒𝑛𝑡𝑠
3. Permit Rate = Total No. of HERS Certificates ÷ 𝑇𝑜𝑡𝑎𝑙 𝑁𝑜. 𝑜𝑓 𝑈𝑛𝑖𝑡𝑠 𝑆𝑜𝑙𝑑 𝑏𝑦 𝐶𝐴 𝐷𝑖𝑠𝑡𝑟𝑖𝑏𝑢𝑡𝑜𝑟𝑠
The challenge with any of these approaches is they are all subject to imprecisions. Some of the
challenges in computing a permit rate from the top-down methods include: non-uniform permit
record requirements and enforcement by the state’s 530 BDs, limited granularity, and costly
data from distributor associations, limited cooperation by distributors and contractors alike,
and limited access to HERS registry data.
In this study, DNV GL researchers applied a bottom-up method, which can sometimes be
extrapolated to a larger population. However, because of the wide range of secondary data
sources used to inform the study, the results were not extrapolated and are not generalizable.
Given more time and resources, it would be possible to extrapolate some of the sample sets from
studies such as CLASS and CSS, which had comprehensive statewide sampling methods. The
current study used the following bottom-up method to determine the permit rate:
𝑃𝑒𝑟𝑚𝑖𝑡 𝑅𝑎𝑡𝑒 = 𝑁𝑜. 𝑃𝑒𝑟𝑚𝑖𝑡𝑠 𝑃𝑢𝑙𝑙𝑒𝑑 ÷ 𝑇𝑜𝑡𝑎𝑙 𝑁𝑜. 𝑜𝑓 𝑅𝑒𝑝𝑙𝑎𝑐𝑒𝑚𝑒𝑛𝑡𝑠
The bottom-up approach is also subject to imprecisions, biases and has its own limitations. For
instance, there could be error in the number of permits pulled numerator and in the
denominator, and self-selection bias would be expected in the denominator.
A 2008 bottom-up permitting estimation evaluation of rebating and permitting that is similar to
the current study measured the rate of residential permitting by the local utility Sacramento
Municipal Utility District (SMUD) in 2007-2008.19 SMUD offered a residential HVAC incentive
program that required the submission of a permit, compliance forms, and HERS rater
verification. Their incentive application further stated that contractors must “Pull and make
19 RLW Analytics, Inc. and The Benningfield Group, Residential HVAC Program Evaluation Permit Data & Duct Test Results, March 2008.
DNV GL - Energy 4-12 October 10, 2014
every effort to promptly final building permits” and were required to submit “CF6R-MECH or
CF4R-MECH forms which apply.” The SMUD program evaluation, performed by DNV GL
(formerly RLW Analytics, Inc. in partnership with The Benningfield Group), used a bottom-up
approach where customers were called through random digit dialing (RDD) to identify HVAC
replacements. The sample of RDD non-incentivized equipment was compared with incentivized
equipment for a similar set of measures including duct testing, right sizing, and refrigerant
charge.
Regardless of the method chosen to estimate the permit rate, it can be expected that rates for
change-outs are capricious and influenced by constantly changing factors such as code changes,
economic market conditions, IOU program intervention, incentives, regulations, CSLB
enforcement, resources and tools for enforcement, uniform permit submissions and computer
applications for easy submission. Last, but not least, the permit rate is subject to the perceived
value of permits to end-users and customers.
DNV GL expected to find permit rates for change-outs in residential buildings to be less than
that of commercial due to the ability to more easily evade code enforcement officials in
residential settings and private property laws, as compared with commercial settings, where
activities may be observed by the general public. In general, consultants found the permit rates
among residential non-incentivized equipment were in line, if not slightly higher than our
expectations based on the 2008 residential permit rate study in the Sacramento region provided
as a reference point. However, it should be noted the high rate of permitted in SMUD territory
could be due to more their continual focus on the issue and rigorous enforcement among their
HVAC change-out programs. As previously mentioned other evaluations have presented much
lower rates of permitting in the 10 -20 percent range.
Based on the current research findings, for the various markets evaluated, it appears there are
significant gaps to bridge to ensure HVAC equipment is permitted. It is assumed programs like
Code Compliance will reduce those some of those gaps.
Data Sources 4.1
Data from several HVAC studies with packaged and split units that were identified as having
been recently replaced were used. Most studies contained roughly 50 residential or commercial
customers with recent (2010-2012) HVAC change-outs. Throughout the report we define
“incentivized equipment” as change-outs where the distributors received incentives through the
IOU-sponsored Upstream program and “non-incentivized equipment” as units where the
distributor did not receive incentives for the equipment.
The main benefit of using secondary data resources is that it eliminates the need to perform
expensive and time-consuming data collection activities that have already been conducted, such
as identification of eligible samples, recruitment, and on-site testing of installation quality.
DNV GL - Energy 4-13 October 10, 2014
Secondary data allowed for a cost effective inquiry of the two research questions—the proportion
of sample that applied for a permit, and the difference in energy performance between
permitted and non-permitted jobs.
Among the five studies used, two measured market saturation of energy-efficient end uses:
CLASS, and CSS. A third study, HVAC Impact and Market Effects Study, estimated impact
savings and market effects for HVAC measures. Researchers also leveraged data from the
Quality Installation (QI) Residential Rebate Program Impact Evaluation. Tracking data was also
used from the Upstream Commercial Incentive Program for program years 2010-2012.
The justifications for leveraging secondary data from these HVAC market and saturation studies’
included:
The incentivized equipment were randomly selected regardless of program participation,
hence a better picture of the market.
The incentivized equipment were selected without raising any issues of permitting, thus
reducing some potential self-selection bias related to reservations of allowing efficiency
measurements of their HVAC systems.
Recognizing that the results may be only indicative due to the small sample sizes that are
not statistically significant, it is a way of contributing some field data to the discussion
without incurring the costs of site visits and measurements within this project.
The QI impact evaluation study conducted onsite visits at 50 residential homes that were
non-incentivized equipment in IOU QI programs; the commercial sample was more
limited. Additionally, this study utilized data collected from SCE’s QI residential
program participants. Participation in this program required that permits must be
obtained for the change-out.20 Data included program tracking data, a file review of
sample projects, and 50 units that received on-site visits. The HVAC Market Effects
Study, CLASS, and CSS studies identified the QI impact evaluation sites.
The HVAC studies mentioned above identified and field-tested 50 recent HVAC
installations. The core data collection effort for the study was matching the addresses of
all HVAC change-outs with permit records from the appropriate jurisdiction. Every effort
was made to obtain permit records for all installations with the understanding that the
study may not achieve a census due to the level of permit record detail retained by BDs.
The first piece of information obtained was the proportion of the sample that received a
permit; the second piece of information was to examine the difference in performance,
relative to the QI workpaper assumptions, between permitted and non-permitted sites.
20 SCE’s Quality Install Requirements http://www.ac-quality.com/contractors/permits
DNV GL - Energy 4-14 October 10, 2014
The WO31 Codes & Standards study identified local building jurisdictions for permit
data for a sample of over 250 non-residential sites. DNV GL used the contact data,
websites, and other information from the study to aid in obtaining building permit data.
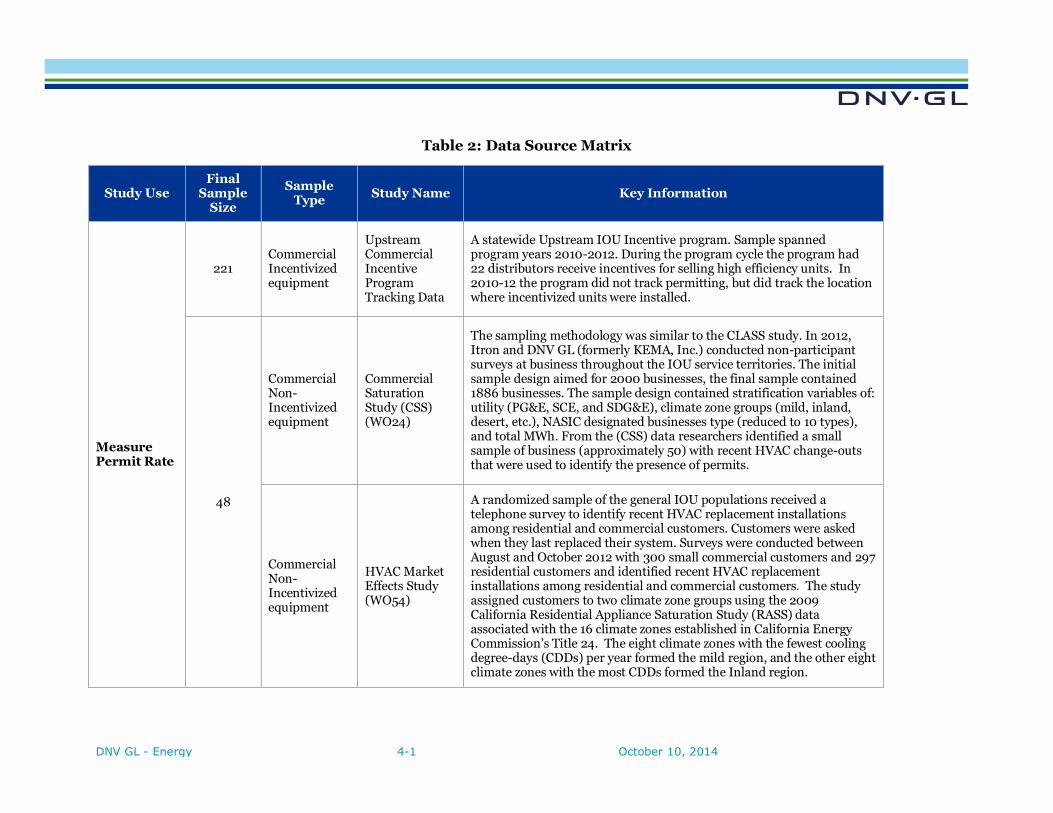
Table 2 identifies how the various study sources were used to determine the permit rate and
measure against QI program assumptions. The table provides the final sample size, the
sample type, the associated program source name, and general information on sample
methods for the previously conducted studies. The permit rate for each sample is described
in Section 4.4.
DNV GL - Energy 4-1 October 10, 2014
Table 2: Data Source Matrix
Study Use Final
Sample Size
Sample Type
Study Name Key Information
Measure Permit Rate
221 Commercial Incentivized equipment
Upstream Commercial Incentive Program Tracking Data
A statewide Upstream IOU Incentive program. Sample spanned program years 2010-2012. During the program cycle the program had 22 distributors receive incentives for selling high efficiency units. In 2010-12 the program did not track permitting, but did track the location where incentivized units were installed.
48
Commercial Non-Incentivized equipment
Commercial Saturation Study (CSS) (WO24)
The sampling methodology was similar to the CLASS study. In 2012, Itron and DNV GL (formerly KEMA, Inc.) conducted non-participant surveys at business throughout the IOU service territories. The initial sample design aimed for 2000 businesses, the final sample contained 1886 businesses. The sample design contained stratification variables of: utility (PG&E, SCE, and SDG&E), climate zone groups (mild, inland, desert, etc.), NASIC designated businesses type (reduced to 10 types), and total MWh. From the (CSS) data researchers identified a small sample of business (approximately 50) with recent HVAC change-outs that were used to identify the presence of permits.
Commercial Non-Incentivized equipment
HVAC Market Effects Study (WO54)
A randomized sample of the general IOU populations received a telephone survey to identify recent HVAC replacement installations among residential and commercial customers. Customers were asked when they last replaced their system. Surveys were conducted between August and October 2012 with 300 small commercial customers and 297 residential customers and identified recent HVAC replacement installations among residential and commercial customers. The study assigned customers to two climate zone groups using the 2009 California Residential Appliance Saturation Study (RASS) data associated with the 16 climate zones established in California Energy Commission’s Title 24. The eight climate zones with the fewest cooling degree-days (CDDs) per year formed the mild region, and the other eight climate zones with the most CDDs formed the Inland region.
DNV GL - Energy 4-2 October 10, 2014
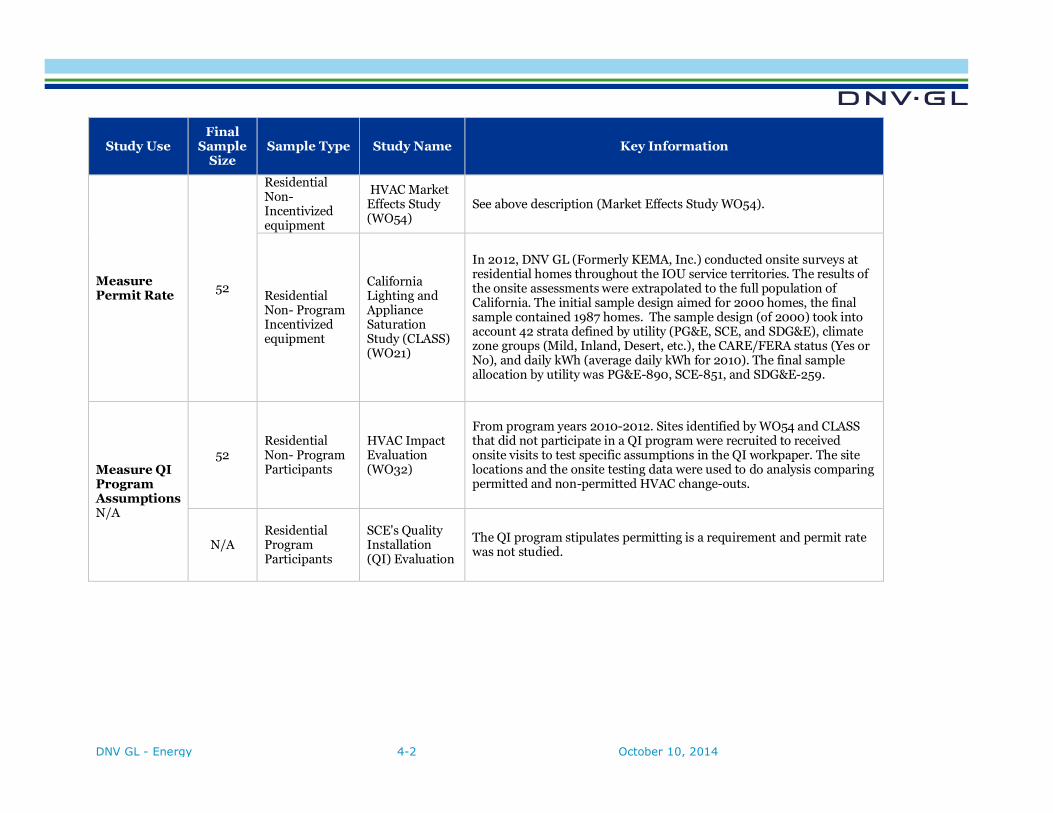
Study Use Final
Sample Size
Sample Type Study Name Key Information
Measure Permit Rate
52
Residential Non-Incentivized equipment
HVAC Market Effects Study (WO54)
See above description (Market Effects Study WO54).
Residential Non- Program Incentivized equipment
California Lighting and Appliance Saturation Study (CLASS) (WO21)
In 2012, DNV GL (Formerly KEMA, Inc.) conducted onsite surveys at residential homes throughout the IOU service territories. The results of the onsite assessments were extrapolated to the full population of California. The initial sample design aimed for 2000 homes, the final sample contained 1987 homes. The sample design (of 2000) took into account 42 strata defined by utility (PG&E, SCE, and SDG&E), climate zone groups (Mild, Inland, Desert, etc.), the CARE/FERA status (Yes or No), and daily kWh (average daily kWh for 2010). The final sample allocation by utility was PG&E-890, SCE-851, and SDG&E-259.
Measure QI Program Assumptions N/A
52 Residential Non- Program Participants
HVAC Impact Evaluation (WO32)
From program years 2010-2012. Sites identified by WO54 and CLASS that did not participate in a QI program were recruited to received onsite visits to test specific assumptions in the QI workpaper. The site locations and the onsite testing data were used to do analysis comparing permitted and non-permitted HVAC change-outs.
N/A Residential Program Participants
SCE's Quality Installation (QI) Evaluation
The QI program stipulates permitting is a requirement and permit rate was not studied.
DNV GL - Energy 4-1 October 10, 2014
Data Collection 4.2
This section of the report describes the data collection process, sampling processes to determine
the permit rate, and influence the HERS rater registries had on the study.
4.2.1 Permit Data Collection and Sampling Processes
The permit assessment was intended to provide a rough estimate on the frequency of permitting
to inform Code Compliance program planners. Twenty-one percent of the State’s local code
enforcement agencies (109 of 530) were contacted for the permit identification endeavor.
The rate of permitting was based on the frequency of known HVAC replacements that pulled
permits; sites where it is known there was no installation were excluded from the permit rate.
Known cases of unit replacement were determined by customers citing their unit was replaced
(market saturations studies), by QI-program rebated customers or contractors, or by
distributors claiming a sales that was incentivized by the commercial Upstream program.
Since there was no program documentation aligned with replacements in market saturations
studies other than customers stating the unit was replaced during a particular year, researchers
expanded the permit identification scope and looked for evidence of mechanical permits
spanning over a year. Permit records often provided historical data dating back to when the
building was constructed including all permitted HVAC replacements from 2010 through 2012,
if any. Researchers looked for mechanical permits for building occupant-replaced and
contractor-replaced units based on the site address. New construction installations and permits
were excluded from all analyses.
To identify if a sample site pulled a permit for an HVAC change-out, consultants conducted
searches at BDs throughout the state. Approximately 50 percent of the permits were obtained
via fax or phone calls and through follow up emails, slightly less than half was obtained through
online search portals such as Accela Citizen’s Access™ via enforcement agencies websites, and
less than 5 percent required a physical site-visit. For five BDs it was necessary to acquire permit
data in person because the departments still relied on microfiche technology to store permit
records. Consultants kept track of where records required site visits and performed these visits
at the end of the data collection period.
Researchers took a conservative approach to confirming the presence of a mechanical permit.
Permit records had to contain a copy of the mechanical permit21 in order to be reflected as
permitted as opposed to say a check box for “mechanical” listed. If there was uncertainty that
21 Mechanical Form “Mech-1” - http://www.energy.ca.gov/2008publications/CEC-400-2008-017/rev1_appendices/appendix_A_files/Certificate_of_Compliance_MECH-C/MECH-1C.pdf
DNV GL - Energy 4-2 October 10, 2014
the permit on file included the replacement sought by researchers then the record was filed as
inconclusive. These sites were almost exclusively associated with commercial tenant
improvements permits. There were 32 inconclusive records. Field note examples of where
change-outs were labeled as inconclusive include; “Found two remodel permits which include
mechanical alterations. Did not state what the alterations are in the remodel permit” and “Three
pages of permits for this address in the online search, but there are no HVAC specific permits.
There are quite a few permits for "expansion" which seems to cover many things including
HVAC.”
4.2.2 Permit Data Collection Sample Design for Upstream Data
The study considered a sample design that prioritized the BDs contacted because requesting and
obtaining permit data is a relatively manual and laborious process depending upon a BDs
infrastructure. The study prioritized telephone, email and online attempts to acquire data as
well as the on-site visits based on the sample design to avoid convenience bias.
The samples from market assessment studies (WO54, CLASS, and CSS) and the residential QI
non-incentivized equipment (WO32) took priority because they represented installations
without IOU program participation. Effectively all of the building departments were required for
this sample. In order to prioritize BDs with single replacements, the study created a
supplemental sample from the non-residential Upstream Program tracking and energy savings
data for the 2010-2012 program years. The study reports permit rate separately for non-
participant and participant records, but the program activity influenced the final non-residential
sample. The two-step sample processes were as follows:
Researchers first identified cities that appeared most often in the 100 records from non-
participant sources (52 residential and 48 commercial sites in WO54, CLASS, and CSS
shown in Table 2).
The supplemented cities were ranked based on the cities with the greatest sum of gross
kilowatt-hour (kWh) savings. Within each city selected, five service addresses where the
equipment was incentivized in the Upstream Program were chosen with the greatest
savings.
DNV GL - Energy 4-3 October 10, 2014
4.2.3 Compliance Data Collection from HERs Rater Registries
In addition to permit verification data, consultants sought out compliance data. From the onset
of the study, consultants anticipated locating compliance data forms such as CF-6Rs from the
109 BDs, however, the data was only found at a single BD. The type of documentation retained
at individual BDs appears not to be uniform across the state. It quickly became apparent that
compliance information was not going to be available from the BDs, so the following two HERS
registry companies that store customer compliance data for HVAC replacements were
contacted:
California Certified Energy Rating & Testing Services (CalCERTS, Inc.), and
The US Energy Raters Association (USERA)
Consultants had limited results on acquiring compliance data from these agencies due to privacy
policies intended to protect customers and mechanical contractors. Ultimately, researchers used
the information from the registry as a reference point to verify the presence of a permit.
USERA agree to review its database to identify records that matched the sample population
reviewed (39 addresses). A single match was found, thus it was not worthwhile to pursue further
given the limited number of matches. USERA representatives were otherwise responsive to the
research and forthcoming regarding opinions on permit and compliance uniformity among
enforcement agencies.
A request for information was also placed with CalCERTS, but again privacy policies created
some barriers. CalCERTS did agree to review its database to identify records that matched. The
matching process identified 15 in total out of approximately.
Methods to Determine Permit Rates 4.3
This section of report describes the methods to determine the permit rates in greater detail and
the rates for current and past studies.
Consultants combined sources of known HVAC replacements. Collectively these data sources,
referred to as non-incentivized equipment, resulted in slightly more than 100 records of which
48 records (or service addresses) and 52 records were residential. The list was augmented with
tracking data from commercial sites from the 2010-2012 IOU Upstream incentive programs. Of
these, approximately 136 addresses contained HVAC replacements in PG&E’s service territory
and 114 addresses in SCE’s service territory. The Upstream program data often contained
multiple HVAC replacements for a given address.
DNV GL - Energy 4-4 October 10, 2014
To verify if a sample site pulled a permit for an HVAC replacement, consultants conducted
searches at BDs through the state. A total of 109 were contacted by one mode or another. The
modes of contact included:
Online website searchers,
Telephone with follow up e-mail or fax, and
Physical site visits.
The vast majority of the verification work occurred at researchers’ desks by contacting permit
technicians by telephone. The second most common data collection method was utilizing online
search engines such as such as Accela Citizen’s Access™, which is linked to individual BDs’
websites. For five BDs it was necessary to acquire permit data in person because the
departments still relied on microfiche technology to store permit records. Consultants kept track
of where records required site visits and performed these visits at the end of the data collection
period.
Consultants spent approximately two months from late January through end of March 2014
searching for evidence of mechanical permits on 350 addresses and HVAC units throughout the
California for commercial and residential replacements that occurred sometime between years
2010-2012.
A small percent of the sample was removed and filed as inconclusive due to the lacked in
sufficient permit record detail. Once these records were removed, the final sample size was
reduced to 321 as shown in Table 2. It should be noted any federal, hospital, school, or historic
buildings, which are exempt from Title 24, were also excluded from the permit rate as they are
not required to file for HVAC change-out permits through their local code enforcement agency.
These facilities follow requirements set by their own enforcement agencies, such as the: Division
of the State Architect (DSA), Office of Statewide Health Planning and Development, and
California Historic Building Code.
Researchers were able to inform permit processes as it pertains to HVAC change-outs at public
schools. The DSA serves as the enforcement agency for schools but according to DSA officials,
the DSA is not required to review energy-saving projects such as HVAC change-outs.22 The
decision to submit an HVAC change-out in a like-with-like application is at the discretion of
school districts (limitations are described in DSA form PR 14-02). Other findings as it pertains
to schools include for alterations, there appears to be no method to ensure compliance for
projects not submitted to DSA and identifying past projects in general could be difficult to track
with discretionary filing practices. And projects submitted to DSA compliance and the ability to
22 DNV GL, DSA and PG&E – personal communication, April 29. 2014.
DNV GL - Energy 4-5 October 10, 2014
enforce it appears limited and based on good faith that contractors will perform services
correctly.
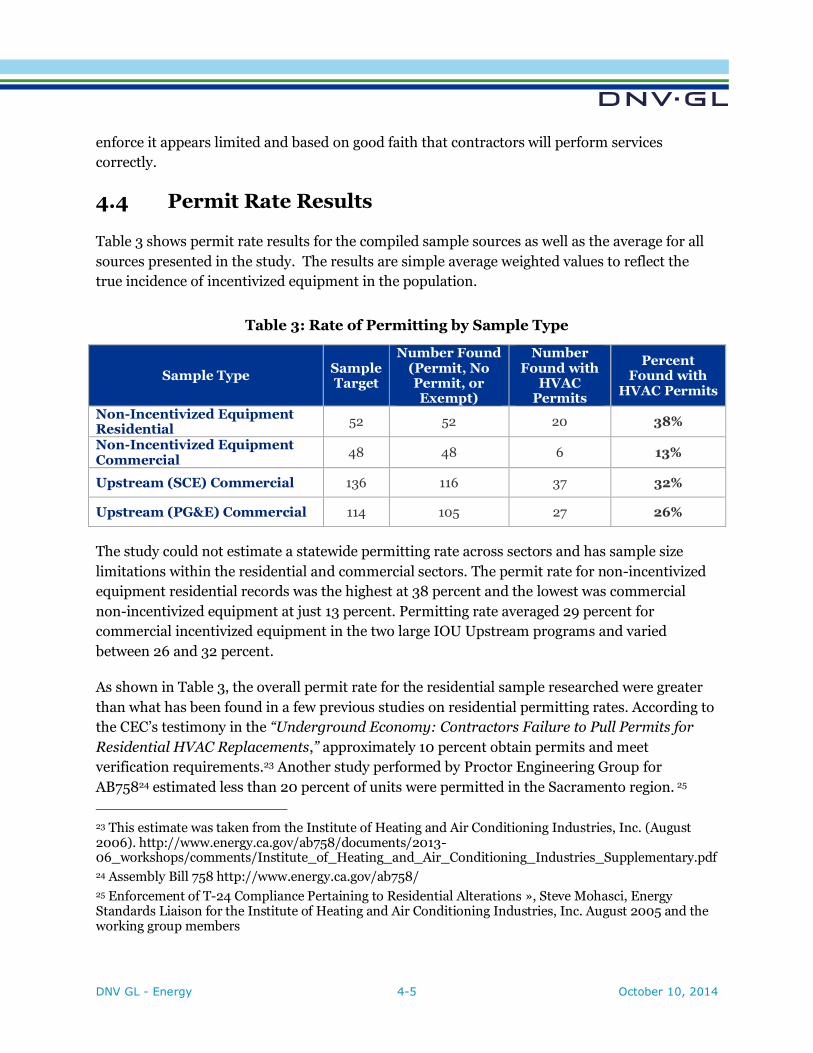
Permit Rate Results 4.4
Table 3 shows permit rate results for the compiled sample sources as well as the average for all
sources presented in the study. The results are simple average weighted values to reflect the
true incidence of incentivized equipment in the population.
Table 3: Rate of Permitting by Sample Type
Sample Type Sample Target
Number Found (Permit, No Permit, or Exempt)
Number Found with
HVAC Permits
Percent Found with
HVAC Permits
Non-Incentivized Equipment Residential
52 52 20 38%
Non-Incentivized Equipment Commercial
48 48 6 13%
Upstream (SCE) Commercial 136 116 37 32%
Upstream (PG&E) Commercial 114 105 27 26%
The study could not estimate a statewide permitting rate across sectors and has sample size
limitations within the residential and commercial sectors. The permit rate for non-incentivized
equipment residential records was the highest at 38 percent and the lowest was commercial
non-incentivized equipment at just 13 percent. Permitting rate averaged 29 percent for
commercial incentivized equipment in the two large IOU Upstream programs and varied
between 26 and 32 percent.
As shown in Table 3, the overall permit rate for the residential sample researched were greater
than what has been found in a few previous studies on residential permitting rates. According to
the CEC’s testimony in the “Underground Economy: Contractors Failure to Pull Permits for
Residential HVAC Replacements,” approximately 10 percent obtain permits and meet
verification requirements.23 Another study performed by Proctor Engineering Group for
AB75824 estimated less than 20 percent of units were permitted in the Sacramento region. 25
23 This estimate was taken from the Institute of Heating and Air Conditioning Industries, Inc. (August 2006). http://www.energy.ca.gov/ab758/documents/2013-06_workshops/comments/Institute_of_Heating_and_Air_Conditioning_Industries_Supplementary.pdf 24 Assembly Bill 758 http://www.energy.ca.gov/ab758/ 25 Enforcement of T-24 Compliance Pertaining to Residential Alterations », Steve Mohasci, Energy Standards Liaison for the Institute of Heating and Air Conditioning Industries, Inc. August 2005 and the working group members
DNV GL - Energy 4-6 October 10, 2014
That study did not cite a permit rate but rather made estimates of the number of units replaced
in the Sacramento region and compared those estimates to the number of HVAC permits
obtained.26
26 http://www.energy.ca.gov/ab758/documents/2012-10-08-09_workshop/comments/Proctor_Engineering_Group%20Ltd_Comments_2012-10-29_TN-68241.pdf
DNV GL - Energy 5-7 October 10, 2014
Permitting Effect on QI Workpaper Baseline 5.
Assumptions
This section compares QI program baseline assumptions to the field test results for non-
participant permitted and non-participant non-permitted change-outs. The results examine how
permitted change-outs compared to non-permitted for the QI program measures of duct
leakage, system airflow, and cooling system sizing.
5.1.1 Duct Leakage
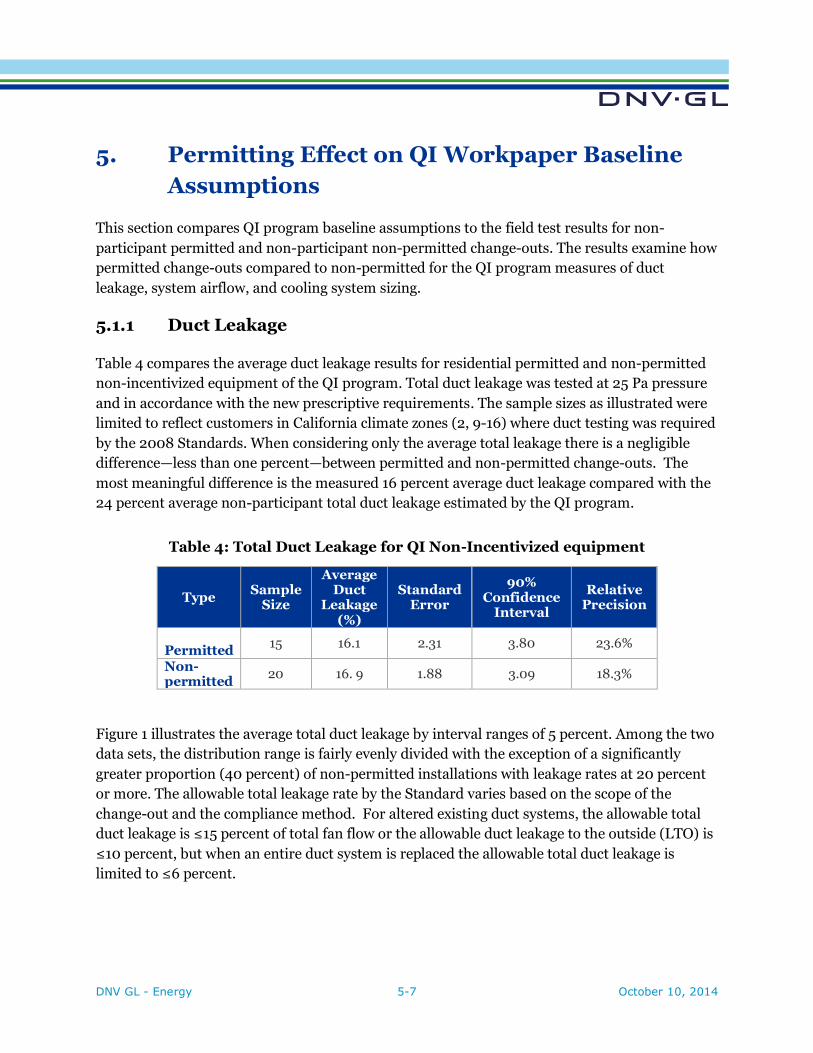
Table 4 compares the average duct leakage results for residential permitted and non-permitted
non-incentivized equipment of the QI program. Total duct leakage was tested at 25 Pa pressure
and in accordance with the new prescriptive requirements. The sample sizes as illustrated were
limited to reflect customers in California climate zones (2, 9-16) where duct testing was required
by the 2008 Standards. When considering only the average total leakage there is a negligible
difference—less than one percent—between permitted and non-permitted change-outs. The
most meaningful difference is the measured 16 percent average duct leakage compared with the
24 percent average non-participant total duct leakage estimated by the QI program.
Table 4: Total Duct Leakage for QI Non-Incentivized equipment
Type Sample
Size
Average Duct
Leakage (%)
Standard Error
90% Confidence
Interval
Relative Precision
Permitted 15 16.1 2.31 3.80 23.6%
Non-permitted
20 16. 9 1.88 3.09 18.3%
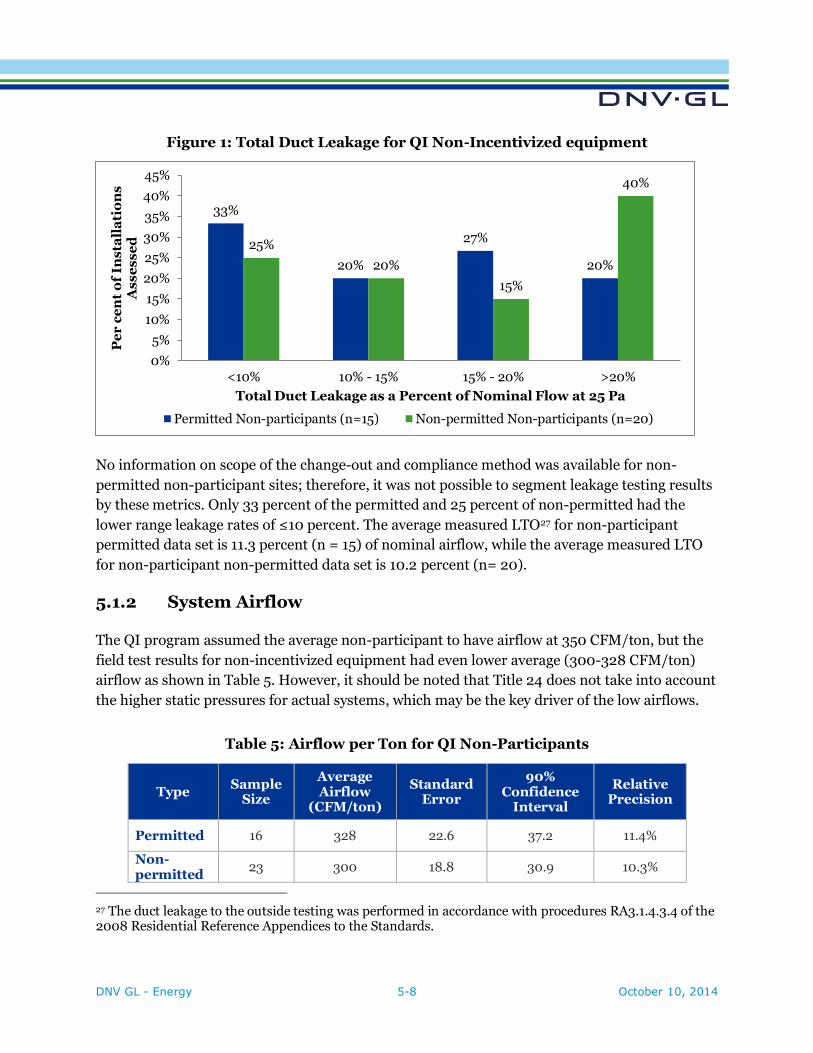
Figure 1 illustrates the average total duct leakage by interval ranges of 5 percent. Among the two
data sets, the distribution range is fairly evenly divided with the exception of a significantly
greater proportion (40 percent) of non-permitted installations with leakage rates at 20 percent
or more. The allowable total leakage rate by the Standard varies based on the scope of the
change-out and the compliance method. For altered existing duct systems, the allowable total
duct leakage is ≤15 percent of total fan flow or the allowable duct leakage to the outside (LTO) is
≤10 percent, but when an entire duct system is replaced the allowable total duct leakage is
limited to ≤6 percent.
DNV GL - Energy 5-8 October 10, 2014
Figure 1: Total Duct Leakage for QI Non-Incentivized equipment
No information on scope of the change-out and compliance method was available for non-
permitted non-participant sites; therefore, it was not possible to segment leakage testing results
by these metrics. Only 33 percent of the permitted and 25 percent of non-permitted had the
lower range leakage rates of ≤10 percent. The average measured LTO27 for non-participant
permitted data set is 11.3 percent (n = 15) of nominal airflow, while the average measured LTO
for non-participant non-permitted data set is 10.2 percent (n= 20).
5.1.2 System Airflow
The QI program assumed the average non-participant to have airflow at 350 CFM/ton, but the
field test results for non-incentivized equipment had even lower average (300-328 CFM/ton)
airflow as shown in Table 5. However, it should be noted that Title 24 does not take into account
the higher static pressures for actual systems, which may be the key driver of the low airflows.
Table 5: Airflow per Ton for QI Non-Participants
Type Sample
Size
Average Airflow
(CFM/ton)
Standard Error
90% Confidence
Interval
Relative Precision
Permitted 16 328 22.6 37.2 11.4%
Non-permitted
23 300 18.8 30.9 10.3%
27 The duct leakage to the outside testing was performed in accordance with procedures RA3.1.4.3.4 of the 2008 Residential Reference Appendices to the Standards.
33%
20%
27%
20%
25%
20%
15%
40%
0%
5%
10%
15%
20%
25%
30%
35%
40%
45%
<10% 10% - 15% 15% - 20% >20%
Pe
r c
en
t o
f In
sta
lla
tio
ns
As
se
ss
ed
Total Duct Leakage as a Percent of Nominal Flow at 25 Pa
Permitted Non-participants (n=15) Non-permitted Non-participants (n=20)
DNV GL - Energy 5-9 October 10, 2014
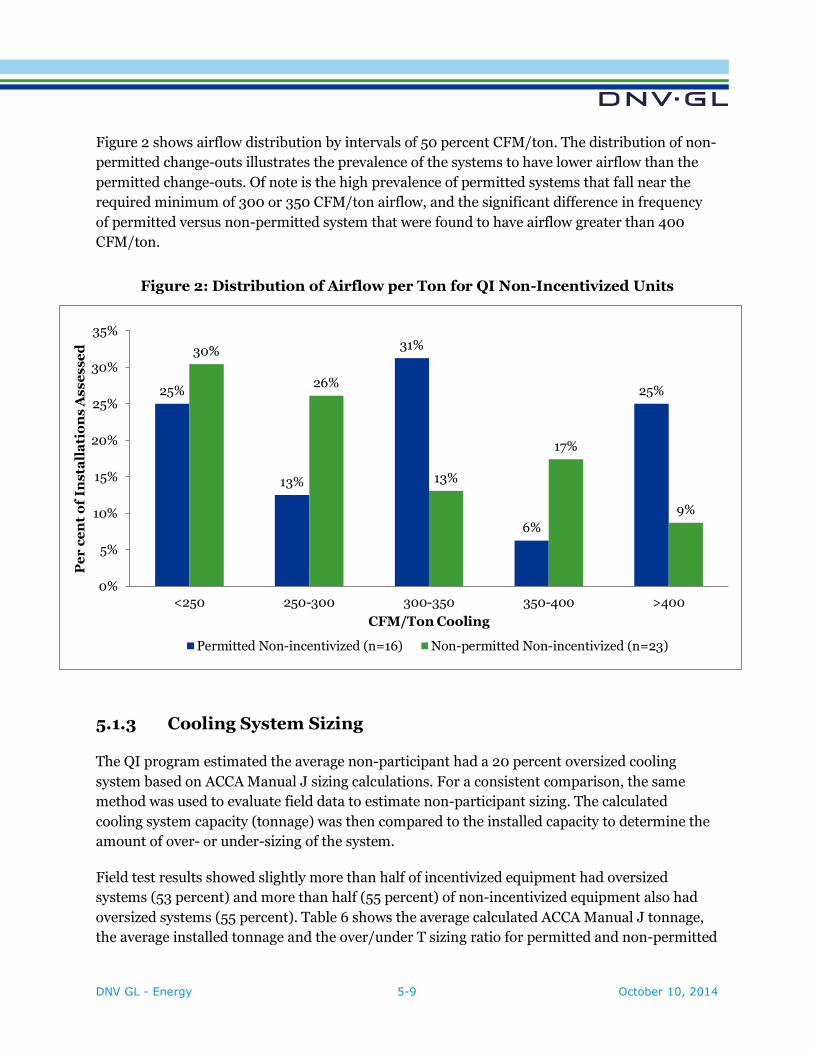
Figure 2 shows airflow distribution by intervals of 50 percent CFM/ton. The distribution of non-
permitted change-outs illustrates the prevalence of the systems to have lower airflow than the
permitted change-outs. Of note is the high prevalence of permitted systems that fall near the
required minimum of 300 or 350 CFM/ton airflow, and the significant difference in frequency
of permitted versus non-permitted system that were found to have airflow greater than 400
CFM/ton.
Figure 2: Distribution of Airflow per Ton for QI Non-Incentivized Units
5.1.3 Cooling System Sizing
The QI program estimated the average non-participant had a 20 percent oversized cooling
system based on ACCA Manual J sizing calculations. For a consistent comparison, the same
method was used to evaluate field data to estimate non-participant sizing. The calculated
cooling system capacity (tonnage) was then compared to the installed capacity to determine the
amount of over- or under-sizing of the system.
Field test results showed slightly more than half of incentivized equipment had oversized
systems (53 percent) and more than half (55 percent) of non-incentivized equipment also had
oversized systems (55 percent). Table 6 shows the average calculated ACCA Manual J tonnage,
the average installed tonnage and the over/under T sizing ratio for permitted and non-permitted
25%
13%
31%
6%
25%
30%
26%
13%
17%
9%
0%
5%
10%
15%
20%
25%
30%
35%
<250 250-300 300-350 350-400 >400
Pe
r c
en
t o
f In
sta
lla
tio
ns A
ss
es
se
d
CFM/Ton Cooling
Permitted Non-incentivized (n=16) Non-permitted Non-incentivized (n=23)
DNV GL - Energy 5-10 October 10, 2014
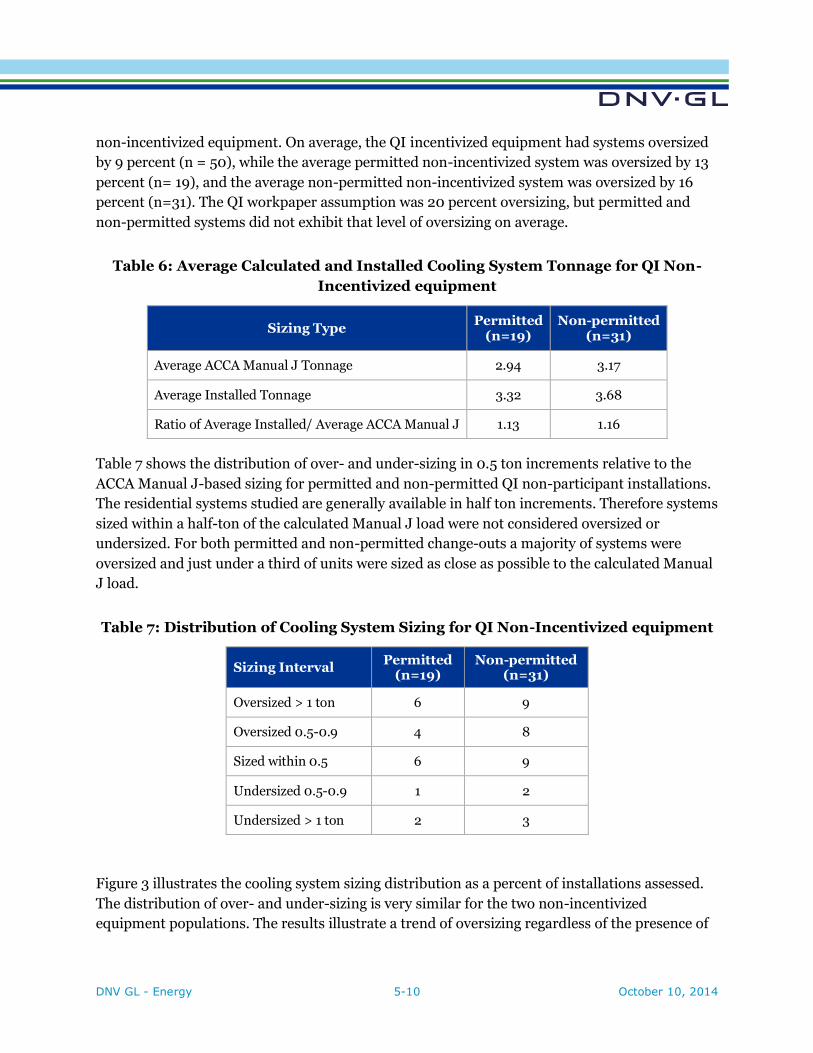
non-incentivized equipment. On average, the QI incentivized equipment had systems oversized
by 9 percent (n = 50), while the average permitted non-incentivized system was oversized by 13
percent (n= 19), and the average non-permitted non-incentivized system was oversized by 16
percent (n=31). The QI workpaper assumption was 20 percent oversizing, but permitted and
non-permitted systems did not exhibit that level of oversizing on average.
Table 6: Average Calculated and Installed Cooling System Tonnage for QI Non-
Incentivized equipment
Sizing Type Permitted
(n=19) Non-permitted
(n=31)
Average ACCA Manual J Tonnage 2.94 3.17
Average Installed Tonnage 3.32 3.68
Ratio of Average Installed/ Average ACCA Manual J 1.13 1.16
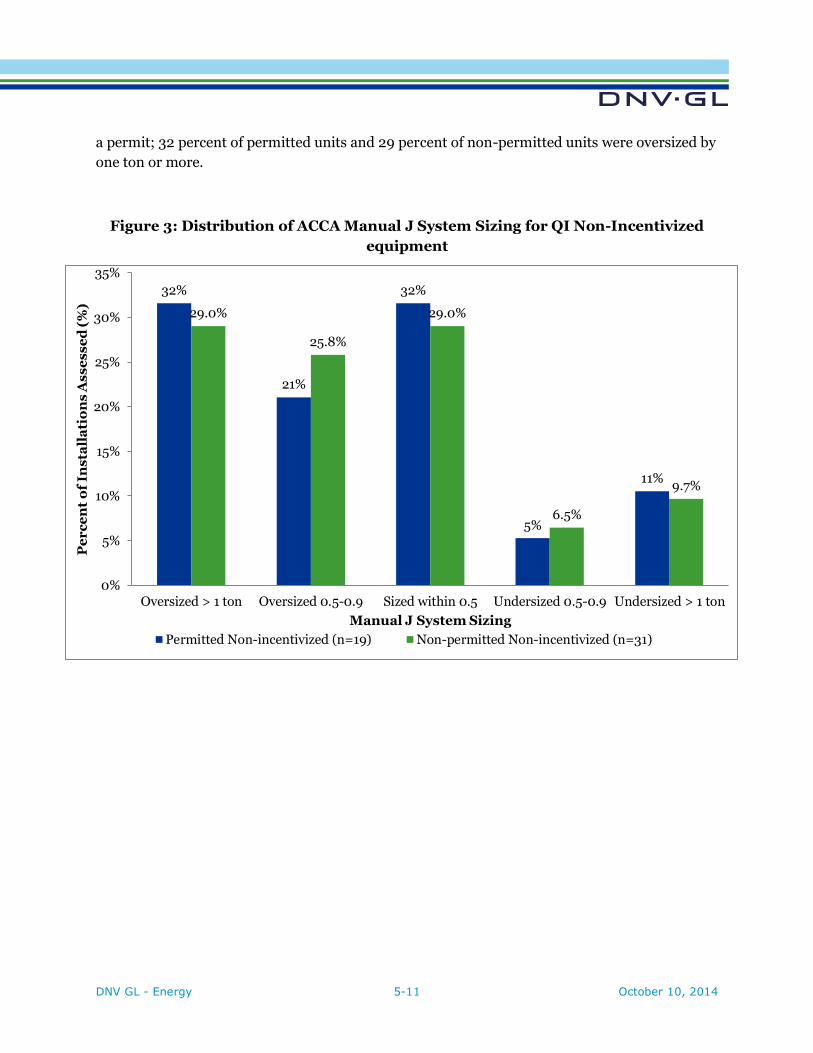
Table 7 shows the distribution of over- and under-sizing in 0.5 ton increments relative to the
ACCA Manual J-based sizing for permitted and non-permitted QI non-participant installations.
The residential systems studied are generally available in half ton increments. Therefore systems
sized within a half-ton of the calculated Manual J load were not considered oversized or
undersized. For both permitted and non-permitted change-outs a majority of systems were
oversized and just under a third of units were sized as close as possible to the calculated Manual
J load.
Table 7: Distribution of Cooling System Sizing for QI Non-Incentivized equipment
Sizing Interval Permitted
(n=19) Non-permitted
(n=31)
Oversized > 1 ton 6 9
Oversized 0.5-0.9 4 8
Sized within 0.5 6 9
Undersized 0.5-0.9 1 2
Undersized > 1 ton 2 3
Figure 3 illustrates the cooling system sizing distribution as a percent of installations assessed.
The distribution of over- and under-sizing is very similar for the two non-incentivized
equipment populations. The results illustrate a trend of oversizing regardless of the presence of
DNV GL - Energy 5-11 October 10, 2014
a permit; 32 percent of permitted units and 29 percent of non-permitted units were oversized by
one ton or more.
Figure 3: Distribution of ACCA Manual J System Sizing for QI Non-Incentivized
equipment
32%
21%
32%
5%
11%
29.0%
25.8%
29.0%
6.5%
9.7%
0%
5%
10%
15%
20%
25%
30%
35%
Oversized > 1 ton Oversized 0.5-0.9 Sized within 0.5 Undersized 0.5-0.9 Undersized > 1 ton
Pe
rc
en
t o
f In
sta
lla
tio
ns A
ss
es
se
d (
%)
Manual J System Sizing
Permitted Non-incentivized (n=19) Non-permitted Non-incentivized (n=31)
DNV GL - Energy 6-12 October 10, 2014
Conclusions 6.
Based on the permit rates found in this study and even considering its lack of statistical rigor, it
does not appear California is on-track to meet the HVAC Action Plan goal of a 50 percent permit
rate by 2015, and it is even less likely of meeting or exceeding the 90 percent goal by 2020
without consistent intervention.28 The presence of a permit had less of an effect on the QI
workpaper baseline assumptions than expected for the residential systems studied.
Permit Rate Conclusions 6.1
Key findings and conclusions from the permitting searches include:
Out of the 109 BDs in the study, only one required and retained HERS compliance
documents. Others could require this, but currently do not.
The permitting rate for residential was 20 permits out of 52, or 38 percent. The
residential estimate may be an upper limit given the small sample size and indications
from other studies of a lower rate.29
For commercial, it should be noted that federal and historic buildings are exempt from
Title 24 Part 6 and schools have a different permit process.
Commercial sites with high efficiency units via the Upstream program did have a higher
permit rate (26-32 percent) than the general commercial population (13 percent).
Consultants expected permit rates for residential to be lower than that of commercial. In
general, consultants found the permit rates among non-incentivized equipment were
opposite those expectations.
Out of the 321 commercial sites researched which included Upstream incentivized
equipment, 23 percent had mechanical permit records. Residential permits were found
for 38 percent of the 52 sites researched.
While we expected to find program incentivized equipment would have higher permit
rates than non-incentivized equipment, one contributing factor that may have impacted
the results was the smaller population of commercial non-incentivized equipment
(n=48) vs. (n=221) participant samples. Furthermore, the passing of SB 454 in 2011 may
have affect permitting.
New initiatives are being put in place to address permitting as are other initiatives
spearheaded by the agency responsible for contractors, California State License Board
28 California Long-term Energy Efficiency Strategic Plan, Goal 1 in Section 6-Page 54,: http://www.energy.ca.gov/ab758/documents/CAEnergyEfficiencyStrategicPlan_Jan2011.pdf 29 Assembly Bill 758 http://www.energy.ca.gov/ab758/
DNV GL - Energy 6-13 October 10, 2014
(CSLB). The CSLB strategies include organized educational campaigns, an ambassador
program, targeted stings, and reporting methods.
Conclusions on Permitting Effect on QI Workpaper 6.2
Baseline Assumptions
Permits had less of an effect on the assumed inefficiencies of program non-incentivized
equipment than expected. The negative attributes of duct leakage and oversizing were higher
for permitted and lower for non-permitted than expected based on assumptions in the QI
workpaper. Key findings from the assessments include the following:
Duct Leakage: On average, non-incentivized duct systems were not as leaky as the QI
program assumption of 24 percent, and there were many systems measured during site
visits that were equal to or less than the target 15 percent leakage for altered duct
systems. The data also shows that on average, the permitted duct systems were only
slightly less leaky than non-permitted duct systems, but that permitted duct systems
were less likely than non-permitted systems to exhibit very high leakage (<20 percent).
System Airflow: The QI workpaper specifies system airflow at 400 CFM/ton. The
average measured system airflow for the non-incentivized sites was lower than the 350
CFM/ton baseline assumed by the QI program. The data shows that on average, airflow
rates for permitted systems are marginally closer (328 CFM/ton) to the target 350
CFM/ton than the non-permitted systems (300 CFM/ton). It should be noted that the
data for the permitted systems shows a broad distribution of airflow rates among that
population, but a quarter of those systems meet or exceeded the QI workpaper target of
400 CFM/ton, while the data for the non-permitted systems showed a stronger tendency
(56 percent versus 38 percent for permitted) for systems with low airflow rates (<300
CFM/ton) and very few systems (9 percent) achieving 400 CFM/ton.
Cooling System Sizing: There is cooling system under- and over-sizing relative to the
Manual J sizing calculation approach, and the program non-incentivized data revealed
that on average there seems to be very little difference between permitted (13 percent)
and non-permitted (16 percent) cooling system over-sizing. Not that system sizing and
the impacts on savings is an area of future research.30
These field assessments begin to provide a market baseline relative to the IOU work paper
baseline assumptions for residential QI. To further meet Title 24 residential requirements,
refrigerant charge and fan watt draw should be included in the scope of future HVAC permitting
studies. Table 8 summarizes the key findings from these field assessments.
30 http://www.energy.ca.gov/2012publications/CEC-500-2012-062/CEC-500-2012-062.pdf
http://www.achrnews.com/articles/print/119497-california-proposes-bypass-duct-ban
DNV GL - Energy 6-14 October 10, 2014
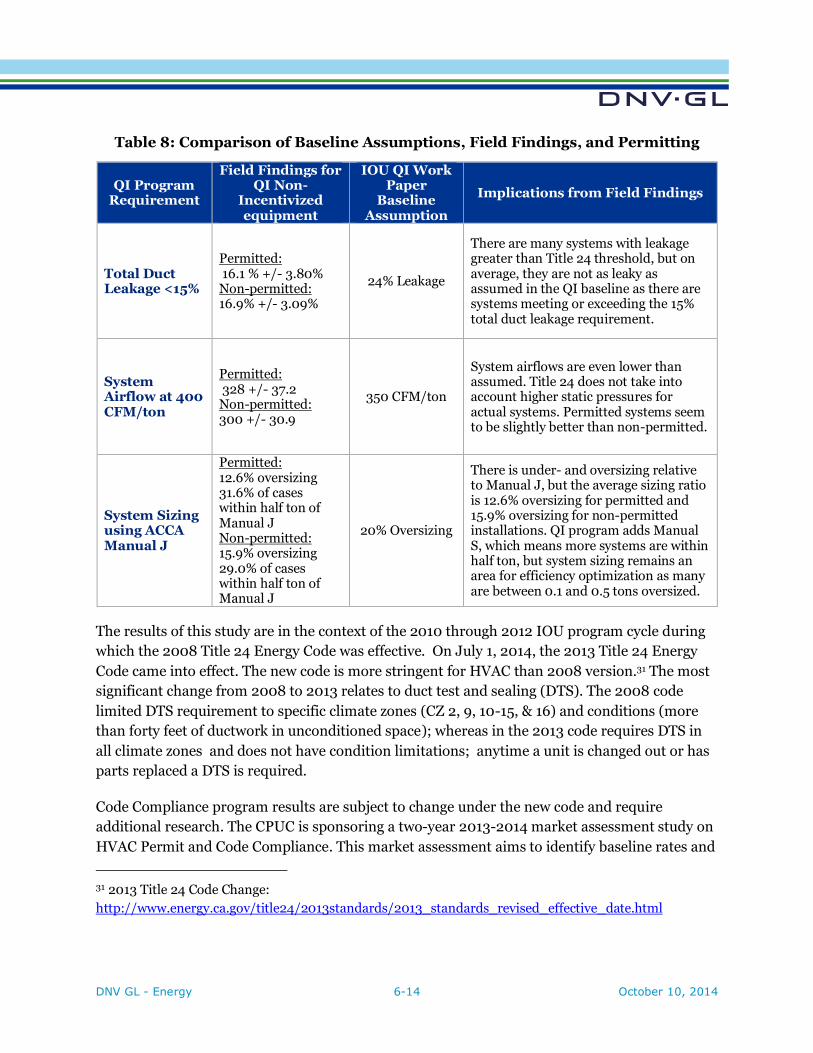
Table 8: Comparison of Baseline Assumptions, Field Findings, and Permitting
QI Program Requirement
Field Findings for QI Non-
Incentivized equipment
IOU QI Work Paper
Baseline Assumption
Implications from Field Findings
Total Duct Leakage <15%
Permitted: 16.1 % +/- 3.80% Non-permitted: 16.9% +/- 3.09%
24% Leakage
There are many systems with leakage greater than Title 24 threshold, but on average, they are not as leaky as assumed in the QI baseline as there are systems meeting or exceeding the 15% total duct leakage requirement.
System Airflow at 400 CFM/ton
Permitted: 328 +/- 37.2 Non-permitted: 300 +/- 30.9
350 CFM/ton
System airflows are even lower than assumed. Title 24 does not take into account higher static pressures for actual systems. Permitted systems seem to be slightly better than non-permitted.
System Sizing using ACCA Manual J
Permitted: 12.6% oversizing 31.6% of cases within half ton of Manual J Non-permitted: 15.9% oversizing 29.0% of cases within half ton of Manual J
20% Oversizing
There is under- and oversizing relative to Manual J, but the average sizing ratio is 12.6% oversizing for permitted and 15.9% oversizing for non-permitted installations. QI program adds Manual S, which means more systems are within half ton, but system sizing remains an area for efficiency optimization as many are between 0.1 and 0.5 tons oversized.
The results of this study are in the context of the 2010 through 2012 IOU program cycle during
which the 2008 Title 24 Energy Code was effective. On July 1, 2014, the 2013 Title 24 Energy
Code came into effect. The new code is more stringent for HVAC than 2008 version.31 The most
significant change from 2008 to 2013 relates to duct test and sealing (DTS). The 2008 code
limited DTS requirement to specific climate zones (CZ 2, 9, 10-15, & 16) and conditions (more
than forty feet of ductwork in unconditioned space); whereas in the 2013 code requires DTS in
all climate zones and does not have condition limitations; anytime a unit is changed out or has
parts replaced a DTS is required.
Code Compliance program results are subject to change under the new code and require
additional research. The CPUC is sponsoring a two-year 2013-2014 market assessment study on
HVAC Permit and Code Compliance. This market assessment aims to identify baseline rates and
31 2013 Title 24 Code Change:
http://www.energy.ca.gov/title24/2013standards/2013_standards_revised_effective_date.html
DNV GL - Energy 6-15 October 10, 2014
barriers for existing HVAC building permits and Title 24 compliance in residential and
commercial buildings.
DNV GL - Energy 7-1 October 10, 2014
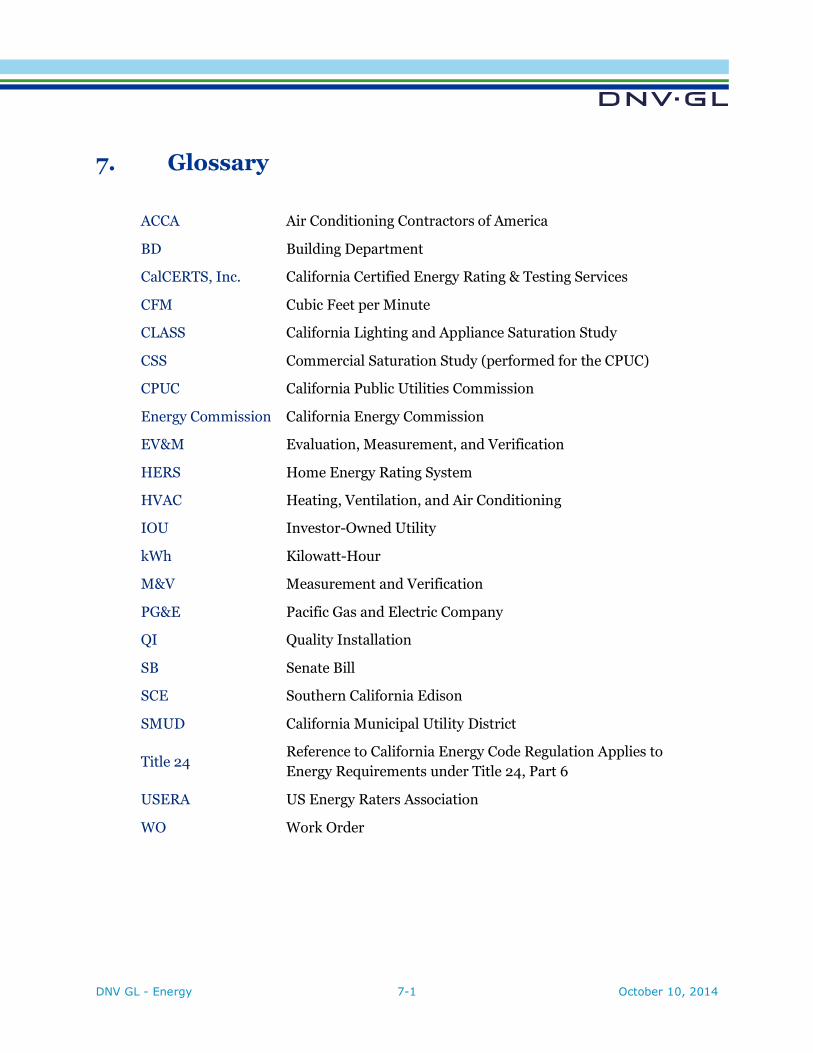
Glossary 7.
ACCA Air Conditioning Contractors of America
BD Building Department
CalCERTS, Inc. California Certified Energy Rating & Testing Services
CFM Cubic Feet per Minute
CLASS California Lighting and Appliance Saturation Study
CSS Commercial Saturation Study (performed for the CPUC)
CPUC California Public Utilities Commission
Energy Commission California Energy Commission
EV&M Evaluation, Measurement, and Verification
HERS Home Energy Rating System
HVAC Heating, Ventilation, and Air Conditioning
IOU Investor-Owned Utility
kWh Kilowatt-Hour
M&V Measurement and Verification
PG&E Pacific Gas and Electric Company
QI Quality Installation
SB Senate Bill
SCE Southern California Edison
SMUD California Municipal Utility District
Title 24 Reference to California Energy Code Regulation Applies to
Energy Requirements under Title 24, Part 6
USERA US Energy Raters Association
WO Work Order
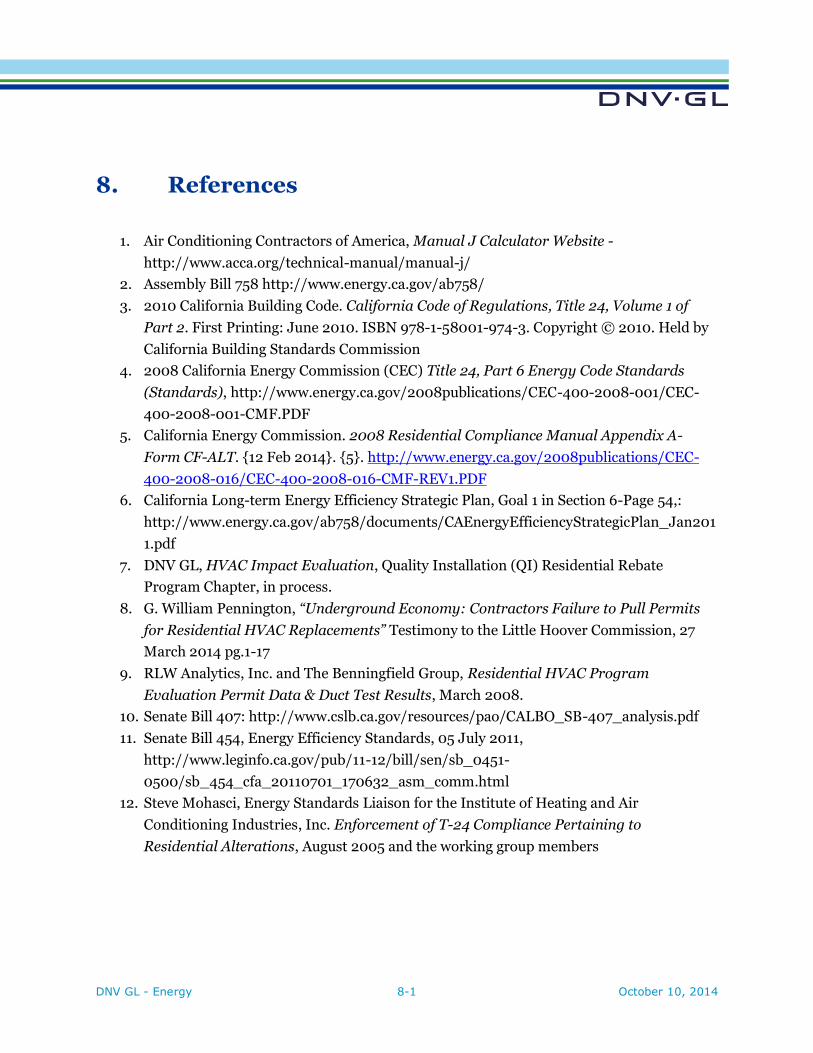
DNV GL - Energy 8-1 October 10, 2014
References 8.
1. Air Conditioning Contractors of America, Manual J Calculator Website -
http://www.acca.org/technical-manual/manual-j/
2. Assembly Bill 758 http://www.energy.ca.gov/ab758/
3. 2010 California Building Code. California Code of Regulations, Title 24, Volume 1 of
Part 2. First Printing: June 2010. ISBN 978-1-58001-974-3. Copyright © 2010. Held by
California Building Standards Commission
4. 2008 California Energy Commission (CEC) Title 24, Part 6 Energy Code Standards
(Standards), http://www.energy.ca.gov/2008publications/CEC-400-2008-001/CEC-
400-2008-001-CMF.PDF
5. California Energy Commission. 2008 Residential Compliance Manual Appendix A-
Form CF-ALT. {12 Feb 2014}. {5}. http://www.energy.ca.gov/2008publications/CEC-
400-2008-016/CEC-400-2008-016-CMF-REV1.PDF
6. California Long-term Energy Efficiency Strategic Plan, Goal 1 in Section 6-Page 54,:
http://www.energy.ca.gov/ab758/documents/CAEnergyEfficiencyStrategicPlan_Jan201
1.pdf
7. DNV GL, HVAC Impact Evaluation, Quality Installation (QI) Residential Rebate
Program Chapter, in process.
8. G. William Pennington, “Underground Economy: Contractors Failure to Pull Permits
for Residential HVAC Replacements” Testimony to the Little Hoover Commission, 27
March 2014 pg.1-17
9. RLW Analytics, Inc. and The Benningfield Group, Residential HVAC Program
Evaluation Permit Data & Duct Test Results, March 2008.
10. Senate Bill 407: http://www.cslb.ca.gov/resources/pao/CALBO_SB-407_analysis.pdf
11. Senate Bill 454, Energy Efficiency Standards, 05 July 2011,
http://www.leginfo.ca.gov/pub/11-12/bill/sen/sb_0451-
0500/sb_454_cfa_20110701_170632_asm_comm.html
12. Steve Mohasci, Energy Standards Liaison for the Institute of Heating and Air
Conditioning Industries, Inc. Enforcement of T-24 Compliance Pertaining to
Residential Alterations, August 2005 and the working group members
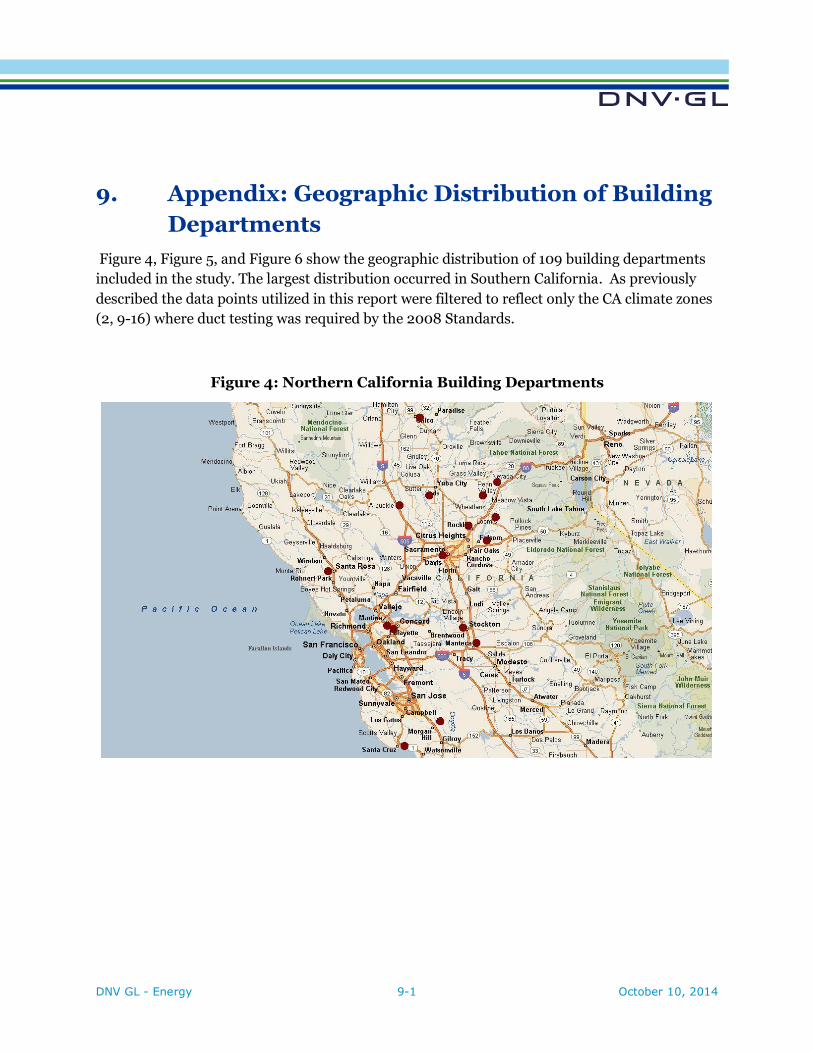
DNV GL - Energy 9-1 October 10, 2014
Appendix: Geographic Distribution of Building 9.
Departments
Figure 4, Figure 5, and Figure 6 show the geographic distribution of 109 building departments
included in the study. The largest distribution occurred in Southern California. As previously
described the data points utilized in this report were filtered to reflect only the CA climate zones
(2, 9-16) where duct testing was required by the 2008 Standards.
Figure 4: Northern California Building Departments
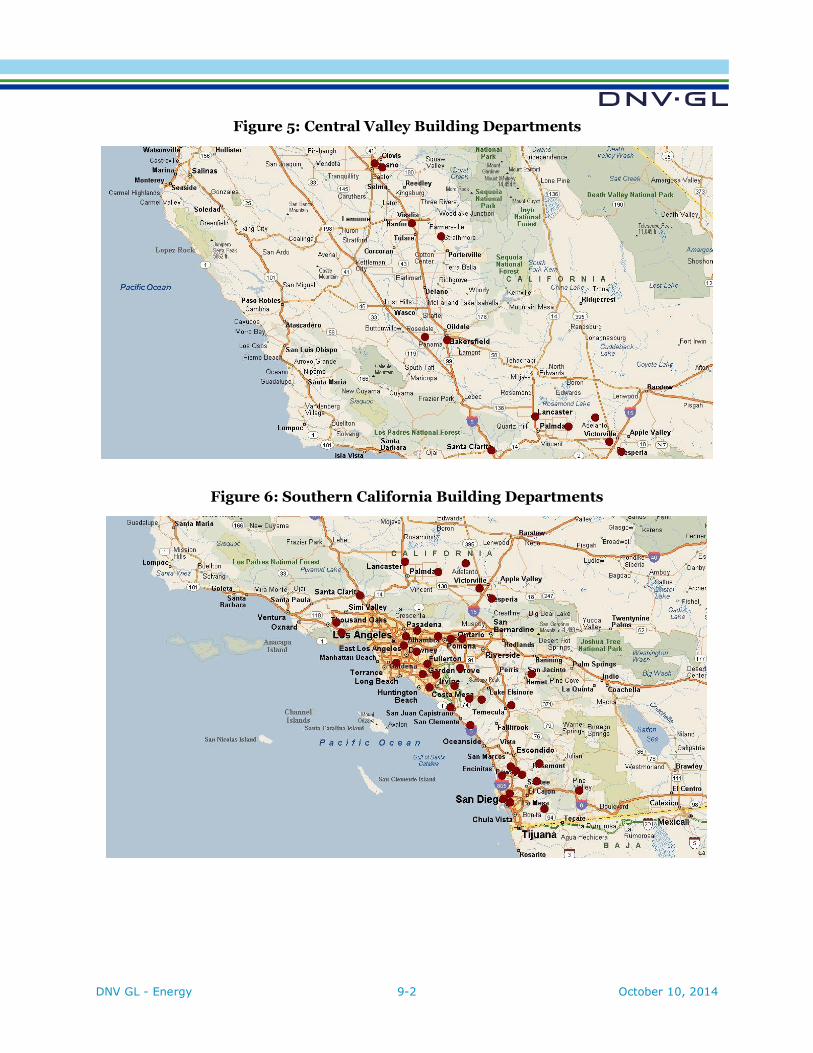
DNV GL - Energy 9-2 October 10, 2014
Figure 5: Central Valley Building Departments
Figure 6: Southern California Building Departments

SAFER, SMARTER, GREENER
THIS IS DNV GL
Driven by our purpose of safeguarding life, property and the environment, DNV
GL enables organizations to advance the safety and sustainability of their
business. We provide classification and technical assurance along with software
and independent expert advisory services to the maritime, oil & gas and energy
industries. We also provide certification services to customers across a wide range
of industries.
Combining leading technical and operational expertise, risk methodology and in-
depth industry knowledge, we empower our customers’ decisions and actions with
trust and confidence. As a company, we continuously invest in research and
collaborative innovation to provide customers and society with operational and
technological foresight. With our origins stretching back to 1864, our reach today
is global. Operating in more than 100 countries, our 16,000 professionals are
dedicated to helping customers make the world safer, smarter and greener.
In the Energy industry
DNV GL delivers world-renowned testing and advisory services to the energy
value chain including renewables and energy efficiency. Our expertise spans
onshore and offshore wind power, solar, conventional generation, transmission
and distribution, smart grids, and sustainable energy use, as well as energy
markets and regulations. Our 3,000 energy experts support clients around the
globe in delivering a safe, reliable, efficient, and sustainable energy supply.
For more information on DNV GL, visit www.dnvgl.com.