Embed Size (px)
Citation preview

© 2011 Conservation Services Group
HVAC for Residential New Construction
Presented by: Rob Sherwood
Conservation Services Group

2
Agenda
•HVAC Rater Checklist
•HVAC Contractor Checklist
• How to Verify a Heating and Cooling Load Calculation
• What is Behind a Load Calculation
• Manual S
• Residential Duct Design
• ACCA Standard 5
© 2011 Conservation Services Group

3
HVAC Rater Checklist.
ENERGY STAR Qualified Homes
HVAC SYSTEM QUALITY
INSTALLATION RATER CHECKLIST
© 2011 Conservation Services Group

4
HVAC
Contractor
Checklist
Starts With Loads
© 2011 Conservation Services Group

5
How to Verify a Heating & Cooling Load Calculation
The Step by Step Process for Verifying Residential Heating and Cooling Loads
© 2011 Conservation Services Group

6
ACCA Method
ACCA- Air Conditioning Contractors of America
Publish a series of manuals with step by step instructions detailing how to size and design a residential heating and cooling system
© 2011 Conservation Services Group

7
What are the Loads on the House?
Conductive
Convective
Latent Loads
Internal Gains
Duct Losses and Gains
Ventilation (if necessary)
© 2011 Conservation Services Group

8
Verifying Conductive Heat Transfer
UAT- “U A delta T” is the basic formula for calculating heat transfer due to conduction
HTM- Manual J combines the u-value and the delta T and calls it a heat transfer multiplier
Manual J has complete set of tables with HTMs listed for both heating and cooling
Cooling HTMs take radiation gains and losses into account for windows
© 2011 Conservation Services Group

9
Where does Delta T come from?
Delta T is the difference in temperature between the inside of the house and the outside at winter (heating) and summer (cooling) design temperatures Design temperatures are not the most extreme that occur during a season Design temperatures are the high and low that outdoor temperatures stay between 99 (or 97.5) percent of the time Boston design temps are 12 and 88 degrees (not zero and 95)
© 2011 Conservation Services Group
10
10
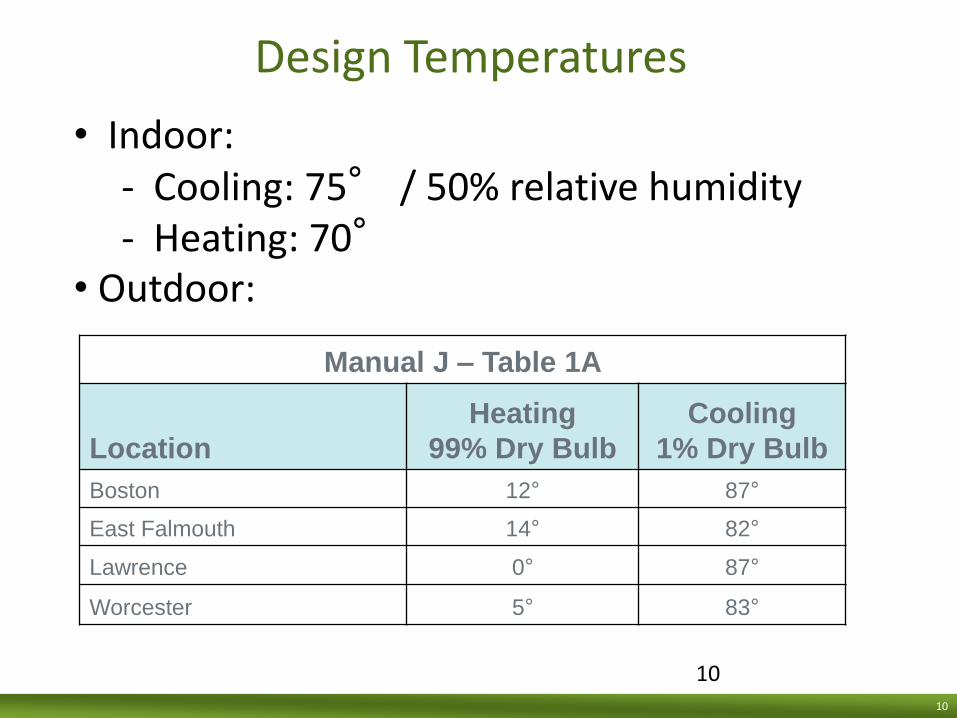
Design Temperatures
Manual J – Table 1A
Location
Heating
99% Dry Bulb
Cooling
1% Dry Bulb
Boston 12° 87°
East Falmouth 14° 82°
Lawrence 0° 87°
Worcester 5° 83°
• Indoor: - Cooling: 75° / 50% relative humidity - Heating: 70°
• Outdoor:

11
11
Temperature Distribution by Hour for a Full Year (8,760 hours)
Boston
0
100
200
300
400
500
600
700
800
900
1000
-5 0 5 10 15 20 25 30 35 40 45 50 55 60 65 70 75 80 85 90 95
Temperature (F)
Ho
urs

12
How to Check a U-Factor
U-Factors for the major components of the building can be checked quickly
Divide the HTMs by the design temperature difference (delta T) and the result will be the U-Factor
U-Factors to R-Factors is 1/U
Question any R-Factors that seem unreasonable
© 2011 Conservation Services Group

13
What about Area?
Finish checking conductive heat loss by verifying reasonableness of component areas
Look for a few related ratios:
1. Check the footprint area. Is there enough ceiling to cover it (is there way
too much ceiling?)
2. Wall area should be close to conditioned floor area (within a few hundred square feet)
3. Window area should fall between 6% and 22% of the wall area
4. Houses usually don’t have more than a few exterior doors
© 2011 Conservation Services Group

14
So, to check conductive heat transfer…(UA deltaT)
Check the winter and summer design temperatures
Divide the HTMs by the winter and summer design Temps to get the U-Factors. Convert to R-factors to check for reasonableness
Look at the construction component areas
© 2011 Conservation Services Group

15
Verifying Convective Losses/Gains
Engineers have a complicated method for calculating losses due to air exchange
Manual-J has a simplified method that may not be as accurate on a case by case basis, but is close enough
Most home builders don’t have budget for this type of engineering analysis
© 2011 Conservation Services Group

16
Convective Losses & Gains
Need to know house volume to calculate.
Use Table 5A to Determine Air Changes per Hour under natural conditions (ACHnat)
Example: An 1800 sq/ft house that has “average” leakage would have a winter ACHnat of .38 and a summer ACHnat of .20.
A blower door test for existing homes would be best.
© 2011 Conservation Services Group

17
Winter Infiltration Btuh
Step 1. Volume x ACH/60 = CFMnat
Step 2. 1.1 x CFMnat x delta T = Btuh
What should we check here?
1. Is the volume reasonable?
2. Does the ACH from Table 5A match the house description?
3. Is the Delta T correct?
© 2011 Conservation Services Group
18
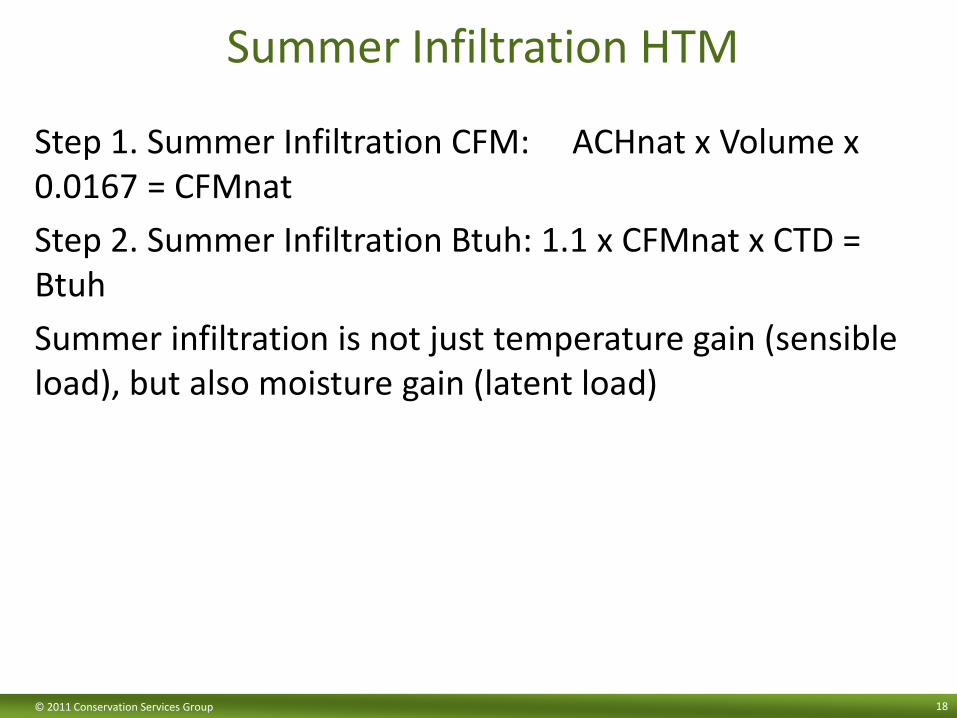
Summer Infiltration HTM
Step 1. Summer Infiltration CFM: ACHnat x Volume x 0.0167 = CFMnat
Step 2. Summer Infiltration Btuh: 1.1 x CFMnat x CTD = Btuh
Summer infiltration is not just temperature gain (sensible load), but also moisture gain (latent load)
© 2011 Conservation Services Group

19
What About Latent Loads?
Need grains difference from Table 1 at 50% RH
.68 x grains difference x CFMnat = Btuh
This is the Latent Cooling Load
© 2011 Conservation Services Group

20
Summer Infiltration Load Check
What are we looking for here to verify accuracy?:
1. Is the volume reasonable?
2. Does the ACH from Table 5A match the house description?
3. Is the summer ACH less than the winter?
4. Is the summer load split into latent and sensible?
5. Is that split ratio reasonable for the climate zone the house is in?
© 2011 Conservation Services Group

21
Internal Gains
Multiply number of occupants by 230 to get sensible gain Multiply number of occupants by 200 to get latent gain People should be placed in the room where they would most likely be at peak load. (not bedrooms) Appliance sets: Stove, Fridge, DW = 1200 Btuh, Washer & Dryer = 1200 Btuh Mechanicals: Heating & Cooling & DHW systems in conditioned space = 1200 Btuh
© 2011 Conservation Services Group

22
Internal Loads Verification
The number of occupants should be reasonable for the space (# beds +1)
If this is a room by room calculation, place the people where they would most likely be in the afternoon (peak load time)
Appliance sets are 1200 Btuh. The key here is “set”, not per appliance
© 2011 Conservation Services Group

23
Duct Losses & Gains
Duct losses & gains are in Tables 7A-D. Which table to use is based on duct config. & location
Use the winter & summer design temps. To determine Base Case Heat Loss Factor (BHLF), Base Case Sensible Gain Factor (BSGF) & Base Case Latent Gain (BLG)
Multiply the BHLF, BSGF & BLG by duct insulation R-value correction
Multiply the BHLF, BSFG & BLG by the duct leakage correction factor
This number x 100 is the percentage of heat loss or gain in the duct system
© 2011 Conservation Services Group

24
So to Check Duct Losses/Gains
Check the location
Check the insulation level
Check the leakage level
If you want to check it quick, look at Table 7, get these values and multiply them by each other.
Lowest possible = 6%, Highest = 65%
© 2011 Conservation Services Group

25
Ventilation (if necessary)
Defined as for occupants and equipment.
For occupants:
CFM.35=.35 x Above Grade Vol./60
Needed for Occ.:
CFMocc= 20 (#beds +1)
For Equipment:
CFMcomb= .5 x input Btuh of atm burners 1000.
© 2011 Conservation Services Group

26
Ventilation Loads (cont)
Select the largest of the three ventilation needs (CFM.35, CFMocc, or CFM comb)
Now, subtract the estimated cooling infiltration or ½ the estimated heating infiltration from the ventilation CFM
Whichever produces the lowest ventilation rate is the one chosen
Evaluate the ventilation CFM load as if it were infiltration
© 2011 Conservation Services Group

27
Ventilation Checks
Correct Above Grade Volume
Correct or reasonable number of occupants
Btuh input of equipment either existing or proposed is reasonable or accurate
© 2011 Conservation Services Group

28
Conclusions
How deep do you want to dig?
1. Weather Station (delta T)
2. Infiltration Factors (ACHnat)
3. Duct Leakage Multiplier
4. U-Factors (HTM/delta T)
5. Internal Gains
6. Ventilation Loads
© 2011 Conservation Services Group

29
What is Behind a Load Calculation?
The Science Behind the Printout
© 2011 Conservation Services Group

30
1st Law of Thermodynamics
Energy is neither created nor destroyed However:
• Energy moves from place to place
And while moving • Energy can change forms
2nd Law of Thermodynamics Energy flows naturally from high concentrations to low concentrations.
– Temperature: Heat moves to cold
– Air Movement: High air pressure moves to low air pressure
– Moisture Transfer: Wet moves to dry
© 2011 Conservation Services Group

31
Temperature - Heat Transfer
Heat is a form of energy
Heat moves in all directions when there is a delta T and when in motion is referred to as “heat transfer”
Three types of heat transfer
• Conduction
• Convection
• Radiation Heat moves in all directions and will move faster as temperatures outside or inside increase or decrease
Winter – heat moving to outside
© 2011 Conservation Services Group

32
British Thermal Unit (BTU)
A basic measure of heat energy • It is an amount, not a rate (avoid 100K BTU heating systems!)
The amount of heat needed to raise one pound of water one degree Fahrenheit
© 2011 Conservation Services Group

33
CONDUCTION
Heat Goes to Cold
Affected by:
• Insulation
– Installation practices
• Windows
• Framing techniques
Photo © Kevin Kennefick 2001
© 2011 Conservation Services Group

34
U-value
Rate of heat energy (Btu) flowing through 1 s.f. of material, per hour, per 1°F
• Basis of heat loss calculations
U-value is “one over” R-value (U=1/R)
• Smaller U-values mean lower heat loss
• Larger U-values mean higher heat loss
Windows and doors are rated in “U”
U values can be averaged over surface areas
• But can’t be added in thermal path
© 2011 Conservation Services Group

35
R-value
The most common unit of measure for describing insulation performance
Inverse of U-value
“Resistance” to heat flow
R values can be added (in thermal path)
• But can’t be averaged over areas
© 2011 Conservation Services Group

36
CONVECTION
Heat transfer from a solid surface to a fluid in contact (usually in motion)
Refers to movement of fluid due to differential buoyancy (warm air is less dense than cool air)
Heat carried by a moving fluid (mass-flow)
• How furnaces and boilers get heat to the rooms
Air leaving the building takes heat with it
• Same amount of heat must be added to incoming air to maintain temp
• Also mass-flow; typically referred to as “convection”
© 2011 Conservation Services Group

37
Convection: Driving Forces
Temperature Wind Exhaust/Mechanicals
Temperature is typically the dominant effect
© 2011 Conservation Services Group

38
Stack Effect Positive pressure (relative to outdoors)
Negative pressure (relative to outdoors)
Neutral Pressure Plane
© 2011 Conservation Services Group

39 © 2011 Conservation Services Group

40
RADIATION
Hot surfaces warm you up
• You feel heat through space, even if the air is cold
• You feel cold surfaces the same way
Function of temperature difference, area
© 2011 Conservation Services Group

41
Mean Radiant Temperature
72°F
64°F
68°F
59°F
70°F
Mean Radiant Temperature: = 67 °F
© 2011 Conservation Services Group
42
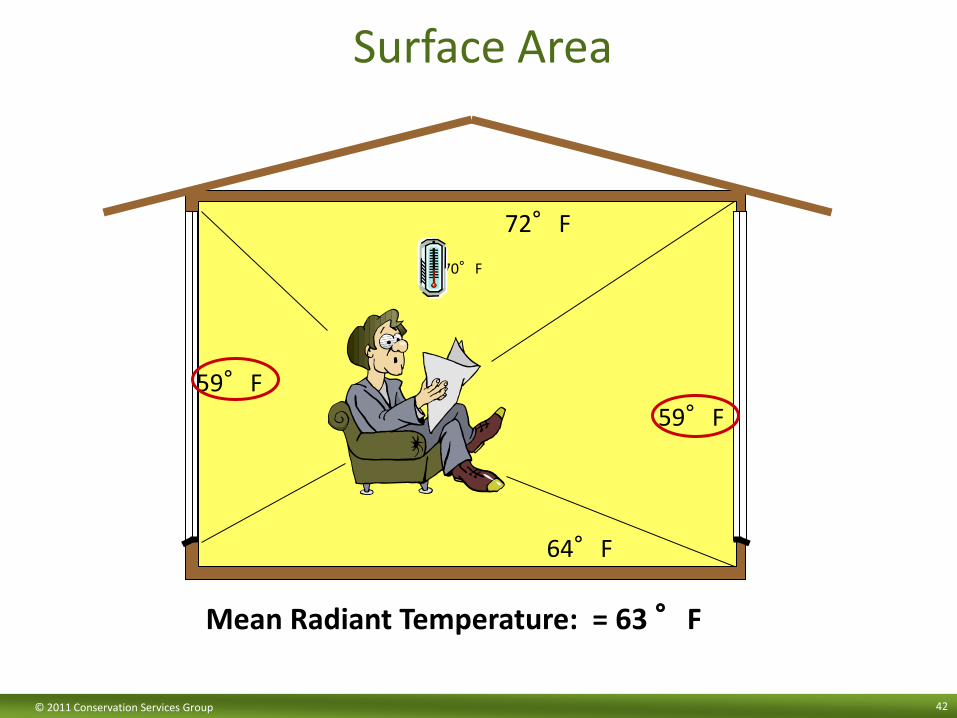
Surface Area
72°F
64°F
59°F
59°F
70°F
Mean Radiant Temperature: = 63 °F
© 2011 Conservation Services Group

43
Energy Related Formulas
© 2011 Conservation Services Group

44
What’s a UA anyway?
“UA” refers to the u-factor, times the area, of a given component
UA is the heat transfer through that component:
Example: 1000 s.f. of R-11 wall (u-factor=0.089):
U x A = .089 x 1000 = 89 BTU/HR/°F
U x A x DT is the heat transfer at a given temp.
Example: Heat loss at 70°F in, 90°F out: (Heat Gain)
89 x 20 = 1780 BTU/HR
© 2011 Conservation Services Group

45
Average R-value Calculation: Steps 1 & 2
Example: 1000 s.f. of R-38 ceiling, 5 s.f. @ R-1:
STEP ONE: Convert R-values to u-factors (if necessary)
U=1/R; here, 1/38 = 0.026 and 1/1=1
STEP TWO: Determine UATotal
UATotal= (U1xA1)+(U2xA2)+...(UnxAn)
Here, UATotal= (0.026 x 995) + (1 x 5) = 30.87
© 2011 Conservation Services Group

46
Average R-value Calculation: Steps 3 & 4
Example: 1000 s.f. of R-38 ceiling, 5 s.f. @ R-1:
STEP THREE: Convert UATotal to UOverall
UO = UATotal/ATotal; here, 30.87/1000 = 0.031
STEP FOUR: Convert UOverall to ROverall
RO = 1/UO; here, 1/0.031 = 32
Unfortunately, the hard way is the right way!
© 2011 Conservation Services Group

47
Instantaneous (Design) Load: Convection (Mass flow)
Heat capacity of air = 0.018 btu / cu ft / °F
Heating or cooling load associated with an air stream:
• cu ft/min x 0.018 btu/cu ft/°F x 60 min/hr x °F
Btu/hr = CFM x 1.08 x DT
© 2011 Conservation Services Group

48
What About Radiation?
Not significant when calculating heating loads
Dominant heat transfer method when calculating cooling loads
1. How much glass area?
2. What direction does it face?
3. What type of glass is it?
4. Shading?
© 2011 Conservation Services Group

49
Manual-J Table 3
Manual-J supplies a Heat Transfer Multiplier (HTM)
This is a multiplier that takes into account the u-factor of the glass, the design delta T, and the radiation gain through the glass
It varies by direction
This number is multiplied by the area to calculate the heat gain through the window
© 2011 Conservation Services Group

50
Internal Gains
People make heat and moisture
-230 Btu/h of sensible gain per person
-200 Btu/h of latent gain per person
• Number of beds +1
• There are no adjustments made for entertaining guests
• 1200 Btu/h for an appliance SET
© 2011 Conservation Services Group

51
So, Simply Stated
Heating Load = Conductive Losses¹ + Convective Losses² – Internal gains
Cooling Load = Conductive Gains¹ + Convective Gains² + Radiation Gains³ + Internal Gains
¹ UAΔT
² CFMn x 1.08 x ΔT
³ HTM x Area
© 2011 Conservation Services Group

52
HVAC
Contractor
Checklist
Next – Select Equipment
© 2011 Conservation Services Group

53
Manual S
A very quick look at the essential points
© 2011 Conservation Services Group

54
How do I get started?
Accurate load calculation (no rules of thumb)
Operating conditions at the building site
Estimating cooling CFM
Equipment selection data summary
Cooling data must be comprehensive
Blower Performance data
ARI Certification data
© 2011 Conservation Services Group
55
Load Calculations
Manual or Right-J
Some manufacturer’s software are okay (Elite)
Heat loss or gain is always calculated the same way.
UAdeltaT for conduction, CFMn x 1.08 x delta T for convection. Use lookup tables for summer radiation heat gain.
© 2011 Conservation Services Group

56
Operating Conditions at Building Site
The capacity of DX coils will be affected by outdoor air temp. for air source
The capacity of water source cooling will be affected by entering water temp
Should choose the Manual-J 2 ½ % dry bulb temp for AS. (some exceptions)
For water source, local ground water temp for “open” loop or for closed loop the water temp of the circulating water
© 2011 Conservation Services Group

57
Estimating Cooling CFM
Calculate the sensible heat ratio (SHR) sensible load/total load
Determine best temperature for supply air
- SHR is high, LAT can be warmer (58 F)
- SHR is low, LAT has to be cooler (54 F)
© 2011 Conservation Services Group
Location
70 99% db 3 67
75 1% db 90 15
50% Grains 38 Medium
41 Elevation 771 0.978
9755 15.49% 5554 24.11%
496 0.79% 1500 6.51%
1097 1.74% 426 1.85%
21113 33.52% 6194 26.88%
201 0.32%
9519 15.11%
5723 9.09% 150 0.65%
846 1.34% 195 0.85%
7652 12.15% 745 3.23%
3320 14.41%
796 1.26% 188 0.82%
3602 5.72% 806 3.50%
62981 100.00% 23038 100.00%
3589
26628
Infiltration
Internal Gains
Total Latent
Total Cooling Load
Duct Loss & Gain
Ventilation
Blower Heat Gain
Total Sensible
Wood & Metal Doors
Above Grade Walls
Slab Floors
Partition Floors
Partition Walls
Below Grade Walls
Ceilings1733
37
252
Partition Ceilings
Passive Floors
42
1712
960
961
2795
1621
596
Workshop
Utility Room
Rec Room
237
HEAT LOSS HEAT GAIN
59379
6188
Valparasio IN
10
Total Area Construction Components
Windows & Glass Doors
Skylights
Room Totals
614
788
1669
1545
2067
Kitchen
MANUAL J8AE ● SUMMARY REPORT
HEAT LOSS
9694
Indoor Design Cooling RH Daily Range
1925
Family Room
Room Name HEAT GAIN
Indoor Design Cooling db
HTDIndoor Design Heating db
CTD
Latitude
Bedroom 3
Project
Bath 1
13423124
Hall A
Bedroom 2
560885
Living Room
Bedroom 1
Barh 2
16573746
1429
6080 3185
22232
ACF
7471
6140
15528
ACCA House w ith Addition Location
70 99% db 3 67
75 1% db 90 15
50% Grains 38 Medium
41 Elevation 771 0.978
9755 15.49% 5554 24.11%
496 0.79% 1500 6.51%
1097 1.74% 426 1.85%
21113 33.52% 6194 26.88%
201 0.32%
9519 15.11%
5723 9.09% 150 0.65%
846 1.34% 195 0.85%
7652 12.15% 745 3.23%
3320 14.41%
796 1.26% 188 0.82%
3602 5.72% 806 3.50%
62981 100.00% 23038 100.00%
3589
26628
Infiltration
Internal Gains
Total Latent
Total Cooling Load
Duct Loss & Gain
Ventilation
Blower Heat Gain
Total Sensible
Wood & Metal Doors
Above Grade Walls
Slab Floors
Partition Floors
Partition Walls
Below Grade Walls
Ceilings1733
37
252
Partition Ceilings
Passive Floors
42
1712
960
961
2795
1621
596
Workshop
Utility Room
Rec Room
237
HEAT LOSS HEAT GAIN
59379
6188
Valparasio IN
10
Total Area Construction Components
Windows & Glass Doors
Skylights
Room Totals
614
788
1669
1545
2067
Kitchen
MANUAL J8AE ● SUMMARY REPORT
HEAT LOSS
9694
Indoor Design Cooling RH Daily Range
1925
Family Room
Room Name HEAT GAIN
Indoor Design Cooling db
HTDIndoor Design Heating db
CTD
Latitude
Bedroom 3
Project
Bath 1
13423124
Hall A
Bedroom 2
560885
Living Room
Bedroom 1
Barh 2
16573746
1429
6080 3185
22232
ACF
7471
6140
15528
ACCA House w ith Addition
(ACCA Presentation Man S)

58
SHR, LAT and TD
How are they related?
-SHR <.80, the LAT=54 and the DT is 21 F
-SHR>.80 but<.85, the LAT=56 and the DT is 19 F
-SHR > .85, the LAT=58 and the DT is 17 F
© 2011 Conservation Services Group

59 © 2011 Conservation Services Group
Determine the sensible heat ratio (SHR).
SHR = Sensible Load Total Cooling Load
SHR = 23,038 BTUH = .865 26,628 BTUH

60
Sensible Heat Equation
Once the TD is calculated the cooling CFM can be calculated
- CFM = Sensible Load/1.1 x TD
- Cooling CFM will determine blower size
© 2011 Conservation Services Group

61
CFM = Sensible Load 1.1 x TD
CFM = 23,038 BTUH 1.1 x 17°TD
= 1,232 CFM Possible data table Cfm + or - 15% ≈ 1,050 Cfm to 1,415 Cfm
Ball Park Estimate for Blower Cfm
(ACCA Presentation Man S)

62
Blower Performance Data
Supplied by the equipment manufacturer
Can be a table or fan curve
Should show the designer
-Model number and btu capacity
-CFM flow at different speeds
-CFM flow should vary by ESP
© 2011 Conservation Services Group

63
Equipment Selection Summary Data
Design Loads:
Latent & Sensible,
Heating
Outdoor Conditions:
Summer dry & wet
bulb, winter dry bulb
Room Conditions:
Dry bulb cooling,
relative humidity, dry
bulb heating
Air @ Indoor Coil:
Dry bulb cooling, wet
bulb cooling, dry bulb
heating
Air Flow Estimate:
TD from Table 1-4 &
CFM from equation
Water Temperature:
Late Summer, late
Winter
© 2011 Conservation Services Group

64
Capacity Data Shall be in Range; Example 1
Select capacity for medium fan speed (preferred). The outdoor design temperature is 90 F, so we should interpolate capacity values for 90 F, but we will just use 95 F to demonstrate procedure. At 1,000 Cfm: Total Cap = 28,020 Btu/h (Ok); Sensible Cap = 27,560 Btu/h (OK); Latent Cap =460 Btu/h (Not OK) A fan speed increase (1,125 Cfm) will not help because it causes latent capacity to go to zero. The reason this unit does not have much sensible capacity is because the indoor coil is relatively large for the condensing unit (designed for a dry climate).
(ACCA Presentation Man S)

65
Capacity Data Shall be in Range; Example 2
1,000 CFM, 95 F, 63 F EWB Total cap = 28,700Btuh Sensible cap = 21,200Btuh Latent cap = 7,700Btuh Latent load = 3,590 Btuh XS Lat cap = 4,110 Btuh ½ XS Lat = 2,055 Btuh Net Sens cap = 23,255 Btuh Req Sens cap = 23,040 Btuh Unit is in range Speeding up blower to 1,125 Cfm increases total cap by 2% and increases sensible cap by 6%. This unit has a relatively small indoor coil for the condensing unit (good for very humid climate).
(ACCA Presentation Man S)

66
ARI Certification Data
AHRI data is only for comparing performance of various makes and models of cooling units and heat pumps
It is not the same as manufacturer’s data
AHRI only provides a units TC not its Latent or sensible.
Coil performance is based on CFM, AHRI no data
AHRI data is not site specific
© 2011 Conservation Services Group

67
Step 1 Choosing the Appliances
Has to satisfy BTU (both heating and cooling (latent & sensible))
Fan has to be able to supply needed CFM at a reasonable ESP
Read the footnotes on the table/chart, these will tell you what air side devices have or have not been accounted for
© 2011 Conservation Services Group

68
Sample Blower Table
Footnotes
1. Filter pd included
2. DX coil not included
Model
Spee
d
.4
ESP
.5
ESP
.6
ESP
HC40-60
Low
Med
High
535
575
602
407
445
500
350
405
450
HC40-80
Low
Med
High
625
735
812
595
675
780
550
625
730
HC60-80
Low
Med
High
625
735
812
595
675
780
550
625
730
© 2011 Conservation Services Group

69
Sample Blower Table
Footnotes
1. Filter pd included
2. DX coil not included
Model
Spee
d
.4
ESP
.5
ESP
.6
ESP
HC40-
60
Low
Med
High
535
575
602
407
445
500
350
405
450
HC40-
80
Low
Med
High
625
735
812
595
675
780
550
625
730
HC60-
80
Low
Med
High
625
735
812
595
675
780
550
625
730
© 2011 Conservation Services Group

70
Air Source Heat Pumps
Sizing should be based on the cooling load
After equipment selection a “balance point diagram” can be used to evaluate heating
Equipment selection for ASHP cooling is same as for cooling only
© 2011 Conservation Services Group
71
Balance Point Diagram
Balance point of a system is when the capacity of the heat pump =s the load on the structure
The balance point can be found by graphing the structure heat load and the system heating capacity on the same graph
The intersection is the balance point
© 2011 Conservation Services Group

72
Balance Point Considerations
Should not adjust balance point by oversizing (poor cooling perf)
Can only adjust capacity by changing unit
Can adjust shell efficiency and this will change the load vs capacity point
Supplementary heat source below balance point
© 2011 Conservation Services Group

73
Ground/Water Source Heat Pumps
Capacity dependant on ground or EWT.
EWT is affected by loop type and well type.
EWT can be estimated using the following
-cooling peak=Extreme Summer Temp-10
-heating peak=Extreme Winter Temp+40
These formulas should be used for closed loop or re-injection wells.
© 2011 Conservation Services Group

74
GHP Balance Point
Differs slightly from ASHP
ASHP is a line that has a slope
GSHP is a straight line at a constant value (EWT)
Wherever that line intersects is where supplemental heat will be required
© 2011 Conservation Services Group

75
So, in Conclusion
Need the heating and cooling loads
Need the cooling CFM (or heating if no A/C)
Need the manufacture’s data
Need site specific information (sometimes)
AHRI data is good to verify total capacity if coils are not listed by manufacture
© 2011 Conservation Services Group

76
HVAC
Contractor
Checklist
Design our Ducts Did you know
This is Code?
© 2011 Conservation Services Group

77
Residential Duct Design
ACCA Manual D Method for Sizing Heating & Cooling Ducts
© 2011 Conservation Services Group

78
Design Considerations
Rambling Floor Plans: Have very diverse loads at diverse times. Should zone Multi-Level Plans: Connected by open stairwells or balconies. Heat stratification is a problem. Careful design and continuous low speed fan operation can minimize this Incompatible Construction Features: Rooms on slabs, conditioned basements, attic rooms, etc. Incompatible Glass Areas: East glass vs. West glass, thermostat placement etc. Summer Loads vs. Winter Loads: Seasonal branch damper adjustments Occupants

79
Supply Duct System Types
Classified by their Geometry, Supply Outlet Location, and Material
1. Geometry: Trunk & Branch, Radial, Perimeter Loop (pros & cons Sect. 1-6,7,& 8)
2. Supply Outlet Location: Perimeter, Ceiling, Inside Wall. (ACCA Manual T)
3. Material: Many different materials. Generally see “hard duct”, flex duct, duct board, PVC (high velocity)
© 2011 Conservation Services Group

80
Return Duct System Types
Return duct systems primarily described by number of return openings
1. Central
2. Multiple
3. Every Room
© 2011 Conservation Services Group

81
Secondary Return Classifications
Location: High Wall, Low System (floor or low wall)
• Place returns where convenient and aesthetic. Returns DO NOT affect air movement or patterns in the room (Manual T, section 7)
Geometry: Like supplies, they can be trunk & branch, radial, perimeter
© 2011 Conservation Services Group

82
Duct Efficiency
Try to place appliances and ducts in conditioned space
If ducts are run in unconditioned space they must be sealed and insulated
Thoroughly Sealed, Lots of Insulation
Seal and Insulate the Ducts
Cooling ducts and vapor retarders
Seal and Insulate the Ducts
© 2011 Conservation Services Group

83
Basic Principles of Residential Duct Design
Units are inches of water column “IWC”
Blower Performance: the amount of air (CFM) that is delivered by a blower depends on the resistance (pressure) that the blower has to work against
Blower data can be summarized in a table or a graph
© 2011 Conservation Services Group

84
Blower Performance Data
Some furnaces are heat only
Some are designed for heating & cooling
Blower data generally supplied with technical information from manufacturer
Must have this blower data to design the system
© 2011 Conservation Services Group

85
Furnace Blower Performance The 93 size provides 1,600 Cfm @ 0.60 IWC
Blower
Speed 0.20 0.30 0.40 0.50 0.60 0.70 0.80 0.90
HI 1,354 1,307 1,253 1,200 1,120 1,060 980 880
Med/Hi 1,087 1,075 1,044 1,010 965 615 840 750
Med 823 854 840 816 780 738 678 607
Low 740 730 720 680 665 620 573 500
HI 1,390 1,337 1,270 1,207 1,138 1,063 949 858
Med/Hi 1,230 1,176 1,137 1,082 1,012 931 838 718
Med 1,008 984 956 912 872 806 722 587
Low 872 847 834 800 758 690 600 495
HI 1,921 1,888 1,831 1,759 1,668 1,624 1,549 1,445
Med/Hi 1,750 1,720 1,682 1,661 1,625 1,494 1,397 1,327
Med 1,515 1,491 1,462 1,421 1,397 1,330 1,258 1,185
Med/Low 1,315 1,300 1,255 1,213 1,188 1,159 1,103 1,017
Low 1,033 982 962 952 906 851 804 721
USA-GASF93
USA-GASF45
USA-GASF67
CFM @ External Static Pressure (IWC) with filter in place
Model
Data is true if we use the factory filter! Not true if we use an accessory filter!
(ACCA Presentation Man D)

86
Duct Performance
The resistance that the blower works against is created by the air side devices and the duct work
Duct performance can be graphed also
When duct performance and blower performance are plotted on the same graph, we get the “system operating point”
If the system operating point does not supply the required CFM:
–Change the fan speed
–Alter the duct geometry
–Change the duct material (flex to hard)
© 2011 Conservation Services Group

87
Air Side Devices
Secondary equipment consists of optional components that are added to the base system
–DX coils
–Dampers
–Humidifiers
–Media, HEPA, or Electro-Static Filters
Secondary equipment causes an increase in the resistance to the air flow. This must be accounted for.
© 2011 Conservation Services Group
88
Basis for Calculating Available Static Pressure
Based on Blower Performance Data
Air Side Accessory Device Pressure Drop Data
These two sets of data are used to determine Available Static Pressure (ASP)
ASP is the amount of pressure left over after all of the air side device pressure drops have been subtracted from the ESP that a fan can produce
© 2011 Conservation Services Group

89
Total Equivalent Length (TEL)
Duct runs consist of straight sections and various fittings
Pressure loss is associated with both
The total pressure drop that is associated with a duct run is the sum of the pressure losses of the straight runs and the fittings
If a fitting had the same pressure drop as 30 feet of straight duct, it would have an equivalent length of 30 feet
© 2011 Conservation Services Group

90
System TEL
A systems’ TEL is the sum of the longest TEL of the supply side and the longest TEL of the return side They need to be carefully calculated using the TELs for various fittings and configurations that are listed in Appendix 3 of Manual D The TEL of the longest supply run and the TEL of the longest return run need to be found and calculated These two TELs are added together and a system TEL is used in the friction equation
© 2011 Conservation Services Group
91
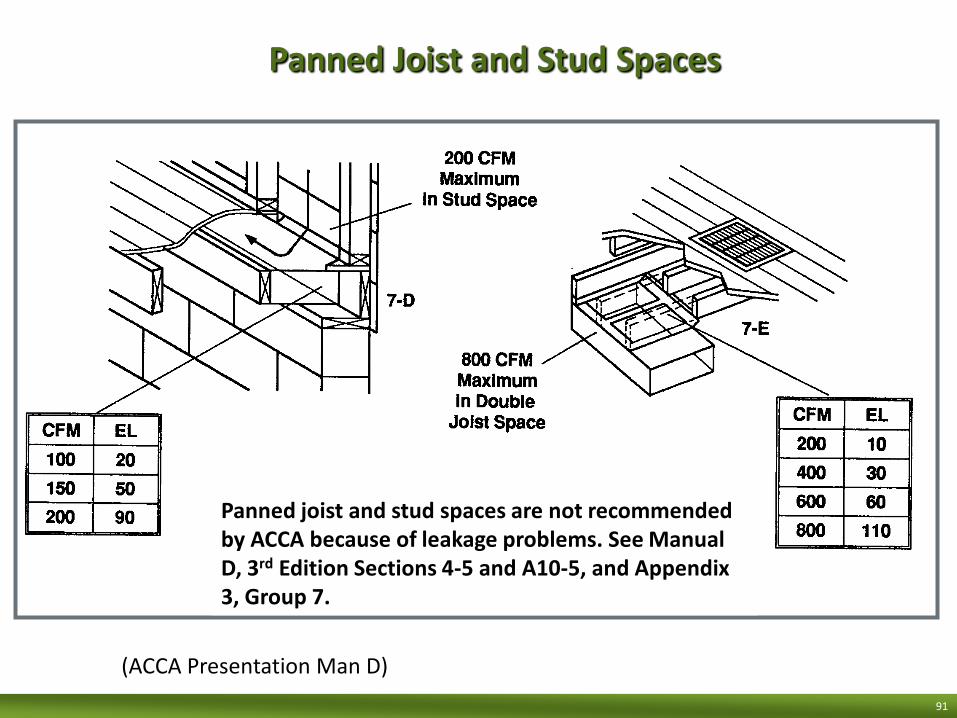
Panned Joist and Stud Spaces
Panned joist and stud spaces are not recommended by ACCA because of leakage problems. See Manual D, 3rd Edition Sections 4-5 and A10-5, and Appendix 3, Group 7.
(ACCA Presentation Man D)

92
Pressure Drop vs. Friction Rate
Pressure Drop is equal to the total pressure loss that occurs between any two points in a system (expressed in IWC)
Friction Rate is equal to the pressure loss that occurs between two points in a system that are separated by a specific distance. Friction charts and slide rules use 100’ as the reference distance (expressed in IWC/100)
To use the duct calculator, pressure drop data must be converted to the friction rate that is associated with 100 feet of duct run
© 2011 Conservation Services Group

93
Friction Rate Equation
Friction rates are not chosen
Friction rates are calculated
• “ a six inch duct will deliver 100 cfm”
• “I always design my system using .1 as the friction rate”
FR= ASP x 100
TEL
© 2011 Conservation Services Group

94
Example
If a blower could move 1000 cfm against a pressure of .20 IWC and the TEL of the duct system (sum of straight runs and fittings) was 300 ft…
FR= .20 x 100 = .067 IWC/100
300 ft
This is the friction rate that would be used to size the ducts. Not .1 IWC/100
© 2011 Conservation Services Group
95
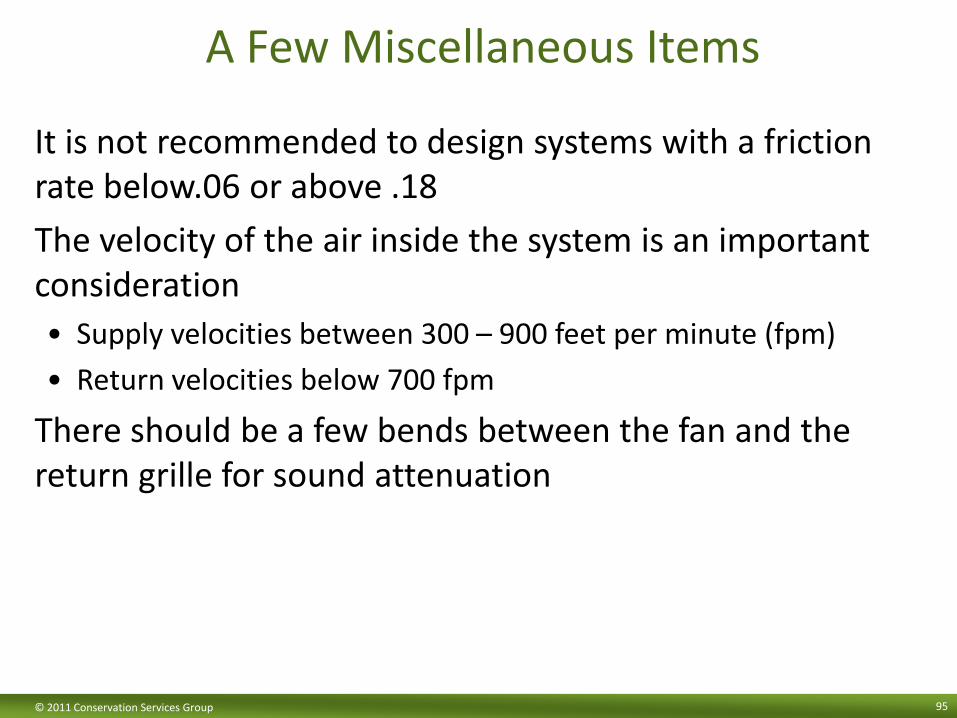
A Few Miscellaneous Items
It is not recommended to design systems with a friction rate below.06 or above .18
The velocity of the air inside the system is an important consideration
• Supply velocities between 300 – 900 feet per minute (fpm)
• Return velocities below 700 fpm
There should be a few bends between the fan and the return grille for sound attenuation
© 2011 Conservation Services Group

96
Chapter 8
This is the chapter with the step by step process spelled out
This chapter discusses a few very important considerations that need to be reviewed before starting
© 2011 Conservation Services Group

97
CFM vs. Velocity
Noise caused by excessive velocity, or poor throw caused by too low a velocity are important considerations
Final duct size may be a compromise between getting adequate airflow and keeping the run quiet
A duct sizing worksheet has been developed to help with this process
© 2011 Conservation Services Group

98
TEL Worksheet
© 2011 Conservation Services Group

99
Sizing Worksheet
© 2011 Conservation Services Group

100
Designer Responsibilities
Ensure that the pressure drop associated with the longest possible circulation path (longest supply TEL + longest return TEL) does not exceed the ASP
That the velocity that is associated with any section does not exceed the recommended limit
© 2011 Conservation Services Group

101
Balancing Dampers
Systems could be designed with multiple friction rates, each rate applying to a particular run • very time consuming to design
• velocity would be an issue
• non-standard run out sizes would be required
These factors make this impractical, therefore a properly designed system will not be self-balancing
Balancing dampers must be installed at the BEGINNING of each supply run out
© 2011 Conservation Services Group

102
Manual D
Loaded with very good information that every residential HVAC designer should know
If you only ever read a few chapters, make it 3 & 8.
Appendix 3 is crucial to process
Appendix 1 has all of the design equations
© 2011 Conservation Services Group

103
If there is time we have an example
© 2011 Conservation Services Group
Will This Duct System Work?Duct Sizing for Furnace & A/C
Replacements
© 2011 Conservation Services Group

104 © 2011 Conservation Services Group

105 © 2011 Conservation Services Group

106 © 2011 Conservation Services Group

107
HVAC
Contractor
Checklist
Next is Set Up Some might say
Commissioning.
© 2011 Conservation Services Group

108
ACCA Standard 5
HVAC Quality Installation Specification
© 2011 Conservation Services Group

109
Sections 1 & 2 Purpose and Scope
Minimum criteria for quality HVAC installation
-Proper Installation/Sizing
-Proper Maintenance
-Proper Servicing
-Customer Education
• Residential
-AC and Heat Pumps up to 65K
-Furnaces up to 225K
-Boilers up to 300K
© 2011 Conservation Services Group

110
HVAC System Types This Standard Applies To
Heating
• Heat Pumps
• Hot Water Coil, Fin Tube, Unit Heaters/Vent
• Electric Resistance Coils
• Hot Air Furnaces
• Radiant equipment
© 2011 Conservation Services Group

111
Applicable Systems (Cont)
Cooling
• Heat Pumps
• Rooftop Single or Multi Zone
• PTACS, Mini-splits
© 2011 Conservation Services Group

112
Section 3, Requirement 1
Heat Loss/Gain Calculation
• Room by Room for new structure or existing structure where new ducts added
• Block Load for existing w/out duct modifications
• Manual-J, Manual N, ASHRAE Handbook, DOE Energy Plus etc.
• Load Calc worksheets must be in work file
© 2011 Conservation Services Group

113
Section 3, Requirement 2
Selected equipment will be properly sized
• For AC & HP, sensible and latent loads will be covered
• AC & HP sized between 95 and 115% of load – 95-125% for HP in heat dominated climate
• Fossil furnaces 100-140% of load
• Fossil boilers 100-115%
• ACCA Manual S or CS, OEM Guidelines
• Documentation in work file
© 2011 Conservation Services Group
114
Section 4: Installation
Air Flow
Refrigerant Charge
Electrical Requirements
On Rate for Fuel Fired
Combustion Venting
System Controls
© 2011 Conservation Services Group

115
Air Flow
• Requirements:
- Air flow w/in 15% of design or OEM Recommendation
• Acceptable Procedures:
-Pressure matching
-Anemometer (pitot traverse)
-Flow grids
-Pressure drop or Temperature Rise
• Documentation
-Field data on start up sheet & service records
© 2011 Conservation Services Group

116
Refrigerant Charge
•Contractor evidence of one of the following • Superheat w/in 5° F of OEM (55°+ outside)
• Subcool w/in 3° F of OEM (60°+ outside)
• Or any OEM approved method
•Start up sheet or service record documentation will include
-system conditions
-calculations conducted
-results obtained
-field data & operating conditions
© 2011 Conservation Services Group

117 © 2011 Conservation Services Group
www.trutechtools.com
www.cachemechanical.com

118
Electrical Requirements
•Contractor shall provide evidence of - line & low voltage within acceptable % of OEM recommendations (w/
voltmeter)
- Amperage within acceptable % of OEM recommendations (w/ amp meter)
- Wiring size & grounding per NEC
•Acceptable procedures -verify measurements w/ nameplate values
•Documentation
-comply w/ OEM specs
-documentation or checklist on file
© 2011 Conservation Services Group

119
On Rate for Fuel Fired
Contractor provide evidence of
-Gas fired w/in 5% of nameplate firing rate w/ correct temperature rise
-Oil fired has correct nozzle flow rate and angle per name plate
1. Oil pump pressure matches nozzle @ OEM spec
2. Temperature rise per name plate
Acceptable Procedures
-Gas: clock the gas meter & check temp rise
-Oil: nozzle input, pump pressure, temp rise & combustion analysis
Document the field measurements or checklist in field file.
© 2011 Conservation Services Group

120
Combustion Venting System
Contractor provide evidence of -Cat I vent to OEM & NGFC specs or IFGC specs
or
-Cat II,III,IV sized per OEM specs
or
-Cat II,III,IV sized per local code
• Acceptable Procedures
- Cat I: compare actual installation to gas vent tables
- Cat 2: compare actual installation to OEM specs
• Documentation: - Field data on start up sheet or service record
© 2011 Conservation Services Group

121
System Controls
Contractor shall ensure proper selection of
-operating & safety controls per OEM specs
-operating & safety controls lead to proper sequencing per OEM specs
• Acceptable Procedures: -OEM literature to support controls selection
-verification of correct sequencing per OEM specs by testing
• Documentation:
- Controls match OEM specs, checklist on file
© 2011 Conservation Services Group

122
Section 5 Duct Distribution Aspects
Duct Leakage -Ducts inside leak less than 10% of design air flow
-Ducts outside leak less than 6% of design air flow
-Energy Star Home ducts leak less than 4% of conditioned floor area
-Meet code if they exceed above requirements
• Test Methods -Duct pressurization, blower door subtraction, hybrid of above other two
Documentation -field data on start up sheet or service record, document on checklist in work file
© 2011 Conservation Services Group

123
Section 5 (cont) Air Flow Balance
-Contractor provide evidence of 1. NewCon or new ducts air flows w/in 20% or 25 cfm of design flows
2. Existing const w/ no duct modifications-no requirements
3. Or meet local code if more stringent
Acceptable Procedures -Flow hood, anemometer, pitot tube traverse.
Documentation -Field data on start up sheet or service record, checklist
© 2011 Conservation Services Group

124
Section 6 System Documentation
• Contractor shall document installation -copies of all applicable construction drawings, calcs, operating
manuals etc w/in easy reach of customer
-record model and serial number of all installed equipment
• Acceptable Procedure
-contractor shall confirm all listed requirements met
• Documentation
- written documentation or checklist in job file, signed document by customer confirming receipt
© 2011 Conservation Services Group

125
Section 6 Owner/Operator Education
Contractor shall conduct the following
-instruct customer on system operation
-explain system maintenance requirements
-explain warranty procedure & responsibilities
-provide contact information for warranty
Acceptable Procedures -contractor shall confirm all listed requirements are met
Acceptable Documentation -written job documentation or checklist in job file
-signed document by customer confirming receipt
© 2011 Conservation Services Group

126
Appendices
Appendix 1: Additional Elements for Quality Installations
Appendix 2: Definitions
Appendix 3: Contractor Management Documentation
Appendix 4: Bibliography & Resources
© 2011 Conservation Services Group

127
Version 3 HVAC Requirements
Professional credentialing - HVAC contractors installing systems in ENERGY STAR Version 3 homes
must be credentialed by an EPA–recognized third–party oversight organization.
Intended to help EPA ensure that contractors installing systems in ENERGY STAR qualified homes have the knowledge, skills, and abilities to perform required QI work.
At this time, this credential is available through ACCA's Quality Assured (QA) Contractor Program.
For additional information
• www.energystar.gov/newhomeshvacor
© 2011 Conservation Services Group

128
Here is the Standard
FREE
PDF copy download
www.acca.org/quality
© 2011 Conservation Services Group

129 © 2011 Conservation Services Group

130
ACCA QA Program
Gaining Recognition:
–Orientation
–Review
–Preparation
–Application / Participation Agreement
–Payment
© 2011 Conservation Services Group

131
ACCA QA Program
–Payment
• $59 (list price) $39 (ACCA Mbr)
• One time: App. pro. fee, $275
• Annual fee, $1,120 (list price)
$ 820 (ACCA Mbr)
© 2011 Conservation Services Group

132
HVAC
Contractor
Checklist
Do Not
Forget
The
Footnotes!
© 2011 Conservation Services Group

133
Thank you!
© 2011 Conservation Services Group